Embed Size (px)
Citation preview
Thermal Performance of a High-flux Solar Concentrating System
M Mouzourisa LW Robertsb and MJ Brooksb
Received 20 April 2011 and accepted 5 December 2011
R amp D Journal of the South African Institution of Mechanical Engineering 2011 27 10-20
httpwwwsaimecheorgza (open access) copy SAIMechE All rights reserved
10
A point-focus concentrator is described for collecting and transporting solar energy at flux levels exceeding 100 Wcm2 The Fibre Optic Concentrating Utilisation System (FOCUS) comprises a 600 mm diameter ring array concentrator injecting solar rays into an optical waveguide for transmission to a remote target The ring array incorporates a nested set of paraboloidal elements each with appropriate geometry to reflect sunlight to a common focal point The use of composite materials in manufacturing the concentrator enables a low-cost solution with good rigidity giving measured surface slope errors of between 290 mrad and 539 mrad rms Optical ray tracing is used to generate a system performance model which is compared with experimental data obtained using energy balance methods and a flat plate calorimeter Temperatures exceeding 1200 K and a concentration ratio approaching 1800 suns are achieved demonstrating the collectorrsquos usefulness in high-flux research applications The study shows that useful solar flux can be delivered by low-cost concentrators fabricated from composite materials Among other applications the system is intended for use in lunar in-situ resource utilisation research where lunar soil simulants are melted for oxygen production surface stabilisation and related activities Additional Keywords Ring array concentrator high-flux solar calorimetry in-situ resource utilisation Nomenclature Roman C concentration ratio F flux [Wcm2]
mass flow rate [kgs] n refractive index P power [W] q solar power [W] T temperature [degC] a MScEng student ab School of Mechanical Engineering
University of KwaZulu-Natal Durban 4041 E-mail brooksukznacza
Greek α absorptivity η efficiency τ transmission Subscripts abs absorbed act actual foc focus inj injection in inlet l losses out outlet s copper plate surface Abbreviations CMM co-ordinate measuring machine CPV concentrating photovoltaic DNI direct normal irradiance FOCUS fibre optic concentrating utilisation system ISRU in-situ resource utilisation OW optical waveguide RAC ring array concentrator RMSE root mean square error
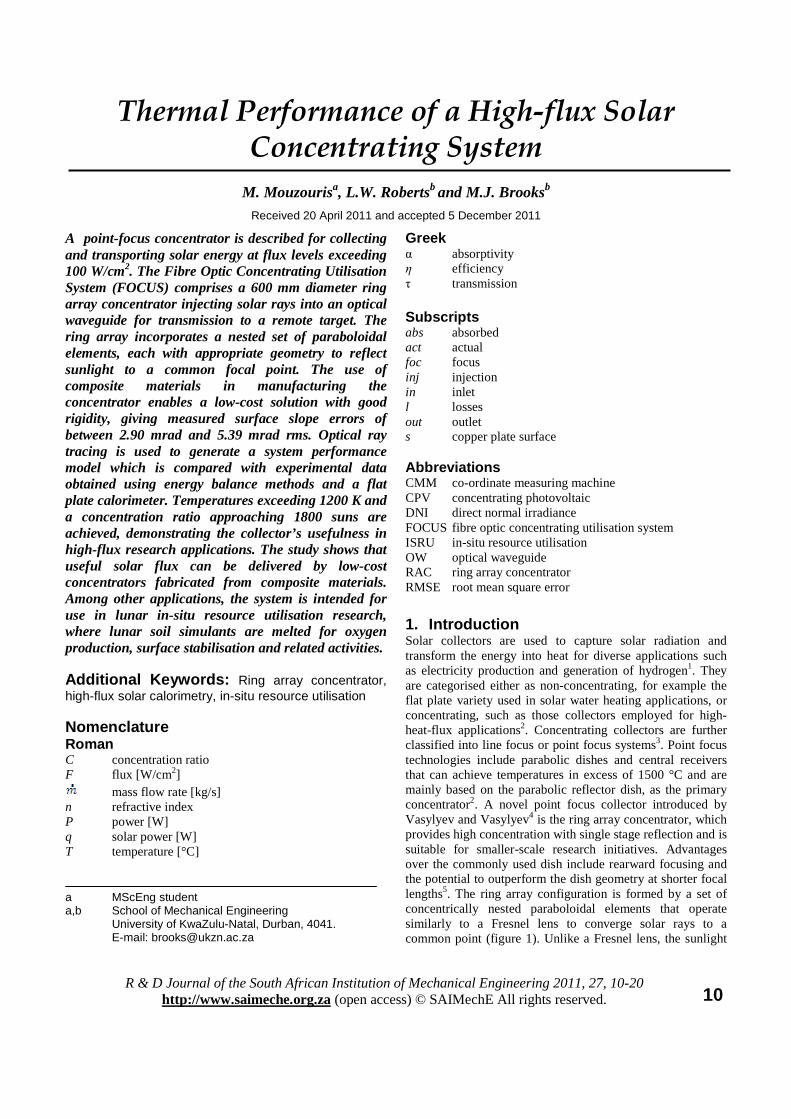
1 Introduction Solar collectors are used to capture solar radiation and transform the energy into heat for diverse applications such as electricity production and generation of hydrogen1 They are categorised either as non-concentrating for example the flat plate variety used in solar water heating applications or concentrating such as those collectors employed for high-heat-flux applications2 Concentrating collectors are further classified into line focus or point focus systems3 Point focus technologies include parabolic dishes and central receivers that can achieve temperatures in excess of 1500 degC and are mainly based on the parabolic reflector dish as the primary concentrator2 A novel point focus collector introduced by Vasylyev and Vasylyev4 is the ring array concentrator which provides high concentration with single stage reflection and is suitable for smaller-scale research initiatives Advantages over the commonly used dish include rearward focusing and the potential to outperform the dish geometry at shorter focal lengths5 The ring array configuration is formed by a set of concentrically nested paraboloidal elements that operate similarly to a Fresnel lens to converge solar rays to a common point (figure 1) Unlike a Fresnel lens the sunlight
Thermal Performance of a High-flux Solar Concentrating System
R amp D Journal of the South African Institution of Mechanical Engineering 2011 27 10-22
httpwwwsaimecheorgza (open access) copy SAIMechE All rights reserved
11
is reflected not refracted therefore optical losses are reduced To date a number of designs have demonstrated the use of point focus technology to concentrate solar energy into fibre optic cables Feuermann et al6 performed experiments using a 200 mm diameter parabolic dish coupled to an optical Figure 1 Typical paraboloidal elements of a ring array concentrator ndash three element profiles single stage reflection to a common focal point fibre 1 mm in diameter that achieved power densities of 1000 Wcm2 for solar surgery Nakamura and Senior7 constructed an optical waveguide (OW) solar thermal system for lunar materials processing Their system consists of seven 27-inch parabolic mirrors concentrating solar energy into optical fibres to deliver a flux of 137 Wcm2 for the production of oxygen from lunar regolith The present work differs from existing efforts in that an alternate collector structure is chosen and the manufacturing process is geared more towards low-cost prototype development than high-accuracy
Point focus collectors experience optical inefficiencies when the reflective surface deviates from the ideal paraboloidal geometry To attain high temperatures and power densities surface contour errors of solar concentrators need to be minimised Previously demonstrated manufacturing methods include diamond turning of aluminium to machine parabolic dishes to a root mean square (rms) mirror slope error of 01 mrad67 This process is expensive because of the materials and equipment involved and suggests a need for novel lower-cost manufacturing methods using composites Such an approach has been followed here in the development of the ring array concentrator To determine the feasibility of the manufacturing process experimental characterisation of the high-flux solar energy is required
Several devices have been developed for high-flux solar measurements including calorimetric and the more expensive approach of radiometric techniques89 Calorimeters use
energy balance methods to obtain estimated flux concentrations incident on the receiving surface The methodology includes determining the heat absorbed by a heat transfer fluid flowing through the calorimeter body by measuring the change in temperatures at inlet and outlet10 Considerations for this technique include minimising uncertain measurements pertaining to mass flow rate of the fluid and rise in temperature at calorimeter exit Estimated modeling of heat losses due to convection and radiation is needed when the receiver plate does not approximate ambient temperature Other more expensive instruments used for measuring heat-flux are concentrating photovoltaic (CPV) cells11 and radiometers such as the Gardon gauge12 For this study a low-cost approach was adopted to determine the performance of FOCUS using a flat plate calorimeter
In this study we demonstrate the use of a ring array concentrator and fibre optic bundle to collect and transport solar energy for high energy flux applications The optical fibres provide a means of transferring energy to a remote target and controlling its delivery As part of the study ray tracing simulations are used to develop a predictive model of concentrator performance in the presence of optical errors Thermal performance is characterised using energy balance theory with a flat plate calorimeter to validate the numerical model Possible terrestrial and space-based research applications include solar power generation CPV and lunar in-situ resource utilisation (ISRU)
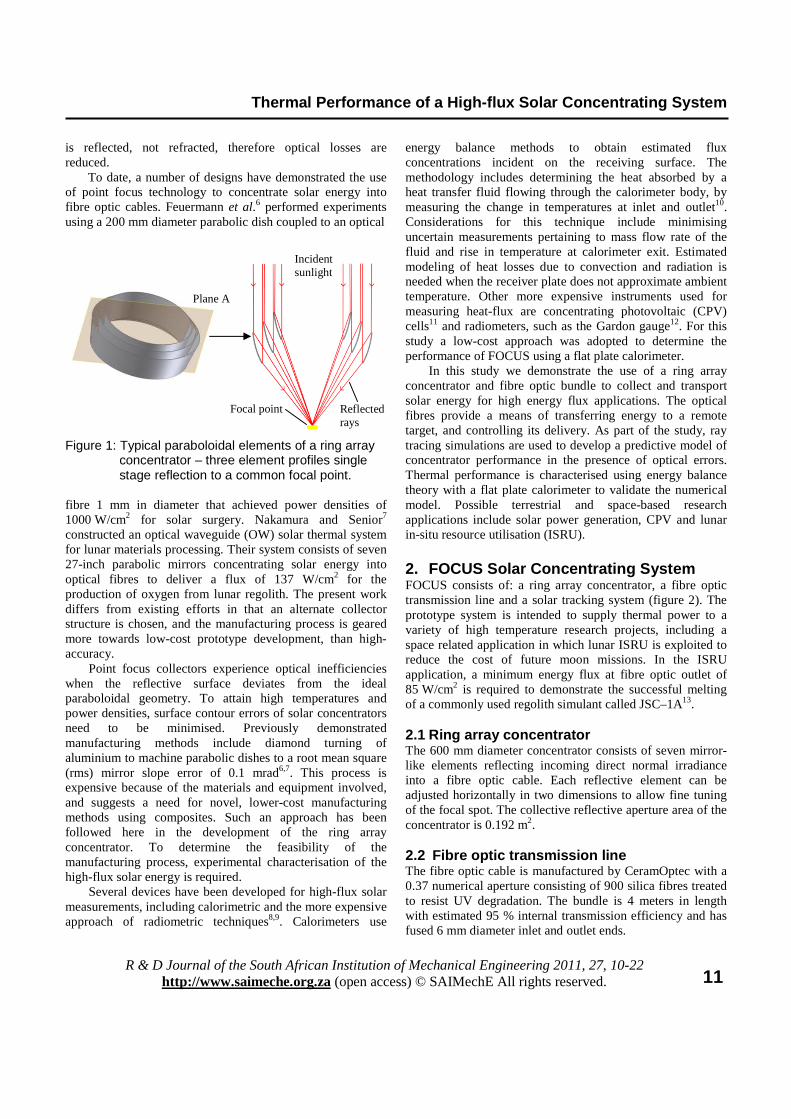
2 FOCUS Solar Concentrating System FOCUS consists of a ring array concentrator a fibre optic transmission line and a solar tracking system (figure 2) The prototype system is intended to supply thermal power to a variety of high temperature research projects including a space related application in which lunar ISRU is exploited to reduce the cost of future moon missions In the ISRU application a minimum energy flux at fibre optic outlet of 85 Wcm2 is required to demonstrate the successful melting of a commonly used regolith simulant called JSCndash1A13 21 Ring array concentrator The 600 mm diameter concentrator consists of seven mirror-like elements reflecting incoming direct normal irradiance into a fibre optic cable Each reflective element can be adjusted horizontally in two dimensions to allow fine tuning of the focal spot The collective reflective aperture area of the concentrator is 0192 m2 22 Fibre optic transmission line The fibre optic cable is manufactured by CeramOptec with a 037 numerical aperture consisting of 900 silica fibres treated to resist UV degradation The bundle is 4 meters in length with estimated 95 internal transmission efficiency and has fused 6 mm diameter inlet and outlet ends
Incident sunlight
Reflected rays
Focal point
Plane A
Thermal Performance of a High-flux Solar Concentrating System
R amp D Journal of the South African Institution of Mechanical Engineering 2011 27 10-22
httpwwwsaimecheorgza (open access) copy SAIMechE All rights reserved
12
23 Solar tracking system The concentrator array is equipped with a commercially available dual-axis solar tracker from Small Power Systems Inc The average tracking accuracy of the sun sensor is 005deg
Figure 2 FOCUS ring array concentrator integrated with an optical waveguide bundle for high- flux level terrestrial and space applications 3 Collector Construction The seven reflective elements of the ring array concentrator are manufactured using composite materials and a paraboloidal mould14 This approach is attractive because of the reductions in cost (one eighth the price of machining each ring from aluminium) and mass (3 kg reduction overall) Each reflective element is formed from a matrix material and two reinforcement materials to produce a fibre reinforced plastic composite Starting with the largest diameter ring the mould is machined using a CNC lathe and the wet lay-up is completed for that element (figure 3) The subsequent rings are manufactured individually by machining down the mould The reflective surfaces of the ring array are laser cut into seven conic profiles from 95 reflective Miro 4 aluminium of 04 mm thickness The aluminium is strapped on to the mould and bonded together at the join with a rectangular sheet of aluminium as the connector (figure 4) The mould is vacuum bagged to allow the aluminium to form the shape of the paraboloid After curing silicone is beaded around the inner and outer diameters of the element to prevent resin seeping between the mould and profile surface Glass and carbon fibre profiles are hand impregnated with resin and applied over the aluminium profile after which a second
vacuum bagging process is conducted for additional consolidation of the geometry (figure 5) Glass and carbon fibre profiles were hand impregnated with resin for the wet lay-up and second vacuum bagging process The concentration of sunlight with a completed reflective element is illustrated in figure 6
Figure 3 Machined geometry for element 1 (largest element) with conic aluminium profiles
Figure 4 Profile for element 7 strapped to the tooling board mould before vacuum bagging process
Figure 5 Aluminium profile bonded with a bead of silicone to prevent resin offset between the metal surface and mould
RAC
Dual axis solar tracker
Target
Concentrated sunlight injected into cable
OW transmission bundle
Rectangular connector
Conic profile with protective vinyl
Paraboloidal geometry
Glass and carbon profiles
Silicone bead
Thermal Performance of a High-flux Solar Concentrating System
R amp D Journal of the South African Institution of Mechanical Engineering 2011 27 10-22
httpwwwsaimecheorgza (open access) copy SAIMechE All rights reserved
13
Figure 6 A completed reflective element focusing incident rays to a point Each element was optically analysed after fabrication to quantify surface errors resulting from the composite material manufacturing method In order to characterise optical errors for each reflective ring using slope measurements the angular deviations between ideal and real perpendicular lines at specific points on each curved surface were obtained15 A three-dimensional co-ordinate measuring machine (CMM) was used to obtain slope errors1617 which lay between 567 mrad and 290 mrad rms (table 1) These are comparable to errors reported by Arasu and Sornakumar18 and Johnston19 who used similar fabrication methods for a parabolic trough and dish respectively The general trend in the errors shows an increase in accuracy with decreasing diameter highlighting the difficulty of manufacturing large double-curvature precision optics using composite materials Table 1 Root mean square error (RMSE) results for optically characterising the reflective elements
Several factors can cause surface errors in the manufactured elements as well as variation in error between individual elements manufactured using the same method For one the manual wet lay-up vacuum bagging process permits variation in the nature and extent of distortion Variations in resin and fibre volume fractions also depend on the skill and consistency of the laminators In this case the nature of the wet lay-up process makes it difficult to produce consistent high fibre volume fractions for each of the seven elements Improved slope error results in the smaller ring elements are due to the reduced curvature with smaller elements requiring less shaping and pressure forming of the flat reflective aluminium to form a paraboloid In addition the characteristic double curvature of the paraboloidal surface creates a complex manufacturing geometry in which material
fibres are less likely to adhere accurately to the mould shape The slope error results suggest that ring array designs should ideally comprise reflective elements with reduced curvatures if wet lay-up vacuum bagging methods are employed Despite the challenges of using composites in this type of application we are able to demonstrate that low-cost reflective elements can be fabricated to reasonable accuracies and for substantially reduced cost and weight 4 Numerical Analysis A numerical analysis was conducted using optical ray tracing software (OptisWorks Studio) to predict performance of the composite material concentrator The optical efficiency of FOCUS (equation 1) can be estimated using results from the ray tracing exercise and is defined as the product of the efficiencies applicable to the concentrator (ηRAC) the focusing process (ηfoc) injection into the fibre optic waveguide (ηinj) and transmission to the target (ητ) (figure 7) Power values used to obtain the first three efficiency stages include the power at concentrator inlet (Pin) concentrator exit (Pout) inlet to optical waveguide (POWin) and the actual power injected into the silica fibres (Pact) Predictions of each power value were derived from the ray trace model
ηoverall = ηRAC ηfoc ηinj ητ (1) The power values given in figure 7 are based on a nominal input flux of 850 Wm2 acting on an aperture of 0192 m2 41 Ray tracing model A ray tracing model was developed to characterise the optical efficiency of FOCUS by estimating the energy striking a receiver of 6 mm diameter representative of the optical waveguide inlet A further analysis was conducted to predict flux on a 60 mm diameter plate at the focal point of the collector representative of the calorimeter used in experimental testing Ray tracing simulations were conducted for eight cases describing the progression from ideal to realistic parameters All eight cases employed a nominal direct normal irradiance of 850 Wm2 to obtain comparative power density results Table 2 shows the input parameters for each case Representations of the best and worst case manufactured geometries were obtained from the CMM
42 Ray tracing results Figure 8 illustrates three dimensional flux maps at cable inlet for the ideal unrealistic simulation of case 1 and the realistic worst case scenario of case 8 The no-loss model of case 1 shows flux magnitudes exceeding 46 000 suns that violate the second law of thermodynamics due to the omission of the solar half-angle in the ideal simulation Implementing the
Thermal Performance of a High-flux Solar Concentrating System
R amp D Journal of the South African Institution of Mechanical Engineering 2011 27 10-22
httpwwwsaimecheorgza (open access) copy SAIMechE All rights reserved
14
Ideal Real
Input parameters Case 1 Case 2 Case 3 Case 4 Case 5 Case 6 Case 7 Case 8
Ideal parallel rays (000deg) 1 0 0 0 0 0 0 0
Ideal specular reflection (100) 1 1 0 0 0 0 0 0
Ideal RAC geometry 1 1 1 1 0 0 0 0
Ideal tracking error (000deg) 1 1 1 0 1 0 1 0
Solar half-angle (0265deg) 0 1 1 1 1 1 1 1
Realistic specular reflection of mirror (95) 0 0 1 1 1 1 1 1
Average tracking error (005deg) 0 0 0 1 0 1 0 1
Manufactured geometry (Best case) 0 0 0 0 1 1 0 0
Manufactured geometry (Worst case) 0 0 0 0 0 0 1 1
Table 2 Ray tracing input parameters for 8 sets of numerical simulations conducted incorporating ideal and realistic parameters for comparison
1
2
3
4
5
1632 W
1501 W
450 W
383 W
363 W
Loss = 131 W due to solar half-angle and imperfect reflection
Loss = 1051 W due to focusing errors including solar half-angle slope errors and tracking misalignment
Loss = 67 W due to imperfect cable injection
Loss = 2 W due to imperfect cable transmission
in
outRAC21 P
P==minus ηη
τηη =minus54
OWin
actinj43 P
P==minus ηη
out
OWinfoc32 P
P==minus ηη
Figure 7 Predicted optical efficiency stages for FOCUS The four efficiency stages include the concentrator focusing process injection into the optical waveguide and the transmission of the concentrated sunlight to the target
Figure 8 Three-dimensional flux maps representing flux levels at waveguide inlet for simulation cases 1 and 8
case 1 case 8
Thermal Performance of a High-flux Solar Concentrating System
R amp D Journal of the South African Institution of Mechanical Engineering 2011 27 10-22
httpwwwsaimecheorgza (open access) copy SAIMechE All rights reserved
15
solar half-angle and other realistic parameters results in more uniform flux distribution within the 6 mm diameter area as shown in the case 8 simulation Figure 9 shows the cross-sectional flux profiles striking the 6 mm diameter inlet to the optical waveguide FOWin Cases 2 ndash 8 describe in a progressive manner the expected losses at the fibre optic cable as successive error parameters are included Optical waveguide inlet power decreases by 6 between cases 2 and 4 suggesting that tracking error and imperfect specular reflectance are relatively benign effects A comparison between cases 4 and 6 and cases 4 and 8 illustrates slope error effects on the manufactured RAC
For the manufactured best and worst case scenarios of the slope errors a decrease in power of 45 and 48 is observed respectively The primary aim of the numerical analysis is to predict flux profiles striking the 6 mm diameter fibre optic cable inlet using a worst case scenario In addition a 60 mm diameter receiver was modelled to represent the flux profile striking the copper plate of the calorimeter which is used in the experimental test procedure Figure 10 illustrates the worst case flux profiles of case 8 for the 60 mm diameter and 6 mm diameter receivers These are used to validate the experimental results against the numerical model
The power values in figure 9 do not account for integration of the RAC with the fibre optic cable therefore further processing of the ray trace results is needed to estimate the energy injected into and transmitted through the cable Using case 8 as an example the inlet power of 448 W to the cable is scaled down by factoring the collective
area of the fibres and the expected transmission efficiency of the cable as described in the design methodology13 Table 3 summarises the expected power P flux F and flux concentration Cflux entering (OWin) and exiting (OWout) the cable and overall optical efficiency results of FOCUS
Figure 9 Two-dimensional flux maps showing modelled cross-sectional flux profiles at the 6 mm diameter optical waveguide inlet for Cases 2 - 8 Average power results striking the cable are given
919 W 868 W 862 W 480 W 475 W 465 W 448 W
Figure 10 Representative cross-sectional flux maps showing the worst case ray trace scenario of case 8 for a 60 mm diameter copper receiver (left) and the fibre optic cable inlet (right)
Thermal Performance of a High-flux Solar Concentrating System
R amp D Journal of the South African Institution of Mechanical Engineering 2011 27 10-22
httpwwwsaimecheorgza (open access) copy SAIMechE All rights reserved
16
5 Experimental Results The experimental testing programme aimed to characterise performance of FOCUS using energy balance methods in conjunction with a flat plate calorimeter Testing was conducted in three phases to determine firstly the power entering and secondly exiting the fibre optic cable and thirdly the melting capabilities of a lunar regolith stimulant using FOCUS 51 Energy balance methodology The flat plate calorimeter consists of a stainless steel outer casing a nylon insulator and a copper receiving plate (figure 11) An energy balance was carried out on the calorimeter to determine the concentrated flux arriving at the plate surface A detailed heat transfer analysis using the flat plate calorimeter is described by Mouzouris et al20 During operation concentrated rays strike the copper disc while cold water flows through the device to absorb energy The energy balance is invoked to estimate the solar power incident on the plate by summing the energy absorbed by the water flow and the external heat
losses due to radiation and convection (equation 2) External heat losses are estimated using temperature measurements midway in the copper plate The absorptivity of the plate surface estimates the fraction of incident irradiation absorbed Internal losses are neglected due to the low thermal conductivity of the nylon insulation within the calorimeter body
αsqin = qabs + qlout (2)
52 Experimental setup Key components of the experiment include FOCUS the calorimeter water circulation system and instrumentation (figure 12) To determine the high-flux solar measurements of FOCUS the calorimeter is positioned first at the focal point of the concentrator and secondly at fibre optic cable exit Positioning the calorimeter at concentrator focus allows the parameter at optical waveguide inlet to be determined such as power (POWin) flux (FOWin) and flux concentration ratio (CfluxOWin) When the calorimeter is placed at fibre optic outlet POWout FOWout and CfluxOWout are characterised 53 Experimental procedure Experimental testing was conducted at the University of KwaZulu-Natal under clear sky conditions The test area is sheltered from wind while allowing clear vertical views for sun-concentrator orientation Direct normal irradiance (DNI) was measured with an Eppley Normal Incidence Pyrheliometer at the nearby Howard College radiometric ground station (299degS 3098degE at 1511 m elevation21) A typical experiment includes cleaning the seven reflective elements and positioning them such that the focal spot approximates concentric alignment onto the receiver being either the copper plate or the fibre optic cable inlet The receiver is firstly positioned using the calculated focal point and then fine-tuned to minimise the focal spot diameter Positioning the ring elements and receiver was performed with the dual-axis solar tracker in operation Running time per experiment was three minutes The fluid circulation system consists of a pump fitted with a throttle valve to achieve the desired mass flow rate Mass flow
Case 1 Case 2 Case 3 Case 4 Case 5 Case 6 Case 7 Case 8
ηRAC 100 098 093 093 093 093 092 092
ηfoc 100 058 058 057 032 031 031 030
ηinj 085 085 085 085 085 085 085 085 Stages
ητ 095 095 095 095 095 095 095 095
Total ηoverall 081 046 044 043 024 023 023 022
Power at cable inlet POWin (W) 1632 919 868 862 480 475 465 448
Fibre optic inlet flux FOWin (Wcm2) 5772 3250 3070 3049 1698 1680 1645 1584
Flux concentration cable inlet Cflux OWin (suns) 67906 38239 36117 35867 19972 19764 19348 18641
Power at cable outlet POWout (W) 1324 745 704 699 389 385 377 363
Fibre optic outlet flux FOWout (Wcm2) 5483 3088 2916 2896 1613 1596 1562 1505
Flux concentration cable outlet Cflux OWout (suns) 64511 36327 34311 34074 18974 18776 18381 17709
Table 3 Predicted component efficiencies and average performance results for FOCUS using ray tracing methods at a typical irradiance of 850 Wm2
Thermal Performance of a High-flux Solar Concentrating System
R amp D Journal of the South African Institution of Mechanical Engineering 2011 27 10-22
httpwwwsaimecheorgza (open access) copy SAIMechE All rights reserved
17
rate is measured by conducting a timed volume collection and is set to keep the copper receiving plate at a temperature close to ambient to minimise external heat losses due to convection and radiation Instrumentation includes two type T thermocouples for the inlet Tin and outlet Tout water measurements and six type K thermocouples for the temperature distribution measurements midway in the copper plate The six thermocouples are labelled T0 T5 T10 T15 T20 and T25 and are used to estimate the surface temperature Ts of the copper plate
531 Concentrator focus results Characterising the flux distribution at concentrator focus requires covering the copper plate of the calorimeter with a series of reflective shields to progressively limit exposure of concentrated rays onto the copper receiver Ten stages were chosen for discretising the flux distribution starting with no shield representing full exposure of the copper plate and ending with a reflective shield incorporating a 3 mm diameter opening The 6 mm diameter reflective shield represents the cable inlet (figure 13) A nylon backing is applied to minimise conduction between the shield and copper surface Several experiments were
Water inlet
Water outlet
Thermocouples
Figure 11a Exploded view of the flat plate calorimeter Figure 11b Calorimeter side view constructed for performance measurements showing water inlet and of FOCUS and outlet passages
Copper disc
Radial flow distributer
Insulation Flow outlet
Stainless steel body
Flow inlet
Water passage
Data acquisition system Water circulation system
Ring array concentrator Optical waveguide inlet Calorimeter Optical waveguide
Instrumentation
OW exit
Water out Water in
Figure 12 Experimental layout to characterise the energy flux at the optical waveguide exit including key components FOCUS the flat plate calorimeter water circulation system and thermocouples
Water inlet
Water outlet
Thermocouples
Thermal Performance of a High-flux Solar Concentrating System
R amp D Journal of the South African Institution of Mechanical Engineering 2011 27 10-22
httpwwwsaimecheorgza (open access) copy SAIMechE All rights reserved
18
conducted for each shield to obtain the average power incident on the exposed copper surface Subtracting successive exposed power values yielded a discretised flux distribution pattern for the 60 mm diameter receiver Data from a typical experiment using the 6 mm diameter reflective shield are shown in table 4 The calorimeter inlet and outlet water temperatures and temperature distributions midway in the copper plate are shown in figure 14 Of importance is the stabilisation of temperature measurements which allows for the assumption of steady state conditions A temperature difference between water inlet and outlet of 64 degC is observed after three minutes allowed for stabilisation using a mass flow rate of 000154 kgsec resulting in 41 W of power absorbed by the water To obtain an estimate power striking the copper plate surface heat losses were calculated using the temperature distribution midway in the copper plate and added to the power absorbed by the water The temperature measurements of T10 T15 and T20 show unexpected similar readings with possible reasons due to thermocouple inaccuracies or imprecise machining of the copper plate Heat losses due to convection and radiation amounted to 02 of the power absorbed resulting in an estimate power striking the copper plate surface of 432 W at an irradiance of 9380 Wm2 This corresponds to an efficiency of 24 which is in good agreement with the case 8 numerical efficiency result at optical waveguide inlet of 27
Figure 13 The 6 mm diameter reflective shield positioned at concentrator focus A comparison between experimental and modelled flux for the parameter set of Case 8 is shown in Figure 15 Experimental results show a peak flux level of 1528 kWm2 at an input irradiance of 850 Wm2 corresponding to a concentration of 1798 suns Measured maximum temperature values at concentrator focus approached 1500degC at irradiance levels in the region of 1000 Wm2 Measured flux obtained from the application of successive
discretised filters closely follows predicted flux from the ray tracing exercise Experiments conducted using smaller reflective shields allowing a 2 mm and 1 mm diameter exposure of the copper surface produced inconsistent results possibly due to measurement uncertainties at very low heat transfer rates
Table 4 Experimental measurements and results for a typical experiment using a reflective shield with 6 mm aperture
Difficulties in stabilising the system for very small diameter filter plates (lt 3 mm) resulted in poor resolution near the peaks of both curves in figure 15 This is a shortcoming in the calorimetric method of measuring flux To measure peak flux levels further performance testing using a radiometric device such as a Gardon flux sensor is indicated
Experiment Average irradiance level (Wm2) 9380 Ray trace qin (W) 488 Experimental qin (W) 432 qabs (W) 410 qlout (W) 009
(kgs) 000154 ∆T ( Tout - Tin) (degC) 64 Ts (degC) 692 T in (degC) 270 Tout (degC) 334 Experimental qin normalised to 850 Wm2 (W)
392
Figure 14a Results from a typical experiment showing a water temperature difference of 64 degC
Tin Tout
∆T = 64 degC
Exposed copper surface of 6 mm diameter
T0
T5
T10
T15
T20
T25
Thermal Performance of a High-flux Solar Concentrating System
R amp D Journal of the South African Institution of Mechanical Engineering 2011 27 10-22
httpwwwsaimecheorgza (open access) copy SAIMechE All rights reserved
19
Key results from the first phase experiments include performance at optical waveguide inlet Representative average power and flux levels incident on the cable of 394 W and 1393 Wcm2 respectively were observed over five experiments An injected power into the 900 silica fibres of 335 W is estimated and is used in calculating the transmission efficiency of the cable 532 Optical waveguide exit results Waveguide exit performance results are obtained by directing the cable outlet at the calorimeter as shown in figure 16a Tests were conducted using the same methodology as at concentrator focus but without the reflective shields A shield was positioned at optical waveguide inlet to protect the metal ferrule from stray radiation that may cause damage (figure 16b) The shield restricts energy to the 6 mm diameter quartz glass inlet of the cable At cable outlet a preventative measure of offsetting the cable 5 mm away from the calorimeter centre was taken to avoid reflection of sunlight back on to the fibre bundle
Experimental Theoretical
Figure 15b A magnified view of the 6 mm diameter inlet to the optical waveguide (at 850 Wm2)
Figure 16b Reflective shield at fibre optic cable inlet allowing concentrated solar energy into the 6 mm diameter quartz glass inlet
T5
T0
T25
T10 T15 T20
Figure 14b Results from a typical experiment showing temperature measurements midway in the copper plate
Figure 15a Performance results at concentrator focus showing flux levels striking the 60 mm diameter copper plate (at 850 Wm2)
Vertical displacement
Figure 16a Vertical displacement of the cable outlet prevents damaging back reflection on to the 900 fibres of the cable
Thermal Performance of a High-flux Solar Concentrating System
R amp D Journal of the South African Institution of Mechanical Engineering 2011 27 10-22
httpwwwsaimecheorgza (open access) copy SAIMechE All rights reserved
20
Test results showed an average power of 205 W exiting the cable and striking the copper plate at a vertical displacement of 5 mm corresponding to a flux of 849 Wcm2 in the exit plane of the fibres The results represent normalised values at a direct normal irradiance of 850 Wm2 Transmission efficiency of the fibre optic cable is estimated at 61 using the average power results from the 6 mm diameter reflective shield conducted at concentrator focus A predicted efficiency of 95 was used for the theoretical calculations stipulated by the supplier of the cable A possible reason for the 34 decrease in efficiency is greater losses due to reflection at inlet to the cable The reflective losses at cable inlet result from the sudden change of refractive index from air (n = 10) to fused quartz glass (n = 15) This was not modelled in the ray tracing simulation A possible solution to minimise inlet reflective losses is the design and implementation of a secondary concentrator at cable inlet to boost energy injection into the silica fibres 533 Optical efficiency Final performance results from the first two experimental phases are given in table 5 A predicted efficiency of 22 was obtained using ray tracing methods and a worst case error set Experimental results show an efficiency of 13 with the difference attributed mainly to high reflective losses at inlet to the optical fibres
Table 5 FOCUS experimental performance (data normalised to a direct normal irradiance of 850 Wm2 - average of five tests) 534 Regolith melting capabilities In the final test procedure several melting experiments were performed in which concentrated sunlight was directed at a sample of the lunar regolith simulant JSC-1 This was intended to demonstrate the high surface temperatures and flux levels required to melt lunar regolith for ISRU-related applications such as those reported by Nakamura and Senior7 The experimental procedure includes positioning the optical waveguide onto the JSC-1 surface and measuring the the temperature of the melt zone
formed after a period of six minutes (figure 17a) A downward facing reflective shield was positioned beneath the cable to prevent reflected solar rays from the regolith surface striking the cable The temperature of the regolith simulant was measured using a thermocouple positioned at the centre of the melt zone Figure 17b shows a post-experimental sample of the melted regolith from a typical experiment The vitrified circular melt zone formed after six minutes is 6 mm in diameter with a depth of 25 mm Table 6 summarises the peak melt temperature readings obtained for five separate experiments The stabilisation of temperature within the melt zone is illustrated in figure 18 showing peak values graphed against estimated flux levels Flux levels exiting the cable were estimated using average irradiance levels over the test period and the optical efficiency value of 13 Results show a peak temperature exceeding 1200 K at cable exit flux levels of 104 Wcm2 which exceeds the minimum flux criterion for successful regolith melting by 22 Temperature results achieved can be applied to several high temperature lunar ISRU processes including oxygen production and surface stabilisation Creating larger sintered surfaces for practical human use on the lunar surface is possible by implementing autonomous mechanisms to drive multiple fibre optic cables in a coordinated manner22
Theoretical Experimental
POWin (W) 448 394
FOWin (Wcm2) 1584 1393
Cflux OWin (suns) 18641 16388
POWout (W) 363 205
FOWout (Wcm2) 1505 849
Cflux OWout (suns) 17709 9988
ηoverall 022 013
Ceramic dish containing JSC-1
Downward facing reflective shield
6 mm
Figure 17a Regolith melting experiment with the protective shield (reflector) to prevent cable damage and a thermocouple
Figure 17b Magnified view of the vitrified melt with diameter of 6 mm and depth 25 mm
Thermal Performance of a High-flux Solar Concentrating System
R amp D Journal of the South African Institution of Mechanical Engineering 2011 27 10-22
httpwwwsaimecheorgza (open access) copy SAIMechE All rights reserved
21
6 Conclusion The design fabrication and testing of a composite material ring array concentrator is described for the collection of solar energy and its transmission through a fibre optic bundle The FOCUS system has application in high-temperature research such as material sintering and lunar in-situ resource utilisation The overall transmission efficiency from aperture to bundle outlet was measured at 13 using a flat plate calorimeter Temperatures
exceeding 1450 degC and 900 degC were measured at the concentrator focal point and the outlet of the fibres respectively yielding flux levels of 104 Wcm2 An optical error analysis of the seven reflective elements is described In addition to performance validation this work also provides an alternate approach to conventional methods of collector construction Rather than machining metal profiles for the reflective surface extensive use was made of composite materials resulting in a low-cost light weight point focus concentrator that is 38 lighter than an aluminium equivalent and considerably less expensive Results suggest that further reduction in optical error is possible by limiting reflector curvature in the design stage and adapting the optics to accommodate for structural distortion during curing Acknowledgements The authors appreciate the assistance and support of Professor J Bindon Professor WH Moolman Clinton Bemont Khulisile Kunene Michael Constantino OPTIS Durban University of Technology and the University of Stellenboschrsquos Centre for Renewable and Sustainable Energy Studies (CRSES) This work is supported by the National Research Foundation of South Africa and the Eskom TESP program References 1 Pregger T Graf D Krewitt W Sattler C Roeb M and
Moller S Prospects of solar thermal hydrogen production processes International Journal of Hydrogen Energy 2009 34 4256-4267
2 Kalogirou SA Solar thermal collectors and applications Progress in Energy and Combustion Science 2004 30 231-295
3 Sen Z Solar energy in progress and future research trends Progress in Energy and Combustion Science 2004 30 367-416
4 Vasylyev S and Vasylyev V Nonimaging reflective lenses A new type of high-heat solar collector Proceedings of the Solar World Congress Orlando Florida 2005
Experiment 1 2 3 4 5
Irradiance level (Wm2) 10054 9971 9957 9913 9879 Peak temperature (degC) 9355 9016 8820 8769 8504 Flux level (Wcm2) 1040 1031 1029 1025 1021
Experiment 1
Experiment 2
Experiment 3
Experiment 4
Experiment 5
Figure 18a Time evolution of the melt temperature for five experiments for 6 min showing temperature stabilisation in the melt zone
Table 6 Lunar regolith simulant peak melt temperature and cable exit flux concentration results
Figure 18b Peak melt temperatures versus maximum flux levels exiting the 900 silica fibres
Thermal Performance of a High-flux Solar Concentrating System
R amp D Journal of the South African Institution of Mechanical Engineering 2011 27 10-22
httpwwwsaimecheorgza (open access) copy SAIMechE All rights reserved
22
5 Vasylyev V and Vasylyev S Expected optical
performances of novel type multi-element high-heat solar concentrators Proceedings of the American Solar Energy Society Reno NV 2002
6 Feuermann D Gordon JM and Huleihil M Solar fiber-optic mini-dish concentrators First experimental results and field experience Solar Energy 2002 71 459-472
7 Nakamura T and Senior CL Solar thermal power for lunar materials processing Journal of Aerospace Engineering 2008 21 91-101
8 Ballestriacuten J Estrada CA Rodriacuteguez-Alonso M Peacuterez-Raacutebago C Langley LW and Barnes A Heat flux sensors Calorimeters or radiometers Solar Energy 2006 80 1314-1320
9 Ballestriacuten J A non-water-cooled heat flux measurement system under concentrated solar radiation conditions Solar Energy 2002 73 159-168
10 Estrada CA Jaramillo OA Acosta R and Arancibia-Bulnes CA Heat transfer analysis in a calorimeter for concentrated solar radiation measurements Solar Energy 2007 81 1306-1313
11 Fernandez-Reche J Sanchez M Alonso M Canadas I Chenlo F Rodriguez J and Ballestrin J Concentrating PV An alternative to calorimeters for measuring high solar flux densities Journal of Solar Energy Engineering 2008 130 0445021-0445023
12 Ballestriacuten J Ulmer S Morales A Barnes A Langley LW and Rodriguez M Systematic error in the measurement of very high solar irradiance Solar Energy Materials and Solar Cells 2003 80 375-381
13 Mouzouris M and Brooks MJ Nonimaging solar thermal collector for high temperature terrestrial and space applications Proceedings of SPIE Optics and Photonics San Diego CA 2009
14 Mouzouris M and Brooks MJ Construction of a composite material solar concentrator for high heat flux applications Proceedings of 8th Annual International Energy Conversion Engineering Conference Nashville TN 2010
15 Stine WB and Harrigan RW Solar energy
fundamentals and design with computer applications Wiley Alternate Energy 1985 185-188
16 Kumler JJ and Caldwell JB Measuring surface slope error on precision aspheres Proceedings of SPIE Optics and Photonics 2007
17 Menq C and Chen FL Curve and surface approximation from CMM measurement data Computers ind Engng 1996 30 211-225
18 Arasu VA and Sornakumar T Design manufacture and testing of fiberglass reinforced parabola trough for parabolic trough solar collector Solar Energy 2007 81 1273-1279
19 Johnston G Focal region measurements of the 20 m2 tilted dish at the Australian National University Solar Energy 1998 63 117-124
20 Mouzouris M Roberts LW and Brooks MJ Heat transfer analysis for high-flux solar measurements using a flat plate calorimeter Proceedings of First Postgraduate Renewable Energy Symposium CRSES Stellenbosch RSA 2010
21 Kunene KR Brooks MJ Roberts LW and Zawilska E Introducing GRADRAD The greater Durban radiometric network Proceedings of World Renewable Energy Congress XI Abu Dhabi UAE 2010
22 Nakamura T and Smith BK Solar thermal system for lunar ISRU applications Development and field operation at Mauna Kea HI Proceedings of 48th AIAA Aerospace Sciences Meeting Including the New Horizons Forum and Aerospace Exposition Orlando FL 2011
Thermal Performance of a High-flux Solar Concentrating System
R amp D Journal of the South African Institution of Mechanical Engineering 2011 27 10-22
httpwwwsaimecheorgza (open access) copy SAIMechE All rights reserved
11
is reflected not refracted therefore optical losses are reduced To date a number of designs have demonstrated the use of point focus technology to concentrate solar energy into fibre optic cables Feuermann et al6 performed experiments using a 200 mm diameter parabolic dish coupled to an optical Figure 1 Typical paraboloidal elements of a ring array concentrator ndash three element profiles single stage reflection to a common focal point fibre 1 mm in diameter that achieved power densities of 1000 Wcm2 for solar surgery Nakamura and Senior7 constructed an optical waveguide (OW) solar thermal system for lunar materials processing Their system consists of seven 27-inch parabolic mirrors concentrating solar energy into optical fibres to deliver a flux of 137 Wcm2 for the production of oxygen from lunar regolith The present work differs from existing efforts in that an alternate collector structure is chosen and the manufacturing process is geared more towards low-cost prototype development than high-accuracy
Point focus collectors experience optical inefficiencies when the reflective surface deviates from the ideal paraboloidal geometry To attain high temperatures and power densities surface contour errors of solar concentrators need to be minimised Previously demonstrated manufacturing methods include diamond turning of aluminium to machine parabolic dishes to a root mean square (rms) mirror slope error of 01 mrad67 This process is expensive because of the materials and equipment involved and suggests a need for novel lower-cost manufacturing methods using composites Such an approach has been followed here in the development of the ring array concentrator To determine the feasibility of the manufacturing process experimental characterisation of the high-flux solar energy is required
Several devices have been developed for high-flux solar measurements including calorimetric and the more expensive approach of radiometric techniques89 Calorimeters use
energy balance methods to obtain estimated flux concentrations incident on the receiving surface The methodology includes determining the heat absorbed by a heat transfer fluid flowing through the calorimeter body by measuring the change in temperatures at inlet and outlet10 Considerations for this technique include minimising uncertain measurements pertaining to mass flow rate of the fluid and rise in temperature at calorimeter exit Estimated modeling of heat losses due to convection and radiation is needed when the receiver plate does not approximate ambient temperature Other more expensive instruments used for measuring heat-flux are concentrating photovoltaic (CPV) cells11 and radiometers such as the Gardon gauge12 For this study a low-cost approach was adopted to determine the performance of FOCUS using a flat plate calorimeter
In this study we demonstrate the use of a ring array concentrator and fibre optic bundle to collect and transport solar energy for high energy flux applications The optical fibres provide a means of transferring energy to a remote target and controlling its delivery As part of the study ray tracing simulations are used to develop a predictive model of concentrator performance in the presence of optical errors Thermal performance is characterised using energy balance theory with a flat plate calorimeter to validate the numerical model Possible terrestrial and space-based research applications include solar power generation CPV and lunar in-situ resource utilisation (ISRU)
2 FOCUS Solar Concentrating System FOCUS consists of a ring array concentrator a fibre optic transmission line and a solar tracking system (figure 2) The prototype system is intended to supply thermal power to a variety of high temperature research projects including a space related application in which lunar ISRU is exploited to reduce the cost of future moon missions In the ISRU application a minimum energy flux at fibre optic outlet of 85 Wcm2 is required to demonstrate the successful melting of a commonly used regolith simulant called JSCndash1A13 21 Ring array concentrator The 600 mm diameter concentrator consists of seven mirror-like elements reflecting incoming direct normal irradiance into a fibre optic cable Each reflective element can be adjusted horizontally in two dimensions to allow fine tuning of the focal spot The collective reflective aperture area of the concentrator is 0192 m2 22 Fibre optic transmission line The fibre optic cable is manufactured by CeramOptec with a 037 numerical aperture consisting of 900 silica fibres treated to resist UV degradation The bundle is 4 meters in length with estimated 95 internal transmission efficiency and has fused 6 mm diameter inlet and outlet ends
Incident sunlight
Reflected rays
Focal point
Plane A
Thermal Performance of a High-flux Solar Concentrating System
R amp D Journal of the South African Institution of Mechanical Engineering 2011 27 10-22
httpwwwsaimecheorgza (open access) copy SAIMechE All rights reserved
12
23 Solar tracking system The concentrator array is equipped with a commercially available dual-axis solar tracker from Small Power Systems Inc The average tracking accuracy of the sun sensor is 005deg
Figure 2 FOCUS ring array concentrator integrated with an optical waveguide bundle for high- flux level terrestrial and space applications 3 Collector Construction The seven reflective elements of the ring array concentrator are manufactured using composite materials and a paraboloidal mould14 This approach is attractive because of the reductions in cost (one eighth the price of machining each ring from aluminium) and mass (3 kg reduction overall) Each reflective element is formed from a matrix material and two reinforcement materials to produce a fibre reinforced plastic composite Starting with the largest diameter ring the mould is machined using a CNC lathe and the wet lay-up is completed for that element (figure 3) The subsequent rings are manufactured individually by machining down the mould The reflective surfaces of the ring array are laser cut into seven conic profiles from 95 reflective Miro 4 aluminium of 04 mm thickness The aluminium is strapped on to the mould and bonded together at the join with a rectangular sheet of aluminium as the connector (figure 4) The mould is vacuum bagged to allow the aluminium to form the shape of the paraboloid After curing silicone is beaded around the inner and outer diameters of the element to prevent resin seeping between the mould and profile surface Glass and carbon fibre profiles are hand impregnated with resin and applied over the aluminium profile after which a second
vacuum bagging process is conducted for additional consolidation of the geometry (figure 5) Glass and carbon fibre profiles were hand impregnated with resin for the wet lay-up and second vacuum bagging process The concentration of sunlight with a completed reflective element is illustrated in figure 6
Figure 3 Machined geometry for element 1 (largest element) with conic aluminium profiles
Figure 4 Profile for element 7 strapped to the tooling board mould before vacuum bagging process
Figure 5 Aluminium profile bonded with a bead of silicone to prevent resin offset between the metal surface and mould
RAC
Dual axis solar tracker
Target
Concentrated sunlight injected into cable
OW transmission bundle
Rectangular connector
Conic profile with protective vinyl
Paraboloidal geometry
Glass and carbon profiles
Silicone bead
Thermal Performance of a High-flux Solar Concentrating System
R amp D Journal of the South African Institution of Mechanical Engineering 2011 27 10-22
httpwwwsaimecheorgza (open access) copy SAIMechE All rights reserved
13
Figure 6 A completed reflective element focusing incident rays to a point Each element was optically analysed after fabrication to quantify surface errors resulting from the composite material manufacturing method In order to characterise optical errors for each reflective ring using slope measurements the angular deviations between ideal and real perpendicular lines at specific points on each curved surface were obtained15 A three-dimensional co-ordinate measuring machine (CMM) was used to obtain slope errors1617 which lay between 567 mrad and 290 mrad rms (table 1) These are comparable to errors reported by Arasu and Sornakumar18 and Johnston19 who used similar fabrication methods for a parabolic trough and dish respectively The general trend in the errors shows an increase in accuracy with decreasing diameter highlighting the difficulty of manufacturing large double-curvature precision optics using composite materials Table 1 Root mean square error (RMSE) results for optically characterising the reflective elements
Several factors can cause surface errors in the manufactured elements as well as variation in error between individual elements manufactured using the same method For one the manual wet lay-up vacuum bagging process permits variation in the nature and extent of distortion Variations in resin and fibre volume fractions also depend on the skill and consistency of the laminators In this case the nature of the wet lay-up process makes it difficult to produce consistent high fibre volume fractions for each of the seven elements Improved slope error results in the smaller ring elements are due to the reduced curvature with smaller elements requiring less shaping and pressure forming of the flat reflective aluminium to form a paraboloid In addition the characteristic double curvature of the paraboloidal surface creates a complex manufacturing geometry in which material
fibres are less likely to adhere accurately to the mould shape The slope error results suggest that ring array designs should ideally comprise reflective elements with reduced curvatures if wet lay-up vacuum bagging methods are employed Despite the challenges of using composites in this type of application we are able to demonstrate that low-cost reflective elements can be fabricated to reasonable accuracies and for substantially reduced cost and weight 4 Numerical Analysis A numerical analysis was conducted using optical ray tracing software (OptisWorks Studio) to predict performance of the composite material concentrator The optical efficiency of FOCUS (equation 1) can be estimated using results from the ray tracing exercise and is defined as the product of the efficiencies applicable to the concentrator (ηRAC) the focusing process (ηfoc) injection into the fibre optic waveguide (ηinj) and transmission to the target (ητ) (figure 7) Power values used to obtain the first three efficiency stages include the power at concentrator inlet (Pin) concentrator exit (Pout) inlet to optical waveguide (POWin) and the actual power injected into the silica fibres (Pact) Predictions of each power value were derived from the ray trace model
ηoverall = ηRAC ηfoc ηinj ητ (1) The power values given in figure 7 are based on a nominal input flux of 850 Wm2 acting on an aperture of 0192 m2 41 Ray tracing model A ray tracing model was developed to characterise the optical efficiency of FOCUS by estimating the energy striking a receiver of 6 mm diameter representative of the optical waveguide inlet A further analysis was conducted to predict flux on a 60 mm diameter plate at the focal point of the collector representative of the calorimeter used in experimental testing Ray tracing simulations were conducted for eight cases describing the progression from ideal to realistic parameters All eight cases employed a nominal direct normal irradiance of 850 Wm2 to obtain comparative power density results Table 2 shows the input parameters for each case Representations of the best and worst case manufactured geometries were obtained from the CMM
42 Ray tracing results Figure 8 illustrates three dimensional flux maps at cable inlet for the ideal unrealistic simulation of case 1 and the realistic worst case scenario of case 8 The no-loss model of case 1 shows flux magnitudes exceeding 46 000 suns that violate the second law of thermodynamics due to the omission of the solar half-angle in the ideal simulation Implementing the
Thermal Performance of a High-flux Solar Concentrating System
R amp D Journal of the South African Institution of Mechanical Engineering 2011 27 10-22
httpwwwsaimecheorgza (open access) copy SAIMechE All rights reserved
14
Ideal Real
Input parameters Case 1 Case 2 Case 3 Case 4 Case 5 Case 6 Case 7 Case 8
Ideal parallel rays (000deg) 1 0 0 0 0 0 0 0
Ideal specular reflection (100) 1 1 0 0 0 0 0 0
Ideal RAC geometry 1 1 1 1 0 0 0 0
Ideal tracking error (000deg) 1 1 1 0 1 0 1 0
Solar half-angle (0265deg) 0 1 1 1 1 1 1 1
Realistic specular reflection of mirror (95) 0 0 1 1 1 1 1 1
Average tracking error (005deg) 0 0 0 1 0 1 0 1
Manufactured geometry (Best case) 0 0 0 0 1 1 0 0
Manufactured geometry (Worst case) 0 0 0 0 0 0 1 1
Table 2 Ray tracing input parameters for 8 sets of numerical simulations conducted incorporating ideal and realistic parameters for comparison
1
2
3
4
5
1632 W
1501 W
450 W
383 W
363 W
Loss = 131 W due to solar half-angle and imperfect reflection
Loss = 1051 W due to focusing errors including solar half-angle slope errors and tracking misalignment
Loss = 67 W due to imperfect cable injection
Loss = 2 W due to imperfect cable transmission
in
outRAC21 P
P==minus ηη
τηη =minus54
OWin
actinj43 P
P==minus ηη
out
OWinfoc32 P
P==minus ηη
Figure 7 Predicted optical efficiency stages for FOCUS The four efficiency stages include the concentrator focusing process injection into the optical waveguide and the transmission of the concentrated sunlight to the target
Figure 8 Three-dimensional flux maps representing flux levels at waveguide inlet for simulation cases 1 and 8
case 1 case 8
Thermal Performance of a High-flux Solar Concentrating System
R amp D Journal of the South African Institution of Mechanical Engineering 2011 27 10-22
httpwwwsaimecheorgza (open access) copy SAIMechE All rights reserved
15
solar half-angle and other realistic parameters results in more uniform flux distribution within the 6 mm diameter area as shown in the case 8 simulation Figure 9 shows the cross-sectional flux profiles striking the 6 mm diameter inlet to the optical waveguide FOWin Cases 2 ndash 8 describe in a progressive manner the expected losses at the fibre optic cable as successive error parameters are included Optical waveguide inlet power decreases by 6 between cases 2 and 4 suggesting that tracking error and imperfect specular reflectance are relatively benign effects A comparison between cases 4 and 6 and cases 4 and 8 illustrates slope error effects on the manufactured RAC
For the manufactured best and worst case scenarios of the slope errors a decrease in power of 45 and 48 is observed respectively The primary aim of the numerical analysis is to predict flux profiles striking the 6 mm diameter fibre optic cable inlet using a worst case scenario In addition a 60 mm diameter receiver was modelled to represent the flux profile striking the copper plate of the calorimeter which is used in the experimental test procedure Figure 10 illustrates the worst case flux profiles of case 8 for the 60 mm diameter and 6 mm diameter receivers These are used to validate the experimental results against the numerical model
The power values in figure 9 do not account for integration of the RAC with the fibre optic cable therefore further processing of the ray trace results is needed to estimate the energy injected into and transmitted through the cable Using case 8 as an example the inlet power of 448 W to the cable is scaled down by factoring the collective
area of the fibres and the expected transmission efficiency of the cable as described in the design methodology13 Table 3 summarises the expected power P flux F and flux concentration Cflux entering (OWin) and exiting (OWout) the cable and overall optical efficiency results of FOCUS
Figure 9 Two-dimensional flux maps showing modelled cross-sectional flux profiles at the 6 mm diameter optical waveguide inlet for Cases 2 - 8 Average power results striking the cable are given
919 W 868 W 862 W 480 W 475 W 465 W 448 W
Figure 10 Representative cross-sectional flux maps showing the worst case ray trace scenario of case 8 for a 60 mm diameter copper receiver (left) and the fibre optic cable inlet (right)
Thermal Performance of a High-flux Solar Concentrating System
R amp D Journal of the South African Institution of Mechanical Engineering 2011 27 10-22
httpwwwsaimecheorgza (open access) copy SAIMechE All rights reserved
16
5 Experimental Results The experimental testing programme aimed to characterise performance of FOCUS using energy balance methods in conjunction with a flat plate calorimeter Testing was conducted in three phases to determine firstly the power entering and secondly exiting the fibre optic cable and thirdly the melting capabilities of a lunar regolith stimulant using FOCUS 51 Energy balance methodology The flat plate calorimeter consists of a stainless steel outer casing a nylon insulator and a copper receiving plate (figure 11) An energy balance was carried out on the calorimeter to determine the concentrated flux arriving at the plate surface A detailed heat transfer analysis using the flat plate calorimeter is described by Mouzouris et al20 During operation concentrated rays strike the copper disc while cold water flows through the device to absorb energy The energy balance is invoked to estimate the solar power incident on the plate by summing the energy absorbed by the water flow and the external heat
losses due to radiation and convection (equation 2) External heat losses are estimated using temperature measurements midway in the copper plate The absorptivity of the plate surface estimates the fraction of incident irradiation absorbed Internal losses are neglected due to the low thermal conductivity of the nylon insulation within the calorimeter body
αsqin = qabs + qlout (2)
52 Experimental setup Key components of the experiment include FOCUS the calorimeter water circulation system and instrumentation (figure 12) To determine the high-flux solar measurements of FOCUS the calorimeter is positioned first at the focal point of the concentrator and secondly at fibre optic cable exit Positioning the calorimeter at concentrator focus allows the parameter at optical waveguide inlet to be determined such as power (POWin) flux (FOWin) and flux concentration ratio (CfluxOWin) When the calorimeter is placed at fibre optic outlet POWout FOWout and CfluxOWout are characterised 53 Experimental procedure Experimental testing was conducted at the University of KwaZulu-Natal under clear sky conditions The test area is sheltered from wind while allowing clear vertical views for sun-concentrator orientation Direct normal irradiance (DNI) was measured with an Eppley Normal Incidence Pyrheliometer at the nearby Howard College radiometric ground station (299degS 3098degE at 1511 m elevation21) A typical experiment includes cleaning the seven reflective elements and positioning them such that the focal spot approximates concentric alignment onto the receiver being either the copper plate or the fibre optic cable inlet The receiver is firstly positioned using the calculated focal point and then fine-tuned to minimise the focal spot diameter Positioning the ring elements and receiver was performed with the dual-axis solar tracker in operation Running time per experiment was three minutes The fluid circulation system consists of a pump fitted with a throttle valve to achieve the desired mass flow rate Mass flow
Case 1 Case 2 Case 3 Case 4 Case 5 Case 6 Case 7 Case 8
ηRAC 100 098 093 093 093 093 092 092
ηfoc 100 058 058 057 032 031 031 030
ηinj 085 085 085 085 085 085 085 085 Stages
ητ 095 095 095 095 095 095 095 095
Total ηoverall 081 046 044 043 024 023 023 022
Power at cable inlet POWin (W) 1632 919 868 862 480 475 465 448
Fibre optic inlet flux FOWin (Wcm2) 5772 3250 3070 3049 1698 1680 1645 1584
Flux concentration cable inlet Cflux OWin (suns) 67906 38239 36117 35867 19972 19764 19348 18641
Power at cable outlet POWout (W) 1324 745 704 699 389 385 377 363
Fibre optic outlet flux FOWout (Wcm2) 5483 3088 2916 2896 1613 1596 1562 1505
Flux concentration cable outlet Cflux OWout (suns) 64511 36327 34311 34074 18974 18776 18381 17709
Table 3 Predicted component efficiencies and average performance results for FOCUS using ray tracing methods at a typical irradiance of 850 Wm2
Thermal Performance of a High-flux Solar Concentrating System
R amp D Journal of the South African Institution of Mechanical Engineering 2011 27 10-22
httpwwwsaimecheorgza (open access) copy SAIMechE All rights reserved
17
rate is measured by conducting a timed volume collection and is set to keep the copper receiving plate at a temperature close to ambient to minimise external heat losses due to convection and radiation Instrumentation includes two type T thermocouples for the inlet Tin and outlet Tout water measurements and six type K thermocouples for the temperature distribution measurements midway in the copper plate The six thermocouples are labelled T0 T5 T10 T15 T20 and T25 and are used to estimate the surface temperature Ts of the copper plate
531 Concentrator focus results Characterising the flux distribution at concentrator focus requires covering the copper plate of the calorimeter with a series of reflective shields to progressively limit exposure of concentrated rays onto the copper receiver Ten stages were chosen for discretising the flux distribution starting with no shield representing full exposure of the copper plate and ending with a reflective shield incorporating a 3 mm diameter opening The 6 mm diameter reflective shield represents the cable inlet (figure 13) A nylon backing is applied to minimise conduction between the shield and copper surface Several experiments were
Water inlet
Water outlet
Thermocouples
Figure 11a Exploded view of the flat plate calorimeter Figure 11b Calorimeter side view constructed for performance measurements showing water inlet and of FOCUS and outlet passages
Copper disc
Radial flow distributer
Insulation Flow outlet
Stainless steel body
Flow inlet
Water passage
Data acquisition system Water circulation system
Ring array concentrator Optical waveguide inlet Calorimeter Optical waveguide
Instrumentation
OW exit
Water out Water in
Figure 12 Experimental layout to characterise the energy flux at the optical waveguide exit including key components FOCUS the flat plate calorimeter water circulation system and thermocouples
Water inlet
Water outlet
Thermocouples
Thermal Performance of a High-flux Solar Concentrating System
R amp D Journal of the South African Institution of Mechanical Engineering 2011 27 10-22
httpwwwsaimecheorgza (open access) copy SAIMechE All rights reserved
18
conducted for each shield to obtain the average power incident on the exposed copper surface Subtracting successive exposed power values yielded a discretised flux distribution pattern for the 60 mm diameter receiver Data from a typical experiment using the 6 mm diameter reflective shield are shown in table 4 The calorimeter inlet and outlet water temperatures and temperature distributions midway in the copper plate are shown in figure 14 Of importance is the stabilisation of temperature measurements which allows for the assumption of steady state conditions A temperature difference between water inlet and outlet of 64 degC is observed after three minutes allowed for stabilisation using a mass flow rate of 000154 kgsec resulting in 41 W of power absorbed by the water To obtain an estimate power striking the copper plate surface heat losses were calculated using the temperature distribution midway in the copper plate and added to the power absorbed by the water The temperature measurements of T10 T15 and T20 show unexpected similar readings with possible reasons due to thermocouple inaccuracies or imprecise machining of the copper plate Heat losses due to convection and radiation amounted to 02 of the power absorbed resulting in an estimate power striking the copper plate surface of 432 W at an irradiance of 9380 Wm2 This corresponds to an efficiency of 24 which is in good agreement with the case 8 numerical efficiency result at optical waveguide inlet of 27
Figure 13 The 6 mm diameter reflective shield positioned at concentrator focus A comparison between experimental and modelled flux for the parameter set of Case 8 is shown in Figure 15 Experimental results show a peak flux level of 1528 kWm2 at an input irradiance of 850 Wm2 corresponding to a concentration of 1798 suns Measured maximum temperature values at concentrator focus approached 1500degC at irradiance levels in the region of 1000 Wm2 Measured flux obtained from the application of successive
discretised filters closely follows predicted flux from the ray tracing exercise Experiments conducted using smaller reflective shields allowing a 2 mm and 1 mm diameter exposure of the copper surface produced inconsistent results possibly due to measurement uncertainties at very low heat transfer rates
Table 4 Experimental measurements and results for a typical experiment using a reflective shield with 6 mm aperture
Difficulties in stabilising the system for very small diameter filter plates (lt 3 mm) resulted in poor resolution near the peaks of both curves in figure 15 This is a shortcoming in the calorimetric method of measuring flux To measure peak flux levels further performance testing using a radiometric device such as a Gardon flux sensor is indicated
Experiment Average irradiance level (Wm2) 9380 Ray trace qin (W) 488 Experimental qin (W) 432 qabs (W) 410 qlout (W) 009
(kgs) 000154 ∆T ( Tout - Tin) (degC) 64 Ts (degC) 692 T in (degC) 270 Tout (degC) 334 Experimental qin normalised to 850 Wm2 (W)
392
Figure 14a Results from a typical experiment showing a water temperature difference of 64 degC
Tin Tout
∆T = 64 degC
Exposed copper surface of 6 mm diameter
T0
T5
T10
T15
T20
T25
Thermal Performance of a High-flux Solar Concentrating System
R amp D Journal of the South African Institution of Mechanical Engineering 2011 27 10-22
httpwwwsaimecheorgza (open access) copy SAIMechE All rights reserved
19
Key results from the first phase experiments include performance at optical waveguide inlet Representative average power and flux levels incident on the cable of 394 W and 1393 Wcm2 respectively were observed over five experiments An injected power into the 900 silica fibres of 335 W is estimated and is used in calculating the transmission efficiency of the cable 532 Optical waveguide exit results Waveguide exit performance results are obtained by directing the cable outlet at the calorimeter as shown in figure 16a Tests were conducted using the same methodology as at concentrator focus but without the reflective shields A shield was positioned at optical waveguide inlet to protect the metal ferrule from stray radiation that may cause damage (figure 16b) The shield restricts energy to the 6 mm diameter quartz glass inlet of the cable At cable outlet a preventative measure of offsetting the cable 5 mm away from the calorimeter centre was taken to avoid reflection of sunlight back on to the fibre bundle
Experimental Theoretical
Figure 15b A magnified view of the 6 mm diameter inlet to the optical waveguide (at 850 Wm2)
Figure 16b Reflective shield at fibre optic cable inlet allowing concentrated solar energy into the 6 mm diameter quartz glass inlet
T5
T0
T25
T10 T15 T20
Figure 14b Results from a typical experiment showing temperature measurements midway in the copper plate
Figure 15a Performance results at concentrator focus showing flux levels striking the 60 mm diameter copper plate (at 850 Wm2)
Vertical displacement
Figure 16a Vertical displacement of the cable outlet prevents damaging back reflection on to the 900 fibres of the cable
Thermal Performance of a High-flux Solar Concentrating System
R amp D Journal of the South African Institution of Mechanical Engineering 2011 27 10-22
httpwwwsaimecheorgza (open access) copy SAIMechE All rights reserved
20
Test results showed an average power of 205 W exiting the cable and striking the copper plate at a vertical displacement of 5 mm corresponding to a flux of 849 Wcm2 in the exit plane of the fibres The results represent normalised values at a direct normal irradiance of 850 Wm2 Transmission efficiency of the fibre optic cable is estimated at 61 using the average power results from the 6 mm diameter reflective shield conducted at concentrator focus A predicted efficiency of 95 was used for the theoretical calculations stipulated by the supplier of the cable A possible reason for the 34 decrease in efficiency is greater losses due to reflection at inlet to the cable The reflective losses at cable inlet result from the sudden change of refractive index from air (n = 10) to fused quartz glass (n = 15) This was not modelled in the ray tracing simulation A possible solution to minimise inlet reflective losses is the design and implementation of a secondary concentrator at cable inlet to boost energy injection into the silica fibres 533 Optical efficiency Final performance results from the first two experimental phases are given in table 5 A predicted efficiency of 22 was obtained using ray tracing methods and a worst case error set Experimental results show an efficiency of 13 with the difference attributed mainly to high reflective losses at inlet to the optical fibres
Table 5 FOCUS experimental performance (data normalised to a direct normal irradiance of 850 Wm2 - average of five tests) 534 Regolith melting capabilities In the final test procedure several melting experiments were performed in which concentrated sunlight was directed at a sample of the lunar regolith simulant JSC-1 This was intended to demonstrate the high surface temperatures and flux levels required to melt lunar regolith for ISRU-related applications such as those reported by Nakamura and Senior7 The experimental procedure includes positioning the optical waveguide onto the JSC-1 surface and measuring the the temperature of the melt zone
formed after a period of six minutes (figure 17a) A downward facing reflective shield was positioned beneath the cable to prevent reflected solar rays from the regolith surface striking the cable The temperature of the regolith simulant was measured using a thermocouple positioned at the centre of the melt zone Figure 17b shows a post-experimental sample of the melted regolith from a typical experiment The vitrified circular melt zone formed after six minutes is 6 mm in diameter with a depth of 25 mm Table 6 summarises the peak melt temperature readings obtained for five separate experiments The stabilisation of temperature within the melt zone is illustrated in figure 18 showing peak values graphed against estimated flux levels Flux levels exiting the cable were estimated using average irradiance levels over the test period and the optical efficiency value of 13 Results show a peak temperature exceeding 1200 K at cable exit flux levels of 104 Wcm2 which exceeds the minimum flux criterion for successful regolith melting by 22 Temperature results achieved can be applied to several high temperature lunar ISRU processes including oxygen production and surface stabilisation Creating larger sintered surfaces for practical human use on the lunar surface is possible by implementing autonomous mechanisms to drive multiple fibre optic cables in a coordinated manner22
Theoretical Experimental
POWin (W) 448 394
FOWin (Wcm2) 1584 1393
Cflux OWin (suns) 18641 16388
POWout (W) 363 205
FOWout (Wcm2) 1505 849
Cflux OWout (suns) 17709 9988
ηoverall 022 013
Ceramic dish containing JSC-1
Downward facing reflective shield
6 mm
Figure 17a Regolith melting experiment with the protective shield (reflector) to prevent cable damage and a thermocouple
Figure 17b Magnified view of the vitrified melt with diameter of 6 mm and depth 25 mm
Thermal Performance of a High-flux Solar Concentrating System
R amp D Journal of the South African Institution of Mechanical Engineering 2011 27 10-22
httpwwwsaimecheorgza (open access) copy SAIMechE All rights reserved
21
6 Conclusion The design fabrication and testing of a composite material ring array concentrator is described for the collection of solar energy and its transmission through a fibre optic bundle The FOCUS system has application in high-temperature research such as material sintering and lunar in-situ resource utilisation The overall transmission efficiency from aperture to bundle outlet was measured at 13 using a flat plate calorimeter Temperatures
exceeding 1450 degC and 900 degC were measured at the concentrator focal point and the outlet of the fibres respectively yielding flux levels of 104 Wcm2 An optical error analysis of the seven reflective elements is described In addition to performance validation this work also provides an alternate approach to conventional methods of collector construction Rather than machining metal profiles for the reflective surface extensive use was made of composite materials resulting in a low-cost light weight point focus concentrator that is 38 lighter than an aluminium equivalent and considerably less expensive Results suggest that further reduction in optical error is possible by limiting reflector curvature in the design stage and adapting the optics to accommodate for structural distortion during curing Acknowledgements The authors appreciate the assistance and support of Professor J Bindon Professor WH Moolman Clinton Bemont Khulisile Kunene Michael Constantino OPTIS Durban University of Technology and the University of Stellenboschrsquos Centre for Renewable and Sustainable Energy Studies (CRSES) This work is supported by the National Research Foundation of South Africa and the Eskom TESP program References 1 Pregger T Graf D Krewitt W Sattler C Roeb M and
Moller S Prospects of solar thermal hydrogen production processes International Journal of Hydrogen Energy 2009 34 4256-4267
2 Kalogirou SA Solar thermal collectors and applications Progress in Energy and Combustion Science 2004 30 231-295
3 Sen Z Solar energy in progress and future research trends Progress in Energy and Combustion Science 2004 30 367-416
4 Vasylyev S and Vasylyev V Nonimaging reflective lenses A new type of high-heat solar collector Proceedings of the Solar World Congress Orlando Florida 2005
Experiment 1 2 3 4 5
Irradiance level (Wm2) 10054 9971 9957 9913 9879 Peak temperature (degC) 9355 9016 8820 8769 8504 Flux level (Wcm2) 1040 1031 1029 1025 1021
Experiment 1
Experiment 2
Experiment 3
Experiment 4
Experiment 5
Figure 18a Time evolution of the melt temperature for five experiments for 6 min showing temperature stabilisation in the melt zone
Table 6 Lunar regolith simulant peak melt temperature and cable exit flux concentration results
Figure 18b Peak melt temperatures versus maximum flux levels exiting the 900 silica fibres
Thermal Performance of a High-flux Solar Concentrating System
R amp D Journal of the South African Institution of Mechanical Engineering 2011 27 10-22
httpwwwsaimecheorgza (open access) copy SAIMechE All rights reserved
22
5 Vasylyev V and Vasylyev S Expected optical
performances of novel type multi-element high-heat solar concentrators Proceedings of the American Solar Energy Society Reno NV 2002
6 Feuermann D Gordon JM and Huleihil M Solar fiber-optic mini-dish concentrators First experimental results and field experience Solar Energy 2002 71 459-472
7 Nakamura T and Senior CL Solar thermal power for lunar materials processing Journal of Aerospace Engineering 2008 21 91-101
8 Ballestriacuten J Estrada CA Rodriacuteguez-Alonso M Peacuterez-Raacutebago C Langley LW and Barnes A Heat flux sensors Calorimeters or radiometers Solar Energy 2006 80 1314-1320
9 Ballestriacuten J A non-water-cooled heat flux measurement system under concentrated solar radiation conditions Solar Energy 2002 73 159-168
10 Estrada CA Jaramillo OA Acosta R and Arancibia-Bulnes CA Heat transfer analysis in a calorimeter for concentrated solar radiation measurements Solar Energy 2007 81 1306-1313
11 Fernandez-Reche J Sanchez M Alonso M Canadas I Chenlo F Rodriguez J and Ballestrin J Concentrating PV An alternative to calorimeters for measuring high solar flux densities Journal of Solar Energy Engineering 2008 130 0445021-0445023
12 Ballestriacuten J Ulmer S Morales A Barnes A Langley LW and Rodriguez M Systematic error in the measurement of very high solar irradiance Solar Energy Materials and Solar Cells 2003 80 375-381
13 Mouzouris M and Brooks MJ Nonimaging solar thermal collector for high temperature terrestrial and space applications Proceedings of SPIE Optics and Photonics San Diego CA 2009
14 Mouzouris M and Brooks MJ Construction of a composite material solar concentrator for high heat flux applications Proceedings of 8th Annual International Energy Conversion Engineering Conference Nashville TN 2010
15 Stine WB and Harrigan RW Solar energy
fundamentals and design with computer applications Wiley Alternate Energy 1985 185-188
16 Kumler JJ and Caldwell JB Measuring surface slope error on precision aspheres Proceedings of SPIE Optics and Photonics 2007
17 Menq C and Chen FL Curve and surface approximation from CMM measurement data Computers ind Engng 1996 30 211-225
18 Arasu VA and Sornakumar T Design manufacture and testing of fiberglass reinforced parabola trough for parabolic trough solar collector Solar Energy 2007 81 1273-1279
19 Johnston G Focal region measurements of the 20 m2 tilted dish at the Australian National University Solar Energy 1998 63 117-124
20 Mouzouris M Roberts LW and Brooks MJ Heat transfer analysis for high-flux solar measurements using a flat plate calorimeter Proceedings of First Postgraduate Renewable Energy Symposium CRSES Stellenbosch RSA 2010
21 Kunene KR Brooks MJ Roberts LW and Zawilska E Introducing GRADRAD The greater Durban radiometric network Proceedings of World Renewable Energy Congress XI Abu Dhabi UAE 2010
22 Nakamura T and Smith BK Solar thermal system for lunar ISRU applications Development and field operation at Mauna Kea HI Proceedings of 48th AIAA Aerospace Sciences Meeting Including the New Horizons Forum and Aerospace Exposition Orlando FL 2011
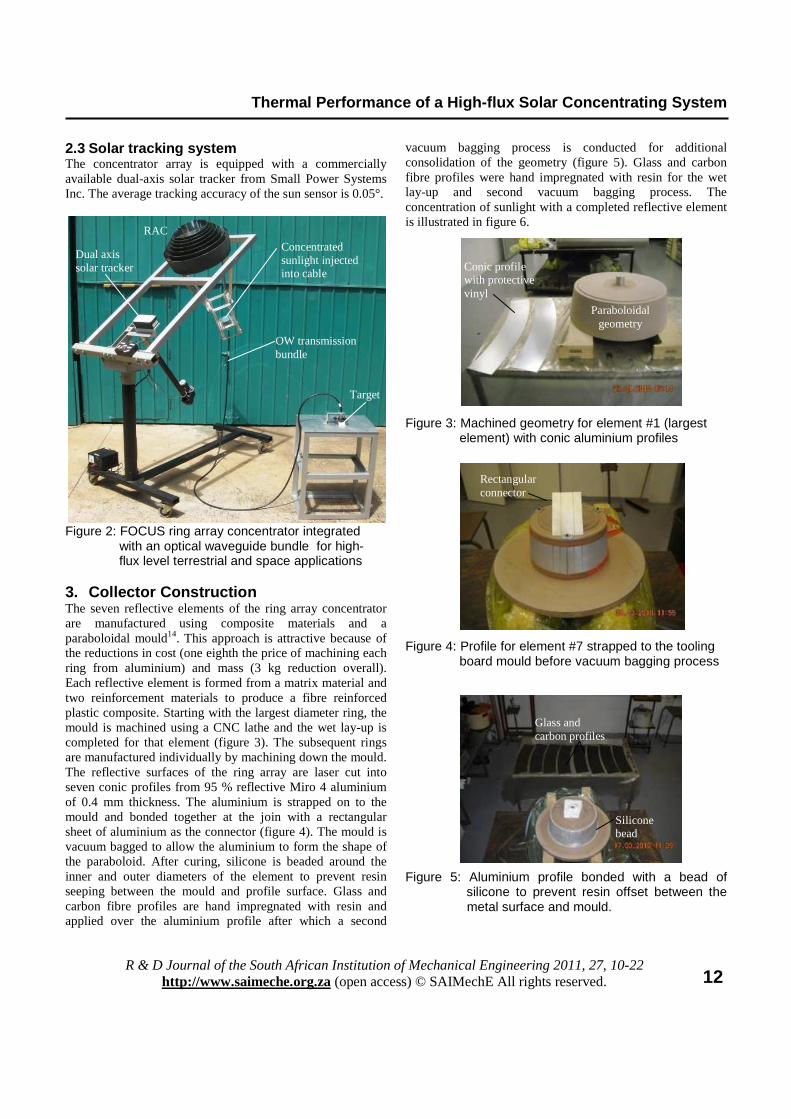
Thermal Performance of a High-flux Solar Concentrating System
R amp D Journal of the South African Institution of Mechanical Engineering 2011 27 10-22
httpwwwsaimecheorgza (open access) copy SAIMechE All rights reserved
12
23 Solar tracking system The concentrator array is equipped with a commercially available dual-axis solar tracker from Small Power Systems Inc The average tracking accuracy of the sun sensor is 005deg
Figure 2 FOCUS ring array concentrator integrated with an optical waveguide bundle for high- flux level terrestrial and space applications 3 Collector Construction The seven reflective elements of the ring array concentrator are manufactured using composite materials and a paraboloidal mould14 This approach is attractive because of the reductions in cost (one eighth the price of machining each ring from aluminium) and mass (3 kg reduction overall) Each reflective element is formed from a matrix material and two reinforcement materials to produce a fibre reinforced plastic composite Starting with the largest diameter ring the mould is machined using a CNC lathe and the wet lay-up is completed for that element (figure 3) The subsequent rings are manufactured individually by machining down the mould The reflective surfaces of the ring array are laser cut into seven conic profiles from 95 reflective Miro 4 aluminium of 04 mm thickness The aluminium is strapped on to the mould and bonded together at the join with a rectangular sheet of aluminium as the connector (figure 4) The mould is vacuum bagged to allow the aluminium to form the shape of the paraboloid After curing silicone is beaded around the inner and outer diameters of the element to prevent resin seeping between the mould and profile surface Glass and carbon fibre profiles are hand impregnated with resin and applied over the aluminium profile after which a second
vacuum bagging process is conducted for additional consolidation of the geometry (figure 5) Glass and carbon fibre profiles were hand impregnated with resin for the wet lay-up and second vacuum bagging process The concentration of sunlight with a completed reflective element is illustrated in figure 6
Figure 3 Machined geometry for element 1 (largest element) with conic aluminium profiles
Figure 4 Profile for element 7 strapped to the tooling board mould before vacuum bagging process
Figure 5 Aluminium profile bonded with a bead of silicone to prevent resin offset between the metal surface and mould
RAC
Dual axis solar tracker
Target
Concentrated sunlight injected into cable
OW transmission bundle
Rectangular connector
Conic profile with protective vinyl
Paraboloidal geometry
Glass and carbon profiles
Silicone bead
Thermal Performance of a High-flux Solar Concentrating System
R amp D Journal of the South African Institution of Mechanical Engineering 2011 27 10-22
httpwwwsaimecheorgza (open access) copy SAIMechE All rights reserved
13
Figure 6 A completed reflective element focusing incident rays to a point Each element was optically analysed after fabrication to quantify surface errors resulting from the composite material manufacturing method In order to characterise optical errors for each reflective ring using slope measurements the angular deviations between ideal and real perpendicular lines at specific points on each curved surface were obtained15 A three-dimensional co-ordinate measuring machine (CMM) was used to obtain slope errors1617 which lay between 567 mrad and 290 mrad rms (table 1) These are comparable to errors reported by Arasu and Sornakumar18 and Johnston19 who used similar fabrication methods for a parabolic trough and dish respectively The general trend in the errors shows an increase in accuracy with decreasing diameter highlighting the difficulty of manufacturing large double-curvature precision optics using composite materials Table 1 Root mean square error (RMSE) results for optically characterising the reflective elements
Several factors can cause surface errors in the manufactured elements as well as variation in error between individual elements manufactured using the same method For one the manual wet lay-up vacuum bagging process permits variation in the nature and extent of distortion Variations in resin and fibre volume fractions also depend on the skill and consistency of the laminators In this case the nature of the wet lay-up process makes it difficult to produce consistent high fibre volume fractions for each of the seven elements Improved slope error results in the smaller ring elements are due to the reduced curvature with smaller elements requiring less shaping and pressure forming of the flat reflective aluminium to form a paraboloid In addition the characteristic double curvature of the paraboloidal surface creates a complex manufacturing geometry in which material
fibres are less likely to adhere accurately to the mould shape The slope error results suggest that ring array designs should ideally comprise reflective elements with reduced curvatures if wet lay-up vacuum bagging methods are employed Despite the challenges of using composites in this type of application we are able to demonstrate that low-cost reflective elements can be fabricated to reasonable accuracies and for substantially reduced cost and weight 4 Numerical Analysis A numerical analysis was conducted using optical ray tracing software (OptisWorks Studio) to predict performance of the composite material concentrator The optical efficiency of FOCUS (equation 1) can be estimated using results from the ray tracing exercise and is defined as the product of the efficiencies applicable to the concentrator (ηRAC) the focusing process (ηfoc) injection into the fibre optic waveguide (ηinj) and transmission to the target (ητ) (figure 7) Power values used to obtain the first three efficiency stages include the power at concentrator inlet (Pin) concentrator exit (Pout) inlet to optical waveguide (POWin) and the actual power injected into the silica fibres (Pact) Predictions of each power value were derived from the ray trace model
ηoverall = ηRAC ηfoc ηinj ητ (1) The power values given in figure 7 are based on a nominal input flux of 850 Wm2 acting on an aperture of 0192 m2 41 Ray tracing model A ray tracing model was developed to characterise the optical efficiency of FOCUS by estimating the energy striking a receiver of 6 mm diameter representative of the optical waveguide inlet A further analysis was conducted to predict flux on a 60 mm diameter plate at the focal point of the collector representative of the calorimeter used in experimental testing Ray tracing simulations were conducted for eight cases describing the progression from ideal to realistic parameters All eight cases employed a nominal direct normal irradiance of 850 Wm2 to obtain comparative power density results Table 2 shows the input parameters for each case Representations of the best and worst case manufactured geometries were obtained from the CMM
42 Ray tracing results Figure 8 illustrates three dimensional flux maps at cable inlet for the ideal unrealistic simulation of case 1 and the realistic worst case scenario of case 8 The no-loss model of case 1 shows flux magnitudes exceeding 46 000 suns that violate the second law of thermodynamics due to the omission of the solar half-angle in the ideal simulation Implementing the
Thermal Performance of a High-flux Solar Concentrating System
R amp D Journal of the South African Institution of Mechanical Engineering 2011 27 10-22
httpwwwsaimecheorgza (open access) copy SAIMechE All rights reserved
14
Ideal Real
Input parameters Case 1 Case 2 Case 3 Case 4 Case 5 Case 6 Case 7 Case 8
Ideal parallel rays (000deg) 1 0 0 0 0 0 0 0
Ideal specular reflection (100) 1 1 0 0 0 0 0 0
Ideal RAC geometry 1 1 1 1 0 0 0 0
Ideal tracking error (000deg) 1 1 1 0 1 0 1 0
Solar half-angle (0265deg) 0 1 1 1 1 1 1 1
Realistic specular reflection of mirror (95) 0 0 1 1 1 1 1 1
Average tracking error (005deg) 0 0 0 1 0 1 0 1
Manufactured geometry (Best case) 0 0 0 0 1 1 0 0
Manufactured geometry (Worst case) 0 0 0 0 0 0 1 1
Table 2 Ray tracing input parameters for 8 sets of numerical simulations conducted incorporating ideal and realistic parameters for comparison
1
2
3
4
5
1632 W
1501 W
450 W
383 W
363 W
Loss = 131 W due to solar half-angle and imperfect reflection
Loss = 1051 W due to focusing errors including solar half-angle slope errors and tracking misalignment
Loss = 67 W due to imperfect cable injection
Loss = 2 W due to imperfect cable transmission
in
outRAC21 P
P==minus ηη
τηη =minus54
OWin
actinj43 P
P==minus ηη
out
OWinfoc32 P
P==minus ηη
Figure 7 Predicted optical efficiency stages for FOCUS The four efficiency stages include the concentrator focusing process injection into the optical waveguide and the transmission of the concentrated sunlight to the target
Figure 8 Three-dimensional flux maps representing flux levels at waveguide inlet for simulation cases 1 and 8
case 1 case 8
Thermal Performance of a High-flux Solar Concentrating System
R amp D Journal of the South African Institution of Mechanical Engineering 2011 27 10-22
httpwwwsaimecheorgza (open access) copy SAIMechE All rights reserved
15
solar half-angle and other realistic parameters results in more uniform flux distribution within the 6 mm diameter area as shown in the case 8 simulation Figure 9 shows the cross-sectional flux profiles striking the 6 mm diameter inlet to the optical waveguide FOWin Cases 2 ndash 8 describe in a progressive manner the expected losses at the fibre optic cable as successive error parameters are included Optical waveguide inlet power decreases by 6 between cases 2 and 4 suggesting that tracking error and imperfect specular reflectance are relatively benign effects A comparison between cases 4 and 6 and cases 4 and 8 illustrates slope error effects on the manufactured RAC
For the manufactured best and worst case scenarios of the slope errors a decrease in power of 45 and 48 is observed respectively The primary aim of the numerical analysis is to predict flux profiles striking the 6 mm diameter fibre optic cable inlet using a worst case scenario In addition a 60 mm diameter receiver was modelled to represent the flux profile striking the copper plate of the calorimeter which is used in the experimental test procedure Figure 10 illustrates the worst case flux profiles of case 8 for the 60 mm diameter and 6 mm diameter receivers These are used to validate the experimental results against the numerical model
The power values in figure 9 do not account for integration of the RAC with the fibre optic cable therefore further processing of the ray trace results is needed to estimate the energy injected into and transmitted through the cable Using case 8 as an example the inlet power of 448 W to the cable is scaled down by factoring the collective
area of the fibres and the expected transmission efficiency of the cable as described in the design methodology13 Table 3 summarises the expected power P flux F and flux concentration Cflux entering (OWin) and exiting (OWout) the cable and overall optical efficiency results of FOCUS
Figure 9 Two-dimensional flux maps showing modelled cross-sectional flux profiles at the 6 mm diameter optical waveguide inlet for Cases 2 - 8 Average power results striking the cable are given
919 W 868 W 862 W 480 W 475 W 465 W 448 W
Figure 10 Representative cross-sectional flux maps showing the worst case ray trace scenario of case 8 for a 60 mm diameter copper receiver (left) and the fibre optic cable inlet (right)
Thermal Performance of a High-flux Solar Concentrating System
R amp D Journal of the South African Institution of Mechanical Engineering 2011 27 10-22
httpwwwsaimecheorgza (open access) copy SAIMechE All rights reserved
16
5 Experimental Results The experimental testing programme aimed to characterise performance of FOCUS using energy balance methods in conjunction with a flat plate calorimeter Testing was conducted in three phases to determine firstly the power entering and secondly exiting the fibre optic cable and thirdly the melting capabilities of a lunar regolith stimulant using FOCUS 51 Energy balance methodology The flat plate calorimeter consists of a stainless steel outer casing a nylon insulator and a copper receiving plate (figure 11) An energy balance was carried out on the calorimeter to determine the concentrated flux arriving at the plate surface A detailed heat transfer analysis using the flat plate calorimeter is described by Mouzouris et al20 During operation concentrated rays strike the copper disc while cold water flows through the device to absorb energy The energy balance is invoked to estimate the solar power incident on the plate by summing the energy absorbed by the water flow and the external heat
losses due to radiation and convection (equation 2) External heat losses are estimated using temperature measurements midway in the copper plate The absorptivity of the plate surface estimates the fraction of incident irradiation absorbed Internal losses are neglected due to the low thermal conductivity of the nylon insulation within the calorimeter body
αsqin = qabs + qlout (2)
52 Experimental setup Key components of the experiment include FOCUS the calorimeter water circulation system and instrumentation (figure 12) To determine the high-flux solar measurements of FOCUS the calorimeter is positioned first at the focal point of the concentrator and secondly at fibre optic cable exit Positioning the calorimeter at concentrator focus allows the parameter at optical waveguide inlet to be determined such as power (POWin) flux (FOWin) and flux concentration ratio (CfluxOWin) When the calorimeter is placed at fibre optic outlet POWout FOWout and CfluxOWout are characterised 53 Experimental procedure Experimental testing was conducted at the University of KwaZulu-Natal under clear sky conditions The test area is sheltered from wind while allowing clear vertical views for sun-concentrator orientation Direct normal irradiance (DNI) was measured with an Eppley Normal Incidence Pyrheliometer at the nearby Howard College radiometric ground station (299degS 3098degE at 1511 m elevation21) A typical experiment includes cleaning the seven reflective elements and positioning them such that the focal spot approximates concentric alignment onto the receiver being either the copper plate or the fibre optic cable inlet The receiver is firstly positioned using the calculated focal point and then fine-tuned to minimise the focal spot diameter Positioning the ring elements and receiver was performed with the dual-axis solar tracker in operation Running time per experiment was three minutes The fluid circulation system consists of a pump fitted with a throttle valve to achieve the desired mass flow rate Mass flow
Case 1 Case 2 Case 3 Case 4 Case 5 Case 6 Case 7 Case 8
ηRAC 100 098 093 093 093 093 092 092
ηfoc 100 058 058 057 032 031 031 030
ηinj 085 085 085 085 085 085 085 085 Stages
ητ 095 095 095 095 095 095 095 095
Total ηoverall 081 046 044 043 024 023 023 022
Power at cable inlet POWin (W) 1632 919 868 862 480 475 465 448
Fibre optic inlet flux FOWin (Wcm2) 5772 3250 3070 3049 1698 1680 1645 1584
Flux concentration cable inlet Cflux OWin (suns) 67906 38239 36117 35867 19972 19764 19348 18641
Power at cable outlet POWout (W) 1324 745 704 699 389 385 377 363
Fibre optic outlet flux FOWout (Wcm2) 5483 3088 2916 2896 1613 1596 1562 1505
Flux concentration cable outlet Cflux OWout (suns) 64511 36327 34311 34074 18974 18776 18381 17709
Table 3 Predicted component efficiencies and average performance results for FOCUS using ray tracing methods at a typical irradiance of 850 Wm2
Thermal Performance of a High-flux Solar Concentrating System
R amp D Journal of the South African Institution of Mechanical Engineering 2011 27 10-22
httpwwwsaimecheorgza (open access) copy SAIMechE All rights reserved
17
rate is measured by conducting a timed volume collection and is set to keep the copper receiving plate at a temperature close to ambient to minimise external heat losses due to convection and radiation Instrumentation includes two type T thermocouples for the inlet Tin and outlet Tout water measurements and six type K thermocouples for the temperature distribution measurements midway in the copper plate The six thermocouples are labelled T0 T5 T10 T15 T20 and T25 and are used to estimate the surface temperature Ts of the copper plate
531 Concentrator focus results Characterising the flux distribution at concentrator focus requires covering the copper plate of the calorimeter with a series of reflective shields to progressively limit exposure of concentrated rays onto the copper receiver Ten stages were chosen for discretising the flux distribution starting with no shield representing full exposure of the copper plate and ending with a reflective shield incorporating a 3 mm diameter opening The 6 mm diameter reflective shield represents the cable inlet (figure 13) A nylon backing is applied to minimise conduction between the shield and copper surface Several experiments were
Water inlet
Water outlet
Thermocouples
Figure 11a Exploded view of the flat plate calorimeter Figure 11b Calorimeter side view constructed for performance measurements showing water inlet and of FOCUS and outlet passages
Copper disc
Radial flow distributer
Insulation Flow outlet
Stainless steel body
Flow inlet
Water passage
Data acquisition system Water circulation system
Ring array concentrator Optical waveguide inlet Calorimeter Optical waveguide
Instrumentation
OW exit
Water out Water in
Figure 12 Experimental layout to characterise the energy flux at the optical waveguide exit including key components FOCUS the flat plate calorimeter water circulation system and thermocouples
Water inlet
Water outlet
Thermocouples
Thermal Performance of a High-flux Solar Concentrating System
R amp D Journal of the South African Institution of Mechanical Engineering 2011 27 10-22
httpwwwsaimecheorgza (open access) copy SAIMechE All rights reserved
18
conducted for each shield to obtain the average power incident on the exposed copper surface Subtracting successive exposed power values yielded a discretised flux distribution pattern for the 60 mm diameter receiver Data from a typical experiment using the 6 mm diameter reflective shield are shown in table 4 The calorimeter inlet and outlet water temperatures and temperature distributions midway in the copper plate are shown in figure 14 Of importance is the stabilisation of temperature measurements which allows for the assumption of steady state conditions A temperature difference between water inlet and outlet of 64 degC is observed after three minutes allowed for stabilisation using a mass flow rate of 000154 kgsec resulting in 41 W of power absorbed by the water To obtain an estimate power striking the copper plate surface heat losses were calculated using the temperature distribution midway in the copper plate and added to the power absorbed by the water The temperature measurements of T10 T15 and T20 show unexpected similar readings with possible reasons due to thermocouple inaccuracies or imprecise machining of the copper plate Heat losses due to convection and radiation amounted to 02 of the power absorbed resulting in an estimate power striking the copper plate surface of 432 W at an irradiance of 9380 Wm2 This corresponds to an efficiency of 24 which is in good agreement with the case 8 numerical efficiency result at optical waveguide inlet of 27
Figure 13 The 6 mm diameter reflective shield positioned at concentrator focus A comparison between experimental and modelled flux for the parameter set of Case 8 is shown in Figure 15 Experimental results show a peak flux level of 1528 kWm2 at an input irradiance of 850 Wm2 corresponding to a concentration of 1798 suns Measured maximum temperature values at concentrator focus approached 1500degC at irradiance levels in the region of 1000 Wm2 Measured flux obtained from the application of successive
discretised filters closely follows predicted flux from the ray tracing exercise Experiments conducted using smaller reflective shields allowing a 2 mm and 1 mm diameter exposure of the copper surface produced inconsistent results possibly due to measurement uncertainties at very low heat transfer rates
Table 4 Experimental measurements and results for a typical experiment using a reflective shield with 6 mm aperture
Difficulties in stabilising the system for very small diameter filter plates (lt 3 mm) resulted in poor resolution near the peaks of both curves in figure 15 This is a shortcoming in the calorimetric method of measuring flux To measure peak flux levels further performance testing using a radiometric device such as a Gardon flux sensor is indicated
Experiment Average irradiance level (Wm2) 9380 Ray trace qin (W) 488 Experimental qin (W) 432 qabs (W) 410 qlout (W) 009
(kgs) 000154 ∆T ( Tout - Tin) (degC) 64 Ts (degC) 692 T in (degC) 270 Tout (degC) 334 Experimental qin normalised to 850 Wm2 (W)
392
Figure 14a Results from a typical experiment showing a water temperature difference of 64 degC
Tin Tout
∆T = 64 degC
Exposed copper surface of 6 mm diameter
T0
T5
T10
T15
T20
T25
Thermal Performance of a High-flux Solar Concentrating System
R amp D Journal of the South African Institution of Mechanical Engineering 2011 27 10-22
httpwwwsaimecheorgza (open access) copy SAIMechE All rights reserved
19
Key results from the first phase experiments include performance at optical waveguide inlet Representative average power and flux levels incident on the cable of 394 W and 1393 Wcm2 respectively were observed over five experiments An injected power into the 900 silica fibres of 335 W is estimated and is used in calculating the transmission efficiency of the cable 532 Optical waveguide exit results Waveguide exit performance results are obtained by directing the cable outlet at the calorimeter as shown in figure 16a Tests were conducted using the same methodology as at concentrator focus but without the reflective shields A shield was positioned at optical waveguide inlet to protect the metal ferrule from stray radiation that may cause damage (figure 16b) The shield restricts energy to the 6 mm diameter quartz glass inlet of the cable At cable outlet a preventative measure of offsetting the cable 5 mm away from the calorimeter centre was taken to avoid reflection of sunlight back on to the fibre bundle
Experimental Theoretical
Figure 15b A magnified view of the 6 mm diameter inlet to the optical waveguide (at 850 Wm2)
Figure 16b Reflective shield at fibre optic cable inlet allowing concentrated solar energy into the 6 mm diameter quartz glass inlet
T5
T0
T25
T10 T15 T20
Figure 14b Results from a typical experiment showing temperature measurements midway in the copper plate
Figure 15a Performance results at concentrator focus showing flux levels striking the 60 mm diameter copper plate (at 850 Wm2)
Vertical displacement
Figure 16a Vertical displacement of the cable outlet prevents damaging back reflection on to the 900 fibres of the cable
Thermal Performance of a High-flux Solar Concentrating System
R amp D Journal of the South African Institution of Mechanical Engineering 2011 27 10-22
httpwwwsaimecheorgza (open access) copy SAIMechE All rights reserved
20
Test results showed an average power of 205 W exiting the cable and striking the copper plate at a vertical displacement of 5 mm corresponding to a flux of 849 Wcm2 in the exit plane of the fibres The results represent normalised values at a direct normal irradiance of 850 Wm2 Transmission efficiency of the fibre optic cable is estimated at 61 using the average power results from the 6 mm diameter reflective shield conducted at concentrator focus A predicted efficiency of 95 was used for the theoretical calculations stipulated by the supplier of the cable A possible reason for the 34 decrease in efficiency is greater losses due to reflection at inlet to the cable The reflective losses at cable inlet result from the sudden change of refractive index from air (n = 10) to fused quartz glass (n = 15) This was not modelled in the ray tracing simulation A possible solution to minimise inlet reflective losses is the design and implementation of a secondary concentrator at cable inlet to boost energy injection into the silica fibres 533 Optical efficiency Final performance results from the first two experimental phases are given in table 5 A predicted efficiency of 22 was obtained using ray tracing methods and a worst case error set Experimental results show an efficiency of 13 with the difference attributed mainly to high reflective losses at inlet to the optical fibres
Table 5 FOCUS experimental performance (data normalised to a direct normal irradiance of 850 Wm2 - average of five tests) 534 Regolith melting capabilities In the final test procedure several melting experiments were performed in which concentrated sunlight was directed at a sample of the lunar regolith simulant JSC-1 This was intended to demonstrate the high surface temperatures and flux levels required to melt lunar regolith for ISRU-related applications such as those reported by Nakamura and Senior7 The experimental procedure includes positioning the optical waveguide onto the JSC-1 surface and measuring the the temperature of the melt zone
formed after a period of six minutes (figure 17a) A downward facing reflective shield was positioned beneath the cable to prevent reflected solar rays from the regolith surface striking the cable The temperature of the regolith simulant was measured using a thermocouple positioned at the centre of the melt zone Figure 17b shows a post-experimental sample of the melted regolith from a typical experiment The vitrified circular melt zone formed after six minutes is 6 mm in diameter with a depth of 25 mm Table 6 summarises the peak melt temperature readings obtained for five separate experiments The stabilisation of temperature within the melt zone is illustrated in figure 18 showing peak values graphed against estimated flux levels Flux levels exiting the cable were estimated using average irradiance levels over the test period and the optical efficiency value of 13 Results show a peak temperature exceeding 1200 K at cable exit flux levels of 104 Wcm2 which exceeds the minimum flux criterion for successful regolith melting by 22 Temperature results achieved can be applied to several high temperature lunar ISRU processes including oxygen production and surface stabilisation Creating larger sintered surfaces for practical human use on the lunar surface is possible by implementing autonomous mechanisms to drive multiple fibre optic cables in a coordinated manner22
Theoretical Experimental
POWin (W) 448 394
FOWin (Wcm2) 1584 1393
Cflux OWin (suns) 18641 16388
POWout (W) 363 205
FOWout (Wcm2) 1505 849
Cflux OWout (suns) 17709 9988
ηoverall 022 013
Ceramic dish containing JSC-1
Downward facing reflective shield
6 mm
Figure 17a Regolith melting experiment with the protective shield (reflector) to prevent cable damage and a thermocouple
Figure 17b Magnified view of the vitrified melt with diameter of 6 mm and depth 25 mm
Thermal Performance of a High-flux Solar Concentrating System
R amp D Journal of the South African Institution of Mechanical Engineering 2011 27 10-22
httpwwwsaimecheorgza (open access) copy SAIMechE All rights reserved
21
6 Conclusion The design fabrication and testing of a composite material ring array concentrator is described for the collection of solar energy and its transmission through a fibre optic bundle The FOCUS system has application in high-temperature research such as material sintering and lunar in-situ resource utilisation The overall transmission efficiency from aperture to bundle outlet was measured at 13 using a flat plate calorimeter Temperatures
exceeding 1450 degC and 900 degC were measured at the concentrator focal point and the outlet of the fibres respectively yielding flux levels of 104 Wcm2 An optical error analysis of the seven reflective elements is described In addition to performance validation this work also provides an alternate approach to conventional methods of collector construction Rather than machining metal profiles for the reflective surface extensive use was made of composite materials resulting in a low-cost light weight point focus concentrator that is 38 lighter than an aluminium equivalent and considerably less expensive Results suggest that further reduction in optical error is possible by limiting reflector curvature in the design stage and adapting the optics to accommodate for structural distortion during curing Acknowledgements The authors appreciate the assistance and support of Professor J Bindon Professor WH Moolman Clinton Bemont Khulisile Kunene Michael Constantino OPTIS Durban University of Technology and the University of Stellenboschrsquos Centre for Renewable and Sustainable Energy Studies (CRSES) This work is supported by the National Research Foundation of South Africa and the Eskom TESP program References 1 Pregger T Graf D Krewitt W Sattler C Roeb M and
Moller S Prospects of solar thermal hydrogen production processes International Journal of Hydrogen Energy 2009 34 4256-4267
2 Kalogirou SA Solar thermal collectors and applications Progress in Energy and Combustion Science 2004 30 231-295
3 Sen Z Solar energy in progress and future research trends Progress in Energy and Combustion Science 2004 30 367-416
4 Vasylyev S and Vasylyev V Nonimaging reflective lenses A new type of high-heat solar collector Proceedings of the Solar World Congress Orlando Florida 2005
Experiment 1 2 3 4 5
Irradiance level (Wm2) 10054 9971 9957 9913 9879 Peak temperature (degC) 9355 9016 8820 8769 8504 Flux level (Wcm2) 1040 1031 1029 1025 1021
Experiment 1
Experiment 2
Experiment 3
Experiment 4
Experiment 5
Figure 18a Time evolution of the melt temperature for five experiments for 6 min showing temperature stabilisation in the melt zone
Table 6 Lunar regolith simulant peak melt temperature and cable exit flux concentration results
Figure 18b Peak melt temperatures versus maximum flux levels exiting the 900 silica fibres
Thermal Performance of a High-flux Solar Concentrating System
R amp D Journal of the South African Institution of Mechanical Engineering 2011 27 10-22
httpwwwsaimecheorgza (open access) copy SAIMechE All rights reserved
22
5 Vasylyev V and Vasylyev S Expected optical
performances of novel type multi-element high-heat solar concentrators Proceedings of the American Solar Energy Society Reno NV 2002
6 Feuermann D Gordon JM and Huleihil M Solar fiber-optic mini-dish concentrators First experimental results and field experience Solar Energy 2002 71 459-472
7 Nakamura T and Senior CL Solar thermal power for lunar materials processing Journal of Aerospace Engineering 2008 21 91-101
8 Ballestriacuten J Estrada CA Rodriacuteguez-Alonso M Peacuterez-Raacutebago C Langley LW and Barnes A Heat flux sensors Calorimeters or radiometers Solar Energy 2006 80 1314-1320
9 Ballestriacuten J A non-water-cooled heat flux measurement system under concentrated solar radiation conditions Solar Energy 2002 73 159-168
10 Estrada CA Jaramillo OA Acosta R and Arancibia-Bulnes CA Heat transfer analysis in a calorimeter for concentrated solar radiation measurements Solar Energy 2007 81 1306-1313
11 Fernandez-Reche J Sanchez M Alonso M Canadas I Chenlo F Rodriguez J and Ballestrin J Concentrating PV An alternative to calorimeters for measuring high solar flux densities Journal of Solar Energy Engineering 2008 130 0445021-0445023
12 Ballestriacuten J Ulmer S Morales A Barnes A Langley LW and Rodriguez M Systematic error in the measurement of very high solar irradiance Solar Energy Materials and Solar Cells 2003 80 375-381
13 Mouzouris M and Brooks MJ Nonimaging solar thermal collector for high temperature terrestrial and space applications Proceedings of SPIE Optics and Photonics San Diego CA 2009
14 Mouzouris M and Brooks MJ Construction of a composite material solar concentrator for high heat flux applications Proceedings of 8th Annual International Energy Conversion Engineering Conference Nashville TN 2010
15 Stine WB and Harrigan RW Solar energy
fundamentals and design with computer applications Wiley Alternate Energy 1985 185-188
16 Kumler JJ and Caldwell JB Measuring surface slope error on precision aspheres Proceedings of SPIE Optics and Photonics 2007
17 Menq C and Chen FL Curve and surface approximation from CMM measurement data Computers ind Engng 1996 30 211-225
18 Arasu VA and Sornakumar T Design manufacture and testing of fiberglass reinforced parabola trough for parabolic trough solar collector Solar Energy 2007 81 1273-1279
19 Johnston G Focal region measurements of the 20 m2 tilted dish at the Australian National University Solar Energy 1998 63 117-124
20 Mouzouris M Roberts LW and Brooks MJ Heat transfer analysis for high-flux solar measurements using a flat plate calorimeter Proceedings of First Postgraduate Renewable Energy Symposium CRSES Stellenbosch RSA 2010
21 Kunene KR Brooks MJ Roberts LW and Zawilska E Introducing GRADRAD The greater Durban radiometric network Proceedings of World Renewable Energy Congress XI Abu Dhabi UAE 2010
22 Nakamura T and Smith BK Solar thermal system for lunar ISRU applications Development and field operation at Mauna Kea HI Proceedings of 48th AIAA Aerospace Sciences Meeting Including the New Horizons Forum and Aerospace Exposition Orlando FL 2011
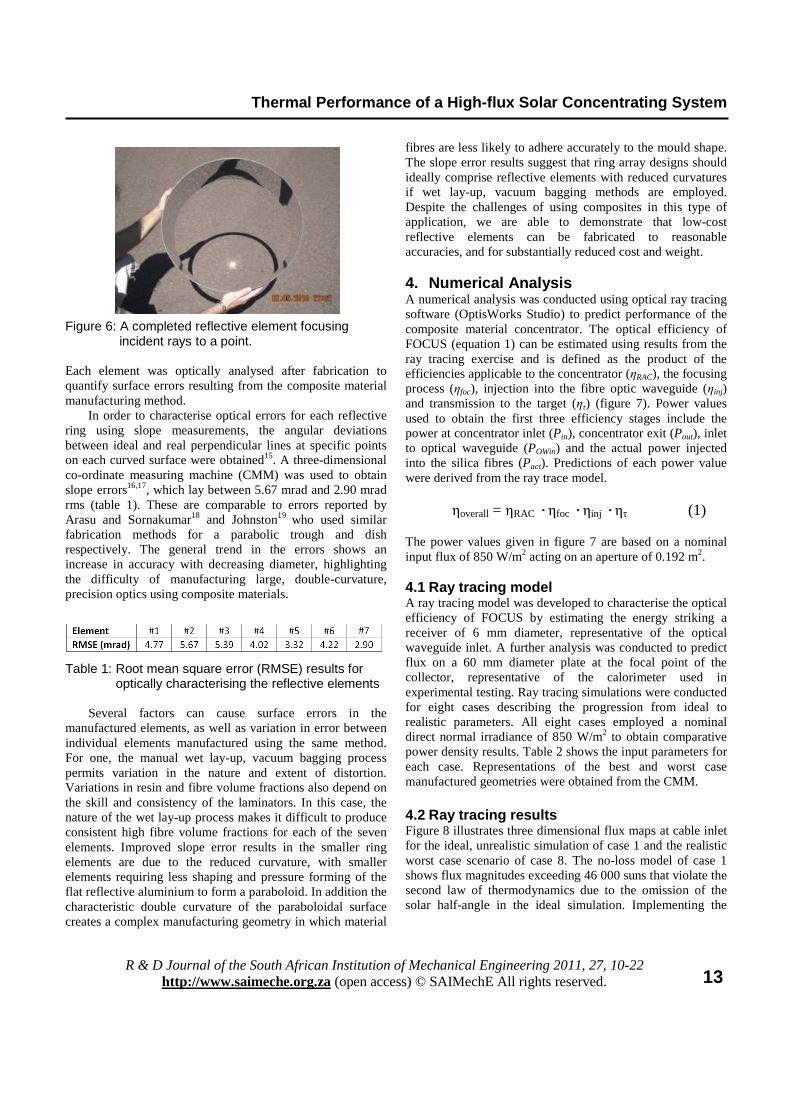
Thermal Performance of a High-flux Solar Concentrating System
R amp D Journal of the South African Institution of Mechanical Engineering 2011 27 10-22
httpwwwsaimecheorgza (open access) copy SAIMechE All rights reserved
13
Figure 6 A completed reflective element focusing incident rays to a point Each element was optically analysed after fabrication to quantify surface errors resulting from the composite material manufacturing method In order to characterise optical errors for each reflective ring using slope measurements the angular deviations between ideal and real perpendicular lines at specific points on each curved surface were obtained15 A three-dimensional co-ordinate measuring machine (CMM) was used to obtain slope errors1617 which lay between 567 mrad and 290 mrad rms (table 1) These are comparable to errors reported by Arasu and Sornakumar18 and Johnston19 who used similar fabrication methods for a parabolic trough and dish respectively The general trend in the errors shows an increase in accuracy with decreasing diameter highlighting the difficulty of manufacturing large double-curvature precision optics using composite materials Table 1 Root mean square error (RMSE) results for optically characterising the reflective elements
Several factors can cause surface errors in the manufactured elements as well as variation in error between individual elements manufactured using the same method For one the manual wet lay-up vacuum bagging process permits variation in the nature and extent of distortion Variations in resin and fibre volume fractions also depend on the skill and consistency of the laminators In this case the nature of the wet lay-up process makes it difficult to produce consistent high fibre volume fractions for each of the seven elements Improved slope error results in the smaller ring elements are due to the reduced curvature with smaller elements requiring less shaping and pressure forming of the flat reflective aluminium to form a paraboloid In addition the characteristic double curvature of the paraboloidal surface creates a complex manufacturing geometry in which material
fibres are less likely to adhere accurately to the mould shape The slope error results suggest that ring array designs should ideally comprise reflective elements with reduced curvatures if wet lay-up vacuum bagging methods are employed Despite the challenges of using composites in this type of application we are able to demonstrate that low-cost reflective elements can be fabricated to reasonable accuracies and for substantially reduced cost and weight 4 Numerical Analysis A numerical analysis was conducted using optical ray tracing software (OptisWorks Studio) to predict performance of the composite material concentrator The optical efficiency of FOCUS (equation 1) can be estimated using results from the ray tracing exercise and is defined as the product of the efficiencies applicable to the concentrator (ηRAC) the focusing process (ηfoc) injection into the fibre optic waveguide (ηinj) and transmission to the target (ητ) (figure 7) Power values used to obtain the first three efficiency stages include the power at concentrator inlet (Pin) concentrator exit (Pout) inlet to optical waveguide (POWin) and the actual power injected into the silica fibres (Pact) Predictions of each power value were derived from the ray trace model
ηoverall = ηRAC ηfoc ηinj ητ (1) The power values given in figure 7 are based on a nominal input flux of 850 Wm2 acting on an aperture of 0192 m2 41 Ray tracing model A ray tracing model was developed to characterise the optical efficiency of FOCUS by estimating the energy striking a receiver of 6 mm diameter representative of the optical waveguide inlet A further analysis was conducted to predict flux on a 60 mm diameter plate at the focal point of the collector representative of the calorimeter used in experimental testing Ray tracing simulations were conducted for eight cases describing the progression from ideal to realistic parameters All eight cases employed a nominal direct normal irradiance of 850 Wm2 to obtain comparative power density results Table 2 shows the input parameters for each case Representations of the best and worst case manufactured geometries were obtained from the CMM
42 Ray tracing results Figure 8 illustrates three dimensional flux maps at cable inlet for the ideal unrealistic simulation of case 1 and the realistic worst case scenario of case 8 The no-loss model of case 1 shows flux magnitudes exceeding 46 000 suns that violate the second law of thermodynamics due to the omission of the solar half-angle in the ideal simulation Implementing the
Thermal Performance of a High-flux Solar Concentrating System
R amp D Journal of the South African Institution of Mechanical Engineering 2011 27 10-22
httpwwwsaimecheorgza (open access) copy SAIMechE All rights reserved
14
Ideal Real
Input parameters Case 1 Case 2 Case 3 Case 4 Case 5 Case 6 Case 7 Case 8
Ideal parallel rays (000deg) 1 0 0 0 0 0 0 0
Ideal specular reflection (100) 1 1 0 0 0 0 0 0
Ideal RAC geometry 1 1 1 1 0 0 0 0
Ideal tracking error (000deg) 1 1 1 0 1 0 1 0
Solar half-angle (0265deg) 0 1 1 1 1 1 1 1
Realistic specular reflection of mirror (95) 0 0 1 1 1 1 1 1
Average tracking error (005deg) 0 0 0 1 0 1 0 1
Manufactured geometry (Best case) 0 0 0 0 1 1 0 0
Manufactured geometry (Worst case) 0 0 0 0 0 0 1 1
Table 2 Ray tracing input parameters for 8 sets of numerical simulations conducted incorporating ideal and realistic parameters for comparison
1
2
3
4
5
1632 W
1501 W
450 W
383 W
363 W
Loss = 131 W due to solar half-angle and imperfect reflection
Loss = 1051 W due to focusing errors including solar half-angle slope errors and tracking misalignment
Loss = 67 W due to imperfect cable injection
Loss = 2 W due to imperfect cable transmission
in
outRAC21 P
P==minus ηη
τηη =minus54
OWin
actinj43 P
P==minus ηη
out
OWinfoc32 P
P==minus ηη
Figure 7 Predicted optical efficiency stages for FOCUS The four efficiency stages include the concentrator focusing process injection into the optical waveguide and the transmission of the concentrated sunlight to the target
Figure 8 Three-dimensional flux maps representing flux levels at waveguide inlet for simulation cases 1 and 8
case 1 case 8
Thermal Performance of a High-flux Solar Concentrating System
R amp D Journal of the South African Institution of Mechanical Engineering 2011 27 10-22
httpwwwsaimecheorgza (open access) copy SAIMechE All rights reserved
15
solar half-angle and other realistic parameters results in more uniform flux distribution within the 6 mm diameter area as shown in the case 8 simulation Figure 9 shows the cross-sectional flux profiles striking the 6 mm diameter inlet to the optical waveguide FOWin Cases 2 ndash 8 describe in a progressive manner the expected losses at the fibre optic cable as successive error parameters are included Optical waveguide inlet power decreases by 6 between cases 2 and 4 suggesting that tracking error and imperfect specular reflectance are relatively benign effects A comparison between cases 4 and 6 and cases 4 and 8 illustrates slope error effects on the manufactured RAC
For the manufactured best and worst case scenarios of the slope errors a decrease in power of 45 and 48 is observed respectively The primary aim of the numerical analysis is to predict flux profiles striking the 6 mm diameter fibre optic cable inlet using a worst case scenario In addition a 60 mm diameter receiver was modelled to represent the flux profile striking the copper plate of the calorimeter which is used in the experimental test procedure Figure 10 illustrates the worst case flux profiles of case 8 for the 60 mm diameter and 6 mm diameter receivers These are used to validate the experimental results against the numerical model
The power values in figure 9 do not account for integration of the RAC with the fibre optic cable therefore further processing of the ray trace results is needed to estimate the energy injected into and transmitted through the cable Using case 8 as an example the inlet power of 448 W to the cable is scaled down by factoring the collective
area of the fibres and the expected transmission efficiency of the cable as described in the design methodology13 Table 3 summarises the expected power P flux F and flux concentration Cflux entering (OWin) and exiting (OWout) the cable and overall optical efficiency results of FOCUS
Figure 9 Two-dimensional flux maps showing modelled cross-sectional flux profiles at the 6 mm diameter optical waveguide inlet for Cases 2 - 8 Average power results striking the cable are given
919 W 868 W 862 W 480 W 475 W 465 W 448 W
Figure 10 Representative cross-sectional flux maps showing the worst case ray trace scenario of case 8 for a 60 mm diameter copper receiver (left) and the fibre optic cable inlet (right)
Thermal Performance of a High-flux Solar Concentrating System
R amp D Journal of the South African Institution of Mechanical Engineering 2011 27 10-22
httpwwwsaimecheorgza (open access) copy SAIMechE All rights reserved
16
5 Experimental Results The experimental testing programme aimed to characterise performance of FOCUS using energy balance methods in conjunction with a flat plate calorimeter Testing was conducted in three phases to determine firstly the power entering and secondly exiting the fibre optic cable and thirdly the melting capabilities of a lunar regolith stimulant using FOCUS 51 Energy balance methodology The flat plate calorimeter consists of a stainless steel outer casing a nylon insulator and a copper receiving plate (figure 11) An energy balance was carried out on the calorimeter to determine the concentrated flux arriving at the plate surface A detailed heat transfer analysis using the flat plate calorimeter is described by Mouzouris et al20 During operation concentrated rays strike the copper disc while cold water flows through the device to absorb energy The energy balance is invoked to estimate the solar power incident on the plate by summing the energy absorbed by the water flow and the external heat
losses due to radiation and convection (equation 2) External heat losses are estimated using temperature measurements midway in the copper plate The absorptivity of the plate surface estimates the fraction of incident irradiation absorbed Internal losses are neglected due to the low thermal conductivity of the nylon insulation within the calorimeter body
αsqin = qabs + qlout (2)
52 Experimental setup Key components of the experiment include FOCUS the calorimeter water circulation system and instrumentation (figure 12) To determine the high-flux solar measurements of FOCUS the calorimeter is positioned first at the focal point of the concentrator and secondly at fibre optic cable exit Positioning the calorimeter at concentrator focus allows the parameter at optical waveguide inlet to be determined such as power (POWin) flux (FOWin) and flux concentration ratio (CfluxOWin) When the calorimeter is placed at fibre optic outlet POWout FOWout and CfluxOWout are characterised 53 Experimental procedure Experimental testing was conducted at the University of KwaZulu-Natal under clear sky conditions The test area is sheltered from wind while allowing clear vertical views for sun-concentrator orientation Direct normal irradiance (DNI) was measured with an Eppley Normal Incidence Pyrheliometer at the nearby Howard College radiometric ground station (299degS 3098degE at 1511 m elevation21) A typical experiment includes cleaning the seven reflective elements and positioning them such that the focal spot approximates concentric alignment onto the receiver being either the copper plate or the fibre optic cable inlet The receiver is firstly positioned using the calculated focal point and then fine-tuned to minimise the focal spot diameter Positioning the ring elements and receiver was performed with the dual-axis solar tracker in operation Running time per experiment was three minutes The fluid circulation system consists of a pump fitted with a throttle valve to achieve the desired mass flow rate Mass flow
Case 1 Case 2 Case 3 Case 4 Case 5 Case 6 Case 7 Case 8
ηRAC 100 098 093 093 093 093 092 092
ηfoc 100 058 058 057 032 031 031 030
ηinj 085 085 085 085 085 085 085 085 Stages
ητ 095 095 095 095 095 095 095 095
Total ηoverall 081 046 044 043 024 023 023 022
Power at cable inlet POWin (W) 1632 919 868 862 480 475 465 448
Fibre optic inlet flux FOWin (Wcm2) 5772 3250 3070 3049 1698 1680 1645 1584
Flux concentration cable inlet Cflux OWin (suns) 67906 38239 36117 35867 19972 19764 19348 18641
Power at cable outlet POWout (W) 1324 745 704 699 389 385 377 363
Fibre optic outlet flux FOWout (Wcm2) 5483 3088 2916 2896 1613 1596 1562 1505
Flux concentration cable outlet Cflux OWout (suns) 64511 36327 34311 34074 18974 18776 18381 17709
Table 3 Predicted component efficiencies and average performance results for FOCUS using ray tracing methods at a typical irradiance of 850 Wm2
Thermal Performance of a High-flux Solar Concentrating System
R amp D Journal of the South African Institution of Mechanical Engineering 2011 27 10-22
httpwwwsaimecheorgza (open access) copy SAIMechE All rights reserved
17
rate is measured by conducting a timed volume collection and is set to keep the copper receiving plate at a temperature close to ambient to minimise external heat losses due to convection and radiation Instrumentation includes two type T thermocouples for the inlet Tin and outlet Tout water measurements and six type K thermocouples for the temperature distribution measurements midway in the copper plate The six thermocouples are labelled T0 T5 T10 T15 T20 and T25 and are used to estimate the surface temperature Ts of the copper plate
531 Concentrator focus results Characterising the flux distribution at concentrator focus requires covering the copper plate of the calorimeter with a series of reflective shields to progressively limit exposure of concentrated rays onto the copper receiver Ten stages were chosen for discretising the flux distribution starting with no shield representing full exposure of the copper plate and ending with a reflective shield incorporating a 3 mm diameter opening The 6 mm diameter reflective shield represents the cable inlet (figure 13) A nylon backing is applied to minimise conduction between the shield and copper surface Several experiments were
Water inlet
Water outlet
Thermocouples
Figure 11a Exploded view of the flat plate calorimeter Figure 11b Calorimeter side view constructed for performance measurements showing water inlet and of FOCUS and outlet passages
Copper disc
Radial flow distributer
Insulation Flow outlet
Stainless steel body
Flow inlet
Water passage
Data acquisition system Water circulation system
Ring array concentrator Optical waveguide inlet Calorimeter Optical waveguide
Instrumentation
OW exit
Water out Water in
Figure 12 Experimental layout to characterise the energy flux at the optical waveguide exit including key components FOCUS the flat plate calorimeter water circulation system and thermocouples
Water inlet
Water outlet
Thermocouples
Thermal Performance of a High-flux Solar Concentrating System
R amp D Journal of the South African Institution of Mechanical Engineering 2011 27 10-22
httpwwwsaimecheorgza (open access) copy SAIMechE All rights reserved
18
conducted for each shield to obtain the average power incident on the exposed copper surface Subtracting successive exposed power values yielded a discretised flux distribution pattern for the 60 mm diameter receiver Data from a typical experiment using the 6 mm diameter reflective shield are shown in table 4 The calorimeter inlet and outlet water temperatures and temperature distributions midway in the copper plate are shown in figure 14 Of importance is the stabilisation of temperature measurements which allows for the assumption of steady state conditions A temperature difference between water inlet and outlet of 64 degC is observed after three minutes allowed for stabilisation using a mass flow rate of 000154 kgsec resulting in 41 W of power absorbed by the water To obtain an estimate power striking the copper plate surface heat losses were calculated using the temperature distribution midway in the copper plate and added to the power absorbed by the water The temperature measurements of T10 T15 and T20 show unexpected similar readings with possible reasons due to thermocouple inaccuracies or imprecise machining of the copper plate Heat losses due to convection and radiation amounted to 02 of the power absorbed resulting in an estimate power striking the copper plate surface of 432 W at an irradiance of 9380 Wm2 This corresponds to an efficiency of 24 which is in good agreement with the case 8 numerical efficiency result at optical waveguide inlet of 27
Figure 13 The 6 mm diameter reflective shield positioned at concentrator focus A comparison between experimental and modelled flux for the parameter set of Case 8 is shown in Figure 15 Experimental results show a peak flux level of 1528 kWm2 at an input irradiance of 850 Wm2 corresponding to a concentration of 1798 suns Measured maximum temperature values at concentrator focus approached 1500degC at irradiance levels in the region of 1000 Wm2 Measured flux obtained from the application of successive
discretised filters closely follows predicted flux from the ray tracing exercise Experiments conducted using smaller reflective shields allowing a 2 mm and 1 mm diameter exposure of the copper surface produced inconsistent results possibly due to measurement uncertainties at very low heat transfer rates
Table 4 Experimental measurements and results for a typical experiment using a reflective shield with 6 mm aperture
Difficulties in stabilising the system for very small diameter filter plates (lt 3 mm) resulted in poor resolution near the peaks of both curves in figure 15 This is a shortcoming in the calorimetric method of measuring flux To measure peak flux levels further performance testing using a radiometric device such as a Gardon flux sensor is indicated
Experiment Average irradiance level (Wm2) 9380 Ray trace qin (W) 488 Experimental qin (W) 432 qabs (W) 410 qlout (W) 009
(kgs) 000154 ∆T ( Tout - Tin) (degC) 64 Ts (degC) 692 T in (degC) 270 Tout (degC) 334 Experimental qin normalised to 850 Wm2 (W)
392
Figure 14a Results from a typical experiment showing a water temperature difference of 64 degC
Tin Tout
∆T = 64 degC
Exposed copper surface of 6 mm diameter
T0
T5
T10
T15
T20
T25
Thermal Performance of a High-flux Solar Concentrating System
R amp D Journal of the South African Institution of Mechanical Engineering 2011 27 10-22
httpwwwsaimecheorgza (open access) copy SAIMechE All rights reserved
19
Key results from the first phase experiments include performance at optical waveguide inlet Representative average power and flux levels incident on the cable of 394 W and 1393 Wcm2 respectively were observed over five experiments An injected power into the 900 silica fibres of 335 W is estimated and is used in calculating the transmission efficiency of the cable 532 Optical waveguide exit results Waveguide exit performance results are obtained by directing the cable outlet at the calorimeter as shown in figure 16a Tests were conducted using the same methodology as at concentrator focus but without the reflective shields A shield was positioned at optical waveguide inlet to protect the metal ferrule from stray radiation that may cause damage (figure 16b) The shield restricts energy to the 6 mm diameter quartz glass inlet of the cable At cable outlet a preventative measure of offsetting the cable 5 mm away from the calorimeter centre was taken to avoid reflection of sunlight back on to the fibre bundle
Experimental Theoretical
Figure 15b A magnified view of the 6 mm diameter inlet to the optical waveguide (at 850 Wm2)
Figure 16b Reflective shield at fibre optic cable inlet allowing concentrated solar energy into the 6 mm diameter quartz glass inlet
T5
T0
T25
T10 T15 T20
Figure 14b Results from a typical experiment showing temperature measurements midway in the copper plate
Figure 15a Performance results at concentrator focus showing flux levels striking the 60 mm diameter copper plate (at 850 Wm2)
Vertical displacement
Figure 16a Vertical displacement of the cable outlet prevents damaging back reflection on to the 900 fibres of the cable
Thermal Performance of a High-flux Solar Concentrating System
R amp D Journal of the South African Institution of Mechanical Engineering 2011 27 10-22
httpwwwsaimecheorgza (open access) copy SAIMechE All rights reserved
20
Test results showed an average power of 205 W exiting the cable and striking the copper plate at a vertical displacement of 5 mm corresponding to a flux of 849 Wcm2 in the exit plane of the fibres The results represent normalised values at a direct normal irradiance of 850 Wm2 Transmission efficiency of the fibre optic cable is estimated at 61 using the average power results from the 6 mm diameter reflective shield conducted at concentrator focus A predicted efficiency of 95 was used for the theoretical calculations stipulated by the supplier of the cable A possible reason for the 34 decrease in efficiency is greater losses due to reflection at inlet to the cable The reflective losses at cable inlet result from the sudden change of refractive index from air (n = 10) to fused quartz glass (n = 15) This was not modelled in the ray tracing simulation A possible solution to minimise inlet reflective losses is the design and implementation of a secondary concentrator at cable inlet to boost energy injection into the silica fibres 533 Optical efficiency Final performance results from the first two experimental phases are given in table 5 A predicted efficiency of 22 was obtained using ray tracing methods and a worst case error set Experimental results show an efficiency of 13 with the difference attributed mainly to high reflective losses at inlet to the optical fibres
Table 5 FOCUS experimental performance (data normalised to a direct normal irradiance of 850 Wm2 - average of five tests) 534 Regolith melting capabilities In the final test procedure several melting experiments were performed in which concentrated sunlight was directed at a sample of the lunar regolith simulant JSC-1 This was intended to demonstrate the high surface temperatures and flux levels required to melt lunar regolith for ISRU-related applications such as those reported by Nakamura and Senior7 The experimental procedure includes positioning the optical waveguide onto the JSC-1 surface and measuring the the temperature of the melt zone
formed after a period of six minutes (figure 17a) A downward facing reflective shield was positioned beneath the cable to prevent reflected solar rays from the regolith surface striking the cable The temperature of the regolith simulant was measured using a thermocouple positioned at the centre of the melt zone Figure 17b shows a post-experimental sample of the melted regolith from a typical experiment The vitrified circular melt zone formed after six minutes is 6 mm in diameter with a depth of 25 mm Table 6 summarises the peak melt temperature readings obtained for five separate experiments The stabilisation of temperature within the melt zone is illustrated in figure 18 showing peak values graphed against estimated flux levels Flux levels exiting the cable were estimated using average irradiance levels over the test period and the optical efficiency value of 13 Results show a peak temperature exceeding 1200 K at cable exit flux levels of 104 Wcm2 which exceeds the minimum flux criterion for successful regolith melting by 22 Temperature results achieved can be applied to several high temperature lunar ISRU processes including oxygen production and surface stabilisation Creating larger sintered surfaces for practical human use on the lunar surface is possible by implementing autonomous mechanisms to drive multiple fibre optic cables in a coordinated manner22
Theoretical Experimental
POWin (W) 448 394
FOWin (Wcm2) 1584 1393
Cflux OWin (suns) 18641 16388
POWout (W) 363 205
FOWout (Wcm2) 1505 849
Cflux OWout (suns) 17709 9988
ηoverall 022 013
Ceramic dish containing JSC-1
Downward facing reflective shield
6 mm
Figure 17a Regolith melting experiment with the protective shield (reflector) to prevent cable damage and a thermocouple
Figure 17b Magnified view of the vitrified melt with diameter of 6 mm and depth 25 mm
Thermal Performance of a High-flux Solar Concentrating System
R amp D Journal of the South African Institution of Mechanical Engineering 2011 27 10-22
httpwwwsaimecheorgza (open access) copy SAIMechE All rights reserved
21
6 Conclusion The design fabrication and testing of a composite material ring array concentrator is described for the collection of solar energy and its transmission through a fibre optic bundle The FOCUS system has application in high-temperature research such as material sintering and lunar in-situ resource utilisation The overall transmission efficiency from aperture to bundle outlet was measured at 13 using a flat plate calorimeter Temperatures
exceeding 1450 degC and 900 degC were measured at the concentrator focal point and the outlet of the fibres respectively yielding flux levels of 104 Wcm2 An optical error analysis of the seven reflective elements is described In addition to performance validation this work also provides an alternate approach to conventional methods of collector construction Rather than machining metal profiles for the reflective surface extensive use was made of composite materials resulting in a low-cost light weight point focus concentrator that is 38 lighter than an aluminium equivalent and considerably less expensive Results suggest that further reduction in optical error is possible by limiting reflector curvature in the design stage and adapting the optics to accommodate for structural distortion during curing Acknowledgements The authors appreciate the assistance and support of Professor J Bindon Professor WH Moolman Clinton Bemont Khulisile Kunene Michael Constantino OPTIS Durban University of Technology and the University of Stellenboschrsquos Centre for Renewable and Sustainable Energy Studies (CRSES) This work is supported by the National Research Foundation of South Africa and the Eskom TESP program References 1 Pregger T Graf D Krewitt W Sattler C Roeb M and
Moller S Prospects of solar thermal hydrogen production processes International Journal of Hydrogen Energy 2009 34 4256-4267
2 Kalogirou SA Solar thermal collectors and applications Progress in Energy and Combustion Science 2004 30 231-295
3 Sen Z Solar energy in progress and future research trends Progress in Energy and Combustion Science 2004 30 367-416
4 Vasylyev S and Vasylyev V Nonimaging reflective lenses A new type of high-heat solar collector Proceedings of the Solar World Congress Orlando Florida 2005
Experiment 1 2 3 4 5
Irradiance level (Wm2) 10054 9971 9957 9913 9879 Peak temperature (degC) 9355 9016 8820 8769 8504 Flux level (Wcm2) 1040 1031 1029 1025 1021
Experiment 1
Experiment 2
Experiment 3
Experiment 4
Experiment 5
Figure 18a Time evolution of the melt temperature for five experiments for 6 min showing temperature stabilisation in the melt zone
Table 6 Lunar regolith simulant peak melt temperature and cable exit flux concentration results
Figure 18b Peak melt temperatures versus maximum flux levels exiting the 900 silica fibres
Thermal Performance of a High-flux Solar Concentrating System
R amp D Journal of the South African Institution of Mechanical Engineering 2011 27 10-22
httpwwwsaimecheorgza (open access) copy SAIMechE All rights reserved
22
5 Vasylyev V and Vasylyev S Expected optical
performances of novel type multi-element high-heat solar concentrators Proceedings of the American Solar Energy Society Reno NV 2002
6 Feuermann D Gordon JM and Huleihil M Solar fiber-optic mini-dish concentrators First experimental results and field experience Solar Energy 2002 71 459-472
7 Nakamura T and Senior CL Solar thermal power for lunar materials processing Journal of Aerospace Engineering 2008 21 91-101
8 Ballestriacuten J Estrada CA Rodriacuteguez-Alonso M Peacuterez-Raacutebago C Langley LW and Barnes A Heat flux sensors Calorimeters or radiometers Solar Energy 2006 80 1314-1320
9 Ballestriacuten J A non-water-cooled heat flux measurement system under concentrated solar radiation conditions Solar Energy 2002 73 159-168
10 Estrada CA Jaramillo OA Acosta R and Arancibia-Bulnes CA Heat transfer analysis in a calorimeter for concentrated solar radiation measurements Solar Energy 2007 81 1306-1313
11 Fernandez-Reche J Sanchez M Alonso M Canadas I Chenlo F Rodriguez J and Ballestrin J Concentrating PV An alternative to calorimeters for measuring high solar flux densities Journal of Solar Energy Engineering 2008 130 0445021-0445023
12 Ballestriacuten J Ulmer S Morales A Barnes A Langley LW and Rodriguez M Systematic error in the measurement of very high solar irradiance Solar Energy Materials and Solar Cells 2003 80 375-381
13 Mouzouris M and Brooks MJ Nonimaging solar thermal collector for high temperature terrestrial and space applications Proceedings of SPIE Optics and Photonics San Diego CA 2009
14 Mouzouris M and Brooks MJ Construction of a composite material solar concentrator for high heat flux applications Proceedings of 8th Annual International Energy Conversion Engineering Conference Nashville TN 2010
15 Stine WB and Harrigan RW Solar energy
fundamentals and design with computer applications Wiley Alternate Energy 1985 185-188
16 Kumler JJ and Caldwell JB Measuring surface slope error on precision aspheres Proceedings of SPIE Optics and Photonics 2007
17 Menq C and Chen FL Curve and surface approximation from CMM measurement data Computers ind Engng 1996 30 211-225
18 Arasu VA and Sornakumar T Design manufacture and testing of fiberglass reinforced parabola trough for parabolic trough solar collector Solar Energy 2007 81 1273-1279
19 Johnston G Focal region measurements of the 20 m2 tilted dish at the Australian National University Solar Energy 1998 63 117-124
20 Mouzouris M Roberts LW and Brooks MJ Heat transfer analysis for high-flux solar measurements using a flat plate calorimeter Proceedings of First Postgraduate Renewable Energy Symposium CRSES Stellenbosch RSA 2010
21 Kunene KR Brooks MJ Roberts LW and Zawilska E Introducing GRADRAD The greater Durban radiometric network Proceedings of World Renewable Energy Congress XI Abu Dhabi UAE 2010
22 Nakamura T and Smith BK Solar thermal system for lunar ISRU applications Development and field operation at Mauna Kea HI Proceedings of 48th AIAA Aerospace Sciences Meeting Including the New Horizons Forum and Aerospace Exposition Orlando FL 2011
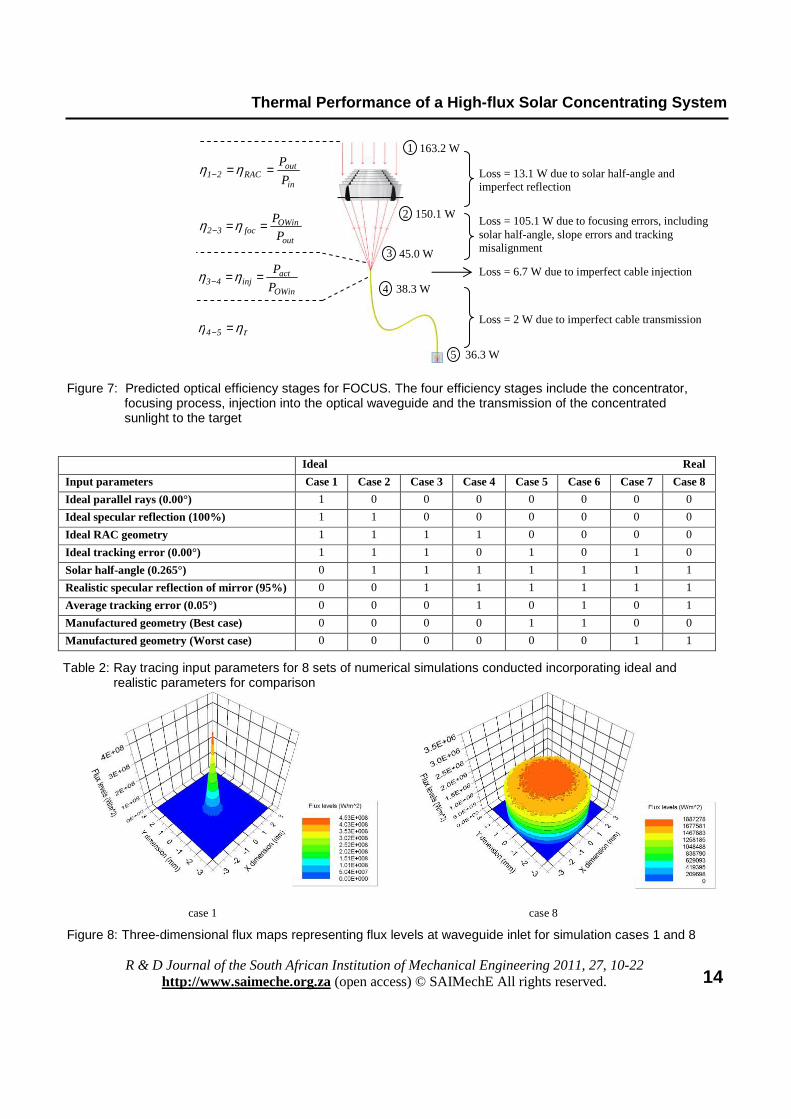
Thermal Performance of a High-flux Solar Concentrating System
R amp D Journal of the South African Institution of Mechanical Engineering 2011 27 10-22
httpwwwsaimecheorgza (open access) copy SAIMechE All rights reserved
14
Ideal Real
Input parameters Case 1 Case 2 Case 3 Case 4 Case 5 Case 6 Case 7 Case 8
Ideal parallel rays (000deg) 1 0 0 0 0 0 0 0
Ideal specular reflection (100) 1 1 0 0 0 0 0 0
Ideal RAC geometry 1 1 1 1 0 0 0 0
Ideal tracking error (000deg) 1 1 1 0 1 0 1 0
Solar half-angle (0265deg) 0 1 1 1 1 1 1 1
Realistic specular reflection of mirror (95) 0 0 1 1 1 1 1 1
Average tracking error (005deg) 0 0 0 1 0 1 0 1
Manufactured geometry (Best case) 0 0 0 0 1 1 0 0
Manufactured geometry (Worst case) 0 0 0 0 0 0 1 1
Table 2 Ray tracing input parameters for 8 sets of numerical simulations conducted incorporating ideal and realistic parameters for comparison
1
2
3
4
5
1632 W
1501 W
450 W
383 W
363 W
Loss = 131 W due to solar half-angle and imperfect reflection
Loss = 1051 W due to focusing errors including solar half-angle slope errors and tracking misalignment
Loss = 67 W due to imperfect cable injection
Loss = 2 W due to imperfect cable transmission
in
outRAC21 P
P==minus ηη
τηη =minus54
OWin
actinj43 P
P==minus ηη
out
OWinfoc32 P
P==minus ηη
Figure 7 Predicted optical efficiency stages for FOCUS The four efficiency stages include the concentrator focusing process injection into the optical waveguide and the transmission of the concentrated sunlight to the target
Figure 8 Three-dimensional flux maps representing flux levels at waveguide inlet for simulation cases 1 and 8
case 1 case 8
Thermal Performance of a High-flux Solar Concentrating System
R amp D Journal of the South African Institution of Mechanical Engineering 2011 27 10-22
httpwwwsaimecheorgza (open access) copy SAIMechE All rights reserved
15
solar half-angle and other realistic parameters results in more uniform flux distribution within the 6 mm diameter area as shown in the case 8 simulation Figure 9 shows the cross-sectional flux profiles striking the 6 mm diameter inlet to the optical waveguide FOWin Cases 2 ndash 8 describe in a progressive manner the expected losses at the fibre optic cable as successive error parameters are included Optical waveguide inlet power decreases by 6 between cases 2 and 4 suggesting that tracking error and imperfect specular reflectance are relatively benign effects A comparison between cases 4 and 6 and cases 4 and 8 illustrates slope error effects on the manufactured RAC
For the manufactured best and worst case scenarios of the slope errors a decrease in power of 45 and 48 is observed respectively The primary aim of the numerical analysis is to predict flux profiles striking the 6 mm diameter fibre optic cable inlet using a worst case scenario In addition a 60 mm diameter receiver was modelled to represent the flux profile striking the copper plate of the calorimeter which is used in the experimental test procedure Figure 10 illustrates the worst case flux profiles of case 8 for the 60 mm diameter and 6 mm diameter receivers These are used to validate the experimental results against the numerical model
The power values in figure 9 do not account for integration of the RAC with the fibre optic cable therefore further processing of the ray trace results is needed to estimate the energy injected into and transmitted through the cable Using case 8 as an example the inlet power of 448 W to the cable is scaled down by factoring the collective
area of the fibres and the expected transmission efficiency of the cable as described in the design methodology13 Table 3 summarises the expected power P flux F and flux concentration Cflux entering (OWin) and exiting (OWout) the cable and overall optical efficiency results of FOCUS
Figure 9 Two-dimensional flux maps showing modelled cross-sectional flux profiles at the 6 mm diameter optical waveguide inlet for Cases 2 - 8 Average power results striking the cable are given
919 W 868 W 862 W 480 W 475 W 465 W 448 W
Figure 10 Representative cross-sectional flux maps showing the worst case ray trace scenario of case 8 for a 60 mm diameter copper receiver (left) and the fibre optic cable inlet (right)
Thermal Performance of a High-flux Solar Concentrating System
R amp D Journal of the South African Institution of Mechanical Engineering 2011 27 10-22
httpwwwsaimecheorgza (open access) copy SAIMechE All rights reserved
16
5 Experimental Results The experimental testing programme aimed to characterise performance of FOCUS using energy balance methods in conjunction with a flat plate calorimeter Testing was conducted in three phases to determine firstly the power entering and secondly exiting the fibre optic cable and thirdly the melting capabilities of a lunar regolith stimulant using FOCUS 51 Energy balance methodology The flat plate calorimeter consists of a stainless steel outer casing a nylon insulator and a copper receiving plate (figure 11) An energy balance was carried out on the calorimeter to determine the concentrated flux arriving at the plate surface A detailed heat transfer analysis using the flat plate calorimeter is described by Mouzouris et al20 During operation concentrated rays strike the copper disc while cold water flows through the device to absorb energy The energy balance is invoked to estimate the solar power incident on the plate by summing the energy absorbed by the water flow and the external heat
losses due to radiation and convection (equation 2) External heat losses are estimated using temperature measurements midway in the copper plate The absorptivity of the plate surface estimates the fraction of incident irradiation absorbed Internal losses are neglected due to the low thermal conductivity of the nylon insulation within the calorimeter body
αsqin = qabs + qlout (2)
52 Experimental setup Key components of the experiment include FOCUS the calorimeter water circulation system and instrumentation (figure 12) To determine the high-flux solar measurements of FOCUS the calorimeter is positioned first at the focal point of the concentrator and secondly at fibre optic cable exit Positioning the calorimeter at concentrator focus allows the parameter at optical waveguide inlet to be determined such as power (POWin) flux (FOWin) and flux concentration ratio (CfluxOWin) When the calorimeter is placed at fibre optic outlet POWout FOWout and CfluxOWout are characterised 53 Experimental procedure Experimental testing was conducted at the University of KwaZulu-Natal under clear sky conditions The test area is sheltered from wind while allowing clear vertical views for sun-concentrator orientation Direct normal irradiance (DNI) was measured with an Eppley Normal Incidence Pyrheliometer at the nearby Howard College radiometric ground station (299degS 3098degE at 1511 m elevation21) A typical experiment includes cleaning the seven reflective elements and positioning them such that the focal spot approximates concentric alignment onto the receiver being either the copper plate or the fibre optic cable inlet The receiver is firstly positioned using the calculated focal point and then fine-tuned to minimise the focal spot diameter Positioning the ring elements and receiver was performed with the dual-axis solar tracker in operation Running time per experiment was three minutes The fluid circulation system consists of a pump fitted with a throttle valve to achieve the desired mass flow rate Mass flow
Case 1 Case 2 Case 3 Case 4 Case 5 Case 6 Case 7 Case 8
ηRAC 100 098 093 093 093 093 092 092
ηfoc 100 058 058 057 032 031 031 030
ηinj 085 085 085 085 085 085 085 085 Stages
ητ 095 095 095 095 095 095 095 095
Total ηoverall 081 046 044 043 024 023 023 022
Power at cable inlet POWin (W) 1632 919 868 862 480 475 465 448
Fibre optic inlet flux FOWin (Wcm2) 5772 3250 3070 3049 1698 1680 1645 1584
Flux concentration cable inlet Cflux OWin (suns) 67906 38239 36117 35867 19972 19764 19348 18641
Power at cable outlet POWout (W) 1324 745 704 699 389 385 377 363
Fibre optic outlet flux FOWout (Wcm2) 5483 3088 2916 2896 1613 1596 1562 1505
Flux concentration cable outlet Cflux OWout (suns) 64511 36327 34311 34074 18974 18776 18381 17709
Table 3 Predicted component efficiencies and average performance results for FOCUS using ray tracing methods at a typical irradiance of 850 Wm2
Thermal Performance of a High-flux Solar Concentrating System
R amp D Journal of the South African Institution of Mechanical Engineering 2011 27 10-22
httpwwwsaimecheorgza (open access) copy SAIMechE All rights reserved
17
rate is measured by conducting a timed volume collection and is set to keep the copper receiving plate at a temperature close to ambient to minimise external heat losses due to convection and radiation Instrumentation includes two type T thermocouples for the inlet Tin and outlet Tout water measurements and six type K thermocouples for the temperature distribution measurements midway in the copper plate The six thermocouples are labelled T0 T5 T10 T15 T20 and T25 and are used to estimate the surface temperature Ts of the copper plate
531 Concentrator focus results Characterising the flux distribution at concentrator focus requires covering the copper plate of the calorimeter with a series of reflective shields to progressively limit exposure of concentrated rays onto the copper receiver Ten stages were chosen for discretising the flux distribution starting with no shield representing full exposure of the copper plate and ending with a reflective shield incorporating a 3 mm diameter opening The 6 mm diameter reflective shield represents the cable inlet (figure 13) A nylon backing is applied to minimise conduction between the shield and copper surface Several experiments were
Water inlet
Water outlet
Thermocouples
Figure 11a Exploded view of the flat plate calorimeter Figure 11b Calorimeter side view constructed for performance measurements showing water inlet and of FOCUS and outlet passages
Copper disc
Radial flow distributer
Insulation Flow outlet
Stainless steel body
Flow inlet
Water passage
Data acquisition system Water circulation system
Ring array concentrator Optical waveguide inlet Calorimeter Optical waveguide
Instrumentation
OW exit
Water out Water in
Figure 12 Experimental layout to characterise the energy flux at the optical waveguide exit including key components FOCUS the flat plate calorimeter water circulation system and thermocouples
Water inlet
Water outlet
Thermocouples
Thermal Performance of a High-flux Solar Concentrating System
R amp D Journal of the South African Institution of Mechanical Engineering 2011 27 10-22
httpwwwsaimecheorgza (open access) copy SAIMechE All rights reserved
18
conducted for each shield to obtain the average power incident on the exposed copper surface Subtracting successive exposed power values yielded a discretised flux distribution pattern for the 60 mm diameter receiver Data from a typical experiment using the 6 mm diameter reflective shield are shown in table 4 The calorimeter inlet and outlet water temperatures and temperature distributions midway in the copper plate are shown in figure 14 Of importance is the stabilisation of temperature measurements which allows for the assumption of steady state conditions A temperature difference between water inlet and outlet of 64 degC is observed after three minutes allowed for stabilisation using a mass flow rate of 000154 kgsec resulting in 41 W of power absorbed by the water To obtain an estimate power striking the copper plate surface heat losses were calculated using the temperature distribution midway in the copper plate and added to the power absorbed by the water The temperature measurements of T10 T15 and T20 show unexpected similar readings with possible reasons due to thermocouple inaccuracies or imprecise machining of the copper plate Heat losses due to convection and radiation amounted to 02 of the power absorbed resulting in an estimate power striking the copper plate surface of 432 W at an irradiance of 9380 Wm2 This corresponds to an efficiency of 24 which is in good agreement with the case 8 numerical efficiency result at optical waveguide inlet of 27
Figure 13 The 6 mm diameter reflective shield positioned at concentrator focus A comparison between experimental and modelled flux for the parameter set of Case 8 is shown in Figure 15 Experimental results show a peak flux level of 1528 kWm2 at an input irradiance of 850 Wm2 corresponding to a concentration of 1798 suns Measured maximum temperature values at concentrator focus approached 1500degC at irradiance levels in the region of 1000 Wm2 Measured flux obtained from the application of successive
discretised filters closely follows predicted flux from the ray tracing exercise Experiments conducted using smaller reflective shields allowing a 2 mm and 1 mm diameter exposure of the copper surface produced inconsistent results possibly due to measurement uncertainties at very low heat transfer rates
Table 4 Experimental measurements and results for a typical experiment using a reflective shield with 6 mm aperture
Difficulties in stabilising the system for very small diameter filter plates (lt 3 mm) resulted in poor resolution near the peaks of both curves in figure 15 This is a shortcoming in the calorimetric method of measuring flux To measure peak flux levels further performance testing using a radiometric device such as a Gardon flux sensor is indicated
Experiment Average irradiance level (Wm2) 9380 Ray trace qin (W) 488 Experimental qin (W) 432 qabs (W) 410 qlout (W) 009
(kgs) 000154 ∆T ( Tout - Tin) (degC) 64 Ts (degC) 692 T in (degC) 270 Tout (degC) 334 Experimental qin normalised to 850 Wm2 (W)
392
Figure 14a Results from a typical experiment showing a water temperature difference of 64 degC
Tin Tout
∆T = 64 degC
Exposed copper surface of 6 mm diameter
T0
T5
T10
T15
T20
T25
Thermal Performance of a High-flux Solar Concentrating System
R amp D Journal of the South African Institution of Mechanical Engineering 2011 27 10-22
httpwwwsaimecheorgza (open access) copy SAIMechE All rights reserved
19
Key results from the first phase experiments include performance at optical waveguide inlet Representative average power and flux levels incident on the cable of 394 W and 1393 Wcm2 respectively were observed over five experiments An injected power into the 900 silica fibres of 335 W is estimated and is used in calculating the transmission efficiency of the cable 532 Optical waveguide exit results Waveguide exit performance results are obtained by directing the cable outlet at the calorimeter as shown in figure 16a Tests were conducted using the same methodology as at concentrator focus but without the reflective shields A shield was positioned at optical waveguide inlet to protect the metal ferrule from stray radiation that may cause damage (figure 16b) The shield restricts energy to the 6 mm diameter quartz glass inlet of the cable At cable outlet a preventative measure of offsetting the cable 5 mm away from the calorimeter centre was taken to avoid reflection of sunlight back on to the fibre bundle
Experimental Theoretical
Figure 15b A magnified view of the 6 mm diameter inlet to the optical waveguide (at 850 Wm2)
Figure 16b Reflective shield at fibre optic cable inlet allowing concentrated solar energy into the 6 mm diameter quartz glass inlet
T5
T0
T25
T10 T15 T20
Figure 14b Results from a typical experiment showing temperature measurements midway in the copper plate
Figure 15a Performance results at concentrator focus showing flux levels striking the 60 mm diameter copper plate (at 850 Wm2)
Vertical displacement
Figure 16a Vertical displacement of the cable outlet prevents damaging back reflection on to the 900 fibres of the cable
Thermal Performance of a High-flux Solar Concentrating System
R amp D Journal of the South African Institution of Mechanical Engineering 2011 27 10-22
httpwwwsaimecheorgza (open access) copy SAIMechE All rights reserved
20
Test results showed an average power of 205 W exiting the cable and striking the copper plate at a vertical displacement of 5 mm corresponding to a flux of 849 Wcm2 in the exit plane of the fibres The results represent normalised values at a direct normal irradiance of 850 Wm2 Transmission efficiency of the fibre optic cable is estimated at 61 using the average power results from the 6 mm diameter reflective shield conducted at concentrator focus A predicted efficiency of 95 was used for the theoretical calculations stipulated by the supplier of the cable A possible reason for the 34 decrease in efficiency is greater losses due to reflection at inlet to the cable The reflective losses at cable inlet result from the sudden change of refractive index from air (n = 10) to fused quartz glass (n = 15) This was not modelled in the ray tracing simulation A possible solution to minimise inlet reflective losses is the design and implementation of a secondary concentrator at cable inlet to boost energy injection into the silica fibres 533 Optical efficiency Final performance results from the first two experimental phases are given in table 5 A predicted efficiency of 22 was obtained using ray tracing methods and a worst case error set Experimental results show an efficiency of 13 with the difference attributed mainly to high reflective losses at inlet to the optical fibres
Table 5 FOCUS experimental performance (data normalised to a direct normal irradiance of 850 Wm2 - average of five tests) 534 Regolith melting capabilities In the final test procedure several melting experiments were performed in which concentrated sunlight was directed at a sample of the lunar regolith simulant JSC-1 This was intended to demonstrate the high surface temperatures and flux levels required to melt lunar regolith for ISRU-related applications such as those reported by Nakamura and Senior7 The experimental procedure includes positioning the optical waveguide onto the JSC-1 surface and measuring the the temperature of the melt zone
formed after a period of six minutes (figure 17a) A downward facing reflective shield was positioned beneath the cable to prevent reflected solar rays from the regolith surface striking the cable The temperature of the regolith simulant was measured using a thermocouple positioned at the centre of the melt zone Figure 17b shows a post-experimental sample of the melted regolith from a typical experiment The vitrified circular melt zone formed after six minutes is 6 mm in diameter with a depth of 25 mm Table 6 summarises the peak melt temperature readings obtained for five separate experiments The stabilisation of temperature within the melt zone is illustrated in figure 18 showing peak values graphed against estimated flux levels Flux levels exiting the cable were estimated using average irradiance levels over the test period and the optical efficiency value of 13 Results show a peak temperature exceeding 1200 K at cable exit flux levels of 104 Wcm2 which exceeds the minimum flux criterion for successful regolith melting by 22 Temperature results achieved can be applied to several high temperature lunar ISRU processes including oxygen production and surface stabilisation Creating larger sintered surfaces for practical human use on the lunar surface is possible by implementing autonomous mechanisms to drive multiple fibre optic cables in a coordinated manner22
Theoretical Experimental
POWin (W) 448 394
FOWin (Wcm2) 1584 1393
Cflux OWin (suns) 18641 16388
POWout (W) 363 205
FOWout (Wcm2) 1505 849
Cflux OWout (suns) 17709 9988
ηoverall 022 013
Ceramic dish containing JSC-1
Downward facing reflective shield
6 mm
Figure 17a Regolith melting experiment with the protective shield (reflector) to prevent cable damage and a thermocouple
Figure 17b Magnified view of the vitrified melt with diameter of 6 mm and depth 25 mm
Thermal Performance of a High-flux Solar Concentrating System
R amp D Journal of the South African Institution of Mechanical Engineering 2011 27 10-22
httpwwwsaimecheorgza (open access) copy SAIMechE All rights reserved
21
6 Conclusion The design fabrication and testing of a composite material ring array concentrator is described for the collection of solar energy and its transmission through a fibre optic bundle The FOCUS system has application in high-temperature research such as material sintering and lunar in-situ resource utilisation The overall transmission efficiency from aperture to bundle outlet was measured at 13 using a flat plate calorimeter Temperatures
exceeding 1450 degC and 900 degC were measured at the concentrator focal point and the outlet of the fibres respectively yielding flux levels of 104 Wcm2 An optical error analysis of the seven reflective elements is described In addition to performance validation this work also provides an alternate approach to conventional methods of collector construction Rather than machining metal profiles for the reflective surface extensive use was made of composite materials resulting in a low-cost light weight point focus concentrator that is 38 lighter than an aluminium equivalent and considerably less expensive Results suggest that further reduction in optical error is possible by limiting reflector curvature in the design stage and adapting the optics to accommodate for structural distortion during curing Acknowledgements The authors appreciate the assistance and support of Professor J Bindon Professor WH Moolman Clinton Bemont Khulisile Kunene Michael Constantino OPTIS Durban University of Technology and the University of Stellenboschrsquos Centre for Renewable and Sustainable Energy Studies (CRSES) This work is supported by the National Research Foundation of South Africa and the Eskom TESP program References 1 Pregger T Graf D Krewitt W Sattler C Roeb M and
Moller S Prospects of solar thermal hydrogen production processes International Journal of Hydrogen Energy 2009 34 4256-4267
2 Kalogirou SA Solar thermal collectors and applications Progress in Energy and Combustion Science 2004 30 231-295
3 Sen Z Solar energy in progress and future research trends Progress in Energy and Combustion Science 2004 30 367-416
4 Vasylyev S and Vasylyev V Nonimaging reflective lenses A new type of high-heat solar collector Proceedings of the Solar World Congress Orlando Florida 2005
Experiment 1 2 3 4 5
Irradiance level (Wm2) 10054 9971 9957 9913 9879 Peak temperature (degC) 9355 9016 8820 8769 8504 Flux level (Wcm2) 1040 1031 1029 1025 1021
Experiment 1
Experiment 2
Experiment 3
Experiment 4
Experiment 5
Figure 18a Time evolution of the melt temperature for five experiments for 6 min showing temperature stabilisation in the melt zone
Table 6 Lunar regolith simulant peak melt temperature and cable exit flux concentration results
Figure 18b Peak melt temperatures versus maximum flux levels exiting the 900 silica fibres
Thermal Performance of a High-flux Solar Concentrating System
R amp D Journal of the South African Institution of Mechanical Engineering 2011 27 10-22
httpwwwsaimecheorgza (open access) copy SAIMechE All rights reserved
22
5 Vasylyev V and Vasylyev S Expected optical
performances of novel type multi-element high-heat solar concentrators Proceedings of the American Solar Energy Society Reno NV 2002
6 Feuermann D Gordon JM and Huleihil M Solar fiber-optic mini-dish concentrators First experimental results and field experience Solar Energy 2002 71 459-472
7 Nakamura T and Senior CL Solar thermal power for lunar materials processing Journal of Aerospace Engineering 2008 21 91-101
8 Ballestriacuten J Estrada CA Rodriacuteguez-Alonso M Peacuterez-Raacutebago C Langley LW and Barnes A Heat flux sensors Calorimeters or radiometers Solar Energy 2006 80 1314-1320
9 Ballestriacuten J A non-water-cooled heat flux measurement system under concentrated solar radiation conditions Solar Energy 2002 73 159-168
10 Estrada CA Jaramillo OA Acosta R and Arancibia-Bulnes CA Heat transfer analysis in a calorimeter for concentrated solar radiation measurements Solar Energy 2007 81 1306-1313
11 Fernandez-Reche J Sanchez M Alonso M Canadas I Chenlo F Rodriguez J and Ballestrin J Concentrating PV An alternative to calorimeters for measuring high solar flux densities Journal of Solar Energy Engineering 2008 130 0445021-0445023
12 Ballestriacuten J Ulmer S Morales A Barnes A Langley LW and Rodriguez M Systematic error in the measurement of very high solar irradiance Solar Energy Materials and Solar Cells 2003 80 375-381
13 Mouzouris M and Brooks MJ Nonimaging solar thermal collector for high temperature terrestrial and space applications Proceedings of SPIE Optics and Photonics San Diego CA 2009
14 Mouzouris M and Brooks MJ Construction of a composite material solar concentrator for high heat flux applications Proceedings of 8th Annual International Energy Conversion Engineering Conference Nashville TN 2010
15 Stine WB and Harrigan RW Solar energy
fundamentals and design with computer applications Wiley Alternate Energy 1985 185-188
16 Kumler JJ and Caldwell JB Measuring surface slope error on precision aspheres Proceedings of SPIE Optics and Photonics 2007
17 Menq C and Chen FL Curve and surface approximation from CMM measurement data Computers ind Engng 1996 30 211-225
18 Arasu VA and Sornakumar T Design manufacture and testing of fiberglass reinforced parabola trough for parabolic trough solar collector Solar Energy 2007 81 1273-1279
19 Johnston G Focal region measurements of the 20 m2 tilted dish at the Australian National University Solar Energy 1998 63 117-124
20 Mouzouris M Roberts LW and Brooks MJ Heat transfer analysis for high-flux solar measurements using a flat plate calorimeter Proceedings of First Postgraduate Renewable Energy Symposium CRSES Stellenbosch RSA 2010
21 Kunene KR Brooks MJ Roberts LW and Zawilska E Introducing GRADRAD The greater Durban radiometric network Proceedings of World Renewable Energy Congress XI Abu Dhabi UAE 2010
22 Nakamura T and Smith BK Solar thermal system for lunar ISRU applications Development and field operation at Mauna Kea HI Proceedings of 48th AIAA Aerospace Sciences Meeting Including the New Horizons Forum and Aerospace Exposition Orlando FL 2011
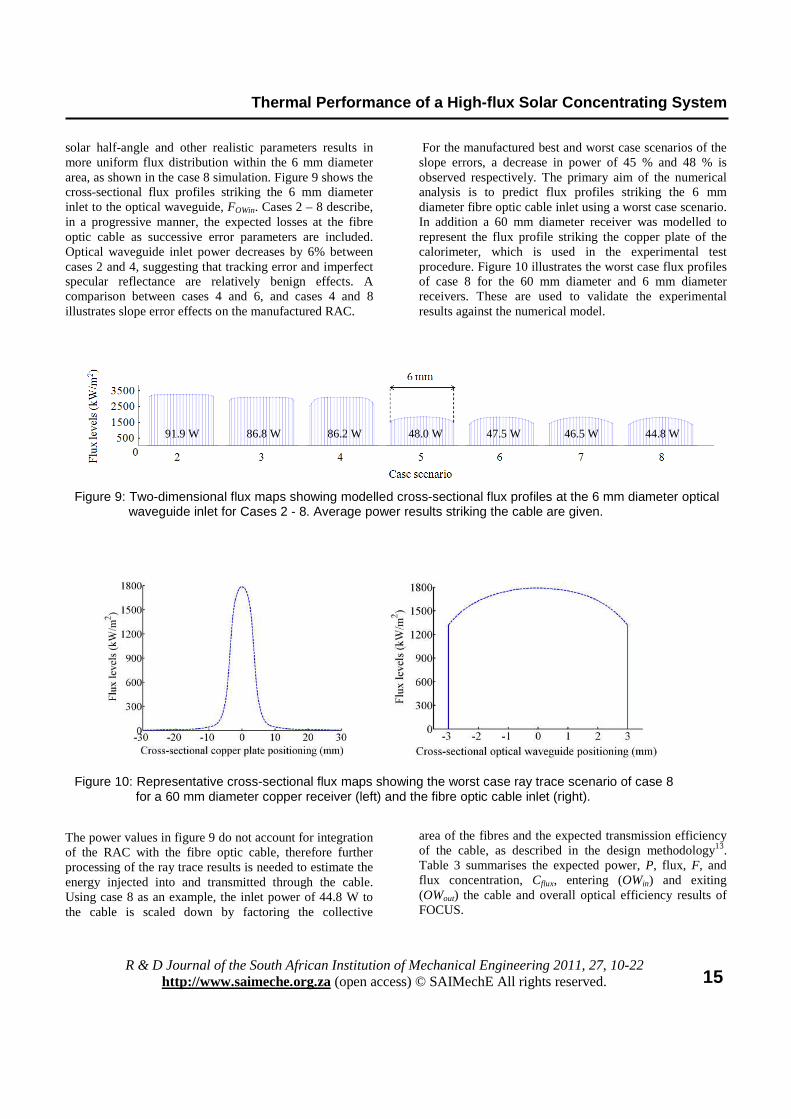
Thermal Performance of a High-flux Solar Concentrating System
R amp D Journal of the South African Institution of Mechanical Engineering 2011 27 10-22
httpwwwsaimecheorgza (open access) copy SAIMechE All rights reserved
15
solar half-angle and other realistic parameters results in more uniform flux distribution within the 6 mm diameter area as shown in the case 8 simulation Figure 9 shows the cross-sectional flux profiles striking the 6 mm diameter inlet to the optical waveguide FOWin Cases 2 ndash 8 describe in a progressive manner the expected losses at the fibre optic cable as successive error parameters are included Optical waveguide inlet power decreases by 6 between cases 2 and 4 suggesting that tracking error and imperfect specular reflectance are relatively benign effects A comparison between cases 4 and 6 and cases 4 and 8 illustrates slope error effects on the manufactured RAC
For the manufactured best and worst case scenarios of the slope errors a decrease in power of 45 and 48 is observed respectively The primary aim of the numerical analysis is to predict flux profiles striking the 6 mm diameter fibre optic cable inlet using a worst case scenario In addition a 60 mm diameter receiver was modelled to represent the flux profile striking the copper plate of the calorimeter which is used in the experimental test procedure Figure 10 illustrates the worst case flux profiles of case 8 for the 60 mm diameter and 6 mm diameter receivers These are used to validate the experimental results against the numerical model
The power values in figure 9 do not account for integration of the RAC with the fibre optic cable therefore further processing of the ray trace results is needed to estimate the energy injected into and transmitted through the cable Using case 8 as an example the inlet power of 448 W to the cable is scaled down by factoring the collective
area of the fibres and the expected transmission efficiency of the cable as described in the design methodology13 Table 3 summarises the expected power P flux F and flux concentration Cflux entering (OWin) and exiting (OWout) the cable and overall optical efficiency results of FOCUS
Figure 9 Two-dimensional flux maps showing modelled cross-sectional flux profiles at the 6 mm diameter optical waveguide inlet for Cases 2 - 8 Average power results striking the cable are given
919 W 868 W 862 W 480 W 475 W 465 W 448 W
Figure 10 Representative cross-sectional flux maps showing the worst case ray trace scenario of case 8 for a 60 mm diameter copper receiver (left) and the fibre optic cable inlet (right)
Thermal Performance of a High-flux Solar Concentrating System
R amp D Journal of the South African Institution of Mechanical Engineering 2011 27 10-22
httpwwwsaimecheorgza (open access) copy SAIMechE All rights reserved
16
5 Experimental Results The experimental testing programme aimed to characterise performance of FOCUS using energy balance methods in conjunction with a flat plate calorimeter Testing was conducted in three phases to determine firstly the power entering and secondly exiting the fibre optic cable and thirdly the melting capabilities of a lunar regolith stimulant using FOCUS 51 Energy balance methodology The flat plate calorimeter consists of a stainless steel outer casing a nylon insulator and a copper receiving plate (figure 11) An energy balance was carried out on the calorimeter to determine the concentrated flux arriving at the plate surface A detailed heat transfer analysis using the flat plate calorimeter is described by Mouzouris et al20 During operation concentrated rays strike the copper disc while cold water flows through the device to absorb energy The energy balance is invoked to estimate the solar power incident on the plate by summing the energy absorbed by the water flow and the external heat
losses due to radiation and convection (equation 2) External heat losses are estimated using temperature measurements midway in the copper plate The absorptivity of the plate surface estimates the fraction of incident irradiation absorbed Internal losses are neglected due to the low thermal conductivity of the nylon insulation within the calorimeter body
αsqin = qabs + qlout (2)
52 Experimental setup Key components of the experiment include FOCUS the calorimeter water circulation system and instrumentation (figure 12) To determine the high-flux solar measurements of FOCUS the calorimeter is positioned first at the focal point of the concentrator and secondly at fibre optic cable exit Positioning the calorimeter at concentrator focus allows the parameter at optical waveguide inlet to be determined such as power (POWin) flux (FOWin) and flux concentration ratio (CfluxOWin) When the calorimeter is placed at fibre optic outlet POWout FOWout and CfluxOWout are characterised 53 Experimental procedure Experimental testing was conducted at the University of KwaZulu-Natal under clear sky conditions The test area is sheltered from wind while allowing clear vertical views for sun-concentrator orientation Direct normal irradiance (DNI) was measured with an Eppley Normal Incidence Pyrheliometer at the nearby Howard College radiometric ground station (299degS 3098degE at 1511 m elevation21) A typical experiment includes cleaning the seven reflective elements and positioning them such that the focal spot approximates concentric alignment onto the receiver being either the copper plate or the fibre optic cable inlet The receiver is firstly positioned using the calculated focal point and then fine-tuned to minimise the focal spot diameter Positioning the ring elements and receiver was performed with the dual-axis solar tracker in operation Running time per experiment was three minutes The fluid circulation system consists of a pump fitted with a throttle valve to achieve the desired mass flow rate Mass flow
Case 1 Case 2 Case 3 Case 4 Case 5 Case 6 Case 7 Case 8
ηRAC 100 098 093 093 093 093 092 092
ηfoc 100 058 058 057 032 031 031 030
ηinj 085 085 085 085 085 085 085 085 Stages
ητ 095 095 095 095 095 095 095 095
Total ηoverall 081 046 044 043 024 023 023 022
Power at cable inlet POWin (W) 1632 919 868 862 480 475 465 448
Fibre optic inlet flux FOWin (Wcm2) 5772 3250 3070 3049 1698 1680 1645 1584
Flux concentration cable inlet Cflux OWin (suns) 67906 38239 36117 35867 19972 19764 19348 18641
Power at cable outlet POWout (W) 1324 745 704 699 389 385 377 363
Fibre optic outlet flux FOWout (Wcm2) 5483 3088 2916 2896 1613 1596 1562 1505
Flux concentration cable outlet Cflux OWout (suns) 64511 36327 34311 34074 18974 18776 18381 17709
Table 3 Predicted component efficiencies and average performance results for FOCUS using ray tracing methods at a typical irradiance of 850 Wm2
Thermal Performance of a High-flux Solar Concentrating System
R amp D Journal of the South African Institution of Mechanical Engineering 2011 27 10-22
httpwwwsaimecheorgza (open access) copy SAIMechE All rights reserved
17
rate is measured by conducting a timed volume collection and is set to keep the copper receiving plate at a temperature close to ambient to minimise external heat losses due to convection and radiation Instrumentation includes two type T thermocouples for the inlet Tin and outlet Tout water measurements and six type K thermocouples for the temperature distribution measurements midway in the copper plate The six thermocouples are labelled T0 T5 T10 T15 T20 and T25 and are used to estimate the surface temperature Ts of the copper plate
531 Concentrator focus results Characterising the flux distribution at concentrator focus requires covering the copper plate of the calorimeter with a series of reflective shields to progressively limit exposure of concentrated rays onto the copper receiver Ten stages were chosen for discretising the flux distribution starting with no shield representing full exposure of the copper plate and ending with a reflective shield incorporating a 3 mm diameter opening The 6 mm diameter reflective shield represents the cable inlet (figure 13) A nylon backing is applied to minimise conduction between the shield and copper surface Several experiments were
Water inlet
Water outlet
Thermocouples
Figure 11a Exploded view of the flat plate calorimeter Figure 11b Calorimeter side view constructed for performance measurements showing water inlet and of FOCUS and outlet passages
Copper disc
Radial flow distributer
Insulation Flow outlet
Stainless steel body
Flow inlet
Water passage
Data acquisition system Water circulation system
Ring array concentrator Optical waveguide inlet Calorimeter Optical waveguide
Instrumentation
OW exit
Water out Water in
Figure 12 Experimental layout to characterise the energy flux at the optical waveguide exit including key components FOCUS the flat plate calorimeter water circulation system and thermocouples
Water inlet
Water outlet
Thermocouples
Thermal Performance of a High-flux Solar Concentrating System
R amp D Journal of the South African Institution of Mechanical Engineering 2011 27 10-22
httpwwwsaimecheorgza (open access) copy SAIMechE All rights reserved
18
conducted for each shield to obtain the average power incident on the exposed copper surface Subtracting successive exposed power values yielded a discretised flux distribution pattern for the 60 mm diameter receiver Data from a typical experiment using the 6 mm diameter reflective shield are shown in table 4 The calorimeter inlet and outlet water temperatures and temperature distributions midway in the copper plate are shown in figure 14 Of importance is the stabilisation of temperature measurements which allows for the assumption of steady state conditions A temperature difference between water inlet and outlet of 64 degC is observed after three minutes allowed for stabilisation using a mass flow rate of 000154 kgsec resulting in 41 W of power absorbed by the water To obtain an estimate power striking the copper plate surface heat losses were calculated using the temperature distribution midway in the copper plate and added to the power absorbed by the water The temperature measurements of T10 T15 and T20 show unexpected similar readings with possible reasons due to thermocouple inaccuracies or imprecise machining of the copper plate Heat losses due to convection and radiation amounted to 02 of the power absorbed resulting in an estimate power striking the copper plate surface of 432 W at an irradiance of 9380 Wm2 This corresponds to an efficiency of 24 which is in good agreement with the case 8 numerical efficiency result at optical waveguide inlet of 27
Figure 13 The 6 mm diameter reflective shield positioned at concentrator focus A comparison between experimental and modelled flux for the parameter set of Case 8 is shown in Figure 15 Experimental results show a peak flux level of 1528 kWm2 at an input irradiance of 850 Wm2 corresponding to a concentration of 1798 suns Measured maximum temperature values at concentrator focus approached 1500degC at irradiance levels in the region of 1000 Wm2 Measured flux obtained from the application of successive
discretised filters closely follows predicted flux from the ray tracing exercise Experiments conducted using smaller reflective shields allowing a 2 mm and 1 mm diameter exposure of the copper surface produced inconsistent results possibly due to measurement uncertainties at very low heat transfer rates
Table 4 Experimental measurements and results for a typical experiment using a reflective shield with 6 mm aperture
Difficulties in stabilising the system for very small diameter filter plates (lt 3 mm) resulted in poor resolution near the peaks of both curves in figure 15 This is a shortcoming in the calorimetric method of measuring flux To measure peak flux levels further performance testing using a radiometric device such as a Gardon flux sensor is indicated
Experiment Average irradiance level (Wm2) 9380 Ray trace qin (W) 488 Experimental qin (W) 432 qabs (W) 410 qlout (W) 009
(kgs) 000154 ∆T ( Tout - Tin) (degC) 64 Ts (degC) 692 T in (degC) 270 Tout (degC) 334 Experimental qin normalised to 850 Wm2 (W)
392
Figure 14a Results from a typical experiment showing a water temperature difference of 64 degC
Tin Tout
∆T = 64 degC
Exposed copper surface of 6 mm diameter
T0
T5
T10
T15
T20
T25
Thermal Performance of a High-flux Solar Concentrating System
R amp D Journal of the South African Institution of Mechanical Engineering 2011 27 10-22
httpwwwsaimecheorgza (open access) copy SAIMechE All rights reserved
19
Key results from the first phase experiments include performance at optical waveguide inlet Representative average power and flux levels incident on the cable of 394 W and 1393 Wcm2 respectively were observed over five experiments An injected power into the 900 silica fibres of 335 W is estimated and is used in calculating the transmission efficiency of the cable 532 Optical waveguide exit results Waveguide exit performance results are obtained by directing the cable outlet at the calorimeter as shown in figure 16a Tests were conducted using the same methodology as at concentrator focus but without the reflective shields A shield was positioned at optical waveguide inlet to protect the metal ferrule from stray radiation that may cause damage (figure 16b) The shield restricts energy to the 6 mm diameter quartz glass inlet of the cable At cable outlet a preventative measure of offsetting the cable 5 mm away from the calorimeter centre was taken to avoid reflection of sunlight back on to the fibre bundle
Experimental Theoretical
Figure 15b A magnified view of the 6 mm diameter inlet to the optical waveguide (at 850 Wm2)
Figure 16b Reflective shield at fibre optic cable inlet allowing concentrated solar energy into the 6 mm diameter quartz glass inlet
T5
T0
T25
T10 T15 T20
Figure 14b Results from a typical experiment showing temperature measurements midway in the copper plate
Figure 15a Performance results at concentrator focus showing flux levels striking the 60 mm diameter copper plate (at 850 Wm2)
Vertical displacement
Figure 16a Vertical displacement of the cable outlet prevents damaging back reflection on to the 900 fibres of the cable
Thermal Performance of a High-flux Solar Concentrating System
R amp D Journal of the South African Institution of Mechanical Engineering 2011 27 10-22
httpwwwsaimecheorgza (open access) copy SAIMechE All rights reserved
20
Test results showed an average power of 205 W exiting the cable and striking the copper plate at a vertical displacement of 5 mm corresponding to a flux of 849 Wcm2 in the exit plane of the fibres The results represent normalised values at a direct normal irradiance of 850 Wm2 Transmission efficiency of the fibre optic cable is estimated at 61 using the average power results from the 6 mm diameter reflective shield conducted at concentrator focus A predicted efficiency of 95 was used for the theoretical calculations stipulated by the supplier of the cable A possible reason for the 34 decrease in efficiency is greater losses due to reflection at inlet to the cable The reflective losses at cable inlet result from the sudden change of refractive index from air (n = 10) to fused quartz glass (n = 15) This was not modelled in the ray tracing simulation A possible solution to minimise inlet reflective losses is the design and implementation of a secondary concentrator at cable inlet to boost energy injection into the silica fibres 533 Optical efficiency Final performance results from the first two experimental phases are given in table 5 A predicted efficiency of 22 was obtained using ray tracing methods and a worst case error set Experimental results show an efficiency of 13 with the difference attributed mainly to high reflective losses at inlet to the optical fibres
Table 5 FOCUS experimental performance (data normalised to a direct normal irradiance of 850 Wm2 - average of five tests) 534 Regolith melting capabilities In the final test procedure several melting experiments were performed in which concentrated sunlight was directed at a sample of the lunar regolith simulant JSC-1 This was intended to demonstrate the high surface temperatures and flux levels required to melt lunar regolith for ISRU-related applications such as those reported by Nakamura and Senior7 The experimental procedure includes positioning the optical waveguide onto the JSC-1 surface and measuring the the temperature of the melt zone
formed after a period of six minutes (figure 17a) A downward facing reflective shield was positioned beneath the cable to prevent reflected solar rays from the regolith surface striking the cable The temperature of the regolith simulant was measured using a thermocouple positioned at the centre of the melt zone Figure 17b shows a post-experimental sample of the melted regolith from a typical experiment The vitrified circular melt zone formed after six minutes is 6 mm in diameter with a depth of 25 mm Table 6 summarises the peak melt temperature readings obtained for five separate experiments The stabilisation of temperature within the melt zone is illustrated in figure 18 showing peak values graphed against estimated flux levels Flux levels exiting the cable were estimated using average irradiance levels over the test period and the optical efficiency value of 13 Results show a peak temperature exceeding 1200 K at cable exit flux levels of 104 Wcm2 which exceeds the minimum flux criterion for successful regolith melting by 22 Temperature results achieved can be applied to several high temperature lunar ISRU processes including oxygen production and surface stabilisation Creating larger sintered surfaces for practical human use on the lunar surface is possible by implementing autonomous mechanisms to drive multiple fibre optic cables in a coordinated manner22
Theoretical Experimental
POWin (W) 448 394
FOWin (Wcm2) 1584 1393
Cflux OWin (suns) 18641 16388
POWout (W) 363 205
FOWout (Wcm2) 1505 849
Cflux OWout (suns) 17709 9988
ηoverall 022 013
Ceramic dish containing JSC-1
Downward facing reflective shield
6 mm
Figure 17a Regolith melting experiment with the protective shield (reflector) to prevent cable damage and a thermocouple
Figure 17b Magnified view of the vitrified melt with diameter of 6 mm and depth 25 mm
Thermal Performance of a High-flux Solar Concentrating System
R amp D Journal of the South African Institution of Mechanical Engineering 2011 27 10-22
httpwwwsaimecheorgza (open access) copy SAIMechE All rights reserved
21
6 Conclusion The design fabrication and testing of a composite material ring array concentrator is described for the collection of solar energy and its transmission through a fibre optic bundle The FOCUS system has application in high-temperature research such as material sintering and lunar in-situ resource utilisation The overall transmission efficiency from aperture to bundle outlet was measured at 13 using a flat plate calorimeter Temperatures
exceeding 1450 degC and 900 degC were measured at the concentrator focal point and the outlet of the fibres respectively yielding flux levels of 104 Wcm2 An optical error analysis of the seven reflective elements is described In addition to performance validation this work also provides an alternate approach to conventional methods of collector construction Rather than machining metal profiles for the reflective surface extensive use was made of composite materials resulting in a low-cost light weight point focus concentrator that is 38 lighter than an aluminium equivalent and considerably less expensive Results suggest that further reduction in optical error is possible by limiting reflector curvature in the design stage and adapting the optics to accommodate for structural distortion during curing Acknowledgements The authors appreciate the assistance and support of Professor J Bindon Professor WH Moolman Clinton Bemont Khulisile Kunene Michael Constantino OPTIS Durban University of Technology and the University of Stellenboschrsquos Centre for Renewable and Sustainable Energy Studies (CRSES) This work is supported by the National Research Foundation of South Africa and the Eskom TESP program References 1 Pregger T Graf D Krewitt W Sattler C Roeb M and
Moller S Prospects of solar thermal hydrogen production processes International Journal of Hydrogen Energy 2009 34 4256-4267
2 Kalogirou SA Solar thermal collectors and applications Progress in Energy and Combustion Science 2004 30 231-295
3 Sen Z Solar energy in progress and future research trends Progress in Energy and Combustion Science 2004 30 367-416
4 Vasylyev S and Vasylyev V Nonimaging reflective lenses A new type of high-heat solar collector Proceedings of the Solar World Congress Orlando Florida 2005
Experiment 1 2 3 4 5
Irradiance level (Wm2) 10054 9971 9957 9913 9879 Peak temperature (degC) 9355 9016 8820 8769 8504 Flux level (Wcm2) 1040 1031 1029 1025 1021
Experiment 1
Experiment 2
Experiment 3
Experiment 4
Experiment 5
Figure 18a Time evolution of the melt temperature for five experiments for 6 min showing temperature stabilisation in the melt zone
Table 6 Lunar regolith simulant peak melt temperature and cable exit flux concentration results
Figure 18b Peak melt temperatures versus maximum flux levels exiting the 900 silica fibres
Thermal Performance of a High-flux Solar Concentrating System
R amp D Journal of the South African Institution of Mechanical Engineering 2011 27 10-22
httpwwwsaimecheorgza (open access) copy SAIMechE All rights reserved
22
5 Vasylyev V and Vasylyev S Expected optical
performances of novel type multi-element high-heat solar concentrators Proceedings of the American Solar Energy Society Reno NV 2002
6 Feuermann D Gordon JM and Huleihil M Solar fiber-optic mini-dish concentrators First experimental results and field experience Solar Energy 2002 71 459-472
7 Nakamura T and Senior CL Solar thermal power for lunar materials processing Journal of Aerospace Engineering 2008 21 91-101
8 Ballestriacuten J Estrada CA Rodriacuteguez-Alonso M Peacuterez-Raacutebago C Langley LW and Barnes A Heat flux sensors Calorimeters or radiometers Solar Energy 2006 80 1314-1320
9 Ballestriacuten J A non-water-cooled heat flux measurement system under concentrated solar radiation conditions Solar Energy 2002 73 159-168
10 Estrada CA Jaramillo OA Acosta R and Arancibia-Bulnes CA Heat transfer analysis in a calorimeter for concentrated solar radiation measurements Solar Energy 2007 81 1306-1313
11 Fernandez-Reche J Sanchez M Alonso M Canadas I Chenlo F Rodriguez J and Ballestrin J Concentrating PV An alternative to calorimeters for measuring high solar flux densities Journal of Solar Energy Engineering 2008 130 0445021-0445023
12 Ballestriacuten J Ulmer S Morales A Barnes A Langley LW and Rodriguez M Systematic error in the measurement of very high solar irradiance Solar Energy Materials and Solar Cells 2003 80 375-381
13 Mouzouris M and Brooks MJ Nonimaging solar thermal collector for high temperature terrestrial and space applications Proceedings of SPIE Optics and Photonics San Diego CA 2009
14 Mouzouris M and Brooks MJ Construction of a composite material solar concentrator for high heat flux applications Proceedings of 8th Annual International Energy Conversion Engineering Conference Nashville TN 2010
15 Stine WB and Harrigan RW Solar energy
fundamentals and design with computer applications Wiley Alternate Energy 1985 185-188
16 Kumler JJ and Caldwell JB Measuring surface slope error on precision aspheres Proceedings of SPIE Optics and Photonics 2007
17 Menq C and Chen FL Curve and surface approximation from CMM measurement data Computers ind Engng 1996 30 211-225
18 Arasu VA and Sornakumar T Design manufacture and testing of fiberglass reinforced parabola trough for parabolic trough solar collector Solar Energy 2007 81 1273-1279
19 Johnston G Focal region measurements of the 20 m2 tilted dish at the Australian National University Solar Energy 1998 63 117-124
20 Mouzouris M Roberts LW and Brooks MJ Heat transfer analysis for high-flux solar measurements using a flat plate calorimeter Proceedings of First Postgraduate Renewable Energy Symposium CRSES Stellenbosch RSA 2010
21 Kunene KR Brooks MJ Roberts LW and Zawilska E Introducing GRADRAD The greater Durban radiometric network Proceedings of World Renewable Energy Congress XI Abu Dhabi UAE 2010
22 Nakamura T and Smith BK Solar thermal system for lunar ISRU applications Development and field operation at Mauna Kea HI Proceedings of 48th AIAA Aerospace Sciences Meeting Including the New Horizons Forum and Aerospace Exposition Orlando FL 2011
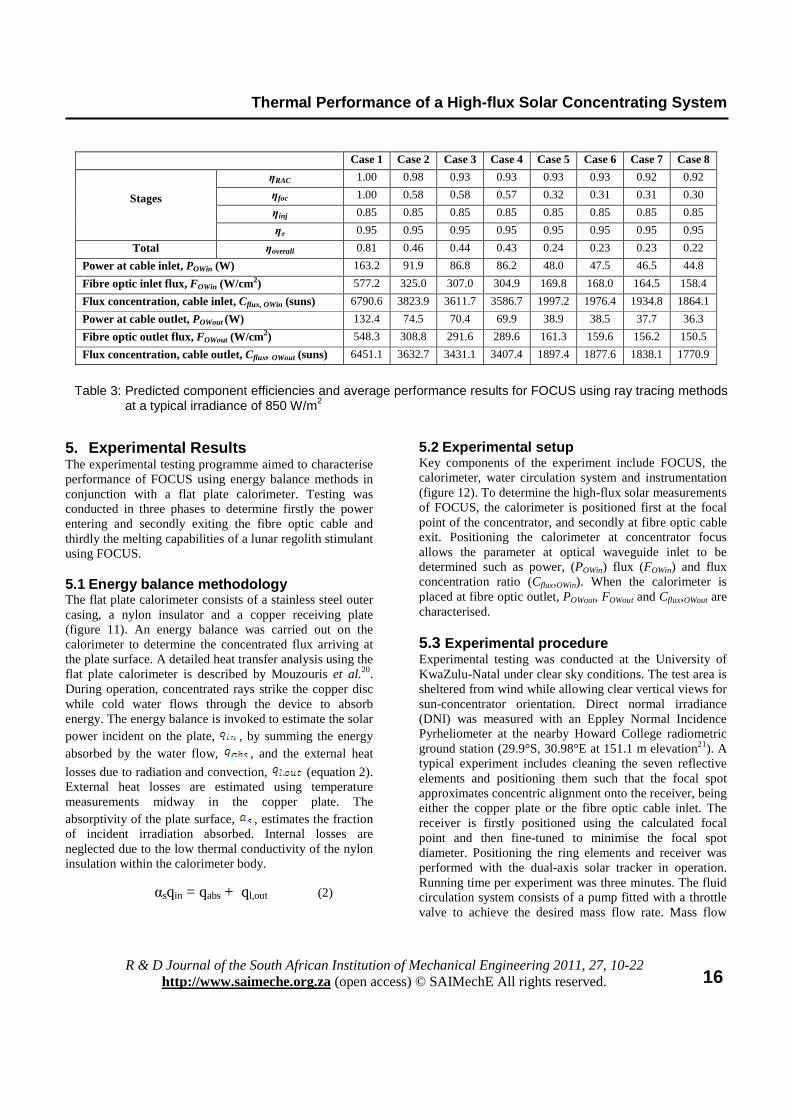
Thermal Performance of a High-flux Solar Concentrating System
R amp D Journal of the South African Institution of Mechanical Engineering 2011 27 10-22
httpwwwsaimecheorgza (open access) copy SAIMechE All rights reserved
16
5 Experimental Results The experimental testing programme aimed to characterise performance of FOCUS using energy balance methods in conjunction with a flat plate calorimeter Testing was conducted in three phases to determine firstly the power entering and secondly exiting the fibre optic cable and thirdly the melting capabilities of a lunar regolith stimulant using FOCUS 51 Energy balance methodology The flat plate calorimeter consists of a stainless steel outer casing a nylon insulator and a copper receiving plate (figure 11) An energy balance was carried out on the calorimeter to determine the concentrated flux arriving at the plate surface A detailed heat transfer analysis using the flat plate calorimeter is described by Mouzouris et al20 During operation concentrated rays strike the copper disc while cold water flows through the device to absorb energy The energy balance is invoked to estimate the solar power incident on the plate by summing the energy absorbed by the water flow and the external heat
losses due to radiation and convection (equation 2) External heat losses are estimated using temperature measurements midway in the copper plate The absorptivity of the plate surface estimates the fraction of incident irradiation absorbed Internal losses are neglected due to the low thermal conductivity of the nylon insulation within the calorimeter body
αsqin = qabs + qlout (2)
52 Experimental setup Key components of the experiment include FOCUS the calorimeter water circulation system and instrumentation (figure 12) To determine the high-flux solar measurements of FOCUS the calorimeter is positioned first at the focal point of the concentrator and secondly at fibre optic cable exit Positioning the calorimeter at concentrator focus allows the parameter at optical waveguide inlet to be determined such as power (POWin) flux (FOWin) and flux concentration ratio (CfluxOWin) When the calorimeter is placed at fibre optic outlet POWout FOWout and CfluxOWout are characterised 53 Experimental procedure Experimental testing was conducted at the University of KwaZulu-Natal under clear sky conditions The test area is sheltered from wind while allowing clear vertical views for sun-concentrator orientation Direct normal irradiance (DNI) was measured with an Eppley Normal Incidence Pyrheliometer at the nearby Howard College radiometric ground station (299degS 3098degE at 1511 m elevation21) A typical experiment includes cleaning the seven reflective elements and positioning them such that the focal spot approximates concentric alignment onto the receiver being either the copper plate or the fibre optic cable inlet The receiver is firstly positioned using the calculated focal point and then fine-tuned to minimise the focal spot diameter Positioning the ring elements and receiver was performed with the dual-axis solar tracker in operation Running time per experiment was three minutes The fluid circulation system consists of a pump fitted with a throttle valve to achieve the desired mass flow rate Mass flow
Case 1 Case 2 Case 3 Case 4 Case 5 Case 6 Case 7 Case 8
ηRAC 100 098 093 093 093 093 092 092
ηfoc 100 058 058 057 032 031 031 030
ηinj 085 085 085 085 085 085 085 085 Stages
ητ 095 095 095 095 095 095 095 095
Total ηoverall 081 046 044 043 024 023 023 022
Power at cable inlet POWin (W) 1632 919 868 862 480 475 465 448
Fibre optic inlet flux FOWin (Wcm2) 5772 3250 3070 3049 1698 1680 1645 1584
Flux concentration cable inlet Cflux OWin (suns) 67906 38239 36117 35867 19972 19764 19348 18641
Power at cable outlet POWout (W) 1324 745 704 699 389 385 377 363
Fibre optic outlet flux FOWout (Wcm2) 5483 3088 2916 2896 1613 1596 1562 1505
Flux concentration cable outlet Cflux OWout (suns) 64511 36327 34311 34074 18974 18776 18381 17709
Table 3 Predicted component efficiencies and average performance results for FOCUS using ray tracing methods at a typical irradiance of 850 Wm2
Thermal Performance of a High-flux Solar Concentrating System
R amp D Journal of the South African Institution of Mechanical Engineering 2011 27 10-22
httpwwwsaimecheorgza (open access) copy SAIMechE All rights reserved
17
rate is measured by conducting a timed volume collection and is set to keep the copper receiving plate at a temperature close to ambient to minimise external heat losses due to convection and radiation Instrumentation includes two type T thermocouples for the inlet Tin and outlet Tout water measurements and six type K thermocouples for the temperature distribution measurements midway in the copper plate The six thermocouples are labelled T0 T5 T10 T15 T20 and T25 and are used to estimate the surface temperature Ts of the copper plate
531 Concentrator focus results Characterising the flux distribution at concentrator focus requires covering the copper plate of the calorimeter with a series of reflective shields to progressively limit exposure of concentrated rays onto the copper receiver Ten stages were chosen for discretising the flux distribution starting with no shield representing full exposure of the copper plate and ending with a reflective shield incorporating a 3 mm diameter opening The 6 mm diameter reflective shield represents the cable inlet (figure 13) A nylon backing is applied to minimise conduction between the shield and copper surface Several experiments were
Water inlet
Water outlet
Thermocouples
Figure 11a Exploded view of the flat plate calorimeter Figure 11b Calorimeter side view constructed for performance measurements showing water inlet and of FOCUS and outlet passages
Copper disc
Radial flow distributer
Insulation Flow outlet
Stainless steel body
Flow inlet
Water passage
Data acquisition system Water circulation system
Ring array concentrator Optical waveguide inlet Calorimeter Optical waveguide
Instrumentation
OW exit
Water out Water in
Figure 12 Experimental layout to characterise the energy flux at the optical waveguide exit including key components FOCUS the flat plate calorimeter water circulation system and thermocouples
Water inlet
Water outlet
Thermocouples
Thermal Performance of a High-flux Solar Concentrating System
R amp D Journal of the South African Institution of Mechanical Engineering 2011 27 10-22
httpwwwsaimecheorgza (open access) copy SAIMechE All rights reserved
18
conducted for each shield to obtain the average power incident on the exposed copper surface Subtracting successive exposed power values yielded a discretised flux distribution pattern for the 60 mm diameter receiver Data from a typical experiment using the 6 mm diameter reflective shield are shown in table 4 The calorimeter inlet and outlet water temperatures and temperature distributions midway in the copper plate are shown in figure 14 Of importance is the stabilisation of temperature measurements which allows for the assumption of steady state conditions A temperature difference between water inlet and outlet of 64 degC is observed after three minutes allowed for stabilisation using a mass flow rate of 000154 kgsec resulting in 41 W of power absorbed by the water To obtain an estimate power striking the copper plate surface heat losses were calculated using the temperature distribution midway in the copper plate and added to the power absorbed by the water The temperature measurements of T10 T15 and T20 show unexpected similar readings with possible reasons due to thermocouple inaccuracies or imprecise machining of the copper plate Heat losses due to convection and radiation amounted to 02 of the power absorbed resulting in an estimate power striking the copper plate surface of 432 W at an irradiance of 9380 Wm2 This corresponds to an efficiency of 24 which is in good agreement with the case 8 numerical efficiency result at optical waveguide inlet of 27
Figure 13 The 6 mm diameter reflective shield positioned at concentrator focus A comparison between experimental and modelled flux for the parameter set of Case 8 is shown in Figure 15 Experimental results show a peak flux level of 1528 kWm2 at an input irradiance of 850 Wm2 corresponding to a concentration of 1798 suns Measured maximum temperature values at concentrator focus approached 1500degC at irradiance levels in the region of 1000 Wm2 Measured flux obtained from the application of successive
discretised filters closely follows predicted flux from the ray tracing exercise Experiments conducted using smaller reflective shields allowing a 2 mm and 1 mm diameter exposure of the copper surface produced inconsistent results possibly due to measurement uncertainties at very low heat transfer rates
Table 4 Experimental measurements and results for a typical experiment using a reflective shield with 6 mm aperture
Difficulties in stabilising the system for very small diameter filter plates (lt 3 mm) resulted in poor resolution near the peaks of both curves in figure 15 This is a shortcoming in the calorimetric method of measuring flux To measure peak flux levels further performance testing using a radiometric device such as a Gardon flux sensor is indicated
Experiment Average irradiance level (Wm2) 9380 Ray trace qin (W) 488 Experimental qin (W) 432 qabs (W) 410 qlout (W) 009
(kgs) 000154 ∆T ( Tout - Tin) (degC) 64 Ts (degC) 692 T in (degC) 270 Tout (degC) 334 Experimental qin normalised to 850 Wm2 (W)
392
Figure 14a Results from a typical experiment showing a water temperature difference of 64 degC
Tin Tout
∆T = 64 degC
Exposed copper surface of 6 mm diameter
T0
T5
T10
T15
T20
T25
Thermal Performance of a High-flux Solar Concentrating System
R amp D Journal of the South African Institution of Mechanical Engineering 2011 27 10-22
httpwwwsaimecheorgza (open access) copy SAIMechE All rights reserved
19
Key results from the first phase experiments include performance at optical waveguide inlet Representative average power and flux levels incident on the cable of 394 W and 1393 Wcm2 respectively were observed over five experiments An injected power into the 900 silica fibres of 335 W is estimated and is used in calculating the transmission efficiency of the cable 532 Optical waveguide exit results Waveguide exit performance results are obtained by directing the cable outlet at the calorimeter as shown in figure 16a Tests were conducted using the same methodology as at concentrator focus but without the reflective shields A shield was positioned at optical waveguide inlet to protect the metal ferrule from stray radiation that may cause damage (figure 16b) The shield restricts energy to the 6 mm diameter quartz glass inlet of the cable At cable outlet a preventative measure of offsetting the cable 5 mm away from the calorimeter centre was taken to avoid reflection of sunlight back on to the fibre bundle
Experimental Theoretical
Figure 15b A magnified view of the 6 mm diameter inlet to the optical waveguide (at 850 Wm2)
Figure 16b Reflective shield at fibre optic cable inlet allowing concentrated solar energy into the 6 mm diameter quartz glass inlet
T5
T0
T25
T10 T15 T20
Figure 14b Results from a typical experiment showing temperature measurements midway in the copper plate
Figure 15a Performance results at concentrator focus showing flux levels striking the 60 mm diameter copper plate (at 850 Wm2)
Vertical displacement
Figure 16a Vertical displacement of the cable outlet prevents damaging back reflection on to the 900 fibres of the cable
Thermal Performance of a High-flux Solar Concentrating System
R amp D Journal of the South African Institution of Mechanical Engineering 2011 27 10-22
httpwwwsaimecheorgza (open access) copy SAIMechE All rights reserved
20
Test results showed an average power of 205 W exiting the cable and striking the copper plate at a vertical displacement of 5 mm corresponding to a flux of 849 Wcm2 in the exit plane of the fibres The results represent normalised values at a direct normal irradiance of 850 Wm2 Transmission efficiency of the fibre optic cable is estimated at 61 using the average power results from the 6 mm diameter reflective shield conducted at concentrator focus A predicted efficiency of 95 was used for the theoretical calculations stipulated by the supplier of the cable A possible reason for the 34 decrease in efficiency is greater losses due to reflection at inlet to the cable The reflective losses at cable inlet result from the sudden change of refractive index from air (n = 10) to fused quartz glass (n = 15) This was not modelled in the ray tracing simulation A possible solution to minimise inlet reflective losses is the design and implementation of a secondary concentrator at cable inlet to boost energy injection into the silica fibres 533 Optical efficiency Final performance results from the first two experimental phases are given in table 5 A predicted efficiency of 22 was obtained using ray tracing methods and a worst case error set Experimental results show an efficiency of 13 with the difference attributed mainly to high reflective losses at inlet to the optical fibres
Table 5 FOCUS experimental performance (data normalised to a direct normal irradiance of 850 Wm2 - average of five tests) 534 Regolith melting capabilities In the final test procedure several melting experiments were performed in which concentrated sunlight was directed at a sample of the lunar regolith simulant JSC-1 This was intended to demonstrate the high surface temperatures and flux levels required to melt lunar regolith for ISRU-related applications such as those reported by Nakamura and Senior7 The experimental procedure includes positioning the optical waveguide onto the JSC-1 surface and measuring the the temperature of the melt zone
formed after a period of six minutes (figure 17a) A downward facing reflective shield was positioned beneath the cable to prevent reflected solar rays from the regolith surface striking the cable The temperature of the regolith simulant was measured using a thermocouple positioned at the centre of the melt zone Figure 17b shows a post-experimental sample of the melted regolith from a typical experiment The vitrified circular melt zone formed after six minutes is 6 mm in diameter with a depth of 25 mm Table 6 summarises the peak melt temperature readings obtained for five separate experiments The stabilisation of temperature within the melt zone is illustrated in figure 18 showing peak values graphed against estimated flux levels Flux levels exiting the cable were estimated using average irradiance levels over the test period and the optical efficiency value of 13 Results show a peak temperature exceeding 1200 K at cable exit flux levels of 104 Wcm2 which exceeds the minimum flux criterion for successful regolith melting by 22 Temperature results achieved can be applied to several high temperature lunar ISRU processes including oxygen production and surface stabilisation Creating larger sintered surfaces for practical human use on the lunar surface is possible by implementing autonomous mechanisms to drive multiple fibre optic cables in a coordinated manner22
Theoretical Experimental
POWin (W) 448 394
FOWin (Wcm2) 1584 1393
Cflux OWin (suns) 18641 16388
POWout (W) 363 205
FOWout (Wcm2) 1505 849
Cflux OWout (suns) 17709 9988
ηoverall 022 013
Ceramic dish containing JSC-1
Downward facing reflective shield
6 mm
Figure 17a Regolith melting experiment with the protective shield (reflector) to prevent cable damage and a thermocouple
Figure 17b Magnified view of the vitrified melt with diameter of 6 mm and depth 25 mm
Thermal Performance of a High-flux Solar Concentrating System
R amp D Journal of the South African Institution of Mechanical Engineering 2011 27 10-22
httpwwwsaimecheorgza (open access) copy SAIMechE All rights reserved
21
6 Conclusion The design fabrication and testing of a composite material ring array concentrator is described for the collection of solar energy and its transmission through a fibre optic bundle The FOCUS system has application in high-temperature research such as material sintering and lunar in-situ resource utilisation The overall transmission efficiency from aperture to bundle outlet was measured at 13 using a flat plate calorimeter Temperatures
exceeding 1450 degC and 900 degC were measured at the concentrator focal point and the outlet of the fibres respectively yielding flux levels of 104 Wcm2 An optical error analysis of the seven reflective elements is described In addition to performance validation this work also provides an alternate approach to conventional methods of collector construction Rather than machining metal profiles for the reflective surface extensive use was made of composite materials resulting in a low-cost light weight point focus concentrator that is 38 lighter than an aluminium equivalent and considerably less expensive Results suggest that further reduction in optical error is possible by limiting reflector curvature in the design stage and adapting the optics to accommodate for structural distortion during curing Acknowledgements The authors appreciate the assistance and support of Professor J Bindon Professor WH Moolman Clinton Bemont Khulisile Kunene Michael Constantino OPTIS Durban University of Technology and the University of Stellenboschrsquos Centre for Renewable and Sustainable Energy Studies (CRSES) This work is supported by the National Research Foundation of South Africa and the Eskom TESP program References 1 Pregger T Graf D Krewitt W Sattler C Roeb M and
Moller S Prospects of solar thermal hydrogen production processes International Journal of Hydrogen Energy 2009 34 4256-4267
2 Kalogirou SA Solar thermal collectors and applications Progress in Energy and Combustion Science 2004 30 231-295
3 Sen Z Solar energy in progress and future research trends Progress in Energy and Combustion Science 2004 30 367-416
4 Vasylyev S and Vasylyev V Nonimaging reflective lenses A new type of high-heat solar collector Proceedings of the Solar World Congress Orlando Florida 2005
Experiment 1 2 3 4 5
Irradiance level (Wm2) 10054 9971 9957 9913 9879 Peak temperature (degC) 9355 9016 8820 8769 8504 Flux level (Wcm2) 1040 1031 1029 1025 1021
Experiment 1
Experiment 2
Experiment 3
Experiment 4
Experiment 5
Figure 18a Time evolution of the melt temperature for five experiments for 6 min showing temperature stabilisation in the melt zone
Table 6 Lunar regolith simulant peak melt temperature and cable exit flux concentration results
Figure 18b Peak melt temperatures versus maximum flux levels exiting the 900 silica fibres
Thermal Performance of a High-flux Solar Concentrating System
R amp D Journal of the South African Institution of Mechanical Engineering 2011 27 10-22
httpwwwsaimecheorgza (open access) copy SAIMechE All rights reserved
22
5 Vasylyev V and Vasylyev S Expected optical
performances of novel type multi-element high-heat solar concentrators Proceedings of the American Solar Energy Society Reno NV 2002
6 Feuermann D Gordon JM and Huleihil M Solar fiber-optic mini-dish concentrators First experimental results and field experience Solar Energy 2002 71 459-472
7 Nakamura T and Senior CL Solar thermal power for lunar materials processing Journal of Aerospace Engineering 2008 21 91-101
8 Ballestriacuten J Estrada CA Rodriacuteguez-Alonso M Peacuterez-Raacutebago C Langley LW and Barnes A Heat flux sensors Calorimeters or radiometers Solar Energy 2006 80 1314-1320
9 Ballestriacuten J A non-water-cooled heat flux measurement system under concentrated solar radiation conditions Solar Energy 2002 73 159-168
10 Estrada CA Jaramillo OA Acosta R and Arancibia-Bulnes CA Heat transfer analysis in a calorimeter for concentrated solar radiation measurements Solar Energy 2007 81 1306-1313
11 Fernandez-Reche J Sanchez M Alonso M Canadas I Chenlo F Rodriguez J and Ballestrin J Concentrating PV An alternative to calorimeters for measuring high solar flux densities Journal of Solar Energy Engineering 2008 130 0445021-0445023
12 Ballestriacuten J Ulmer S Morales A Barnes A Langley LW and Rodriguez M Systematic error in the measurement of very high solar irradiance Solar Energy Materials and Solar Cells 2003 80 375-381
13 Mouzouris M and Brooks MJ Nonimaging solar thermal collector for high temperature terrestrial and space applications Proceedings of SPIE Optics and Photonics San Diego CA 2009
14 Mouzouris M and Brooks MJ Construction of a composite material solar concentrator for high heat flux applications Proceedings of 8th Annual International Energy Conversion Engineering Conference Nashville TN 2010
15 Stine WB and Harrigan RW Solar energy
fundamentals and design with computer applications Wiley Alternate Energy 1985 185-188
16 Kumler JJ and Caldwell JB Measuring surface slope error on precision aspheres Proceedings of SPIE Optics and Photonics 2007
17 Menq C and Chen FL Curve and surface approximation from CMM measurement data Computers ind Engng 1996 30 211-225
18 Arasu VA and Sornakumar T Design manufacture and testing of fiberglass reinforced parabola trough for parabolic trough solar collector Solar Energy 2007 81 1273-1279
19 Johnston G Focal region measurements of the 20 m2 tilted dish at the Australian National University Solar Energy 1998 63 117-124
20 Mouzouris M Roberts LW and Brooks MJ Heat transfer analysis for high-flux solar measurements using a flat plate calorimeter Proceedings of First Postgraduate Renewable Energy Symposium CRSES Stellenbosch RSA 2010
21 Kunene KR Brooks MJ Roberts LW and Zawilska E Introducing GRADRAD The greater Durban radiometric network Proceedings of World Renewable Energy Congress XI Abu Dhabi UAE 2010
22 Nakamura T and Smith BK Solar thermal system for lunar ISRU applications Development and field operation at Mauna Kea HI Proceedings of 48th AIAA Aerospace Sciences Meeting Including the New Horizons Forum and Aerospace Exposition Orlando FL 2011
Thermal Performance of a High-flux Solar Concentrating System
R amp D Journal of the South African Institution of Mechanical Engineering 2011 27 10-22
httpwwwsaimecheorgza (open access) copy SAIMechE All rights reserved
17
rate is measured by conducting a timed volume collection and is set to keep the copper receiving plate at a temperature close to ambient to minimise external heat losses due to convection and radiation Instrumentation includes two type T thermocouples for the inlet Tin and outlet Tout water measurements and six type K thermocouples for the temperature distribution measurements midway in the copper plate The six thermocouples are labelled T0 T5 T10 T15 T20 and T25 and are used to estimate the surface temperature Ts of the copper plate
531 Concentrator focus results Characterising the flux distribution at concentrator focus requires covering the copper plate of the calorimeter with a series of reflective shields to progressively limit exposure of concentrated rays onto the copper receiver Ten stages were chosen for discretising the flux distribution starting with no shield representing full exposure of the copper plate and ending with a reflective shield incorporating a 3 mm diameter opening The 6 mm diameter reflective shield represents the cable inlet (figure 13) A nylon backing is applied to minimise conduction between the shield and copper surface Several experiments were
Water inlet
Water outlet
Thermocouples
Figure 11a Exploded view of the flat plate calorimeter Figure 11b Calorimeter side view constructed for performance measurements showing water inlet and of FOCUS and outlet passages
Copper disc
Radial flow distributer
Insulation Flow outlet
Stainless steel body
Flow inlet
Water passage
Data acquisition system Water circulation system
Ring array concentrator Optical waveguide inlet Calorimeter Optical waveguide
Instrumentation
OW exit
Water out Water in
Figure 12 Experimental layout to characterise the energy flux at the optical waveguide exit including key components FOCUS the flat plate calorimeter water circulation system and thermocouples
Water inlet
Water outlet
Thermocouples
Thermal Performance of a High-flux Solar Concentrating System
R amp D Journal of the South African Institution of Mechanical Engineering 2011 27 10-22
httpwwwsaimecheorgza (open access) copy SAIMechE All rights reserved
18
conducted for each shield to obtain the average power incident on the exposed copper surface Subtracting successive exposed power values yielded a discretised flux distribution pattern for the 60 mm diameter receiver Data from a typical experiment using the 6 mm diameter reflective shield are shown in table 4 The calorimeter inlet and outlet water temperatures and temperature distributions midway in the copper plate are shown in figure 14 Of importance is the stabilisation of temperature measurements which allows for the assumption of steady state conditions A temperature difference between water inlet and outlet of 64 degC is observed after three minutes allowed for stabilisation using a mass flow rate of 000154 kgsec resulting in 41 W of power absorbed by the water To obtain an estimate power striking the copper plate surface heat losses were calculated using the temperature distribution midway in the copper plate and added to the power absorbed by the water The temperature measurements of T10 T15 and T20 show unexpected similar readings with possible reasons due to thermocouple inaccuracies or imprecise machining of the copper plate Heat losses due to convection and radiation amounted to 02 of the power absorbed resulting in an estimate power striking the copper plate surface of 432 W at an irradiance of 9380 Wm2 This corresponds to an efficiency of 24 which is in good agreement with the case 8 numerical efficiency result at optical waveguide inlet of 27
Figure 13 The 6 mm diameter reflective shield positioned at concentrator focus A comparison between experimental and modelled flux for the parameter set of Case 8 is shown in Figure 15 Experimental results show a peak flux level of 1528 kWm2 at an input irradiance of 850 Wm2 corresponding to a concentration of 1798 suns Measured maximum temperature values at concentrator focus approached 1500degC at irradiance levels in the region of 1000 Wm2 Measured flux obtained from the application of successive
discretised filters closely follows predicted flux from the ray tracing exercise Experiments conducted using smaller reflective shields allowing a 2 mm and 1 mm diameter exposure of the copper surface produced inconsistent results possibly due to measurement uncertainties at very low heat transfer rates
Table 4 Experimental measurements and results for a typical experiment using a reflective shield with 6 mm aperture
Difficulties in stabilising the system for very small diameter filter plates (lt 3 mm) resulted in poor resolution near the peaks of both curves in figure 15 This is a shortcoming in the calorimetric method of measuring flux To measure peak flux levels further performance testing using a radiometric device such as a Gardon flux sensor is indicated
Experiment Average irradiance level (Wm2) 9380 Ray trace qin (W) 488 Experimental qin (W) 432 qabs (W) 410 qlout (W) 009
(kgs) 000154 ∆T ( Tout - Tin) (degC) 64 Ts (degC) 692 T in (degC) 270 Tout (degC) 334 Experimental qin normalised to 850 Wm2 (W)
392
Figure 14a Results from a typical experiment showing a water temperature difference of 64 degC
Tin Tout
∆T = 64 degC
Exposed copper surface of 6 mm diameter
T0
T5
T10
T15
T20
T25
Thermal Performance of a High-flux Solar Concentrating System
R amp D Journal of the South African Institution of Mechanical Engineering 2011 27 10-22
httpwwwsaimecheorgza (open access) copy SAIMechE All rights reserved
19
Key results from the first phase experiments include performance at optical waveguide inlet Representative average power and flux levels incident on the cable of 394 W and 1393 Wcm2 respectively were observed over five experiments An injected power into the 900 silica fibres of 335 W is estimated and is used in calculating the transmission efficiency of the cable 532 Optical waveguide exit results Waveguide exit performance results are obtained by directing the cable outlet at the calorimeter as shown in figure 16a Tests were conducted using the same methodology as at concentrator focus but without the reflective shields A shield was positioned at optical waveguide inlet to protect the metal ferrule from stray radiation that may cause damage (figure 16b) The shield restricts energy to the 6 mm diameter quartz glass inlet of the cable At cable outlet a preventative measure of offsetting the cable 5 mm away from the calorimeter centre was taken to avoid reflection of sunlight back on to the fibre bundle
Experimental Theoretical
Figure 15b A magnified view of the 6 mm diameter inlet to the optical waveguide (at 850 Wm2)
Figure 16b Reflective shield at fibre optic cable inlet allowing concentrated solar energy into the 6 mm diameter quartz glass inlet
T5
T0
T25
T10 T15 T20
Figure 14b Results from a typical experiment showing temperature measurements midway in the copper plate
Figure 15a Performance results at concentrator focus showing flux levels striking the 60 mm diameter copper plate (at 850 Wm2)
Vertical displacement
Figure 16a Vertical displacement of the cable outlet prevents damaging back reflection on to the 900 fibres of the cable
Thermal Performance of a High-flux Solar Concentrating System
R amp D Journal of the South African Institution of Mechanical Engineering 2011 27 10-22
httpwwwsaimecheorgza (open access) copy SAIMechE All rights reserved
20
Test results showed an average power of 205 W exiting the cable and striking the copper plate at a vertical displacement of 5 mm corresponding to a flux of 849 Wcm2 in the exit plane of the fibres The results represent normalised values at a direct normal irradiance of 850 Wm2 Transmission efficiency of the fibre optic cable is estimated at 61 using the average power results from the 6 mm diameter reflective shield conducted at concentrator focus A predicted efficiency of 95 was used for the theoretical calculations stipulated by the supplier of the cable A possible reason for the 34 decrease in efficiency is greater losses due to reflection at inlet to the cable The reflective losses at cable inlet result from the sudden change of refractive index from air (n = 10) to fused quartz glass (n = 15) This was not modelled in the ray tracing simulation A possible solution to minimise inlet reflective losses is the design and implementation of a secondary concentrator at cable inlet to boost energy injection into the silica fibres 533 Optical efficiency Final performance results from the first two experimental phases are given in table 5 A predicted efficiency of 22 was obtained using ray tracing methods and a worst case error set Experimental results show an efficiency of 13 with the difference attributed mainly to high reflective losses at inlet to the optical fibres
Table 5 FOCUS experimental performance (data normalised to a direct normal irradiance of 850 Wm2 - average of five tests) 534 Regolith melting capabilities In the final test procedure several melting experiments were performed in which concentrated sunlight was directed at a sample of the lunar regolith simulant JSC-1 This was intended to demonstrate the high surface temperatures and flux levels required to melt lunar regolith for ISRU-related applications such as those reported by Nakamura and Senior7 The experimental procedure includes positioning the optical waveguide onto the JSC-1 surface and measuring the the temperature of the melt zone
formed after a period of six minutes (figure 17a) A downward facing reflective shield was positioned beneath the cable to prevent reflected solar rays from the regolith surface striking the cable The temperature of the regolith simulant was measured using a thermocouple positioned at the centre of the melt zone Figure 17b shows a post-experimental sample of the melted regolith from a typical experiment The vitrified circular melt zone formed after six minutes is 6 mm in diameter with a depth of 25 mm Table 6 summarises the peak melt temperature readings obtained for five separate experiments The stabilisation of temperature within the melt zone is illustrated in figure 18 showing peak values graphed against estimated flux levels Flux levels exiting the cable were estimated using average irradiance levels over the test period and the optical efficiency value of 13 Results show a peak temperature exceeding 1200 K at cable exit flux levels of 104 Wcm2 which exceeds the minimum flux criterion for successful regolith melting by 22 Temperature results achieved can be applied to several high temperature lunar ISRU processes including oxygen production and surface stabilisation Creating larger sintered surfaces for practical human use on the lunar surface is possible by implementing autonomous mechanisms to drive multiple fibre optic cables in a coordinated manner22
Theoretical Experimental
POWin (W) 448 394
FOWin (Wcm2) 1584 1393
Cflux OWin (suns) 18641 16388
POWout (W) 363 205
FOWout (Wcm2) 1505 849
Cflux OWout (suns) 17709 9988
ηoverall 022 013
Ceramic dish containing JSC-1
Downward facing reflective shield
6 mm
Figure 17a Regolith melting experiment with the protective shield (reflector) to prevent cable damage and a thermocouple
Figure 17b Magnified view of the vitrified melt with diameter of 6 mm and depth 25 mm
Thermal Performance of a High-flux Solar Concentrating System
R amp D Journal of the South African Institution of Mechanical Engineering 2011 27 10-22
httpwwwsaimecheorgza (open access) copy SAIMechE All rights reserved
21
6 Conclusion The design fabrication and testing of a composite material ring array concentrator is described for the collection of solar energy and its transmission through a fibre optic bundle The FOCUS system has application in high-temperature research such as material sintering and lunar in-situ resource utilisation The overall transmission efficiency from aperture to bundle outlet was measured at 13 using a flat plate calorimeter Temperatures
exceeding 1450 degC and 900 degC were measured at the concentrator focal point and the outlet of the fibres respectively yielding flux levels of 104 Wcm2 An optical error analysis of the seven reflective elements is described In addition to performance validation this work also provides an alternate approach to conventional methods of collector construction Rather than machining metal profiles for the reflective surface extensive use was made of composite materials resulting in a low-cost light weight point focus concentrator that is 38 lighter than an aluminium equivalent and considerably less expensive Results suggest that further reduction in optical error is possible by limiting reflector curvature in the design stage and adapting the optics to accommodate for structural distortion during curing Acknowledgements The authors appreciate the assistance and support of Professor J Bindon Professor WH Moolman Clinton Bemont Khulisile Kunene Michael Constantino OPTIS Durban University of Technology and the University of Stellenboschrsquos Centre for Renewable and Sustainable Energy Studies (CRSES) This work is supported by the National Research Foundation of South Africa and the Eskom TESP program References 1 Pregger T Graf D Krewitt W Sattler C Roeb M and
Moller S Prospects of solar thermal hydrogen production processes International Journal of Hydrogen Energy 2009 34 4256-4267
2 Kalogirou SA Solar thermal collectors and applications Progress in Energy and Combustion Science 2004 30 231-295
3 Sen Z Solar energy in progress and future research trends Progress in Energy and Combustion Science 2004 30 367-416
4 Vasylyev S and Vasylyev V Nonimaging reflective lenses A new type of high-heat solar collector Proceedings of the Solar World Congress Orlando Florida 2005
Experiment 1 2 3 4 5
Irradiance level (Wm2) 10054 9971 9957 9913 9879 Peak temperature (degC) 9355 9016 8820 8769 8504 Flux level (Wcm2) 1040 1031 1029 1025 1021
Experiment 1
Experiment 2
Experiment 3
Experiment 4
Experiment 5
Figure 18a Time evolution of the melt temperature for five experiments for 6 min showing temperature stabilisation in the melt zone
Table 6 Lunar regolith simulant peak melt temperature and cable exit flux concentration results
Figure 18b Peak melt temperatures versus maximum flux levels exiting the 900 silica fibres
Thermal Performance of a High-flux Solar Concentrating System
R amp D Journal of the South African Institution of Mechanical Engineering 2011 27 10-22
httpwwwsaimecheorgza (open access) copy SAIMechE All rights reserved
22
5 Vasylyev V and Vasylyev S Expected optical
performances of novel type multi-element high-heat solar concentrators Proceedings of the American Solar Energy Society Reno NV 2002
6 Feuermann D Gordon JM and Huleihil M Solar fiber-optic mini-dish concentrators First experimental results and field experience Solar Energy 2002 71 459-472
7 Nakamura T and Senior CL Solar thermal power for lunar materials processing Journal of Aerospace Engineering 2008 21 91-101
8 Ballestriacuten J Estrada CA Rodriacuteguez-Alonso M Peacuterez-Raacutebago C Langley LW and Barnes A Heat flux sensors Calorimeters or radiometers Solar Energy 2006 80 1314-1320
9 Ballestriacuten J A non-water-cooled heat flux measurement system under concentrated solar radiation conditions Solar Energy 2002 73 159-168
10 Estrada CA Jaramillo OA Acosta R and Arancibia-Bulnes CA Heat transfer analysis in a calorimeter for concentrated solar radiation measurements Solar Energy 2007 81 1306-1313
11 Fernandez-Reche J Sanchez M Alonso M Canadas I Chenlo F Rodriguez J and Ballestrin J Concentrating PV An alternative to calorimeters for measuring high solar flux densities Journal of Solar Energy Engineering 2008 130 0445021-0445023
12 Ballestriacuten J Ulmer S Morales A Barnes A Langley LW and Rodriguez M Systematic error in the measurement of very high solar irradiance Solar Energy Materials and Solar Cells 2003 80 375-381
13 Mouzouris M and Brooks MJ Nonimaging solar thermal collector for high temperature terrestrial and space applications Proceedings of SPIE Optics and Photonics San Diego CA 2009
14 Mouzouris M and Brooks MJ Construction of a composite material solar concentrator for high heat flux applications Proceedings of 8th Annual International Energy Conversion Engineering Conference Nashville TN 2010
15 Stine WB and Harrigan RW Solar energy
fundamentals and design with computer applications Wiley Alternate Energy 1985 185-188
16 Kumler JJ and Caldwell JB Measuring surface slope error on precision aspheres Proceedings of SPIE Optics and Photonics 2007
17 Menq C and Chen FL Curve and surface approximation from CMM measurement data Computers ind Engng 1996 30 211-225
18 Arasu VA and Sornakumar T Design manufacture and testing of fiberglass reinforced parabola trough for parabolic trough solar collector Solar Energy 2007 81 1273-1279
19 Johnston G Focal region measurements of the 20 m2 tilted dish at the Australian National University Solar Energy 1998 63 117-124
20 Mouzouris M Roberts LW and Brooks MJ Heat transfer analysis for high-flux solar measurements using a flat plate calorimeter Proceedings of First Postgraduate Renewable Energy Symposium CRSES Stellenbosch RSA 2010
21 Kunene KR Brooks MJ Roberts LW and Zawilska E Introducing GRADRAD The greater Durban radiometric network Proceedings of World Renewable Energy Congress XI Abu Dhabi UAE 2010
22 Nakamura T and Smith BK Solar thermal system for lunar ISRU applications Development and field operation at Mauna Kea HI Proceedings of 48th AIAA Aerospace Sciences Meeting Including the New Horizons Forum and Aerospace Exposition Orlando FL 2011
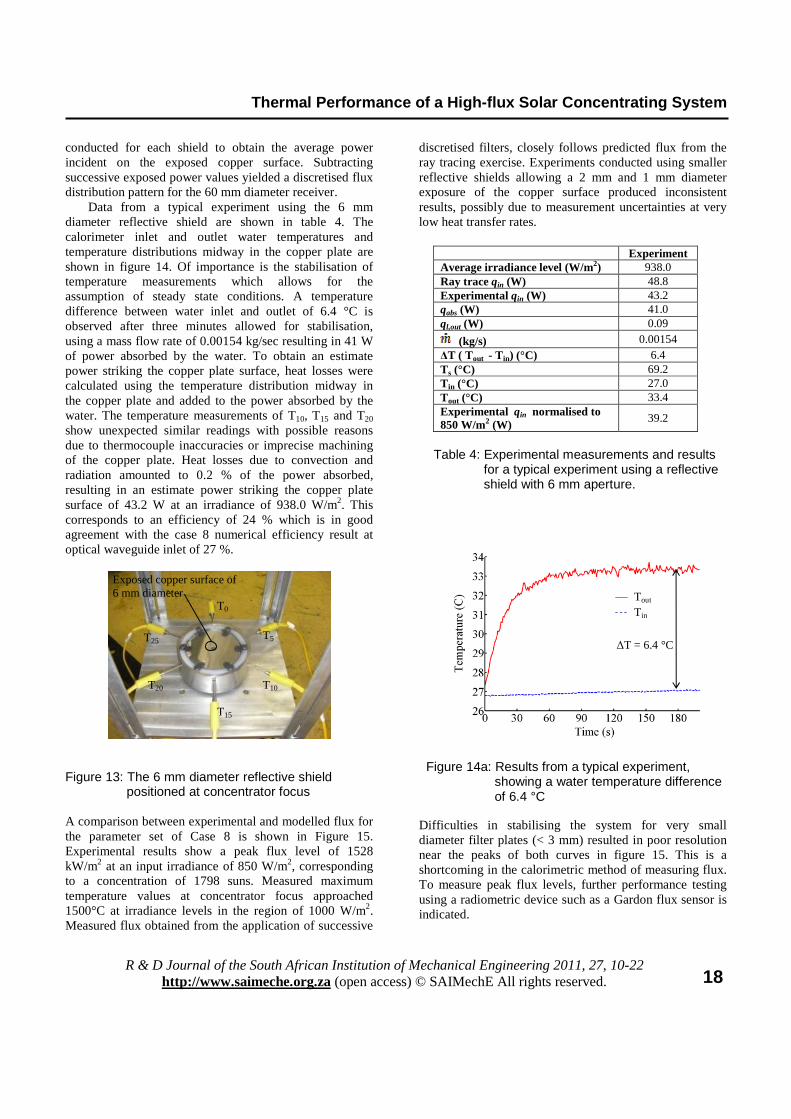
Thermal Performance of a High-flux Solar Concentrating System
R amp D Journal of the South African Institution of Mechanical Engineering 2011 27 10-22
httpwwwsaimecheorgza (open access) copy SAIMechE All rights reserved
18
conducted for each shield to obtain the average power incident on the exposed copper surface Subtracting successive exposed power values yielded a discretised flux distribution pattern for the 60 mm diameter receiver Data from a typical experiment using the 6 mm diameter reflective shield are shown in table 4 The calorimeter inlet and outlet water temperatures and temperature distributions midway in the copper plate are shown in figure 14 Of importance is the stabilisation of temperature measurements which allows for the assumption of steady state conditions A temperature difference between water inlet and outlet of 64 degC is observed after three minutes allowed for stabilisation using a mass flow rate of 000154 kgsec resulting in 41 W of power absorbed by the water To obtain an estimate power striking the copper plate surface heat losses were calculated using the temperature distribution midway in the copper plate and added to the power absorbed by the water The temperature measurements of T10 T15 and T20 show unexpected similar readings with possible reasons due to thermocouple inaccuracies or imprecise machining of the copper plate Heat losses due to convection and radiation amounted to 02 of the power absorbed resulting in an estimate power striking the copper plate surface of 432 W at an irradiance of 9380 Wm2 This corresponds to an efficiency of 24 which is in good agreement with the case 8 numerical efficiency result at optical waveguide inlet of 27
Figure 13 The 6 mm diameter reflective shield positioned at concentrator focus A comparison between experimental and modelled flux for the parameter set of Case 8 is shown in Figure 15 Experimental results show a peak flux level of 1528 kWm2 at an input irradiance of 850 Wm2 corresponding to a concentration of 1798 suns Measured maximum temperature values at concentrator focus approached 1500degC at irradiance levels in the region of 1000 Wm2 Measured flux obtained from the application of successive
discretised filters closely follows predicted flux from the ray tracing exercise Experiments conducted using smaller reflective shields allowing a 2 mm and 1 mm diameter exposure of the copper surface produced inconsistent results possibly due to measurement uncertainties at very low heat transfer rates
Table 4 Experimental measurements and results for a typical experiment using a reflective shield with 6 mm aperture
Difficulties in stabilising the system for very small diameter filter plates (lt 3 mm) resulted in poor resolution near the peaks of both curves in figure 15 This is a shortcoming in the calorimetric method of measuring flux To measure peak flux levels further performance testing using a radiometric device such as a Gardon flux sensor is indicated
Experiment Average irradiance level (Wm2) 9380 Ray trace qin (W) 488 Experimental qin (W) 432 qabs (W) 410 qlout (W) 009
(kgs) 000154 ∆T ( Tout - Tin) (degC) 64 Ts (degC) 692 T in (degC) 270 Tout (degC) 334 Experimental qin normalised to 850 Wm2 (W)
392
Figure 14a Results from a typical experiment showing a water temperature difference of 64 degC
Tin Tout
∆T = 64 degC
Exposed copper surface of 6 mm diameter
T0
T5
T10
T15
T20
T25
Thermal Performance of a High-flux Solar Concentrating System
R amp D Journal of the South African Institution of Mechanical Engineering 2011 27 10-22
httpwwwsaimecheorgza (open access) copy SAIMechE All rights reserved
19
Key results from the first phase experiments include performance at optical waveguide inlet Representative average power and flux levels incident on the cable of 394 W and 1393 Wcm2 respectively were observed over five experiments An injected power into the 900 silica fibres of 335 W is estimated and is used in calculating the transmission efficiency of the cable 532 Optical waveguide exit results Waveguide exit performance results are obtained by directing the cable outlet at the calorimeter as shown in figure 16a Tests were conducted using the same methodology as at concentrator focus but without the reflective shields A shield was positioned at optical waveguide inlet to protect the metal ferrule from stray radiation that may cause damage (figure 16b) The shield restricts energy to the 6 mm diameter quartz glass inlet of the cable At cable outlet a preventative measure of offsetting the cable 5 mm away from the calorimeter centre was taken to avoid reflection of sunlight back on to the fibre bundle
Experimental Theoretical
Figure 15b A magnified view of the 6 mm diameter inlet to the optical waveguide (at 850 Wm2)
Figure 16b Reflective shield at fibre optic cable inlet allowing concentrated solar energy into the 6 mm diameter quartz glass inlet
T5
T0
T25
T10 T15 T20
Figure 14b Results from a typical experiment showing temperature measurements midway in the copper plate
Figure 15a Performance results at concentrator focus showing flux levels striking the 60 mm diameter copper plate (at 850 Wm2)
Vertical displacement
Figure 16a Vertical displacement of the cable outlet prevents damaging back reflection on to the 900 fibres of the cable
Thermal Performance of a High-flux Solar Concentrating System
R amp D Journal of the South African Institution of Mechanical Engineering 2011 27 10-22
httpwwwsaimecheorgza (open access) copy SAIMechE All rights reserved
20
Test results showed an average power of 205 W exiting the cable and striking the copper plate at a vertical displacement of 5 mm corresponding to a flux of 849 Wcm2 in the exit plane of the fibres The results represent normalised values at a direct normal irradiance of 850 Wm2 Transmission efficiency of the fibre optic cable is estimated at 61 using the average power results from the 6 mm diameter reflective shield conducted at concentrator focus A predicted efficiency of 95 was used for the theoretical calculations stipulated by the supplier of the cable A possible reason for the 34 decrease in efficiency is greater losses due to reflection at inlet to the cable The reflective losses at cable inlet result from the sudden change of refractive index from air (n = 10) to fused quartz glass (n = 15) This was not modelled in the ray tracing simulation A possible solution to minimise inlet reflective losses is the design and implementation of a secondary concentrator at cable inlet to boost energy injection into the silica fibres 533 Optical efficiency Final performance results from the first two experimental phases are given in table 5 A predicted efficiency of 22 was obtained using ray tracing methods and a worst case error set Experimental results show an efficiency of 13 with the difference attributed mainly to high reflective losses at inlet to the optical fibres
Table 5 FOCUS experimental performance (data normalised to a direct normal irradiance of 850 Wm2 - average of five tests) 534 Regolith melting capabilities In the final test procedure several melting experiments were performed in which concentrated sunlight was directed at a sample of the lunar regolith simulant JSC-1 This was intended to demonstrate the high surface temperatures and flux levels required to melt lunar regolith for ISRU-related applications such as those reported by Nakamura and Senior7 The experimental procedure includes positioning the optical waveguide onto the JSC-1 surface and measuring the the temperature of the melt zone
formed after a period of six minutes (figure 17a) A downward facing reflective shield was positioned beneath the cable to prevent reflected solar rays from the regolith surface striking the cable The temperature of the regolith simulant was measured using a thermocouple positioned at the centre of the melt zone Figure 17b shows a post-experimental sample of the melted regolith from a typical experiment The vitrified circular melt zone formed after six minutes is 6 mm in diameter with a depth of 25 mm Table 6 summarises the peak melt temperature readings obtained for five separate experiments The stabilisation of temperature within the melt zone is illustrated in figure 18 showing peak values graphed against estimated flux levels Flux levels exiting the cable were estimated using average irradiance levels over the test period and the optical efficiency value of 13 Results show a peak temperature exceeding 1200 K at cable exit flux levels of 104 Wcm2 which exceeds the minimum flux criterion for successful regolith melting by 22 Temperature results achieved can be applied to several high temperature lunar ISRU processes including oxygen production and surface stabilisation Creating larger sintered surfaces for practical human use on the lunar surface is possible by implementing autonomous mechanisms to drive multiple fibre optic cables in a coordinated manner22
Theoretical Experimental
POWin (W) 448 394
FOWin (Wcm2) 1584 1393
Cflux OWin (suns) 18641 16388
POWout (W) 363 205
FOWout (Wcm2) 1505 849
Cflux OWout (suns) 17709 9988
ηoverall 022 013
Ceramic dish containing JSC-1
Downward facing reflective shield
6 mm
Figure 17a Regolith melting experiment with the protective shield (reflector) to prevent cable damage and a thermocouple
Figure 17b Magnified view of the vitrified melt with diameter of 6 mm and depth 25 mm
Thermal Performance of a High-flux Solar Concentrating System
R amp D Journal of the South African Institution of Mechanical Engineering 2011 27 10-22
httpwwwsaimecheorgza (open access) copy SAIMechE All rights reserved
21
6 Conclusion The design fabrication and testing of a composite material ring array concentrator is described for the collection of solar energy and its transmission through a fibre optic bundle The FOCUS system has application in high-temperature research such as material sintering and lunar in-situ resource utilisation The overall transmission efficiency from aperture to bundle outlet was measured at 13 using a flat plate calorimeter Temperatures
exceeding 1450 degC and 900 degC were measured at the concentrator focal point and the outlet of the fibres respectively yielding flux levels of 104 Wcm2 An optical error analysis of the seven reflective elements is described In addition to performance validation this work also provides an alternate approach to conventional methods of collector construction Rather than machining metal profiles for the reflective surface extensive use was made of composite materials resulting in a low-cost light weight point focus concentrator that is 38 lighter than an aluminium equivalent and considerably less expensive Results suggest that further reduction in optical error is possible by limiting reflector curvature in the design stage and adapting the optics to accommodate for structural distortion during curing Acknowledgements The authors appreciate the assistance and support of Professor J Bindon Professor WH Moolman Clinton Bemont Khulisile Kunene Michael Constantino OPTIS Durban University of Technology and the University of Stellenboschrsquos Centre for Renewable and Sustainable Energy Studies (CRSES) This work is supported by the National Research Foundation of South Africa and the Eskom TESP program References 1 Pregger T Graf D Krewitt W Sattler C Roeb M and
Moller S Prospects of solar thermal hydrogen production processes International Journal of Hydrogen Energy 2009 34 4256-4267
2 Kalogirou SA Solar thermal collectors and applications Progress in Energy and Combustion Science 2004 30 231-295
3 Sen Z Solar energy in progress and future research trends Progress in Energy and Combustion Science 2004 30 367-416
4 Vasylyev S and Vasylyev V Nonimaging reflective lenses A new type of high-heat solar collector Proceedings of the Solar World Congress Orlando Florida 2005
Experiment 1 2 3 4 5
Irradiance level (Wm2) 10054 9971 9957 9913 9879 Peak temperature (degC) 9355 9016 8820 8769 8504 Flux level (Wcm2) 1040 1031 1029 1025 1021
Experiment 1
Experiment 2
Experiment 3
Experiment 4
Experiment 5
Figure 18a Time evolution of the melt temperature for five experiments for 6 min showing temperature stabilisation in the melt zone
Table 6 Lunar regolith simulant peak melt temperature and cable exit flux concentration results
Figure 18b Peak melt temperatures versus maximum flux levels exiting the 900 silica fibres
Thermal Performance of a High-flux Solar Concentrating System
R amp D Journal of the South African Institution of Mechanical Engineering 2011 27 10-22
httpwwwsaimecheorgza (open access) copy SAIMechE All rights reserved
22
5 Vasylyev V and Vasylyev S Expected optical
performances of novel type multi-element high-heat solar concentrators Proceedings of the American Solar Energy Society Reno NV 2002
6 Feuermann D Gordon JM and Huleihil M Solar fiber-optic mini-dish concentrators First experimental results and field experience Solar Energy 2002 71 459-472
7 Nakamura T and Senior CL Solar thermal power for lunar materials processing Journal of Aerospace Engineering 2008 21 91-101
8 Ballestriacuten J Estrada CA Rodriacuteguez-Alonso M Peacuterez-Raacutebago C Langley LW and Barnes A Heat flux sensors Calorimeters or radiometers Solar Energy 2006 80 1314-1320
9 Ballestriacuten J A non-water-cooled heat flux measurement system under concentrated solar radiation conditions Solar Energy 2002 73 159-168
10 Estrada CA Jaramillo OA Acosta R and Arancibia-Bulnes CA Heat transfer analysis in a calorimeter for concentrated solar radiation measurements Solar Energy 2007 81 1306-1313
11 Fernandez-Reche J Sanchez M Alonso M Canadas I Chenlo F Rodriguez J and Ballestrin J Concentrating PV An alternative to calorimeters for measuring high solar flux densities Journal of Solar Energy Engineering 2008 130 0445021-0445023
12 Ballestriacuten J Ulmer S Morales A Barnes A Langley LW and Rodriguez M Systematic error in the measurement of very high solar irradiance Solar Energy Materials and Solar Cells 2003 80 375-381
13 Mouzouris M and Brooks MJ Nonimaging solar thermal collector for high temperature terrestrial and space applications Proceedings of SPIE Optics and Photonics San Diego CA 2009
14 Mouzouris M and Brooks MJ Construction of a composite material solar concentrator for high heat flux applications Proceedings of 8th Annual International Energy Conversion Engineering Conference Nashville TN 2010
15 Stine WB and Harrigan RW Solar energy
fundamentals and design with computer applications Wiley Alternate Energy 1985 185-188
16 Kumler JJ and Caldwell JB Measuring surface slope error on precision aspheres Proceedings of SPIE Optics and Photonics 2007
17 Menq C and Chen FL Curve and surface approximation from CMM measurement data Computers ind Engng 1996 30 211-225
18 Arasu VA and Sornakumar T Design manufacture and testing of fiberglass reinforced parabola trough for parabolic trough solar collector Solar Energy 2007 81 1273-1279
19 Johnston G Focal region measurements of the 20 m2 tilted dish at the Australian National University Solar Energy 1998 63 117-124
20 Mouzouris M Roberts LW and Brooks MJ Heat transfer analysis for high-flux solar measurements using a flat plate calorimeter Proceedings of First Postgraduate Renewable Energy Symposium CRSES Stellenbosch RSA 2010
21 Kunene KR Brooks MJ Roberts LW and Zawilska E Introducing GRADRAD The greater Durban radiometric network Proceedings of World Renewable Energy Congress XI Abu Dhabi UAE 2010
22 Nakamura T and Smith BK Solar thermal system for lunar ISRU applications Development and field operation at Mauna Kea HI Proceedings of 48th AIAA Aerospace Sciences Meeting Including the New Horizons Forum and Aerospace Exposition Orlando FL 2011
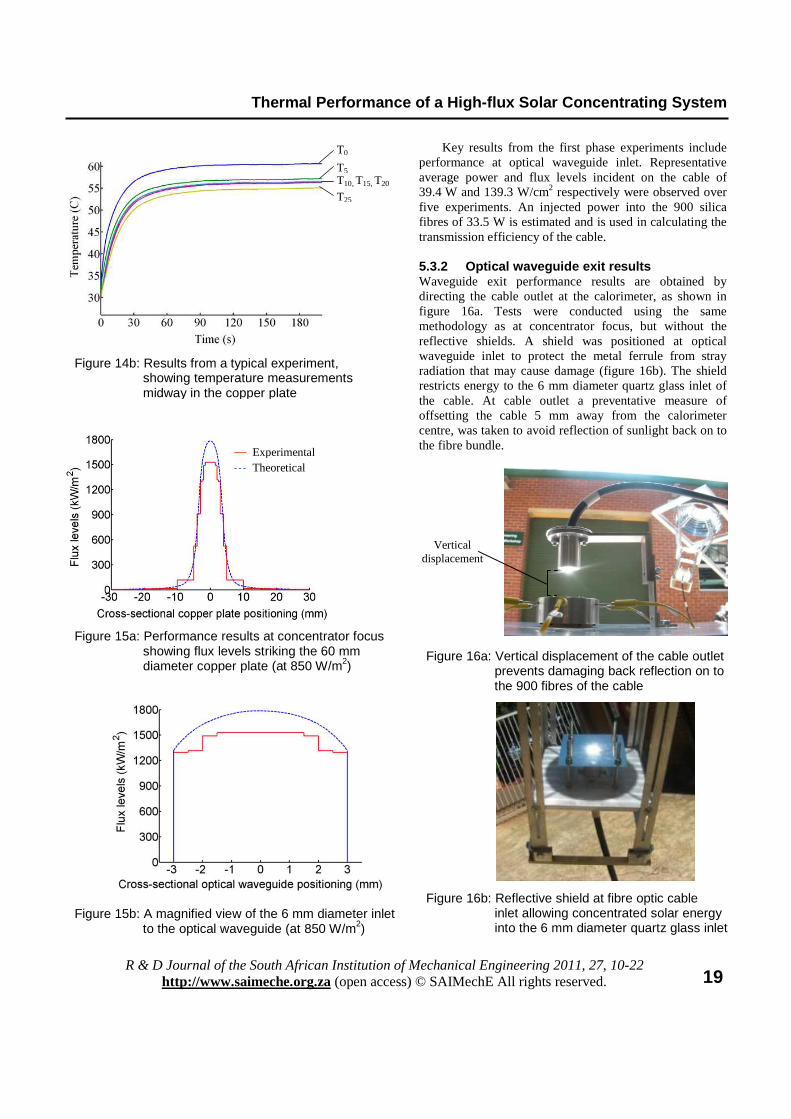
Thermal Performance of a High-flux Solar Concentrating System
R amp D Journal of the South African Institution of Mechanical Engineering 2011 27 10-22
httpwwwsaimecheorgza (open access) copy SAIMechE All rights reserved
20
Test results showed an average power of 205 W exiting the cable and striking the copper plate at a vertical displacement of 5 mm corresponding to a flux of 849 Wcm2 in the exit plane of the fibres The results represent normalised values at a direct normal irradiance of 850 Wm2 Transmission efficiency of the fibre optic cable is estimated at 61 using the average power results from the 6 mm diameter reflective shield conducted at concentrator focus A predicted efficiency of 95 was used for the theoretical calculations stipulated by the supplier of the cable A possible reason for the 34 decrease in efficiency is greater losses due to reflection at inlet to the cable The reflective losses at cable inlet result from the sudden change of refractive index from air (n = 10) to fused quartz glass (n = 15) This was not modelled in the ray tracing simulation A possible solution to minimise inlet reflective losses is the design and implementation of a secondary concentrator at cable inlet to boost energy injection into the silica fibres 533 Optical efficiency Final performance results from the first two experimental phases are given in table 5 A predicted efficiency of 22 was obtained using ray tracing methods and a worst case error set Experimental results show an efficiency of 13 with the difference attributed mainly to high reflective losses at inlet to the optical fibres
Table 5 FOCUS experimental performance (data normalised to a direct normal irradiance of 850 Wm2 - average of five tests) 534 Regolith melting capabilities In the final test procedure several melting experiments were performed in which concentrated sunlight was directed at a sample of the lunar regolith simulant JSC-1 This was intended to demonstrate the high surface temperatures and flux levels required to melt lunar regolith for ISRU-related applications such as those reported by Nakamura and Senior7 The experimental procedure includes positioning the optical waveguide onto the JSC-1 surface and measuring the the temperature of the melt zone
formed after a period of six minutes (figure 17a) A downward facing reflective shield was positioned beneath the cable to prevent reflected solar rays from the regolith surface striking the cable The temperature of the regolith simulant was measured using a thermocouple positioned at the centre of the melt zone Figure 17b shows a post-experimental sample of the melted regolith from a typical experiment The vitrified circular melt zone formed after six minutes is 6 mm in diameter with a depth of 25 mm Table 6 summarises the peak melt temperature readings obtained for five separate experiments The stabilisation of temperature within the melt zone is illustrated in figure 18 showing peak values graphed against estimated flux levels Flux levels exiting the cable were estimated using average irradiance levels over the test period and the optical efficiency value of 13 Results show a peak temperature exceeding 1200 K at cable exit flux levels of 104 Wcm2 which exceeds the minimum flux criterion for successful regolith melting by 22 Temperature results achieved can be applied to several high temperature lunar ISRU processes including oxygen production and surface stabilisation Creating larger sintered surfaces for practical human use on the lunar surface is possible by implementing autonomous mechanisms to drive multiple fibre optic cables in a coordinated manner22
Theoretical Experimental
POWin (W) 448 394
FOWin (Wcm2) 1584 1393
Cflux OWin (suns) 18641 16388
POWout (W) 363 205
FOWout (Wcm2) 1505 849
Cflux OWout (suns) 17709 9988
ηoverall 022 013
Ceramic dish containing JSC-1
Downward facing reflective shield
6 mm
Figure 17a Regolith melting experiment with the protective shield (reflector) to prevent cable damage and a thermocouple
Figure 17b Magnified view of the vitrified melt with diameter of 6 mm and depth 25 mm
Thermal Performance of a High-flux Solar Concentrating System
R amp D Journal of the South African Institution of Mechanical Engineering 2011 27 10-22
httpwwwsaimecheorgza (open access) copy SAIMechE All rights reserved
21
6 Conclusion The design fabrication and testing of a composite material ring array concentrator is described for the collection of solar energy and its transmission through a fibre optic bundle The FOCUS system has application in high-temperature research such as material sintering and lunar in-situ resource utilisation The overall transmission efficiency from aperture to bundle outlet was measured at 13 using a flat plate calorimeter Temperatures
exceeding 1450 degC and 900 degC were measured at the concentrator focal point and the outlet of the fibres respectively yielding flux levels of 104 Wcm2 An optical error analysis of the seven reflective elements is described In addition to performance validation this work also provides an alternate approach to conventional methods of collector construction Rather than machining metal profiles for the reflective surface extensive use was made of composite materials resulting in a low-cost light weight point focus concentrator that is 38 lighter than an aluminium equivalent and considerably less expensive Results suggest that further reduction in optical error is possible by limiting reflector curvature in the design stage and adapting the optics to accommodate for structural distortion during curing Acknowledgements The authors appreciate the assistance and support of Professor J Bindon Professor WH Moolman Clinton Bemont Khulisile Kunene Michael Constantino OPTIS Durban University of Technology and the University of Stellenboschrsquos Centre for Renewable and Sustainable Energy Studies (CRSES) This work is supported by the National Research Foundation of South Africa and the Eskom TESP program References 1 Pregger T Graf D Krewitt W Sattler C Roeb M and
Moller S Prospects of solar thermal hydrogen production processes International Journal of Hydrogen Energy 2009 34 4256-4267
2 Kalogirou SA Solar thermal collectors and applications Progress in Energy and Combustion Science 2004 30 231-295
3 Sen Z Solar energy in progress and future research trends Progress in Energy and Combustion Science 2004 30 367-416
4 Vasylyev S and Vasylyev V Nonimaging reflective lenses A new type of high-heat solar collector Proceedings of the Solar World Congress Orlando Florida 2005
Experiment 1 2 3 4 5
Irradiance level (Wm2) 10054 9971 9957 9913 9879 Peak temperature (degC) 9355 9016 8820 8769 8504 Flux level (Wcm2) 1040 1031 1029 1025 1021
Experiment 1
Experiment 2
Experiment 3
Experiment 4
Experiment 5
Figure 18a Time evolution of the melt temperature for five experiments for 6 min showing temperature stabilisation in the melt zone
Table 6 Lunar regolith simulant peak melt temperature and cable exit flux concentration results
Figure 18b Peak melt temperatures versus maximum flux levels exiting the 900 silica fibres
Thermal Performance of a High-flux Solar Concentrating System
R amp D Journal of the South African Institution of Mechanical Engineering 2011 27 10-22
httpwwwsaimecheorgza (open access) copy SAIMechE All rights reserved
22
5 Vasylyev V and Vasylyev S Expected optical
performances of novel type multi-element high-heat solar concentrators Proceedings of the American Solar Energy Society Reno NV 2002
6 Feuermann D Gordon JM and Huleihil M Solar fiber-optic mini-dish concentrators First experimental results and field experience Solar Energy 2002 71 459-472
7 Nakamura T and Senior CL Solar thermal power for lunar materials processing Journal of Aerospace Engineering 2008 21 91-101
8 Ballestriacuten J Estrada CA Rodriacuteguez-Alonso M Peacuterez-Raacutebago C Langley LW and Barnes A Heat flux sensors Calorimeters or radiometers Solar Energy 2006 80 1314-1320
9 Ballestriacuten J A non-water-cooled heat flux measurement system under concentrated solar radiation conditions Solar Energy 2002 73 159-168
10 Estrada CA Jaramillo OA Acosta R and Arancibia-Bulnes CA Heat transfer analysis in a calorimeter for concentrated solar radiation measurements Solar Energy 2007 81 1306-1313
11 Fernandez-Reche J Sanchez M Alonso M Canadas I Chenlo F Rodriguez J and Ballestrin J Concentrating PV An alternative to calorimeters for measuring high solar flux densities Journal of Solar Energy Engineering 2008 130 0445021-0445023
12 Ballestriacuten J Ulmer S Morales A Barnes A Langley LW and Rodriguez M Systematic error in the measurement of very high solar irradiance Solar Energy Materials and Solar Cells 2003 80 375-381
13 Mouzouris M and Brooks MJ Nonimaging solar thermal collector for high temperature terrestrial and space applications Proceedings of SPIE Optics and Photonics San Diego CA 2009
14 Mouzouris M and Brooks MJ Construction of a composite material solar concentrator for high heat flux applications Proceedings of 8th Annual International Energy Conversion Engineering Conference Nashville TN 2010
15 Stine WB and Harrigan RW Solar energy
fundamentals and design with computer applications Wiley Alternate Energy 1985 185-188
16 Kumler JJ and Caldwell JB Measuring surface slope error on precision aspheres Proceedings of SPIE Optics and Photonics 2007
17 Menq C and Chen FL Curve and surface approximation from CMM measurement data Computers ind Engng 1996 30 211-225
18 Arasu VA and Sornakumar T Design manufacture and testing of fiberglass reinforced parabola trough for parabolic trough solar collector Solar Energy 2007 81 1273-1279
19 Johnston G Focal region measurements of the 20 m2 tilted dish at the Australian National University Solar Energy 1998 63 117-124
20 Mouzouris M Roberts LW and Brooks MJ Heat transfer analysis for high-flux solar measurements using a flat plate calorimeter Proceedings of First Postgraduate Renewable Energy Symposium CRSES Stellenbosch RSA 2010
21 Kunene KR Brooks MJ Roberts LW and Zawilska E Introducing GRADRAD The greater Durban radiometric network Proceedings of World Renewable Energy Congress XI Abu Dhabi UAE 2010
22 Nakamura T and Smith BK Solar thermal system for lunar ISRU applications Development and field operation at Mauna Kea HI Proceedings of 48th AIAA Aerospace Sciences Meeting Including the New Horizons Forum and Aerospace Exposition Orlando FL 2011
Thermal Performance of a High-flux Solar Concentrating System
R amp D Journal of the South African Institution of Mechanical Engineering 2011 27 10-22
httpwwwsaimecheorgza (open access) copy SAIMechE All rights reserved
21
6 Conclusion The design fabrication and testing of a composite material ring array concentrator is described for the collection of solar energy and its transmission through a fibre optic bundle The FOCUS system has application in high-temperature research such as material sintering and lunar in-situ resource utilisation The overall transmission efficiency from aperture to bundle outlet was measured at 13 using a flat plate calorimeter Temperatures
exceeding 1450 degC and 900 degC were measured at the concentrator focal point and the outlet of the fibres respectively yielding flux levels of 104 Wcm2 An optical error analysis of the seven reflective elements is described In addition to performance validation this work also provides an alternate approach to conventional methods of collector construction Rather than machining metal profiles for the reflective surface extensive use was made of composite materials resulting in a low-cost light weight point focus concentrator that is 38 lighter than an aluminium equivalent and considerably less expensive Results suggest that further reduction in optical error is possible by limiting reflector curvature in the design stage and adapting the optics to accommodate for structural distortion during curing Acknowledgements The authors appreciate the assistance and support of Professor J Bindon Professor WH Moolman Clinton Bemont Khulisile Kunene Michael Constantino OPTIS Durban University of Technology and the University of Stellenboschrsquos Centre for Renewable and Sustainable Energy Studies (CRSES) This work is supported by the National Research Foundation of South Africa and the Eskom TESP program References 1 Pregger T Graf D Krewitt W Sattler C Roeb M and
Moller S Prospects of solar thermal hydrogen production processes International Journal of Hydrogen Energy 2009 34 4256-4267
2 Kalogirou SA Solar thermal collectors and applications Progress in Energy and Combustion Science 2004 30 231-295
3 Sen Z Solar energy in progress and future research trends Progress in Energy and Combustion Science 2004 30 367-416
4 Vasylyev S and Vasylyev V Nonimaging reflective lenses A new type of high-heat solar collector Proceedings of the Solar World Congress Orlando Florida 2005
Experiment 1 2 3 4 5
Irradiance level (Wm2) 10054 9971 9957 9913 9879 Peak temperature (degC) 9355 9016 8820 8769 8504 Flux level (Wcm2) 1040 1031 1029 1025 1021
Experiment 1
Experiment 2
Experiment 3
Experiment 4
Experiment 5
Figure 18a Time evolution of the melt temperature for five experiments for 6 min showing temperature stabilisation in the melt zone
Table 6 Lunar regolith simulant peak melt temperature and cable exit flux concentration results
Figure 18b Peak melt temperatures versus maximum flux levels exiting the 900 silica fibres
Thermal Performance of a High-flux Solar Concentrating System
R amp D Journal of the South African Institution of Mechanical Engineering 2011 27 10-22
httpwwwsaimecheorgza (open access) copy SAIMechE All rights reserved
22
5 Vasylyev V and Vasylyev S Expected optical
performances of novel type multi-element high-heat solar concentrators Proceedings of the American Solar Energy Society Reno NV 2002
6 Feuermann D Gordon JM and Huleihil M Solar fiber-optic mini-dish concentrators First experimental results and field experience Solar Energy 2002 71 459-472
7 Nakamura T and Senior CL Solar thermal power for lunar materials processing Journal of Aerospace Engineering 2008 21 91-101
8 Ballestriacuten J Estrada CA Rodriacuteguez-Alonso M Peacuterez-Raacutebago C Langley LW and Barnes A Heat flux sensors Calorimeters or radiometers Solar Energy 2006 80 1314-1320
9 Ballestriacuten J A non-water-cooled heat flux measurement system under concentrated solar radiation conditions Solar Energy 2002 73 159-168
10 Estrada CA Jaramillo OA Acosta R and Arancibia-Bulnes CA Heat transfer analysis in a calorimeter for concentrated solar radiation measurements Solar Energy 2007 81 1306-1313
11 Fernandez-Reche J Sanchez M Alonso M Canadas I Chenlo F Rodriguez J and Ballestrin J Concentrating PV An alternative to calorimeters for measuring high solar flux densities Journal of Solar Energy Engineering 2008 130 0445021-0445023
12 Ballestriacuten J Ulmer S Morales A Barnes A Langley LW and Rodriguez M Systematic error in the measurement of very high solar irradiance Solar Energy Materials and Solar Cells 2003 80 375-381
13 Mouzouris M and Brooks MJ Nonimaging solar thermal collector for high temperature terrestrial and space applications Proceedings of SPIE Optics and Photonics San Diego CA 2009
14 Mouzouris M and Brooks MJ Construction of a composite material solar concentrator for high heat flux applications Proceedings of 8th Annual International Energy Conversion Engineering Conference Nashville TN 2010
15 Stine WB and Harrigan RW Solar energy
fundamentals and design with computer applications Wiley Alternate Energy 1985 185-188
16 Kumler JJ and Caldwell JB Measuring surface slope error on precision aspheres Proceedings of SPIE Optics and Photonics 2007
17 Menq C and Chen FL Curve and surface approximation from CMM measurement data Computers ind Engng 1996 30 211-225
18 Arasu VA and Sornakumar T Design manufacture and testing of fiberglass reinforced parabola trough for parabolic trough solar collector Solar Energy 2007 81 1273-1279
19 Johnston G Focal region measurements of the 20 m2 tilted dish at the Australian National University Solar Energy 1998 63 117-124
20 Mouzouris M Roberts LW and Brooks MJ Heat transfer analysis for high-flux solar measurements using a flat plate calorimeter Proceedings of First Postgraduate Renewable Energy Symposium CRSES Stellenbosch RSA 2010
21 Kunene KR Brooks MJ Roberts LW and Zawilska E Introducing GRADRAD The greater Durban radiometric network Proceedings of World Renewable Energy Congress XI Abu Dhabi UAE 2010
22 Nakamura T and Smith BK Solar thermal system for lunar ISRU applications Development and field operation at Mauna Kea HI Proceedings of 48th AIAA Aerospace Sciences Meeting Including the New Horizons Forum and Aerospace Exposition Orlando FL 2011


![Energetic and exergetic investigation of a parabolic ...voltaics or concentrating power plants, or to thermal energy by solar thermal collectors (flat or concentrating) [5, 6]. Parabolic](https://img.pdfslide.us/doc/110x75/5e2dc6a98dc87f78785d01d9/energetic-and-exergetic-investigation-of-a-parabolic-voltaics-or-concentrating.jpg)


![Numerical Analysis of Heat Transfer Performance of Flat ...jffhmt.avestia.com/2014/PDF/006.pdfSultana et al. [12] investigated the thermal performance of a solar micro-concentrating](https://img.pdfslide.us/doc/110x75/5b2ab8db7f8b9afb378b58e8/numerical-analysis-of-heat-transfer-performance-of-flat-et-al-12-investigated.jpg)