Embed Size (px)
Citation preview
Thermal and Chemical Inactivation of Ricin and Shiga toxins in Orange Juice
A THESIS SUBMITTED TO THE FACULTY OF THE GRADUATE SCHOOL
OF THE UNIVERSITY OF MINNESOTA BY
Na Wang
IN PARTIAL FULFILLMENT OF THE REQUIREMENTS FOR THE DEGREE OF MASTER OF SCIENCE
Advisors: Dr. Francisco Diez-Gonzalez and Dr. Theodore P. Labuza
January 2010

© Na Wang 2010
i
Acknowledgements
I’d like to express my deep and sincere appreciation to my advisors, Dr.
Francisco Diez-Gonzalez and Dr. Theodore Labuza for their wonderful
guidance, advice and patience throughout my entire thesis process. Without
their help and insights, I wouldn’t have been able to find myself in food science
major and attain this degree.
I’d also like to thank my fellow labmates in the Diez lab group and Labuza lab
group for their help during my research and their good humor which made it a
fun and memorable time of my life. I am deeply grateful to the undergraduates
for their help with media preparation, especially Tim Blasius and Neal R.
Fredrickson for their great help with my experiments.
Thanks to the National Center of Food Protection and Defense (NCFPD) for
funding this project.
Special thanks to my masks, gloves and lab coats for protecting me from the
toxic compounds and keeping me safe.
Last, I’d like to acknowledge my father, mother and my husband for their infinite
love and support.

ii
Dedication
This thesis is dedicated to my advisors for their wonderful guidance and my
family for their unconditional love and support.
iii
Abstract
The potential use of ricin and Shiga toxins (Stxs) as bioterror weapons in the
food supply is a major concern for homeland security. Denaturation effects of
thermal and chemical treatments are expected to reduce the toxicity of ricin and
Shiga toxins in water solutions, but their effectiveness and stabilities in food
matrices are largely unknown.
The objective of this project was the identification of heat and chemical
treatments capable of inactivating ricin and Shiga toxins in orange juice so that
large quantities can be safely disposed in the event of an intentional attack.
Diluted ricin was mixed with orange juice for inactivation studies. Thermal
stability was determined in capillary tubes using a water bath at high
temperatures typical of pasteurization. For chemical inactivation, sodium
hypochlorite (NaOCl), sodium hydroxide (NaOH) and peracetic acid (PA) were
added alone or in combination to samples with or without thermal treatment.
The ricin concentration in samples was determined using an ELISA. The
Arrhenius model was used to evaluate temperature dependence.
Enterohemorrhagic Escherichia coli strains were used to produce Shiga toxin 1
(Stx1) and Shiga toxin 2 (Stx2). Shiga toxins were added into phosphate
buffered saline (PBS) or orange juice to study the inactivation effects. The same
inactivation method was also used for heat treatment of Stxs. The concentration
of Stxs was determined by an ELISA and a cytotoxicity assay was conducted to
confirm the inactivation. Kinetics studies were done to evaluate inactivation
parameters.
Heat inactivation of ricin followed first-order kinetics. The half-life (t1/2) of ricin at
72, 80, 85 and 90°C were 72.6, 9.0, 2.0 and 0.5 min, respectively. The Z value
was 8.8°C indicating high temperature sensitivity. When the concentration of
each chemical was increased to a sufficient amount, the detection limit of the
iv
ELISA kit was reached when measuring ricin inactivated within 5 s at room
temperature. A significant synergism between NaOCl and NaOH and
considerable efficacy with treatment with PA alone were observed.
The heat inactivation of Stxs in PBS and orange juice also followed first-order
reaction kinetics. Both Shiga toxins in PBS and orange juice would reach the
concentration that was not detectable with ELISA within 30 s at 90°C and 120 s
at 85°C. The Z values for Stx1 and Stx2 were 6.7 and 7.2°C in PBS as well as
8.7 and 6.9°C in orange juice, respectively.
This study delivered the first series of time/temperature/concentration
conditions that would serve as the basis for recommendations for treating
orange juice subjected to intentional adulteration with ricin or Shiga toxins in an
orange juice plant with typical pasteurization equipment so it can be safely
disposed into the environment.
v
Table of Contents
List of Tables ................................................................................................. viii
List of Figures................................................................................................... x
1 Introduction.......................................................................................... 1
1.1 Bioterrorism and food safety ............................................................... 1
1.2 Toxins used as bioterrorism agents in foods....................................... 1
1.3 Detection of toxins in foods................................................................. 2
1.4 Inactivation of toxins in foods.............................................................. 3
1.5 Research needs.................................................................................. 4
1.6 Hypotheses......................................................................................... 5
1.7 Objectives........................................................................................... 5
2 Literature review .................................................................................. 6
2.1 Ricin overview..................................................................................... 6
2.1.1 Castor bean and castor oil......................................................... 6 2.1.2 Structure and mechanism of action of ricin................................ 6 2.1.3 Use of ricin as a bioterror agent ................................................ 8 2.1.4 Toxicity and clinical features of ricin .......................................... 9 2.1.5 Detection of ricin...................................................................... 11 2.1.6 Inactivation studies of ricin ...................................................... 12
2.2 Shiga toxins ...................................................................................... 16
2.2.1 Shiga toxin classification ......................................................... 16 2.2.2 Structure and mechanism of action of Shiga toxins................. 17 2.2.3 Use of Shiga toxins as bioterror agents................................... 18 2.2.4 Toxicity of Shiga toxins............................................................ 18 2.2.5 Production of Shiga toxins....................................................... 19 2.2.6 Detection methods of Shiga toxins .......................................... 20 2.2.7 Inactivation studies of Shiga toxins ......................................... 21
2.3 Terminology ...................................................................................... 24
vi
2.3.1 High temperature short time (HTST) pasteurization ................ 24 2.3.2 Inactivation kinetics ................................................................. 25 2.3.3 D value .................................................................................... 26 2.3.4 Half life .................................................................................... 28 2.3.5 Activation energy..................................................................... 30 2.3.6 Z value..................................................................................... 33 2.3.7 Q10........................................................................................... 33
2.4 Orange juice ..................................................................................... 34
2.4.1 Orange juice definition............................................................. 34 2.4.2 Orange juice processing.......................................................... 36 2.4.3 Vulnerability of the orange juice processing system................ 36
2.5 Pasteurization processing................................................................. 37
2.6 ELISA ............................................................................................... 38
2.7 EPA regulations ................................................................................ 44
3 Inactivation of ricin ............................................................................ 45
3.1 Materials and methods ..................................................................... 45
3.1.1 Thermal inactivation of ricin..................................................... 45 3.1.2 Chemical inactivation of ricin ................................................... 46 3.1.3 Combined inactivation of ricin.................................................. 47 3.1.4 ELISA test for ricin................................................................... 47 3.1.5 Data analysis........................................................................... 48
3.2 Results.............................................................................................. 49
3.2.1 Establishment of ELISA standard curve .................................. 49 3.2.2 Thermal inactivation results of ricin ......................................... 52 3.2.3 Chemical inactivation results for ricin ...................................... 56 3.2.4 Combined thermal and chemical inactivation of ricin............... 59
3.3 Discussion ........................................................................................ 62
3.3.1 Establishment of a standard curve for evaluation of ricin concentration in orange juice ............................................................. 62 3.3.2 Thermal inactivation of ricin..................................................... 62 3.3.3 Chemical inactivation of ricin ................................................... 66 3.3.4 Combined inactivation of ricin with heat and chemicals .......... 69
vii
4 Inactivation of Shiga toxins .............................................................. 71
4.1 Materials and Methods ..................................................................... 71
4.1.1 Production of Shiga toxins....................................................... 71 4.1.2 Thermal Inactivation of Shiga toxins........................................ 72 4.1.3 ELISA Test for Shiga Toxins ................................................... 73 4.1.4 Cytotoxicity Assay for Shiga Toxins ........................................ 75 4.1.5 Data Analysis .......................................................................... 77
4.2 Results.............................................................................................. 78
4.2.1 Production of Shiga toxins....................................................... 78 4.2.2 Thermal Inactivation ................................................................ 79 4.2.3 Confirmation of thermal inactivation by indirect enzymatic assay 96
4.3 Discussion ...................................................................................... 101
5 References ....................................................................................... 110
6 Appendix .......................................................................................... 116
viii
List of Tables
Table 2-1. Summary of LD50s of ricin through injection, inhalation or ingestion.......................................................................................................................... 10
Table 2-2. Loss of ricin activity after heating for 3 min in different food matrices from He and other (26). .................................................................................... 16
Table 2-3. Examples of calculation results of residual amount of toxin through number of half lives. ......................................................................................... 30
Table 2-4. Examples of calculation results of residual amount of toxin through number of log reduction.................................................................................... 30
Table 2-5. Typical values of activation energy for reactions in foods and drugs (39). .................................................................................................................. 32
Table 3-1. The effect of dilution ratio of juice and buffer on the variability of standards used for detection of ricin in orange juice by ELISA......................... 52
Table 3-2. The effect of temperature on inactivation rates (k) and half life (t1/2) of ricin in orange juice measured in triplicate........................................................ 54
Table 3-3. D, Z and activation energy (Ea) values of thermal inactivation of ricin in orange juice in as measured in triplicate....................................................... 55
Table 3-4. Inactivation of ricin by combinations of NaOH and NaOCl. ............. 59
Table 3-5. Half life (t1/2) of combined inactivation of ricin in orange juice. ........ 61
Table 3-6. Comparison of thermal inactivation parameters of ricin in milk and orange juice...................................................................................................... 64
Table 3-7. Inactivation results of ricin in processed castor bean cake samples (1) . ................................................................................................................... 67
Table 3-8. Complete inactivation of different toxins with a 30 min exposure time to varying concentrations of sodium hypochlorite (NaOCl) and/or sodium hydroxide (NaOH) (49). .................................................................................... 68
Table 4-1. Concentration of Shiga toxins in the supernatant of Escherichia coli O157:H7 cultures after incubation at 37°C overnight. ...................................... 79
ix
Table 4-2. D values, Z value and activation energy (Ea) of thermal inactivation kinetics of Shiga toxin 1 in PBS........................................................................ 82
Table 4-3. D values, Z value and activation energy (Ea) of thermal inactivation kinetics of Shiga toxin 2 in PBS........................................................................ 82
Table 4-4. The effect of temperature on inactivation rates (k) and half life (t1/2) of Shiga toxin 1 in PBS. Results of triplicate runs are shown for each temperature.......................................................................................................................... 86
Table 4-5. The effect of temperature on the inactivation rates (k) and half life (t1/2) of Shiga toxin 2 in PBS. Results of triplicate runs are shown for each temperature. ..................................................................................................... 87
Table 4-6. D values, Z value and activation energy (Ea) for thermal inactivation of Shiga toxin 1 in orange juice. ....................................................................... 90
Table 4-7. D values, Z value and activation energy (Ea) for thermal inactivation of Shiga toxin 2 in orange juice. ....................................................................... 91
Table 4-8. The effect of temperature on inactivation rates (k) and half life (t1/2) of Shiga toxin 1 in orange juice. Results of replicates are shown for each temperature. ..................................................................................................... 94
Table 4-9. The effect of temperature on inactivation rates (k) and half life (t1/2) of Shiga toxin 2 in orange juice. Results of replicates are shown for each temperature. ..................................................................................................... 95
Table 4-10. ANOVA table for the inactivation of Shiga toxins in orange juice. . 96
Table 4-11. Number of D values accomplished within standard processing time under HTST temperatures.............................................................................. 103
Table 4-12. Comparison of inactivation rates (k) of Shiga toxins in PBS and juice. ............................................................................................................... 104
Table 4-13. Hypothetical amount of toxins in a 7,000 gal silo of orange juice lethal to half of the children that would drink the product, assuming 20 kg children with one serving of orange juice........................................................ 107
x
List of Figures
Figure 2-1. Illustration that depicts the mode of the toxic action of ricin toxin. Reprinted with permission from Pommerville, 2003 (54). ................................... 7
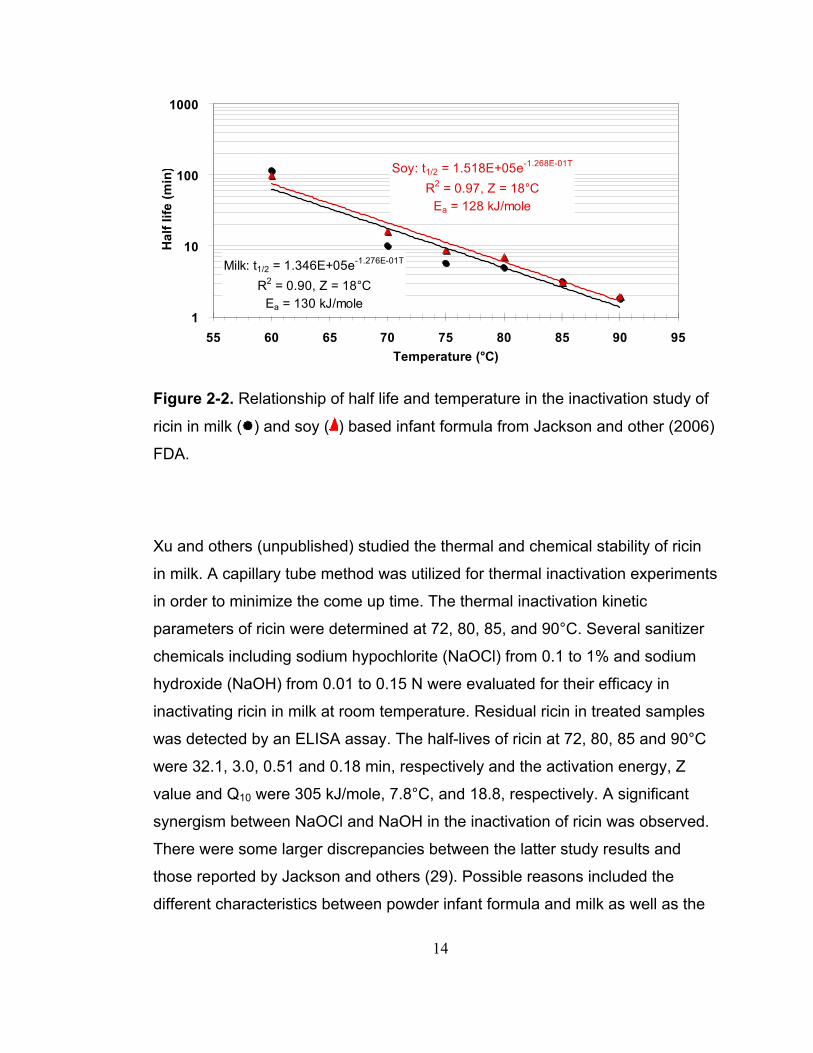
Figure 2-2. Relationship of half life and temperature in the inactivation study of ricin in milk ( ) and soy ( ) based infant formula from Jackson and other (2006) FDA. ................................................................................................................. 14
Figure 2-3. Schematic structure of protein toxins and difference between ricin and Shiga toxin (65). Reprinted by permission from Sadvig, 2000................... 18
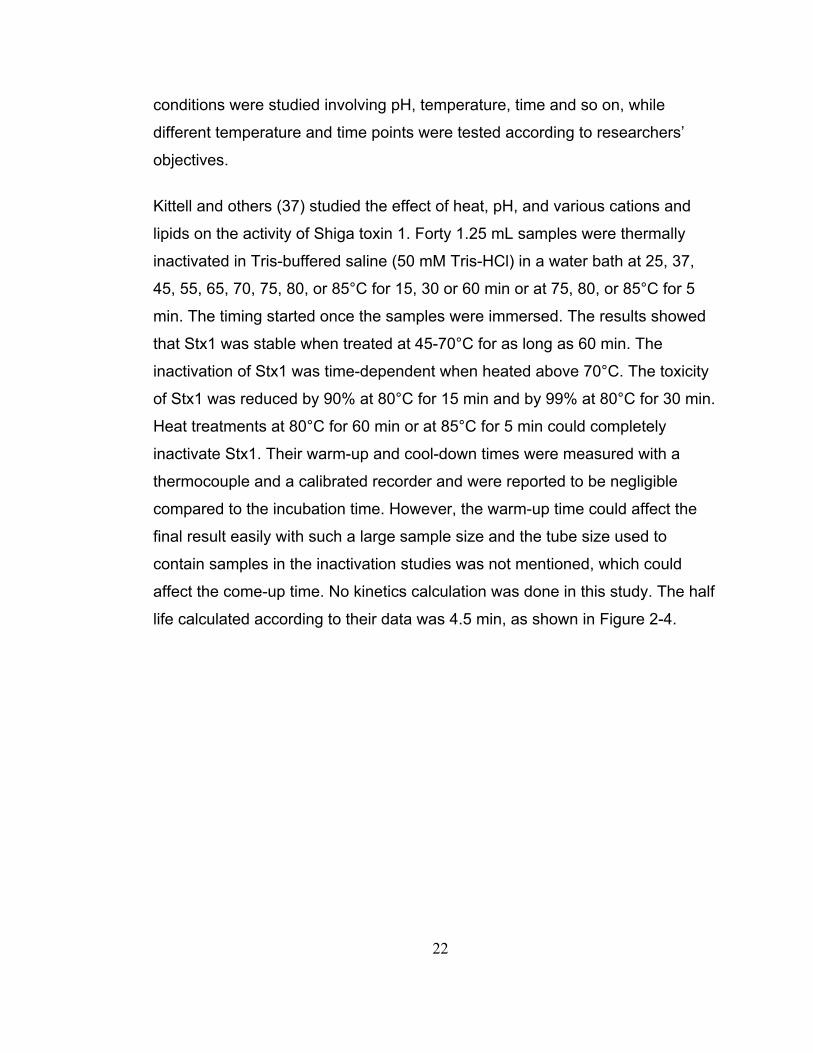
Figure 2-4. Inactivation of Shiga toxin 1 in buffer at 80°C from Kittell and others (37). .................................................................................................................. 23
Figure 2-5. Theoretical inactivation curve for calculation of D value................ 27
Figure 2-6. Hypothetical Arrhenius plot of the reaction rate constant k versus the inverse of absolute temperature 1/T. .......................................................... 32
Figure 2-7. Cartoon depicting the principle of a direct ELISA method. ............ 39
Figure 2-8. Illustration of the principle of an indirect ELISA method. ............... 40
Figure 2-9. Cartoon that illustrates the principle of a direct sandwich ELISA method. ............................................................................................................ 41
Figure 2-10. Illustration that depicts the principle of an indirect sandwich ELISA method. ............................................................................................................ 42
Figure 2-11. Cartoon that depicts the principle of a competitive ELISA method.......................................................................................................................... 43
Figure 3-1. Illustration of the protocol steps for toxin inactivation studies. ....... 46
Figure 3-2. Example of a quality control standard curve included in an ELISA kit insert for ricin by the manufacturer. .................................................................. 50
Figure 3-3. Standard curves plots from four different ELISA plates for ricin detection. Note that each symbol represents the results for the standardization of different 96 well plates.................................................................................. 50
xi
Figure 3-4. A representative ELISA standard curve of ricin in orange juice..... 51
Figure 3-5. The effect of temperature on inactivation of ricin in orange juice at 72°C ( ), 80°C ( ), 85°C ( ), and 90°C ( ). ................................................... 53
Figure 3-6. Arrhenius plots of inactivation of ricin in orange juice used to determine activation energy (Ea). ..................................................................... 55
Figure 3-7. Chemical inactivation effects of ricin in orange juice by different concentrations of NaOH at room temperature without any incubation time...... 57
Figure 3-8. Chemical inactivation effects of ricin in orange juice by different concentrations of NaOCl at room temperature without any incubation time. .... 57
Figure 3-9. Chemical inactivation effects of ricin in orange juice by different concentrations of PA at room temperature without any incubation time........... 58
Figure 3-10. Inactivation of ricin in orange juice at 72°C by addition of NaOH and NaOCl. Mixtures included ricin-containing orange juice without chemical addition ( ), with 0.2% NaOCl/0.15 N NaOH ( ), and with 0.2% NaOCl/0.2 N NaOH ( ).......................................................................................................... 60
Figure 3-11. The effect of peracetic acid (PA) on inactivation of ricin in orange juice at 72 and 80°C. Mixtures included ricin containing orange juice alone at 72°C ( ), 0.032% at 72°C ( ), 0.064% at 72°C ( ), and 0.032% at 80°C ( ). 60
Figure 4-1. Steps of ELISA method to determine Shiga toxins........................ 74
Figure 4-2. Steps of LDH assay for detection of Shiga toxins.......................... 77
Figure 4-3. A representative ELISA standard curve of Shiga toxins in PBS. ... 80
Figure 4-4. The effect of temperature on inactivation of Shiga toxin 1 (A) and Shiga toxin 2 (B) in PBS at 72°C ( ), 80°C ( ), 85°C ( ), and 90°C ( ). ........ 81
Figure 4-5. Relationship of D values of Shiga toxin 1 (A) and Shiga toxin 2 (B) with temperature when toxin preparations were suspended in PBS................. 83
Figure 4-6. Arrhenius plots for inactivation of Shiga toxin 1 (A) and Shiga toxin 2 (B) in PBS used to determine activation energy (Ea). .................................... 84
Figure 4-7. A representative ELISA standard curve of Shiga toxins in orange juice. ................................................................................................................. 88
xii
Figure 4-8. The effect of temperature on inactivation of Shiga toxin 1 (A) and Shiga toxin 2 (B) in orange juice at 72°C ( ), 80°C ( ), 85°C ( ), and 90°C ( ).......................................................................................................................... 89
Figure 4-9. Relationship of D values of Shiga toxin 1 (A) and Shiga toxin 2 (B) with temperature when toxin preparations were suspended in orange juice. ... 92
Figure 4-10. Arrhenius plots for inactivation of Shiga toxin 1 (A) and Shiga toxin 2 (B) in orange juice used to determine activation energy (Ea)......................... 93
Figure 4-11. Effect of concentration of Vero cells on the amount of lactate dehydrogenase (LDH) released after overnight incubation measured by the change in absorbance (OD) at 490 nm using a commercial LDH assay. ......... 97
Figure 4-12. Comparison of incubation condition for Vero cells based on the release of lactate dehydrogenase (LDH) as measured by LDH assay at 2 (a), 6 (b) and 24 h (c). Incubation conditions: A, control standard CO2 incubator ( ), B, tight CO2 container in air incubator ( ), C, CO2 -flushed container in air incubator ( ), and D, plain air incubator ( )...................................................... 99
Figure 4-13. Inactivation of Shiga toxins in PBS as indicated by the release of lactate dehydrogenase measured by an LDH assay. Inactivation condition: 80°C for 5 h (A), 85°C for 4 h (B) and 90°C for 2 h (C)................................... 100
Figure 4-14. Comparison of temperature dependence for safe inactivation time (10 half lives) for Bacillus anthracis spores ( ) (78), ricin in milk ( ) (Xu and others, unpublished), botulism toxin (BT) (76) in canned corn (○) (pH 6.2) and phosphate buffer ( ) (pH 6.8), ricin in orange juice ( ) and Shiga toxin in orange juice ( ).......................................................................................................... 108
1
1 Introduction
1.1 Bioterrorism and food safety
After the events of September 11, 2001, terrorism became a major concern for
homeland security. The goal of terrorists is to attack specific targets resulting in
consequences such as chaos, death and economic loss. The food industry
which includes the food supply chain starting from producers and a large
number of transportation, processing and distribution facilities is vulnerable due
to weaknesses related to security, monitoring and tracking. Since all societies
are dependent on a stable food supply, the potential for the food system to be a
target of terrorists is a top priority issue. Food terrorism was defined by the
World Health Organization (WHO) as “an act or threat of deliberate
contamination of food for human consumption with chemical, biological or
radionuclear agents for the purpose of causing injury or death to civilian
populations and/or disrupting social, economic, or political stability” (73).
There are many instances in history where the food supply has been sabotaged
deliberately. Some of these attacks have included industrial chemicals as well
as biological agents. Among those agents, biological toxins such as ricin and
abrin, if used in a terrorist act, would have relatively severe consequences.
1.2 Toxins used as bioterrorism agents in foods
Biological materials and chemicals that cause acute effects on health are the
most likely candidates for intentional food contamination. Biological toxins such
as ricin, T-2 toxin and Shiga toxins may be used as bioterrorism weapons to
attack the food system. Symptoms of intoxication with any of these toxins
2
develop rather quickly and can be life threatening. In addition to their relatively
high toxicity, some of these toxins are fairly easy to produce.
The current food industry, especially the liquid food (milk /juice) production and
processing systems are particularly susceptible to deliberate sabotage (35, 72).
The toxins could be purposely released at different points in the production
chain, such as a holding tank at a farm, a tanker truck transporting milk, or a
raw milk silo at the processing facility (72). The centralized storage and
processing followed by rapid distribution and consumption of liquid foods would
result in several thousands of poisoned individuals in a deliberate toxin attack.
Intentional contamination of food may also cause enormous economic loss and
trade disruption, by targeting a product, a manufacturer, an industry or a
country (72).
1.3 Detection of toxins in foods
In order to detect toxins such as ricin or Shiga toxins, sensitive, accurate and
robust assays that can provide critical information are crucial to the prevention
and defense against food contamination. There are many types of detection
methods and the most common methods used to detect such protein based
toxins include cell culture assay, immunochemical assay and mass
spectrometry. Several studies (26, 31) have shown generally, that most of the
detection methods can’t discriminate between inactive and active toxins and
only several detection methods are able to differentiate inactive and active
toxins.
Kalb and Barr (2009) reported a mass spectrometric detection method for ricin
and its activity in food samples, with enhanced selectivity and specificity for
ricin. It combines three analytical methods: (1) immunoaffinity capture of the
ricin protein; (2) examination of the activity of the ricin protein using a DNA
3
substrate that mimics the toxin’s natural RNA target; and (3) analysis of the
tryptic digestion fragments of the toxin itself. Babu and others (2008) studied
flow cytometry in an apoptosis assay to determine the stability of Shiga toxin 1
and confirmed that this approach is able to provide rapid and high throughput
when detecting the activity of Shiga toxin 1 (4). Commercial products such as
enzyme linked immunosorbent assays (ELISA) from Tetracore Inc. or Meridian
Bioscience, and the cytotoxicity lactate dehydrogenase (LDH) detection kit from
Roche Applied Science can be used to detect toxins.
1.4 Inactivation of toxins in foods
There is very limited information about the stability of toxins in foods. Previous
research indicated that ricin could be detoxified by thermal treatment during the
processing of castor bean. Ricin in flaked castor bean was detoxified at 100-
102°C when held for 12 to 15 min (25). Heating castor bean meal for 1 h in
steam (~121°C) at 15 psi also inactivated ricin (30). However, the thermal
inactivation of ricin added to foods has been largely ignored. Only very recently,
researchers at the FDA reported that ricin retained half of its toxicity after
heating for 2 min at 90°C in liquid infant formula (29).
Shiga toxins (Stx) and Shiga-like toxins (Stx1 and Stx2) are a relatively large
group of cytotoxins produced by certain serotypes of Shigella and Shiga-toxin
producing Escherichia coli (STEC). These toxins are robust, stable, and
relatively easy to manufacture and have been the subject of intense research
for the last 25 years. Kittell and others (1991) reported the inactivation of
verotoxin 1 (Stx1) produced by E. coli O157:H7. Stx1 toxicity was stable at
70°C for 60 min, but was reduced by 90% at 80°C for 15 min and 99% at 80°C
for 30 min. Verocytoxicity was completely lost at 80°C for 60 min and at 85°C
for at least 5 min. Both temperature and pH played an important role on the loss
of toxicity. Stability of Shiga-like toxin 1 in fruit punch was studied (4). The
4
inactivation was achieved with the combination of acidic pH and higher storage
temperature (20°C). However, no detailed data were presented about the heat
resistance of the toxin.
It should be noted that most of the above data were not produced in food
matrices. Due to the complexity of food composition, the inactivation conditions
cannot be extrapolated from one system to other food matrices. Thermal
susceptibility of toxins can be affected by pH, initial concentration, and food
constituents of the specific product. One goal of the Agents group of the
National Center for Food Protection and Defense (NCFPD) is to come up with
rapid (<30 min) assays for toxins as well as to determine for liquid foods like
milk and juice, parameters for heat and chemical inactivation, so if a silo (5,000
to 60,000 gallons) was sabotaged, the processor could effectively reduce the
level of toxin such that the liquid food could be disposed according to
Environmental Protection Agency (EPA) requirements.
1.5 Research needs
It is important to understand how to inactivate toxins and characterize the
thermal and chemical stability of biological toxins, particularly in typical food
environments and processing conditions to assess the potential impact of food
processes on toxin activity and to identify effective toxin inactivation protocols. It
is also critical to develop effective intervention methods that could be used in
the event of a deliberate terrorists attack to mitigate the public health impact
and serve in decontamination and disposal responses.
5
1.6 Hypotheses
The null hypotheses for this research are as follows:
1) Heat treatment at high temperature short time (HTST) pasteurization
temperatures for processing of orange juice does not inactivate ricin and Shiga
toxins.
2) Combinations of heat treatment and chemical compounds treatment do not
cause the inactivation of ricin and Shiga toxins in orange juice.
1.7 Objectives
To address these hypotheses, the objectives of this research are as follows:
1) Characterize the thermal stability of ricin and Shiga toxins at HTST
pasteurization temperatures in orange juice.
2). Determine the detoxifying time/temperature/concentration conditions of heat
combined with sanitizing compounds against the same toxins in orange juice.
6
2 Literature review
2.1 Ricin overview
2.1.1 Castor bean and castor oil
Castor beans are the seeds of the castor oil plant, Ricinus communis, a
flowering plant. Ricin is present in the seed coat. Approximately 50% of the
weight of the castor seeds is castor oil. It is valued for a number of industrial
and medicinal applications such as lubricants, plastics, wax, and transparent
soaps in industry or as a laxative, purgative and cathartic in medicinal
applications (3). After the oil is extracted from the seeds, the remaining part is
called seed cake which could be used as fertilizer or animal feed after careful
boiling or heating to inactivate any remaining toxins including ricin. Ricin
naturally protects the castor plant from insect pests. The production of castor
beans exceeds one billion pounds annually worldwide for these applications
and the waste mash contains 5-10% of ricin (75). The readily availability of ricin
from the seed cake makes it a potential concern as an easily obtainable
biological weapon.
2.1.2 Structure and mechanism of action of ricin
The structure and mechanism of action of ricin have been extensively
characterized (11, 17, 19). Ricin is a globular protein (66 kDa) which is
comprised of two chains, A and B, linked by a disulfide bond. The A chain (32
kDa), a N-glycosidase, is able to irreversibly inactivate eukaryotic ribosomes
through release of a single adenine residue from the 28S ribosomal RNA loop
contained within the 60S subunit and therefore inhibits protein synthesis (3).
The B chain (34 kDa), a lectin, is able to bind to galactose-containing
7
glycoproteins and glycolipids expressed on the surface of cells and then
facilitate the entry of ricin into the cytosol. Ricin is first taken up and contained
in an endosome, and then it could be digested in lysosomes. Most likely, it
could pass through the endomembrane compartments and the A chain is
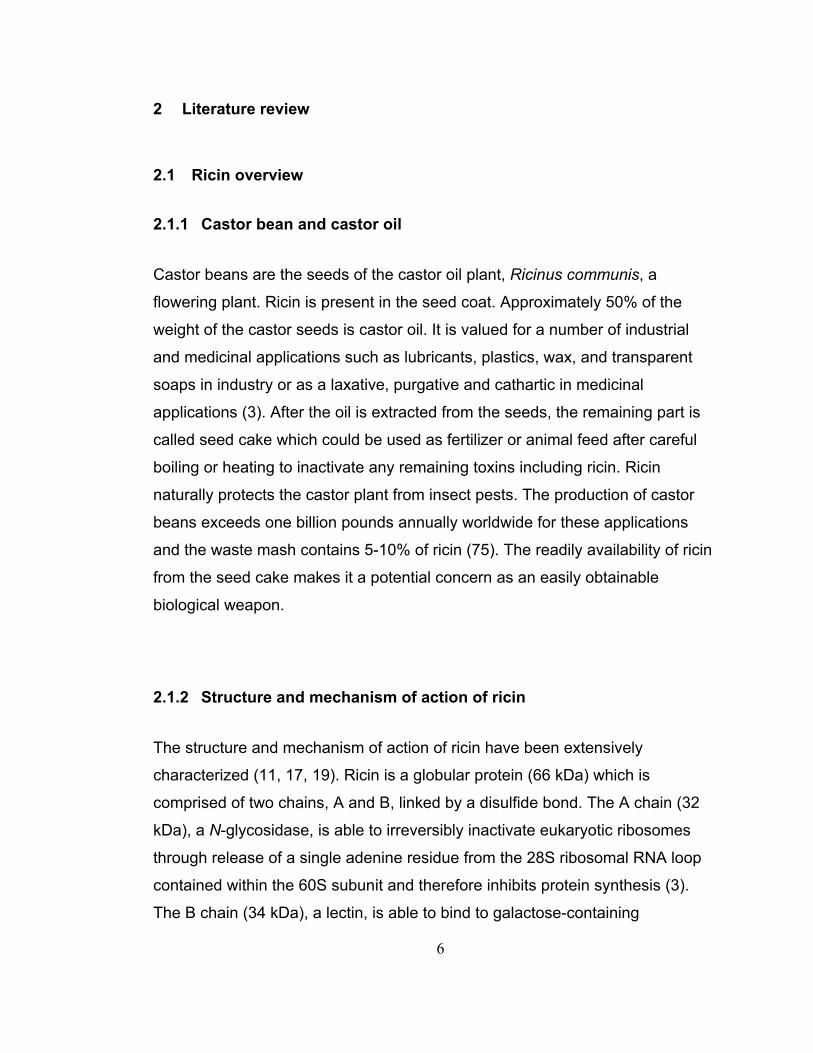
removed into the cytosol. Then the A chain enzymatically cleaves a specific
adenine residue and as a result, protein synthesis is inhibited and the cells die
eventually, as shown in Figure 2-1.
Figure 2-1. Illustration that depicts the mode of the toxic action of ricin toxin.
Reprinted with permission from Pommerville, 2003 (54).
8
The ricin A chain inhibits protein synthesis only when it is internalized into the
cytosol with the help of the ricin B chain. If these two subunits are separate, the
ricin A chain is not able to penetrate the membrane and would not inhibit protein
synthesis (28). However, when they are linked together or even the two
separate subunits are mixed together, they can reassociate covalently to form
toxic ricin (15).
2.1.3 Use of ricin as a bioterror agent
In recent years, ricin was involved in a number of cases as an agent of terror.
As early as 1978, the Bulgarian dissident Georgi Markov was assassinated in
Great Britain by an embedded pellet containing ricin in the tip of an umbrella
used to puncture Georgi in the foot releasing the pellet into his blood stream. In
2003 and 2004, a letter containing ricin and sealed in a “ricin-contaminated”
envelope addressed to the White House was discovered and intercepted in a
South Carolina mail sorting facility (7). In 2008 and 2009, ricin was found in a
hotel room in Las Vegas and a suburban home in Washington.
Beyond the cases of ricin as a bioterrorism weapon in envelopes and facilities,
it has also been detected in food. In 2004, ground-up castor beans which were
far less toxic than purified ricin were found in two jars of Gerber banana yogurt
dessert sold in a supermarket. The parents of the two families found notes in
the jars after they fed their babies warning that the jars were contaminated but
the babies were not harmed. The Gerber Products Company stated that the
product tampering did not occur at its facilities. Nonetheless, Gerber’s products
were removed from all southern California grocery and drug stores. The FDA
recommended people to check food packages for any signs of tampering (53).
These events had reinforced the concerns regarding the use of ricin for mass
urban terror, especially in food systems.
9
2.1.4 Toxicity and clinical features of ricin
The physical state of ricin determines the route of exposure in humans. Since
castor beans are the source of ricin, ricin can be made either in the form of a
crude extract, in a purified form as ricin crystals, a powder or dissolved in
solvents. The exposure for humans is possible through injection, inhalation or
ingestion. The route of exposure determines toxicity and mortality.
A few publications have focused on human exposure to ricin via injection. The
LD50 (lethal dose) value of crude ricin was reported as 0.2 µg (8 µg/kg) in mice
by intraperitoneal injection in 1973 (51). The LD50 in mice was reported as
approximately 5 to 10 µg/kg body weight through injection (3) while the
intravenous LD50 in mice was from 55 to 65 ng/kg (75), i.e. the latter being 1000
times more lethal. The symptoms start after ~20 h and the tissue at the injection
site could be damaged. Ricin toxic effects on the body can be characterized by
laboratory tests which include elevated liver transaminases, amylase, and
creatinine kinase, hyperbilirubinemia, myoglobinuria, and renal insufficiency.
Only a few studies have reported toxicity of ricin by human inhalation. The
inhalation LD50 in mice was reported at 3 to 5 µg/kg (3) or 4 to 6 mg/min/kg (75).
The particle size of ricin significantly affects the lethality after ricin inhalation.
Smaller particles tend to deposit deeper in the respiratory tract which leads to
higher death rate, while larger particles often deposit on the surface and could
be swept up by physiological activities in the respiratory tract after inhalation.
Symptoms include airway inflammation, rhinitis, and ocular irritation.
No literature has been found indicating human lethality from ingestion of purified
ricin. Almost all reported human cases are associated with ingestion of whole or
ground castor beans. The physicochemical characteristics of ricin make it easy
to be dissolved in food or drink available for ingestion. The median oral lethal
dose (LD50) in mice was reported as 30 mg/kg which is ~1,000 times more than
the lethal dose found through injection or inhalation. LD50 was also reported as
10
3~5 µg/kg in mice (34, 69, 77), however, we could not obtain the original
references. The lethal oral dose in humans was 1 to 20 mg/kg body weight,
estimated from consumption of 8 castor beans (6, 75). The minimum number of
castor beans associated with an adult human death was 2 and symptoms from
mild condition to lethality were mainly reported in the range of one half to 30
castor beans in human (3). Symptoms usually started within 4 to 10 h after
ingestion. The symptoms include abdominal pain, vomiting, diarrhea, heartburn,
and oropharyngeal pain. A summary of LD50s through different routes of
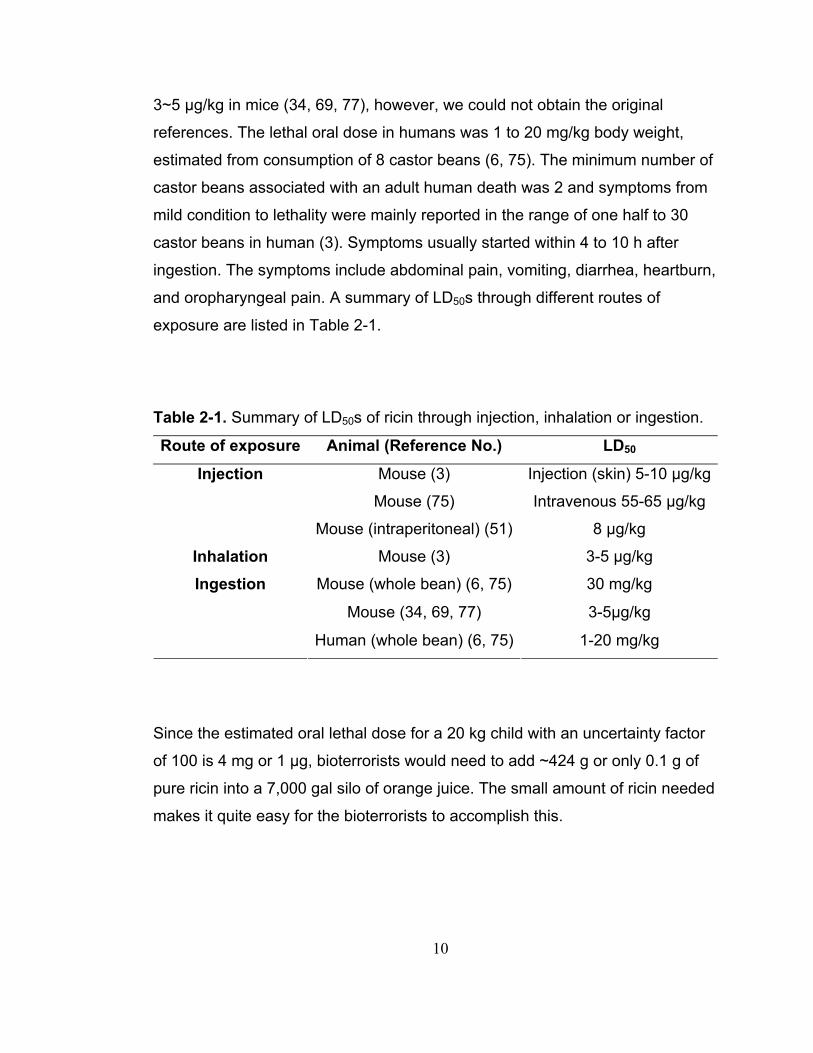
exposure are listed in Table 2-1.
Table 2-1. Summary of LD50s of ricin through injection, inhalation or ingestion.
Route of exposure Animal (Reference No.) LD50
Mouse (3) Injection (skin) 5-10 µg/kgInjection Mouse (75) Intravenous 55-65 µg/kg
Mouse (intraperitoneal) (51) 8 µg/kg
Inhalation Mouse (3) 3-5 µg/kg
Mouse (whole bean) (6, 75) 30 mg/kg
Mouse (34, 69, 77) 3-5µg/kg
Ingestion
Human (whole bean) (6, 75) 1-20 mg/kg
Since the estimated oral lethal dose for a 20 kg child with an uncertainty factor
of 100 is 4 mg or 1 μg, bioterrorists would need to add ~424 g or only 0.1 g of
pure ricin into a 7,000 gal silo of orange juice. The small amount of ricin needed
makes it quite easy for the bioterrorists to accomplish this.
11
2.1.5 Detection of ricin
Detection of ricin and monitoring of decontamination of ricin released to the
environment are big concerns and developing suitable, reliable and rapid
methods therefore becomes extremely important. There are different
technologies for quantifying ricin and the most promising ones include mass
spectrometry, cell culture assays, and immunochemical assays. Each assay
has its advantages and disadvantages that the researchers should consider
when choosing a suitable method according to their needs.
Kalb and Barr (31) reported a mass spectrometric detection method for ricin
and its activity in food samples. It combines three analytical methods:
immunoaffinity capture, examination of the activity of the ricin protein using a
DNA substrate and analysis of the tryptic fragments of the toxin itself. Mass
spectrometry is a very sensitive and selective measurement which can detect at
very low levels. However, the measurement needs expensive equipment, highly
trained people and thus can’t be used as a screening method in the field, for
example at the point of unloading a tanker truck into a silo at a processing plant.
Cell cytotoxicity assays are used to evaluate and differentiate active and
inactive toxins. Cole and others (12) investigated the disinfection effect of
bleach and monochloramine through measuring the effect on mammalian cell
cytotoxicity. The ricin cytotoxicity assay is very sensitive because it measures
the enzymatic activity of ricin. However, the measurement of cytotoxicity needs
cultivation of mammalian cells with specialized expertise, and any
contamination in sample preparation could ruin the whole experiment.
The use of enzyme-linked immunosorbent assay (ELISA) methods for ricin
detection has been reported by several researchers. Two recent studies applied
ELISA methods to detect residual ricin in a food matrix (24, 29). ELISA is a
relatively sensitive and selective measurement for ricin that could be completed
within hours. Nonetheless, the cross-reaction and large variance in results are
12
great limitations of ELISA. Besides, since ELISA protocols are typically based
on the immunogenic relationship between antigen (toxin) and antibody, it is not
able to reveal the toxic activity of toxins. To address this limitation, Jackson and
others (29) correlated the results of ELISA and cell cytotoxicity assays and
found a high degree of correspondence, which supported the idea of using
ELISA to determine active ricin.
2.1.6 Inactivation studies of ricin
There are few publications on the inactivation of pure ricin but some on the
inactivation of whole or flaked castor seeds or castor bean meal. Okorie and
Anugwa (50) observed that ricin in castor oil bean seeds prepared for a
commercial chicken feed diet couldn’t be destroyed by steaming at 80°C for 40
min but activated instead. Steaming for 60 min partially inactivated the ricin and
roasting at 140°C for 20 to 30 min was sufficient to destroy ricin. Jenkins (30)
reviewed the studies of the inactivation of the toxic components of castor bean
meal. That review included autoclaving castor meal at 15 p.s.i. for 30 min,
boiling castor cake with saline and heating castor meal at 140°C for 60 to 90
min or heating at 125°C for 15 min. The author concluded that all of those
treatments were enough to make animal feed safe to consume by animals.
Since 1963, however, very little research on the inactivation of pure ricin or ricin
in food matrices had been published.
In one of the recent reports, researchers at the FDA investigated the thermal
stability of ricin in different infant formulas (29). This was the first study that
determined the half life (time for a toxin to be inactivated by half), activation
energy (the threshold or energy barrier that must be overcome or surpassed to
permit the transformation of reactants into products) and Z value (change in
temperature that accompanies a 10-fold change in D value) parameters of
heating ricin in a food matrix. Reconstituted infant formula powders containing
13
100 μg/mL (27 mg per 8 oz serving) of ricin were heated at 60, 70, 75, 80, 85
and 90°C for up to 5 h in glass test tubes in a block heater. Tubes were
removed at different time intervals from the block heater and cooled in an ice
bath. Calibrated thermocouples were utilized to monitor the come up time (less
than 2 min). However, the come up time wasn’t subtracted from the final
heating time which would affect the kinetics parameters. The treated samples
were then quantified using an ELISA kit and a cytotoxicity assay. Their results
showed that ricin inactivation in infant formula at 60 to 90°C could be modeled
based on first-order kinetics and the toxicity of ricin decreased with the
increasing heating times and temperatures.
According to Jackson and others (29), the half lives of ricin cytotoxic activity in a
milk-based infant formula at 60, 70, 75, 80, 85 and 90°C were >100, 9.8, 5.8,
5.1, 3.1 and 1.8 min, respectively, while the values for a soy-based infant
formula were >100, 16, 8.7, 6.9, 3.0 and 2.0 min. The activation energy was 92
kJ/mole and Z values for ricin inactivation were 25°C in both formulas.
However, when the data was recalculated, the activation energy was 130 and
128 kJ/mole in milk and in soy based infant formulas, respectively, and the Z
values were both 18°C, as shown in Figure 2-2. This was convincing evidence
indicating that conventional pasteurization processing (63°C for 30 min, 72°C
for 15 s, 89°C for 1.0 s and 90°C for 0.5 s) would not be sufficient to ensure
complete inactivation of ricin present in infant formulas. Based on the prior
calculation, one would need 10 × 1.8 min or a process time of 18 min at 90°C to
achieve the needed 10 half lives. For a 4 kg infant, this would need to be
inactivated for >150 min at 90°C for both soy and milk based formulas. Very
importantly, this study showed that the OD value for the heat treated ricin
obtained from the ELISA method could give a good estimation of the amount of
residual toxicity of ricin from the cytotoxicity test.
14
Milk: t1/2 = 1.346E+05e-1.276E-01T
R2 = 0.90, Z = 18°CEa = 130 kJ/mole
Soy: t1/2 = 1.518E+05e-1.268E-01T
R2 = 0.97, Z = 18°CEa = 128 kJ/mole
1
10
100
1000
55 60 65 70 75 80 85 90 95Temperature (°C)
Hal
f life
(min
)
Figure 2-2. Relationship of half life and temperature in the inactivation study of
ricin in milk ( ) and soy ( ) based infant formula from Jackson and other (2006)
FDA.
Xu and others (unpublished) studied the thermal and chemical stability of ricin
in milk. A capillary tube method was utilized for thermal inactivation experiments
in order to minimize the come up time. The thermal inactivation kinetic
parameters of ricin were determined at 72, 80, 85, and 90°C. Several sanitizer
chemicals including sodium hypochlorite (NaOCl) from 0.1 to 1% and sodium
hydroxide (NaOH) from 0.01 to 0.15 N were evaluated for their efficacy in
inactivating ricin in milk at room temperature. Residual ricin in treated samples
was detected by an ELISA assay. The half-lives of ricin at 72, 80, 85 and 90°C
were 32.1, 3.0, 0.51 and 0.18 min, respectively and the activation energy, Z
value and Q10 were 305 kJ/mole, 7.8°C, and 18.8, respectively. A significant
synergism between NaOCl and NaOH in the inactivation of ricin was observed.
There were some larger discrepancies between the latter study results and
those reported by Jackson and others (29). Possible reasons included the
different characteristics between powder infant formula and milk as well as the
15
different inactivation methods, especially the come up time.
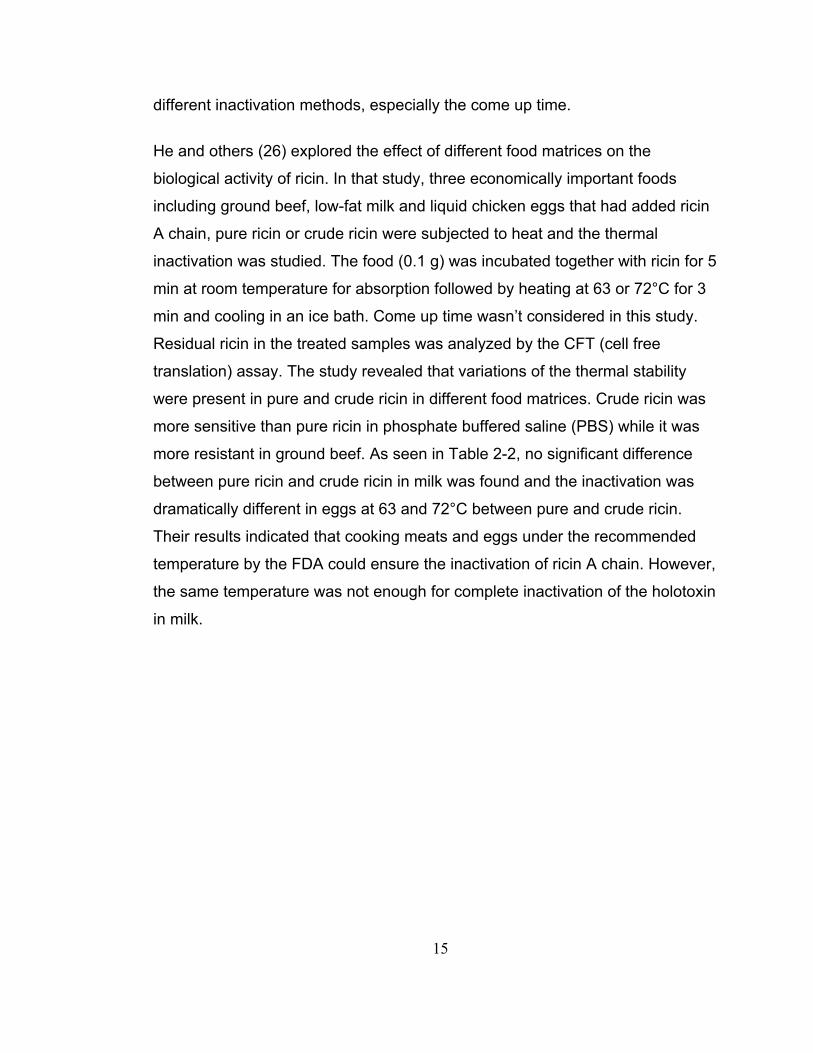
He and others (26) explored the effect of different food matrices on the
biological activity of ricin. In that study, three economically important foods
including ground beef, low-fat milk and liquid chicken eggs that had added ricin
A chain, pure ricin or crude ricin were subjected to heat and the thermal
inactivation was studied. The food (0.1 g) was incubated together with ricin for 5
min at room temperature for absorption followed by heating at 63 or 72°C for 3
min and cooling in an ice bath. Come up time wasn’t considered in this study.
Residual ricin in the treated samples was analyzed by the CFT (cell free
translation) assay. The study revealed that variations of the thermal stability
were present in pure and crude ricin in different food matrices. Crude ricin was
more sensitive than pure ricin in phosphate buffered saline (PBS) while it was
more resistant in ground beef. As seen in Table 2-2, no significant difference
between pure ricin and crude ricin in milk was found and the inactivation was
dramatically different in eggs at 63 and 72°C between pure and crude ricin.
Their results indicated that cooking meats and eggs under the recommended
temperature by the FDA could ensure the inactivation of ricin A chain. However,
the same temperature was not enough for complete inactivation of the holotoxin
in milk.
16
Table 2-2. Loss of ricin activity after heating for 3 min in different food matrices
from He and other (26).
Loss of ricin activity (%) Matrix Temp. (°C)
Ricin A chain Pure ricin Crude ricin
PBS 63 47.34 -1.65 12.65
72 62.22 4.25 14.80
Beef 63 99.65 17.43 10.92
72 100.00 30.96 23.78
Milk 63 38.76 -9.90 -9.77
72 60.21 0.20 -1.40
Egg 63 89.18 5.00 18.00
72 100.00 42.00 28.00
2.2 Shiga toxins
2.2.1 Shiga toxin classification
Shiga toxin-producing Esherichia coli (STEC) and Shigella dysenteriae type 1
are two bacteria capable of producing Shiga toxins (Stxs), a class protein of
toxin also known as verotoxins, verocytotoxins or Shiga-like toxins. Shiga toxin
1 (Stx1) and Shiga toxin 2 (Stx2) are the two most important Shiga toxins. A
single STEC isolate can produce Stx1, Stx2 or both toxins while Shigella
dysenteriae type 1 can only produce Stx (48).
Many similarities exist among Stxs in various aspects including genetic,
structural and functional properties, however significant divergences are also
present (47). The difference between Stx1 of STEC and Stx of Shigella
dysenteriae type 1 is only one amino acid in the A polypeptide and therefore
they are usually designated as Stx/Stx1 group versus Stx2 group. Variable
17
antigenic features are present among the Stx2 group including Stx2, Stx2c,
Stx2d and Stx2e while there are no significant differences, in the Stx/Stx1
group. These antigenic features among Stx2s are mainly from the sequence in
the B chain and these lead to different toxicity and activity among Stx2 variants
in tissue cells or animals. Against Vero cells, the toxicity of Stx/Stx1 and Stx2
are similar while Stx2 is almost 400 times more toxic than Stx/Stx1 to humans.
2.2.2 Structure and mechanism of action of Shiga toxins
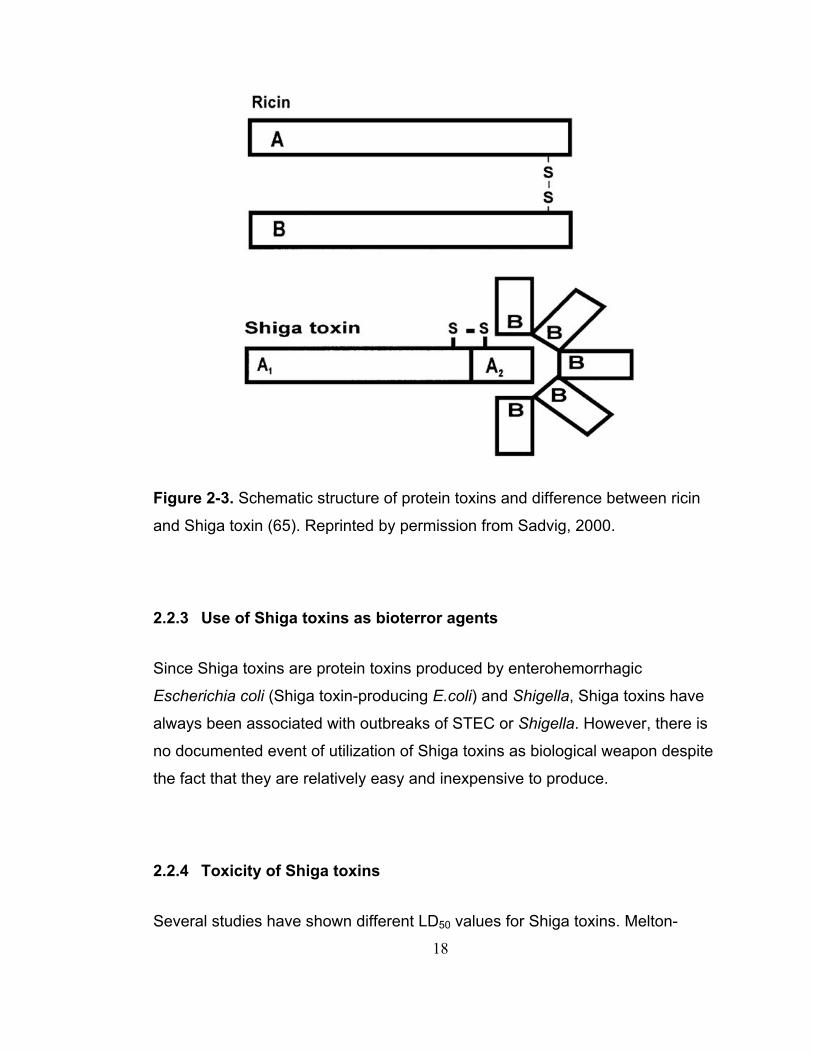
Similar to ricin, Shiga toxin also consists of two chains, namely the A and B
chains. The A chain (32 kDa) has an A1 portion of ~28 kDa and an A2 portion of
4 kDa. The A1 portion, an N-glycosidase, is able to remove a key nucleotide
residue from the 28S rRNA of 60S ribosomes and cause inhibition of protein
synthesis, similar to the mode of action of ricin (19). The A2 domain’s main
function is to connect the A1 portion to the B chain. The B chain is a pentamer
formed by monomers (~7.7 kDa per monomer). It is required to bind to a
eukaryotic glycolipid receptor, globotriaosylceramide (Gb3) (48). Similar to ricin,
the A chain can’t enter cells by itself and the B chain is required for toxin cell
surface recognition and internalization.
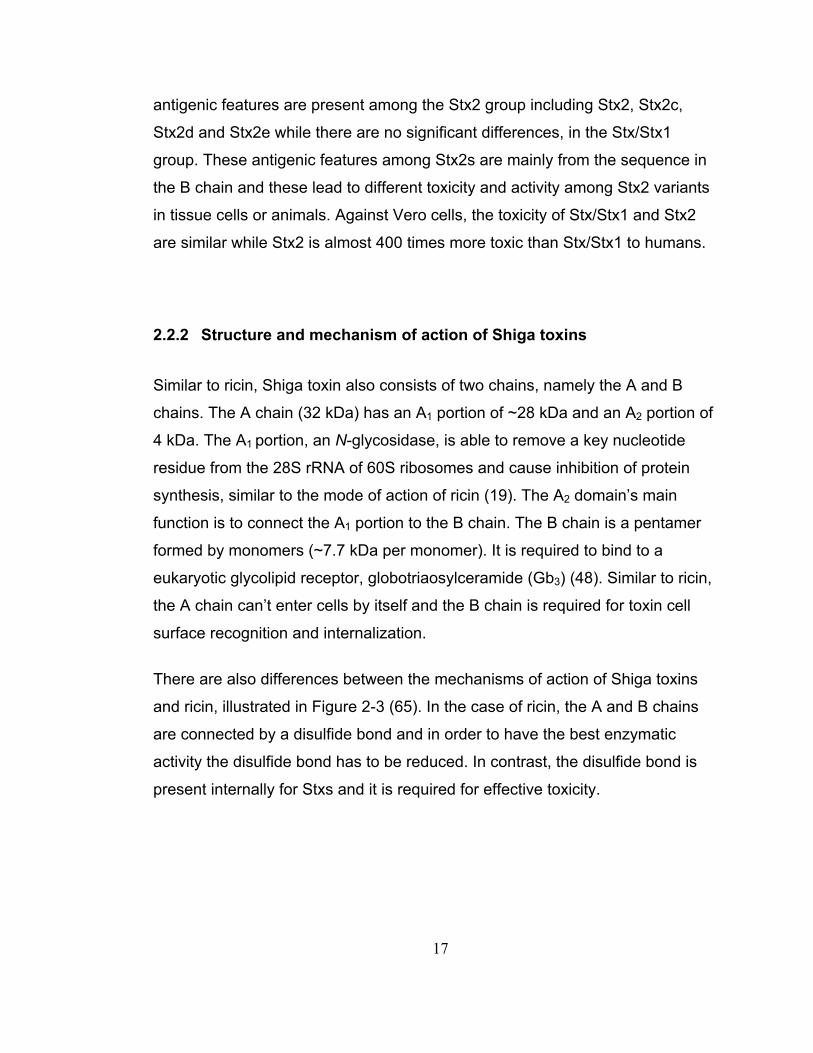
There are also differences between the mechanisms of action of Shiga toxins
and ricin, illustrated in Figure 2-3 (65). In the case of ricin, the A and B chains
are connected by a disulfide bond and in order to have the best enzymatic
activity the disulfide bond has to be reduced. In contrast, the disulfide bond is
present internally for Stxs and it is required for effective toxicity.
18
Figure 2-3. Schematic structure of protein toxins and difference between ricin
and Shiga toxin (65). Reprinted by permission from Sadvig, 2000.
2.2.3 Use of Shiga toxins as bioterror agents
Since Shiga toxins are protein toxins produced by enterohemorrhagic
Escherichia coli (Shiga toxin-producing E.coli) and Shigella, Shiga toxins have
always been associated with outbreaks of STEC or Shigella. However, there is
no documented event of utilization of Shiga toxins as biological weapon despite
the fact that they are relatively easy and inexpensive to produce.
2.2.4 Toxicity of Shiga toxins
Several studies have shown different LD50 values for Shiga toxins. Melton-
19
Celsa and O’Brien (48) listed the LD50 of Shiga toxin 1 and Shiga toxin 2 as 400
ng and 0.5-2 ng, respectively, for mice intraperitoneally. There are no published
reports on the inhalation toxicity of Shiga toxins. The LD50 of Shiga toxins in
mice was determined by Tesh and others (67) as approximately 5 × 10⁻⁵ mg/kg
body weight for Shiga toxin 2 and 0.02 mg/kg body weight for Shiga toxin 1,
through either intravenous or intraperitoneal injection. These data indicated that
Stx2 appears to be much more toxic than Stx1.
2.2.5 Production of Shiga toxins
Since Shiga toxins are not commercially available, almost every researcher has
to produce Shiga toxins by themselves through different methods. Roberts and
others (61) prepared Shiga toxins in a traditional way by growing bacterial
cultures in brain heart infusion (BHI) at 37°C for 23 to 26 h followed by
centrifugation (8160 × g, 3 min), resuspension of the cell pellets in polymyxin B
sulfate solution, incubation for 30 min to release cell bound toxins and filtration
through 0.45 μm disc filters. Rocha and Piazza (63) determined the suitability of
different broth media for producing Shiga toxin from STEC and concluded that
Shiga toxin production could be optimized when bacteria is grown in the
presence of antibiotics such as ciprofloxacin. In order to produce a relatively
large amount of Shiga toxin for research purpose, Viscardi and others (71) grew
E.coli O157:H7 in pre-warmed Luria-Bertani (LB) broth at 37°C with antibiotics
(5 µg/L ciprofloxacin or 10 µg/L norfloxacin) overnight, centrifuged at 1000 × g
for 20 min at 4°C and then filtered using 0.2 μm pore size filter with low protein
binding capacity. The toxin was measured with a Premier EHEC kit.
20
2.2.6 Detection methods of Shiga toxins
In order to detect Shiga toxins, fast, sensitive, accurate and robust assays that
can provide critical information are needed. Several studies (26, 31, 58) have
shown that, most of the detection methods can’t discriminate between inactive
and active toxins and only several detection methods are able to differentiate
them. There are several types of detection methods such as immunochemical
assays, and cell culture assays, with or without the ability to determine the
activity of Shiga toxins.
There are a variety of cell-based assays to detect Shiga toxins such as MTT
(Methylthiazolyldiphenyl-tetrazolium bromide) assay (66), GFP (green
fluorescent protein) (58) assay and LDH (lactate dehydrogenase) assay (61).
Most of the cell-based assays for detection of Shiga toxins utilize Vero cells and
different reagents to measure the change of Vero cell activity due to the attack
of Shiga toxins. Sekino and others (66) utilized the MTT assay to measure the
effect of Shiga toxins on Vero cell dehydrogenase activity. The researchers
reported the existence of a Stx1-resistant stock of Vero cells and revealed the
mechanism of the Stx1 resistance in their Vero cells. A GFP assay was utilized
by Rasooly and Do (58) to determine the stability of Shiga toxin 2 in whole milk
that was confirmed by the MTT assay. Although these cell-based detection
assays are time consuming and labor intensive, they are able to differentiate
active toxins and inactive toxins, which is critical in many studies.
One popular cell-based detection assay is the LDH and Vero cell assay. As a
confirmatory test, a Vero cell assay is used to determine the virulence potential
of STEC (38). However, time consuming and additional microscopic analysis
make it inconvenient to be used. An LDH assay (lactate dehydrogenase) could
be combined with the Vero cell assay to rapidly determine toxicity. LDH is a
stable enzyme that is present in all mammalian cells. When the plasma
membrane of Vero cells is damaged or dead in response to the toxin, LDH in
21
the cell is rapidly released from the cytosol into the cell culture supernatant. The
toxin is then determined using a colorimetric assay based on the measurement
of LDH. A large number of samples in an LDH assay could be measured
simultaneously in a 96-well plate. LDH assays have been utilized frequently and
one example is to distinguish Shiga toxin producing E.coli from non-Shiga toxin
producing strains (61). The LDH and Vero cell assay is capable of determining
the virulence factors and therefore is a good detection and confirmation method
although it is still time consuming.
Immunoassays are common detection methods, which are commercially
available. ELISA formats are among the most popular commercial
immunoassays, because they are easy, fast and convenient compared with
other methods such as PCR or cell culture assay. Willford and others (74)
evaluated three commercially available Shiga toxin ELISA kits including Premier
EHEC test (Meridian Bioscience Inc., Cincinnati, OH), the Ridascreen Verotoxin
Enzyme Immunoassay (r-Biopharm AG, Darmstadt, Germany), and the
ProSpecT Shiga toxin E.coli (STEC) Microplate Assay (Remel Inc., Lenexa,
KS). The researchers concluded that all the three tests had similar specificities.
The first two kits had comparable sensitivity while the one from Remel Inc. was
10-fold less sensitive. In addition, they indicated the lack of ability of all three
tests to detect Stx2d and Stx2e variants, which is absolutely a disadvantage of
ELISA commercial kits. In addition, although the ELISA kit is available, easy
and fast, it was uncertain if the method could differentiate between active and
inactive Shiga toxins. Further studies are needed to correlate ELISA results with
the cytotoxicity assay for detection of Shiga toxins.
2.2.7 Inactivation studies of Shiga toxins
A number of inactivation studies of Shiga toxins were done in the past years.
Most of the media include water, buffer or a food matrix. Different inactivation
22
conditions were studied involving pH, temperature, time and so on, while
different temperature and time points were tested according to researchers’
objectives.
Kittell and others (37) studied the effect of heat, pH, and various cations and
lipids on the activity of Shiga toxin 1. Forty 1.25 mL samples were thermally
inactivated in Tris-buffered saline (50 mM Tris-HCl) in a water bath at 25, 37,
45, 55, 65, 70, 75, 80, or 85°C for 15, 30 or 60 min or at 75, 80, or 85°C for 5
min. The timing started once the samples were immersed. The results showed
that Stx1 was stable when treated at 45-70°C for as long as 60 min. The
inactivation of Stx1 was time-dependent when heated above 70°C. The toxicity
of Stx1 was reduced by 90% at 80°C for 15 min and by 99% at 80°C for 30 min.
Heat treatments at 80°C for 60 min or at 85°C for 5 min could completely
inactivate Stx1. Their warm-up and cool-down times were measured with a
thermocouple and a calibrated recorder and were reported to be negligible
compared to the incubation time. However, the warm-up time could affect the
final result easily with such a large sample size and the tube size used to
contain samples in the inactivation studies was not mentioned, which could
affect the come-up time. No kinetics calculation was done in this study. The half
life calculated according to their data was 4.5 min, as shown in Figure 2-4.
23
Toxin% = 1.000E+02e-1.535E-01t
R2 = 1.00, t1/2 = 4.5 min
1
10
100
0 5 10 15 20 25 30Time (min)
Res
idua
l tox
in (%
)
Figure 2-4. Inactivation of Shiga toxin 1 in buffer at 80°C from Kittell and others
(37).
Tesh and others (67) determined the inactivation effect of Shiga toxins at
different temperatures and at different pH. They found that heating at 65°C at
pH 7.0 could reduce 99% of the cytotoxic activity of purified Shiga toxin 1 while
it could not reduce Stx2 to a comparable level until heating at 85°C. Heating at
60°C and an extreme pH of 3.0 could completely reduce the cytotoxic activity of
Shiga toxin 1 while heating to 95°C was required for a comparable loss in
activity of Shiga toxin 2. However, neither the heating time nor how much toxin
was left after the treatment was mentioned in their study. Furthermore, no
sample size or any consideration of the come-up time was mentioned in this
study.
Babu and others (4) studied the stability of Shiga toxins (Stx1 and Stx2) in fruit
punch at different temperatures and pH values and flow cytometry was utilized
to quantify apoptosis to determine the stability of Shiga toxins. Toxin-punch
mixtures were heated at 95°C for 10 min or adjusted to pH ranging from 2 to 9
24
and incubated at 4 or 20°C for 0 to 90 days. However, no detailed inactivation
methods were mentioned in their study. The best inactivation was achieved with
the combination of acidic pH and storage temperature (20°C) at the 30 day time
point. Nonetheless, no detailed data were presented about the kinetics of the
heat resistance of the toxin.
Rasooly and Do (58) investigated the ability of Shiga toxin to inhibit the LDH
activity of Vero cells and protein synthesis. They spiked whole milk with 1, 10 or
100 ng/mL Shiga toxin 2 (100 μL) and heated at the suggested temperatures
and times by the U.S. Food and Drug Administration (63°C for 30 min, 72°C for
15 s or 89°C for 1 s) as well as 100°C for 5 min. The Stx2 activity was tested
with a GFP assay and confirmed by a MTT test. The results suggested that
Stx2 was heat stable and could not be inactivated by conventional
pasteurization of milk. However, the thermal treatment at 100°C for 5 min was
able to completely inactivate the toxin.
2.3 Terminology
2.3.1 High temperature short time (HTST) pasteurization
High temperature short time (HTST) pasteurization is the most widely used
treatment for preserving the quality and extending the shelf life of dairy products
and orange juice. It is a continuous pasteurization process using a continuous-
flow heat exchanger. The typical heating temperature for milk is 72 to 74°C with
a holding time of 15 to 30 s compared with 62 to 65°C for at least 30 min in low
temperature long time pasteurization (LTLT) (32). Standard HTST
pasteurization conditions are heating at 72°C for 15 s for milk and commercially
orange juice is pasteurized at 90 to 95°C for 15 to 30 s. The HTST process has
many advantages as compared to the LTLT process including less heat
damage and flavor changes as well as higher throughput.
25
2.3.2 Inactivation kinetics
The rate law is an equation that incorporates the reaction rate constant and the
concentrations of reactants in a chemical reaction (40). A reaction rate is given
by:
[ ] [ ]a bdA k A Bdt
± = (2.1)
Where [ ]A = concentration of reactant A
[ ]B = concentration of reactant B
a = stoichiometric coefficient of A in the balanced equation
b = stoichiometric coefficient of B in the balanced equation
t = time
The overall order = sum of exponents= a+b
An apparent zero order reaction has a reaction rate independent of reactant
concentration, thus the concentration of the reactant will not change the
reaction rate. The loss in A is given by:
[ ]− = =0dA k A kdt
(2.2)
Or = −0A A kt (2.3)
Where A = amount at time t
A0 = initial amount
26
k = rate constant in amount per unit time
t = time
The reaction rate of a first order reaction is dependent on the concentration of
only one reactant and it is given by:
−= 0ektA A (2.4)
Or ⎡ ⎤
= −⎢ ⎥⎣ ⎦0
Ln A ktA
(2.5)
Where k = the slope of ⎡ ⎤⎢ ⎥⎣ ⎦0
Ln AA
versus time and k = 2.3 × slope if using a semi-
log10 scale. In Microsoft Excel, one can use the trendline exponential function
on a semi-log plot of A versus time to get the rate constant directly.
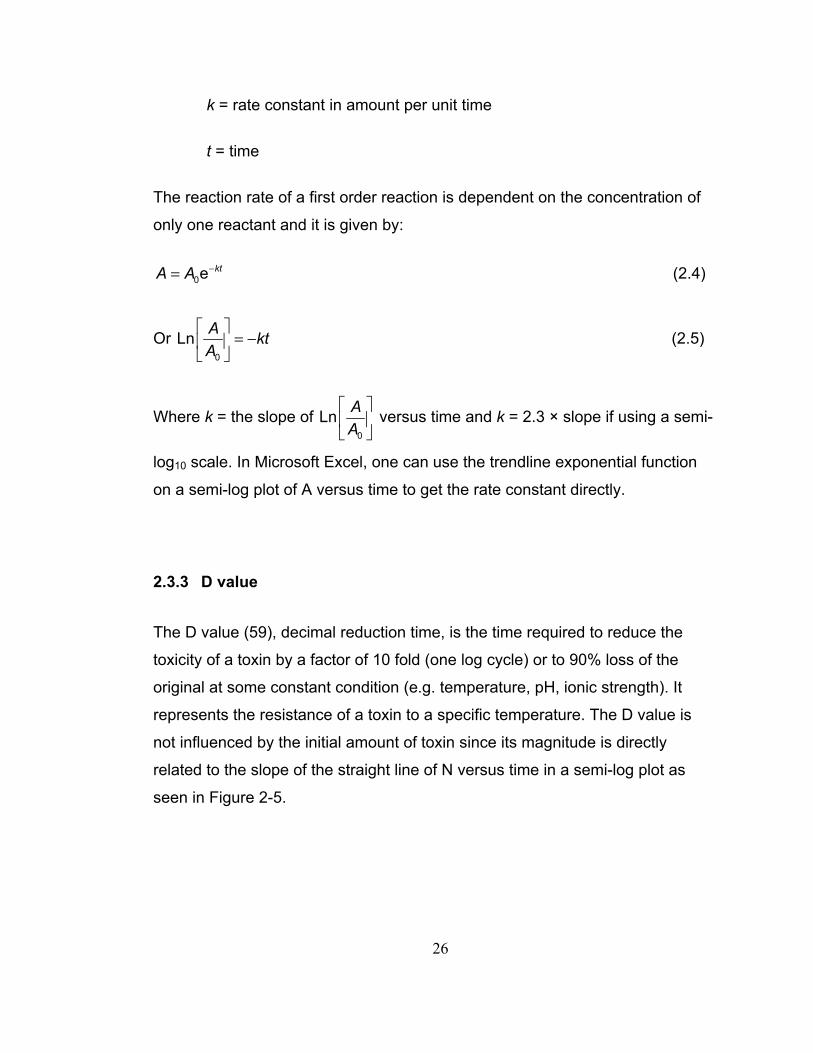
2.3.3 D value
The D value (59), decimal reduction time, is the time required to reduce the
toxicity of a toxin by a factor of 10 fold (one log cycle) or to 90% loss of the
original at some constant condition (e.g. temperature, pH, ionic strength). It
represents the resistance of a toxin to a specific temperature. The D value is
not influenced by the initial amount of toxin since its magnitude is directly
related to the slope of the straight line of N versus time in a semi-log plot as
seen in Figure 2-5.
27
1
10
100
Time
N
Figure 2-5. Theoretical inactivation curve for calculation of D value.
0ktN N e−= (2.6)
Where N0 = initial amount of toxin
N = final amount of toxin
k = rate constant in amount per unit time
Since Equation 2.6 is an exponential decay, the slope of the line is the rate
constant k (on a semi-log plot it is 2.3 × slope) and the D value is the time for
one log cycle reduction. Thus,
0 10 ktN eN
= = (2.7)
0 2.3NLn kt kDN
⎛ ⎞ = = =⎜ ⎟⎝ ⎠
(2.8)
Where D = the time for one log reduction.
Thus,

28
2.303Dk
= (2.9)
2.3.4 Half life
Half life (t1/2) is the time needed to reduce the concentration of active toxin to
50% of original value. It describes the thermal resistant of toxins at a specific
temperature measured in time units. The half life is equal to:
01/ 2
50Ln Ln 0.693100AAt
k k k
− −= = = (2.10)
The half life could be also calculated as follows:
( )1/ 2
2 1 11 0.52
tt nN N N⎛ ⎞= =⎜ ⎟
⎝ ⎠ (2.11)
Where N1 = initial amount of toxin
N2 = final amount of toxin at time t
t1/2 = half life of the inactivation (time)
n = number of half lives (1/ 2
tt
)
Thus we can calculate the final concentration percentage left for any number of
half lives:
( )%left 100 0.5 n= × (2.12)
Where n = number of half lives
29
Conversely we can determine the number of log reductions equivalent to the
number of half lives (n):
0 01/ 2 1/ 2
1/ 2
0.6932.3 log 0.693N NLn kt knt nt nN N t
⎛ ⎞ ⎛ ⎞= × = = = = ×⎜ ⎟ ⎜ ⎟⎝ ⎠ ⎝ ⎠
(2.13)
Thus,
0.6932.30 10
nNN
⎛ ⎞⎜ ⎟⎝ ⎠= or 0 0.693log
2.3N nN
⎛ ⎞ =⎜ ⎟⎝ ⎠
(2.14)
For example, for 7 half lives:
0.693 7 2.110 2.310 10 129NN
×= = = (2.15)
So, the amount left is 0 0.78%129NN = = .
For 12 log reduction then:
( )12012 2.3log 10 2.3 12 27.6NLn kt
N⎛ ⎞ = = = × =⎜ ⎟⎝ ⎠
Therefore, the time to achieve 12 log reduction is 12 1/ 2 1/ 227.6 27.6 40
0.693t t t
k= = ≈ .
( )40 11%left 100 0.5 9 10 %−= × = ×
Some examples of calculation results are listed in Table 2-3 and Table 2-4.
30
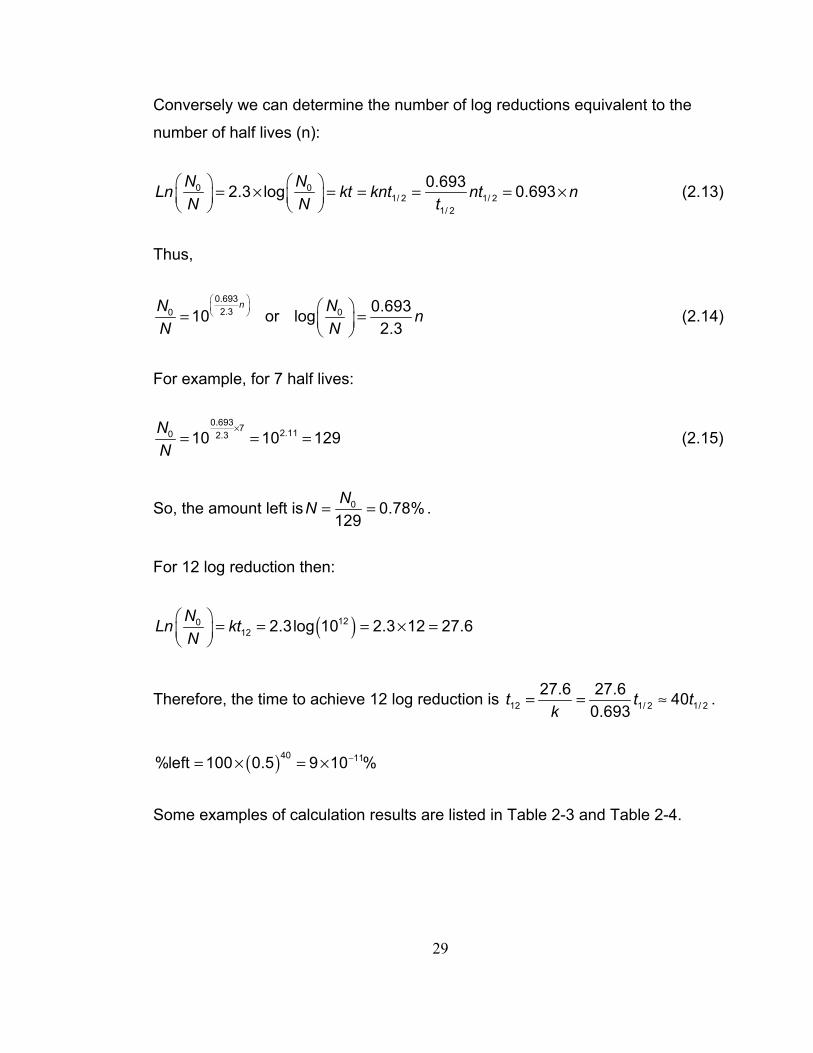
Table 2-3. Examples of calculation results of residual amount of toxin through
number of half lives.
No. of half lives Residual amount
7 0.78%
12 0.02%
13 0.01%
Table 2-4. Examples of calculation results of residual amount of toxin through
number of log reduction.
No. of log reduction Equivalent No. of half lives Residual amount
5 16.6 0.001%
6 20 0.000095%
12 40 9 × 10-11%
2.3.5 Activation energy
The Arrhenius equation (Equation 2.16) was developed by Svante Arrhenius (2)
in the late 1800s. In chemical kinetics, Arrhenius equation is used to describe
the influence of temperature on the rate constant which consequently shows the
temperature dependence or sensitivity of the reaction.
−= /0
aE RTk k e (2.16)
Where k0 = theoretical value of k at T = infinity intercept on plot and related to
the probability of collision frequency
Ea = activation energy (calories/mole or joules/mole)
R = gas constant = 8.314 joules/mole K = 1.9869 calories/mole K
31
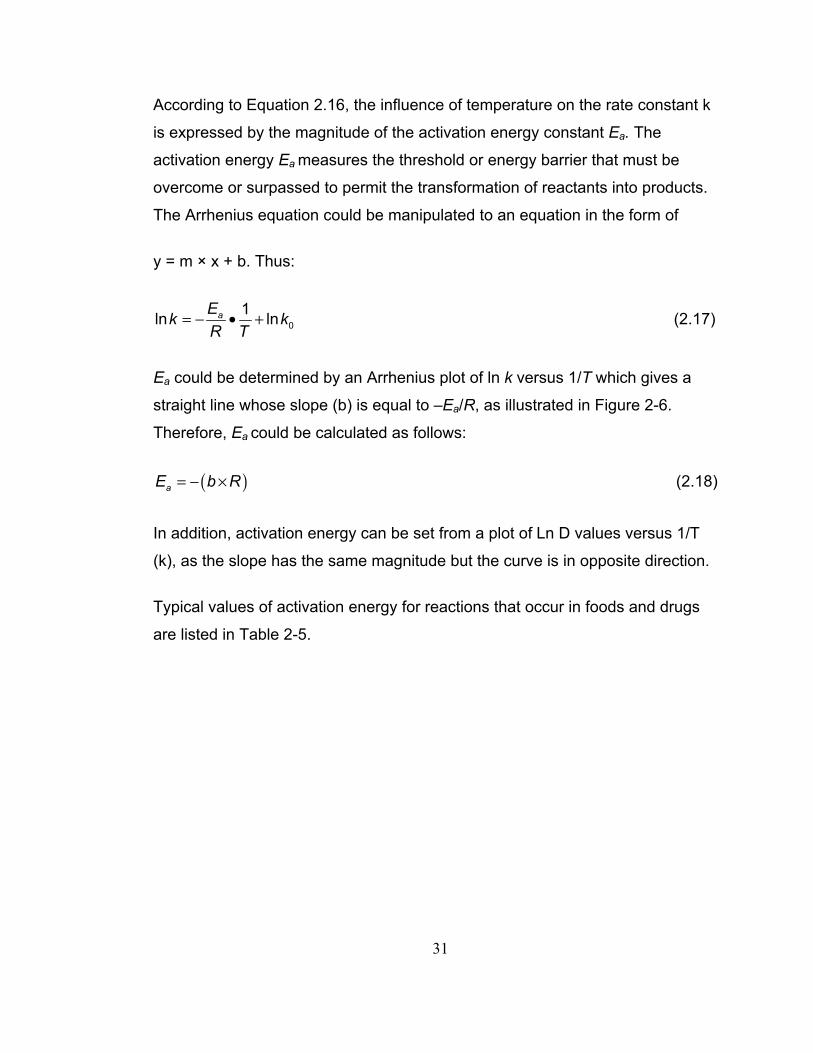
According to Equation 2.16, the influence of temperature on the rate constant k
is expressed by the magnitude of the activation energy constant Ea. The
activation energy Ea measures the threshold or energy barrier that must be
overcome or surpassed to permit the transformation of reactants into products.
The Arrhenius equation could be manipulated to an equation in the form of
y = m × x + b. Thus:
= − • + 01ln lnaEk k
R T (2.17)
Ea could be determined by an Arrhenius plot of ln k versus 1/T which gives a
straight line whose slope (b) is equal to –Ea/R, as illustrated in Figure 2-6.
Therefore, Ea could be calculated as follows:
( )= − ×aE b R (2.18)
In addition, activation energy can be set from a plot of Ln D values versus 1/T
(k), as the slope has the same magnitude but the curve is in opposite direction.
Typical values of activation energy for reactions that occur in foods and drugs
are listed in Table 2-5.
32
1/T (K)
Ln (R
ate
cons
tant
k)
Ea/R
Figure 2-6. Hypothetical Arrhenius plot of the reaction rate constant k versus
the inverse of absolute temperature 1/T.
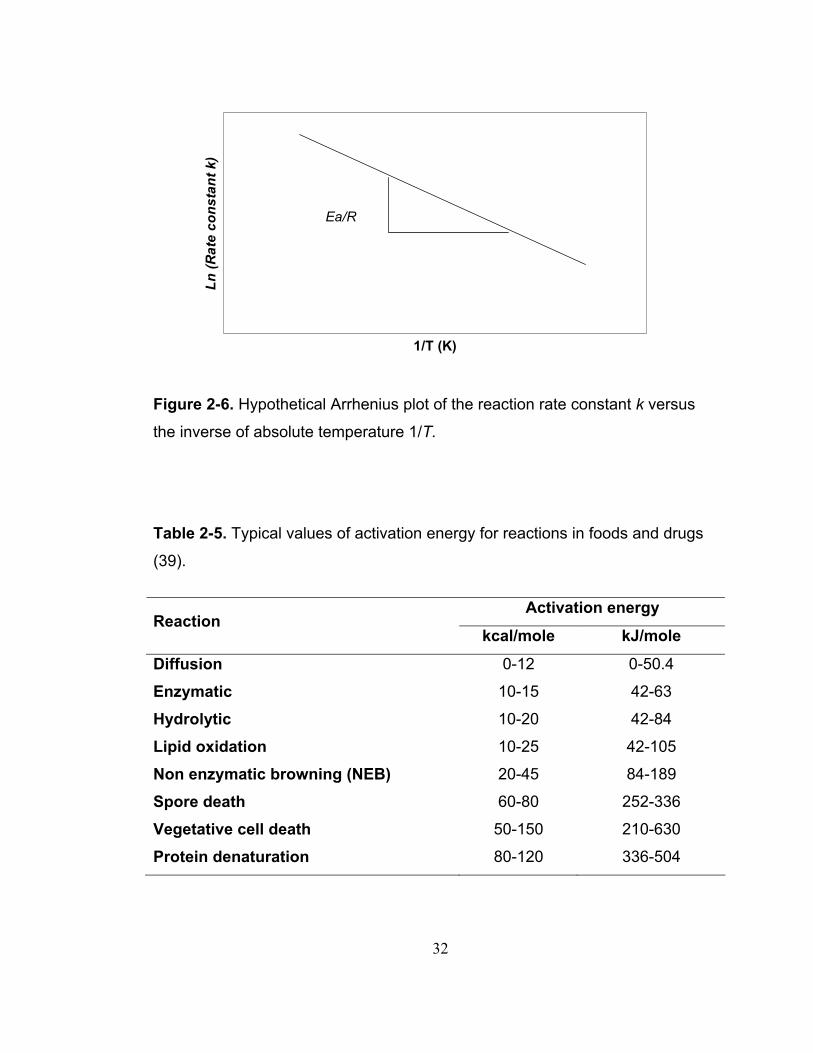
Table 2-5. Typical values of activation energy for reactions in foods and drugs
(39).
Activation energy Reaction
kcal/mole kJ/mole
Diffusion 0-12 0-50.4
Enzymatic 10-15 42-63
Hydrolytic 10-20 42-84
Lipid oxidation 10-25 42-105
Non enzymatic browning (NEB) 20-45 84-189
Spore death 60-80 252-336
Vegetative cell death 50-150 210-630
Protein denaturation 80-120 336-504
33
2.3.6 Z value
The Z value is the change in temperature that causes a 10-fold change in D
value. It represents the thermal sensitivity of a toxin to a change in temperature.
The smaller the Z value, the smaller change in temperature needed to get a 10
fold change in rate. It is a different measure of temperature sensitivity. The Z
value can be determined by plotting the D values against corresponding
temperatures on a semi-logarithmic scale and doing a linear regression to get
the best fit to the data. The absolute value of the reciprocal of the slope of this
line is the Z value. The Z value could be calculated as follows:
1 2Z T T= − (2.19)
Where D1 = D value at temperature T1
D2 = D value at one log cycle difference found at temperature T2
2.3.7 Q10
The temperature sensitivity can also be expressed as the Q10, or the increase in
rate for a 10°C increase in temperature. It could be calculated by analyzing rate
constants at a temperature interval of 10°C:
+= = 2
1
1010
TT
T
DkQk D
(2.20)
Where k = rate constant at temperature T
k T+10 = rate constant at temperature T+10
2TD = D value at temperature T2
34
1TD = D value at temperature T1 which is 10°C different than T2
Also, Q10 could be calculated by analyzing the rate increases for temperature
intervals other than 10°C:
Δ
= =2 1010
1
T
AkQ Qk
(2.21)
Where k1 = rate constant at temperature T1
k2 = rate constant at temperature T2
ΔT = difference between the two test temperatures (T2-T1)
2.4 Orange juice
2.4.1 Orange juice definition
Orange juice has the largest consumption in the United States among juices at
5.1 gal/year/person (70). There are a variety of orange juice products including
fresh, pasteurized, frozen concentrated and canned orange juice. Different
products have different definitions according to the Code of Federal Regulations
(CFR) although processing steps are similar.
Orange juice has a standard of identity defined in Title 21, CFR Chapter 1
Section 146.135 (22), as “the unfermented juice obtained from mature oranges
of the species Citrus sinensis or of the citrus hybrid commonly called
“Ambersweet” (1/2 Citrus sinensis x 3/8 Citrus reticulata x 1/8 Citrus paradisi
(USDA Selection:1-100-29: 1972 Whitmore Foundation Farm)). Seeds (except
embryonic seeds and small fragments of seeds that cannot be separated by
current good manufacturing practice) and excess pulp are removed. The juice
35
may be chilled, but it is not frozen.”
Pasteurized orange juice is defined in CFR, Title 21, Chapter 1 Section 146.140
as “orange juice (defined above) that is treated by heat as to reduce
substantially the enzymatic activity and the number of viable microorganisms.
Either before or after such heat treatment, all or a part of the product may be
frozen. The finished pasteurized orange juice contains not less than 10.5% by
weight of orange juice soluble solids, exclusive of the solids of any added
optional sweetening ingredients, and the ratio of the Brix hydrometer reading to
the grams of anhydrous citric acid per 100 mL of juice is not less than 10 to 1.”
Frozen concentrated orange juice is regulated in 21 CFR 140.146 and defined
as “the food prepared by removing water from the general orange juice defined
in 21 CFR 146.135, to which may be added unfermented juice obtained from
mature oranges of the species Citrus reticulate, other Citrus reticulate hybrids,
or of Citrus aurantium, or both. However, the volume of juice from Citrus
reticulate or Citrus reticulate hybrids shall not exceed 10% (with the exception
of the Ambersweet) and from Citrus aurantium shall not exceed 5% in the
unconcentrated blend. The finished product of frozen concentrated orange juice
is of such concentration that when diluted according to label directions the
diluted article will contain more than 11.8% by weight of orange juice soluble
solids, exclusive of the solids of any added optional sweetening ingredients and
the dilution ratio shall be not less than 3 plus 1.”
Canned orange juice is defined in 21 CFR 146.141 as the food prepared
complying with 21 CFR 146.135, which is “sealed in containers and so
processed by heat, either before or after sealing, as to prevent spoilage. The
finished canned orange juice tests not less than 10° Brix, and the ratio of the
Brix hydrometer reading to the grams of anhydrous citric acid per 100 mL of
juice is not less than 9:1”. Orange juice, no matter fresh, pasteurized, frozen
concentrated or canned orange juice, has similar nutritional value and
36
composition.
2.4.2 Orange juice processing
Orange juice processing begins with harvesting mature oranges from the
orchards and shipping by truck to juice plants. Following arrival at the orange
juice plant, the fruit initially goes through inspection and grading. Samples are
tested for titratable acidity, °Brix and juice yield. Fruits are then conveyed to
washers where sanitizers are applied and then they enter a juicer (squeezer)
where juice is produced and the pulp and seed are separated from the liquid.
Once general orange juice is produced, the products are processed differently
according to the definitions utilizing different steps or technologies such as
pasteurization, ultrafiltration, deoiling, deaeration (64). Orange juice and orange
juice products are regulated in the juice labeling rule (21 CFR 101.17) and juice
Hazard Analysis and Critical Control Point (HACCP) (23), as they have to be
processed to attain a 5-log reduction in the pertinent pathogen as stated in the
performance standard.
2.4.3 Vulnerability of the orange juice processing system
Similar to other food systems, the orange juice processing system is vulnerable
at a certain degree to special weapons attack such as the introduction of
biological agents such as ricin and Shiga toxins. A number of points in the
processing operation are potential targets for a bioterrorist where large volume
of orange juice could be contaminated. This is critical as the aim of bioterrorists
is to have mass destruction rather than 10-12 people getting ill or dying. Since
the supply chain begins with a vast number of widely distributed small farms
and numerous transportation, processing and distribution facilities to the
37
consumers’ table, orange juice could be contaminated intentionally in every and
each of the steps. The three most vulnerable points in the orange juice system
include the pesticides applied before harvest in the orchard, which could be
washed into the juice later in the plant, storage in the silos (typically 7,000 gal)
in the plant and the tanker truck after pasteurization where agents could be
added deliberately (64). Although it is less possible to evenly contaminate a
large amount of orange juice during storage or in trucks, it can still cause
intended harm effectively. Scenarios for deliberate contamination events are
still likely although possible vulnerability in processing orange juice is
recognized.
2.5 Pasteurization processing
The goal of pasteurization in orange juice processing is to inactivate both
spoilage organisms and pathogenic organisms as well as the enzyme pectin
methylesterase (PME) which is responsible for loss of cloud stability and
discoloration in juice. Pasteurized orange juice has an extended shelf life and
ensured safety. Commercially, orange juice is rapidly heated to ~92°C and the
exact heating temperature depends on the type of equipment that is used in the
plant and also on the rate of juice flow. Pasteurizers such as tube in tube and
plate and frame heat exchangers are used in pasteurization using steam or hot
water as the heating agent as well as using the hot juice to warm up the cold
juice in a regeneration step (32, 44).
Tube in tube heat exchangers are used for a variety of products from low to
high viscosity, of course including fruit juices. It consists of one or multiple tubes
fixed inside a larger tube with either current flow (same direction inside and
outside) or countercurrent flow (opposite directions). The fluid in the larger outer
tube functions as the heating or cooling medium while the smaller tubes carry
the juice (18). Tube in tube heat exchangers have many advantages including
38
suitability over a wide product range, high pressure resistance, simple design
and low maintenance costs (although high cleaning costs). However, tubular
heat exchangers tend to form thermal cracks especially at joints due to the
changes in temperature.
A plate and frame heat exchanger is generally used to pasteurize less viscous
liquids, such as fruit juices on a large scale. The plate heat exchanger is
composed of several thin vertical stainless steel corrugated plates to form
parallel channels, which are separated by rubber gaskets to produce a
watertight seal. Plate heat exchangers have a number of advantages over other
heat exchangers, such as saved space per unit area of contact, increased
flexibility and the better heating profile (57).
2.6 ELISA
The enzyme linked immunosorbent assay (ELISA) or enzyme immunoassay
(EIA), is a biochemical technique based on the specific affinity between
antibody and antigen, which could be used to determine the presence or
amount of antigen or antibody in a sample. An enzyme covalently linked to one
of the antibodies is the key component of ELISA. The antigen-antibody enzyme
conjugate complex catalyzes a specific reaction with a chromogenic substance
used to develop color after addition of substrate for quantification of antigen or
antibody at the appropriate wavelength (43).
There are many types of ELISA but four main methods form the basis to all
ELISAs including direct ELISA, indirect ELISA, sandwich ELISA and
competitive ELISA (33, 43). The simplest form of ELISA is the direct ELISA,
illustrated in Figure 2-7. In direct ELISA, the antigen protein, i.e. the toxin in this
study or protein on the surface of a pathogenic microbe, after extraction from
the food or directly is first attached to a solid surface by hydrophobic bonding.
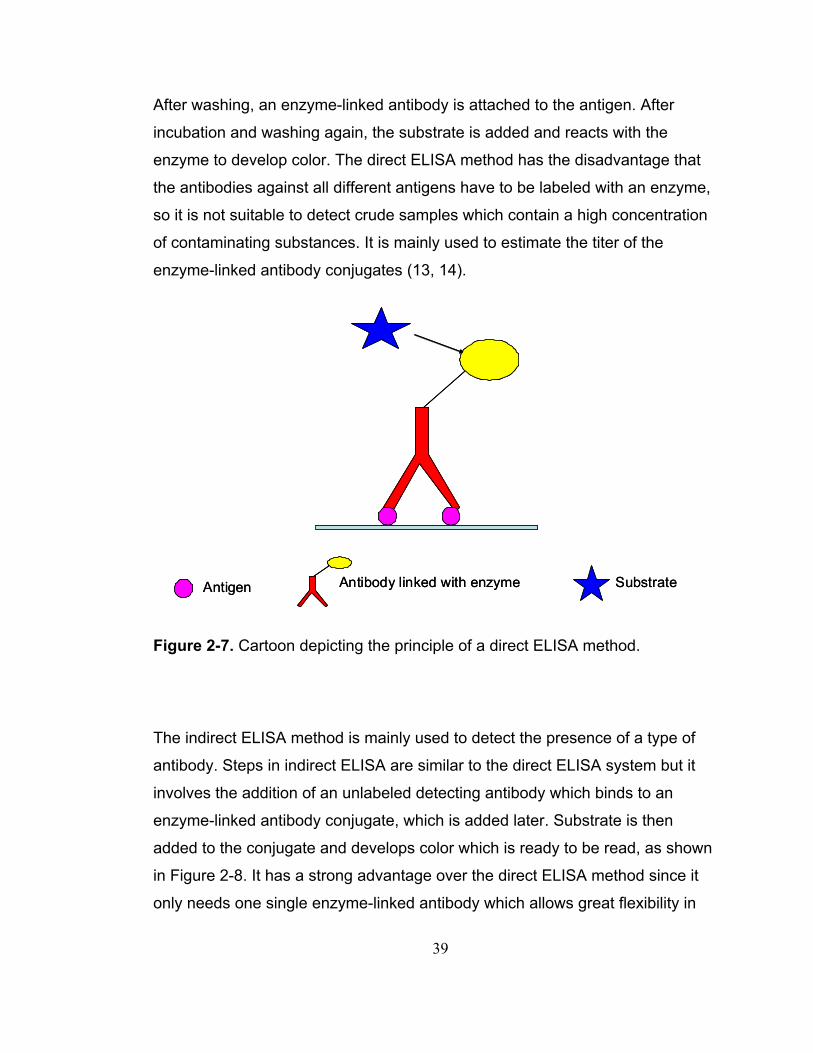
39
After washing, an enzyme-linked antibody is attached to the antigen. After
incubation and washing again, the substrate is added and reacts with the
enzyme to develop color. The direct ELISA method has the disadvantage that
the antibodies against all different antigens have to be labeled with an enzyme,
so it is not suitable to detect crude samples which contain a high concentration
of contaminating substances. It is mainly used to estimate the titer of the
enzyme-linked antibody conjugates (13, 14).
Antigen Antibody linked with enzyme SubstrateAntigen Antibody linked with enzyme Substrate
Figure 2-7. Cartoon depicting the principle of a direct ELISA method.
The indirect ELISA method is mainly used to detect the presence of a type of
antibody. Steps in indirect ELISA are similar to the direct ELISA system but it
involves the addition of an unlabeled detecting antibody which binds to an
enzyme-linked antibody conjugate, which is added later. Substrate is then
added to the conjugate and develops color which is ready to be read, as shown
in Figure 2-8. It has a strong advantage over the direct ELISA method since it
only needs one single enzyme-linked antibody which allows great flexibility in
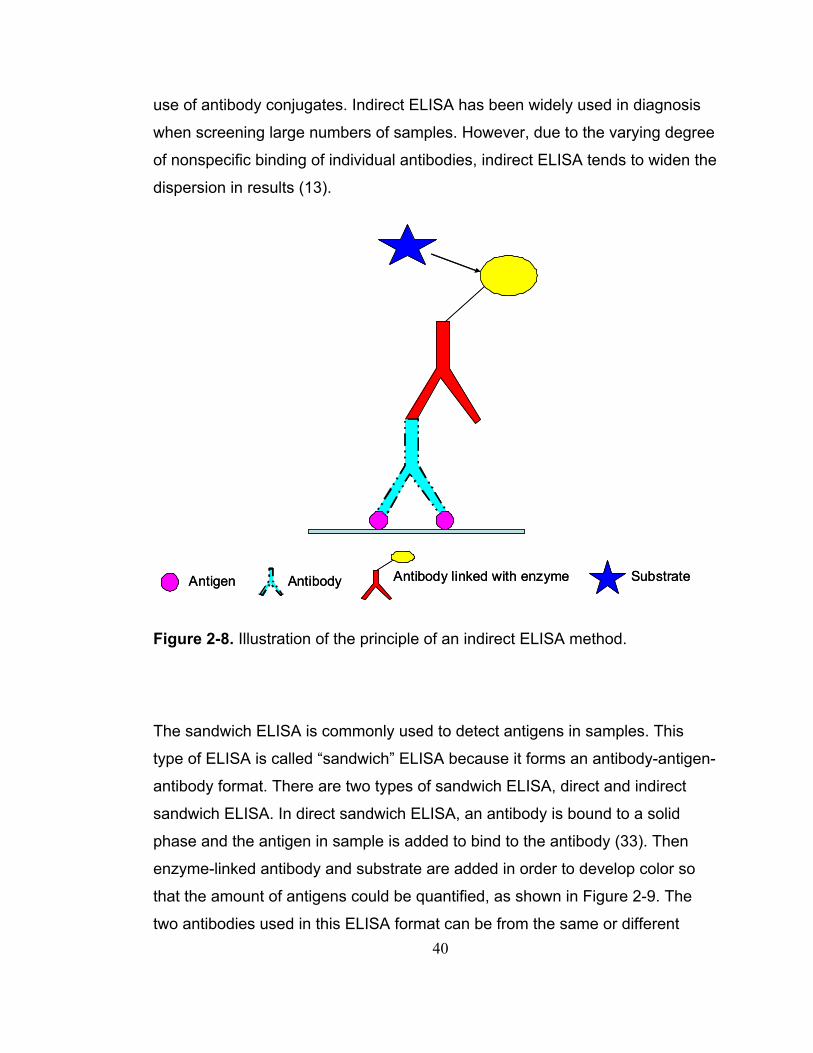
40
use of antibody conjugates. Indirect ELISA has been widely used in diagnosis
when screening large numbers of samples. However, due to the varying degree
of nonspecific binding of individual antibodies, indirect ELISA tends to widen the
dispersion in results (13).
Antigen Antibody linked with enzyme SubstrateAntibodyAntigen Antibody linked with enzyme SubstrateAntibody
Figure 2-8. Illustration of the principle of an indirect ELISA method.
The sandwich ELISA is commonly used to detect antigens in samples. This
type of ELISA is called “sandwich” ELISA because it forms an antibody-antigen-
antibody format. There are two types of sandwich ELISA, direct and indirect
sandwich ELISA. In direct sandwich ELISA, an antibody is bound to a solid
phase and the antigen in sample is added to bind to the antibody (33). Then
enzyme-linked antibody and substrate are added in order to develop color so
that the amount of antigens could be quantified, as shown in Figure 2-9. The
two antibodies used in this ELISA format can be from the same or different
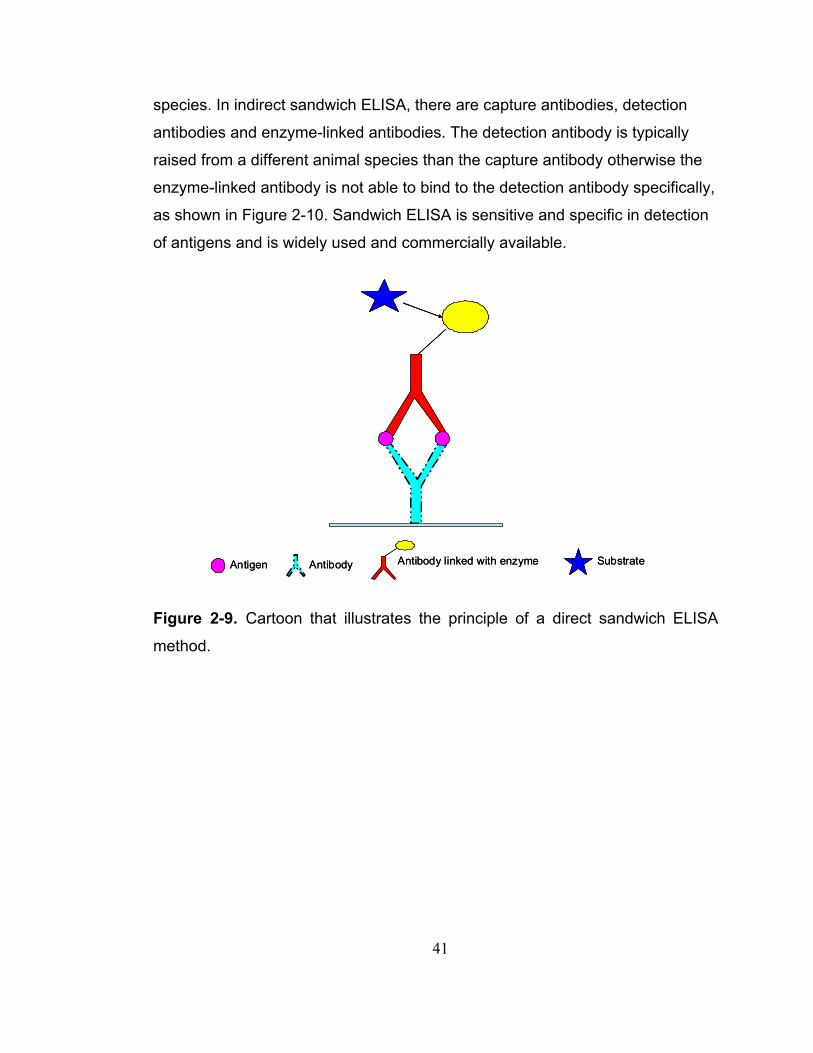
41
species. In indirect sandwich ELISA, there are capture antibodies, detection
antibodies and enzyme-linked antibodies. The detection antibody is typically
raised from a different animal species than the capture antibody otherwise the
enzyme-linked antibody is not able to bind to the detection antibody specifically,
as shown in Figure 2-10. Sandwich ELISA is sensitive and specific in detection
of antigens and is widely used and commercially available.
Antigen Antibody linked with enzyme SubstrateAntibodyAntigen Antibody linked with enzyme SubstrateAntibody
Figure 2-9. Cartoon that illustrates the principle of a direct sandwich ELISA
method.
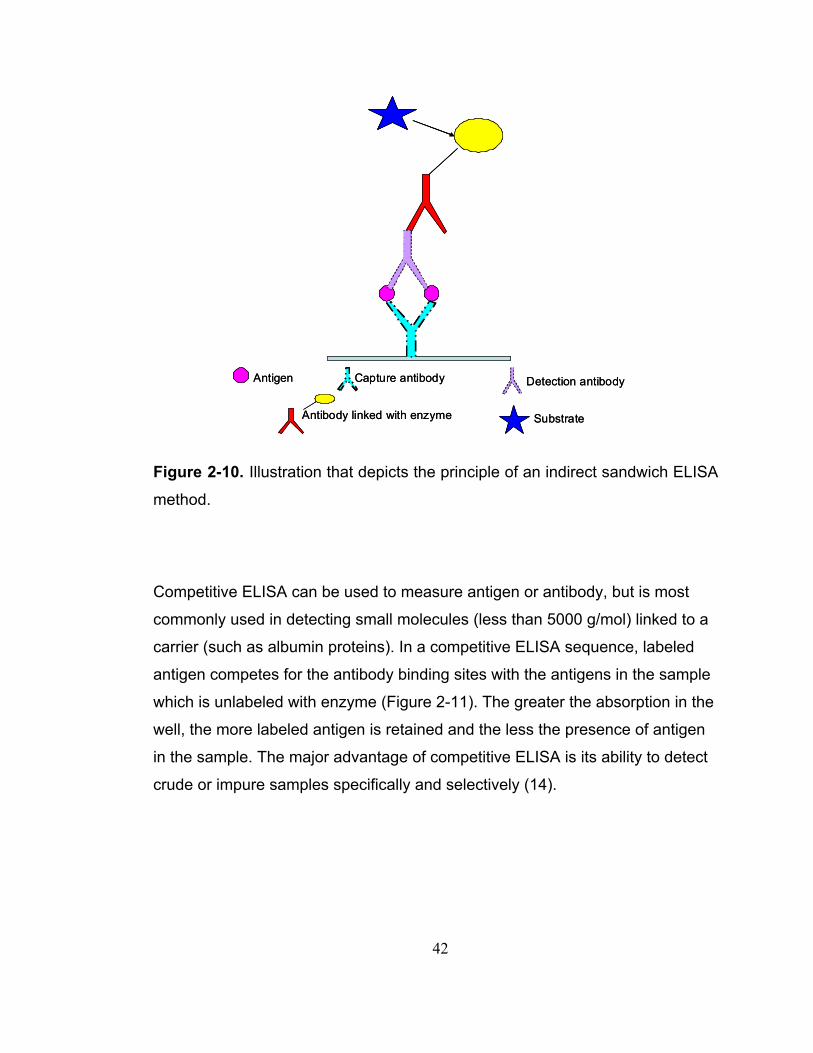
42
Antibody linked with enzyme Substrate
Antigen Capture antibody Detection antibody
Antibody linked with enzyme Substrate
Antigen Capture antibody Detection antibody
Figure 2-10. Illustration that depicts the principle of an indirect sandwich ELISA
method.
Competitive ELISA can be used to measure antigen or antibody, but is most
commonly used in detecting small molecules (less than 5000 g/mol) linked to a
carrier (such as albumin proteins). In a competitive ELISA sequence, labeled
antigen competes for the antibody binding sites with the antigens in the sample
which is unlabeled with enzyme (Figure 2-11). The greater the absorption in the
well, the more labeled antigen is retained and the less the presence of antigen
in the sample. The major advantage of competitive ELISA is its ability to detect
crude or impure samples specifically and selectively (14).
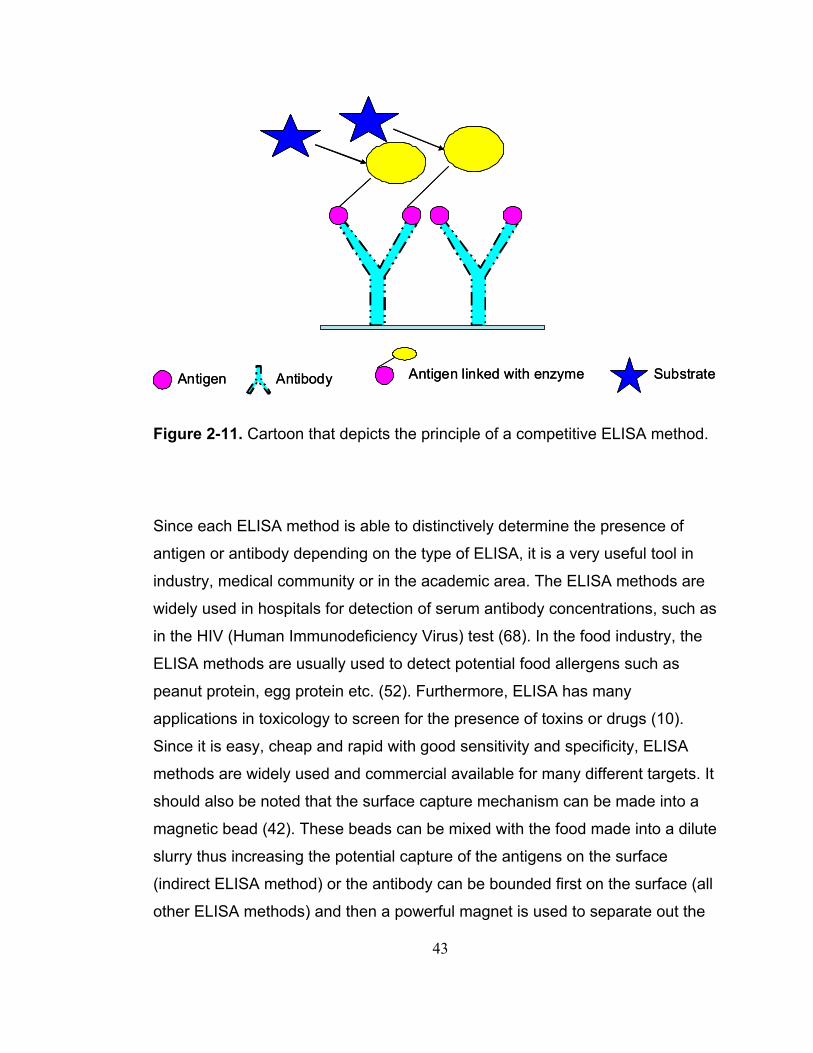
43
Antigen Antigen linked with enzyme SubstrateAntibodyAntigen Antigen linked with enzyme SubstrateAntibody
Figure 2-11. Cartoon that depicts the principle of a competitive ELISA method.
Since each ELISA method is able to distinctively determine the presence of
antigen or antibody depending on the type of ELISA, it is a very useful tool in
industry, medical community or in the academic area. The ELISA methods are
widely used in hospitals for detection of serum antibody concentrations, such as
in the HIV (Human Immunodeficiency Virus) test (68). In the food industry, the
ELISA methods are usually used to detect potential food allergens such as
peanut protein, egg protein etc. (52). Furthermore, ELISA has many
applications in toxicology to screen for the presence of toxins or drugs (10).
Since it is easy, cheap and rapid with good sensitivity and specificity, ELISA
methods are widely used and commercial available for many different targets. It
should also be noted that the surface capture mechanism can be made into a
magnetic bead (42). These beads can be mixed with the food made into a dilute
slurry thus increasing the potential capture of the antigens on the surface
(indirect ELISA method) or the antibody can be bounded first on the surface (all
other ELISA methods) and then a powerful magnet is used to separate out the
44
beads from the food, which are then washed and the other ELISA methods
used.
2.7 EPA regulations
In order to meet the goal of this study, ricin and Shiga toxin have to be
inactivated to a specific level so that it could meet the disposal standards of the
Environmental Protection Agency (EPA). However, no such limit is present in
the EPA standard although the EPA should have published rules to address the
potential public health effects from the possible presence of ricin or Shiga toxin
in water. In addition, in an event of deliberate delivery of toxins in a food supply,
we have no idea of what level of toxins are added, which would be based on
how much of a given toxin is available for delivery by the bioterrorists.
Therefore, it is hard to know what the target level for reduction of the toxin is in
the intentionally contaminated food so as to safely dispose of the toxins.
However, this could be extrapolated from other toxic compounds that have EPA
regulations. For instance, EPA has issued a Maximum Contaminant Level
(MCL) or Maximum Tolerated Dose (MTD) of 0.01 mg/L for arsenic (21). The
NOAEL (No Observable Adverse Effect Level) for arsenic is 0.009 mg/L (20),
which is almost the same as the MCL. Once we have the NOAEL for ricin or
Shiga toxin, it could be used as the MCL. Due to the lack of a NOAEL, which
must be obtained through 90 day acute feeding studies with at least 2 animal
species (such as mice and rabbits), the LD50 was divided by a factor of 1000 to
get an estimation of NOAEL. Therefore, an estimated 1000 fold inactivation
could reach a presumable safe level when there is a deliberate delivery of ricin
or Shiga toxin at the concentration of 1 human LD50. Further data is needed to
get a more exact value and we need to adjust the value for infant, children or
adults.
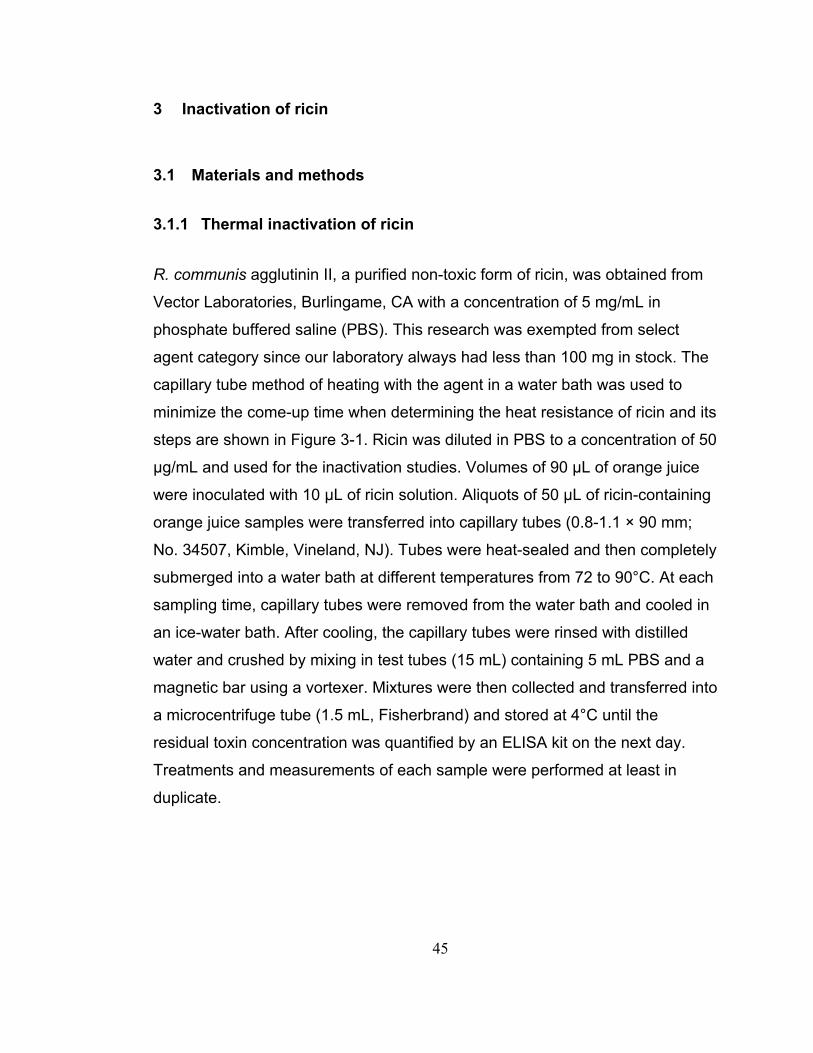
45
3 Inactivation of ricin
3.1 Materials and methods
3.1.1 Thermal inactivation of ricin
R. communis agglutinin II, a purified non-toxic form of ricin, was obtained from
Vector Laboratories, Burlingame, CA with a concentration of 5 mg/mL in
phosphate buffered saline (PBS). This research was exempted from select
agent category since our laboratory always had less than 100 mg in stock. The
capillary tube method of heating with the agent in a water bath was used to
minimize the come-up time when determining the heat resistance of ricin and its
steps are shown in Figure 3-1. Ricin was diluted in PBS to a concentration of 50
µg/mL and used for the inactivation studies. Volumes of 90 µL of orange juice
were inoculated with 10 µL of ricin solution. Aliquots of 50 µL of ricin-containing
orange juice samples were transferred into capillary tubes (0.8-1.1 × 90 mm;
No. 34507, Kimble, Vineland, NJ). Tubes were heat-sealed and then completely
submerged into a water bath at different temperatures from 72 to 90°C. At each
sampling time, capillary tubes were removed from the water bath and cooled in
an ice-water bath. After cooling, the capillary tubes were rinsed with distilled
water and crushed by mixing in test tubes (15 mL) containing 5 mL PBS and a
magnetic bar using a vortexer. Mixtures were then collected and transferred into
a microcentrifuge tube (1.5 mL, Fisherbrand) and stored at 4°C until the
residual toxin concentration was quantified by an ELISA kit on the next day.
Treatments and measurements of each sample were performed at least in
duplicate.
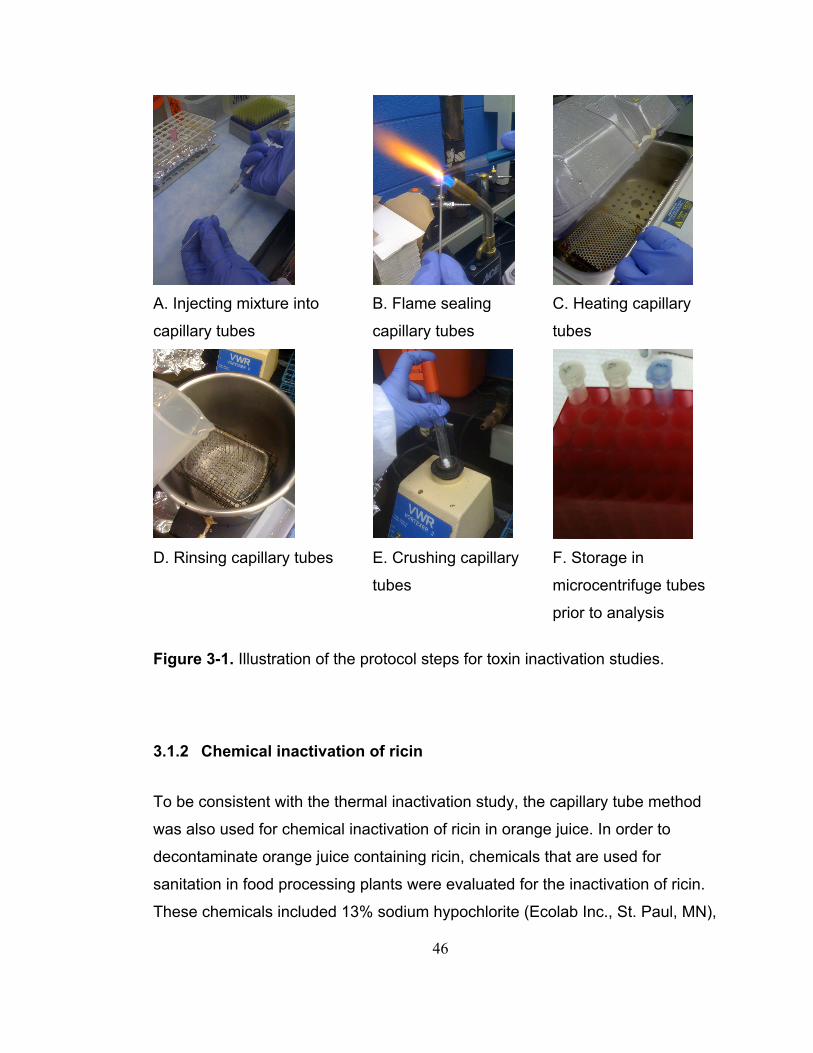
46
A. Injecting mixture into
capillary tubes
B. Flame sealing
capillary tubes
C. Heating capillary
tubes
D. Rinsing capillary tubes E. Crushing capillary
tubes
F. Storage in
microcentrifuge tubes
prior to analysis
Figure 3-1. Illustration of the protocol steps for toxin inactivation studies.
3.1.2 Chemical inactivation of ricin
To be consistent with the thermal inactivation study, the capillary tube method
was also used for chemical inactivation of ricin in orange juice. In order to
decontaminate orange juice containing ricin, chemicals that are used for
sanitation in food processing plants were evaluated for the inactivation of ricin.
These chemicals included 13% sodium hypochlorite (Ecolab Inc., St. Paul, MN),
47
1 N sodium hydroxide (Sigma-Aldrich Inc, St. Louis, MO), and 0.32% peracetic
acid (Sigma-Aldrich Inc, St. Louis, MO).
Ricin was diluted in phosphate buffered saline (PBS) to a concentration of 50
µg/mL and used for inactivation. Ricin and sanitizers were added into orange
juice in that order at the desired concentration. Volumes of 50 µL of ricin-
containing orange juice samples were then transferred into capillary tubes. The
tubes were flame-sealed and then left at room temperature. At each sampling
time, capillary tubes were transferred into an ice-water bath for cooling and then
rinsed with distilled water and crushed in test tubes containing 5 mL PBS. The
mixture was then collected and transferred into a microcentrifuge tube and
stored at 4°C until the residual toxin concentration was quantified. Treatments
and measurements of each sample were performed at least in duplicate. The
sanitizers were used separately or in combination in different concentrations.
3.1.3 Combined inactivation of ricin
Thermal and chemical inactivation methods were combined to determine any
synergistic effect. Combined inactivation was similar with the chemical
inactivation method, except for the submerging of the ricin-containing orange
juice samples in the capillary tubes into a water bath at desired temperature
instead of holding at room temperature. Duplicates were performed. Sanitizers
were used separately or in combination at different concentrations and
temperatures.
3.1.4 ELISA test for ricin
The residual ricin concentration was quantified using a pre-coated indirect
48
capture ELISA kit (Tetracore Inc., Rockville, MD). Multi-point standard curves
as well as positive and negative controls were established for each ELISA plate
to reduce the variations among ELISA testing. The cut-off concentration
calculated using the instruction of kit was 5 ng/mL.
The Tetracore ELISA kit utilizes the indirect capture ELISA format, i.e. wells
coated with positive capture antibody (goat anti-ricin) and with negative capture
antibody (normal goat). When testing, each well in the plate (96 total) was first
blocked with 150 µL of ELISA dilution/blocking buffer made from dry skim milk
and incubated at 37°C for 1 h. PBST (phosphate buffered saline with Tween-
20) made prior to the ELISA test was used to wash the wells for four times.
Aliquots of 100 µL positive control, negative control as well as testing samples
were added into corresponding wells and incubated at 37°C for 1 h. After
washing with PBST according to the manufacturer’s instructions, volumes of
100 µL of detector antibody (monoclonal antibody, 10 µg/mL) were then added
into each well and the plate was incubated again at 37°C for 1 h. Wells were
washed again with PBST to remove unbound detector antibodies. Volumes of
100 µL of conjugate antibodies (goat anti-mouse IgG (H+L)-HRP) with a
concentration of 0.08 µg/mL were added to each well and the plate was
incubated again at 37°C for 1 h. After washing to remove unbound conjugate
antibodies, 100 µL aliquots of substrate (ABTS 2-part peroxidase) were added
to each individual well and the plate was incubated again at 37°C for 30 min.
Absorbance was measured at 405 nm using a Bio-Tek Kinetics microplate
Reader (Bio-Tek Instruments Inc., Winooski, VT) and software (KC 4, Bio-Tek).
According to the manufacture, the kit is able to detect the holotoxin, A chain and
B chain but no other information on epitope is available.
3.1.5 Data analysis
The residual ricin percentage was calculated from the concentration of ricin
49
detected in the treated orange juice versus the amount of ricin at time zero as
determined by ELISA. The kinetics of heat treatments were determined by first-
order regression plots of concentration over time. The inactivation rate constant
(k), half-life (t1/2) (time for a toxin to be inactivated by half) were calculated using
a spreadsheet developed by Dr. Ted Labuza (University of Minnesota) and the
D value (time required to reduce the toxicity of a toxin by a factor of 10) were
estimated by linear regression. Activation energy (Ea) (the threshold or energy
barrier that must be overcome or surpassed to permit the transformation of
reactants into products), Q10 (increase in rate for a 10°C increase in
temperature) and Z value (change in temperature that accompanies a 10-fold
change in D value) were also calculated using these models. In addition, the
times for a 12 fold half-life destruction (12 × t1/2) were calculated assuming that
the final concentration has to be reduced to ~ 0.02% of the initial amount to
meet EPA standards for disposal.
All experiments were replicated at least twice with duplicate samples at each
time interval for each treatment. The lack of convergence of the upper and
lower 95% confidence limits were calculated in each plot of residual ricin (%)
versus treatment time and semi-log plots of D value versus temperature (41).
Note that all original data are available in an electronic appendix.
3.2 Results
3.2.1 Establishment of ELISA standard curve
The product inserts of each ELISA kit included quality control standard curves
provided by the manufacturer with a linear range from 1.2 to 20 ng/mL of ricin
(Figure 3-2). However, the experimental standard curve rarely matched the kits’
standard curves and each standard curve was different with each
determination. Figure 3-3 shows four different repetitions for standard curves
with different ELISA plates for ricin. The results indicated that there were
marked variations in the ELISA kits and individual standard curves had to be
50
performed for each ELISA plate.
Figure 3-2. Example of a quality control standard curve included in an ELISA kit
insert for ricin by the manufacturer.
0.0
0.5
1.0
1.5
2.0
2.5
3.0
0 5 10 15 20 25 30
Concentration of ricin (ng/mL)
OD
val
ue
Figure 3-3. Standard curves plots from four different ELISA plates for ricin
detection. Note that each symbol represents the results for the standardization
of different 96 well plates.
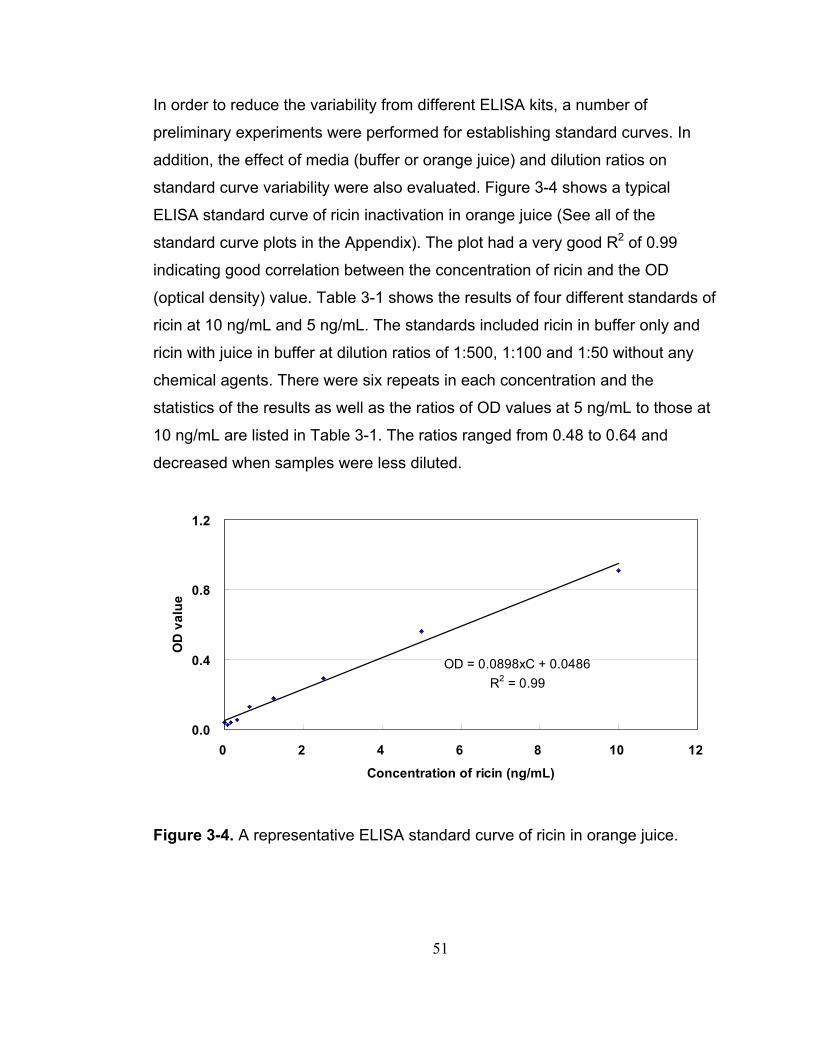
51
In order to reduce the variability from different ELISA kits, a number of
preliminary experiments were performed for establishing standard curves. In
addition, the effect of media (buffer or orange juice) and dilution ratios on
standard curve variability were also evaluated. Figure 3-4 shows a typical
ELISA standard curve of ricin inactivation in orange juice (See all of the
standard curve plots in the Appendix). The plot had a very good R2 of 0.99
indicating good correlation between the concentration of ricin and the OD
(optical density) value. Table 3-1 shows the results of four different standards of
ricin at 10 ng/mL and 5 ng/mL. The standards included ricin in buffer only and
ricin with juice in buffer at dilution ratios of 1:500, 1:100 and 1:50 without any
chemical agents. There were six repeats in each concentration and the
statistics of the results as well as the ratios of OD values at 5 ng/mL to those at
10 ng/mL are listed in Table 3-1. The ratios ranged from 0.48 to 0.64 and
decreased when samples were less diluted.
OD = 0.0898xC + 0.0486R2 = 0.99
0.0
0.4
0.8
1.2
0 2 4 6 8 10 12
Concentration of ricin (ng/mL)
OD
val
ue
Figure 3-4. A representative ELISA standard curve of ricin in orange juice.
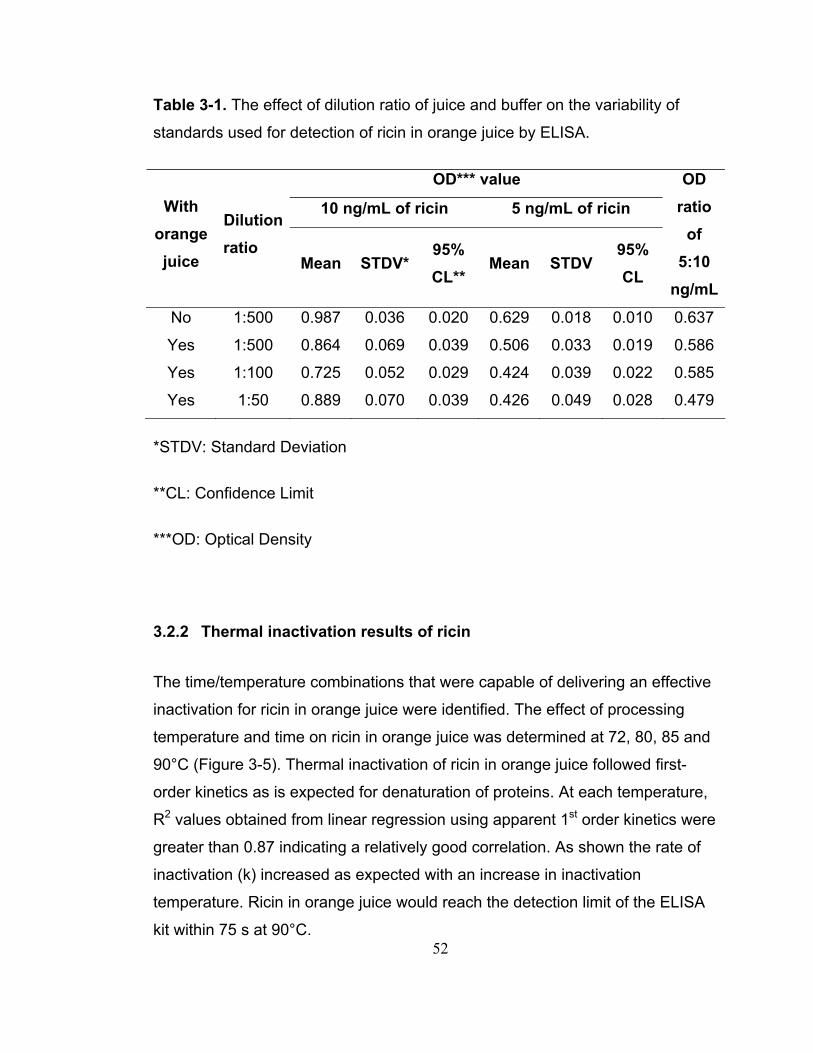
52
Table 3-1. The effect of dilution ratio of juice and buffer on the variability of
standards used for detection of ricin in orange juice by ELISA.
OD*** value
10 ng/mL of ricin 5 ng/mL of ricin With orange juice
Dilution ratio
Mean STDV*95% CL**
Mean STDV 95% CL
OD ratio
of 5:10
ng/mL
No 1:500 0.987 0.036 0.020 0.629 0.018 0.010 0.637
Yes 1:500 0.864 0.069 0.039 0.506 0.033 0.019 0.586
Yes 1:100 0.725 0.052 0.029 0.424 0.039 0.022 0.585
Yes 1:50 0.889 0.070 0.039 0.426 0.049 0.028 0.479
*STDV: Standard Deviation
**CL: Confidence Limit
***OD: Optical Density
3.2.2 Thermal inactivation results of ricin
The time/temperature combinations that were capable of delivering an effective
inactivation for ricin in orange juice were identified. The effect of processing
temperature and time on ricin in orange juice was determined at 72, 80, 85 and
90°C (Figure 3-5). Thermal inactivation of ricin in orange juice followed first-
order kinetics as is expected for denaturation of proteins. At each temperature,
R2 values obtained from linear regression using apparent 1st order kinetics were
greater than 0.87 indicating a relatively good correlation. As shown the rate of
inactivation (k) increased as expected with an increase in inactivation
temperature. Ricin in orange juice would reach the detection limit of the ELISA
kit within 75 s at 90°C.
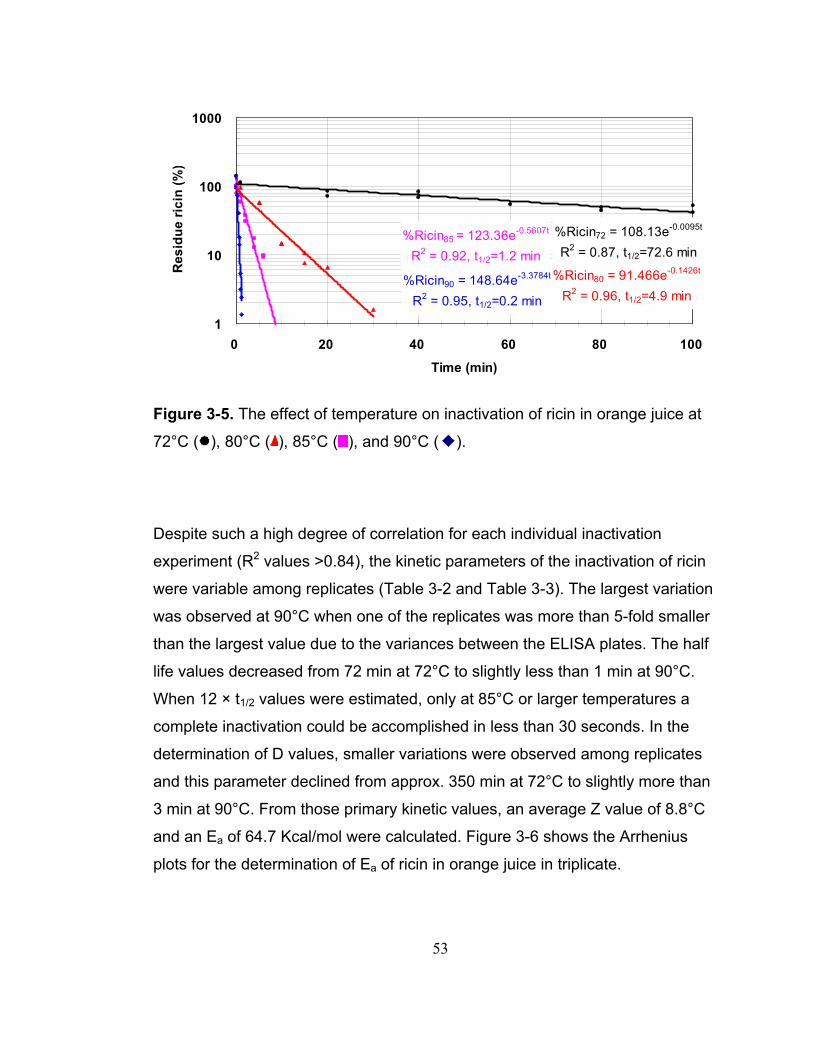
53
%Ricin90 = 148.64e-3.3784t
R2 = 0.95, t1/2=0.2 min
%Ricin85 = 123.36e-0.5607t
R2 = 0.92, t1/2=1.2 min%Ricin80 = 91.466e-0.1426t
R2 = 0.96, t1/2=4.9 min
%Ricin72 = 108.13e-0.0095t
R2 = 0.87, t1/2=72.6 min
1
10
100
1000
0 20 40 60 80 100
Time (min)
Res
idue
rici
n (%
)
Figure 3-5. The effect of temperature on inactivation of ricin in orange juice at
72°C ( ), 80°C ( ), 85°C ( ), and 90°C ( ).
Despite such a high degree of correlation for each individual inactivation
experiment (R2 values >0.84), the kinetic parameters of the inactivation of ricin
were variable among replicates (Table 3-2 and Table 3-3). The largest variation
was observed at 90°C when one of the replicates was more than 5-fold smaller
than the largest value due to the variances between the ELISA plates. The half
life values decreased from 72 min at 72°C to slightly less than 1 min at 90°C.
When 12 × t1/2 values were estimated, only at 85°C or larger temperatures a
complete inactivation could be accomplished in less than 30 seconds. In the
determination of D values, smaller variations were observed among replicates
and this parameter declined from approx. 350 min at 72°C to slightly more than
3 min at 90°C. From those primary kinetic values, an average Z value of 8.8°C
and an Ea of 64.7 Kcal/mol were calculated. Figure 3-6 shows the Arrhenius
plots for the determination of Ea of ricin in orange juice in triplicate.
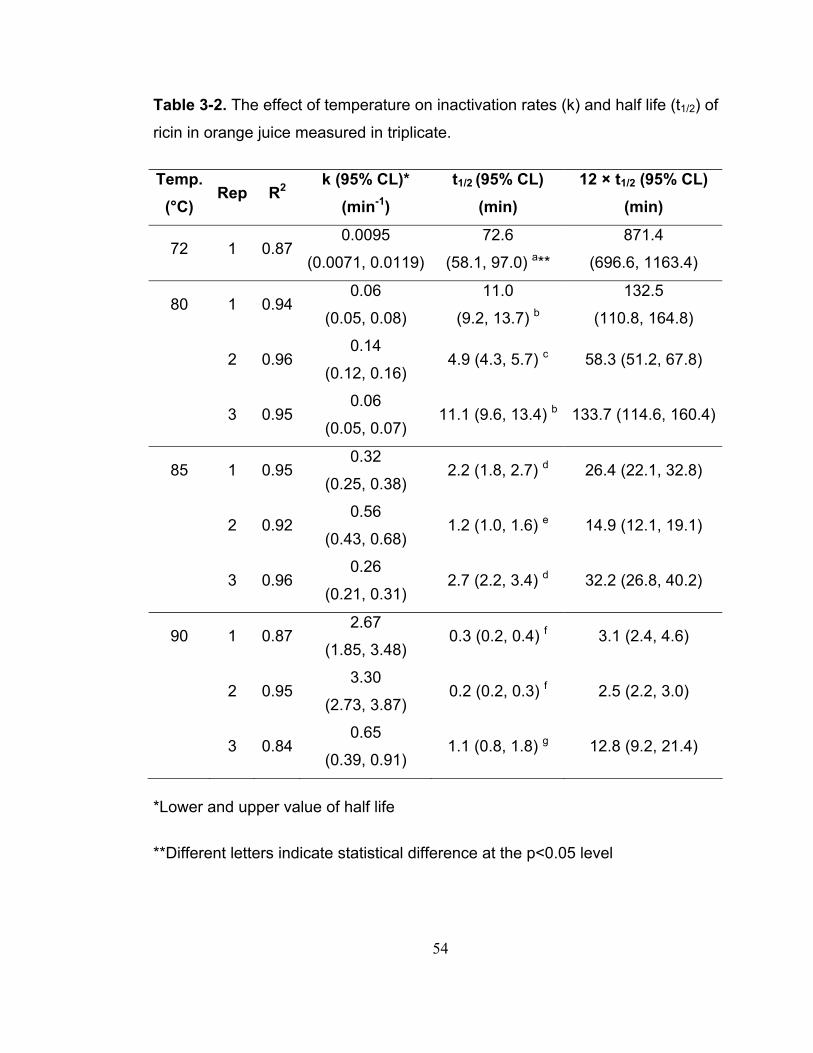
54
Table 3-2. The effect of temperature on inactivation rates (k) and half life (t1/2) of
ricin in orange juice measured in triplicate.
Temp. (°C)
Rep R2 k (95% CL)*
(min-1) t1/2 (95% CL)
(min) 12 × t1/2 (95% CL)
(min)
72 1 0.87 0.0095
(0.0071, 0.0119)
72.6
(58.1, 97.0) a**
871.4
(696.6, 1163.4)
80 1 0.94 0.06
(0.05, 0.08)
11.0
(9.2, 13.7) b
132.5
(110.8, 164.8)
2 0.96 0.14
(0.12, 0.16) 4.9 (4.3, 5.7) c 58.3 (51.2, 67.8)
3 0.95 0.06
(0.05, 0.07) 11.1 (9.6, 13.4) b 133.7 (114.6, 160.4)
85 1 0.95 0.32
(0.25, 0.38) 2.2 (1.8, 2.7) d 26.4 (22.1, 32.8)
2 0.92 0.56
(0.43, 0.68) 1.2 (1.0, 1.6) e 14.9 (12.1, 19.1)
3 0.96 0.26
(0.21, 0.31) 2.7 (2.2, 3.4) d 32.2 (26.8, 40.2)
90 1 0.87 2.67
(1.85, 3.48) 0.3 (0.2, 0.4) f 3.1 (2.4, 4.6)
2 0.95 3.30
(2.73, 3.87) 0.2 (0.2, 0.3) f 2.5 (2.2, 3.0)
3 0.84 0.65
(0.39, 0.91) 1.1 (0.8, 1.8) g 12.8 (9.2, 21.4)
*Lower and upper value of half life
**Different letters indicate statistical difference at the p<0.05 level
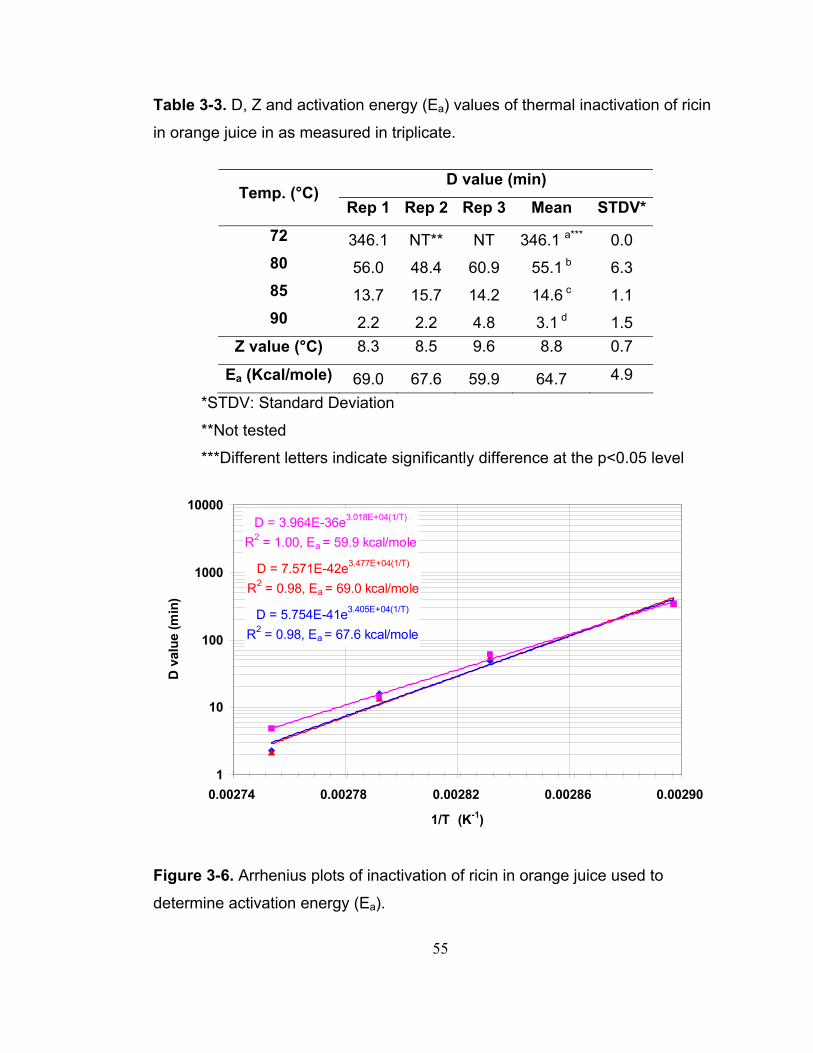
55
Table 3-3. D, Z and activation energy (Ea) values of thermal inactivation of ricin
in orange juice in as measured in triplicate.
D value (min) Temp. (°C)
Rep 1 Rep 2 Rep 3 Mean STDV*
72 346.1 NT** NT 346.1 a*** 0.0 80 56.0 48.4 60.9 55.1 b 6.3 85 13.7 15.7 14.2 14.6 c 1.1 90 2.2 2.2 4.8 3.1 d 1.5
Z value (°C) 8.3 8.5 9.6 8.8 0.7
Ea (Kcal/mole) 69.0 67.6 59.9 64.7 4.9
*STDV: Standard Deviation
**Not tested
***Different letters indicate significantly difference at the p<0.05 level
D = 7.571E-42e3.477E+04(1/T)
R2 = 0.98, Ea = 69.0 kcal/mole
D = 5.754E-41e3.405E+04(1/T)
R2 = 0.98, Ea = 67.6 kcal/mole
D = 3.964E-36e3.018E+04(1/T)
R2 = 1.00, Ea = 59.9 kcal/mole
1
10
100
1000
10000
0.00274 0.00278 0.00282 0.00286 0.00290
1/T (K-1)
D v
alue
(min
)
Figure 3-6. Arrhenius plots of inactivation of ricin in orange juice used to
determine activation energy (Ea).
56
3.2.3 Chemical inactivation results for ricin
The effects of sanitizing chemicals on inactivation of ricin in orange juice were
evaluated at room temperature (approximately 23°C). The ricin concentration
was significantly reduced immediately after addition of 0.18 to 0.20 N NaOH
(Figure 3-4), but at 0.16 N or less little to no effect was observed. When NaOCl
was used, a concentration dependent inactivation of ricin was detected (Figure
3-8). Almost 70% of the ricin concentration was inactivated after addition of 1%
of NaOCl. The inactivation effect with peracetic acid (PA) also followed the
similar trend as the other two chemicals (Figure 3-9). The residual ricin
immediately after addition of increased concentration of PA was markedly
decreased. Reductions to <10% residual ricin occurred at approx. 0.02% PA
making it the most effective sanitizer capable of inactivating ricin by simple
addition. All three chemicals shared the same concentration dependent trend,
however, no further inactivation effect was observed after a certain period of
time. When the concentration of each chemical was increased to a sufficient
amount, the detection limit of the ELISA kit was attained when measuring ricin
inactivated within 5 s at room temperature.
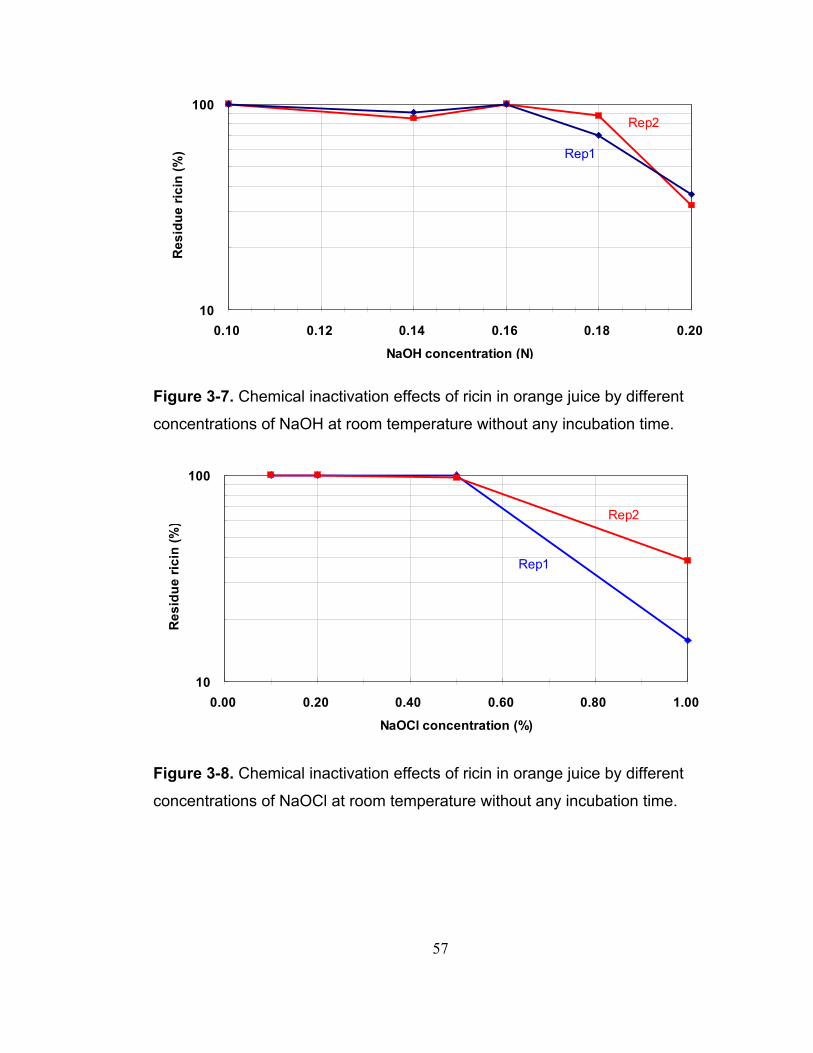
57
10
100
0.10 0.12 0.14 0.16 0.18 0.20
NaOH concentration (N)
Res
idue
rici
n (%
) Rep1
Rep2
Figure 3-7. Chemical inactivation effects of ricin in orange juice by different
concentrations of NaOH at room temperature without any incubation time.
10
100
0.00 0.20 0.40 0.60 0.80 1.00
NaOCl concentration (%)
Res
idue
rici
n (%
)
Rep1
Rep2
Figure 3-8. Chemical inactivation effects of ricin in orange juice by different
concentrations of NaOCl at room temperature without any incubation time.
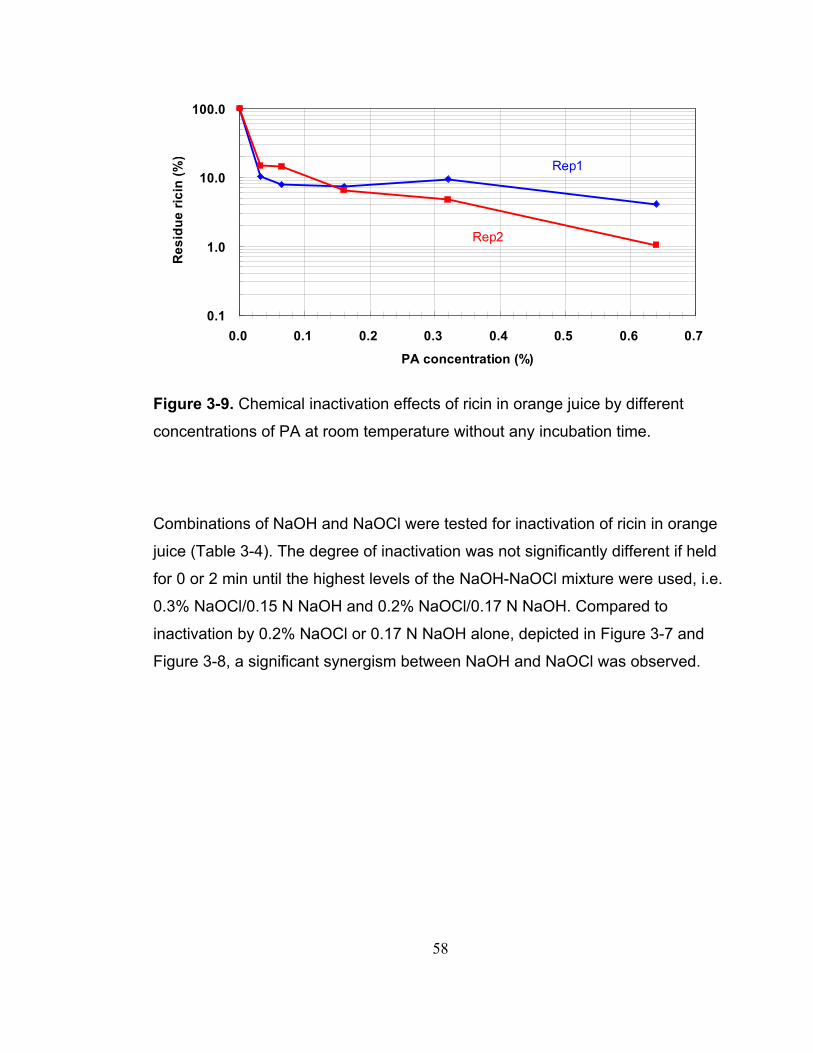
58
0.1
1.0
10.0
100.0
0.0 0.1 0.2 0.3 0.4 0.5 0.6 0.7
PA concentration (%)
Res
idue
rici
n (%
)Rep1
Rep2
Figure 3-9. Chemical inactivation effects of ricin in orange juice by different
concentrations of PA at room temperature without any incubation time.
Combinations of NaOH and NaOCl were tested for inactivation of ricin in orange
juice (Table 3-4). The degree of inactivation was not significantly different if held
for 0 or 2 min until the highest levels of the NaOH-NaOCl mixture were used, i.e.
0.3% NaOCl/0.15 N NaOH and 0.2% NaOCl/0.17 N NaOH. Compared to
inactivation by 0.2% NaOCl or 0.17 N NaOH alone, depicted in Figure 3-7 and
Figure 3-8, a significant synergism between NaOH and NaOCl was observed.
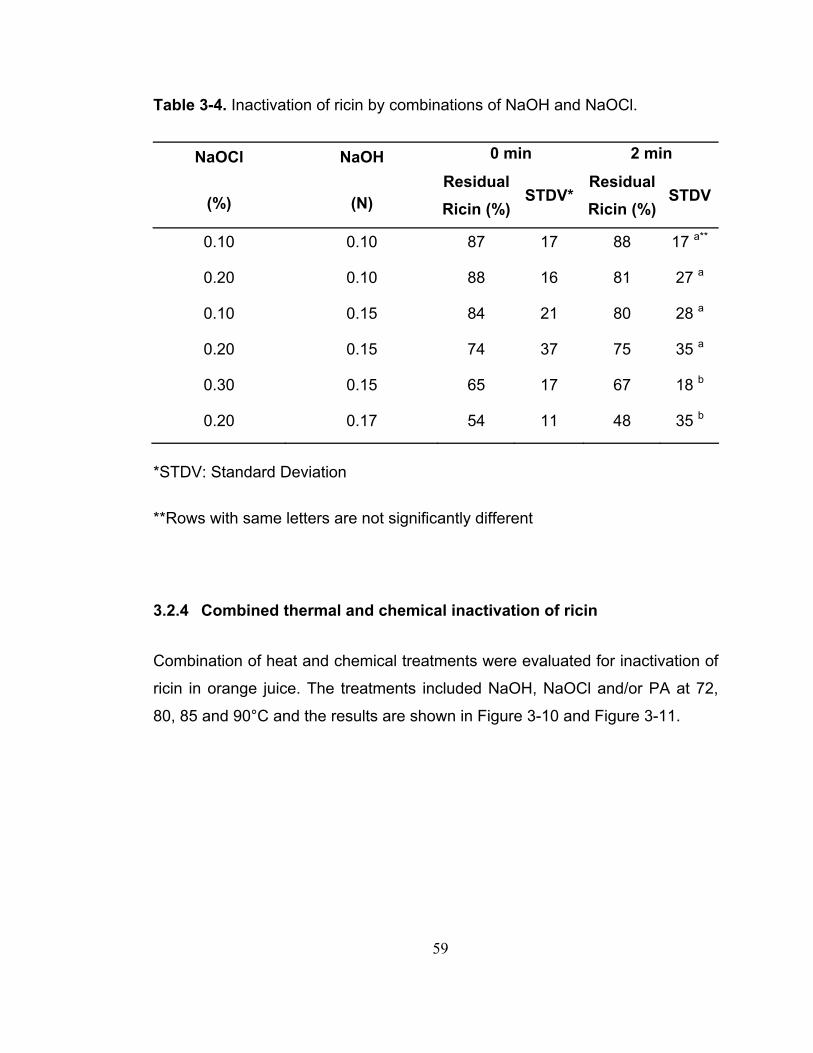
59
Table 3-4. Inactivation of ricin by combinations of NaOH and NaOCl.
0 min 2 min NaOCl
(%)
NaOH
(N) Residual Ricin (%)
STDV* Residual Ricin (%)
STDV
0.10 0.10 87 17 88 17 a**
0.20 0.10 88 16 81 27 a
0.10 0.15 84 21 80 28 a
0.20 0.15 74 37 75 35 a
0.30 0.15 65 17 67 18 b
0.20 0.17 54 11 48 35 b
*STDV: Standard Deviation
**Rows with same letters are not significantly different
3.2.4 Combined thermal and chemical inactivation of ricin
Combination of heat and chemical treatments were evaluated for inactivation of
ricin in orange juice. The treatments included NaOH, NaOCl and/or PA at 72,
80, 85 and 90°C and the results are shown in Figure 3-10 and Figure 3-11.
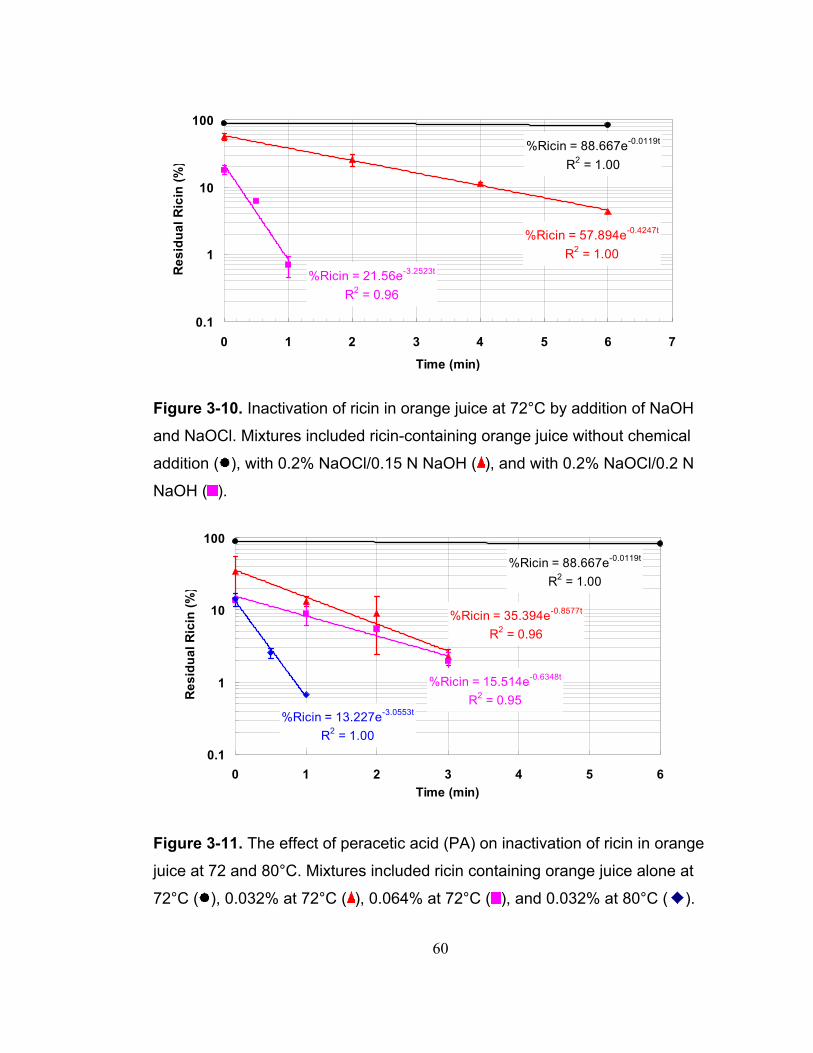
60
%Ricin = 21.56e-3.2523t
R2 = 0.96
%Ricin = 57.894e-0.4247t
R2 = 1.00
%Ricin = 88.667e-0.0119t
R2 = 1.00
0.1
1
10
100
0 1 2 3 4 5 6 7
Time (min)
Res
idua
l Ric
in (%
)
Figure 3-10. Inactivation of ricin in orange juice at 72°C by addition of NaOH
and NaOCl. Mixtures included ricin-containing orange juice without chemical
addition ( ), with 0.2% NaOCl/0.15 N NaOH ( ), and with 0.2% NaOCl/0.2 N
NaOH ( ).
%Ricin = 88.667e-0.0119t
R2 = 1.00
%Ricin = 35.394e-0.8577t
R2 = 0.96
%Ricin = 15.514e-0.6348t
R2 = 0.95%Ricin = 13.227e-3.0553t
R2 = 1.000.1
1
10
100
0 1 2 3 4 5 6Time (min)
Res
idua
l Ric
in (%
)
Figure 3-11. The effect of peracetic acid (PA) on inactivation of ricin in orange
juice at 72 and 80°C. Mixtures included ricin containing orange juice alone at
72°C ( ), 0.032% at 72°C ( ), 0.064% at 72°C ( ), and 0.032% at 80°C ( ).
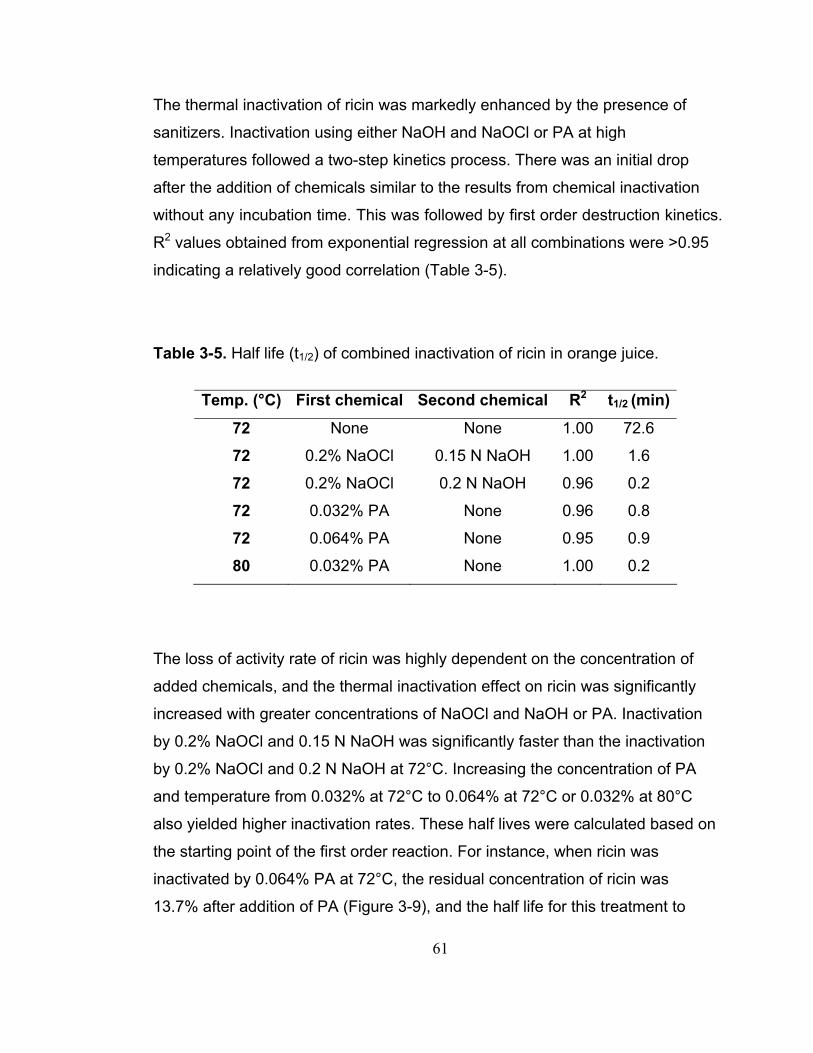
61
The thermal inactivation of ricin was markedly enhanced by the presence of
sanitizers. Inactivation using either NaOH and NaOCl or PA at high
temperatures followed a two-step kinetics process. There was an initial drop
after the addition of chemicals similar to the results from chemical inactivation
without any incubation time. This was followed by first order destruction kinetics.
R2 values obtained from exponential regression at all combinations were >0.95
indicating a relatively good correlation (Table 3-5).
Table 3-5. Half life (t1/2) of combined inactivation of ricin in orange juice.
Temp. (°C) First chemical Second chemical R2 t1/2 (min)
72 None None 1.00 72.6
72 0.2% NaOCl 0.15 N NaOH 1.00 1.6
72 0.2% NaOCl 0.2 N NaOH 0.96 0.2
72 0.032% PA None 0.96 0.8
72 0.064% PA None 0.95 0.9
80 0.032% PA None 1.00 0.2
The loss of activity rate of ricin was highly dependent on the concentration of
added chemicals, and the thermal inactivation effect on ricin was significantly
increased with greater concentrations of NaOCl and NaOH or PA. Inactivation
by 0.2% NaOCl and 0.15 N NaOH was significantly faster than the inactivation
by 0.2% NaOCl and 0.2 N NaOH at 72°C. Increasing the concentration of PA
and temperature from 0.032% at 72°C to 0.064% at 72°C or 0.032% at 80°C
also yielded higher inactivation rates. These half lives were calculated based on
the starting point of the first order reaction. For instance, when ricin was
inactivated by 0.064% PA at 72°C, the residual concentration of ricin was
13.7% after addition of PA (Figure 3-9), and the half life for this treatment to
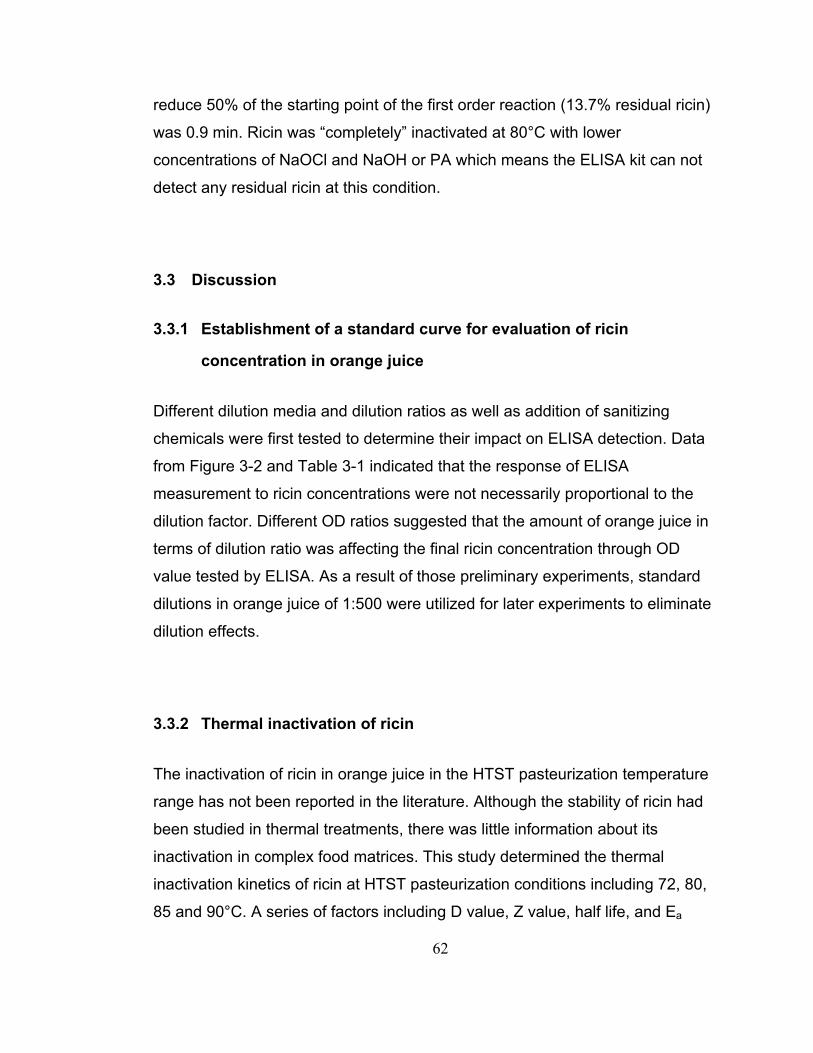
62
reduce 50% of the starting point of the first order reaction (13.7% residual ricin)
was 0.9 min. Ricin was “completely” inactivated at 80°C with lower
concentrations of NaOCl and NaOH or PA which means the ELISA kit can not
detect any residual ricin at this condition.
3.3 Discussion
3.3.1 Establishment of a standard curve for evaluation of ricin
concentration in orange juice
Different dilution media and dilution ratios as well as addition of sanitizing
chemicals were first tested to determine their impact on ELISA detection. Data
from Figure 3-2 and Table 3-1 indicated that the response of ELISA
measurement to ricin concentrations were not necessarily proportional to the
dilution factor. Different OD ratios suggested that the amount of orange juice in
terms of dilution ratio was affecting the final ricin concentration through OD
value tested by ELISA. As a result of those preliminary experiments, standard
dilutions in orange juice of 1:500 were utilized for later experiments to eliminate
dilution effects.
3.3.2 Thermal inactivation of ricin
The inactivation of ricin in orange juice in the HTST pasteurization temperature
range has not been reported in the literature. Although the stability of ricin had
been studied in thermal treatments, there was little information about its
inactivation in complex food matrices. This study determined the thermal
inactivation kinetics of ricin at HTST pasteurization conditions including 72, 80,
85 and 90°C. A series of factors including D value, Z value, half life, and Ea
63
were determined from the inactivation kinetics.
The results of this study indicate that thermal treatment could be a relatively
effective method for inactivating ricin in orange juice. Although heat could not
ensure complete inactivation of ricin present in orange juice at standard HTST
pasteurization conditions (72°C, 15 s; 90°C, 0.5 s), the thermal resistance of
ricin is remarkably reduced with increased temperature likely due to the
denaturation of the toxin protein. The half life of ricin decreased approximately
140-fold when the heating temperature was increased from 72 to 90°C.
Xu and others (unpublished) studied the thermal inactivation effect of ricin in
milk in the HTST temperature range. The results in milk as compared to the
results of this study in juice are shown in Table 3-6. The current study found
that the half life at each temperature and the Z value were higher than the
corresponding ones found in milk while the activation energy was lower than the
one found in milk. Since the inactivation steps were almost the same, the main
difference between these two studies were likely due to the difference of the
composition of orange juice and milk in terms of pH, ionic strength as well as
the presence of protein. Furthermore, to the author’s acknowledge, Xu and
others chose a wider range of ricin concentration to establish the standard
curves and data points with OD values greater than 2.5 also considered in the
standard equation. These would all contribute to the significant difference
between the results of the current study and the ones from Xu and others.
Table 3-6 also compares the Z value obtained here to the milk and soy based
infant formulas from Jackson and others (29). Although the FDA values were in
the same order of magnitude, they had lower activation energy and higher Z
value compared to the inactivation studies of ricin in orange juice. Possible
reasons include the different characteristics between infant formulas and
orange juice such as the composition and pH values. Inactivation methods were
very different since larger glass test tubes (size not specified) were used in the
64
FDA study while capillary tubes were used in the current study. One mL
aliquots of samples in glass test tubes would have been difficult to heat evenly
and the come-up time (less than 2 min) was not considered in their final
calculation. These factors could have contributed to the differences in these
kinetics values.
Table 3-6. Comparison of thermal inactivation parameters of ricin in milk and
orange juice.
Half life t1/2 (min)
Infant formula Medium
Soy basedMilk
based
Milk Orange
juice
Temp. (°C) Jackson and others,
(29) (FDA) Xu and others, (unpublished)
Current work
60 99.0 115.5 NT* NT
70 16.1 9.9 NT NT
72 NT NT 32.1 72.6
75 8.7 5.8 NT NT
80 6.9 5.0 3.0 9.0
85 3.0 3.2 0.5 2.0
90 2.0 1.8 0.2 0.5
Ea (kcal/mole) 30.6 30.9 72.9 64.7
Z value (°C) 18 18 7.8 8.8
*Not tested
65
Losikoff (45) determined the Z value for inactivation of Clostridium botulinum
62A protein toxin in beef broth using 1.5 mL of samples in thermal death time
tubes (9 by 150 mm). The effect of lethality of mice after intraperitoneal injection
of treated toxin was evaluated. The come-up time was considered in this study
although they didn’t mention how they measured it. Z values obtained for
Clostridium botulinum 62A protein toxin were 5.4°C and 4.6°C in beef broth at
pH 6.8 and pH 5.0, respectively. These Z values were somewhat less than the
Z value obtained for ricin in orange juice. A smaller Z value equals to a steeper
slope of D value versus temperature, so it indicates that the reaction is more
sensitive to temperature, i.e. it has a higher activation energy. Similarly,
characteristics of beef broth and orange juice as well as volumes of samples
and the detection methods were different. The nature of the Clostridium
botulinum 62A protein toxin should be the main contributor to the huge
difference.
Many inactivation studies on Staphylococcus aureus enterotoxin have been
done previously. Read and Bradshaw (60), Hilker and others (27) and Denny
and others (16) conducted studies on the inactivation of Staphylococcus aureus
enterotoxin A or B, respectively. Studies on enterotoxin A considered the come-
up time while the study on enterotoxin B did not mention any information about
the come-up time. Their results showed that the Z value for Staphylococcus
aureus enterotoxin A was 27.8°C in Veronal buffer (pH 7.2) and beef bouillon
(pH 6.2) the one for enterotoxin B was 25.9°C in milk. These values are
significantly greater than the Z values obtained for ricin in orange juice. The
protein toxin structure and the characteristics of food matrices could be the two
main reasons for the huge differences, but one would expect smaller Z values
for any type of protein denaturation.
66
3.3.3 Chemical inactivation of ricin
Since thermal inactivation alone did not seem to be sufficient to inactivate ricin
at HTST temperatures, the addition of chemical sanitizers for inactivating ricin in
orange juice was studied. NaOH and NaOCl have been widely used as
sanitizers in food processing plants and have been routinely used in research
laboratories to destroy biotoxins, such as ricin (8). PA has been recognized as
an ideal antimicrobial agent as well as a sanitizing agent due to its high
oxidizing potential. The effect of these three chemicals was to be very sensitive
to changes in concentration for inactivation of ricin in orange juice. For instance,
0.18 N NaOH had little effect on the inactivation of ricin but 0.20 N NaOH had a
relatively stronger effect to inactive ricin. Since these chemicals could interact
with a variety of substances, lower concentrations of chemicals would be
consumed rapidly and depleted while no or little amount left for the inactivation
of ricin. Therefore, higher concentrations were necessary for inactivation.
NaOH and NaOCl are widely used as disinfectants. The alkali ion from NaOH
plays a key role in destruction of ricin protein. Previous studies recommended
using 0.1 to 0.5% or 0.1 N NaOH for the inactivation of biological toxins on
surfaces (49). NaOH was also studied in the inactivation of ricin in castor cake
(1) (Table 3-7). Similar results were found that increasing the concentration of
NaOH could increase the inactivation of ricin. However, there was a huge
difference between that and the current study when inactivating ricin by 0.18 N
NaOH (18% versus ~85%). This may be due to the methodology as well as the
characteristics of castor bean cake and orange juice. The extraction efficiency
of ricin from the castor bean cake played an important role in the estimation of
ricin. The study (62) that used 0.5 M NaOH for inactivation of viruses has
extremely rapid rates of inactivation similar as the initial drop in the present
study.
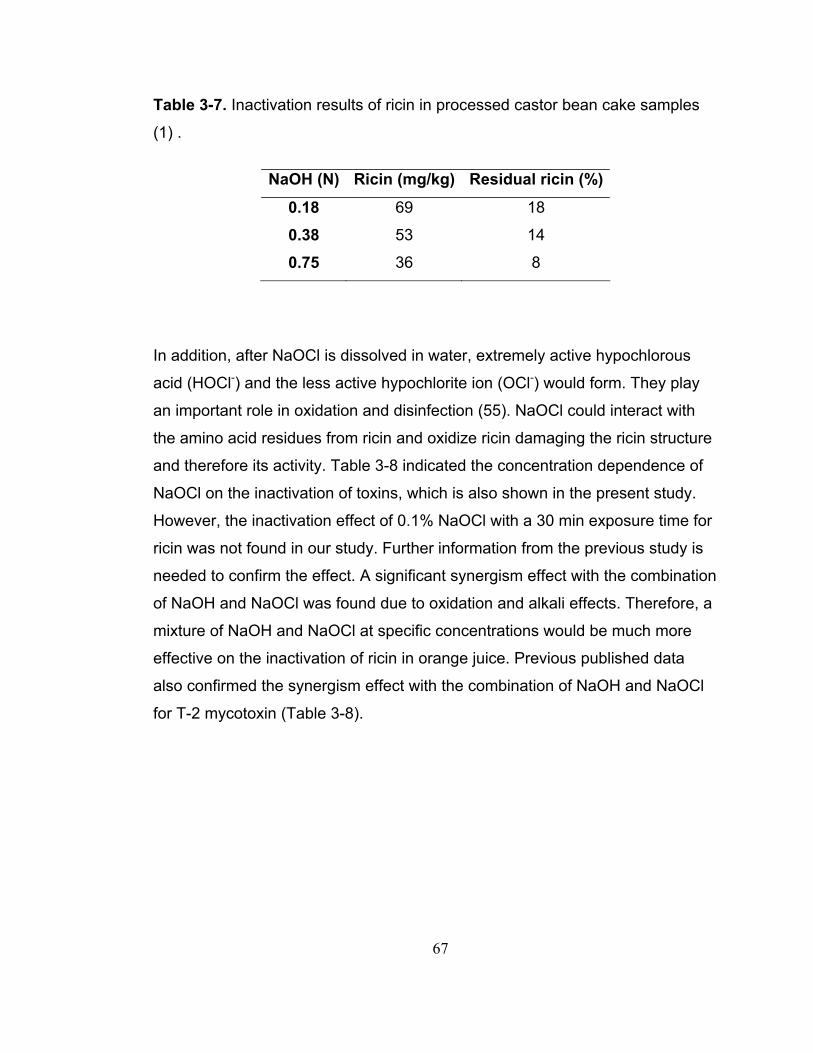
67
Table 3-7. Inactivation results of ricin in processed castor bean cake samples
(1) .
NaOH (N) Ricin (mg/kg) Residual ricin (%)
0.18 69 18
0.38 53 14
0.75 36 8
In addition, after NaOCl is dissolved in water, extremely active hypochlorous
acid (HOCl-) and the less active hypochlorite ion (OCl-) would form. They play
an important role in oxidation and disinfection (55). NaOCl could interact with
the amino acid residues from ricin and oxidize ricin damaging the ricin structure
and therefore its activity. Table 3-8 indicated the concentration dependence of
NaOCl on the inactivation of toxins, which is also shown in the present study.
However, the inactivation effect of 0.1% NaOCl with a 30 min exposure time for
ricin was not found in our study. Further information from the previous study is
needed to confirm the effect. A significant synergism effect with the combination
of NaOH and NaOCl was found due to oxidation and alkali effects. Therefore, a
mixture of NaOH and NaOCl at specific concentrations would be much more
effective on the inactivation of ricin in orange juice. Previous published data
also confirmed the synergism effect with the combination of NaOH and NaOCl
for T-2 mycotoxin (Table 3-8).
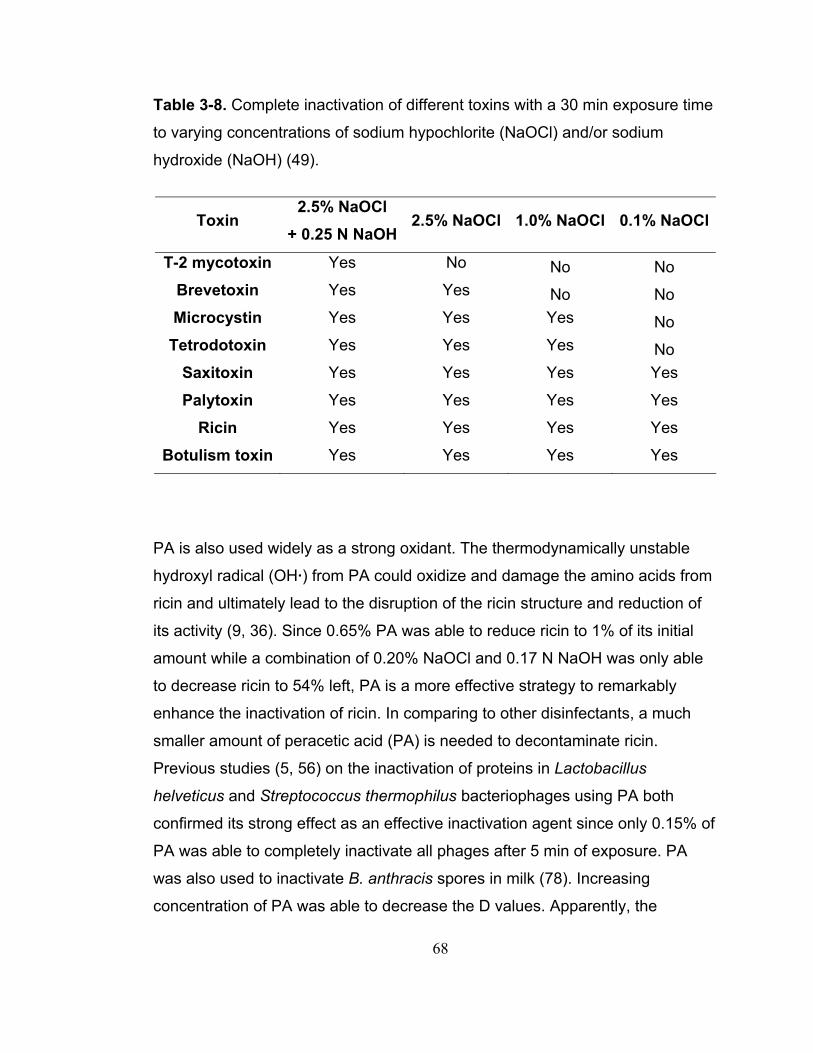
68
Table 3-8. Complete inactivation of different toxins with a 30 min exposure time
to varying concentrations of sodium hypochlorite (NaOCl) and/or sodium
hydroxide (NaOH) (49).
Toxin 2.5% NaOCl
+ 0.25 N NaOH2.5% NaOCl 1.0% NaOCl 0.1% NaOCl
T-2 mycotoxin Yes No No No Brevetoxin Yes Yes No No Microcystin Yes Yes Yes No
Tetrodotoxin Yes Yes Yes No Saxitoxin Yes Yes Yes Yes
Palytoxin Yes Yes Yes Yes
Ricin Yes Yes Yes Yes
Botulism toxin Yes Yes Yes Yes
PA is also used widely as a strong oxidant. The thermodynamically unstable
hydroxyl radical (OH·) from PA could oxidize and damage the amino acids from
ricin and ultimately lead to the disruption of the ricin structure and reduction of
its activity (9, 36). Since 0.65% PA was able to reduce ricin to 1% of its initial
amount while a combination of 0.20% NaOCl and 0.17 N NaOH was only able
to decrease ricin to 54% left, PA is a more effective strategy to remarkably
enhance the inactivation of ricin. In comparing to other disinfectants, a much
smaller amount of peracetic acid (PA) is needed to decontaminate ricin.
Previous studies (5, 56) on the inactivation of proteins in Lactobacillus
helveticus and Streptococcus thermophilus bacteriophages using PA both
confirmed its strong effect as an effective inactivation agent since only 0.15% of
PA was able to completely inactivate all phages after 5 min of exposure. PA
was also used to inactivate B. anthracis spores in milk (78). Increasing
concentration of PA was able to decrease the D values. Apparently, the
69
inactivation of spores by PA at a specific temperature was time-dependent,
according to the reported data. This was different with the initial drop, which
was non time dependence, found in the present study which may be explained
by the differences in the nature of spores or toxins. In summary, PA is a very
potent inactivation agent that could be used for decontamination in a deliberate
delivery of ricin in a food system by bioterrorists.
3.3.4 Combined inactivation of ricin with heat and chemicals
The combination of heat and the three sanitizers studied including NaOH,
NaOCl or PA was an effective method to inactivate ricin in orange juice at HTST
pasteurization temperatures. It included the inactivation effect from heat or
chemical treatment and a combination with two-step inactivation.
The inactivation rate of ricin in milk and orange juice both were highly
dependent on the concentration of the chemical substances as well as the
heating temperature and time. Significant synergistic effects between NaOH
and NaOCl were observed in orange juice. Different food matrices have to be
studied individually to determine feasible inactivation conditions.
The estimated lethal dose for human ingestion of ricin is approx. between 1 to
20 mg/kg body weight (6, 75), estimated from consumption of whole castor
beans. Using the higher value, the estimated lethal dose for a 20 kg child using
an uncertainty factor of 100 (10 for the most sensitive population and 10 for the
maximum contaminant level in water) would be 4 mg. A 7,000 gal (26,409 kg)
silo of orange juice plant is capable to produce 106,000 servings of orange juice
with 0.25 kg/serving. A hypothetical deliberate delivery of ricin by bioterrorists
would need 106,000 × 4 mg = 424 g of pure ricin to get a lethal dose in one
serving of orange juice. It thus would be easy for bioterrorists to accomplish this
in an orange juice plant due to the minimal amount of ricin needed. Using the
70
lethal dose for mice ingestion of ricin (5 μg/kg) instead, the estimated lethal
dose for a 20 kg child using an uncertainty factor of 100 (10 for interspecies and
10 for the most sensitive population) would be 1 μg. A hypothetical deliberate
delivery of ricin by bioterrorists would need 106,000 × 1 μg = 0.1 g of pure ricin
to get a lethal dose in one serving of orange juice. It is extremely easy for
bioterrorists to accomplish this in an orange juice plant due to the minimal
amount of ricin needed. Thus, the fact is that one is likely able to use ricin as a
bioterror weapon since it is quite effective. In the event of an intentional delivery
of ricin, assuming that an 8 oz glass of orange juice is contaminated with ricin,
0.064% of peracetic acid (PA) could be added into the silos and orange juice
could go through the pasteurization equipment at 72°C. To achieve a 1000 fold
reduction, a 10 half life process (10 × 0.9) of 9 min would be required.
In summary, this project generated the procedures of thermal and chemical
inactivation conditions at HTST pasteurization temperatures to decontaminate
ricin in an orange juice plant. In case of a deliberate delivery of ricin into an
orange juice plant, a feasible and effective procedure could be applied in the
plant to decontaminate ricin with small concentrations of chemicals and the
typical pasteurization equipment available in the plant.
71
4 Inactivation of Shiga toxins
4.1 Materials and Methods
4.1.1 Production of Shiga toxins
Escherichia coli O157:H7 strains were used as the source of Shiga toxins. The
following strains were tested for their ability to produce toxins: Shiga toxin 1
(Stx1) producers: ATCC 43890 and O29 (an isolate originally obtained from
cattle); Shiga toxin 2 (Stx2) producers: O14, O42, O47 (cattle isolates) and EK-
1 TW08609 (provided by the Minnesota Department of Health and originally
isolated from a patient); and producers of both toxins: ATCC 31350 and ATCC
43895. Bacterial cultures of these strains were grown separately in 3 mL of
Luria-Bertani (LB) broth and incubated at 37°C overnight. Stock cultures were
stored at 4°C. Working cultures were cultivated in 3 mL LB broth with 10 µg/L
norfloxacin at 37°C overnight. The best producers of Shiga toxins were chosen
for future studies and were cultivated in a larger amount of broth for stock and
working cultures.
Cultures were centrifuged at 1000 × g for 20 min at 4°C. The supernatants were
filtered using a 0.2 µm pore size with a low protein binding filter (VWR Scientific
Inc.) (71). The retentate was frozen in a centrifuge tube (50 mL, Corning Inc.) at
-20°C and then freeze dried in a 2 L flask at 0 millitorr/microns for ~3 days
(ATR, Inc.) and then stored over desiccant (Drierite) at 4°C for future use. Toxin
concentrations in the dried supernatant were determined using an
immunoassay test (see below) and freeze-dried supernatants were produced
once a month to ensure the freshness of toxins.
72
4.1.2 Thermal Inactivation of Shiga toxins
A capillary tube method was used to minimize the come-up time when
determining the heat resistance of toxins in a water bath (78). Freeze dried
culture supernatant powder was weighed and dissolved in phosphate buffered
saline (PBS) as in the ricin study. Volumes of 90 µL of PBS or orange juice
(Minute Maid, The Coca-Cola Company, Atlanta, GA) were mixed with 10 µL of
the supernatant solution containing Shiga toxin. Shiga toxin-containing PBS and
orange juice samples (50 µL) were transferred into capillary tubes (0.8-1.1 × 90
mm; No. 34507, Kimble, Vineland, NJ). Tubes were heat-sealed and then
completely submerged into a water bath (High-TempTM Bath 160A, Fisher
Scientific) at different temperatures from 72 to 90°C. At each sampling time,
capillary tubes were removed from the water bath and cooled in an ice-water
bath. After cooling, tubes were rinsed with distilled water to remove any
possible contaminants and crushed by mixing in test tubes (10 mL, 16 × 125
mm) containing 0.25 mL PBS and a magnetic stirrer using a vortexer (Mini
Vortexer, VWR). Mixtures were transferred into a 1.5 mL mirocentrifuge tube
and stored at 4°C until the residual toxin concentration was quantified by an
immunoassay on the same day. Treatments and measurements for each
sample were performed at least in duplicate.
In addition to the capillary tube method, inactivation of toxins was also
conducted in 1.5 mL microcentrifuge tubes containing mixtures of 0.45 mL of
PBS or orange juice and 0.05 mL of supernatant-PBS solutions. Shiga toxin-
added PBS or orange juice samples were then completely submerged into a
water bath at different temperatures. At each sampling time, two tubes were
removed from the water bath, cooled in an ice-water bath and stored at 4°C
until testing was performed as described above.
73
4.1.3 ELISA Test for Shiga Toxins
The concentration of residual Shiga toxins after heat treatment was determined
by using ELISA, the PremierTM EHEC ELISA kit (Meridian Bioscience,
Cincinnati, OH). Multi-point standard curves as well as positive and negative
controls were performed to reduce variations among ELISA testings. The cut-off
concentration according to the manufacturer’s instructions was OD=0.18 where
the concentrations of Stx1 and Stx2 were 0.07 and 0.15 ng/mL respectively.
The Premier EHEC test kit utilizes monoclonal anti-Shiga toxin capture
antibodies absorbed onto the bottom of microwells. When testing, 100 µL
samples were added to each well, mixed thoroughly with the pipette and the 96-
well plates were incubated at room temperature (RT) for 1 h. Wells were then
washed according to manufacturer’s instructions. Volumes of 100 µL of
polyclonal anti-Shiga toxin antibodies provided by the kit were added into each
well, mixed well as before, and incubated at RT for 30 min. Wells were washed
again to remove unbound antibody. Aliquots of 100 µL of enzyme-conjugated
anti-IgG polyclonal antibody were added into each well, mixed and incubated at
RT for 30 min. After washing to remove unbound conjugate, 100 µL of substrate
were added to each well and plates were incubated for 10 min at RT followed
by addition of 100 µL of stop solution into each well. Absorbance was then
measured at 450 nm using a Bio-Tek Kinetics Reader (Bio-Tek Instruments
Inc., Winooski, VT) and software (KC 4, Bio-Tek). The steps of this ELISA
method are shown in Figure 4-1.
74
Add 100 µL sample to each well in a 96-well ELISA plate
Add 100 µL of enzyme conjugated anti-IgG polyclonal antibody to each well
Add 100 µL of polyclonal anti-Shiga toxin antibodies to each well
Wash plate 4 times with wash buffer
Incubate plate at room temperature for 1 h
Incubate plate at room temperature for 30 min
Wash plate 4 times with wash buffer
Incubate plate at room temperature for 30 min
Wash plate 4 times with wash buffer
Add 100 µL/well of substrate into each well
Reading
Add 100 µL of stop solution into each well
Incubate plate at room temperature for 10 min
Figure 4-1. Steps of ELISA method to determine Shiga toxins.
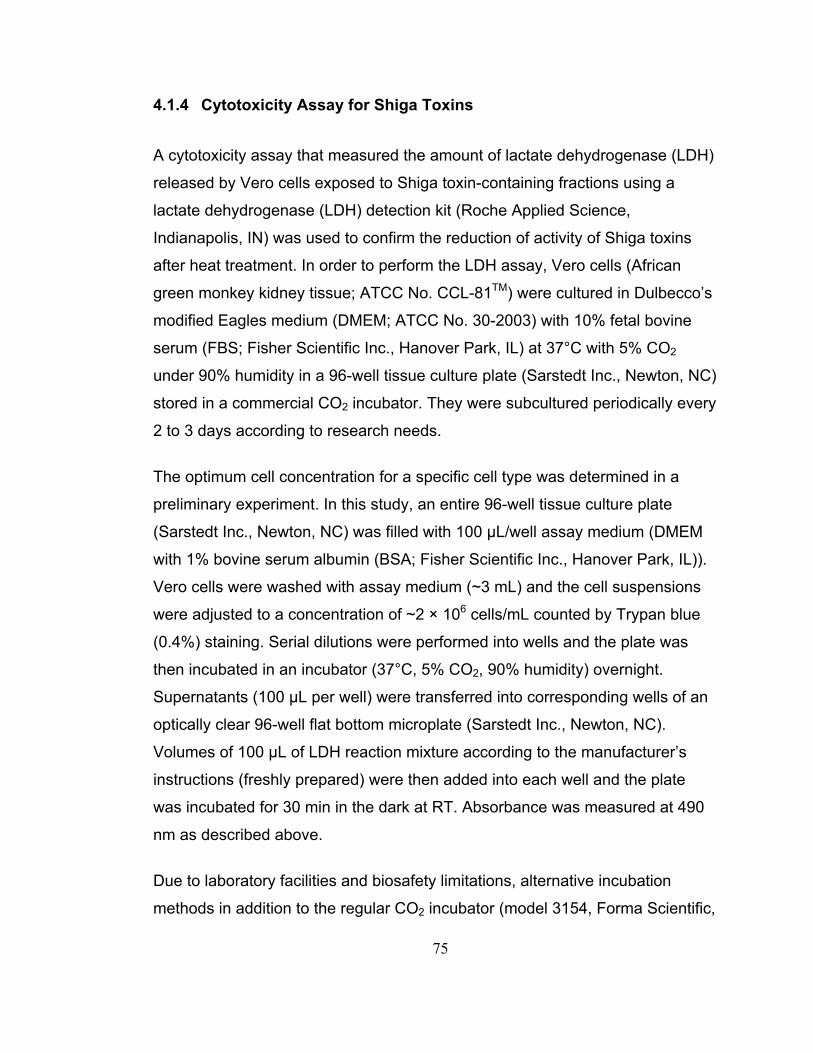
75
4.1.4 Cytotoxicity Assay for Shiga Toxins
A cytotoxicity assay that measured the amount of lactate dehydrogenase (LDH)
released by Vero cells exposed to Shiga toxin-containing fractions using a
lactate dehydrogenase (LDH) detection kit (Roche Applied Science,
Indianapolis, IN) was used to confirm the reduction of activity of Shiga toxins
after heat treatment. In order to perform the LDH assay, Vero cells (African
green monkey kidney tissue; ATCC No. CCL-81TM) were cultured in Dulbecco’s
modified Eagles medium (DMEM; ATCC No. 30-2003) with 10% fetal bovine
serum (FBS; Fisher Scientific Inc., Hanover Park, IL) at 37°C with 5% CO2
under 90% humidity in a 96-well tissue culture plate (Sarstedt Inc., Newton, NC)
stored in a commercial CO2 incubator. They were subcultured periodically every
2 to 3 days according to research needs.
The optimum cell concentration for a specific cell type was determined in a
preliminary experiment. In this study, an entire 96-well tissue culture plate
(Sarstedt Inc., Newton, NC) was filled with 100 µL/well assay medium (DMEM
with 1% bovine serum albumin (BSA; Fisher Scientific Inc., Hanover Park, IL)).
Vero cells were washed with assay medium (~3 mL) and the cell suspensions
were adjusted to a concentration of ~2 × 10⁶ cells/mL counted by Trypan blue
(0.4%) staining. Serial dilutions were performed into wells and the plate was
then incubated in an incubator (37°C, 5% CO2, 90% humidity) overnight.
Supernatants (100 µL per well) were transferred into corresponding wells of an
optically clear 96-well flat bottom microplate (Sarstedt Inc., Newton, NC).
Volumes of 100 µL of LDH reaction mixture according to the manufacturer’s
instructions (freshly prepared) were then added into each well and the plate
was incubated for 30 min in the dark at RT. Absorbance was measured at 490
nm as described above.
Due to laboratory facilities and biosafety limitations, alternative incubation
methods in addition to the regular CO2 incubator (model 3154, Forma Scientific,
76
Inc.) were tested. A regular CO2 incubator was used as a control (method A).
Method B consisted in leaving a sealable plastic container open in a regular
CO2 incubator for some time to reach an equilibrium condition with the incubator
so that it would have a similar condition when sealed and incubated in air
incubator. Method C was accomplished by using an anaerobic jar injected with
an approximate amount of CO2 and incubated in a standard incubator. Method
D was incubation in air with its own cover. Four experiments were conducted
using the LDH assay and absorbance was measured at 490 nm.
To measure the cytotoxic potential of Shiga toxins, Vero cells were first washed
in assay medium made according to the instructions from the manufacture of
the LDH kit. Aliquots of 100 µL/well cell suspensions in assay medium were
added to sterile 96-well tissue culture plate (No. 82.1581.001, Sarstedt Inc.,
Newton, NC) and incubated overnight at 37°C, 5% CO2 and 90% humidity to
allow cells to adhere tightly. Immediately before use, the assay media from the
adherent cells was removed with pipette and 100 µL/well fresh assay media
was added. Samples (toxin in orange juice) of 100 µL were transferred into
wells as well as background control (200 µL assay medium), low control (100
µL/well cell suspensions with 100 µL/well assay medium) and high control
(100µL/well Triton X-100 solution with 100 µL/well cells). Plates were incubated
under the same conditions as before for 2 h. Volumes of 100 µL of supernatant
were transferred into corresponding wells of an optically clear 96-well flat
bottom microplate. The reaction mixture (100 µL freshly prepared) was added
into each well and incubated for 30 min in the dark at RT. The absorbance was
determined as described before. Note that all the original data are available in
an electronic appendix. Steps are shown in Figure 4-2.
77
Wash Vero cells in assay medium
Transfer 100 µL of supernatant into corresponding wells
Remove assay medium and add 100 µL/well fresh assay medium
Incubate the plate overnight in an incubator (37°C, 5% CO2, 90% humidity)
Add 100 µL of cell suspension to each well in a 96-well tissue culture plate
Transfer 100 µL sample into each well as well as controls
Incubate plate in dark for 30 min at room temperature
Add 100 µL of reaction mixture into each well
Incubate plate in CO2 incubator for 2 h
Reading
Figure 4-2. Steps of LDH assay for detection of Shiga toxins.
4.1.5 Data Analysis
As noted above, the ELISA test and LDH assay were used to determine the
residual concentration of Shiga toxins after thermal treatment. In the ELISA test,
residual Shiga toxin (%) was the percentage of Shiga toxins detected in the
treated PBS or orange juice with respect to the amount of Shiga toxin detected
at zero time. The kinetics of heat treatment was determined by making first-
order plots of concentration with time. A spreadsheet developed by Dr. Ted
Labuza (University of Minnesota) was used to set the inactivation rate (k), half-
78
life (t1/2) (time for a toxin to be inactivated by half) and D value (time required to
reduce the toxicity of a toxin by a factor of 10) through linear regression. The
activation energy (Ea) (the threshold or energy barrier that must be overcome or
surpassed to permit the transformation of reactants into products), Q10
(increase in rate for a 10°C increase in temperature) and Z value (change in
temperature that accompanies a 10-fold change in D or k value) were also
calculated with these spreadsheets. In addition, the time equivalent to
destruction of 12 half lives was calculated assuming that the final concentration
was reduced to approximately 0.02% of the initial level. In the LDH assay, the
absorbance from treated samples was determined to qualitatively confirm
whether there was inactivation of the Shiga toxins.
All experiments were replicated at least two times with duplicate samples at
each time interval for each treatment. Confidence interval limits of 95% were
calculated from semi-log plots of residual Shiga toxin (%) versus time and D
value versus temperature. The difference of D values between Shiga toxins or
media (PBS or juice) was analyzed by using analysis of variance procedure
(ANOVA R version 2.8.1, 2008) with a significance level of 0.05. In addition, the
lack of convergence of the upper and lower 95% confidence limit of each key
value was used to confirm the significance (41). Note again that all original data
are available in an electronic appendix.
4.2 Results
4.2.1 Production of Shiga toxins
All Escherichia coli O157:H7 strains were capable of producing Shiga toxins,
but the amount of toxin detected was quite variable (Table 4-1). For Stx1
producing strains, ATCC 43890 was the only strain capable of producing
significant amounts of toxin. Strain EK-1 TW08609 produced more than 100-
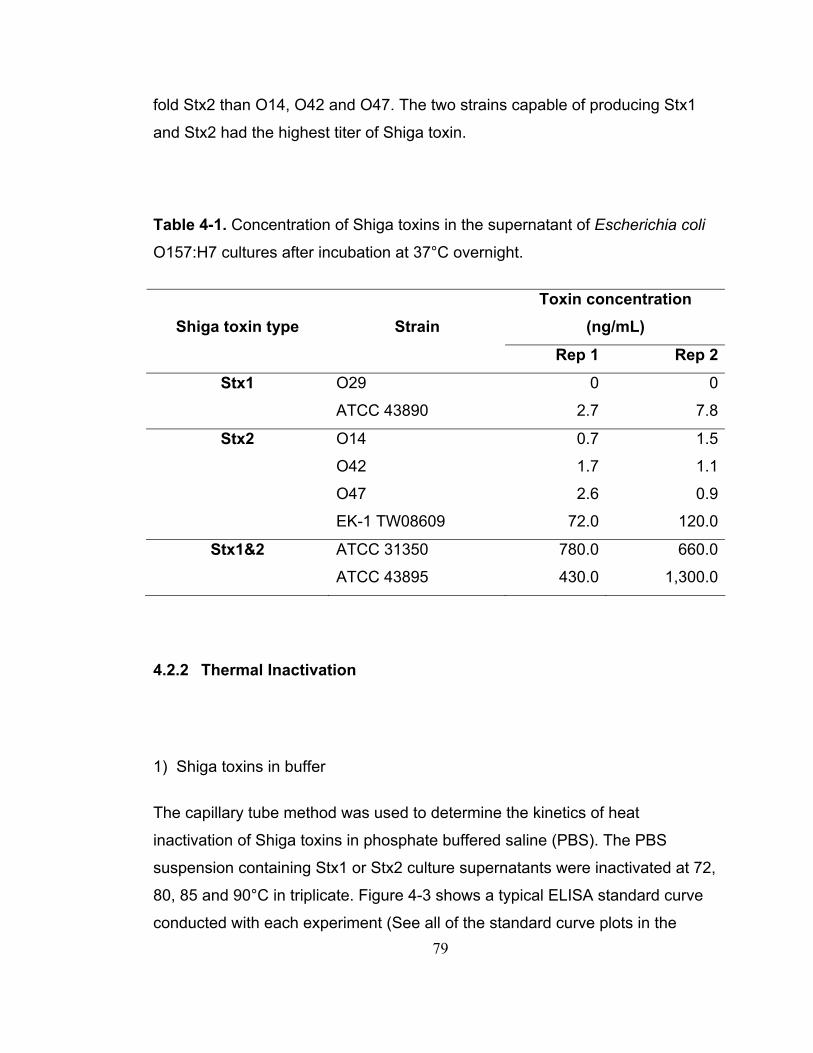
79
fold Stx2 than O14, O42 and O47. The two strains capable of producing Stx1
and Stx2 had the highest titer of Shiga toxin.
Table 4-1. Concentration of Shiga toxins in the supernatant of Escherichia coli
O157:H7 cultures after incubation at 37°C overnight.
Toxin concentration (ng/mL) Shiga toxin type Strain
Rep 1 Rep 2
Stx1 O29 0 0
ATCC 43890 2.7 7.8
Stx2 O14 0.7 1.5
O42 1.7 1.1
O47 2.6 0.9
EK-1 TW08609 72.0 120.0
Stx1&2 ATCC 31350 780.0 660.0
ATCC 43895 430.0 1,300.0
4.2.2 Thermal Inactivation
1) Shiga toxins in buffer
The capillary tube method was used to determine the kinetics of heat
inactivation of Shiga toxins in phosphate buffered saline (PBS). The PBS
suspension containing Stx1 or Stx2 culture supernatants were inactivated at 72,
80, 85 and 90°C in triplicate. Figure 4-3 shows a typical ELISA standard curve
conducted with each experiment (See all of the standard curve plots in the
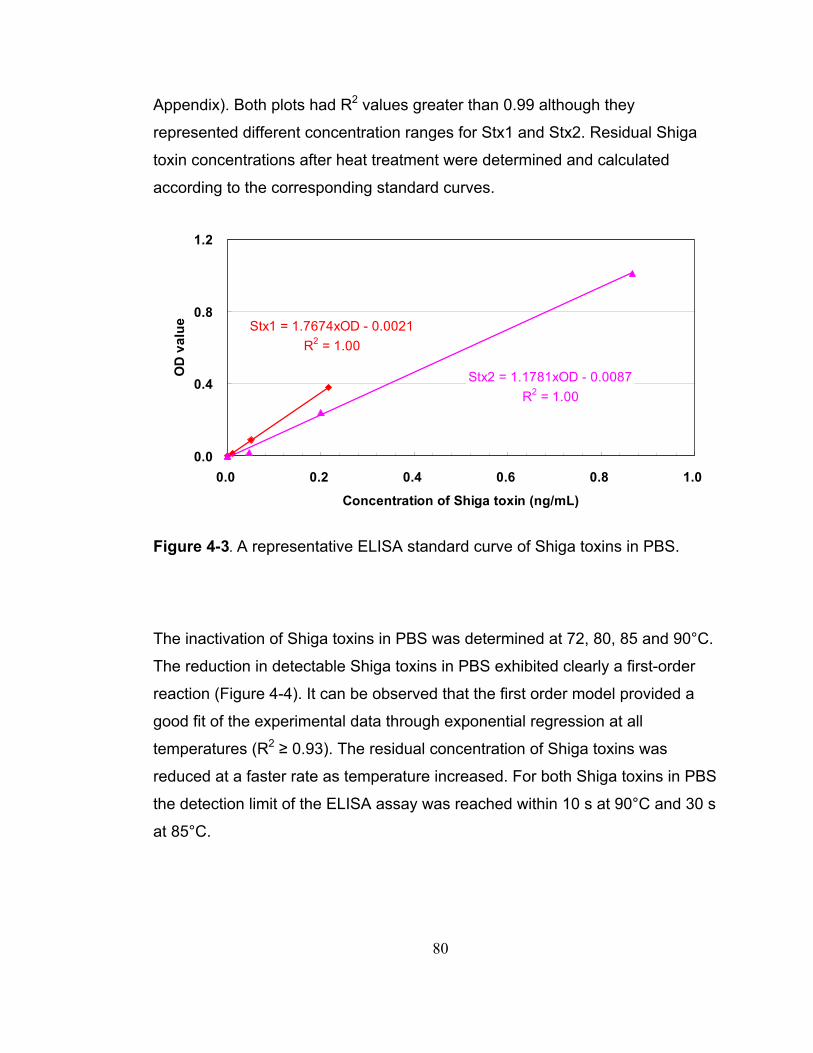
80
Appendix). Both plots had R2 values greater than 0.99 although they
represented different concentration ranges for Stx1 and Stx2. Residual Shiga
toxin concentrations after heat treatment were determined and calculated
according to the corresponding standard curves.
Stx1 = 1.7674xOD - 0.0021R2 = 1.00
Stx2 = 1.1781xOD - 0.0087R2 = 1.00
0.0
0.4
0.8
1.2
0.0 0.2 0.4 0.6 0.8 1.0
Concentration of Shiga toxin (ng/mL)
OD
val
ue
Figure 4-3. A representative ELISA standard curve of Shiga toxins in PBS.
The inactivation of Shiga toxins in PBS was determined at 72, 80, 85 and 90°C.
The reduction in detectable Shiga toxins in PBS exhibited clearly a first-order
reaction (Figure 4-4). It can be observed that the first order model provided a
good fit of the experimental data through exponential regression at all
temperatures (R2 ≥ 0.93). The residual concentration of Shiga toxins was
reduced at a faster rate as temperature increased. For both Shiga toxins in PBS
the detection limit of the ELISA assay was reached within 10 s at 90°C and 30 s
at 85°C.
81
%Stx172 = 95.165e-0.0008t
R2 = 0.95
%Stx190 = 99.599e-0.5419t
R2 = 0.98
%Stx180 = 97.554e-0.0098t
R2 = 0.96
%Stx185 = 99.599e-0.1607t
R2 = 1.00
0.1
1.0
10.0
100.0
0 100 200 300 400 500 600 700
Time (s)
Res
idua
l Stx
(%)
A
%Stx272 = 95.91e-0.002t
R2 = 0.98
%Stx290 = 73.049e-0.4262t
R2 = 0.94
%Stx280 = 96.34e-0.0197t
R2 = 0.98
%Stx285 = 95.906e-0.1451t
R2 = 0.99
0.1
1.0
10.0
100.0
0 100 200 300 400 500 600 700
Time (s)
Res
idua
l Stx
(%)
B
Figure 4-4. The effect of temperature on inactivation of Shiga toxin 1 (A) and
Shiga toxin 2 (B) in PBS at 72°C ( ), 80°C ( ), 85°C ( ), and 90°C ( ).
Based on the rate of inactivation, D values at each temperature were calculated
(Table 4-2 and Table 4-3). Z values and activation energy (Ea) were determined
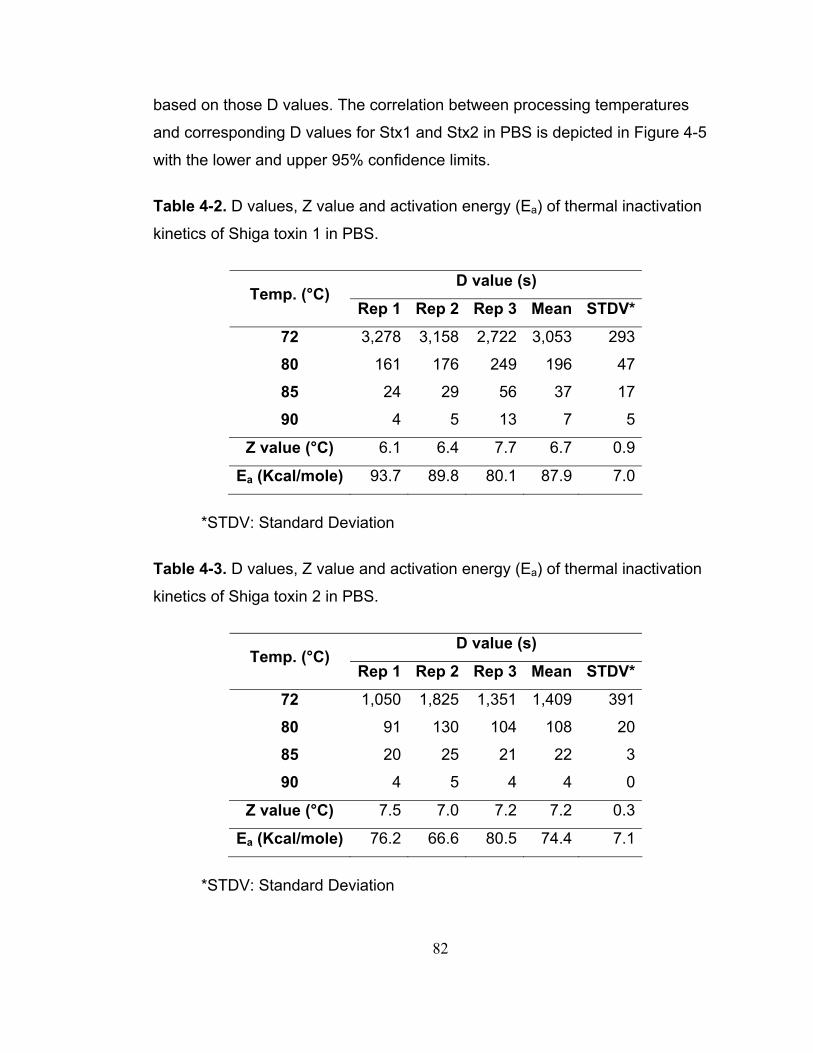
82
based on those D values. The correlation between processing temperatures
and corresponding D values for Stx1 and Stx2 in PBS is depicted in Figure 4-5
with the lower and upper 95% confidence limits.
Table 4-2. D values, Z value and activation energy (Ea) of thermal inactivation
kinetics of Shiga toxin 1 in PBS.
D value (s) Temp. (°C)
Rep 1 Rep 2 Rep 3 Mean STDV*
72 3,278 3,158 2,722 3,053 293
80 161 176 249 196 47
85 24 29 56 37 17
90 4 5 13 7 5
Z value (°C) 6.1 6.4 7.7 6.7 0.9
Ea (Kcal/mole) 93.7 89.8 80.1 87.9 7.0
*STDV: Standard Deviation
Table 4-3. D values, Z value and activation energy (Ea) of thermal inactivation
kinetics of Shiga toxin 2 in PBS.
D value (s) Temp. (°C)
Rep 1 Rep 2 Rep 3 Mean STDV*
72 1,050 1,825 1,351 1,409 391
80 91 130 104 108 20
85 20 25 21 22 3
90 4 5 4 4 0
Z value (°C) 7.5 7.0 7.2 7.2 0.3
Ea (Kcal/mole) 76.2 66.6 80.5 74.4 7.1
*STDV: Standard Deviation
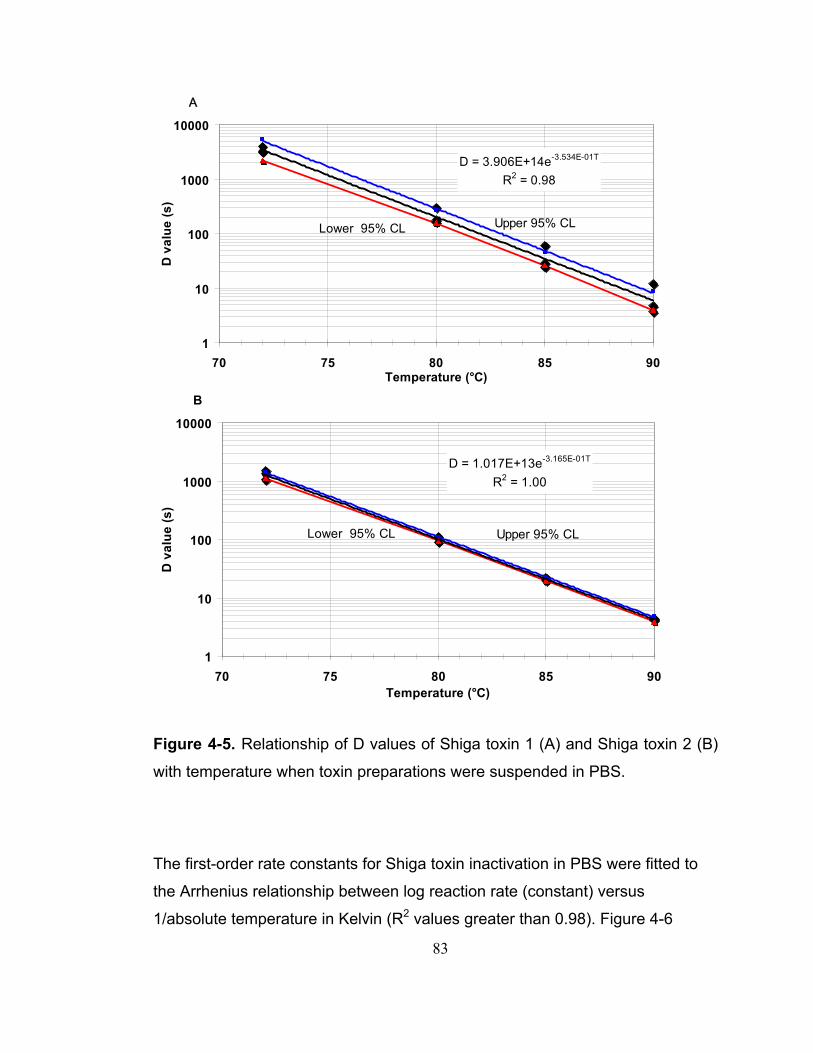
83
D = 3.906E+14e-3.534E-01T
R2 = 0.98
1
10
100
1000
10000
70 75 80 85 90Temperature (°C)
D v
alue
(s)
Upper 95% CLLower 95% CL
A
D = 1.017E+13e-3.165E-01T
R2 = 1.00
1
10
100
1000
10000
70 75 80 85 90Temperature (°C)
D v
alue
(s)
Upper 95% CLLower 95% CL
B
Figure 4-5. Relationship of D values of Shiga toxin 1 (A) and Shiga toxin 2 (B)
with temperature when toxin preparations were suspended in PBS.
The first-order rate constants for Shiga toxin inactivation in PBS were fitted to
the Arrhenius relationship between log reaction rate (constant) versus
1/absolute temperature in Kelvin (R2 values greater than 0.98). Figure 4-6
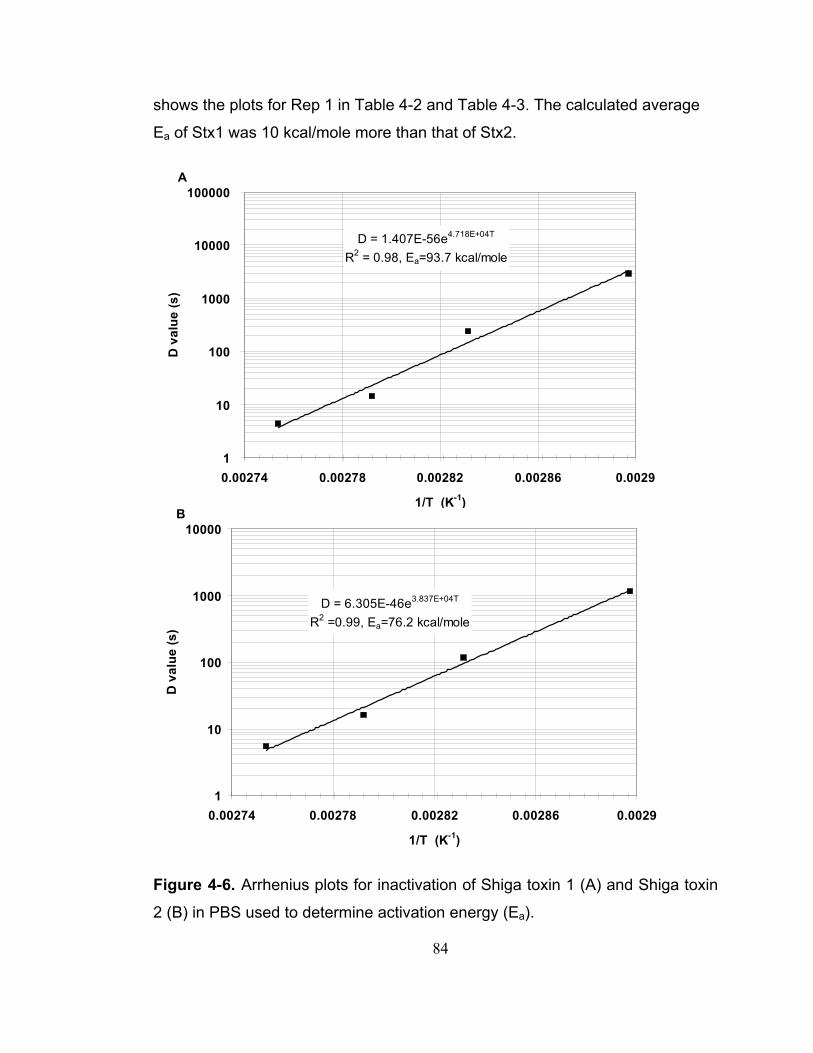
84
shows the plots for Rep 1 in Table 4-2 and Table 4-3. The calculated average
Ea of Stx1 was 10 kcal/mole more than that of Stx2.
D = 1.407E-56e4.718E+04T
R2 = 0.98, Ea=93.7 kcal/mole
1
10
100
1000
10000
100000
0.00274 0.00278 0.00282 0.00286 0.0029
1/T (K-1)
D v
alue
(s)
A
D = 6.305E-46e3.837E+04T
R2 =0.99, Ea=76.2 kcal/mole
1
10
100
1000
10000
0.00274 0.00278 0.00282 0.00286 0.0029
1/T (K-1)
D v
alue
(s)
B
Figure 4-6. Arrhenius plots for inactivation of Shiga toxin 1 (A) and Shiga toxin
2 (B) in PBS used to determine activation energy (Ea).
85
The inactivation rates (k) and half life (t1/2) kinetic parameters were also
calculated (Table 4-4 and Table 4-5). In addition, an extrapolation equivalent to
12 half lives (reduction to 0.025%) was also determined for both toxins. Similar
to previous kinetic parameters, R2 values greater than 0.88 indicated a good fit.
86
Table 4-4. The effect of temperature on inactivation rates (k) and half life (t1/2) of
Shiga toxin 1 in PBS. Results of triplicate runs are shown for each temperature.
Temp. (°C)
Rep # R2 k (95% CL)
(s-1) t1/2 (95% CL)
(s) 12 × t1/2
(95% CL) (s)
72 1 0.95 0.0008
(0.0005, 0.0011)
855
(642, 1283)
10263
(7699, 15390) a*
2 0.89 0.0008
(0.0003, 0.0011)
827
(608, 1290)
9918
(7297, 15480) a
3 0.96 0.0007
(0.0005, 0.0009)
930
(757, 1207)
11161
(9078, 14486) a
80 1 0.96 0.0098
(0.0079, 0.0117)71 (59, 88) 849 (712, 1051) b
2 0.96 0.0101
(0.0081, 0.0121)69 (57, 69) 823 (686, 823) b
3 0.90 0.0052
(0.0035, 0.0069)134 (100, 201) 1607 (1205, 2410) c
85 1 1.00 0.16
(0.14, 0.18) 4 (4, 5) 52 (45, 61) d
2 1.00 0.14
(0.08, 0.20) 5 (3, 9) 59 (41, 106) d
3 0.95 0.03
(0.02, 0.05) 21 (15, 37) 254 (178, 441) e
90 1 0.98 0.54
(0.34, 0.74) 1 (1, 2) 15 (11, 25) f
2 0.93 0.40
(0.25, 0.56) 2 (1, 3) 21 (15, 33) f
3 0.97 0.24
(0.17, 0.30) 3 (2, 4) 35 (28, 48) f
*Same letter indicates not statistically different at p ≤ 0.05
87
Table 4-5. The effect of temperature on the inactivation rates (k) and half life
(t1/2) of Shiga toxin 2 in PBS. Results of triplicate runs are shown for each
temperature.
Temp. (°C)
Rep # R2 k (95% CL)
(s-1) t1/2 (95% CL)
(s) 12 × t1/2
(95% CL) (s)
72 1 0.98 0.0020
(0.0016, 0.0024)341 (290, 413)
4088 (3478, 4958) g
2 0.99 0.0014
(0.0013, 0.0015)489 (457, 527)
5873 (5480, 633) h
3 0.95 0.0015
(0.0012, 0.0018)468 (379, 611)
5617 (4551, 7333) g
80 1 0.98 0.02
(0.02, 0.02) 35 (30, 435) 423 (356, 522) l
2 0.99 0.01
(0.01, 0.01) 66 (58, 77) 792 (693, 924) i
3 0.99 0.02
(0.01, 0.02) 36 (28, 50) 430 (334, 604) l
85 1 0.99 0.15
(0.11, 0.18) 5 (4, 7) 57 (46, 78) k
2 0.92 0.10
(0.01, 0.19) 7 (4, 63) 83 (44, 752) k
3 0.95 0.14
(0.04, 0.25) 5 (3, 18) 58 (34, 217) k
90 1 0.94 0.43
(0.27, 0.58) 2 (1, 3) 19.6 (14, 31) m
2 0.91 0.47
(0.02, 0.9) 2 (1, 34) 17.5 (9, 410) m
3 0.95 0.47
(0.13, 0.82) 2 (1, 5) 17.5 (10, 64) m
* Same letter indicates not statistically different at p ≤ 0.05
88
2) Shiga toxins in orange juice
The capillary tube method was also used for inactivation studies in orange juice.
Stx1 or Stx2 culture supernatants in orange juice were inactivated at 72, 80, 85
and 90°C, performed in duplicate. An ELISA standard curve for Shiga toxins in
orange juice were performed with each experiment and a typical one is shown
in Figure 4-7. Both plots had R2 values higher than 0.95, although the range of
concentration of Shiga toxins were different. Standard curve equations shown in
the figure were used to calculate the residual Shiga toxin concentration after
heat treatment.
Stx1 = 1.4809xOD - 0.006R2 = 1.00
Stx2 = 0.6216xOD + 0.0153R2 = 1.00
0.0
0.4
0.8
1.2
1.6
0.0 0.5 1.0 1.5 2.0 2.5
Concentration of Shiga toxin (ng/mL)
OD
val
ue
Figure 4-7. A representative ELISA standard curve of Shiga toxins in orange
juice.
The inactivation effects of Shiga toxins in orange juice (processing temperature
and time) were determined at 72, 80, 85 and 90°C. Measurable inactivation of
Shiga toxins in orange juice followed first-order reaction kinetics (Figure 4-8)
with distinguishable slopes for each regression line and the rate of loss in ricin
activity was highly dependent on temperature. The inactivation rate of Shiga
89
toxins was increased as temperature increased. All R2 values of the inactivation
curves were greater than 0.90 indicating good fits. In addition, both Shiga toxins
in orange juice were inactivated until non-detectable using an ELISA kit within
30 s at 90°C and 120 s at 85°C.
%Stx172 = 88.076e-0.001t
R2 = 0.95
%Stx190 = 69.753e-0.1333t
R2 = 0.91%Stx180 = 100.29e-0.005t
R2 = 0.93
%Stx185 = 104.69e-0.0227t
R2 = 0.95
0
1
10
100
0 200 400 600 800 1000 1200 1400 1600 1800
Time (s)
Res
idua
l Stx
(%)
A
%Stx272 = 105.4e-0.0017t
R2 = 0.99
%Stx290 = 94.914e-0.6773t
R2 = 0.93
%Stx280 = 110.11e-0.0177t
R2 = 0.97
%Stx285 = 94.914e-0.1336t
R2 = 0.94
0.1
1.0
10.0
100.0
0 200 400 600 800 1000 1200 1400 1600 1800
Time (s)
Res
idua
l Stx
(%)
B
Figure 4-8. The effect of temperature on inactivation of Shiga toxin 1 (A) and
Shiga toxin 2 (B) in orange juice at 72°C ( ), 80°C ( ), 85°C ( ), and 90°C ( ).
90
The D value at each temperature was calculated according to the rate of
inactivation. In addition, the Z value and activation energy (Ea) was determined
from the first order rate constants for each temperature treatment using linear
regression (Table 4-6 and Table 4-7). Figure 4-9 reveals the linear relationship
between D values and corresponding temperatures for Stx1 and Stx2 in orange
juice with lower and upper 95% confidence limits.
Table 4-6. D values, Z value and activation energy (Ea) for thermal inactivation
of Shiga toxin 1 in orange juice.
*STDV: Standard Deviation
D value (s) T (°C)
Rep 1 Rep 2 Mean STDV*
72 2,289 2,929 2,609 452
80 287 338 313 36
85 78 88 83 7
90 21 23 22 1
Z value (°C) 8.9 8.5 8.7 0.3
Ea (kcal/mole) 64.5 67.0 65.8 1.8
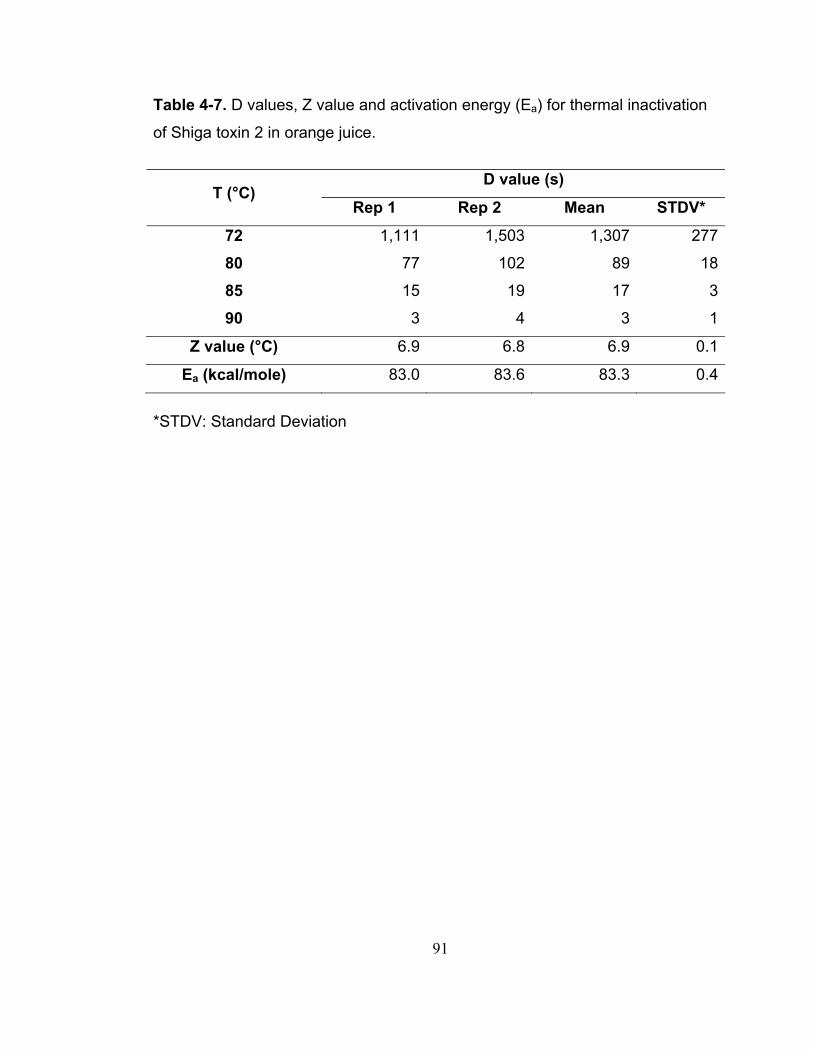
91
Table 4-7. D values, Z value and activation energy (Ea) for thermal inactivation
of Shiga toxin 2 in orange juice.
D value (s) T (°C)
Rep 1 Rep 2 Mean STDV*
72 1,111 1,503 1,307 277
80 77 102 89 18
85 15 19 17 3
90 3 4 3 1
Z value (°C) 6.9 6.8 6.9 0.1
Ea (kcal/mole) 83.0 83.6 83.3 0.4
*STDV: Standard Deviation
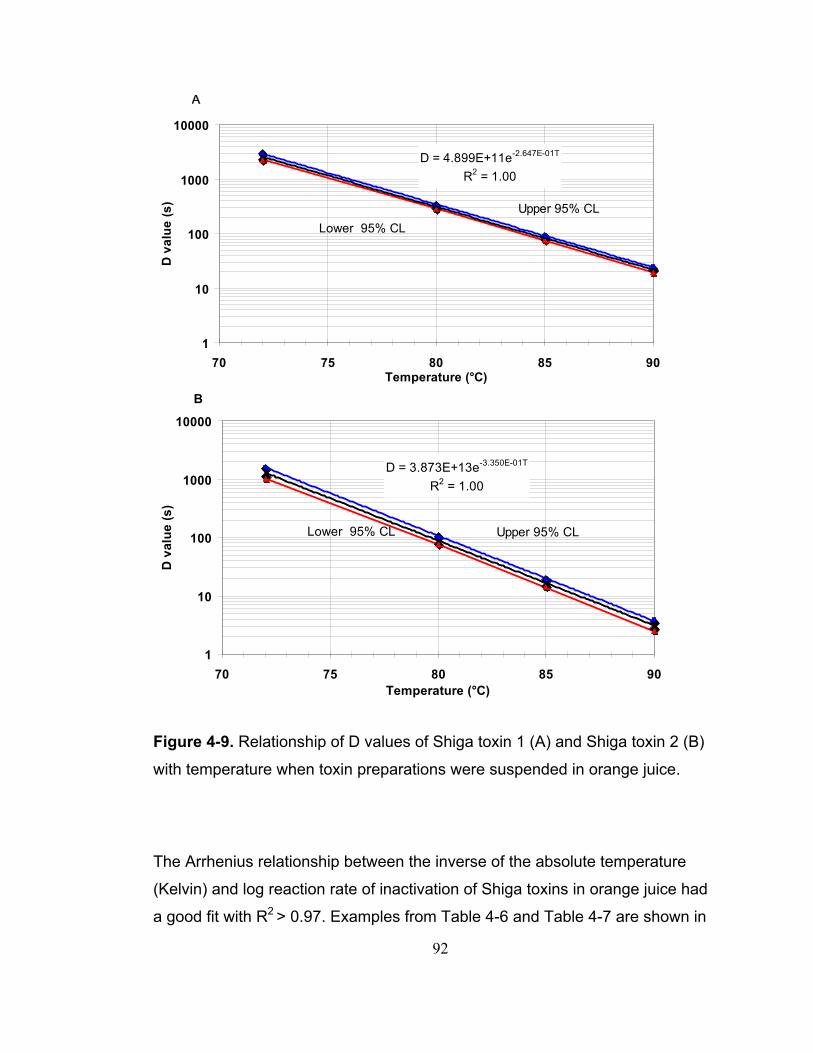
92
D = 4.899E+11e-2.647E-01T
R2 = 1.00
1
10
100
1000
10000
70 75 80 85 90Temperature (°C)
D v
alue
(s) Upper 95% CL
Lower 95% CL
A
D = 3.873E+13e-3.350E-01T
R2 = 1.00
1
10
100
1000
10000
70 75 80 85 90Temperature (°C)
D v
alue
(s)
Upper 95% CLLower 95% CL
B
Figure 4-9. Relationship of D values of Shiga toxin 1 (A) and Shiga toxin 2 (B)
with temperature when toxin preparations were suspended in orange juice.
The Arrhenius relationship between the inverse of the absolute temperature
(Kelvin) and log reaction rate of inactivation of Shiga toxins in orange juice had
a good fit with R2 > 0.97. Examples from Table 4-6 and Table 4-7 are shown in
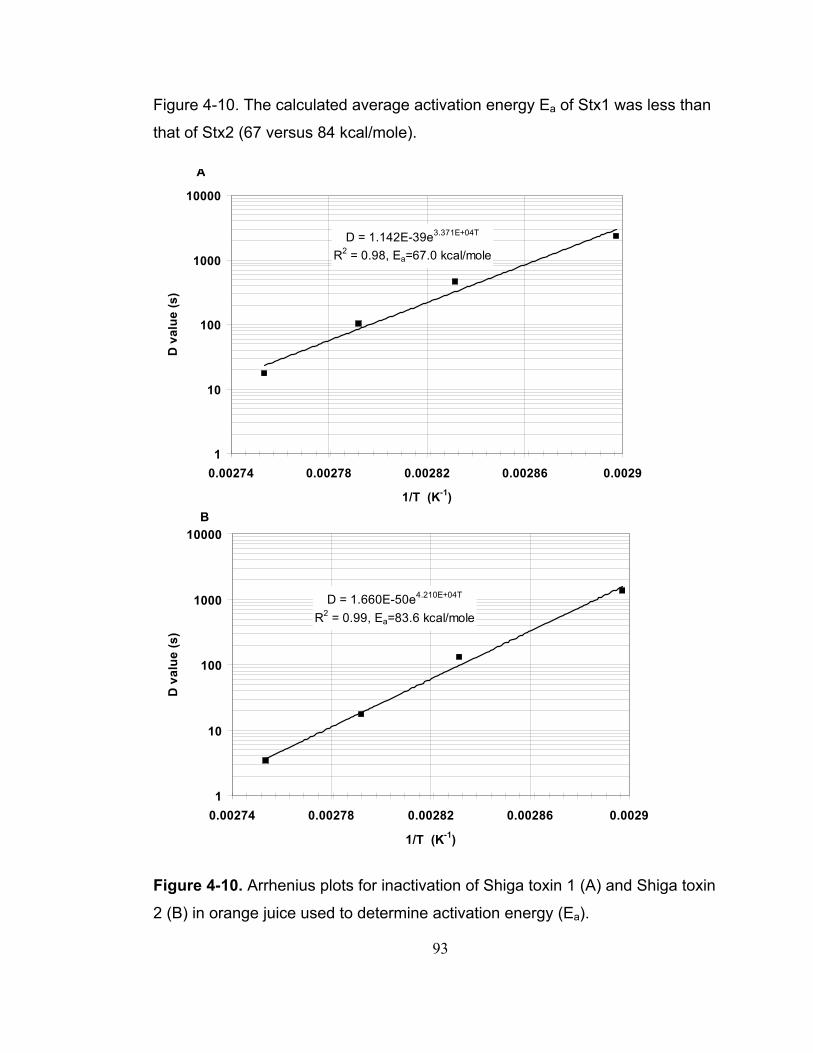
93
Figure 4-10. The calculated average activation energy Ea of Stx1 was less than
that of Stx2 (67 versus 84 kcal/mole).
D = 1.142E-39e3.371E+04T
R2 = 0.98, Ea=67.0 kcal/mole
1
10
100
1000
10000
0.00274 0.00278 0.00282 0.00286 0.0029
1/T (K-1)
D v
alue
(s)
A
D = 1.660E-50e4.210E+04T
R2 = 0.99, Ea=83.6 kcal/mole
1
10
100
1000
10000
0.00274 0.00278 0.00282 0.00286 0.0029
1/T (K-1)
D v
alue
(s)
B
Figure 4-10. Arrhenius plots for inactivation of Shiga toxin 1 (A) and Shiga toxin
2 (B) in orange juice used to determine activation energy (Ea).
94
Kinetics parameters including inactivation rates (k), half lives, and 12 × half lives
for inactivation of Shiga toxins in orange juice, as well as the 95% confidence
limits are listed in Table 4-8 and Table 4-9. Correlation is good with R2 > 0.86.
Table 4-8. The effect of temperature on inactivation rates (k) and half life (t1/2) of
Shiga toxin 1 in orange juice. Results of replicates are shown for each
temperature.
Temp. (°C)
Rep # R2 k (95% CL)
(s-1) t1/2 (95% CL)
(s) 12 × t1/2
(95% CL) (s)
72 1 0.92 0.0012
(0.0008, 0.0016)555 (412, 846)
6653
(4949, 10149) a*
2 0.95 0.0010
(0.0008, 0.0012)728 (594, 942)
8739
(7122, 11307) a
80 1 0.87 0.0061
(0.0034, 0.0088)113 (79, 203)
1356
(947, 2441) b
2 0.93 0.0050
(0.0035, 0.0065)138 (106, 198)
1655
(1269, 2379) b
85 1 0.97 0.04
(0.02, 0.06) 18 (12, 37)
215
(142, 440) c
2 0.95 0.02
(0.02, 0.03) 31 (25, 40)
367
(300, 475) c
90 1 0.87 0.12
(**, 0.73) 6 (1, **) 67 (11, **) d
2 0.91 0.13
(0.09, 0.18) 5 (4, 8) 62 (47, 92) d
* Same letter indicates not statistically different at p ≤ 0.05
**Not applicable due to poor 95% CL
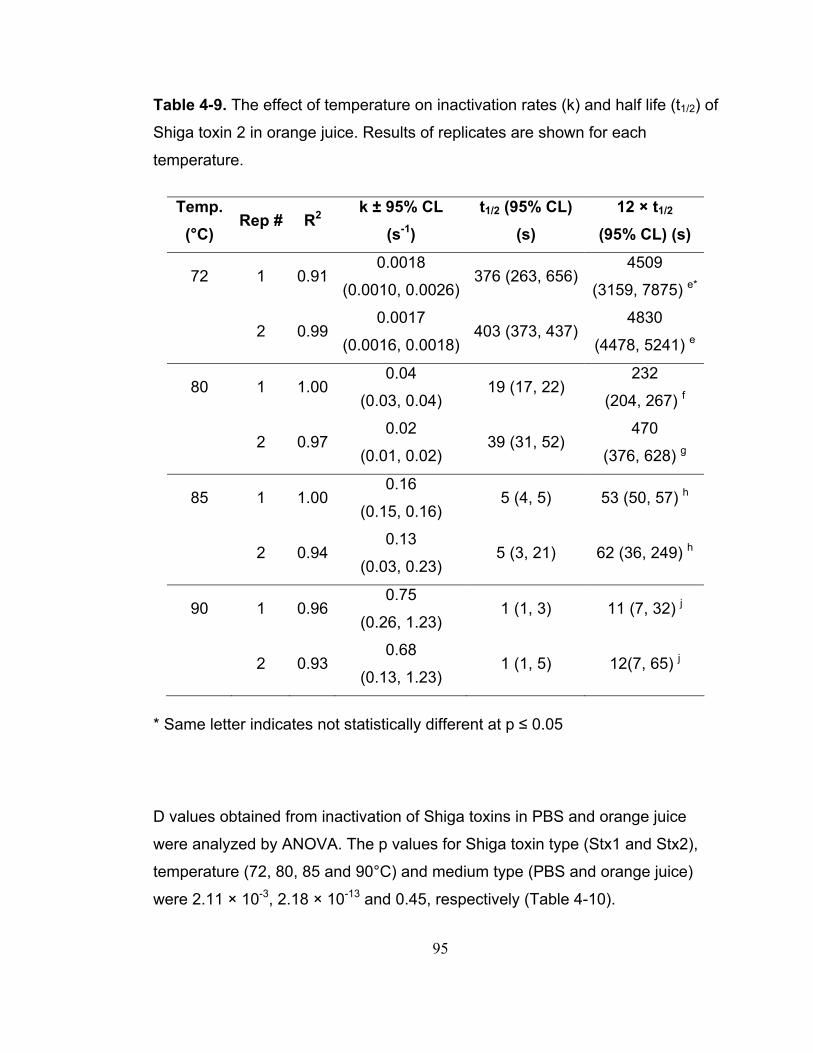
95
Table 4-9. The effect of temperature on inactivation rates (k) and half life (t1/2) of
Shiga toxin 2 in orange juice. Results of replicates are shown for each
temperature.
Temp. (°C)
Rep # R2 k ± 95% CL
(s-1) t1/2 (95% CL)
(s) 12 × t1/2
(95% CL) (s)
72 1 0.910.0018
(0.0010, 0.0026)376 (263, 656)
4509
(3159, 7875) e*
2 0.990.0017
(0.0016, 0.0018)403 (373, 437)
4830
(4478, 5241) e
80 1 1.000.04
(0.03, 0.04) 19 (17, 22)
232
(204, 267) f
2 0.970.02
(0.01, 0.02) 39 (31, 52)
470
(376, 628) g
85 1 1.000.16
(0.15, 0.16) 5 (4, 5) 53 (50, 57) h
2 0.940.13
(0.03, 0.23) 5 (3, 21) 62 (36, 249) h
90 1 0.960.75
(0.26, 1.23) 1 (1, 3) 11 (7, 32) j
2 0.930.68
(0.13, 1.23) 1 (1, 5) 12(7, 65) j
* Same letter indicates not statistically different at p ≤ 0.05
D values obtained from inactivation of Shiga toxins in PBS and orange juice
were analyzed by ANOVA. The p values for Shiga toxin type (Stx1 and Stx2),
temperature (72, 80, 85 and 90°C) and medium type (PBS and orange juice)
were 2.11 × 10⁻³, 2.18 × 10⁻¹³ and 0.45, respectively (Table 4-10).
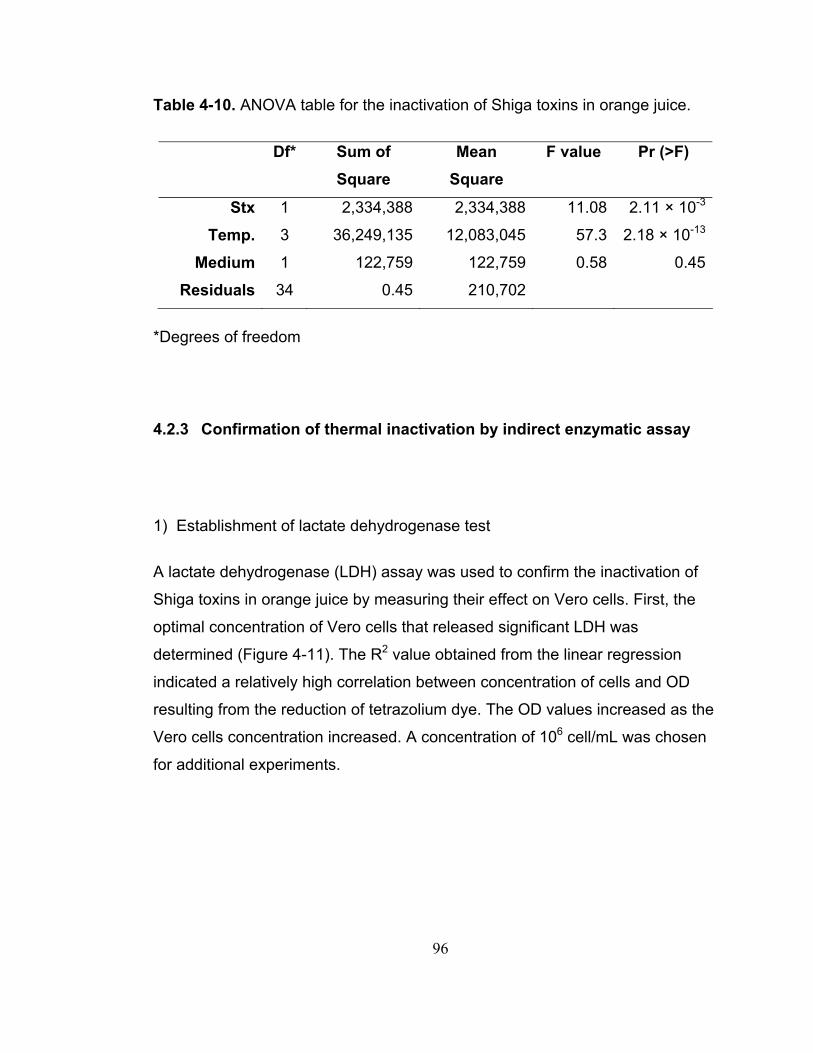
96
Table 4-10. ANOVA table for the inactivation of Shiga toxins in orange juice.
Df* Sum of Square
Mean Square
F value Pr (>F)
Stx 1 2,334,388 2,334,388 11.08 2.11 × 10⁻³
Temp. 3 36,249,135 12,083,045 57.3 2.18 × 10⁻¹³
Medium 1 122,759 122,759 0.58 0.45
Residuals 34 0.45 210,702
*Degrees of freedom
4.2.3 Confirmation of thermal inactivation by indirect enzymatic assay
1) Establishment of lactate dehydrogenase test
A lactate dehydrogenase (LDH) assay was used to confirm the inactivation of
Shiga toxins in orange juice by measuring their effect on Vero cells. First, the
optimal concentration of Vero cells that released significant LDH was
determined (Figure 4-11). The R2 value obtained from the linear regression
indicated a relatively high correlation between concentration of cells and OD
resulting from the reduction of tetrazolium dye. The OD values increased as the
Vero cells concentration increased. A concentration of 106 cell/mL was chosen
for additional experiments.
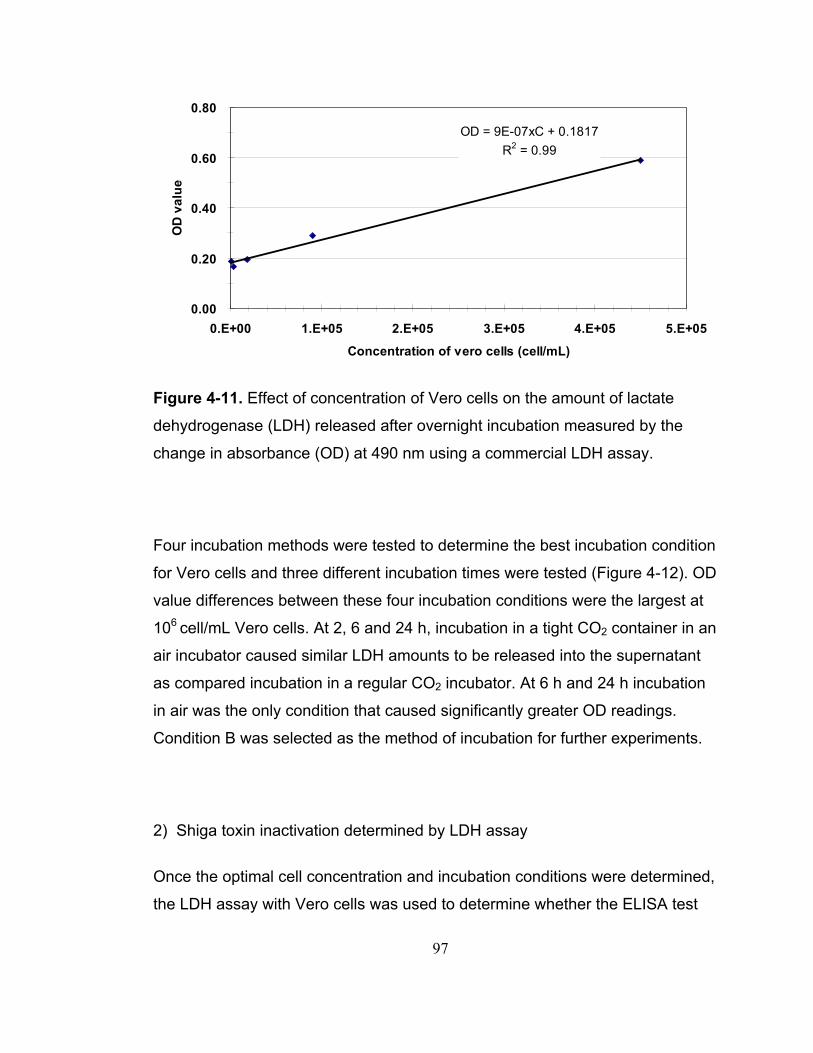
97
OD = 9E-07xC + 0.1817R2 = 0.99
0.00
0.20
0.40
0.60
0.80
0.E+00 1.E+05 2.E+05 3.E+05 4.E+05 5.E+05
Concentration of vero cells (cell/mL)
OD
val
ue
Figure 4-11. Effect of concentration of Vero cells on the amount of lactate
dehydrogenase (LDH) released after overnight incubation measured by the
change in absorbance (OD) at 490 nm using a commercial LDH assay.
Four incubation methods were tested to determine the best incubation condition
for Vero cells and three different incubation times were tested (Figure 4-12). OD
value differences between these four incubation conditions were the largest at
106 cell/mL Vero cells. At 2, 6 and 24 h, incubation in a tight CO2 container in an
air incubator caused similar LDH amounts to be released into the supernatant
as compared incubation in a regular CO2 incubator. At 6 h and 24 h incubation
in air was the only condition that caused significantly greater OD readings.
Condition B was selected as the method of incubation for further experiments.
2) Shiga toxin inactivation determined by LDH assay
Once the optimal cell concentration and incubation conditions were determined,
the LDH assay with Vero cells was used to determine whether the ELISA test
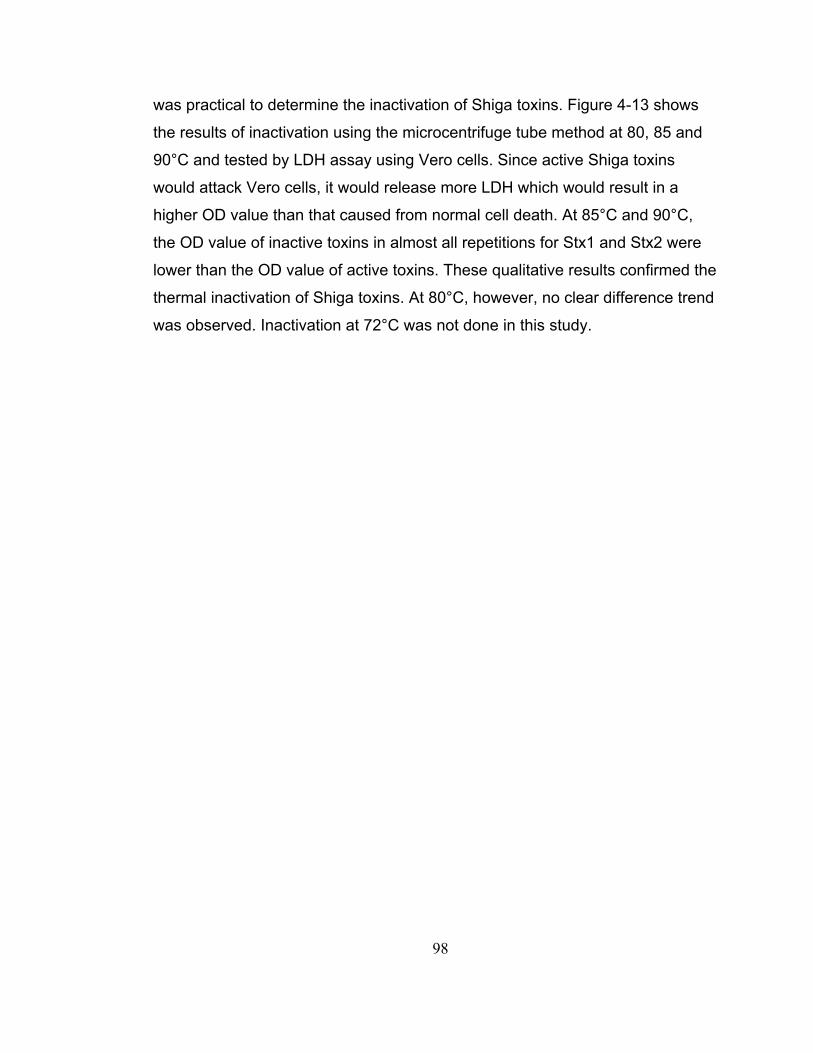
98
was practical to determine the inactivation of Shiga toxins. Figure 4-13 shows
the results of inactivation using the microcentrifuge tube method at 80, 85 and
90°C and tested by LDH assay using Vero cells. Since active Shiga toxins
would attack Vero cells, it would release more LDH which would result in a
higher OD value than that caused from normal cell death. At 85°C and 90°C,
the OD value of inactive toxins in almost all repetitions for Stx1 and Stx2 were
lower than the OD value of active toxins. These qualitative results confirmed the
thermal inactivation of Shiga toxins. At 80°C, however, no clear difference trend
was observed. Inactivation at 72°C was not done in this study.
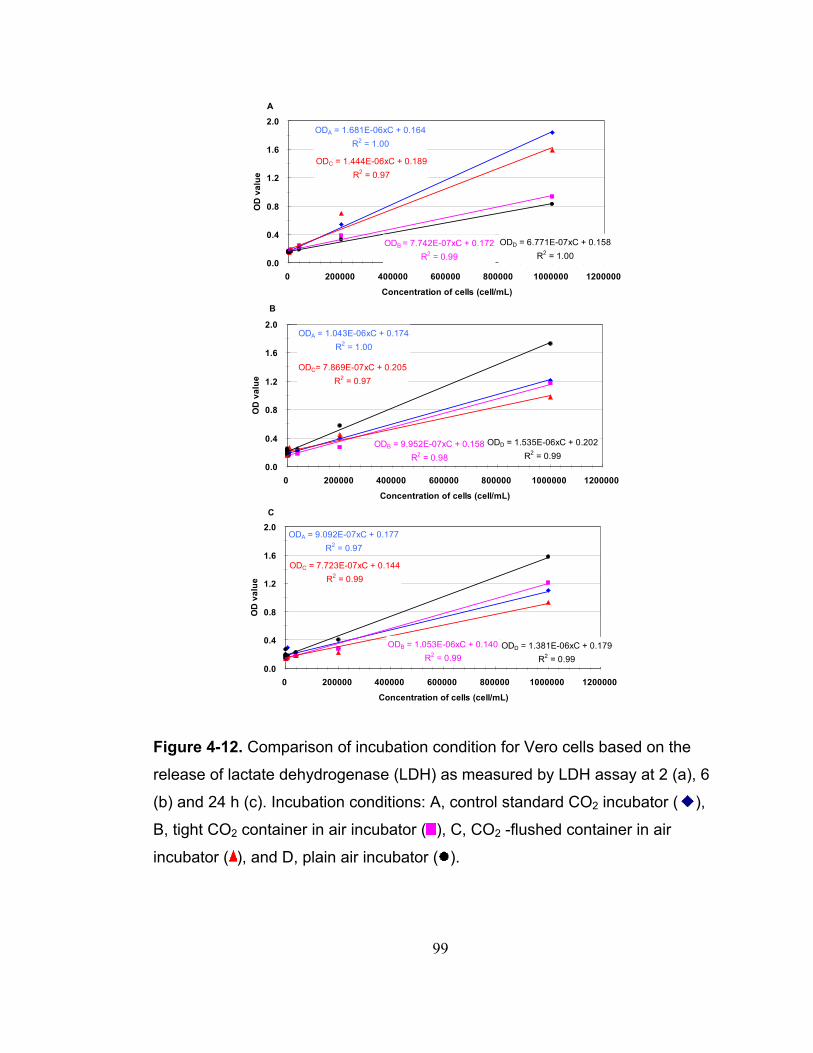
99
ODA = 1.681E-06xC + 0.164R2 = 1.00
ODB = 7.742E-07xC + 0.172R2 = 0.99
ODC = 1.444E-06xC + 0.189R2 = 0.97
ODD = 6.771E-07xC + 0.158R2 = 1.00
0.0
0.4
0.8
1.2
1.6
2.0
0 200000 400000 600000 800000 1000000 1200000
Concentration of cells (cell/mL)
OD
val
ue
A
ODA = 1.043E-06xC + 0.174R2 = 1.00
ODB = 9.952E-07xC + 0.158R2 = 0.98
ODC= 7.869E-07xC + 0.205R2 = 0.97
ODD = 1.535E-06xC + 0.202R2 = 0.99
0.0
0.4
0.8
1.2
1.6
2.0
0 200000 400000 600000 800000 1000000 1200000
Concentration of cells (cell/mL)
OD
val
ue
B
ODA = 9.092E-07xC + 0.177R2 = 0.97
ODB = 1.053E-06xC + 0.140R2 = 0.99
ODC = 7.723E-07xC + 0.144R2 = 0.99
ODD = 1.381E-06xC + 0.179R2 = 0.99
0.0
0.4
0.8
1.2
1.6
2.0
0 200000 400000 600000 800000 1000000 1200000
Concentration of cells (cell/mL)
OD
val
ue
C
Figure 4-12. Comparison of incubation condition for Vero cells based on the
release of lactate dehydrogenase (LDH) as measured by LDH assay at 2 (a), 6
(b) and 24 h (c). Incubation conditions: A, control standard CO2 incubator ( ),
B, tight CO2 container in air incubator ( ), C, CO2 -flushed container in air
incubator ( ), and D, plain air incubator ( ).
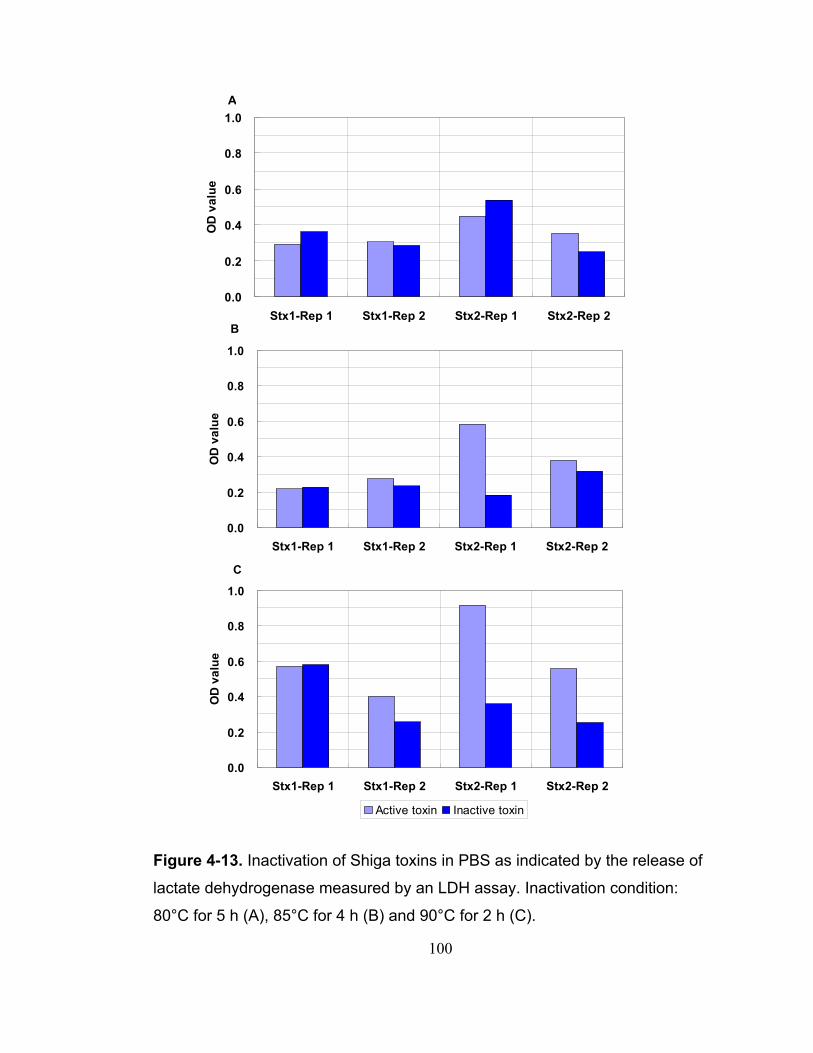
100
0.0
0.2
0.4
0.6
0.8
1.0
Stx1-Rep 1 Stx1-Rep 2 Stx2-Rep 1 Stx2-Rep 2
OD
val
ue
A
0.0
0.2
0.4
0.6
0.8
1.0
Stx1-Rep 1 Stx1-Rep 2 Stx2-Rep 1 Stx2-Rep 2
OD
val
ue
B
0.0
0.2
0.4
0.6
0.8
1.0
Stx1-Rep 1 Stx1-Rep 2 Stx2-Rep 1 Stx2-Rep 2
OD
val
ue
Active toxin Inactive toxin
C
Figure 4-13. Inactivation of Shiga toxins in PBS as indicated by the release of
lactate dehydrogenase measured by an LDH assay. Inactivation condition:
80°C for 5 h (A), 85°C for 4 h (B) and 90°C for 2 h (C).
101
4.3 Discussion
1) Thermal inactivation of Shiga toxins
The inactivation of Shiga toxins in PBS and orange juice at temperatures in the
high temperature short time (HTST) pasteurization range has not been reported
prior to this work. Although the stability of Shiga toxins as affected by thermal
treatments had been studied before (4, 37, 58, 67), there was almost no
information about the inactivation condition in a food matrix. This study
determined the thermal inactivation kinetics of Shiga toxins at HTST
pasteurization temperatures of 72, 80, 85 and 90°C. The kinetic factors
including D value, Z value, half life, 12 half life reduction and activation energy
(Ea) were determined through inactivation experiments of Shiga toxins in buffer
(PBS) and orange juice.
The results of this study indicated that thermal treatment could be an effective
method for inactivating Shiga toxins in PBS and orange juice. Although heat
could not completely inactivate Shiga toxins at standard HTST pasteurization
conditions (72°C, 15 s; 90°C, 0.5 s), the activity of Shiga toxins was remarkably
reduced with increased temperature due to denaturation of the toxin protein.
The half life of both Shiga toxins decreased at least 100-fold when the heating
temperature was increased from 72 to 90°C in both PBS and orange juice.
Previously published studies on thermal inactivation of Shiga toxins in Tris-
buffered saline or other pH controlled buffers also confirmed that there was a
temperature and time-dependent decrease in the activity of Shiga toxins when
heated above 70°C (37, 67). However, due to the different detection and
inactivation methods, the inactivation time and temperature results were
different. For instance, a previous study (37) reported that Shiga toxin 1 in Tris-
buffered saline could be completely inactivated at 80°C for 60 min or 85°C for 5

102
min while in the present study we found that both Shiga toxins in PBS were
completely inactivated 10 s at 90°C and 30 s at 85°C. Detection limits of each
method played a key role in the final results.
The intravenous and intraperitoneal LD50 of Shiga toxin was determined to be
0.05 μg/kg body weight for mice (48), but there is no information on a similar
oral dose. As a risk assessment exercise, we could assume that the oral lethal
dose could be 100 times the intraperitoneal dose which would be 5 μg/kg and
the lethal dose for a 20 kg child is 100 μg. For instance, a 7,000 gal (26,409 kg)
silo of orange juice is able to produce 106,000 servings of orange juice (0.25
kg/serving in a 250 mL juice bottle). A hypothetical intentional attack would
require a terrorist to add only 11g of Shiga toxin to get a potential lethal dose in
every serving of the orange juice. Under these assumptions, it would then be
relatively easy for bioterrorists to deliver sufficient Shiga toxin into tanks in an
orange juice plant. Assuming a bottle of orange juice with a volume of 8 oz is
deliberately adulterated by addition of 100 μg of Shiga toxin, a 1000 fold
reduction to meet a theoretical requirement from EPA would require at least 60
s and 10 s for Stx1 and Stx2, respectively, with a standard treatment at 90°C.
Such a reduction is possible in many pasteurizers with the proper hold tube and
Shiga toxins would be reduced to 0.1% of the lethal dose which would then be
presumably inactive and safe for disposal.
Conventional pasteurization processing requires 30 min at 63°C, 15 s at 72°C,
1.0 s at 89°C and 0.5 s at 90°C. A comparison of the standard processing time
versus the D values is listed in Table 4-11. As seen, standard pasteurization
would not ensure complete inactivation of ricin or Shiga toxins. However, a
1000 fold reduction required by EPA with longer processing time is possible in
many pasteurizers with the proper hold tube.
103
Table 4-11. Number of D values accomplished within standard processing time
under HTST temperatures.
No. of D values Temp. (°C) Standard processing time (s)
Ricin Stx1 Stx2
72 15 0.0007 0.006 0.01
90 0.5 0.003 0.02 0.2
2) Comparison of inactivation results in different food matrices
The ANOVA results with a p value of 0.45 in the present study suggested that
there was little effect of liquid media on D values. PBS is composed of salts
including NaCl, KCl, Na2HPO4 and KH2PO4 with a pH of 7.2 while orange juice
is composed of sugars, salts, citric acid and wide variety of other organic
compounds with a pH of ~3.5. The pH difference had little effect on the rate of
inactivation and D value at each temperature. These results may suggests that
thermal stability of Shiga toxins was not affected by different matrices and no
significant difference in inactivation rate was apparent whether determined in
PBS or orange juice (Table 4-12).
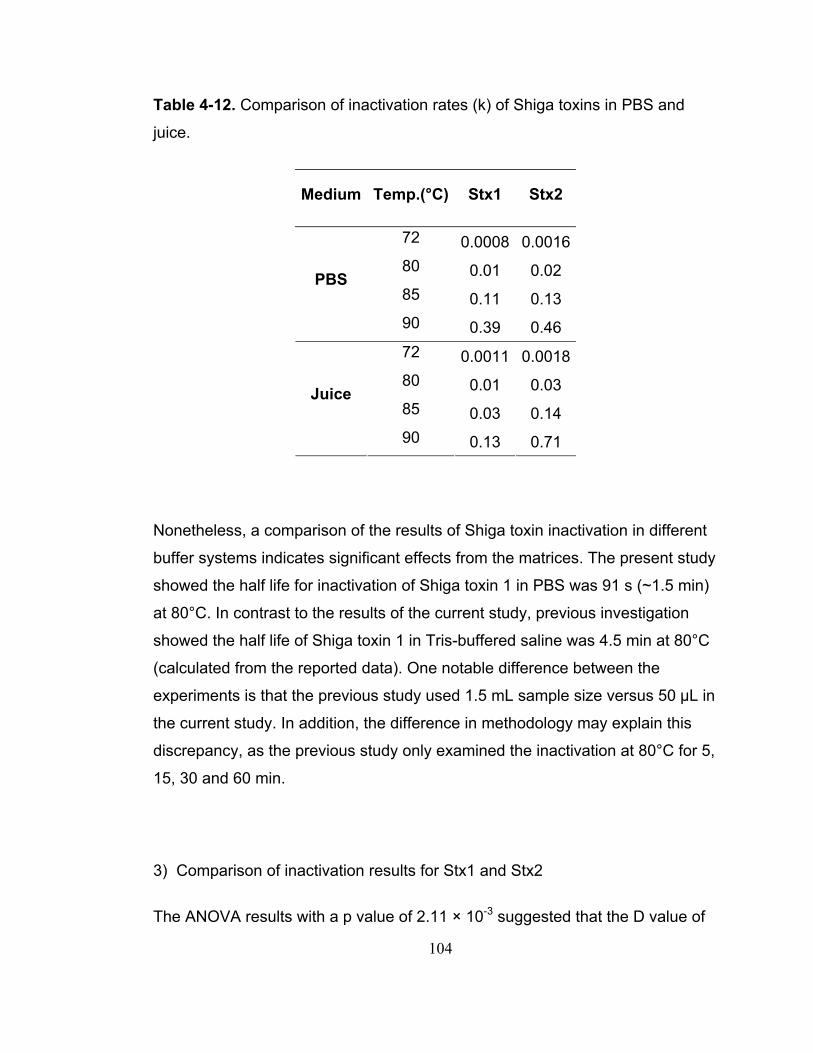
104
Table 4-12. Comparison of inactivation rates (k) of Shiga toxins in PBS and
juice.
Medium Temp.(°C) Stx1 Stx2
72 0.0008 0.001680 0.01 0.02 85 0.11 0.13
PBS
90 0.39 0.46 72 0.0011 0.001880 0.01 0.03 85 0.03 0.14
Juice
90 0.13 0.71
Nonetheless, a comparison of the results of Shiga toxin inactivation in different
buffer systems indicates significant effects from the matrices. The present study
showed the half life for inactivation of Shiga toxin 1 in PBS was 91 s (~1.5 min)
at 80°C. In contrast to the results of the current study, previous investigation
showed the half life of Shiga toxin 1 in Tris-buffered saline was 4.5 min at 80°C
(calculated from the reported data). One notable difference between the
experiments is that the previous study used 1.5 mL sample size versus 50 μL in
the current study. In addition, the difference in methodology may explain this
discrepancy, as the previous study only examined the inactivation at 80°C for 5,
15, 30 and 60 min.
3) Comparison of inactivation results for Stx1 and Stx2
The ANOVA results with a p value of 2.11 × 10⁻³ suggested that the D value of
105
Shiga toxin was affected by the toxin type. The enzymatic activities of Shiga
toxin 1 and Shiga toxin 2 are indistinguishable in cell-free systems as well as
their specific activities for Vero cells (48). However, the toxicities of these two
types of toxins are significantly different in mice. Since Stx2 binds to the Gb3
receptor in cells less tightly than Stx1, it may be more easily released from the
receptor before endocytosis and is exposed to more (48). As a result, Shiga
toxin 2 is 400 times more toxic than Shiga toxin 1. In addition, the structural
differences of these two Shiga toxins in the length and sequence of amino acids
are possible reasons for different D values after heat treatment (48).
4) LDH assay for confirmation of inactivation
An indirect LDH assay that measured the biological effect of Shiga toxins on
Vero cells was used to confirm their biological inactivation in this study.
Alternative incubation conditions were determined since toxins could not be
taken out of the biosafety laboratory where a regular CO2 incubator was not
available. CO2 and humidity are two key factors for the healthy growth of Vero
cells. A CO2-bicarbonate system is the main buffering system in most media.
The interaction of CO2 derived from the cells or the atmosphere with water
leads to a decrease in pH due to the formation of carbonic acid when CO2
dissolves in water (46).
Shiga toxins were inactivated at 90°C for 2 h, 85°C for 4 h and 80°C for 5 h in
microcentrifuge tubes. There was enormous variability apparently due to the
unique physiology of Vero cells and the reproducibility of the measurements
was markedly affected, especially at 80°C. With increasing inactivation time,
some unknown reactions occurred during the inactivation period. Along with the
uncertainty of the LDH assay, the OD value after the heat treatment sometimes
was higher than the one before. However, the inactivation of Shiga toxins was
confirmed based on the reduction of activity at 85°C and 90°C. The

106
determination of the LDH released by Vero cells was proven to be inconsistent
at lower temperatures.
5) Comparison with other agents
The agents which could be used as bioterror weapon, including botulism toxin,
ricin, Shiga toxin and Bacillus anthracis strain ANR-1 spores, were compared
with each other. The amounts of these agents that are lethal to a 20 kg child for
an oral dose in one serving of orange juice were calculated and summarized in
Table 4-13. Botulism toxin has the lowest amount needed to be lethal as
compared to ricin which has the largest amount needed. The amount of Shiga
toxin required to result in death is almost 40 fold less than that of ricin. Although
these values are significantly different, the maximum amount needed is only
424 g and this is indicating that all of these agents are main concerns as
biological warfare in food systems.
Kinetic parameters for these agents were also collected and correlation
between safe inactivation time and temperature are compared in Figure 4-14.
Generally, botulism toxins needed the shortest heat treatment time to achieve a
safe level comparing to any other agents. In contrast, Bacillus anthracis spores
required the longest time which was significantly different from other agents.
The heat treatment time for Shiga toxin in orange juice was approximately one
log difference less than that for ricin in orange juice and more than one log
difference as compared to that for B. anthracis spores to achieve a safe level.
Shiga toxin required a shorter time to be inactivated to get a presumable safe
level than ricin. In all cases, the protein toxins require less time for inactivation
to a safe level as compared to Bacillus anthracis spores. The evaluation of the
lethality and time required to inactivate these agents to a safe level indicated
their great potential as bioterror weapon in a food supply system.
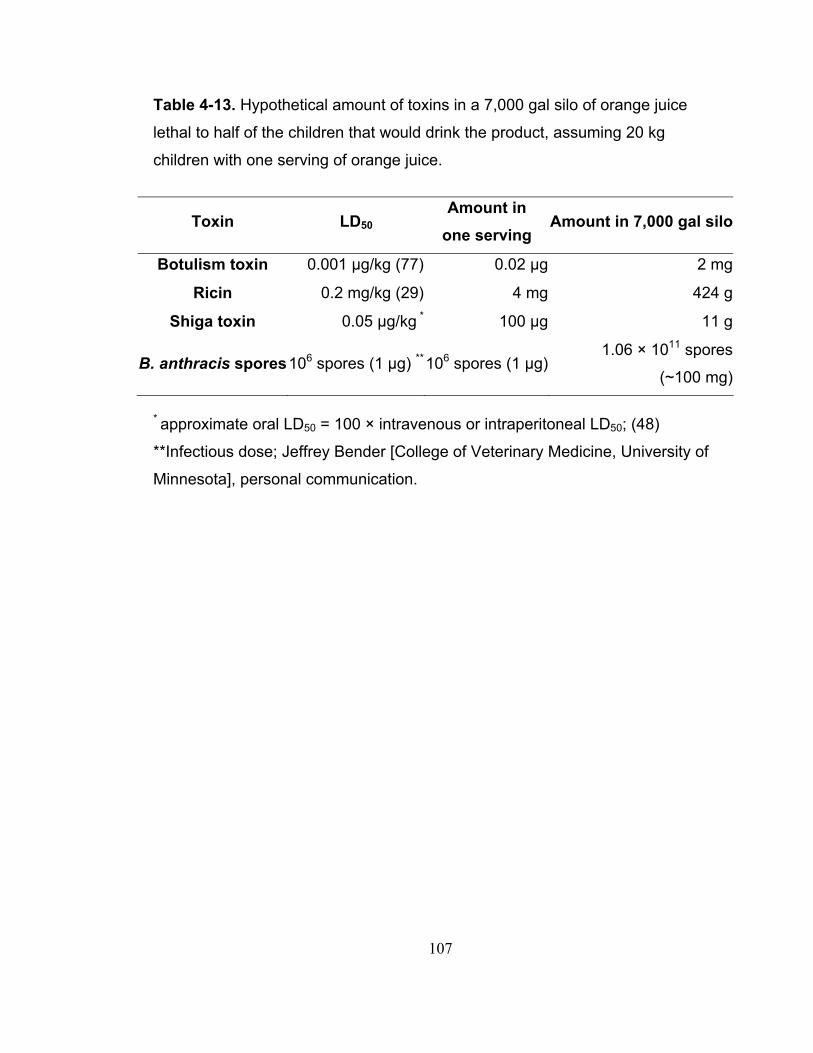
107
Table 4-13. Hypothetical amount of toxins in a 7,000 gal silo of orange juice
lethal to half of the children that would drink the product, assuming 20 kg
children with one serving of orange juice.
Toxin LD50 Amount in
one serving Amount in 7,000 gal silo
Botulism toxin 0.001 μg/kg (77) 0.02 μg 2 mg
Ricin 0.2 mg/kg (29) 4 mg 424 g
Shiga toxin 0.05 μg/kg * 100 μg 11 g
B. anthracis spores 106 spores (1 μg) **106 spores (1 μg)1.06 × 10¹¹ spores
(~100 mg)
* approximate oral LD50 = 100 × intravenous or intraperitoneal LD50; (48)
**Infectious dose; Jeffrey Bender [College of Veterinary Medicine, University of
Minnesota], personal communication.
108
0.01
0.10
1.00
10.00
100.00
1000.00
10000.00
70 75 80 85 90 95 100 105 110 115Temperature (°C)
Safe
Inac
tivat
ion
Tim
e (m
in)
Figure 4-14. Comparison of temperature dependence for safe inactivation time
(10 half lives) for Bacillus anthracis spores ( ) (78), ricin in milk ( ) (Xu and
others, unpublished), botulism toxin (BT) (76) in canned corn (○) (pH 6.2) and
phosphate buffer ( ) (pH 6.8), ricin in orange juice ( ) and Shiga toxin in orange
juice ( ).
In summary, this is the first study that reports the thermal inactivation of Shiga
toxins in orange juice at temperatures within the HTST pasteurization range. A
set of temperature/time processing conditions have been identified that could
be useful in the event of a bioterrorist attack. The heat inactivation of Shiga
toxins in PBS and orange juice followed first-order reaction kinetics. Both Shiga
toxins in PBS and orange juice would reach the concentration that was not
detectable by use of ELISA kit within 30 s at 90°C and 120 s at 85°C. The Z
value for Stx1 and Stx2 was 6.7 and 7.2 in PBS as well as 8.7 and 6.9 in
orange juice. This study generated initial data that could lead to the
development of feasible and effective decontamination procedures which could
be applied in orange juice plant with typical pasteurization equipment to mitigate
the impact of an intentional attack with Shiga toxins. Recommendations for
further studies may include animal studies to evaluate the NOAEL and oral
109
lethal dose of ricin and Shiga toxins, correlation studies of ELISA method and
cytotoxicity assay as well as the inactivation studies for other select agents in
food systems.
110
5 References
1. Anandan, S., G. K. Anil Kumar, J. Ghosh, and K. S. Ramachandra. 2004. Effect of different physical and chemical treatments on detoxification of ricin in castor cake. Anim. Feed Sci. Technol. 120:159-168.
2. Arrhenius, S. 1889. Uber die reaktionsgeschwindigkeit bei der inversion von rohrzucker durch sauren. Z. Phys. Chem. 4:226-248.
3. Audi, J., M. Belson, M. Patel, J. Schier, and J. Osterloh. 2005. Ricin poisoning: a comprehensive review. JAMA 294:2342-2351.
4. Babu, U. S., D. M. Gaines, Y. Wu, C. D. Westphal, M. Pereira, and R. B. Raybourne. 2008. Use of flow cytometry in an apoptosis assay to determine pH and temperature stability of Shiga-like toxin 1. J. Microbiol. Meth. 75:167-171.
5. Binetti, A. G., and J. A. Reinheimer. 2000. Thermal and chemical inactivation of indigenous Streptococcus thermophilus bacteriophages isolated from Argentinian dairy plants. J. Food Prot. 63:509-515.
6. Bradberry, S. M., K. J. Dickers, P. Rice, G. D. Griffiths, and J. A. Vale. 2003. Ricin poisoning. Toxicol. Rev. 22:65-70.
7. CDC. 2003. Investigation of a ricin-containing envelope at a postal facility--South Carolina, 2003. Mort. Morb. Wkly. Rep. 52:1129-1131.
8. CDC, and NIH. 2007. Biosafety in Microbiological and Biomedical Laboratories (BMBL) 5th ed, vol. US Government Printing Office, Washington.
9. Chang, W., D. A. Small, F. Toghrol, and W. E. Bentley. 2005. Microarray analysis of toxicogenomic effects of peracetic acid on Pseudomonas aeruginosa. Environ. Sci. Technol. 39:5893-5899.
10. Chavez-Olortegui, C., S. C. Fonseca, D. Campolina, C. F. Amaral, and C. R. Diniz. 1994. ELISA for the detection of toxic antigens in experimental and clinical envenoming by Tityus serrulatus scorpion venom. Toxicon. 32:1649-1656.
11. Chen, X. Y., T. M. Link, and V. L. Schramm. 1998. Ricin A-chain: kinetics, mechanism, and RNA stem-loop inhibitors. Biochem. 37:11605-11613.
12. Cole, K. D., A. Gaigalas, and J. L. Almeida. 2008. Process monitoring the inactivation of ricin and model proteins by disinfectants using fluorescence and biological activity. Biotechnol. Progr. 24:784-791.
13. Crowther, J. R. 1995. Indirect ELISA. In J. R. Crowther (ed.), ELISA: Theory and Practice. Humana Press Inc., Totowa, New Jersey.
14. Crowther, J. R. 2001. Systems in ELISA. In J. R. Crowther (ed.), The ELISA Guidebook, vol. 149. Humana Press Inc., Totowa, New Jersey.
15. Cushley, W., M. J. Muirhead, F. Silva, J. Greathouse, T. Tucker, J. W. Uhr, and E. S. Vitetta. 1984. In-vivo reconstitution of ricin-like activity from its A chain and B chain subunits. Toxicon. 22:265-278.
111
16. Denny, C. B., J. Y. Humber, and C. W. Bohrer. 1971. Effect of toxin concentration on the heat inactivation of staphylococcal enterotoxin A in beef bouillon and in phosphate buffer. Appl. Microbiol. 21:1064-1066.
17. Despeyroux, D., N. Walker, M. Pearce, M. Fisher, M. McDonnell, S. C. Bailey, G. D. Griffiths, and P. Watts. 2000. Characterization of ricin heterogeneity by electrospray mass spectrometry, capillary electrophoresis, and resonant mirror. Anal. Biochem. 279:23-36.
18. Emond, S. P., and C. Campden. 2001. Continuous heat processing. In P. Richardson (ed.), Thermal Technologies in Food Processing. Woodhead Publishing Limited, Abington Cambridge, England.
19. Endo, Y., K. Mitsui, M. Motizuki, and K. Tsurugi. 1987. The mechanism of action of ricin and related toxic lectins on eukaryotic ribosomes. The site and the characteristics of the modification in 28 S ribosomal RNA caused by the toxins. J. Biol. Chem. 262:5908-5912.
20. EPA. 1998. Arsenic, inorganic. 21. EPA. 2001. National Primary Drinking Water Regulations; Arsenic and
Clarifications to Compliance and New Source Contaminants Monitoring. vol. 66. EPA.
22. FDA. 2009. Code of federal regulations. 21. FDA. 23. FDA. 2001. HACCP procedures for the safe and sanitary processing and
importing of juice: final rule federal register. FDA. 24. Garber, E. A. 2008. Toxicity and detection of ricin and abrin in
beverages. J. Food Prot. 71:1875-1883. 25. Gardner, H., E. L. D’Aquin, S. P. Koltun, E. J. McCourtney, H. L. E.
Vix, and E. A. Gastrock. 1960. Detoxification and deallergenization of castor beans. J. Am. Oil Chem. Soc. 37:142-148.
26. He, X., S. Lu, L. W. Cheng, R. Rasooly, and J. M. Carter. 2008. Effect of food matrices on the biological activity of ricin. J. Food Prot. 71:2053-2058.
27. Hilker, J. S., W. R. Heilman, P. L. Tan, C. B. Denny, and C. W. Bohrer. 1968. Heat inactivation of enterotoxin A from Staphylococcus aureus in veronal buffer. Appl. Microbiol. 16:308-310.
28. Houston, L. L. 1982. Transport of ricin A chain after prior treatment of mouse leukemia cells with ricin B chain. Biol. Chem. 257:1532-1539.
29. Jackson, L. S., W. H. Tolleson, and S. J. Chirtel. 2006. Thermal inactivation of ricin using infant formula as a food matrix Agric. Food Chem. 54:7300-7304.
30. Jenkins, F. P. 1963. Allergenic and toxic components of castor bean meal: Review of the literature and studies of the inactivation of these components. J. Sci. Food Agric. 14:773-780.
31. Kalb, S. R., and J. R. Barr. 2009. Mass spectrometric detection of ricin and its activity in food and clinical samples. Anal. Chem. 81:2037-2042.
32. Kelly, A. L., N. Datta, and H. C. Deeth. 2006. Thermal processing of dairy products. In D. W. Sun (ed.), Thermal Food Processing: New Technologies and Quality Issues. CRC Press.
112
33. Kemeny, D. M., and S. Chantler. 1988. An introduction to ELISA. In D. M. Kemeny and S. J. Challacombe (ed.), ELISA and Other Solid Phase Immunoassays: Theoretical and Practical Aspects. John Wiley & Sons Ltd., Portsmouth.
34. Kennedy, S. P., and F. Busta. 2007. Biosecurity: food protection and defense, p. 35. In M. P. Doyle and L. R. Beuchatt (ed.), Food Microbiology: Fundamentals and Frontiers, 3rd ed. ASM Press.
35. Khan, A. S., D. L. Swerdlow, and D. D. Juranek. 2001. Precautions against biological and chemical terrorism directed at food and water supplies. Public Health Rep. 116:3-14.
36. Kitis, M. 2004. Disinfection of wastewater with peracetic acid: a review. Environ. Int. 30:47-55.
37. Kittell, F. B., V. V. Padhye, and M. P. Doyle. 1991. Characterization and inactivation of verotoxin 1 produced by Escherichia coli O157:H7. J. Agric. Food Chem. 39:141-145.
38. Konowalchuk, J., J. I. Speirs, and S. Stavric. 1977. Vero response to a cytotoxin of Escherichia coli. Infect. Immun. 18:775-779.
39. Labuza, T. P. 2009. Kinetic theory and temperature dependence, p. 34. University of Minnesota, St. Paul.
40. Labuza, T. P. 2007. Reaction kinetics, p. 48. University of Minnesota, St. Paul.
41. Labuza, T. P., and J. F. Kamman. 1983. Reaction kinetics and accelerated shelf life test simulation as a function of temperature, p. 71-151. Application of Computers in Food Research and the Food Industry, vol. I. Marcel Dekker, Inc., New York.
42. Leishman, O. N. 2009. Concentration and extraction of Bacillus anthracis spores and ricin toxin from liquid foods. University of Minnesota, St. Paul.
43. Lequin, R. M. 2005. Enzyme immunoassay (EIA)/enzyme-linked immunosorbent assay (ELISA). Clin. Chem. 51:2415-2418.
44. Lewis, M. J., and N. J. Heppell. 2000. Pasteurization, p. 193. In M. J. Lewis and N. J. Heppell (ed.), Continuous Thermal Processing of Foods: Pasteurization and UHT Sterilization. Aspen Publisher, Inc., Gaithersburg.
45. Losikoff, M. E. 1978. Establishment of a heat inactivation curve for Clostridium botulinum 62A toxin in beef broth. Appl. Environ. Microbiol. 36:386-388.
46. Mather, J. P., and P. E. Roberts. 1998. The physical environment, p. 260. In J. P. Mather and P. E. Roberts (ed.), Introduction to Cell and Tissue Culture: Theory and Technique. Springer.
47. Melton-Celsa, A. R., and A. D. O'Brien. 1998. Structure, biology, and relative toxicity of Shiga toxin family members for cells and animals, p. 121-125. In A. D. O. B. James B. Kaper (ed.), Escherichia coli O157:H7 and other Shiga toxin-producing E.coli strains. American Society for Microbiology, Washington, D.C.
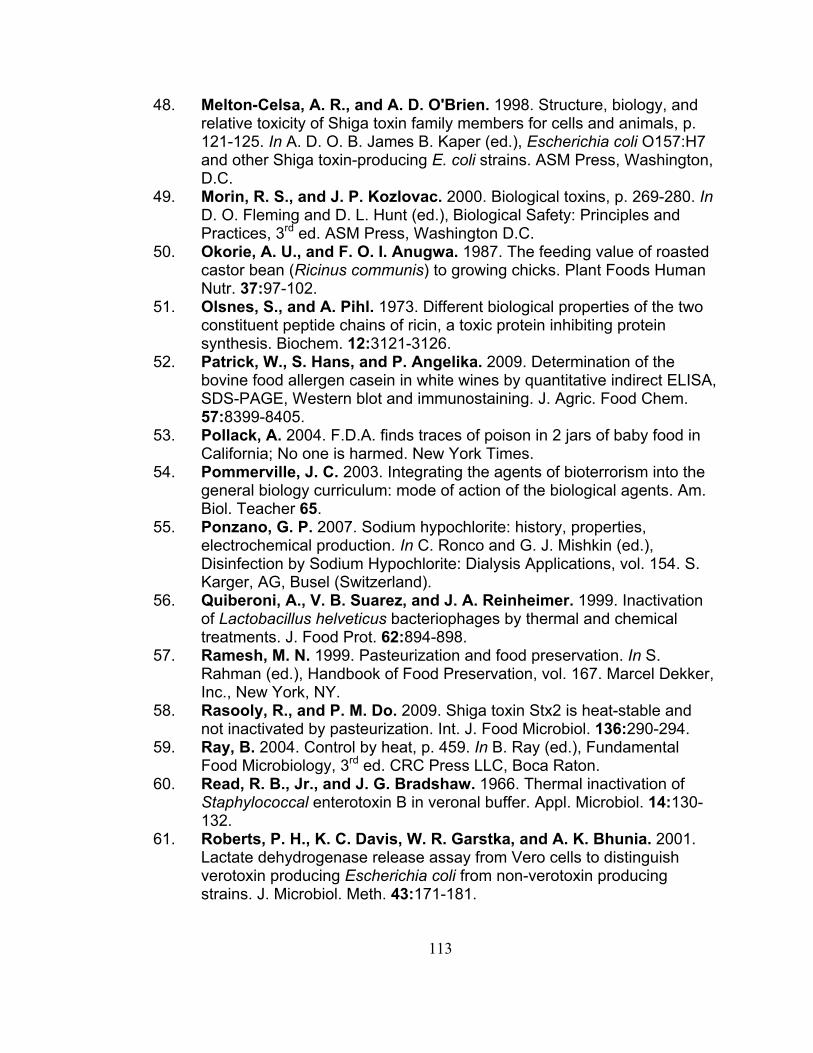
113
48. Melton-Celsa, A. R., and A. D. O'Brien. 1998. Structure, biology, and relative toxicity of Shiga toxin family members for cells and animals, p. 121-125. In A. D. O. B. James B. Kaper (ed.), Escherichia coli O157:H7 and other Shiga toxin-producing E. coli strains. ASM Press, Washington, D.C.
49. Morin, R. S., and J. P. Kozlovac. 2000. Biological toxins, p. 269-280. In D. O. Fleming and D. L. Hunt (ed.), Biological Safety: Principles and Practices, 3rd ed. ASM Press, Washington D.C.
50. Okorie, A. U., and F. O. I. Anugwa. 1987. The feeding value of roasted castor bean (Ricinus communis) to growing chicks. Plant Foods Human Nutr. 37:97-102.
51. Olsnes, S., and A. Pihl. 1973. Different biological properties of the two constituent peptide chains of ricin, a toxic protein inhibiting protein synthesis. Biochem. 12:3121-3126.
52. Patrick, W., S. Hans, and P. Angelika. 2009. Determination of the bovine food allergen casein in white wines by quantitative indirect ELISA, SDS-PAGE, Western blot and immunostaining. J. Agric. Food Chem. 57:8399-8405.
53. Pollack, A. 2004. F.D.A. finds traces of poison in 2 jars of baby food in California; No one is harmed. New York Times.
54. Pommerville, J. C. 2003. Integrating the agents of bioterrorism into the general biology curriculum: mode of action of the biological agents. Am. Biol. Teacher 65.
55. Ponzano, G. P. 2007. Sodium hypochlorite: history, properties, electrochemical production. In C. Ronco and G. J. Mishkin (ed.), Disinfection by Sodium Hypochlorite: Dialysis Applications, vol. 154. S. Karger, AG, Busel (Switzerland).
56. Quiberoni, A., V. B. Suarez, and J. A. Reinheimer. 1999. Inactivation of Lactobacillus helveticus bacteriophages by thermal and chemical treatments. J. Food Prot. 62:894-898.
57. Ramesh, M. N. 1999. Pasteurization and food preservation. In S. Rahman (ed.), Handbook of Food Preservation, vol. 167. Marcel Dekker, Inc., New York, NY.
58. Rasooly, R., and P. M. Do. 2009. Shiga toxin Stx2 is heat-stable and not inactivated by pasteurization. Int. J. Food Microbiol. 136:290-294.
59. Ray, B. 2004. Control by heat, p. 459. In B. Ray (ed.), Fundamental Food Microbiology, 3rd ed. CRC Press LLC, Boca Raton.
60. Read, R. B., Jr., and J. G. Bradshaw. 1966. Thermal inactivation of Staphylococcal enterotoxin B in veronal buffer. Appl. Microbiol. 14:130-132.
61. Roberts, P. H., K. C. Davis, W. R. Garstka, and A. K. Bhunia. 2001. Lactate dehydrogenase release assay from Vero cells to distinguish verotoxin producing Escherichia coli from non-verotoxin producing strains. J. Microbiol. Meth. 43:171-181.
114
62. Roberts, P. L., and D. Lloyd. 2007. Virus inactivation by protein denaturants used in affinity chromatography. Biologicals 35:343-347.
63. Rocha, L. B., and R. M. Piazza. 2007. Production of Shiga toxin by Shiga toxin-expressing Escherichia coli (STEC) in broth media: from divergence to definition. Lett. Appl. Microbiol. 45:411-417.
64. Sandhu, K. S., and K. S. Minhas. 2006. Oranges and citrus juices. In Y. H. Hui, M. P. Cano, T. Gusek, J. S. Sidhu, and N. K. Sinha (ed.), Handbook of Fruits and Fruit Processing. Blackwell Publishing Professional, Ames, Iowa.
65. Sandvig, K., and B. Van Deurs. 2000. Entry of ricin and Shiga toxin into cells: molecular mechanisms and medical perspectives. EMBO J. 19:5943-5950.
66. Sekino, T., N. Kiyokawa, T. Taguchi, H. Takenouchi, J. Matsui, W. R. Tang, T. Suzuki, H. Nakajima, M. Saito, K. Ohmi, Y. U. Katagiri, H. Okita, H. Nakao, T. Takeda, and J. Fujimoto. 2004. Characterization of a Shiga-toxin 1-resistant stock of Vero cells. Microbiol. Immunol. 48:377-387.
67. Tesh, V. L., J. A. Burris, J. W. Owens, V. M. Gordon, E. A. Wadolkowski, A. D. O'Brien, and J. E. Samuel. 1993. Comparison of the relative toxicities of Shiga-like toxins type I and type II for mice. Infect. Immun. 61:3392-3402.
68. Torane, V. P., and J. S. Shastri. 2008. Comparison of ELISA and rapid screening tests for the diagnosis of HIV, Hepatitis B and Hepatitis C among healthy blood donors in a tertiary care hospital in Mumbai. Indian J. Med. Microbiol. 26:284-285.
69. TOXNET. 2005. Toxicology data network. http://www.toxnet.nlm.nih.gov ed. National Library of Medicine.
70. USDA. 2001. Economic research service (ERS). USDA. 71. Viscardi, M., A. G. Perugini, C. Auriemma, F. Capuano, S. Morabito,
K. P. Kim, M. J. Loessner, and G. Iovane. 2008. Isolation and characterisation of two novel coliphages with high potential to control antibiotic-resistant pathogenic Escherichia coli (EHEC and EPEC). Int. J. Antimicrob. Agents 31:152-157.
72. Wein, L. M., and Y. F. Liu. 2005. Analyzing a bioterror attack on the food supply: The case of botulinum toxin in milk. Proc. Natl. Acad. Sci. U. S. A. 102:9984-9989.
73. WHO. 2002. Terrorist Threats to Food: Guidance for Establishing and Strengthening Prevention and Response Systems. WHO, Geneva.
74. Willford, J., K. Mills, and L. D. Goodridge. 2009. Evaluation of three commercially available enzyme-linked immunosorbent assay kits for detection of Shiga toxin. J. Food Prot. 72:741-747.
75. Winder, C. 2004. Toxicity of ricin. J. Toxicol. 23:97-103. 76. Woodburn, M. J., E. Somers, J. Rodriguez, and E. J. Schantz. 1979.
Heat inactivation rates of botulinum toxins A, B, E and F in some foods and buffers. J. Food Sci. 44:1658-1661.
115
77. Woods, J. B. 2005. USAMRIID's medical management of biological casualties handbook. Maryland.
78. Xu, S., T. P. Labuza, and F. Diez-Gonzalez. 2006. Thermal inactivation of Bacillus anthracis spores in cow's milk. Appl. Environ. Microbiol. 72:4479-4483.
116
6 Appendix
1) Permission from Kirsten Sandvig
From Na Wang ([email protected]):
Dear Dr. Sandvig,
I am a master student in the Department of Food Science and Nutrition in
University of Minnesota. I am writing to ask your permission to cite your figure 1
in "Entry of ricin and Shiga toxin into cells: molecular mechanisms and medical
perspectives" in my master thesis. This is for research purpose only and is
going to be in my thesis to explain the structure of ricin and Shiga toxin. Please
let me know whether I can cite it. Thank you very much!
Have a nice day.
Na Wang
From Kirsten Sandvig ([email protected]):
Dear Na Wang,
It is fine with me.
Best regards,
Kirsten Sandvig
2) Permission from Jeffrey Pommerville
From Na Wang ([email protected]):
Dear Dr. Pommerville,
I am a master student in the Department of Food Science and Nutrition in
University of Minnesota. I am writing to ask your permission to cite your figure 4
in "Integrating the agents of bioterrorism into the general biology curriculum II.
117
mode of action of the biological agents" in my master thesis. This is for research
purpose only and is going to be in my thesis to explain the mode of action of
ricin. Please let me know whether I can cite it. Thank you very much!
Have a nice day.
Na Wang
From Jeffrey Pommerville ([email protected])
Mr Wang,
You can certainly cite the figure. Good luck to you!
Dr. Pommerville
Jeffrey Pommerville, Ph.D.
Professor of Biology and Microbiology / Glendale Community College
Office: 623-845-3910 / Email: [email protected]
Address: Department of Biology, 6000 W. Olive Avenue, Glendale, AZ 85302