Embed Size (px)
Citation preview

1
Thermal analysis and FTIR studies of volatile corrosion inhibitor model systems
Walter W. Focke1, Nontete Suzan Nhlapo1, and Eino Vuorinen2
1Institute for Applied Materials, Department of Chemical Engineering, University of Pretoria,
Private bag X20, Hatfield, Pretoria, 0028, South Africa
2National Metrology Institute of South Africa, Private bag X34, Lynnwood Ridge, Pretoria,
South Africa, 0040
Abstract
Model compounds simulating amine-carboxylic acid-based volatile corrosion inhibitors were
characterized by thermogravimetric analysis and Fourier transform infrared spectroscopy.
These systems are usually employed as equimolar mixtures to protect ferrous metals against
atmospheric corrosion. The key finding of this study was that the vapours released by such
equimolar mixtures initially contain almost free amine only. After prolonged vaporization a
steady-state azeotrope-like composition is approached. It contains excess carboxylic acid and
features impaired corrosion inhibition efficiency according to the Skinner test. In part, this
behaviour can be attributed to the mismatch in the volatilities of the amine and carboxylic
acid constituents.
Keywords: A. Steel; B. IR spectroscopy; C. Atmospheric corrosion.
*Corresponding author: Walter W. Focke, Tel: +27(12) 420 3728 and Fax: +27(12) 420 2516
E-mail address: [email protected]

2
1. Introduction
Atmospheric corrosion is a natural process that causes deterioration of metal surfaces.
It results from the individual or combined action of oxygen, moisture and contaminants (e.g.,
sulfur dioxide, hydrogen sulfide, chlorides, etc. present in air) [1,2]. Corrosion inhibitors are
compounds that, when added to corrosive environments in small quantities, drastically reduce
the corrosion rate [3]. The subclass of volatile corrosion inhibitors (VCIs) are used to protect
metal substrates against atmospheric corrosion during storage and transport [4]. The
inhibitive mechanism comprises adsorption on the metal surface followed by the formation of
a passive protective layer [2,5]. Suitable inhibitor combinations show synergistic effects. The
improved inhibition has been attributed to stronger adsorption at local defects in the oxide
layer covering the metal surface providing an improved “pore plugging effect” [2,6-8].
Assisting the development of thicker protective barrier layer on the metal surface also limits
the penetration of corrosion causing species [7].
For an inhibitor to be classified as a VCI it must be sufficiently volatile to allow fast
migration to the metal surface and rapid development of a protective film [4]. Thus volatility
is the main property that distinguishes VCIs from other corrosion inhibitors [9]. They are
therefore also referred to as vapour phase corrosion inhibitors (VPIs) [10]. VCIs provide an
effective, simple and reliable way of controlling corrosion in closed systems and
environments [5]. Proper use of VCIs considerably lengthens the service life of machinery
without promoting other forms of corrosion [3].
The efficacy of VCIs is affected by the ambient temperature and humidity, the
concentration of the inhibitor, the method of application, and by the presence or absence of
corrosive contaminants [11]. Atmospheric corrosion is generally prevented with VCIs as long

3
as the chemicals remain active [2]. Thus the metal packaging materials should be chosen
carefully to retain the VCIs and to prevent deactivation due to UV exposure [2,4].
Several techniques have been described in literature for evaluating the effectiveness
of corrosion inhibitors. They include Skinner’s test method [3], the atmospheric exposure
chamber [12], the conical flask method [13], Eschke’s test method [13], as well as
electrochemical characterizations [14-16].
A wide range of chemical compounds have been proposed as VCIs [9,11-14,16-20].
Amines [16,19,21] and, in particular their salts or mixtures with carboxylic acids
[2,9,10,17,22,23] are used to protect ferrous metals against atmospheric corrosion during
storage and transportation. Usually these systems are applied as equimolar amine-carboxylic
acid mixtures.
The interactions between amines (A) and carboxylic acids (C) are therefore
particularly relevant to this class of VCIs. Carboxylic acids have a strong tendency to form
dimers featuring two hydrogen bonds in a planar ring configuration [24]. Amines and
carboxylic acids can undergo Brønsted-Lowry acid-base reactions to form 1:1 salts. In
anhydrous organic liquid media the charged species are stabilized either through the
formation of strongly associated ion pairs (A2C2) or by further complexation with carboxylic
acid dimers to form A1C3 complexes [25,26,29-33]. The presence of water affects complex
formation [34]. Raman studies indicated that, when water is added to a pure carboxylic acid,
the cyclic carboxylic acid dimers dissociate and acid monomer-water complexes are formed
[33]. However, in amine-carboxylic acid mixtures the usual complexation behaviour is not
affected by the presence of small amounts of water [33]. The A1C3 complex co-exists with
acid monomer-water complexes [33].
The nature of the vapours released by amine-carboxylic acid-based VCIs has not been
discussed in the open literature. The aim of the present study was to apply FTIR

4
spectroscopy, thermal analysis techniques and the hyphenated TGA-FTIR characterization
method previously described [35] to VCI model systems. Mixtures of primary, secondary or
tertiary amines (1-hexylamine, morpholine or triethylamine) with n-alkanoic acids of
different chain lengths (acetic acid, 1-propanoic acid, 1-hexanoic acid, and 1-octanoic acid)
were considered. The objective was to infer either directly or indirectly how mixture
composition would affect the nature of the vapour released by the system. Whereas equimolar
amine blends of 1-octanoic acid are known VCIs, those with acetic acid tend to promote
corrosion [9]. However, the higher volatility of the lower carboxylic acids facilitates accurate
vapour phase composition measurements. Hence the decision to study a series of n-alkanoic
acids with different chain lengths.
2. Experimental
2.1. Reagents
Acetic acid (99.8%), triethylamine (TEA) (99%), 1-propanoic acid (99%), 1-
hexylamine (99%), sodium hydrogen carbonate and silica gel were supplied by Merck
chemicals. Sodium chloride (99.5%) and anhydrous sodium sulfate (99%) were supplied
Unilab. Morpholine (99.5%), 1-octanoic acid (99.5%), and Drierite (8 mesh) drying agent
were supplied by Sigma Aldrich. Fluka supplied the 1-hexanoic acid (99%). All the reagents
were used as received without further purification.
2.2. Methods
The binary mixtures of amines and carboxylic acids were prepared using the method
previously described [35]. All mixtures were made up in a dry glove box under a nitrogen
5
atmosphere to avoid air oxidation or contamination with moisture. All the experiments were
performed at an atmospheric pressure of 91.6 ± 0.3 kPa.
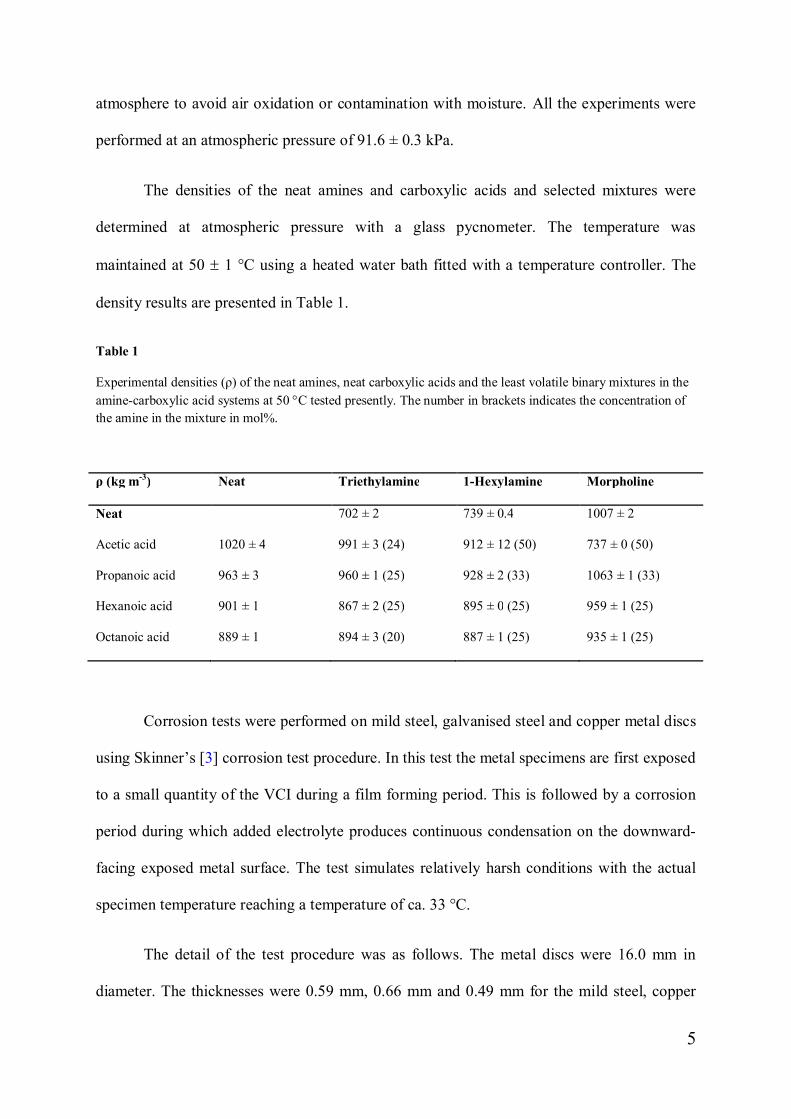
The densities of the neat amines and carboxylic acids and selected mixtures were
determined at atmospheric pressure with a glass pycnometer. The temperature was
maintained at 50 ± 1 °C using a heated water bath fitted with a temperature controller. The
density results are presented in Table 1.
Table 1
Experimental densities (ρ) of the neat amines, neat carboxylic acids and the least volatile binary mixtures in theamine-carboxylic acid systems at 50 °C tested presently. The number in brackets indicates the concentration ofthe amine in the mixture in mol%.
ρ (kg m-3) Neat Triethylamine 1-Hexylamine Morpholine
Neat 702 ± 2 739 ± 0.4 1007 ± 2
Acetic acid 1020 ± 4 991 ± 3 (24) 912 ± 12 (50) 737 ± 0 (50)
Propanoic acid 963 ± 3 960 ± 1 (25) 928 ± 2 (33) 1063 ± 1 (33)
Hexanoic acid 901 ± 1 867 ± 2 (25) 895 ± 0 (25) 959 ± 1 (25)
Octanoic acid 889 ± 1 894 ± 3 (20) 887 ± 1 (25) 935 ± 1 (25)
Corrosion tests were performed on mild steel, galvanised steel and copper metal discs
using Skinner’s [3] corrosion test procedure. In this test the metal specimens are first exposed
to a small quantity of the VCI during a film forming period. This is followed by a corrosion
period during which added electrolyte produces continuous condensation on the downward-
facing exposed metal surface. The test simulates relatively harsh conditions with the actual
specimen temperature reaching a temperature of ca. 33 °C.
The detail of the test procedure was as follows. The metal discs were 16.0 mm in
diameter. The thicknesses were 0.59 mm, 0.66 mm and 0.49 mm for the mild steel, copper
6
and galvanised specimens respectively. The surfaces of the mild steel and copper discs were
first prepared by abrading them with 320 grit sandpaper. They were scrubbed vigorously until
visual inspection indicated a shiny surface free from any visible tarnish. They were then
rinsed several times in acetone. The sandpaper treatment was omitted for the galvanized steel
buttons to avoid removing the zinc layer from the surface. The surface roughness of abraded
discs was determined with a Bruker Dimension Icon® atomic force microscope (AFM).
Experiments were carried out in the contact mode with the SNL tip (silicon tip on nitride
lever). The spring constant was 0.12 N m-1. For each metal, the surface roughness was
determined as an average over fifteen 50 μm image scans (captured at the scan rate of 0.2 Hz
or 0.4 Hz) performed on three different samples. The measured root mean square average of
the height deviations, form the mean image data plane were 0.22 ± 0.12 mm, 0.26 ± 0.14 mm,
and 0.21 ± 0.07 mm for the mild steel, copper and galvanised steel respectively.
The mass of the individual metal discs were determined prior to the corrosion tests. A
10 mm hole was punched into a plastic film with an adhesive back. This film was placed over
the metal disc with the hole located in a concentric position. This assembly was then stuck to
the inside surface of the lid of a 1 L glass preserving jar. On closing the jar the exposed
abraded metal surface pointed down towards the bottom of the jar. Thus the adhesive film
held the metal disc in place such that the metal surface area, exposed to water vapour and
moisture condensation during the corrosion test, was ca. 81 mm2.
Approximately 250 mg of the VCI model compound to be tested was measured into a
vial (diameter ca. 54 f mm; height ca. 60 mm) and placed inside the 1 L glass jar. The lid was
closed and the jar was partially submerged in a water bath set at 40 °C. About one third of the
jar protruded above the water level. Following a 72 h film forming period, electrolyte was
added to the 1 L jar and it was left for another 72 h at 40 °C. This electrolyte was prepared by
7
dissolving approximately 148 mg sodium sulfate, 165 mg sodium chloride and 138 mg
sodium hydrogen carbonate in 1 L deionized water.
At the end of this period the metal specimens were removed from the lid. Following
an evaluation by visual inspection, the metal surfaces were cleaned by rinsing them several
times with acetone. They were left to dry before the mass loss was determined. Every
experiment was repeated at least three times for statistical purposes. Eight blanks were run
for each metal to provide a reference corrosion rate under the test conditions used. These test
specimens were treated in the same way except that no corrosion inhibitor was added. The
corrosion rate (CR) of each sample in mm/year was estimated from mass loss determinations.
The inhibitor effectiveness was calculated by the formula:
where CR0 and CRI are the corrosion rates in mm per year determined in the absence
and in the presence of the inhibitor respectively.
In a separate set of experiments, the corrosion tests were repeated up to the end of the
film forming period. At this point the vials were removed and weighed to determine how
much of the VCI mixtures had evaporated. In addition, vials containing 250 mg VCI mixture
were placed in a convection oven set at 40 °C. They were removed after 72 h and the mass
loss recorded.
2.3. Instrumentation
Differential scanning calorimetry (DSC) was performed on a Mettler Toledo DSC1
instrument. Approximately 5-10 mg samples were placed in standard 40 μL aluminium pans

8
with a pin hole and heated from -40 °C to 400 °C in nitrogen flowing at 50 mL min-1.
Refractive indices were determined at 20 °C on an ATAGO® NAR-liquid instrument (Model
DTM-N). Liquid phase FT-IR data were collected using a Perkin-Elmer Spectrum RX 100
spectrometer. Samples were placed between two KBr crystal windows (25 mm diameter and
4 mm thick). Background corrected spectra were recorded at room temperature in the
wavenumber range 4000 to 800 cm-1 at a resolution of 2 cm-1.
TGA and TGA-FTIR data were collected with a Perkin-Elmer TGA 4000
thermogravimetric analyser coupled with a Spectrum RX 100 FTIR spectrometer with a 1 m
TL800 EGA transfer line. A 180 μL open alumina pan was partially filled with 85 ± 5 mg of
sample. The samples were heated from 25 °C to 50 °C at a heating a rate of 20 °C min-1 and
then kept isothermal at 50 °C for the duration of the test period. The high test temperature of
50 °C was selected to maximize volatility and because it corresponds to the highest
temperature VCIs are expected to function during commercial use. Data were collected under
N2 at the flow rate of 50 mL min-1 to prevent oxidation. The evolved gases were transferred
from the TGA to FTIR cell at a flow rate of 30 mL min-1. The spectra were recorded every
minute at 2 cm-1 wavenumber intervals at a resolution of 2 cm-1. The transfer line and FTIR
cell temperature were both kept at 230 °C to avoid condensation and prevent complex
formation. The length of the time lag from the point where vapours are released and recorded
as a TGA mass loss signal to the time that they are captured as an FTIR spectrum was
determined as previously described [35]. The composition of the vapours released and the
liquid remaining were determined according to the procedures previously reported [35].
9
3. Results
In the discussions that follow, the overall amine mole fraction of the prepared mixture
(zA) is used as the composition descriptor for the amine-carboxylic acid mixtures. The
composition of the released vapour is denoted by yA and that of the remaining liquid by xA.
3.1. Liquid phase FTIR and refractive index
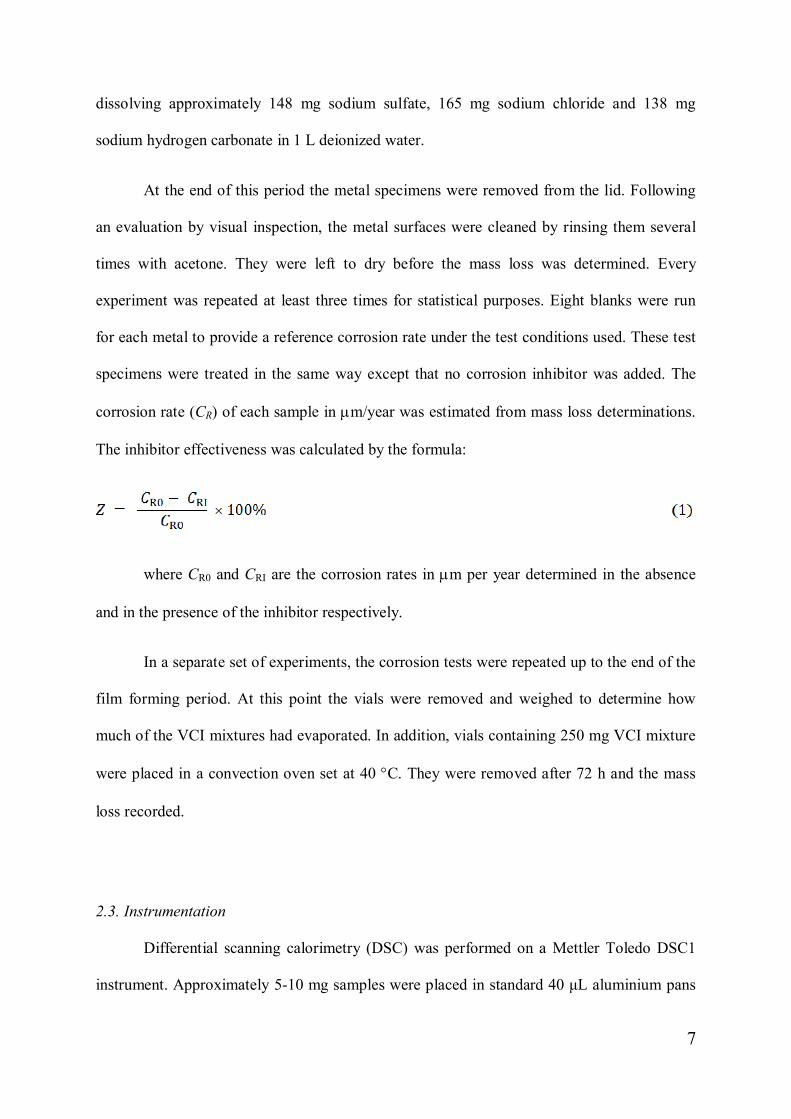
Fig. 1. Liquid phase FTIR spectra of binary mixtures of triethylamine and 1-hexanoic acid. The maximumintensity of the absorption band at ca. 1560 cm-1 (indicative of the carboxylate ion) is attained at a compositioncorresponding to the A1C3 complex, i.e. zA = 0.25.
The representative data set presented in Fig. 1 shows the effect of composition on the
liquid phase FTIR spectra for triethylamine + 1-hexanoic acid mixtures. The pure carboxylic
acids (zA = 0) all showed a sharp and high intensity absorption band at ca. 1705 cm-1
characteristic of the hydrogen-bonded carbonyl (C=O) functional group in the carboxylic acid

10
dimer form [36]. On addition of the amine, this peak decreased rapidly in intensity and
several new absorption bands developed. These changes are consistent with the formation of
an ionic complex (i.e. salt formation) between the amine and the acid in the liquid phase [36].
The band observed at ca. 1560 cm-1 is due to the ionic carboxylate ion, COO- [36,37], while
the band near 1400 cm-1 is attributed to the protonated amine [36]. Both these bands grew in
intensity as amine was added but waned beyond a critical amine concentration.
Fig. 2. The effect of liquid phase composition on the absorbance maximum near 1560 cm-1 in the FTIR spectraof binary mixtures of the various amines with 1-octanoic acid. The maximum intensity of the absorption bandnear 1560 cm-1 is attained at a composition corresponding to the A1C3 complex for triethylamine but for theother two amines it corresponds to the A1C1 complex, i.e. zA = 0.5.
Fig. 2 shows the effect of amine content on the intensity of the carboxylate ion band
(1560 cm-1) for 1-octanoic acid-based mixtures. It reached maxima at amine concentrations
near zA = 0.25 for the tertiary amine and around zA = 0.5 for the primary and secondary
amines. The liquid phase FTIR spectra obtained using the other carboxylic acids showed
similar trends. Thus the liquid phase FTIR spectra suggest that the A1C3 complex dominated
11
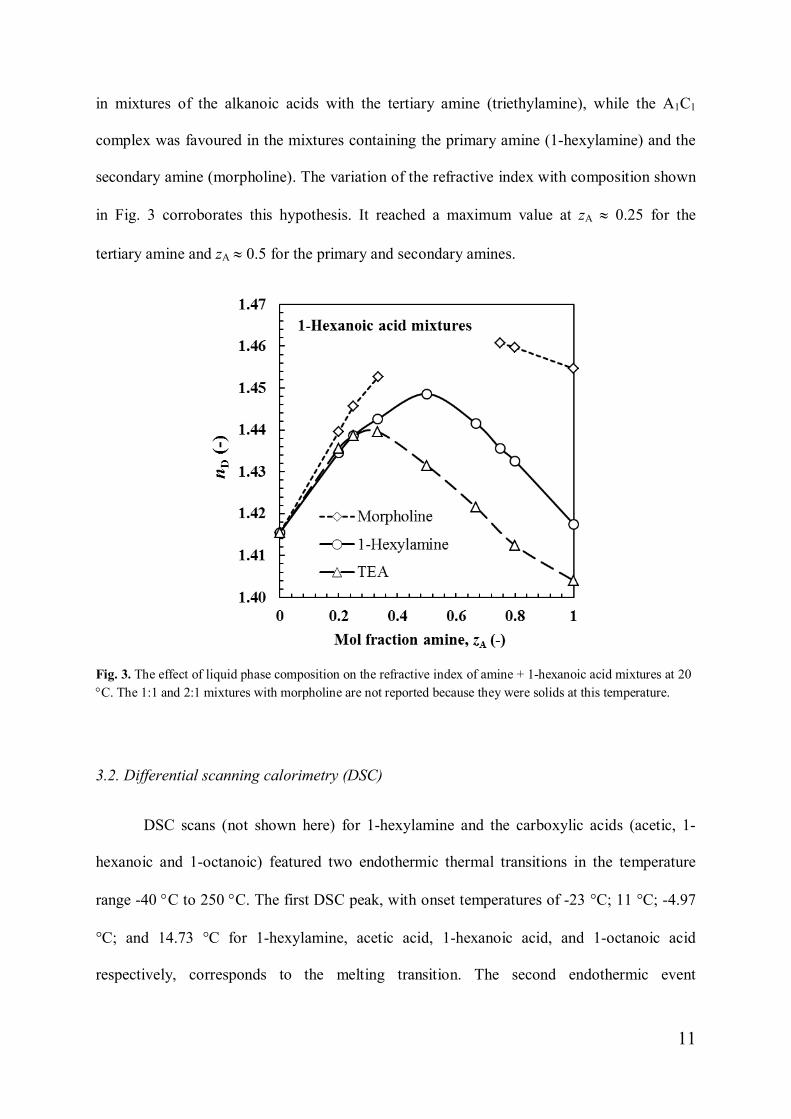
in mixtures of the alkanoic acids with the tertiary amine (triethylamine), while the A1C1
complex was favoured in the mixtures containing the primary amine (1-hexylamine) and the
secondary amine (morpholine). The variation of the refractive index with composition shown
in Fig. 3 corroborates this hypothesis. It reached a maximum value at zA » 0.25 for the
tertiary amine and zA » 0.5 for the primary and secondary amines.
Fig. 3. The effect of liquid phase composition on the refractive index of amine + 1-hexanoic acid mixtures at 20°C. The 1:1 and 2:1 mixtures with morpholine are not reported because they were solids at this temperature.
3.2. Differential scanning calorimetry (DSC)
DSC scans (not shown here) for 1-hexylamine and the carboxylic acids (acetic, 1-
hexanoic and 1-octanoic) featured two endothermic thermal transitions in the temperature
range -40 °C to 250 °C. The first DSC peak, with onset temperatures of -23 °C; 11 °C; -4.97
°C; and 14.73 °C for 1-hexylamine, acetic acid, 1-hexanoic acid, and 1-octanoic acid
respectively, corresponds to the melting transition. The second endothermic event

12
corresponds to the onset of boiling. The scans for TEA, morpholine and 1-propanoic acid
showed only a single thermal transition due to boiling.
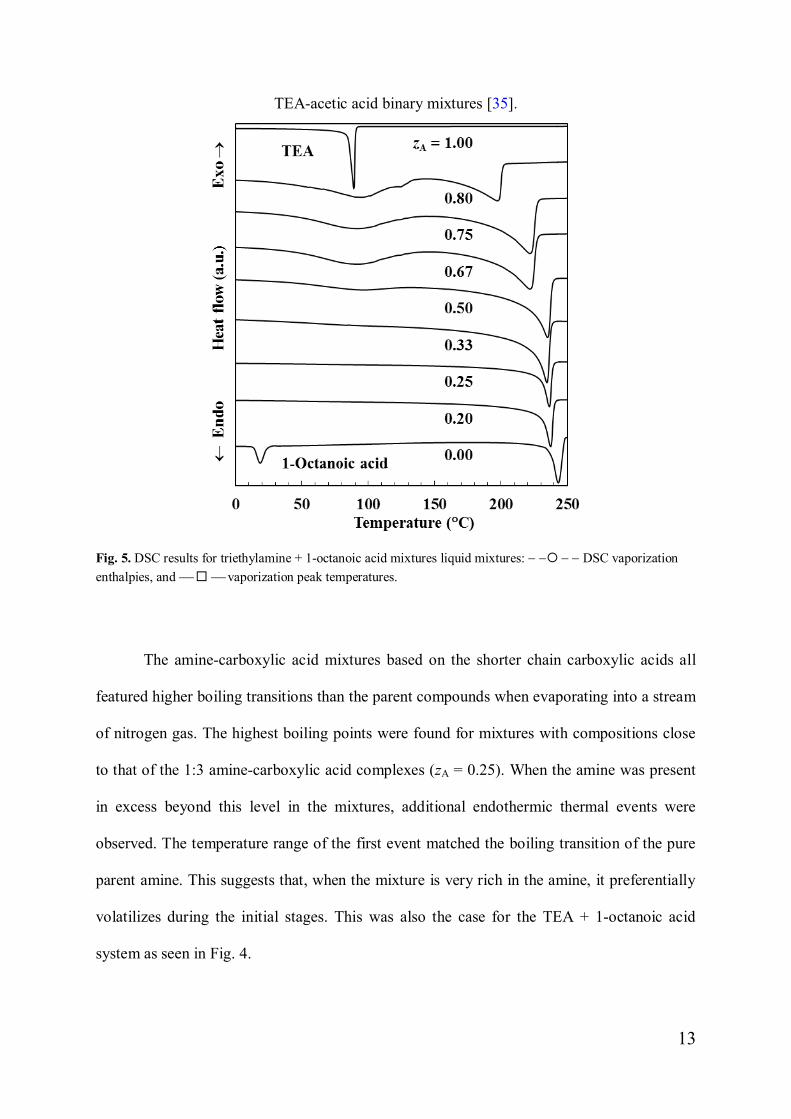
Fig. 4. DSC traces for mixtures of triethylamine + 1-octanoic acid.
Fig. 4 shows DSC scans obtained with TEA + 1-octanoic acid mixtures with differentcompositions. In the case of the mixtures considered here, no melting transitions were
observed above -40 °C. However, the highest boiling transitions showed a smooth variationwith composition. Fig. 5 also shows that the enthalpy of vaporization peaked near a
composition consistent with the prevalence of the A1C3 compound as previously observed for
13
TEA-acetic acid binary mixtures [35].
Fig. 5. DSC results for triethylamine + 1-octanoic acid mixtures liquid mixtures: - -¡ - - DSC vaporizationenthalpies, and ¾¨¾ vaporization peak temperatures.
The amine-carboxylic acid mixtures based on the shorter chain carboxylic acids all
featured higher boiling transitions than the parent compounds when evaporating into a stream
of nitrogen gas. The highest boiling points were found for mixtures with compositions close
to that of the 1:3 amine-carboxylic acid complexes (zA = 0.25). When the amine was present
in excess beyond this level in the mixtures, additional endothermic thermal events were
observed. The temperature range of the first event matched the boiling transition of the pure
parent amine. This suggests that, when the mixture is very rich in the amine, it preferentially
volatilizes during the initial stages. This was also the case for the TEA + 1-octanoic acid
system as seen in Fig. 4.
14
3.3. Thermogravimetric analysis-Fourier transform infrared spectroscopy (TGA-FTIR)
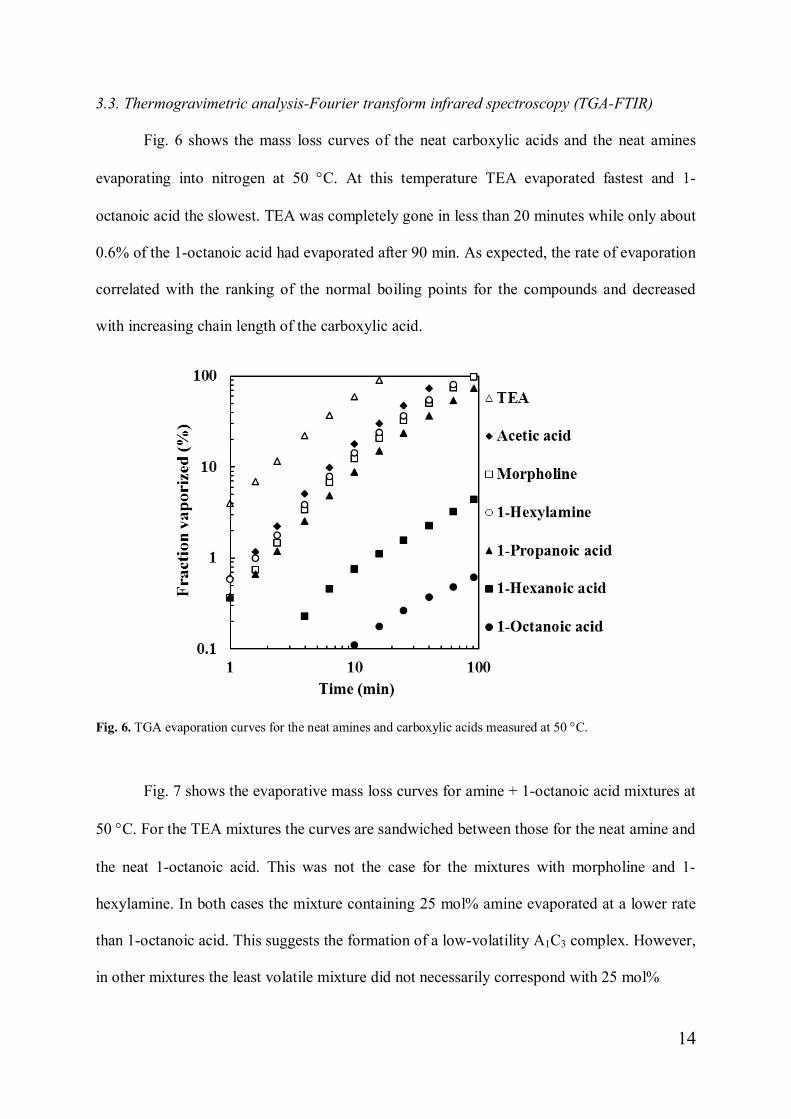
Fig. 6 shows the mass loss curves of the neat carboxylic acids and the neat amines
evaporating into nitrogen at 50 °C. At this temperature TEA evaporated fastest and 1-
octanoic acid the slowest. TEA was completely gone in less than 20 minutes while only about
0.6% of the 1-octanoic acid had evaporated after 90 min. As expected, the rate of evaporation
correlated with the ranking of the normal boiling points for the compounds and decreased
with increasing chain length of the carboxylic acid.
Fig. 6. TGA evaporation curves for the neat amines and carboxylic acids measured at 50 °C.
Fig. 7 shows the evaporative mass loss curves for amine + 1-octanoic acid mixtures at
50 °C. For the TEA mixtures the curves are sandwiched between those for the neat amine and
the neat 1-octanoic acid. This was not the case for the mixtures with morpholine and 1-
hexylamine. In both cases the mixture containing 25 mol% amine evaporated at a lower rate
than 1-octanoic acid. This suggests the formation of a low-volatility A1C3 complex. However,
in other mixtures the least volatile mixture did not necessarily correspond with 25 mol%

15
Fig. 7. TGA evaporation curves measured at 50 °C for binary mixtures of 1-octanoic acid with (A)triethylamine; (B) morpholine, and (C) 1-hexylamine.
Fig. 7. TGA evaporation curves measured at 50 °C for binary mixtures of 1-octanoic acid with (A)triethylamine; (B) morpholine, and (C) 1-hexylamine.

16
Fig. 7. TGA evaporation curves measured at 50 °C for binary mixtures of 1-octanoic acid with (A)triethylamine; (B) morpholine, and (C) 1-hexylamine.
Table 2
The gas permeability (SC = PCDAC) of the neat amines, the neat carboxylic acids and the least volatile binarymixtures in the amine-carboxylic acid systems at 50 °C tested presently. The number in brackets indicates theconcentration of the amine in the mixture in mol%.
SC (Pa m2 s-1) Neat Triethylamine 1-Hexylamine Morpholine
Neat - 60 ± 0.2 69 ± 0.3
Acetic acid 164 ± 2 1.89 ± 0.01 (24) 0.41 ± 0.03 (50) 0.67 ± 0.01 (50)
Propanoic acid 45.0 ± 0.2 1.34 ± 0.01 (25) 0.24 ± 0.01(33) 0.74 ± 0.01 (33)
Hexanoic acid 1.28 ± 0.1 0.16 ± 0.01 (25) 0.063 ± 0.002 (25) 0.078 ± 0.02 (25)
Octanoic acid 0.19 ± 0.02 0.048 ± 0.003 (20) 0.009 ± 0.001 (25) 0.022 ± 0.001 (25)
amine. Table 2 shows that the least volatile mixtures of acetic acid with either of morpholine
or 1-hexylamine corresponded to zA = 0.5, i.e. with the composition of the A1C1 salt. Note
that mixtures high in amine content showed rapid rates of evaporation initially but that it then
17
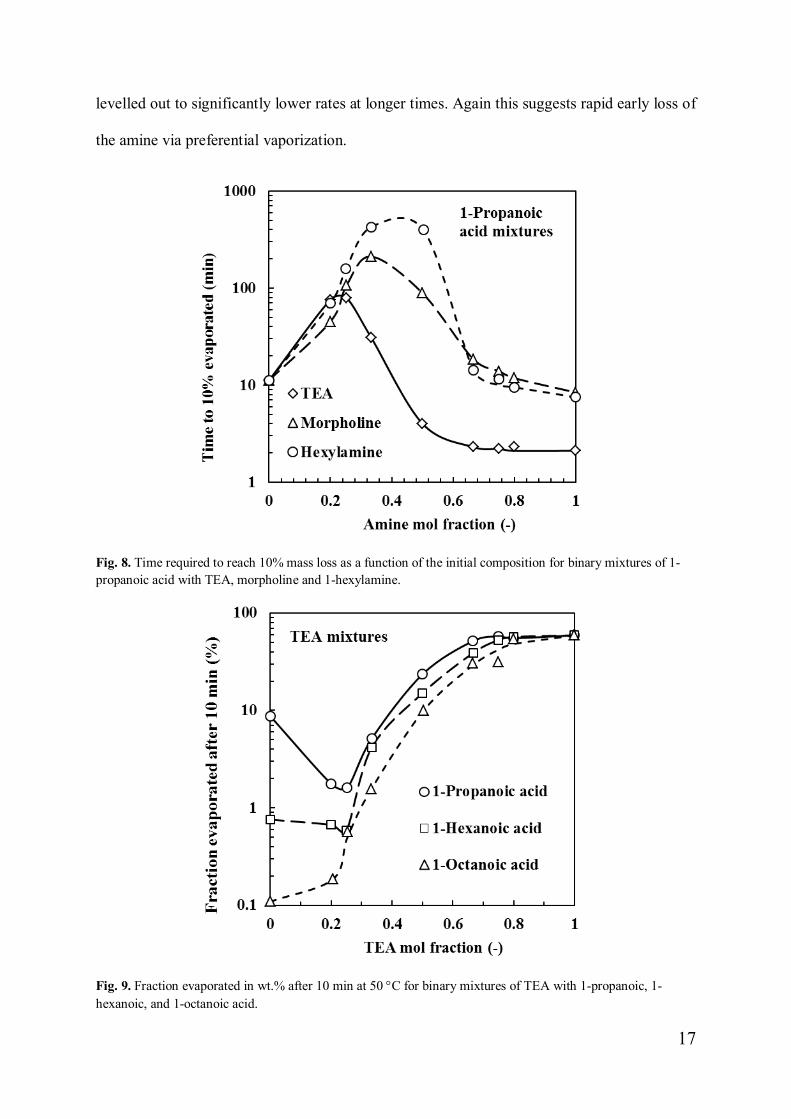
levelled out to significantly lower rates at longer times. Again this suggests rapid early loss of
the amine via preferential vaporization.
Fig. 8. Time required to reach 10% mass loss as a function of the initial composition for binary mixtures of 1-propanoic acid with TEA, morpholine and 1-hexylamine.
Fig. 9. Fraction evaporated in wt.% after 10 min at 50 °C for binary mixtures of TEA with 1-propanoic, 1-hexanoic, and 1-octanoic acid.
18
Fig. 8 shows the time required to evaporate 10% of 1-propanoic acid mixtures. Fig. 9
shows the fraction liquid vaporized after 10 min at 50 °C for TEA-based mixtures. In both
data sets the least volatile mixtures tested contained either 25 mol% or 33.3 mol% amine
except in the TEA + 1-octanoic acid system where the neat carboxylic acid was least volatile.
It should be kept in mind that this study considered a limited set of mixtures only. It is highly
unlikely that any of these would correspond exactly with composition of the least volatile
mixture in the respective systems.
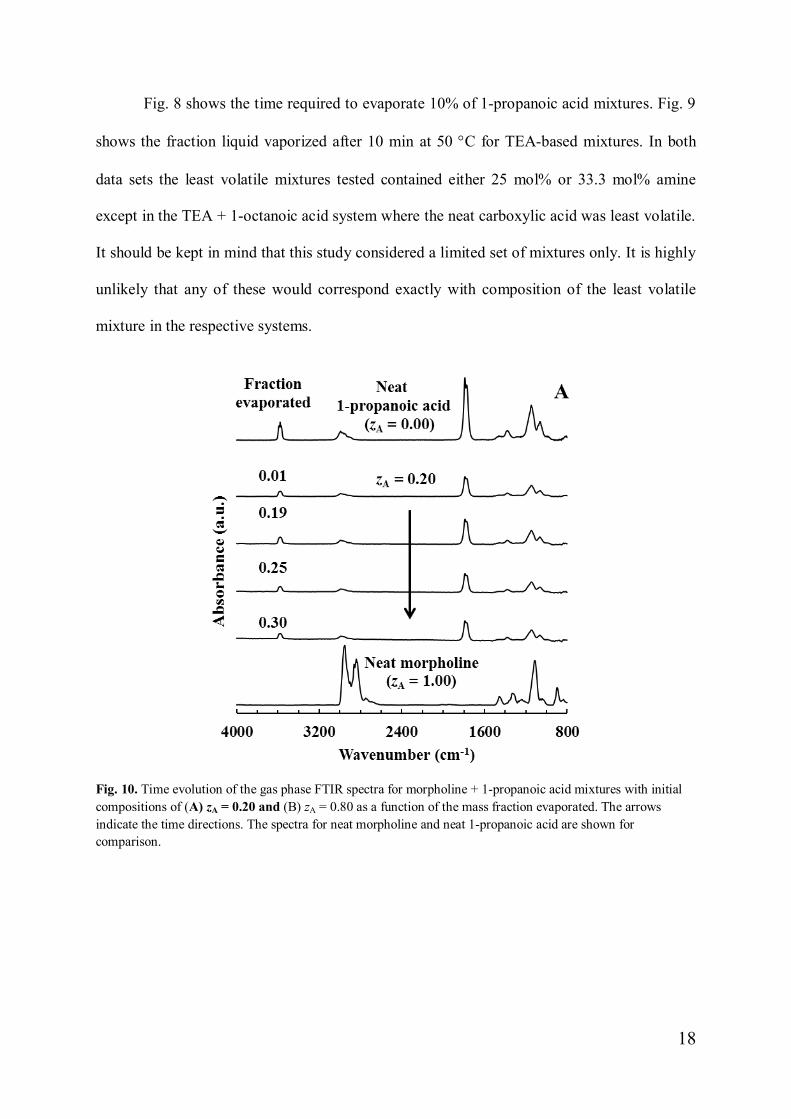
Fig. 10. Time evolution of the gas phase FTIR spectra for morpholine + 1-propanoic acid mixtures with initialcompositions of (A) zA = 0.20 and (B) zA = 0.80 as a function of the mass fraction evaporated. The arrowsindicate the time directions. The spectra for neat morpholine and neat 1-propanoic acid are shown forcomparison.

19
Fig. 10. Time evolution of the gas phase FTIR spectra for morpholine + 1-propanoic acid mixtures with initialcompositions of (A) zA = 0.20 and (B) zA = 0.80 as a function of the mass fraction evaporated. The arrowsindicate the time directions. The spectra for neat morpholine and neat 1-propanoic acid are shown forcomparison.
Fig. 10 shows representative vapour phase FTIR spectra for the morpholine + 1-
propanoic acid system. Fig. 10A and Fig. 10B show the evolution of the FTIR spectra with
fraction liquid evaporated for mixtures initially containing 20 mol% (zA = 0.2) and 80 mol%
(zA = 0.8) morpholine respectively. In the former case the spectrum of the 1-propanoic acid
dominated even after 30% of the liquid had evaporated. In the latter case the FTIR spectrum
associated with the amine dominated even up to the point where 68% of the liquid had
evaporated. Similar observations were made for the other mixtures rich in amine content. Fig.
11 shows the change in the compositions of the released vapour and the retained liquid as a
function of the fraction of inhibitor volatilized. The mixture, that initially contained 89 mol%
amine, emitted nearly pure TEA up to the point where 80% inhibitor had vaporized. Even the

20
Fig. 11. Evolution of the released vapour composition (A) and the remaining liquid composition (B) with theamount VCI remaining for TEA + 1-propanoic acid mixtures with varying initial amine content.
mixture with initial composition of zA = 0.39 released, in the beginning, nearly pure amine
into the vapour. As Fig. 11 further illustrates for the TEA + 1-propanoic acid system, the
21
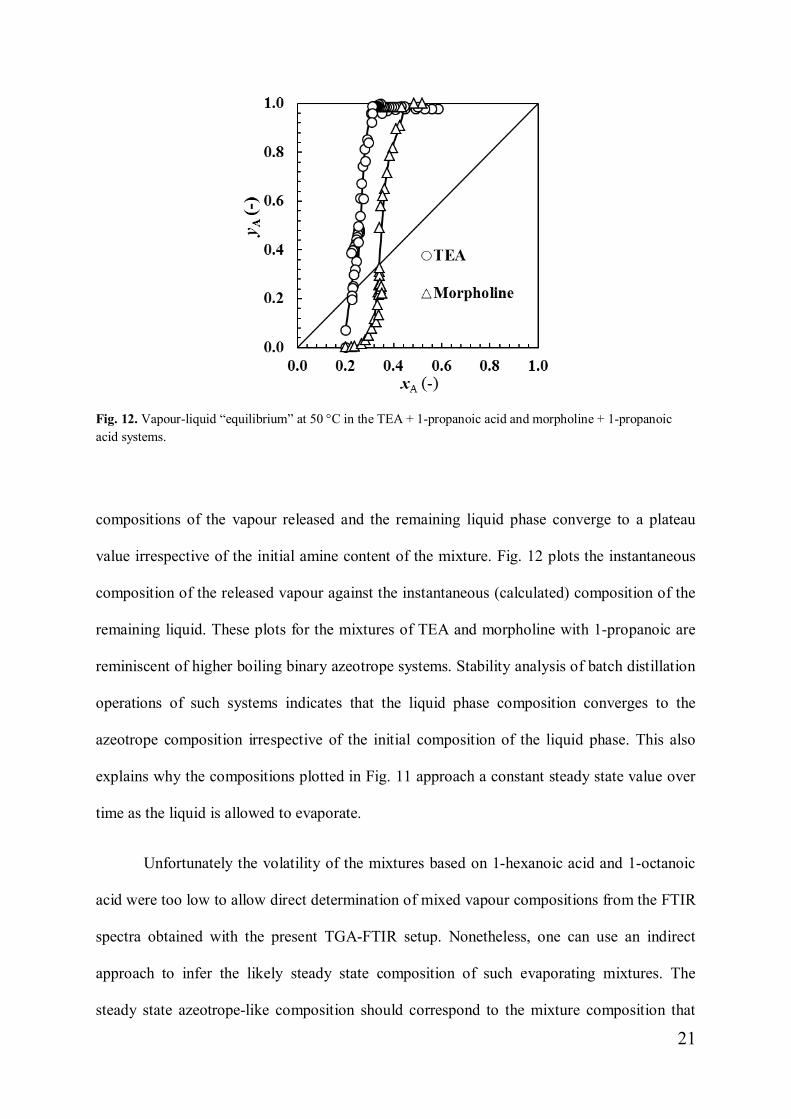
Fig. 12. Vapour-liquid “equilibrium” at 50 °C in the TEA + 1-propanoic acid and morpholine + 1-propanoicacid systems.
compositions of the vapour released and the remaining liquid phase converge to a plateau
value irrespective of the initial amine content of the mixture. Fig. 12 plots the instantaneous
composition of the released vapour against the instantaneous (calculated) composition of the
remaining liquid. These plots for the mixtures of TEA and morpholine with 1-propanoic are
reminiscent of higher boiling binary azeotrope systems. Stability analysis of batch distillation
operations of such systems indicates that the liquid phase composition converges to the
azeotrope composition irrespective of the initial composition of the liquid phase. This also
explains why the compositions plotted in Fig. 11 approach a constant steady state value over
time as the liquid is allowed to evaporate.
Unfortunately the volatility of the mixtures based on 1-hexanoic acid and 1-octanoic
acid were too low to allow direct determination of mixed vapour compositions from the FTIR
spectra obtained with the present TGA-FTIR setup. Nonetheless, one can use an indirect
approach to infer the likely steady state composition of such evaporating mixtures. The
steady state azeotrope-like composition should correspond to the mixture composition that

22
exhibits the lowest rate of evaporation. This was confirmed within experimental error for the
discrete set of compositions that were tested for acetic acid and 1-propanoic acid. Further
confirmation is provided by the following observation that also applied to the 1-hexanoic acid
and 1-octanoic acid mixtures. The initial release of the amine was detected for all mixtures
higher in amine content than the least volatility composition (as indicated by the TGA rate of
mass loss). Thus it may safely be concluded that the composition of the mixtures exhibiting
the lowest volatility indicates the azeotrope-like steady state composition of that particular
amine-carboxylic acid VCI system.
Fig. 13. Skinner corrosion test results for mild steel and copper for the amine + 1-octanoic acid mixtures withamine contents of zA = 0.25 and zA = 0.50. The metal samples were mounted on the inside lid of 1 L glass jarusing plastic film with an adhesive back. The exposed metal surface was circular in shape with a radius of ca.10.1 mm. The VCI mixture was put in a small vial placed inside the jar. The lid was closed and the jar waspartially submerged in a water bath set at 40 °C. The samples were conditioned for 72 h in the presence of theVCI mixture. Then electrolyte was added to generate a humid environment and the test continued for a further72 h. The corrosion rate was estimated from mass loss measurements.

23
The present 1-octanoic acid-based VCI model compounds were all corrosive towards
galvanized steel. All samples showed an increased in mass and featured a white staining after
exposure. Therefore, only the corrosion test results for mild steel and copper are presented in
Fig. 13. None of the mixtures were particularly effective with respect to copper protection.
All samples caused green staining of the copper surface. Surprisingly the staining was only
slight for the 1:1 1-hexylamine + 1-octanoic acid mixture even though the inhibition
performance was poor.
The morpholine + 1-octanoic acid and the TEA + 1-octanoic acid mixtures, both with
zA = 0.50, featured the best inhibitor efficiencies for mild steel at ca. 91% (with no staining)
and ca. 82% (with slight black staining) respectively. This is in approximate agreement with
the findings of a previous study [9]. The 1-hexylamine + 1-octanoic acid mixture with zA =
0.50 did not perform as well. In this case the inhibitor efficiency was only about 68%
although the metal surface did not show any staining.
In all three systems a significant drop in inhibitor efficiency (with respect to mild
steel) was observed when the amine concentration in the VCI mixture was reduced to zA =
0.25. These samples also showed black staining of the metal surface although it was only
slight for the 1:3 1-hexylamine + 1-octanoic acid system. The implication is that the vapours
released in the long term from an amine-carboxylic acid-based VCI reservoir may not offer
the same level of protection than the vapours released during the initial stage.
4. Discussion
VCIs are often present in either a paper sheet or a plastic film and must reach the
metal surface by crossing a layer of air. If the air is stagnant, the release rate of a pure volatile
24
compound is determined by its gas permeability (SC) [38]. This parameter is the product of
the vapour pressure of the compound and its diffusion coefficient in air, i.e. SC = PCDAC (Pa
m2 s-1). The former is a measure of the concentration of the compound while the latter is an
indication of the mobility of the inhibitor molecules in the gas phase. This gas permeability
can be estimated by simple isothermal or dynamic scanning TGA experiments. In essence the
technique is based on the quantification of the vaporization mass loss rate from a partially
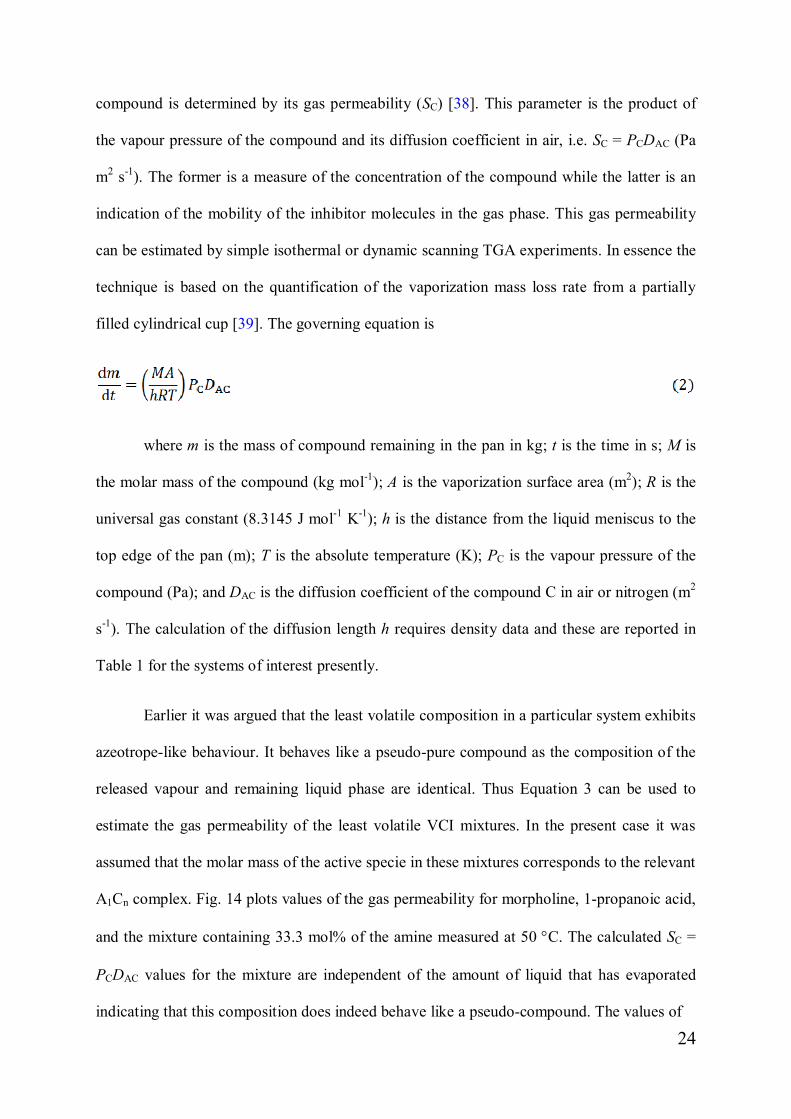
filled cylindrical cup [39]. The governing equation is
where m is the mass of compound remaining in the pan in kg; t is the time in s; M is
the molar mass of the compound (kg mol-1); A is the vaporization surface area (m2); R is the
universal gas constant (8.3145 J mol-1 K-1); h is the distance from the liquid meniscus to the
top edge of the pan (m); T is the absolute temperature (K); PC is the vapour pressure of the
compound (Pa); and DAC is the diffusion coefficient of the compound C in air or nitrogen (m2
s-1). The calculation of the diffusion length h requires density data and these are reported in
Table 1 for the systems of interest presently.
Earlier it was argued that the least volatile composition in a particular system exhibits
azeotrope-like behaviour. It behaves like a pseudo-pure compound as the composition of the
released vapour and remaining liquid phase are identical. Thus Equation 3 can be used to
estimate the gas permeability of the least volatile VCI mixtures. In the present case it was
assumed that the molar mass of the active specie in these mixtures corresponds to the relevant
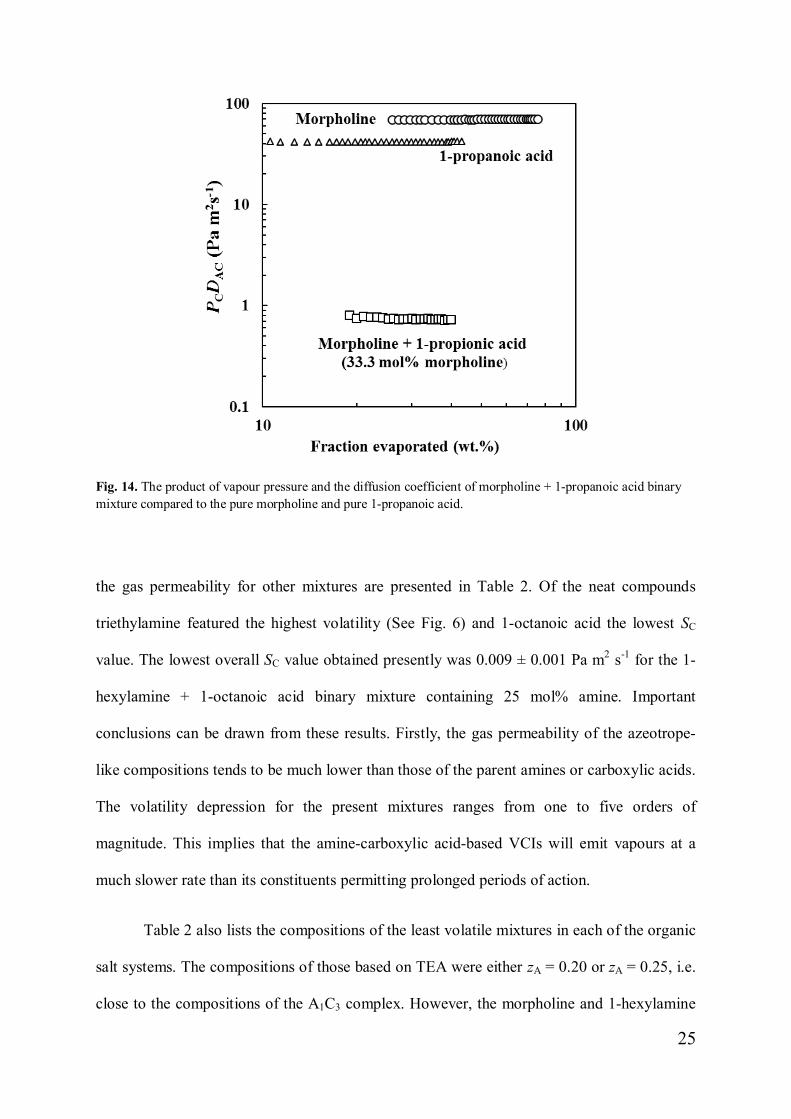
A1Cn complex. Fig. 14 plots values of the gas permeability for morpholine, 1-propanoic acid,
and the mixture containing 33.3 mol% of the amine measured at 50 °C. The calculated SC =
PCDAC values for the mixture are independent of the amount of liquid that has evaporated
indicating that this composition does indeed behave like a pseudo-compound. The values of
25
Fig. 14. The product of vapour pressure and the diffusion coefficient of morpholine + 1-propanoic acid binarymixture compared to the pure morpholine and pure 1-propanoic acid.
the gas permeability for other mixtures are presented in Table 2. Of the neat compounds
triethylamine featured the highest volatility (See Fig. 6) and 1-octanoic acid the lowest SC
value. The lowest overall SC value obtained presently was 0.009 ± 0.001 Pa m2 s-1 for the 1-
hexylamine + 1-octanoic acid binary mixture containing 25 mol% amine. Important
conclusions can be drawn from these results. Firstly, the gas permeability of the azeotrope-
like compositions tends to be much lower than those of the parent amines or carboxylic acids.
The volatility depression for the present mixtures ranges from one to five orders of
magnitude. This implies that the amine-carboxylic acid-based VCIs will emit vapours at a
much slower rate than its constituents permitting prolonged periods of action.
Table 2 also lists the compositions of the least volatile mixtures in each of the organic
salt systems. The compositions of those based on TEA were either zA = 0.20 or zA = 0.25, i.e.
close to the compositions of the A1C3 complex. However, the morpholine and 1-hexylamine

26
mixtures with acetic acid were least volatile when zA = 0.50, i.e. at a composition
corresponding to the A1C1 complex. This was expected as this complex is favoured with
these amines in combination with any of the acids tested presently as indicated by the FTIR,
DSC and refractive index data. However, the composition of the least volatile mixture
decreased with increasing carbon number of the carboxylic acid. For 1-propanoic acid it
corresponded to zA = 0.33 and for 1-hexanoic and 1-octanoic acid it corresponded to zA =
0.25. This trend can be rationalized as follows. Andreev and Ibatullin [40] argued that salts of
this type vaporize via a dissociative mechanism. In other words one must consider the salt
formation as a dynamic equilibrium where the neutral amine and acid react to form the salt.
So at any instant there will be free amine and carboxylic acid molecules present in the liquid.
The relative volatility of the acid to the amine decreases in the series acetic, 1-propanoic, 1-
hexanoic and 1-octanoic acids. Thus the amine will increasingly be lost by volatilization in
preference to the acid molecules. In addition the remaining acid monomers will decrease their
volatility by forming dimers and, in addition, by these dimers possibly associating with ion
pairs to form A2C2 complexes. The implication is that, if steady state volatilization at a
composition commensurate to the A2C2 complex is desired, the amine should be chosen
carefully such that its volatility is adapted to that of the acid.
The application of Equation 3 to the systems tested here in the VCI test apparatus
showed that the 72 h film forming period was sufficient to vaporize most of the VCI dosed in
the present Skinner corrosion tests. The 1:3 mixture of 1-hexylamine + 1-octanoic acid was
the least volatile system considered in this study. Calculations based on the gas permeability
of this composition, and considering the dimensions of the vials used for the VCI liquids,
show that about 2.5 h at 50 °C would be sufficient to vaporize 250 mg from the vial in the
Skinner setup provided it formed a uniform liquid layer at the bottom of the vial and provided
the air above the vial contained no VCI component. Although the corrosion test was only

27
conducted at 40 °C, it is unlikely that the vaporization rate would be much slower than a
factor of two. This was confirmed experimentally by the complete mass loss observed for the
vials kept for 72 h in the convection oven set at 40 °C. When the VCI mixture is allowed to
vaporise inside the test jar, the rate of vaporization will decrease over time as the air in the jar
above the vial becomes saturated with VCI components. However, after the 72 h film
forming period only minor amounts of the VCI mixtures were still present in the vials that
were placed inside the test jars. This amount varied from as little as 4.4% for the 1:3 1-
hexylamine + 1-octanoic acid mixture to as much as 18% for the 1:1 morpholine + 1-octanoic
acid mixture. Nevertheless, these results do confirm that, for the VCI mixtures tested
presently, most of the active had indeed evaporated during the film forming period of the
corrosion test.
The inhibitor performance reported in the literature pertains to that of equimolar
mixtures [3,9]. The present corrosion tests confirmed the previous finding that the 1:1
mixtures containing triethylamine + 1-octanoic acid and morpholine + 1-octanoic acid [9].
However, the present TGA-FTIR results indicated that these equimolar mixtures release
mostly free amine only during the initial stages of evaporation. Furthermore, it was found that
the 72 h film forming period allowed for in the Skinner test was sufficient to allow
vaporization of most of the inhibitor mixtures considered presently. While the equimolar
mixtures performed reasonably well as VCIs for mild steel in the Skinner test, the inhibitor
efficiencies of the 1:3 amine-carboxylic acid mixtures were significantly worse. Since the
major part of the inhibitors vaporized in these tests, the explanation might be found in the
excess acid present imparting an adverse pH, outside the passivation range, in the moisture
film on the metal surface. To test this hypothesis, the pH of 5 wt.% solutions in deionized
water was determined. The results are presented in Table 3. It confirms that the 1:3 amine +
28
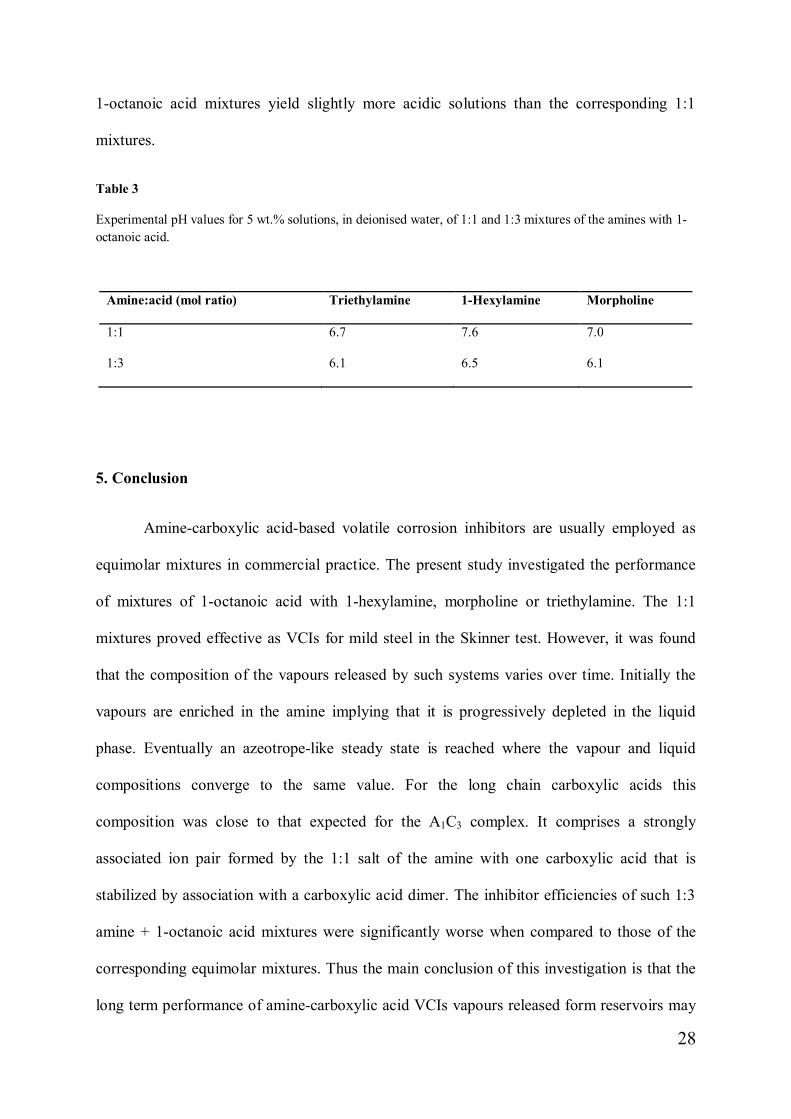
1-octanoic acid mixtures yield slightly more acidic solutions than the corresponding 1:1
mixtures.
Table 3
Experimental pH values for 5 wt.% solutions, in deionised water, of 1:1 and 1:3 mixtures of the amines with 1-octanoic acid.
Amine:acid (mol ratio) Triethylamine 1-Hexylamine Morpholine
1:1 6.7 7.6 7.0
1:3 6.1 6.5 6.1
5. Conclusion
Amine-carboxylic acid-based volatile corrosion inhibitors are usually employed as
equimolar mixtures in commercial practice. The present study investigated the performance
of mixtures of 1-octanoic acid with 1-hexylamine, morpholine or triethylamine. The 1:1
mixtures proved effective as VCIs for mild steel in the Skinner test. However, it was found
that the composition of the vapours released by such systems varies over time. Initially the
vapours are enriched in the amine implying that it is progressively depleted in the liquid
phase. Eventually an azeotrope-like steady state is reached where the vapour and liquid
compositions converge to the same value. For the long chain carboxylic acids this
composition was close to that expected for the A1C3 complex. It comprises a strongly
associated ion pair formed by the 1:1 salt of the amine with one carboxylic acid that is
stabilized by association with a carboxylic acid dimer. The inhibitor efficiencies of such 1:3
amine + 1-octanoic acid mixtures were significantly worse when compared to those of the
corresponding equimolar mixtures. Thus the main conclusion of this investigation is that the
long term performance of amine-carboxylic acid VCIs vapours released form reservoirs may
29
not accord with the results obtained by short term inhibitor performance tests. The present
observations also suggest that future formulations of amine-carboxylic acid systems should
pay closer attention to matching the volatilities of the constituent amines and carboxylic
acids.
Acknowledgements
Financial support for this research, from the National Metrology Institute of South
Africa (NMISA), the Institutional Research Development Programme (IRDP) of the National
Research Foundation of South Africa and Xyris Technology CC is gratefully acknowledged.
References
[1] V.S. Sastri, Corrosion Inhibitors: Principles and Applications, Wiley, New York, 1998.
[2] D.M. Bastidas, E. Cano, E.M. Mora, Volatile corrosion inhibitors: a review, Anti-Corros.
Methods Mater. 52 (2005) 71-77.
[3] W. Skinner, A new method for quantitative evaluation of volatile corrosion inhibitors,
Corros. Sci. 35 (1993) 1494-1501.
[4] E. Vuorinen, E. Kálmán, W.W. Focke, Introduction to vapour phase corrosion inhibitors
in metal packaging, Surf. Eng. 20 (2004) 281-284.
[5] N. N. Andreev, Y. I. Kuznetsov, Physicochemical aspects of the action of volatile metal
corrosion inhibitors, Rus. Chem. Rev. 74 (2005) 685-695.
30
[6] J.E.O. Mayne, C.L. Page, Inhibition of the corrosion of iron by benzoate and acetate ions,
Br. Corros. J. 9 (1974) 223-226.
[7] P. Bommersbach, C. Alemany-Dumont, J.P. Millet, B. Normand, Formation and
behaviour study of an environment-friendly corrosion inhibitor by electrochemical methods,
Electrochim. Acta 51 (2005) 1076–1084.
[8] Z. Ahmad, Principles of Corrosion Engineering and Corrosion Control, Butterworth-
Heinemann, Oxford, 2006.
[9] E. Vuorinen, W. Skinner, Amine carboxylates as vapour phase corrosion inhibitors, Br.
Corros. J. 37 (2002) 159-160.
[10] C. Fiaud, Theory and Practice of Vapour Phase Inhibitors, in Corrosion Inhibitors,
European Federation of Corrosion Publications, No. 11, Institute of Materials, London, 1994,
pp. 1-11.
[11] W. Skinner, F. Du Preez, E. Vuorinen, Evaluation of vapour phase corrosion inhibitors,
Br. Corros. J. 34 (1999) 151-152.
[12] S.C. Byrne, A.C. Miller, Atmospheric Corrosion of Metals, ASTM, STP768, 1982, pp.
359-373.
[13] M.A. Quraishi, D. Jamal, Development and testing of all organic volatile corrosion
inhibitors, Corrosion 58 (2002) 387-391.
[14] E. Cano, D.M. Bastidas, J. Simancas, J.M. Bastisdas, Dicyclohexylamine nitrite as
volatile corrosion inhibitor for steel in polluted environments, Corrosion 61 (2005) 473-479.
31
[15] F. D. Wall, M.A. Martinez, N.A. Missert, R.G. Copeland, A.C. Kilgo, Characterizing
corrosion behaviour under atmospheric conditions using electrochemical techniques. Corros.
Sci. 47 (2005) 17–32.
[16] G. Gao, C.H. Liang, H. Wang, Synthesis of tertiary amines and their inhibitive
performance on carbon steel corrosion. Corros. Sci. 49 (2007) 1833–1846.
[17] J.F. Henriksen, The distribution of a volatile corrosion inhibitor (CHC) on corroded Fe,
Corros. Sci. 12 (1972) 433-436.
[18] B. Sanyal, Organic compounds as corrosion inhibitors in different environments-A
review, Prog. Org. Coat. 9 (1981) 165-236.
[19] A. Subramanian, R.R. Kumar, M. Natesan, T. Vasudevan, The performance of VPI-
coated paper for temporary corrosion prevention of metals, Anti-Corros. Methods Mater. 49
(2002) 354-363.
[20] U. Rammelt, S. Koehler, G. Reinhard, Use of vapour phase corrosion inhibitors in
packages for protecting mild steel against corrosion, Corros. Sci. 51 (2009) 921-925.
[21] N.N. Andreev, O.A. Goncharova, On the effect of OH- ions on the inhibition of steel
corrosion with amines, Prot. Met. 40 (2004) 280-287.
[22] H. Kondo, Protic ionic liquids with ammonium salts as lubricants for magnetic thin film
media, Tribol. Lett. 31 (2008) 211-218.
[23] B.M. Bradan, A.A. Abdel Fattah, A.A. Abdul, New corrosion inhibitors based on fatty
materials-II. Epoxidized fatty materials modified with aromatic amines, Corros. Sci. 22
(1982) 525-536.

32
[24] Curtiss, L.A.; Blander, M.; Thermodynamic properties of gas-phase hydrogen-bonded
complexes. Chem. Rev. 88 (1988) 827-841.
[25] F. Kohler, E. Liebermann, G. Miksch, C. Kainz, On the thermodynamics of the acetic
acid-triethylamine system, J. Phys. Chem. 76 (1972) 2764-2768.
[26] F. Kohler, P. Hyskens, Some aspects of the structure and interaction potential of
hydrogen bonded complexes, Adv. Mol. Rel. Proc. 8 (1976) 125-154.
[29] M. Wierzejewsha-Hzat, Z. Mielke, H. Ratajczak, Infrared studies of complexes between
carboxylic acids and tertiary amines in argon matrices, J. Chem. Soc. Faraday T 2 76 (1980)
834-843.
[30] F. Kohler, H. Atrops, H. Kalal, E. Liebermann, E. Wilhelm, F. Ratkovics, T. Salamon,
Molecular interactions in mixtures of carboxylic acids with amines. 1. Melting curves and
viscosities, J. Phys. Chem. 85 (1981) 2520-2524.
[31] F. Kohler, R. Gopal, G. Gõtze, H. Atrops, M.A. Demiriz,; E. Liebermann,; E. Wilhelm,
F. Ratkovics, B. Palagyl, Molecular interactions in mixtures of carboxylic acids with amines.
2. Volumetric, conductimetric, and NMR properties, J. Phys. Chem. 85 (1981) 2524-2549.
[32] S.E. Friberg, W.M. Sun, Y. Yang, A.J.I. Ward, Molecular interactions in nonaqueous
cationic system, J. Colloid Interface Sci. 11 (1990) 503-517.
[33] S. Karlsson, J. Päivärinta, R. Friman, A. Poso, M. Hotokka, S. Backlund,
Characterization of the phase behaviour and complexation in heptanoic acid-heptylamime-
water system, J. Phys. Chem. B 105 (2001) 7944-7949.
[34] S. Karlsson, S. Backlund, R. Friman, Complexation in the heptanoic acid-heptylamine
system, Colloid Polym. Sci. 278 (2000) 8-14.

33
[35] N.S. Nhlapo, W.W. Focke and E. Vuorinen, TGA-FTIR study of the vapours released
by triethylamine-acetic acid mixtures. Thermochim. Acta, 546 (2012) 113–119.
[36] J. Coates, Interpretation of Infrared Spectra, a Practical Approach, in R.A. Meyers (Ed.),
Encyclopedia of Analytical Chemistry, John Wiley & Sons Ltd, Chichester. 2000, pp.
10815-10837.
[37] J. Päivärinta, S. Karlsson, A. Poso, M. Hotokka, Calculated molecular properties for
different alkanoic acid-alkylamine complexes: A comparison with measured FTIR and
Raman spectra, Chem. Phys. 263 (2001) 127-138.
[38] N. Pieterse, W. W. Focke, E. Vuorinen, I. Rácz, Estimating the gas permeability of
commercial volatile corrosion inhibitors at elevated temperatures with thermo-gravimetry.
Corros. Sci. 48 (2006) 1986-1995.
[39] N. Pieterse, W.W. Focke, Diffusion controlled evaporation through a stagnant gas:
estimating low vapour pressures from thermogravimetric data. Thermochim. Acta 406 (2003)
191-198.
[40] N. N. Andreev and K. A. Ibatullin, On the prediction of the vapor’s pressure of salt-type
volatile inhibitors, Prot. Met. 38 (2002) 13–16.