Embed Size (px)
Citation preview

Theory of Edge Detection
D Marr E Hildreth
Proceedings of the Royal Society of London Series B Biological Sciences Vol 207 No 1167(Feb 29 1980) pp 187-217
Stable URL
httplinksjstororgsicisici=0080-46492819800229292073A11673C1873ATOED3E20CO3B2-0
Proceedings of the Royal Society of London Series B Biological Sciences is currently published by The Royal Society
Your use of the JSTOR archive indicates your acceptance of JSTORs Terms and Conditions of Use available athttpwwwjstororgabouttermshtml JSTORs Terms and Conditions of Use provides in part that unless you have obtainedprior permission you may not download an entire issue of a journal or multiple copies of articles and you may use content inthe JSTOR archive only for your personal non-commercial use
Please contact the publisher regarding any further use of this work Publisher contact information may be obtained athttpwwwjstororgjournalsrslhtml
Each copy of any part of a JSTOR transmission must contain the same copyright notice that appears on the screen or printedpage of such transmission
The JSTOR Archive is a trusted digital repository providing for long-term preservation and access to leading academicjournals and scholarly literature from around the world The Archive is supported by libraries scholarly societies publishersand foundations It is an initiative of JSTOR a not-for-profit organization with a mission to help the scholarly community takeadvantage of advances in technology For more information regarding JSTOR please contact supportjstororg
httpwwwjstororgWed Jan 30 112106 2008
Proc R Boc Lond B 207 187-217 (1980)
Printed in Great Britain
Theory of edge detection
B Y D MARR A N D E HILDRETH
MIT Psychology Department and Artijcial Intelligence Laboratory 79 Amherst Street Cambridge Massachusetts 02139 USA
(Communicated by S Brenner FRS -Received 22 February 1979)
A theory of edge detection is presented The analysis proceeds in two parts (1)Intensity changes which occur in a natural image over a wide range of scales are detected separately at different scales An appropriate filter for this purpose a t a given scale is found to be the second derivative of a Gaussian and it is shown that provided some simple conditions are satisfied these primary filters need not be orientation-dependent Thus intensity changes a t a given scale are best detected by finding the zero values of V2G(x y) I(x y) for image I where G(x y) is a two-dimen- sional Gaussian distribution and V2 is the Laplacian The intensity changes thus discovered in each of the channels are then represented by oriented primitives called zero-crossing segments and evidence is given that this representation is complete (2) Intensity changes in images arise from surface discontinuities or from reflectance or illumination bound- aries and these all have the property that they are spatially localized Because of this the zero-crossing segments from the different channels are not independent and rules are deduced for combining them into a description of the image This description is called the raw primal sketch The theory explains several basic psychophysical findings and the opera- tion of forming oriented zero-crossing segments from the output of centre-surround V2G filters acting on the image forms the basis for a physiological model of simple cells (see Marr amp Ullman 1979)
The experiments of Hubel amp TNiesel (1962) and of Campbell amp Robson (1968) introduced two rather distinct notions of the function of early information pro- cessing in higher visual systems Hubel amp Wiesels description of simple cells as linear with bar- or edge-shaped receptive fields led to a view of the cortex as containing a population of feature detectors (Barlow 1969 p 881) tuned to edges and bars of various widths and orientations Campbell amp Robsons ex-periments showing that visual information is processed in parallel by a number of independent orientation and spatial-frequency-tuned channels suggested a rather different view which in its extreme form would describe the visual cortex as a kind of spatial Fourier analyser (Pollen et al 1971 Maffei amp Fiorentini
1977) 1 187 I
188 D Marr and E Hildreth
Protagonists of each of these views are able to make substantial criticisms of the other The main points against a Fourier interpretation are (1) The bandwidth of the channels is not narrow (16 octaves Wilson amp Bergen 1979) The corres- ponding receptive fields have a definite spatial localization (2) As Campbell amp Robson found early visual information processing is not linear (eg probability summation (Graham 1977 Wilson amp Giese 1977) and failure of superposition (Maffeiamp Fiorentini 1972 a)) (3) Only rudimentary phase information is apparently encoded (Atkinson amp Campbell 1974)
The main point against the linear feature-detector idea is that if a simple cell truly signals either the positive or the negative part of the linear convolution of its bar-shaped receptive field with the image intensity i t can hardly be thought of as making some symbolic assertion about the presence of a bar in the image (Marr 1976~3 p 648) Such a cell would necessarily respond to many stimuli other than a bar more vigorously for example to a bright edge than to a dim bar and thus would not be specific enough in its response to warrant being called a feature detector
Perhaps the greatest difficulty faced by both camps is that neither approach can give direct information about the goals of the early analysis of an image This motivated a new approach to vision which enquired directly about the informa- tion processing problems inherent in the task of vision itself (Marr 1 9 7 6 ~ ) b and see Marr 1978 for the overall scheme) According to this scheme the purpose of early visual processing is to construct a primitive but rich description of the image that is to be used to determine the reflectance and illumination of the visible surfaces and their orientation and distance relative to the viewer The first primitive description of the image was called the primal sketch (Marr 1976b) and i t is formed in two parts First a description is constructed of the intensity changes in an image using a primitive language of edge-segments bars blobs and termina- tions This description was called the raw primal sketch (Marr 19768 P 497) Secondly geometrical relations are made explicit (using virtual lines) and larger more abstract tokens are constructed by selecting grouping and summarizing the raw primitives in various ways The resulting hierarchy of descriptions covers a range of scales and is called the full primal sketch of an image
Although the primal sketch was inspired by findings about mammalian visual systems we were until recently unable to make it the basis of a detailed theory of human early vision Three developments have made this possible now (a) the emergence of quantitative information about the channels present in early human vision (Cowan 1977 Graham 1977 Wilson amp Giese 1977 Wilson amp Bergen 1979) (b) Marr amp Poggios (1979) theory of human vision (especially the framework within which it was written) and (c) the related observations of Marr et al (1979) about the relevance of a result like Logans (1977) theorem to early vision
These advances have made possible the formulation of a satisfactory computa- tional theory This article deals with the first part the derivation of the raw primal sketch The theory itself is given in two sections the first dealing with the
189 The raw primal sketch
analysis within each channel and the second with combining information from different channels Each computational section discusses algorithms for imple- menting the theory and gives examples
The second half of the article examines the implications for biology The behaviour of the algorithms is shown to account for a range of basic psychophy- sical findings and a specific neural implementation is presented Our model is not intended as a complete proposal for a physiological mechanism because i t ignores the attribute of directional selectivity that so pervades cortical simple cells The model does however make explicit certain nonlinear features that we regard as critical and i t forms the starting point for the more complete proposal of Marr amp Ullman (1979) which incorporates directional selectivity
DETECTINGA N D R E P R E S E N T I N G I N T E N S I T Y C H A N G E S I N A N I M A G E
A major difficulty with natural images is that changes can and do occur over a wide range of scales (Marr 1976a b) No single filter can be optimal simulta- neously a t all scales so i t follows that one should seek a way of dealing separately with the changes occurring a t different scales This requirement together with the findings of Campbell amp Robson (1968) leads to the basic idea illustrated in figure 1 in which one first takes local averages of the image a t various resolutions and then detects the changes in intensity that occur a t each one To realize this idea we need to determine (a) the nature of the optimal smoothing filter and (b) how to detect intensity changes a t a given scale
The optimal smoothing filter
There are two physical considerations that combine to determine the appro- priate smoothing filter The first is that the motivation for filtering the image is to reduce the range of scales over which intensity changes take place The filters spectrum slzould therefore be smooth androughly band-limited in the frequency domain We may express this condition by requiring that its variance there Aw should be small
The second consideration is best expressed as a constraint in the spatial domain and we call i t the constraint of spatial localization The things in the world that give rise to intensity changes in the image are (1) illumination changes which include shadows visible light sources and illumination gradients (2) changes in the orientation or distance from the viewer of the visible surfaces and (3) changes in surface reflectance The critical observation here is that a t their own scale these things can all be thought of as spatially localized Apart from the occasional diffraction pattern the visual world is not constructed of ripply wave-like primi- tives that extend and add together over an area (cf Marr 1970 p 169) but of contours creases scratches marks shadows and shading
The consequence for us of this constraint is that the contributions to each
D Marr and E Hildreth
FIGURE1A local-average filtered image I n the original image (a)intensity changes can take place over a wide range of scales and no single operator will be very efficient a t detecting a11 of them The problem is much simplified in a Gaussian band-limited filtered image because there is effectively an upper limit to the rate a t which changes can take place The first part of our scheme can be thought of as decomposing the original image into a set of copies each filtered like this and detecting the intensity changes separately in each I n (b ) the image is filtered with a Gaussian having cr = 8 picture elements and in (c) a = 4 The image is 320 x 320 picture elements
191 The raw primal sketch
point in the filtered image should arise from a smooth average of nearby points rather than any kind of average of widely scattered points Hence the filter that we seek should also be smooth and localized in the spatial domain and in particular its spatial variance Ax should also be small
FIGURE2 The operators G (equation 5) and V2G (a)shows G the second derivative of the one-dimensional Gaussian distribution (c) shows V2G its rotationally synlmetric two- dimensional counterpart (b) and (d) exhibit their Fourier transforms
Unfortunately these two localization requirements the one in the spatial and the other in the frequency domain are conflicting They are in fact related by the uncertainty principle which states that Ax Aw gt an (see for example Bracewell 1965 pp 160-163) There is moreover only one distribution that optimizes this relation (Leipnik 1960) namely the Gaussian
G ( x )= [la(2n)amp]exp (-x22a2) with Fourier transform (1)
Q(w) = exp ( -+a2u2) (2)
In two dimensions G(r) = (ampna2)exp ( -r22a2)
192 D Marr and E Hildreth
The filter G thus provides the optimal trade-off between our conflicting require- ments
Detecting intensity changes
Wherever an intensity change occurs there will be a corresponding peak in the first directional derivative or equivalently a zero-crossing in the second direc- tional derivative of intensity (Marr 19768 Marr amp Poggio 1979) In fact we may define an intensity change in this way so that the task of detecting these changes
FIGURE3 Spatial and directional factors interact in the definition of a zero-crossing segment (a )shows an intensity change and (b) (c) and ( d )show values of the second directional derivative near the origin a t various orientations across the change In (b) the derivative is taken parallel to the a-axis and in (c) and (d)a t 30 and 60 to it There is a zero- crossing a t every orientation except for a21i3y2 which is identically zero Since the zero- crossings line up along the y-axis this is the direction that is chosen In this example it is also the direction that maximizes the slope of the second derivative
can be reduced to that of finding the zero-crossings of the second derivative D2 of intensity in the appropriate direction That is to say we seek the zero-crossings in
f (x Y ) = D2[G(r)I(xy)l (3)
where I (x y) is the image and is the convolution operator By the derivative rule for convolutions
f (s y) = D2G I(x y) (4)
We can write the operator D2G as Go and in one dimension
G(x) = (1-x2cr2)exp ( -x22cr2)[- 1~9(27~)4]
The raw primal sketch 193
fJ1(x) looks like a Mexican hat operator (see figure 2)) it closely resembles Wilson 5 Gieses (1977) difference of two Gaussians (DOG)and it is in fact the limit of the DOG function as the sizes of the two Gaussians tend to one another (see figure 11 and appendix B) It is an approximately bandpass operator with a half-power bandwidth of about 12 octaves and so it can be thought of as looking a t the information contained in one particular part of the spectrum of the image
These arguments establish that intensity changes a t one scale may in principle be detected by convolving the image with the operator D2C and looking for zero-crossings in its output Only one issue is still unresolved and i t concerns the orientation associated with D2 It is not enough to choose zero-crossings of the second derivative in any direction To understand this imagine a uniform intensity change running down the y-axis as shown in figure 3 At the origin the second directional derivative is zero in every direction but it is non-zero nearby in every direction except along the y-axis
I n which direction should the derivative be taken
To choose which directional derivative to use we observe that the underlying motivation for detecting changes in intensity is that they will correspond to useful properties of the physical world like changes in reflectance illumination surface orientation or distance from the viewer Such properties are spatially continuous and can almost everywhere be associated with a direction that projects to an orientation in the image The orientation of the directional derivative that we choose to use is therefore that which coincides with the orientation formed locally by its zero-crossings I n figure 3 this orientation is the y-axis and so the directional derivative we would choose there is a21i3x2
Under what conditions does this direction coincide with that in which the zero- crossing has maximum slope The answer to this is given by theorem 1 (see appendix A) and we call it the condition of linear variation
the intensity variation near and parallel to the line of zero-crossings should locally be linear
This condition will be approximately true in smoothed images and in the rest of this article we shall assume that the condition of linear variation holds
This direction can be found by means of the Laplacian
There are three main steps in the detection of zero-crossings They are (1) a convolution with D2G where 0 2 stands for a second directional derivative opera- tor (2) the localization of zero-crossings and (3) checking of the alignment and orientation of a local segment of zero-crossings Although i t is possible to imple- ment this scheme directly (Marr r976b p 494) one immediate question that can be asked is are directional derivatives of critical importance here Convolutions are relatively expensive and it would much lessen the computational burden if
7 VO~207 B
194 D Marr and E Hildreth
their number could be reduced for example by using just one orientation-independent operator
The only orientation-independent second-order differential operator is the Laplacian V2 and theorem 2 (see appendix A) makes explicit the conditions under which i t can be used They are weaker than the condition of linear variation which we met in theorem 1 and they state that provided the intensity variation in (G I)is linear along but not necessarily near to a line of zero-crossings then the zero-crossings will be detected and accurately located by the zero values of the Laplacian Again because in our application the condition of linear variation is approximately satisfied so will be this condition It follows that the detection of intensity changes can be based on the filter V2G illustrated in figure 2 It is however worth remembering that in principle if intensity varies along a segment in a very non-linear way the Laplacian and hence the operator V2G will see the zero-crossing displaced to one side
Summary of the argument
The main steps in the argument so far are therefore these (1) To limit the rate a t which intensities can change we first convolve the
image I with a two-dimensional Gaussian operator G (2) Intensity changes in G I are then characterized by the zero-crossings in
the second directional derivative D2(G I ) This operator is roughly bandpass and so i t examines only a portion of the spectrum of the image
( 3 ) The orientation of the directional derivative should be chosen to coincide with the local orientation of the underlying line of zero-crossings
(4) Provided that the condition of linear variation holds this orientation is also the one at which the zero-crossing has maximum slope (measured perpendicular to the orientation of the zero-crossing)
( 5 ) By theorem 1of appendix A if the condition of linear variation holds the lines of zero-crossings defined by (3) are precisely the zero-crossings of the orient- ation-independent differential operator the Laplacian V2
(6) The loci of zero-crossings defined by (3) may therefore be detected eco- nomically in the image a t each given scale by searching for the zero values of the convolution V2G II n two dimensions
V2G(r) = - lng4[1-r22a2] exp ( -r22a2)
We turn now to the question of how to represent the intensity changes thus detected
Representing the intensity changes
I n a band-limited image changes take place smoothly so i t is always possible to divide a line of zero-crossings into small segments each of which approximately obeys the condition of linear variation This fact allows us to make thefollowingdefinitions
195 The raw primal sketch
(1) A zero-crossing segment in a Gaussian filtered image consists of a linear segment 1 of zero-crossings in the second directional derivative operator whose direction lies perpendicular to I
(2) We can also define an amplitude v associated with a zero-crossing segment as the slope of the directional derivative taken perpendicular to the segment To see why this is an appropriate measure observe that a narrow bandpass channel near a zero-crossing a t the origin can be described approximately by v sin wx which has slope uw at the origin Hence if s is the measured slope of the zero- crossing v = s ~ The factor l w is a space constant and scales linearly with the sampling interval required
The set of zero-crossing segments together with their amplitudes constitutes a primitive symbolic representation of the changes taking place within one region of the spectrum of an image Pull coverage of the spectrum can now be had simply by applying the analysis over a sufficient number of channels simultaneously
Pinally there are grounds for believing that this representation of the image is complete Marr et al (1979) noted that Logans (1977) recent theorem about the zero-crossings of one-octave bandpass signals shows that the set of such zero- crossing segments is extremely rich in information If the filters had bandwidth of an octave or less they would in fact contain complete information about the filtered image I n practice the V2G filter has a half-sensitivity bandwidth of about 175 octaves which puts i t outside the range in which Logans theorem applies On the other hand if we add information about the slopes of the zero- crossings the situation may be more congenial In the standard sampling theorem if the first derivative as well as the value is given the sampling density can be halved (see for example Bracewell 1978 pp 198-200) I t seems likely than an analogous extension holds for Logans (1977) theorem If this were true the zero- crossing segments whose underlying motivation is physical would in fact provide a sufficient basis for the recovery of arbitrary intensity profiles
I n summary then we have shown how intensity changes a t one scale may be detected by means of the V2G operator and that they may be represented probably completely by oriented zero-crossing segments and their amplitudes To detect changes a t all scales i t is necessary only to add other channels like the one described above and to carry out the same computation in each These representations are precursors of the descriptive primitives in the raw primal sketch and mark the transition from the analytic to the symbolic analysis of an image The remaining step is to combine the zero-crossings from the different channels into primitive edge elements and this task is addressed later in the article
Examples and comments
Figure 4 sho~vssome examples of zero-crossings The top row shows images and the second shows their convolutions with the operator V2G exhibited in figure 2 Zero is represented here by an intermediate grey so that very positive values
7-2
196 D Marr and E Hildreth
The raw primal sketch
198 D Marr and E Hildreth (a) ( b )
FIGURE5 Comparison of the performance of V2G with that of similar filters Column (a ) shows an image its convolution with V2G and the resulting signed zero-crossings Column (b) contains the same sequence but for the pure one-octave bandpass filter shown with its Fourier transform a t the top of the column The zero-crossing array contains echoes of the strong edges in the image Columns (c) and ((1) exhibit the same
----
The raw primal sketch ( d )
lt (J$6(JJ(-(-- 1- $yd 9 amp
L)(
I) --d
~j
I
_ -1
------7I)-J ----ltc-L_
6$lt -- ----i y ----c-
---1
kf-0-----ltI
1 x ----- I- -I
-lt2----gt_I ----- I t
-gt -
-- ---2
-7tlt--
gt (- s
gt -- analysis of another image except that here V2G is compared with a square-wave approximation to the second derivative The widths of the central excitatory regions of the filters are the same for each comparison pair being 12 for (a )and ( b ) and 18 for (c) and (d) The square-wave filter sees relatively few zero-crossings
200 D Marr and E Hildreth
appear white and very negative ones black I n the third row all positive values appear completely white and all negative ones are black and the fourth row shows just the loci of zero values It will be observed that these delineate well the visible edges in the images (See the legend for more details) It remains only to break the zero value loci into oriented line segments
It is interesting to compare the zero-crossings found by means of V2G with those found by means of similar operators that according to our arguments are not optimal Our choice of the Gaussian filter was based on the requirements of simul- taneous localization in the frequency and spatial domains We therefore show examples in which each of these requirements is severely violated An ideal one- octave bandpass filter satisfies the localization requirement in the frequency domain but violates it in the spatial domain The reason is that strict band- limiting gives rise to sidelobes in the spatial filter and the consequence of these is that in the zero-crossing image strong intensity changes give rise to echoes as well as to the directly corresponding zero-crossings (see figure 5) These echoes have no direct physical correlate and are therefore undesirable for early visual processing
On the other hand if one cuts off the filter in the spatial domain one acquires sidelobes in the frequency domain Figure 5 also shows a square-wave approxi- mation to the second derivative operator together with an example of the zero- crossings to which i t gives rise This operator sees fewer zero-crossings essentially because i t is averaging out the changes that occur over a wider range of scales
Interestingly Rosenfeld amp Kak (1976 pp 281-4) discuss the Laplacian in relation to edge detection but they do not report its having been used very effectively One reason for this is that i t is not very effective unless i t is used in a band-limited situation and one uses its zero-crossings and these ideas do not appear in the computer vision literature (see for example Rosenfeld amp Kak 1976 fig 10 for how the Laplacian has previously been used) I n fact the idea of using narrow bandpass differential operators did not appear until the human stereo theory of Marr amp Poggio (1979) which was also the first theory to depend primarily on zero-crossings
Another more practical reason why edge-detecting operators have previously been less than optimally successful in computer vision is that most current operators examine only a very small part of the image their receptive fields are of the order of 10 to 20 image points a t most This contrasts sharply with the smallest of Wilsons four psychophysical channels the receptive field of which must cover over 500 foveal cones (see figure 4)
Finally notice that G and hence V2G is approximately a second derivative operator because its Fourier transform is -4n2w2 exp ( -a2w2) which behaves like -w2 near the origin
201 The raw primal sketch
FIGURE6 The image (a)has been convolved with V2G having w = 2rr = 6 12 and 24 pixels These filters span approximately the range of filters that operate in the human fovea I n (b) ( c ) and (d) are shown the zero-crossings thus obtained Notice the h e detail picked up by the smallest This set of figures neatly poses our next problem how does one combine all this information into a single description
COMBININGI N F O R M A T I O N F R O M DIFFERENT CHANNELS
The signals transmitted through channels that do not overlap in the Fourier domain will be generally unrelated unless the underlying signal is constrained The critical question for us here is therefore (and we are indebted to T Poggio for conversations on this point) what additional information needs to be taken into account when we consider how to combine information from the different channels to form a primitive description of the image In other words are there any general physical constraints on the structure of the visual world that allow us to place valid restrictions on the way in which information from the different channels may be combined Figure 6 illustrates the problem that we have to solve
The spatial coincidence assumption
The additional information that we need here comes from the constraint of spatial localization which we defined in the previous section It states that the physical phenomena that give rise to intensity changes in the image are spatially
202 D Marr and E Hildreth
localized Since it is these changes that produce zero-crossings in the filtered images it follows that if a discernible zero-crossing is present in a channel centred on wavelength Ao there should be a corresponding zero-crossing a t the same spatial location in channels for wavelengths A gt A If this ceases to be true a t some wavelength A gt A it will be for one of two reasons either (a) two or more local intensity changes are being averaged together in the larger channel or (b) two independent physical phenomena are operating to produce intensity changes in the same region of the image but a t different scales An example of situation (a) would be a thin bar whose edges will be accurately located by small channels but not by large ones Situations of this kind can be recognized by the presence of two nearby zero-crossings in the smaller channels An example of situation (b) would be a shadow superimposed on a sharp reflectance change and it can be recognized if the zero-crossings in the larger channels are displaced relative to those in the smaller If the shadow has exactly the correct position and orientation the loca- tions of the zero-crossings may not contain enough information to separate the two physical phenomena but in practice this situation will be rare
We can therefore base the parsing of sets of zero-crossing segments from dif- ferent V2G channels on the following assumption which we call the spatial coincidence assumption
If a zero-crossing segment is present in a set of independent V2G channels over a contiguous range of sizes and the segment has the same positioil and orientation in each channel then the set of such zero-crossing segments may may be taken to indicate the presence of an intensity change in the image that is due to a single physical phenomenon (a change in reflectance illumina- tion depth or surface orientation)
I n other words provided that the zero-crossings from independent channels of adjacent sizes coincide they can be taken together If they do not they probably arise from distinct surfaces or physical phenomena It follows that the minimum number of channels required is two and that provided the two channels are reasonably separated in the frequency domain and their zero-crossings agree the combined zero-crossings can be taken to indicate the presence of an edge in the image
The parsing of sets of zero-crossing segments
Figure 6 shows the zero-crossings obtained from two channels whose dimensions are approximately the same as the two sustained channels present a t the fovea in the human visual system (Wilson amp Bergen 1979) We now derive the parsing rules needed for combining zero-crossings from the different channels
Case (1) isolated edges
For an isolated linearly disposed intensity change there is a single zero-crossing present a t the same orientation in all channels above some size that depends upon the channel sensitivity and the spatial extent of the edge This set of zero-
203 The raw primal sketch
crossings may therefore be combined into a symbol that we shall call an edge- segment with the attributes of edge-amplitude and width which we may obtain as follows
Calculation of edge-amplitude Because the assumptions that we have made mean that the type of intensity change involved is a simple one we can in fact use what Marr (1976 figure 1) called the selection criterion according to which one
FIGURE7 Parsing of sets of zero-crossing segments (a) If zero-crossing segments lie close and roughly parallel (as in profile (a) of column 3 above) larger masks cannot be used only the smaller masks There are four possible configurations shown in (1)-(4) and the figure represents the way in which the contrast changes across the edge Each of these cases needs to be detected separately (b) If the bar- or edge-segments are terminated special descriptors are required Doubly terminated bars with I lt 3w are called blobs and the other assertions are labelled terminations These are illustrated here for one contrast sign Termination assertions may mark only a discontinuity in edge orientation but it is often useful later on to have such positions explicitly available
selects the smallest channel to which the intensity change is essentially indis- tinguishable from a step function and uses that channel alone to estimate the contrast by means of the amplitude v derived above If one has just two indepen- dent channels with amplitudes v and v an approximation to the edge amplitude is J(v+vi)
Calculation of width The width of the edge in this case can also be estimated from the channel selected according to the selection criterion For a narrow channel with central wavelength A the physical notion of width corresponds to the distance over which intensity increases This distance is ampA which is approximately w the width of the central excitatory region of the receptive field associated with the most excited channel (in fact h = nw)
Case ( 2 ) bars
If two parallel edges with opposite contrast lie only a small distance d apart in the image zero-crossings from channels with associated wavelength that exceeds about 2d cannot be relied upon to provide accurate information about the positions
D Marr and E Hildreth
FIGURE8 Combination of information from two channels I n (a)and (b) are shoxvn the zero- crossings obtained from one of the images of figure 4 by means of masks with w = 9 and 18 Because there are no zero-crossings in the larger channel that do not correspond to zero-crossings in the smaller channel the locations of the edges in the combined description also correspond to (a) I n (c) (d) and (e) are shown symbolic representations of the descriptors attached to the locations marked in ( a ) (c) shows the blobs (d)the local orientations assigned to the edge segments and (e) the bars These diagrams show only the spatial information contained in the descriptors Typical examples of the full descriptors are as follows
(BLOB (POSITION 146 21) (EDGE (POSITION 104 23) (BAR (POSITION 118 134) (ORIENTATION 105) (ORIENTATION 120) (ORIENTATION 120) (CONTRAST 76) (CONTRAST -25) (CONTRAST -25) (LENGTH 16) (LENGTH 25) (LENGTH 25) (WIDTH 6)) (WIDTH 4)) (WIDW 4))
The descriptors t o which these correspond are marked with arrows The resolution of this analysis of the image of figure 4 roughly corresponds to what a humanwould see when viewing it from a distance of about 6 f t (183rn)
or contrasts of the edges In these circumstances the larger channels must be ignored and the description formed solely from small channels of which the zero- crossing segments do superimpose An edge can have either positive or negative contrast and so two together give us the four situations shown in figure 7 a There is of course no reason why the two edges should have the same contrast and the contrast of each edge must be obtained individually from the smallest channels
205 The raw primal sketch
(w c d) Two other parameters are useful one is the average orientation of the two zero-crossing segments and the other is their average separation
Our case (2) applies only to situations in which neither zero-crossing segment terminates and they both remain approximately parallel (w or less apart) When the two edges are closer together than w for the smallest available channel the zero-crossings associated with even the smallest channel will not accurately reflect the positions of the two edges they will over estimate the distance between them If the two edges have opposite contrasts that are not too different in absolute magnitude the position of the centre of the line segment so formed in the image will be the midpoint of the two corresponding zero-crossings I n these circum- stances the parameters associated with the line segment will be more reliable than those associated with each individual edge
Case (3) blobs and terminations
It frequently happens that the zero-crossing segments do not continue very far across the image Two parallel segments can merge or be joined by a third seg- ment and in textured images they often form small closed curves (see figure 6) which are quite small compared to the underlying field size Both situations can give rise to anomalous effects a t larger channel sizes and so are best made explicit early on Following Marr (1976b) the closed contours we call BLOBS and assign to them a length width orientation and (average) contrast and the terminations are assigned a position and orientation (see figure 7c)
Remarks
Two interesting practical details have emerged from our implementation First the intensity changes a t each edge of a bar are in practice rarely the same so i t is perhaps more proper to think of the BAR descriptor as a primitive grouping predicate that combines two edges the contrasts of which are specified precisely by the smallest channel Brightness within the area of the bar will of course be constant Secondly i t is often the case that the zero-crossings from the small and from the large masks roughly coincide but those from the small mask weave around much more partly because of the image structure and partly because of noise and the image tesselation Local orientation has little meaning over dis- tances shorter than the width w of the central excitatory region of the V2G filter so if the zero-crossings from the smaller filter are changing direction rapidly locally the orientation derived from the larger mask can provide a more stable and more reliable measure
We have presented specific algorithms for the construction of the raw primal sketch and we now ask whether the human visual system implements these algorithms or something close to them There are two empirically accessible
206 D Marr and E Hildreth
characteristics of our scheme The first concerns the underlying convolutions and zero-crossing segments and the second whether zero-crossing segments from the different channels are combined in the way that we have described
Detection of zero-crossing segments
According to our theory the most economical way of detecting zero-crossing segments requires that the image first be filtered through a t least two independent V2G channels and that the zero-crossings then be found in the filtered outputs These zero-crossings may be divided into short oriented zero-crossing segments
The empirical data
Recent psychophysical work by Wilson amp Giese (1977) FVilson amp Bergen (1979) (see also Macleod amp Rosenfeld 1974) has led to a precise quantitative model of the orientation-dependent spatial-frequency-tuned channels discovered by Campbell amp Robson (1968) At each point in the visual field there are four such channels spanning about three octaves and their peak sensitivity wavelength increases linearly with retinal eccentricity The larger two channels at each point are transient and the smaller two are sustained These channels can be realized by linear units with bar-shaped receptive fields made of the difference of two Gaussian distributions with excitatory to inhibitory space constants in the ratio of 1175 for the sustained and 1 30 for the transient channels (Wilson amp Bergen 1979) The largest receptive field a t each point is about four times the smallest
This state of affairs is consistent with the neurophysiology since Hubel amp Wiesel (1962) originally defined simple cells by the linearity of their response and they reported many bar-shaped receptive fields I n addition simple cell receptive field sizes increase linearly with eccentricity (Hubel amp Wiesel 1974 fig 6a) and the scatter in size a t each location seems to be about 4 1 (Hubel amp Wiesel 1974 fig 7) It is therefore tempting to identify a t least some of the simple cells with the psychophysical channels If so the first obvious way of making the identification is to propose that the simple cells measure the second directional derivatives thus perhaps providing the convolution values from which zero-crossing segments are subsequently detected
There are however various reasons why this proposal can probably be excluded They are
(1) If the simple cells are essentially performing a linear convolution that approximates the second directional derivative why are they so orientation sensitive Three measurements in principle suffice to characterize the second derivative completely and in practice the directional derivatives measured along four orientations are apparently enough for this stage (see Marr 19763 Hildreth in preparation) and yet simple cells divide the domain into about 12 orientations
(2) Scl~illeret al (19763 pp 1324-5) found that the orientation sensitivity of simple cells is relatively independent of the strength of flanking inhibition and
207 The raw primal sketch
of the separation and lengths of the positive and negative subfields of the receptive field of the cell In addition tripartite receptive fields did not appear to be more orientation sensitive than bipartite ones These points provide good evidence that simple cells are not linear devices
(3) If the simple cells perform the convolution what elements find the zero- crossings and implement the spatial part of the computation lining the zero- crossings up with the convolution orientations for example
Wilsons channel data i s consistent with V2G
Wilsons Doa functions are very similar to V2G and probably indistinguishable by means of his experimental technique which yields about 10 accuracy (H G Wilson personal communication) In appendix B we show ( a )that V2G is the limit of the DOG function as gige the ratio of the inhibitory to excitatory space constants tends to unity and (b) that if an approximation to V2G is to be constructed out of the difference of two Gaussian distributions one excitatory and the other inhibitory the optimal choice on engineering grounds for gige is about 16
A specific proposal lateral geniculate X-cells carry V2G+ I and some simple cells detect and represent zero-crossing segments
It is known that retinal ganglion X-cells have receptive fields that are accurately described by the difference of two Gaussian distributions (Rodieck amp Stone 1965 Ratliff 1965 Enroth-Cugell amp Robson 1966) The positive and negative parts are not quite balanced (there is a response to diffuse illumination and i t increases with intensity) and since the ganglion cells have a spontaneous resting discharge they signal somewhat more than just the positive or just the negative part of such a convolution Interestingly there is little scatter in receptive field sizes of X-cells a t a given location in the retina (Peichl amp Wassle 1979)
There is some controversy about the way in which lateral geniculate receptive fields are constructed (cf Maffei amp Fiorentini 1972 b) but i t seems most likely that the on-centre geniculate X-cell fields are formed by combining a small number of on-centre retinal ganglion X-cell fields of which the centres approximately coincide (Cleland et al 1971)It seems likely that the scatter in receptive field size arises in this way since the amount of scatter required to account for the psychophysical findings is only a factor of two in both the X and the Y channels Finally lateral geniculate cells give a smaller response to diffuse illumination than do retinal ganglion cells sometimes giving no response a t all (Hubel amp Wiesel 1961)
These facts lead us to a particularly attractive scheme which for simplicity we present in idealized form
(1) Measurement of V2G The sustained or X-cell geniculate fibres can be thought of as carrying either the positive or the negative part of V2G I where the filter V2G of figure 2 is in practice approximated by a difference
208 D Marr and E Hildreth
of Gaussian convolution operator with centre-to-surround space constants in the ratio 1175 (One should probably think of this as being a convolution on linear intensity values rather than on their logarithms The reason for this is that although the nerve signal in the retina is an adaptation term multi- plied by I(I+K) where I is the incident illumination and K = 800 quanta per receptor per second (Alpern et al 1970) in any given image the ratio of the darkest to the brightest portion rarely exceeds 25 (a local ratio of around
-- (XL r -
AND
----
( a )
FIGURE9 Proposed mechanism whereby some simple cells detect zero-crossing segments I n (a ) if P represents an on-centre geniculate X-cell receptive field and Q an off-centre one then if both are active a zero-crossing Z in the Laplacian passes between them If they are connected to a logical AND gate as shown then the gate will detect the presence of the zero-crossing If several are arranged in tandem as in (b) and also connected by logical ANDS the resulting operation detects an oriented zero-crossing segment within the orientation bounds given roughly by the dotted lines This gives our most primitive model for simple cells Ideally one would like gates such that there is a response only if all (P Q) inputs are active and the magnitude of the response then varies with their sum Marr amp Ullman (1979) extend this model to include directional selectivity
30 is seen as a light source (Ullman 1976)) and over such ranges this function does not depart far from linearity) At each point in the visual field there are two sizes of filter (the minimum required for combining zero-crossings between channels) and these correspond to Wilson amp Bergens (1979) N and S chan-nels The one-dimensional projection of the widths w of the central excitatory regions of these two channels scales linearly with eccentricity from 31 and 62 a t the central fovea
The basic idea behind our model for the detection of zero-crossings rests on the following observations if an on-centre geniculate cell is active a t location P and an off-centre cell is active a t nearby location Q then the value of V2G I passes through zero between P and Q (see figure 9 a ) Hence by combining the signals from P and Q through a logical AND operation one can construct an operator for detecting when a zero-crossing segment (at some unknown orientation) passes
209 The raw primal sketch
between P and Q (figure 9a) By adding nonlinear AND operations in the longitu- dinal direction one can in a similar way construct an operator that detects oriented zero-crossing segments It is easy to see that the pure logical operator of figure 9 b will respond only to zero-crossing segments whose orientations lie within its sensitivity range (shown roughly dotted) We therefore propose
(2) Detection and representation of zero-crossing segments Part of the function of one subclass of simple cells is to detect zero-crossing segments Their re- ceptive fields include the construction shown in figure 9b with the proviso that the non-linearities may be weaker than the pure logical ANUS shown there It is however a critical feature of this model that the (PAND Q) inter-action (figure 9a) across the zero-crossing segment should contain a strong nonlinear component and that the longitudinal interaction (eg between the ends in figure 9b) contains a t least a weak nonlinear component Marr amp Ullmans (1979) full model for simple cells contains this organization but includes additional machinery for detecting the direction of movement of the zero-crossing segment and i t is this that provides a role for the two larger transient channels
(3) Signalling amplitude Ideally the output of the cell should be gated by the logical AND function of (2) but its value should be the average local amplitude v associated with the zero-crossings along the segment As we saw earlier this may be found by measuring the average local value of the slope of the zero-crossings which (in suitable units) is equal to the sum of the inputs to the cell
(4) Sampling density Finally for this scheme to be successful the sampling density of the function V2G I must be great enough to ensure that the zero- crossings may subsequently be localized accurately enough to account for the findings about hyperacuity (see for example Westheimer amp McKee 1977) which means roughly to within 5 This implies an extremely high precision of representation but in layer I V of the monkeys striate cortex there apparently exists a myriad of small centre-surround non-oriented cells (Hubel amp Wiesel 1968) Barlow (1979)and Crick et al (1980) have suggested that these cells may be involved in the reconstruction of the VZG function to an adequate precision for hyperacuity
The empirical consequences of this overall scheme are set out by Marr amp Ullman
(1979) Combination of zero-crossings
Empirical predictions for psychophysics
There are several aspects of our algorithm for combining zero-crossings from different channels that are accessible to psychophysical experiment They are (a) the phase relations (b) combination of zero-crossings from different channels and (c) the special cases that arise when zero-crossings lie close to one another
( I ) Phase relations Our theory predicts that descriptors need exist only for sets
210 D Marr and E Hildreth
of zero-crossings from different channels that coincide spatially (ie have a phase relation of 0 or n)Interestingly Atkinson amp Campbell (1974) superimposed 1 and 3 cyclesldeg sinusoidal gratings of the same orientation and found that the number of perceptual fluctuations per minute (which they called rate of monocular rivalry) was low near the in-phase 0 and out-of-phase n positions but reached a high plateau for intermediate phase positions They concluded (p161) that the visual system contains a device that seems to be designed to respond only to 0 and n phase relation When [it] is active it gives rise to a stable percept that is the sum of the two spatial frequency selective channels (cf also Maffeiamp Eiorentini 1972a) Our theory would predict these results if the additional assumption were made that units exist that represent explicitly the edge segment descriptor formed by combining appropriately arranged zero-crossing segments
(2) The parsing process The main point here is that the description of an edge (its width amplitude and orientation) can be obtained from the (smallest) channel whose zero-crossing there has maximum slope As Marr (19766 pp 496-497) observed this is consistent with Harmon amp Juleszs (1973) finding that noise bands spectrally adjacent to the spectrum of a picture are most effective at suppressing recognition since these have their greatest effect on mask response amplitudes near the important mask sizes It also explains why removal of the middle spatial frequencies from such an image leaves a recognizable image of Lincoln behind a visible graticule (see Harmon amp Julesz 1973) The reason is that the zero-crossings from different mask sizes fail to coincide and the gap in the spectrum means that the small bar descriptors fail to account for this discrepancy Hence the assumption of spatial coincidence cannot be used and the outputs from the different mask sizes are assumed to be due to different physical phenomena Accordingly they give rise to independent descriptions
There is another possible but weaker consequence If one makes the extra assumption that the selection criterion is implemented by inhibitory connections between zero-crossing segment detectors that are spatially coincident and lying adjacent in the frequency domain then one would expect to find an inhibitory interaction between channels a t the cortical orientation-dependent level There is in fact evidence that this occurs (see for example Tolhurst 1972 de Valois
1 9 7 7 ~ ) (3) Bar-detectors Case (2) of our parsing algorithm requires the specific detec-
tion of close parallel zero-crossing segments This requires the existence of units sensitive a t each orientation to one of the four cases (black bar white bar two dark edges two light edges) and sensitive to their width (ie the distance separat- ing the edges) rather than to spatial frequency characteristics of the whole pattern Adaptation studies that lead to these conclusions for white bars and for black bars have recently been published (Burton et al 1977 de Valois 19776) If our algo- rithm is implemented by the human visual system the analogous result should hold for the remaining two cases (see figure 7a)
(4) Blob-detectors and terminations Case (3) of our parsing algorithm requires
The raw primal sketch
the explicit representation of (oriented) blobs and terminations Units that re-present them should be susceptible to psychophysical adaptation and in fact Nakayama amp Roberts (1972) and Burton amp Ruddock (1978) have found evidence for units that are sensitive to bars whose length does not exceed three times the width
Consequences for neurophysiology
There are several ways of implementing the parsing process that we have described but i t is probably not worth setting them out in detail until we have good evidence from psychophysics about the parsing algorithm that is actually used and we know whether simple cells in fact implement the detection of zero-crossing segments Without these pieces of information firm predictions cannot be made but we offer the following suggestions as a possible framework for the neural implementation (1) The four types of bar detectors could be implemented a t the very first simple cell level (along the lines of figure 9 but being fed by three rows of centre-surround cells instead of two) (2) For relatively isolated edges there should exist oriented edge-segment-detecting neurons that combine zero-crossing segment detectors (simple cells) from different channels when and only when the segments are spatially coincident (3) Detectors for terminations and blobs (doubly-terminated oriented bars) seem to have been found already (Hubel amp Wiesel 1962 1968) Interestingly Schiller et al (1976a) found that even some simple cells are stopped Our scheme is consistent with this since it requires such detectors a t a very early stage
The concept of an edge has a partly visual and partly physical meaning One of our main purposes in this article is to make explicit this dual dependence our definition of an edge rests lightly on the early assumptions of theorem 1 about directional derivatives and heavily on the constraint of spatial localizatjon
Our theory is based on two main ideas First one simplifies the detection of intensity changes by dealing with the image separately a t different resolutions The detection process can then be based on finding zero-crossings in a second derivative operator which in practice can be the (non-oriented) Laplacian The representation a t this point consists of zero-crossing segments and their slopes This representation is probably complete and is therefore in principle invertible This had previously been given only an empirical demonstration by Marr and by R Woodham (see Marr 1978 fig 7)
The subsequent step of combining information from different channels into a single description rests on the second main idea of the theory which we formu- lated as the spatial coincidence assumption Physical edges will produce roughly coincident zero-crossings in channels of nearby sizes The spatial coincidence assumption asserts that the converse of this is true that is the coincidence of zero-
212 D Marr and E Hildreth
crossings is sufficient evidence for the existence of a real physical edge If the zero-crossings in one channel are not consistent with those in the others they are probably caused by different physical phenomena so descriptions need to be formed from both sources and kept somewhat separate
Finally the basic idea that some simple cells detect and represent zero-crossing segments and that this is carried out simultaneously a t different scales has some implications for Marr amp Poggios (1979)stereo theory According to various neuro- physiological studies (Barlow et al 1967 Poggio amp Fischer 1978 von der Heydt et al 1978) there exist disparity sensitive simple cells The existence of such cells is consisten6 with our suggestion that they detect zero-crossing segments but not with the idea that they perform a linear convolution equivalent to a directional derivative since it is the primitive symbolic descriptions provided by zero-crossing segments that need to be matched between images not the raw convolu- tion values
We thank K Nishihara T Poggio and S Ullman for their illuminating and helpful comments This work was conducted at the Artificial Intelligence Labora- tory a Massachusetts Institute of Technology research program supported in part by the Advanced Research Projects Agency of the Department of Defence and monitored by the Office of Naval Research under contract number N00014- 75-C-0643 D M was also supported by NSF contract number 77-07569-MCS
Alpern M Rushton W A H amp Torii S 1970 The size of rod signals J Physiol Lond 206 193-208
Atkinson J amp Campbell F W 1974 The effect of phase on the perception of compound gratings Vis ion Res 14 159-162
Barlow H B 1969 Pattern recognition and the responses of sensory neurons Ann N Y Acad Xci 156 872-881
Barlow H B 1979 Reconstructing the visual image in space and time Nature Lond 279 189-190
Barlow H B Blakemore C amp Pettigrew J D 1967 The neural mechanism of binocular depth discrimination J Physiol Lond 193 327-342
Bracewell R 1965 T h e Fourier transform and i ts applications New York MacGraw-Hill Burton G JNagshineh S amp Ruddock K H 1977 Processing by the human visual system
of the light and dark contrast components of the retinal image Biol Cybernetics 28 1-9 Burton G J amp Ruddock K H 1978 Visual adaptation to patterns containing two-
dimensional spatial structure Vis ion Res 18 93-99 Campbell F W amp Robson J G 1968 Applications of Fourier analysis to the visibility of
gratings J Physiol Lond 197 551-556 Cleland B G Dubin N W amp Levick W R 1971 Sustained and transient neurones in the
cats retina and lateral geniculate nucleus J Physiol Lond 217 473-496 Cowan J D 1977 Some remarks on channel bandwidths for visual contrast detection
Neurosci Res Prog Bull 15 492-517 Crick F H C Narr D amp Poggio T 1980 An information processing approach to under-
standing the visual cortex To appear in the NRP symposium T h e cerebral cortex (ed F 0 Schmidt amp F G Worden)
213 The raw primal sketch
De Valois K K 1977a Spatial frequency adaptation can enhance contrast sensitivity Vis ion Res 17 1057-1065
De Valois K K 1977 b Independence of black and white phase-specific adaptation Vis ion Res 17 209-215
Enroth-Cugell C amp Robson J G 1966 The contrast sensitivity of retinal ganglion cells of the cat J Physiol Lond 187 517-552
Graham N 1977 Visual detection of aperiodic spatial stimuli by probability summation among narrowband channels Vis ion Res 17 637-652
Harmon L D amp Julesz B 1973 Masking in visual recognition effects of two-dimensional filtered noise Science N Y 180 1194-1 197
von der Heydt R Adorjani Cs Hanny P amp Baumgartner G 1978 Disparity sensitivity and receptive field incongruity of units in the cat striate cortex E s p Bra in Res 31 523-545
Hubel D H amp Wiesel T N 1961 Integrative action in the cats lateral geniculate body J Physiol Lond 155 385-398
Hubel D H amp Wiesel T N 1962 Receptive fields binocular interaction and functional architecture in the cats visual cortex JPhysiol Lond 160 106-154
Hubel D H amp Wiesel T N 1968 Receptive fields and functional architecture of monkey striate cortex JPhysiol Lond 195 215-243
Hubel D H amp Wiesel T N 1974 Uniformity of monkey striate cortex a parallel relation- ship between field size scatter and magnification factor J comp Neurol 158 295-306
Kulikowski J J amp King-Smith P E 1973 Spatial arrangement of line edge and grating detectors revealed by subthreshold summation Vis ion Res 13 1455-1478
Leipnik R 1960 The extended entropy uncertainty principle I n f Control 3 18-25 Logan B F J r 1977 Information in the zero-crossings of bandpass signals Bell Sys t tech
J 56 487-510 Macleod I D G amp Rosenfeld A 1974 The visibility of gratings spatial frequency channels
or bar-detecting units Vis ion Res 14 909-915 Maffei L amp Fiorentini A 1 g 7 z a Process of synthesis in visual perception Nature Lond
240 479-481 Maffei L amp Fiorentini A 1g7zb Retinogeniculate convergence and analysis of contrast
J Neurophysiol 35 65-72 Maffei L amp Fiorentini A 1977 Spatial frequency rows in the striate visual cortex Vis ion
Res 17 257-264 Marr D 1970 A theory for cerebral neocortex Proc R Soc Lond B 176 161-234 Marr D 1976a Analyzing natural images a computational theory of texture vision Cold
Spr ing Harbor S y m p quant Biol 40 647-662 Marr D 19763 Early processing of visual information Phi l T rans R Soc Lond B 275
483-524 Marr D 1978 Representing visual information AAAS 143rd Annual Meeting Sym-
posium on Some mathematical questions in biology February 1977 Published in Lectures o n mathematics in the life sciences 10101-1 80 Also available as M I T AI Lab Memo 41 5
Marr D amp Poggio T 1979 A computational theory of human stereo vision Proc R Soc Lond B 204 301-328
Marr D Poggio T amp Ullman S 1979 Bandpass channels zero-crossings and early visual information processing J opt Soc Am 69 914r916
Marr D amp Ullman S 1979 Directional selectivity and its use in early visual processing (In preparation )
Mayhew J E W amp Frisby J P 1978 Suprathreshold contrast perception and complex random textures Vis ion Res 18 895-897
Nakayama K amp Roberts D J 1972 Line-length detectors in the human visual system evidence from selective adaptation Iision Res 12 1709-1713
Peichl L amp Wassle H 1979 Size scatter and coverage of ganglion cell receptive field centres in the cat retina JPhysiol Lond 291 117-141
Poggio G F amp Fischer B 1978 Binocular interaction and depth sensitivity of striate and prestriate neurons of the behaving rhesus monkey J Neurophysiol 40 1392-1405
214 D Marr and E Hildreth
Pollen D A Lee J R amp Taylor J H 1971 HOW does the striate cortex begin the recon- struction of the visual world Science N P 173 74-77
Ratliff F 1965 Mach bands quantitative studies on neural networks in the retina San Francisco Holden-Day
Rodieck R W amp Stone J 1965 Analysis of receptive fields of cat retinal ganglion cells JNeurophysiol 28 833-849
Rosenfeld A amp Kak A C 1976 Digital picture processing New York Academic Press Sachs M B Nachmias J amp Robson J G 1971 Spatial-frequency channels in human
vision J opt Soc Am 61 1176-1186 Shapley R M amp Tolhurst D J 1973 Edge detectors in human vision J Physiol Lond
229 165-183 Schiller P H Finlay B L amp Volman S F 1976a Quantitative studies of single-cell
properties in monkey striate cortex I Spatiotemporal organization of receptive fields J Neurophysiol 39 1288-1319
Schiller P H Finlay B L amp Volman S F 1976b Quantitative studies of single-oell properties in monkey striate cortex 11 Orientation specificity and ocular dominance JNeurophysiol 39 1320-1333
Ullman S 1976 On visual detection of light sources Biol Cybernetics 21 205-212 Westheimer G amp McKee S P 1977 Spatial configurations for visual hyperacuity Vision
Res 17 941-947 Wilson H R amp Bergen J R 1979 A four mechanism model for spatial vision Vision Res
19 19-32 Wilson H R amp Giese S C 1977 Threshold visibility of frequency gradient patterns Vision
Res 17 1177-1190
Let I be an open line segment of the y-axis containing the origin 0 Suppose that f(x y) is twice continuously differentiable and that N(1) is an open two- dimensional neighbourhood of I Assume that i32fi3x2 = 0 on I Then if i3fi3y is constant in N(I) the slope of the second directional derivative taken perpendicular to I (ie the slope of i32fi3x2) is greater than the slope of the zero-crossing along any other line through 0
Proof
Consider the line segment Q = (r cos 8 r sin 8) for fixed 8 and values of r sufficiently small that Q lies entirely within N(1) (see figure 10) Now writing fxx for i32fi3x2 etc we have
(a2faQ2)= (f cos2 8 +fx 2 sin 8 cos 8 +f sin2O) B
since the condition of the theorem that f be constant implies that f and f are both zero As required therefore the above quantity is zero a t r = 0 and has maximum slope when 8 = 0
The raw primal sketch
FIGURE10 Diagram for theorems 1and 2 1is a segment of the y-axis containing the origin N(1)is a neighbourhood of it Provided that afay is constant in N(l) theorem 1 states that the orientation of the line of zero-crossings is perpendicular to the orientation a t which the zero-crossings have maximum slope
THEOREM2
Let f (x y) be a real-valued twice continuously differelltiable function on the plane Let 1 be an open line segment along the axis x = 0 Then the two conditions
(i) V2f = 0 on I
and (ii) a2fax2 = 0 on I
are equivalent if and only if f(O y) is constant or linear on I
Proof
If f(0 y) is linear on I a2fay2 = 0 on 1 Hence V2f = 0 there implies that a2fax2 = 0 on 1 too
Conversely if a2fax2 = V2f = 0 on I then a2fay2 = 0 on Z and so f (0 y) varies a t most linearly on I
APPENDIXB
Doas and V2G v2G is the limit of a DOG
Wilsons Doa function may be written
216 D Marr and E Hildreth
where a and ai are the excitatory and inhibitory space constants Writing a = a and ai = a+65 the right hand side varies with
( l a ) exp ( -x22a2)- [ l ( a + 6a)] exp [- x22(a+6g)2]
= 6a (aau) (IU exp [- x22v2]) (4)
This derivative is equal to - (la2-x2a4) exp ( -x22a2) which equals G up to a constant (text equation 5) )
Approximation of V2Qby a DOG
The function
DOG (a5)= [1(2n)+ael exp ( -x22d)- [1(2n)gflil exp ( -x22a) ( 5 )
has Fourier transform w
DOG (w) = exp ( -a w22)-exp ( -cw22) (6)
Notice that D ~ G(w) behaves like w2 for values of w that are small compared with cr and ai so that these filters in common with V2G approximate a second derivative operator
The problem with using a DOG to approximate V2G is to find a space constant that keeps the bandwidth of the filter small and yet allows the filter adequate sensitivity for clearly as the space constants approach one another the contri- butions of the excitatory and inhibitory components become identical and the sensitivity of the filter is reduced
The bandwidths a t half sensitivity and a t half power and the peak sensitivity all depend together on the value of aiae in a way that is shown in figure 11 From this we see that (i) the bandwidth a t half sensitivity increases very slowly up to about aiae = 16 increases faster from there to CT~CT= 30 and is thereafter approximately constant (ii) the peak sensitivity of the filter is desultory for small CT~CTreaching about 33 at CT~CT= 16 Since our aim is to create a narrow bandpass differential operator tve should choose CT~CTto minimize the bandwidth Since the bandwidth is approximately constant for CT~CTlt 16 and since sensitivity is low there the minimal value one would in practice choose for aa is around 16 giving a half-sensitivity bandwidth of 18 octaves and a half power bandwidth of 13 octaves
The raw primal sketch
FIGURE 11 The values of certain parameters associated with difference-of-Gaussian (DOG)
masks with excitatory and inhibitory space constants a and a (a )For various values of auwe show the half-sensitivity bandwidth ( + ) and the half-power bandwidth (a)of the filter In ( b )is shown its peak sensitivity in the Fourier plane (The peak sensitivity of the excitatory component alone equals 100 on this scale) (c) The arguments in the appendix show that the best engineering approximation to VaG using a DOG occurs with aiuearound 16 In figure (c) this particular Doa is shown dotted against the operator V20 with the appropriate a The two profiles are very similar
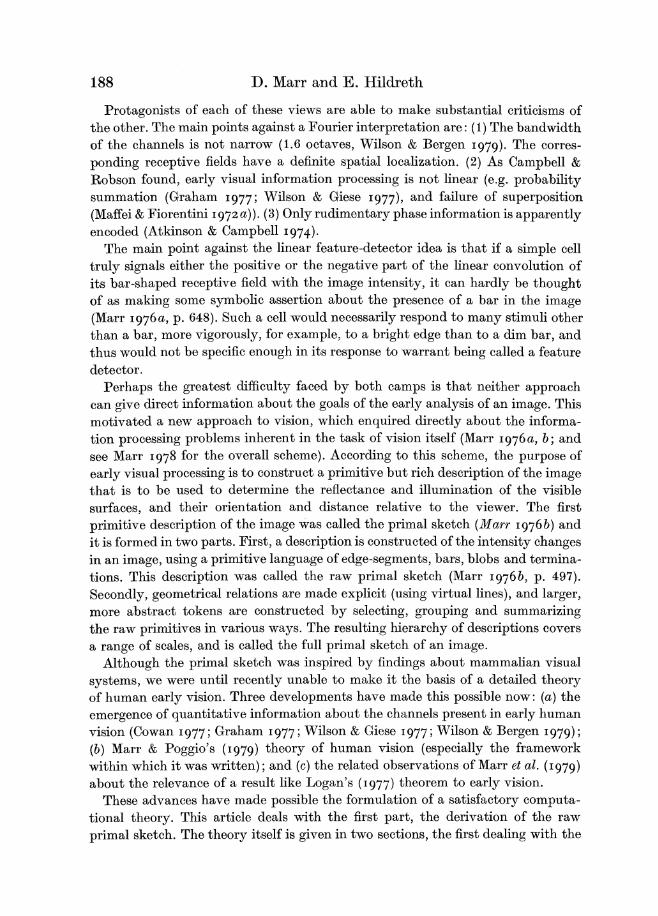
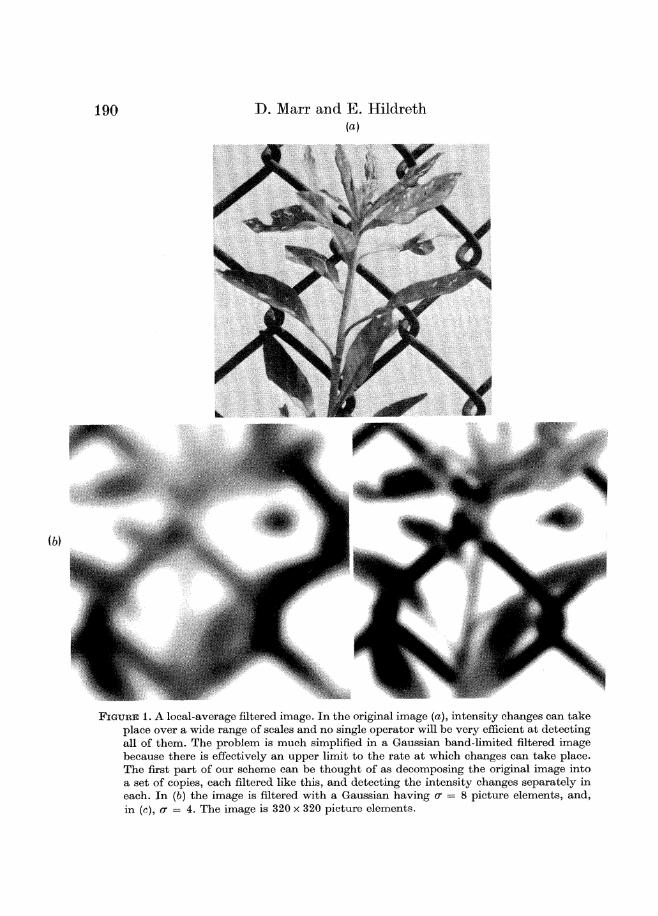
D Marr and E Hildreth
FIGURE1A local-average filtered image I n the original image (a)intensity changes can take place over a wide range of scales and no single operator will be very efficient a t detecting a11 of them The problem is much simplified in a Gaussian band-limited filtered image because there is effectively an upper limit to the rate a t which changes can take place The first part of our scheme can be thought of as decomposing the original image into a set of copies each filtered like this and detecting the intensity changes separately in each I n (b ) the image is filtered with a Gaussian having cr = 8 picture elements and in (c) a = 4 The image is 320 x 320 picture elements
191 The raw primal sketch
point in the filtered image should arise from a smooth average of nearby points rather than any kind of average of widely scattered points Hence the filter that we seek should also be smooth and localized in the spatial domain and in particular its spatial variance Ax should also be small
FIGURE2 The operators G (equation 5) and V2G (a)shows G the second derivative of the one-dimensional Gaussian distribution (c) shows V2G its rotationally synlmetric two- dimensional counterpart (b) and (d) exhibit their Fourier transforms
Unfortunately these two localization requirements the one in the spatial and the other in the frequency domain are conflicting They are in fact related by the uncertainty principle which states that Ax Aw gt an (see for example Bracewell 1965 pp 160-163) There is moreover only one distribution that optimizes this relation (Leipnik 1960) namely the Gaussian
G ( x )= [la(2n)amp]exp (-x22a2) with Fourier transform (1)
Q(w) = exp ( -+a2u2) (2)
In two dimensions G(r) = (ampna2)exp ( -r22a2)
192 D Marr and E Hildreth
The filter G thus provides the optimal trade-off between our conflicting require- ments
Detecting intensity changes
Wherever an intensity change occurs there will be a corresponding peak in the first directional derivative or equivalently a zero-crossing in the second direc- tional derivative of intensity (Marr 19768 Marr amp Poggio 1979) In fact we may define an intensity change in this way so that the task of detecting these changes
FIGURE3 Spatial and directional factors interact in the definition of a zero-crossing segment (a )shows an intensity change and (b) (c) and ( d )show values of the second directional derivative near the origin a t various orientations across the change In (b) the derivative is taken parallel to the a-axis and in (c) and (d)a t 30 and 60 to it There is a zero- crossing a t every orientation except for a21i3y2 which is identically zero Since the zero- crossings line up along the y-axis this is the direction that is chosen In this example it is also the direction that maximizes the slope of the second derivative
can be reduced to that of finding the zero-crossings of the second derivative D2 of intensity in the appropriate direction That is to say we seek the zero-crossings in
f (x Y ) = D2[G(r)I(xy)l (3)
where I (x y) is the image and is the convolution operator By the derivative rule for convolutions
f (s y) = D2G I(x y) (4)
We can write the operator D2G as Go and in one dimension
G(x) = (1-x2cr2)exp ( -x22cr2)[- 1~9(27~)4]
The raw primal sketch 193
fJ1(x) looks like a Mexican hat operator (see figure 2)) it closely resembles Wilson 5 Gieses (1977) difference of two Gaussians (DOG)and it is in fact the limit of the DOG function as the sizes of the two Gaussians tend to one another (see figure 11 and appendix B) It is an approximately bandpass operator with a half-power bandwidth of about 12 octaves and so it can be thought of as looking a t the information contained in one particular part of the spectrum of the image
These arguments establish that intensity changes a t one scale may in principle be detected by convolving the image with the operator D2C and looking for zero-crossings in its output Only one issue is still unresolved and i t concerns the orientation associated with D2 It is not enough to choose zero-crossings of the second derivative in any direction To understand this imagine a uniform intensity change running down the y-axis as shown in figure 3 At the origin the second directional derivative is zero in every direction but it is non-zero nearby in every direction except along the y-axis
I n which direction should the derivative be taken
To choose which directional derivative to use we observe that the underlying motivation for detecting changes in intensity is that they will correspond to useful properties of the physical world like changes in reflectance illumination surface orientation or distance from the viewer Such properties are spatially continuous and can almost everywhere be associated with a direction that projects to an orientation in the image The orientation of the directional derivative that we choose to use is therefore that which coincides with the orientation formed locally by its zero-crossings I n figure 3 this orientation is the y-axis and so the directional derivative we would choose there is a21i3x2
Under what conditions does this direction coincide with that in which the zero- crossing has maximum slope The answer to this is given by theorem 1 (see appendix A) and we call it the condition of linear variation
the intensity variation near and parallel to the line of zero-crossings should locally be linear
This condition will be approximately true in smoothed images and in the rest of this article we shall assume that the condition of linear variation holds
This direction can be found by means of the Laplacian
There are three main steps in the detection of zero-crossings They are (1) a convolution with D2G where 0 2 stands for a second directional derivative opera- tor (2) the localization of zero-crossings and (3) checking of the alignment and orientation of a local segment of zero-crossings Although i t is possible to imple- ment this scheme directly (Marr r976b p 494) one immediate question that can be asked is are directional derivatives of critical importance here Convolutions are relatively expensive and it would much lessen the computational burden if
7 VO~207 B
194 D Marr and E Hildreth
their number could be reduced for example by using just one orientation-independent operator
The only orientation-independent second-order differential operator is the Laplacian V2 and theorem 2 (see appendix A) makes explicit the conditions under which i t can be used They are weaker than the condition of linear variation which we met in theorem 1 and they state that provided the intensity variation in (G I)is linear along but not necessarily near to a line of zero-crossings then the zero-crossings will be detected and accurately located by the zero values of the Laplacian Again because in our application the condition of linear variation is approximately satisfied so will be this condition It follows that the detection of intensity changes can be based on the filter V2G illustrated in figure 2 It is however worth remembering that in principle if intensity varies along a segment in a very non-linear way the Laplacian and hence the operator V2G will see the zero-crossing displaced to one side
Summary of the argument
The main steps in the argument so far are therefore these (1) To limit the rate a t which intensities can change we first convolve the
image I with a two-dimensional Gaussian operator G (2) Intensity changes in G I are then characterized by the zero-crossings in
the second directional derivative D2(G I ) This operator is roughly bandpass and so i t examines only a portion of the spectrum of the image
( 3 ) The orientation of the directional derivative should be chosen to coincide with the local orientation of the underlying line of zero-crossings
(4) Provided that the condition of linear variation holds this orientation is also the one at which the zero-crossing has maximum slope (measured perpendicular to the orientation of the zero-crossing)
( 5 ) By theorem 1of appendix A if the condition of linear variation holds the lines of zero-crossings defined by (3) are precisely the zero-crossings of the orient- ation-independent differential operator the Laplacian V2
(6) The loci of zero-crossings defined by (3) may therefore be detected eco- nomically in the image a t each given scale by searching for the zero values of the convolution V2G II n two dimensions
V2G(r) = - lng4[1-r22a2] exp ( -r22a2)
We turn now to the question of how to represent the intensity changes thus detected
Representing the intensity changes
I n a band-limited image changes take place smoothly so i t is always possible to divide a line of zero-crossings into small segments each of which approximately obeys the condition of linear variation This fact allows us to make thefollowingdefinitions
195 The raw primal sketch
(1) A zero-crossing segment in a Gaussian filtered image consists of a linear segment 1 of zero-crossings in the second directional derivative operator whose direction lies perpendicular to I
(2) We can also define an amplitude v associated with a zero-crossing segment as the slope of the directional derivative taken perpendicular to the segment To see why this is an appropriate measure observe that a narrow bandpass channel near a zero-crossing a t the origin can be described approximately by v sin wx which has slope uw at the origin Hence if s is the measured slope of the zero- crossing v = s ~ The factor l w is a space constant and scales linearly with the sampling interval required
The set of zero-crossing segments together with their amplitudes constitutes a primitive symbolic representation of the changes taking place within one region of the spectrum of an image Pull coverage of the spectrum can now be had simply by applying the analysis over a sufficient number of channels simultaneously
Pinally there are grounds for believing that this representation of the image is complete Marr et al (1979) noted that Logans (1977) recent theorem about the zero-crossings of one-octave bandpass signals shows that the set of such zero- crossing segments is extremely rich in information If the filters had bandwidth of an octave or less they would in fact contain complete information about the filtered image I n practice the V2G filter has a half-sensitivity bandwidth of about 175 octaves which puts i t outside the range in which Logans theorem applies On the other hand if we add information about the slopes of the zero- crossings the situation may be more congenial In the standard sampling theorem if the first derivative as well as the value is given the sampling density can be halved (see for example Bracewell 1978 pp 198-200) I t seems likely than an analogous extension holds for Logans (1977) theorem If this were true the zero- crossing segments whose underlying motivation is physical would in fact provide a sufficient basis for the recovery of arbitrary intensity profiles
I n summary then we have shown how intensity changes a t one scale may be detected by means of the V2G operator and that they may be represented probably completely by oriented zero-crossing segments and their amplitudes To detect changes a t all scales i t is necessary only to add other channels like the one described above and to carry out the same computation in each These representations are precursors of the descriptive primitives in the raw primal sketch and mark the transition from the analytic to the symbolic analysis of an image The remaining step is to combine the zero-crossings from the different channels into primitive edge elements and this task is addressed later in the article
Examples and comments
Figure 4 sho~vssome examples of zero-crossings The top row shows images and the second shows their convolutions with the operator V2G exhibited in figure 2 Zero is represented here by an intermediate grey so that very positive values
7-2
196 D Marr and E Hildreth
The raw primal sketch
198 D Marr and E Hildreth (a) ( b )
FIGURE5 Comparison of the performance of V2G with that of similar filters Column (a ) shows an image its convolution with V2G and the resulting signed zero-crossings Column (b) contains the same sequence but for the pure one-octave bandpass filter shown with its Fourier transform a t the top of the column The zero-crossing array contains echoes of the strong edges in the image Columns (c) and ((1) exhibit the same
----
The raw primal sketch ( d )
lt (J$6(JJ(-(-- 1- $yd 9 amp
L)(
I) --d
~j
I
_ -1
------7I)-J ----ltc-L_
6$lt -- ----i y ----c-
---1
kf-0-----ltI
1 x ----- I- -I
-lt2----gt_I ----- I t
-gt -
-- ---2
-7tlt--
gt (- s
gt -- analysis of another image except that here V2G is compared with a square-wave approximation to the second derivative The widths of the central excitatory regions of the filters are the same for each comparison pair being 12 for (a )and ( b ) and 18 for (c) and (d) The square-wave filter sees relatively few zero-crossings
200 D Marr and E Hildreth
appear white and very negative ones black I n the third row all positive values appear completely white and all negative ones are black and the fourth row shows just the loci of zero values It will be observed that these delineate well the visible edges in the images (See the legend for more details) It remains only to break the zero value loci into oriented line segments
It is interesting to compare the zero-crossings found by means of V2G with those found by means of similar operators that according to our arguments are not optimal Our choice of the Gaussian filter was based on the requirements of simul- taneous localization in the frequency and spatial domains We therefore show examples in which each of these requirements is severely violated An ideal one- octave bandpass filter satisfies the localization requirement in the frequency domain but violates it in the spatial domain The reason is that strict band- limiting gives rise to sidelobes in the spatial filter and the consequence of these is that in the zero-crossing image strong intensity changes give rise to echoes as well as to the directly corresponding zero-crossings (see figure 5) These echoes have no direct physical correlate and are therefore undesirable for early visual processing
On the other hand if one cuts off the filter in the spatial domain one acquires sidelobes in the frequency domain Figure 5 also shows a square-wave approxi- mation to the second derivative operator together with an example of the zero- crossings to which i t gives rise This operator sees fewer zero-crossings essentially because i t is averaging out the changes that occur over a wider range of scales
Interestingly Rosenfeld amp Kak (1976 pp 281-4) discuss the Laplacian in relation to edge detection but they do not report its having been used very effectively One reason for this is that i t is not very effective unless i t is used in a band-limited situation and one uses its zero-crossings and these ideas do not appear in the computer vision literature (see for example Rosenfeld amp Kak 1976 fig 10 for how the Laplacian has previously been used) I n fact the idea of using narrow bandpass differential operators did not appear until the human stereo theory of Marr amp Poggio (1979) which was also the first theory to depend primarily on zero-crossings
Another more practical reason why edge-detecting operators have previously been less than optimally successful in computer vision is that most current operators examine only a very small part of the image their receptive fields are of the order of 10 to 20 image points a t most This contrasts sharply with the smallest of Wilsons four psychophysical channels the receptive field of which must cover over 500 foveal cones (see figure 4)
Finally notice that G and hence V2G is approximately a second derivative operator because its Fourier transform is -4n2w2 exp ( -a2w2) which behaves like -w2 near the origin
201 The raw primal sketch
FIGURE6 The image (a)has been convolved with V2G having w = 2rr = 6 12 and 24 pixels These filters span approximately the range of filters that operate in the human fovea I n (b) ( c ) and (d) are shown the zero-crossings thus obtained Notice the h e detail picked up by the smallest This set of figures neatly poses our next problem how does one combine all this information into a single description
COMBININGI N F O R M A T I O N F R O M DIFFERENT CHANNELS
The signals transmitted through channels that do not overlap in the Fourier domain will be generally unrelated unless the underlying signal is constrained The critical question for us here is therefore (and we are indebted to T Poggio for conversations on this point) what additional information needs to be taken into account when we consider how to combine information from the different channels to form a primitive description of the image In other words are there any general physical constraints on the structure of the visual world that allow us to place valid restrictions on the way in which information from the different channels may be combined Figure 6 illustrates the problem that we have to solve
The spatial coincidence assumption
The additional information that we need here comes from the constraint of spatial localization which we defined in the previous section It states that the physical phenomena that give rise to intensity changes in the image are spatially
202 D Marr and E Hildreth
localized Since it is these changes that produce zero-crossings in the filtered images it follows that if a discernible zero-crossing is present in a channel centred on wavelength Ao there should be a corresponding zero-crossing a t the same spatial location in channels for wavelengths A gt A If this ceases to be true a t some wavelength A gt A it will be for one of two reasons either (a) two or more local intensity changes are being averaged together in the larger channel or (b) two independent physical phenomena are operating to produce intensity changes in the same region of the image but a t different scales An example of situation (a) would be a thin bar whose edges will be accurately located by small channels but not by large ones Situations of this kind can be recognized by the presence of two nearby zero-crossings in the smaller channels An example of situation (b) would be a shadow superimposed on a sharp reflectance change and it can be recognized if the zero-crossings in the larger channels are displaced relative to those in the smaller If the shadow has exactly the correct position and orientation the loca- tions of the zero-crossings may not contain enough information to separate the two physical phenomena but in practice this situation will be rare
We can therefore base the parsing of sets of zero-crossing segments from dif- ferent V2G channels on the following assumption which we call the spatial coincidence assumption
If a zero-crossing segment is present in a set of independent V2G channels over a contiguous range of sizes and the segment has the same positioil and orientation in each channel then the set of such zero-crossing segments may may be taken to indicate the presence of an intensity change in the image that is due to a single physical phenomenon (a change in reflectance illumina- tion depth or surface orientation)
I n other words provided that the zero-crossings from independent channels of adjacent sizes coincide they can be taken together If they do not they probably arise from distinct surfaces or physical phenomena It follows that the minimum number of channels required is two and that provided the two channels are reasonably separated in the frequency domain and their zero-crossings agree the combined zero-crossings can be taken to indicate the presence of an edge in the image
The parsing of sets of zero-crossing segments
Figure 6 shows the zero-crossings obtained from two channels whose dimensions are approximately the same as the two sustained channels present a t the fovea in the human visual system (Wilson amp Bergen 1979) We now derive the parsing rules needed for combining zero-crossings from the different channels
Case (1) isolated edges
For an isolated linearly disposed intensity change there is a single zero-crossing present a t the same orientation in all channels above some size that depends upon the channel sensitivity and the spatial extent of the edge This set of zero-
203 The raw primal sketch
crossings may therefore be combined into a symbol that we shall call an edge- segment with the attributes of edge-amplitude and width which we may obtain as follows
Calculation of edge-amplitude Because the assumptions that we have made mean that the type of intensity change involved is a simple one we can in fact use what Marr (1976 figure 1) called the selection criterion according to which one
FIGURE7 Parsing of sets of zero-crossing segments (a) If zero-crossing segments lie close and roughly parallel (as in profile (a) of column 3 above) larger masks cannot be used only the smaller masks There are four possible configurations shown in (1)-(4) and the figure represents the way in which the contrast changes across the edge Each of these cases needs to be detected separately (b) If the bar- or edge-segments are terminated special descriptors are required Doubly terminated bars with I lt 3w are called blobs and the other assertions are labelled terminations These are illustrated here for one contrast sign Termination assertions may mark only a discontinuity in edge orientation but it is often useful later on to have such positions explicitly available
selects the smallest channel to which the intensity change is essentially indis- tinguishable from a step function and uses that channel alone to estimate the contrast by means of the amplitude v derived above If one has just two indepen- dent channels with amplitudes v and v an approximation to the edge amplitude is J(v+vi)
Calculation of width The width of the edge in this case can also be estimated from the channel selected according to the selection criterion For a narrow channel with central wavelength A the physical notion of width corresponds to the distance over which intensity increases This distance is ampA which is approximately w the width of the central excitatory region of the receptive field associated with the most excited channel (in fact h = nw)
Case ( 2 ) bars
If two parallel edges with opposite contrast lie only a small distance d apart in the image zero-crossings from channels with associated wavelength that exceeds about 2d cannot be relied upon to provide accurate information about the positions
D Marr and E Hildreth
FIGURE8 Combination of information from two channels I n (a)and (b) are shoxvn the zero- crossings obtained from one of the images of figure 4 by means of masks with w = 9 and 18 Because there are no zero-crossings in the larger channel that do not correspond to zero-crossings in the smaller channel the locations of the edges in the combined description also correspond to (a) I n (c) (d) and (e) are shown symbolic representations of the descriptors attached to the locations marked in ( a ) (c) shows the blobs (d)the local orientations assigned to the edge segments and (e) the bars These diagrams show only the spatial information contained in the descriptors Typical examples of the full descriptors are as follows
(BLOB (POSITION 146 21) (EDGE (POSITION 104 23) (BAR (POSITION 118 134) (ORIENTATION 105) (ORIENTATION 120) (ORIENTATION 120) (CONTRAST 76) (CONTRAST -25) (CONTRAST -25) (LENGTH 16) (LENGTH 25) (LENGTH 25) (WIDTH 6)) (WIDTH 4)) (WIDW 4))
The descriptors t o which these correspond are marked with arrows The resolution of this analysis of the image of figure 4 roughly corresponds to what a humanwould see when viewing it from a distance of about 6 f t (183rn)
or contrasts of the edges In these circumstances the larger channels must be ignored and the description formed solely from small channels of which the zero- crossing segments do superimpose An edge can have either positive or negative contrast and so two together give us the four situations shown in figure 7 a There is of course no reason why the two edges should have the same contrast and the contrast of each edge must be obtained individually from the smallest channels
205 The raw primal sketch
(w c d) Two other parameters are useful one is the average orientation of the two zero-crossing segments and the other is their average separation
Our case (2) applies only to situations in which neither zero-crossing segment terminates and they both remain approximately parallel (w or less apart) When the two edges are closer together than w for the smallest available channel the zero-crossings associated with even the smallest channel will not accurately reflect the positions of the two edges they will over estimate the distance between them If the two edges have opposite contrasts that are not too different in absolute magnitude the position of the centre of the line segment so formed in the image will be the midpoint of the two corresponding zero-crossings I n these circum- stances the parameters associated with the line segment will be more reliable than those associated with each individual edge
Case (3) blobs and terminations
It frequently happens that the zero-crossing segments do not continue very far across the image Two parallel segments can merge or be joined by a third seg- ment and in textured images they often form small closed curves (see figure 6) which are quite small compared to the underlying field size Both situations can give rise to anomalous effects a t larger channel sizes and so are best made explicit early on Following Marr (1976b) the closed contours we call BLOBS and assign to them a length width orientation and (average) contrast and the terminations are assigned a position and orientation (see figure 7c)
Remarks
Two interesting practical details have emerged from our implementation First the intensity changes a t each edge of a bar are in practice rarely the same so i t is perhaps more proper to think of the BAR descriptor as a primitive grouping predicate that combines two edges the contrasts of which are specified precisely by the smallest channel Brightness within the area of the bar will of course be constant Secondly i t is often the case that the zero-crossings from the small and from the large masks roughly coincide but those from the small mask weave around much more partly because of the image structure and partly because of noise and the image tesselation Local orientation has little meaning over dis- tances shorter than the width w of the central excitatory region of the V2G filter so if the zero-crossings from the smaller filter are changing direction rapidly locally the orientation derived from the larger mask can provide a more stable and more reliable measure
We have presented specific algorithms for the construction of the raw primal sketch and we now ask whether the human visual system implements these algorithms or something close to them There are two empirically accessible
206 D Marr and E Hildreth
characteristics of our scheme The first concerns the underlying convolutions and zero-crossing segments and the second whether zero-crossing segments from the different channels are combined in the way that we have described
Detection of zero-crossing segments
According to our theory the most economical way of detecting zero-crossing segments requires that the image first be filtered through a t least two independent V2G channels and that the zero-crossings then be found in the filtered outputs These zero-crossings may be divided into short oriented zero-crossing segments
The empirical data
Recent psychophysical work by Wilson amp Giese (1977) FVilson amp Bergen (1979) (see also Macleod amp Rosenfeld 1974) has led to a precise quantitative model of the orientation-dependent spatial-frequency-tuned channels discovered by Campbell amp Robson (1968) At each point in the visual field there are four such channels spanning about three octaves and their peak sensitivity wavelength increases linearly with retinal eccentricity The larger two channels at each point are transient and the smaller two are sustained These channels can be realized by linear units with bar-shaped receptive fields made of the difference of two Gaussian distributions with excitatory to inhibitory space constants in the ratio of 1175 for the sustained and 1 30 for the transient channels (Wilson amp Bergen 1979) The largest receptive field a t each point is about four times the smallest
This state of affairs is consistent with the neurophysiology since Hubel amp Wiesel (1962) originally defined simple cells by the linearity of their response and they reported many bar-shaped receptive fields I n addition simple cell receptive field sizes increase linearly with eccentricity (Hubel amp Wiesel 1974 fig 6a) and the scatter in size a t each location seems to be about 4 1 (Hubel amp Wiesel 1974 fig 7) It is therefore tempting to identify a t least some of the simple cells with the psychophysical channels If so the first obvious way of making the identification is to propose that the simple cells measure the second directional derivatives thus perhaps providing the convolution values from which zero-crossing segments are subsequently detected
There are however various reasons why this proposal can probably be excluded They are
(1) If the simple cells are essentially performing a linear convolution that approximates the second directional derivative why are they so orientation sensitive Three measurements in principle suffice to characterize the second derivative completely and in practice the directional derivatives measured along four orientations are apparently enough for this stage (see Marr 19763 Hildreth in preparation) and yet simple cells divide the domain into about 12 orientations
(2) Scl~illeret al (19763 pp 1324-5) found that the orientation sensitivity of simple cells is relatively independent of the strength of flanking inhibition and
207 The raw primal sketch
of the separation and lengths of the positive and negative subfields of the receptive field of the cell In addition tripartite receptive fields did not appear to be more orientation sensitive than bipartite ones These points provide good evidence that simple cells are not linear devices
(3) If the simple cells perform the convolution what elements find the zero- crossings and implement the spatial part of the computation lining the zero- crossings up with the convolution orientations for example
Wilsons channel data i s consistent with V2G
Wilsons Doa functions are very similar to V2G and probably indistinguishable by means of his experimental technique which yields about 10 accuracy (H G Wilson personal communication) In appendix B we show ( a )that V2G is the limit of the DOG function as gige the ratio of the inhibitory to excitatory space constants tends to unity and (b) that if an approximation to V2G is to be constructed out of the difference of two Gaussian distributions one excitatory and the other inhibitory the optimal choice on engineering grounds for gige is about 16
A specific proposal lateral geniculate X-cells carry V2G+ I and some simple cells detect and represent zero-crossing segments
It is known that retinal ganglion X-cells have receptive fields that are accurately described by the difference of two Gaussian distributions (Rodieck amp Stone 1965 Ratliff 1965 Enroth-Cugell amp Robson 1966) The positive and negative parts are not quite balanced (there is a response to diffuse illumination and i t increases with intensity) and since the ganglion cells have a spontaneous resting discharge they signal somewhat more than just the positive or just the negative part of such a convolution Interestingly there is little scatter in receptive field sizes of X-cells a t a given location in the retina (Peichl amp Wassle 1979)
There is some controversy about the way in which lateral geniculate receptive fields are constructed (cf Maffei amp Fiorentini 1972 b) but i t seems most likely that the on-centre geniculate X-cell fields are formed by combining a small number of on-centre retinal ganglion X-cell fields of which the centres approximately coincide (Cleland et al 1971)It seems likely that the scatter in receptive field size arises in this way since the amount of scatter required to account for the psychophysical findings is only a factor of two in both the X and the Y channels Finally lateral geniculate cells give a smaller response to diffuse illumination than do retinal ganglion cells sometimes giving no response a t all (Hubel amp Wiesel 1961)
These facts lead us to a particularly attractive scheme which for simplicity we present in idealized form
(1) Measurement of V2G The sustained or X-cell geniculate fibres can be thought of as carrying either the positive or the negative part of V2G I where the filter V2G of figure 2 is in practice approximated by a difference
208 D Marr and E Hildreth
of Gaussian convolution operator with centre-to-surround space constants in the ratio 1175 (One should probably think of this as being a convolution on linear intensity values rather than on their logarithms The reason for this is that although the nerve signal in the retina is an adaptation term multi- plied by I(I+K) where I is the incident illumination and K = 800 quanta per receptor per second (Alpern et al 1970) in any given image the ratio of the darkest to the brightest portion rarely exceeds 25 (a local ratio of around
-- (XL r -
AND
----
( a )
FIGURE9 Proposed mechanism whereby some simple cells detect zero-crossing segments I n (a ) if P represents an on-centre geniculate X-cell receptive field and Q an off-centre one then if both are active a zero-crossing Z in the Laplacian passes between them If they are connected to a logical AND gate as shown then the gate will detect the presence of the zero-crossing If several are arranged in tandem as in (b) and also connected by logical ANDS the resulting operation detects an oriented zero-crossing segment within the orientation bounds given roughly by the dotted lines This gives our most primitive model for simple cells Ideally one would like gates such that there is a response only if all (P Q) inputs are active and the magnitude of the response then varies with their sum Marr amp Ullman (1979) extend this model to include directional selectivity
30 is seen as a light source (Ullman 1976)) and over such ranges this function does not depart far from linearity) At each point in the visual field there are two sizes of filter (the minimum required for combining zero-crossings between channels) and these correspond to Wilson amp Bergens (1979) N and S chan-nels The one-dimensional projection of the widths w of the central excitatory regions of these two channels scales linearly with eccentricity from 31 and 62 a t the central fovea
The basic idea behind our model for the detection of zero-crossings rests on the following observations if an on-centre geniculate cell is active a t location P and an off-centre cell is active a t nearby location Q then the value of V2G I passes through zero between P and Q (see figure 9 a ) Hence by combining the signals from P and Q through a logical AND operation one can construct an operator for detecting when a zero-crossing segment (at some unknown orientation) passes
209 The raw primal sketch
between P and Q (figure 9a) By adding nonlinear AND operations in the longitu- dinal direction one can in a similar way construct an operator that detects oriented zero-crossing segments It is easy to see that the pure logical operator of figure 9 b will respond only to zero-crossing segments whose orientations lie within its sensitivity range (shown roughly dotted) We therefore propose
(2) Detection and representation of zero-crossing segments Part of the function of one subclass of simple cells is to detect zero-crossing segments Their re- ceptive fields include the construction shown in figure 9b with the proviso that the non-linearities may be weaker than the pure logical ANUS shown there It is however a critical feature of this model that the (PAND Q) inter-action (figure 9a) across the zero-crossing segment should contain a strong nonlinear component and that the longitudinal interaction (eg between the ends in figure 9b) contains a t least a weak nonlinear component Marr amp Ullmans (1979) full model for simple cells contains this organization but includes additional machinery for detecting the direction of movement of the zero-crossing segment and i t is this that provides a role for the two larger transient channels
(3) Signalling amplitude Ideally the output of the cell should be gated by the logical AND function of (2) but its value should be the average local amplitude v associated with the zero-crossings along the segment As we saw earlier this may be found by measuring the average local value of the slope of the zero-crossings which (in suitable units) is equal to the sum of the inputs to the cell
(4) Sampling density Finally for this scheme to be successful the sampling density of the function V2G I must be great enough to ensure that the zero- crossings may subsequently be localized accurately enough to account for the findings about hyperacuity (see for example Westheimer amp McKee 1977) which means roughly to within 5 This implies an extremely high precision of representation but in layer I V of the monkeys striate cortex there apparently exists a myriad of small centre-surround non-oriented cells (Hubel amp Wiesel 1968) Barlow (1979)and Crick et al (1980) have suggested that these cells may be involved in the reconstruction of the VZG function to an adequate precision for hyperacuity
The empirical consequences of this overall scheme are set out by Marr amp Ullman
(1979) Combination of zero-crossings
Empirical predictions for psychophysics
There are several aspects of our algorithm for combining zero-crossings from different channels that are accessible to psychophysical experiment They are (a) the phase relations (b) combination of zero-crossings from different channels and (c) the special cases that arise when zero-crossings lie close to one another
( I ) Phase relations Our theory predicts that descriptors need exist only for sets
210 D Marr and E Hildreth
of zero-crossings from different channels that coincide spatially (ie have a phase relation of 0 or n)Interestingly Atkinson amp Campbell (1974) superimposed 1 and 3 cyclesldeg sinusoidal gratings of the same orientation and found that the number of perceptual fluctuations per minute (which they called rate of monocular rivalry) was low near the in-phase 0 and out-of-phase n positions but reached a high plateau for intermediate phase positions They concluded (p161) that the visual system contains a device that seems to be designed to respond only to 0 and n phase relation When [it] is active it gives rise to a stable percept that is the sum of the two spatial frequency selective channels (cf also Maffeiamp Eiorentini 1972a) Our theory would predict these results if the additional assumption were made that units exist that represent explicitly the edge segment descriptor formed by combining appropriately arranged zero-crossing segments
(2) The parsing process The main point here is that the description of an edge (its width amplitude and orientation) can be obtained from the (smallest) channel whose zero-crossing there has maximum slope As Marr (19766 pp 496-497) observed this is consistent with Harmon amp Juleszs (1973) finding that noise bands spectrally adjacent to the spectrum of a picture are most effective at suppressing recognition since these have their greatest effect on mask response amplitudes near the important mask sizes It also explains why removal of the middle spatial frequencies from such an image leaves a recognizable image of Lincoln behind a visible graticule (see Harmon amp Julesz 1973) The reason is that the zero-crossings from different mask sizes fail to coincide and the gap in the spectrum means that the small bar descriptors fail to account for this discrepancy Hence the assumption of spatial coincidence cannot be used and the outputs from the different mask sizes are assumed to be due to different physical phenomena Accordingly they give rise to independent descriptions
There is another possible but weaker consequence If one makes the extra assumption that the selection criterion is implemented by inhibitory connections between zero-crossing segment detectors that are spatially coincident and lying adjacent in the frequency domain then one would expect to find an inhibitory interaction between channels a t the cortical orientation-dependent level There is in fact evidence that this occurs (see for example Tolhurst 1972 de Valois
1 9 7 7 ~ ) (3) Bar-detectors Case (2) of our parsing algorithm requires the specific detec-
tion of close parallel zero-crossing segments This requires the existence of units sensitive a t each orientation to one of the four cases (black bar white bar two dark edges two light edges) and sensitive to their width (ie the distance separat- ing the edges) rather than to spatial frequency characteristics of the whole pattern Adaptation studies that lead to these conclusions for white bars and for black bars have recently been published (Burton et al 1977 de Valois 19776) If our algo- rithm is implemented by the human visual system the analogous result should hold for the remaining two cases (see figure 7a)
(4) Blob-detectors and terminations Case (3) of our parsing algorithm requires
The raw primal sketch
the explicit representation of (oriented) blobs and terminations Units that re-present them should be susceptible to psychophysical adaptation and in fact Nakayama amp Roberts (1972) and Burton amp Ruddock (1978) have found evidence for units that are sensitive to bars whose length does not exceed three times the width
Consequences for neurophysiology
There are several ways of implementing the parsing process that we have described but i t is probably not worth setting them out in detail until we have good evidence from psychophysics about the parsing algorithm that is actually used and we know whether simple cells in fact implement the detection of zero-crossing segments Without these pieces of information firm predictions cannot be made but we offer the following suggestions as a possible framework for the neural implementation (1) The four types of bar detectors could be implemented a t the very first simple cell level (along the lines of figure 9 but being fed by three rows of centre-surround cells instead of two) (2) For relatively isolated edges there should exist oriented edge-segment-detecting neurons that combine zero-crossing segment detectors (simple cells) from different channels when and only when the segments are spatially coincident (3) Detectors for terminations and blobs (doubly-terminated oriented bars) seem to have been found already (Hubel amp Wiesel 1962 1968) Interestingly Schiller et al (1976a) found that even some simple cells are stopped Our scheme is consistent with this since it requires such detectors a t a very early stage
The concept of an edge has a partly visual and partly physical meaning One of our main purposes in this article is to make explicit this dual dependence our definition of an edge rests lightly on the early assumptions of theorem 1 about directional derivatives and heavily on the constraint of spatial localizatjon
Our theory is based on two main ideas First one simplifies the detection of intensity changes by dealing with the image separately a t different resolutions The detection process can then be based on finding zero-crossings in a second derivative operator which in practice can be the (non-oriented) Laplacian The representation a t this point consists of zero-crossing segments and their slopes This representation is probably complete and is therefore in principle invertible This had previously been given only an empirical demonstration by Marr and by R Woodham (see Marr 1978 fig 7)
The subsequent step of combining information from different channels into a single description rests on the second main idea of the theory which we formu- lated as the spatial coincidence assumption Physical edges will produce roughly coincident zero-crossings in channels of nearby sizes The spatial coincidence assumption asserts that the converse of this is true that is the coincidence of zero-
212 D Marr and E Hildreth
crossings is sufficient evidence for the existence of a real physical edge If the zero-crossings in one channel are not consistent with those in the others they are probably caused by different physical phenomena so descriptions need to be formed from both sources and kept somewhat separate
Finally the basic idea that some simple cells detect and represent zero-crossing segments and that this is carried out simultaneously a t different scales has some implications for Marr amp Poggios (1979)stereo theory According to various neuro- physiological studies (Barlow et al 1967 Poggio amp Fischer 1978 von der Heydt et al 1978) there exist disparity sensitive simple cells The existence of such cells is consisten6 with our suggestion that they detect zero-crossing segments but not with the idea that they perform a linear convolution equivalent to a directional derivative since it is the primitive symbolic descriptions provided by zero-crossing segments that need to be matched between images not the raw convolu- tion values
We thank K Nishihara T Poggio and S Ullman for their illuminating and helpful comments This work was conducted at the Artificial Intelligence Labora- tory a Massachusetts Institute of Technology research program supported in part by the Advanced Research Projects Agency of the Department of Defence and monitored by the Office of Naval Research under contract number N00014- 75-C-0643 D M was also supported by NSF contract number 77-07569-MCS
Alpern M Rushton W A H amp Torii S 1970 The size of rod signals J Physiol Lond 206 193-208
Atkinson J amp Campbell F W 1974 The effect of phase on the perception of compound gratings Vis ion Res 14 159-162
Barlow H B 1969 Pattern recognition and the responses of sensory neurons Ann N Y Acad Xci 156 872-881
Barlow H B 1979 Reconstructing the visual image in space and time Nature Lond 279 189-190
Barlow H B Blakemore C amp Pettigrew J D 1967 The neural mechanism of binocular depth discrimination J Physiol Lond 193 327-342
Bracewell R 1965 T h e Fourier transform and i ts applications New York MacGraw-Hill Burton G JNagshineh S amp Ruddock K H 1977 Processing by the human visual system
of the light and dark contrast components of the retinal image Biol Cybernetics 28 1-9 Burton G J amp Ruddock K H 1978 Visual adaptation to patterns containing two-
dimensional spatial structure Vis ion Res 18 93-99 Campbell F W amp Robson J G 1968 Applications of Fourier analysis to the visibility of
gratings J Physiol Lond 197 551-556 Cleland B G Dubin N W amp Levick W R 1971 Sustained and transient neurones in the
cats retina and lateral geniculate nucleus J Physiol Lond 217 473-496 Cowan J D 1977 Some remarks on channel bandwidths for visual contrast detection
Neurosci Res Prog Bull 15 492-517 Crick F H C Narr D amp Poggio T 1980 An information processing approach to under-
standing the visual cortex To appear in the NRP symposium T h e cerebral cortex (ed F 0 Schmidt amp F G Worden)
213 The raw primal sketch
De Valois K K 1977a Spatial frequency adaptation can enhance contrast sensitivity Vis ion Res 17 1057-1065
De Valois K K 1977 b Independence of black and white phase-specific adaptation Vis ion Res 17 209-215
Enroth-Cugell C amp Robson J G 1966 The contrast sensitivity of retinal ganglion cells of the cat J Physiol Lond 187 517-552
Graham N 1977 Visual detection of aperiodic spatial stimuli by probability summation among narrowband channels Vis ion Res 17 637-652
Harmon L D amp Julesz B 1973 Masking in visual recognition effects of two-dimensional filtered noise Science N Y 180 1194-1 197
von der Heydt R Adorjani Cs Hanny P amp Baumgartner G 1978 Disparity sensitivity and receptive field incongruity of units in the cat striate cortex E s p Bra in Res 31 523-545
Hubel D H amp Wiesel T N 1961 Integrative action in the cats lateral geniculate body J Physiol Lond 155 385-398
Hubel D H amp Wiesel T N 1962 Receptive fields binocular interaction and functional architecture in the cats visual cortex JPhysiol Lond 160 106-154
Hubel D H amp Wiesel T N 1968 Receptive fields and functional architecture of monkey striate cortex JPhysiol Lond 195 215-243
Hubel D H amp Wiesel T N 1974 Uniformity of monkey striate cortex a parallel relation- ship between field size scatter and magnification factor J comp Neurol 158 295-306
Kulikowski J J amp King-Smith P E 1973 Spatial arrangement of line edge and grating detectors revealed by subthreshold summation Vis ion Res 13 1455-1478
Leipnik R 1960 The extended entropy uncertainty principle I n f Control 3 18-25 Logan B F J r 1977 Information in the zero-crossings of bandpass signals Bell Sys t tech
J 56 487-510 Macleod I D G amp Rosenfeld A 1974 The visibility of gratings spatial frequency channels
or bar-detecting units Vis ion Res 14 909-915 Maffei L amp Fiorentini A 1 g 7 z a Process of synthesis in visual perception Nature Lond
240 479-481 Maffei L amp Fiorentini A 1g7zb Retinogeniculate convergence and analysis of contrast
J Neurophysiol 35 65-72 Maffei L amp Fiorentini A 1977 Spatial frequency rows in the striate visual cortex Vis ion
Res 17 257-264 Marr D 1970 A theory for cerebral neocortex Proc R Soc Lond B 176 161-234 Marr D 1976a Analyzing natural images a computational theory of texture vision Cold
Spr ing Harbor S y m p quant Biol 40 647-662 Marr D 19763 Early processing of visual information Phi l T rans R Soc Lond B 275
483-524 Marr D 1978 Representing visual information AAAS 143rd Annual Meeting Sym-
posium on Some mathematical questions in biology February 1977 Published in Lectures o n mathematics in the life sciences 10101-1 80 Also available as M I T AI Lab Memo 41 5
Marr D amp Poggio T 1979 A computational theory of human stereo vision Proc R Soc Lond B 204 301-328
Marr D Poggio T amp Ullman S 1979 Bandpass channels zero-crossings and early visual information processing J opt Soc Am 69 914r916
Marr D amp Ullman S 1979 Directional selectivity and its use in early visual processing (In preparation )
Mayhew J E W amp Frisby J P 1978 Suprathreshold contrast perception and complex random textures Vis ion Res 18 895-897
Nakayama K amp Roberts D J 1972 Line-length detectors in the human visual system evidence from selective adaptation Iision Res 12 1709-1713
Peichl L amp Wassle H 1979 Size scatter and coverage of ganglion cell receptive field centres in the cat retina JPhysiol Lond 291 117-141
Poggio G F amp Fischer B 1978 Binocular interaction and depth sensitivity of striate and prestriate neurons of the behaving rhesus monkey J Neurophysiol 40 1392-1405
214 D Marr and E Hildreth
Pollen D A Lee J R amp Taylor J H 1971 HOW does the striate cortex begin the recon- struction of the visual world Science N P 173 74-77
Ratliff F 1965 Mach bands quantitative studies on neural networks in the retina San Francisco Holden-Day
Rodieck R W amp Stone J 1965 Analysis of receptive fields of cat retinal ganglion cells JNeurophysiol 28 833-849
Rosenfeld A amp Kak A C 1976 Digital picture processing New York Academic Press Sachs M B Nachmias J amp Robson J G 1971 Spatial-frequency channels in human
vision J opt Soc Am 61 1176-1186 Shapley R M amp Tolhurst D J 1973 Edge detectors in human vision J Physiol Lond
229 165-183 Schiller P H Finlay B L amp Volman S F 1976a Quantitative studies of single-cell
properties in monkey striate cortex I Spatiotemporal organization of receptive fields J Neurophysiol 39 1288-1319
Schiller P H Finlay B L amp Volman S F 1976b Quantitative studies of single-oell properties in monkey striate cortex 11 Orientation specificity and ocular dominance JNeurophysiol 39 1320-1333
Ullman S 1976 On visual detection of light sources Biol Cybernetics 21 205-212 Westheimer G amp McKee S P 1977 Spatial configurations for visual hyperacuity Vision
Res 17 941-947 Wilson H R amp Bergen J R 1979 A four mechanism model for spatial vision Vision Res
19 19-32 Wilson H R amp Giese S C 1977 Threshold visibility of frequency gradient patterns Vision
Res 17 1177-1190
Let I be an open line segment of the y-axis containing the origin 0 Suppose that f(x y) is twice continuously differentiable and that N(1) is an open two- dimensional neighbourhood of I Assume that i32fi3x2 = 0 on I Then if i3fi3y is constant in N(I) the slope of the second directional derivative taken perpendicular to I (ie the slope of i32fi3x2) is greater than the slope of the zero-crossing along any other line through 0
Proof
Consider the line segment Q = (r cos 8 r sin 8) for fixed 8 and values of r sufficiently small that Q lies entirely within N(1) (see figure 10) Now writing fxx for i32fi3x2 etc we have
(a2faQ2)= (f cos2 8 +fx 2 sin 8 cos 8 +f sin2O) B
since the condition of the theorem that f be constant implies that f and f are both zero As required therefore the above quantity is zero a t r = 0 and has maximum slope when 8 = 0
The raw primal sketch
FIGURE10 Diagram for theorems 1and 2 1is a segment of the y-axis containing the origin N(1)is a neighbourhood of it Provided that afay is constant in N(l) theorem 1 states that the orientation of the line of zero-crossings is perpendicular to the orientation a t which the zero-crossings have maximum slope
THEOREM2
Let f (x y) be a real-valued twice continuously differelltiable function on the plane Let 1 be an open line segment along the axis x = 0 Then the two conditions
(i) V2f = 0 on I
and (ii) a2fax2 = 0 on I
are equivalent if and only if f(O y) is constant or linear on I
Proof
If f(0 y) is linear on I a2fay2 = 0 on 1 Hence V2f = 0 there implies that a2fax2 = 0 on 1 too
Conversely if a2fax2 = V2f = 0 on I then a2fay2 = 0 on Z and so f (0 y) varies a t most linearly on I
APPENDIXB
Doas and V2G v2G is the limit of a DOG
Wilsons Doa function may be written
216 D Marr and E Hildreth
where a and ai are the excitatory and inhibitory space constants Writing a = a and ai = a+65 the right hand side varies with
( l a ) exp ( -x22a2)- [ l ( a + 6a)] exp [- x22(a+6g)2]
= 6a (aau) (IU exp [- x22v2]) (4)
This derivative is equal to - (la2-x2a4) exp ( -x22a2) which equals G up to a constant (text equation 5) )
Approximation of V2Qby a DOG
The function
DOG (a5)= [1(2n)+ael exp ( -x22d)- [1(2n)gflil exp ( -x22a) ( 5 )
has Fourier transform w
DOG (w) = exp ( -a w22)-exp ( -cw22) (6)
Notice that D ~ G(w) behaves like w2 for values of w that are small compared with cr and ai so that these filters in common with V2G approximate a second derivative operator
The problem with using a DOG to approximate V2G is to find a space constant that keeps the bandwidth of the filter small and yet allows the filter adequate sensitivity for clearly as the space constants approach one another the contri- butions of the excitatory and inhibitory components become identical and the sensitivity of the filter is reduced
The bandwidths a t half sensitivity and a t half power and the peak sensitivity all depend together on the value of aiae in a way that is shown in figure 11 From this we see that (i) the bandwidth a t half sensitivity increases very slowly up to about aiae = 16 increases faster from there to CT~CT= 30 and is thereafter approximately constant (ii) the peak sensitivity of the filter is desultory for small CT~CTreaching about 33 at CT~CT= 16 Since our aim is to create a narrow bandpass differential operator tve should choose CT~CTto minimize the bandwidth Since the bandwidth is approximately constant for CT~CTlt 16 and since sensitivity is low there the minimal value one would in practice choose for aa is around 16 giving a half-sensitivity bandwidth of 18 octaves and a half power bandwidth of 13 octaves
The raw primal sketch
FIGURE 11 The values of certain parameters associated with difference-of-Gaussian (DOG)
masks with excitatory and inhibitory space constants a and a (a )For various values of auwe show the half-sensitivity bandwidth ( + ) and the half-power bandwidth (a)of the filter In ( b )is shown its peak sensitivity in the Fourier plane (The peak sensitivity of the excitatory component alone equals 100 on this scale) (c) The arguments in the appendix show that the best engineering approximation to VaG using a DOG occurs with aiuearound 16 In figure (c) this particular Doa is shown dotted against the operator V20 with the appropriate a The two profiles are very similar
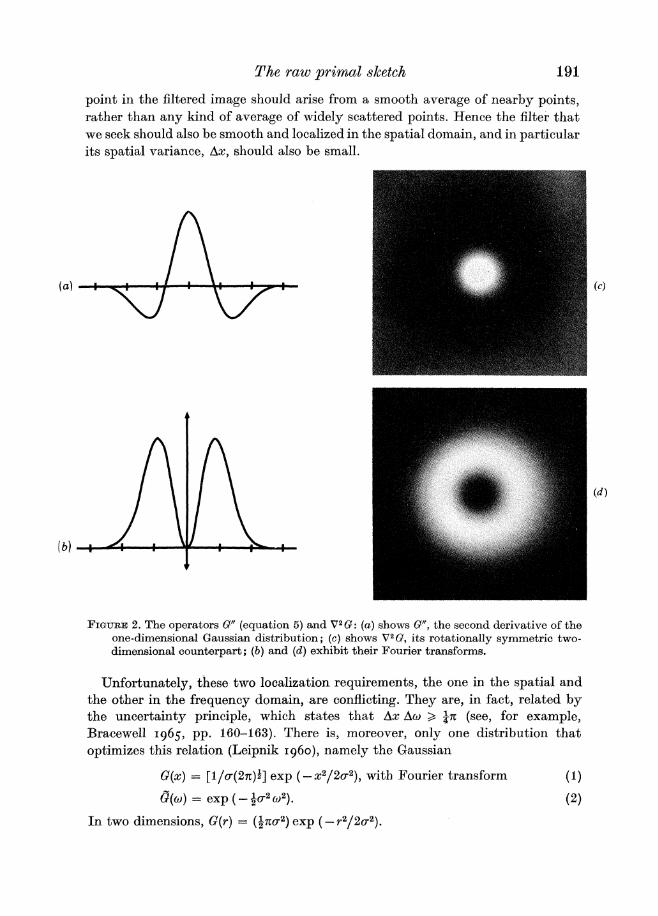
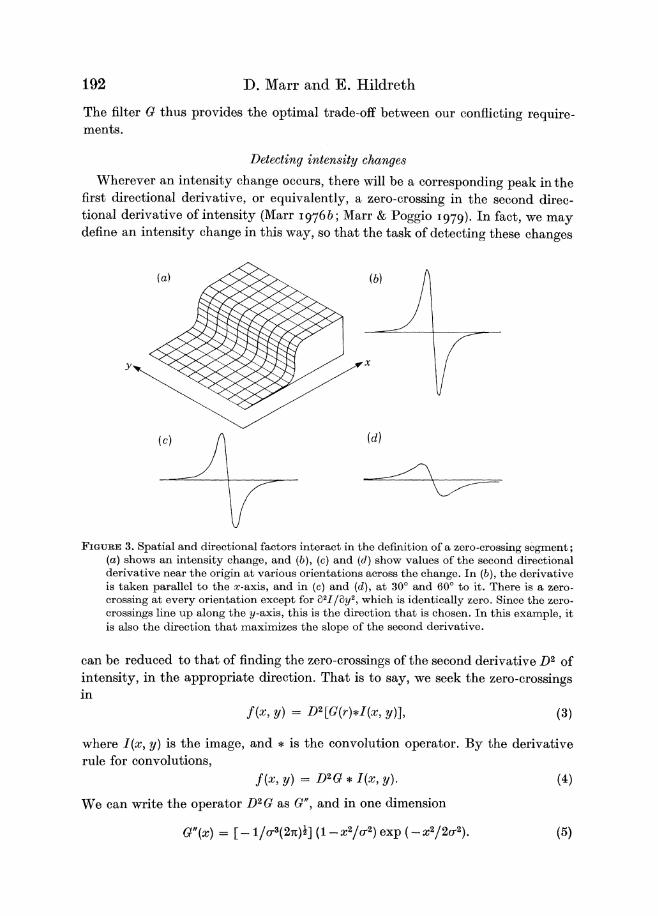
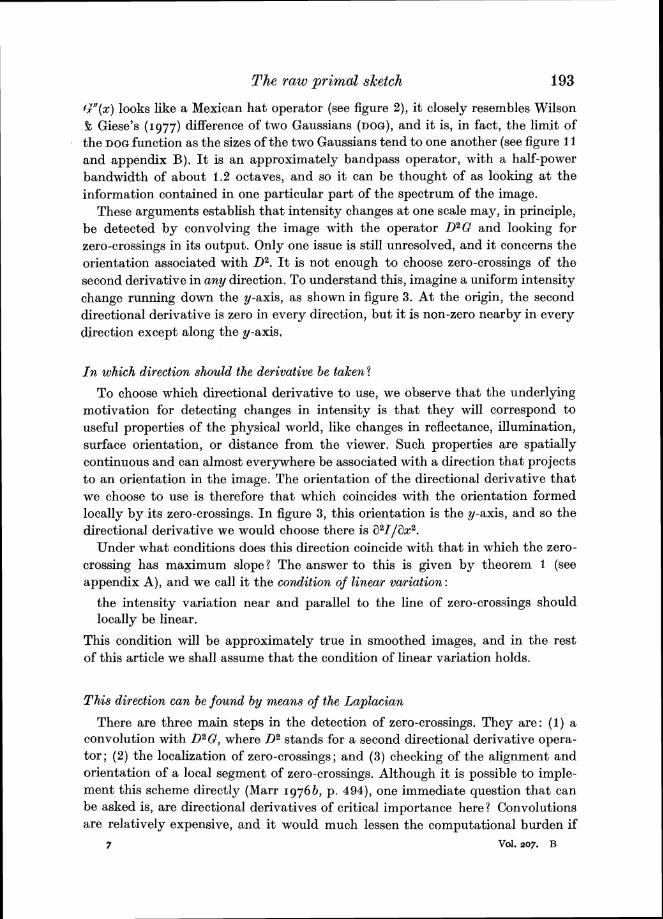
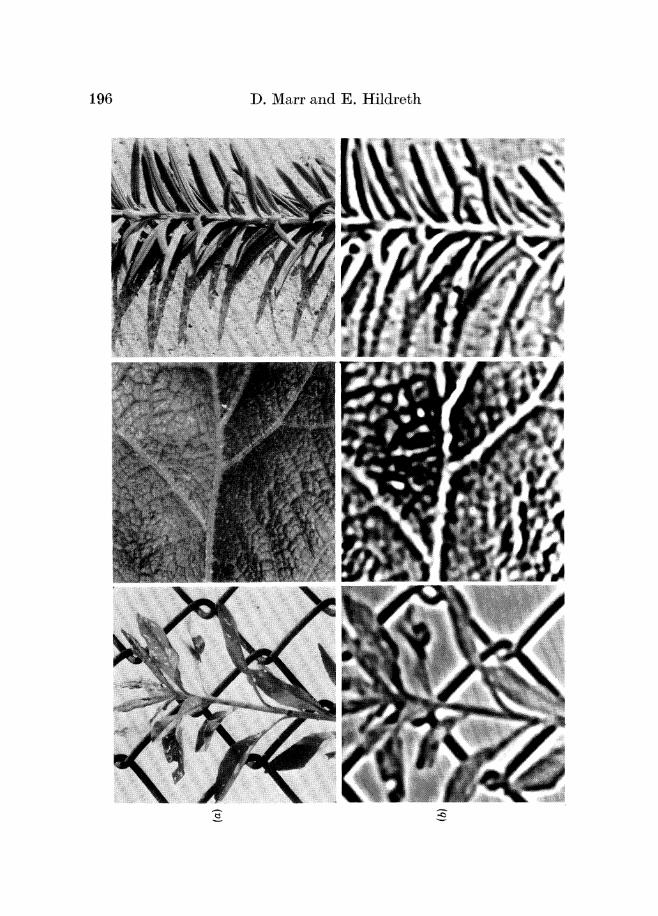
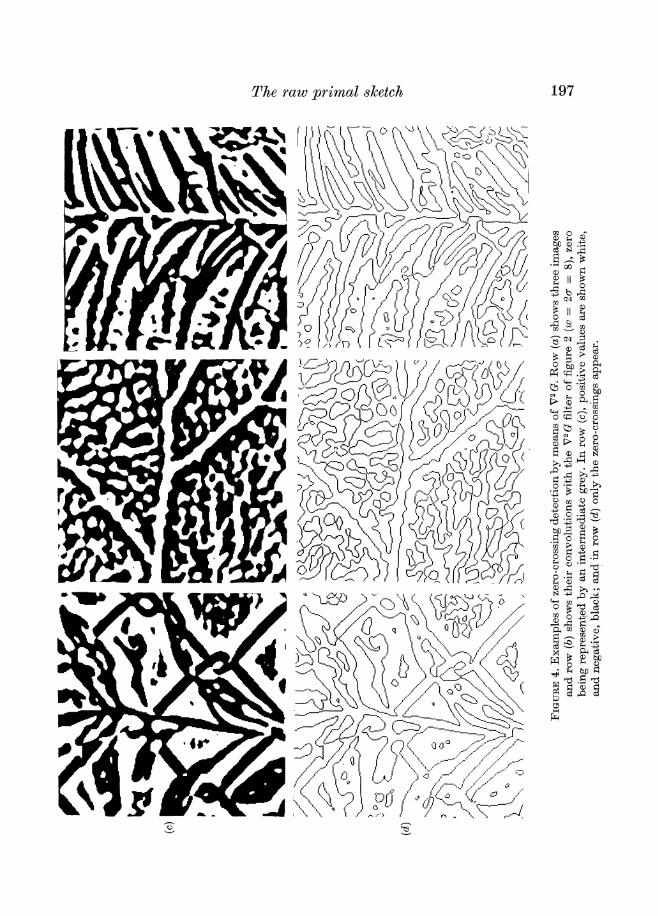
The raw primal sketch
198 D Marr and E Hildreth (a) ( b )
FIGURE5 Comparison of the performance of V2G with that of similar filters Column (a ) shows an image its convolution with V2G and the resulting signed zero-crossings Column (b) contains the same sequence but for the pure one-octave bandpass filter shown with its Fourier transform a t the top of the column The zero-crossing array contains echoes of the strong edges in the image Columns (c) and ((1) exhibit the same
----
The raw primal sketch ( d )
lt (J$6(JJ(-(-- 1- $yd 9 amp
L)(
I) --d
~j
I
_ -1
------7I)-J ----ltc-L_
6$lt -- ----i y ----c-
---1
kf-0-----ltI
1 x ----- I- -I
-lt2----gt_I ----- I t
-gt -
-- ---2
-7tlt--
gt (- s
gt -- analysis of another image except that here V2G is compared with a square-wave approximation to the second derivative The widths of the central excitatory regions of the filters are the same for each comparison pair being 12 for (a )and ( b ) and 18 for (c) and (d) The square-wave filter sees relatively few zero-crossings
200 D Marr and E Hildreth
appear white and very negative ones black I n the third row all positive values appear completely white and all negative ones are black and the fourth row shows just the loci of zero values It will be observed that these delineate well the visible edges in the images (See the legend for more details) It remains only to break the zero value loci into oriented line segments
It is interesting to compare the zero-crossings found by means of V2G with those found by means of similar operators that according to our arguments are not optimal Our choice of the Gaussian filter was based on the requirements of simul- taneous localization in the frequency and spatial domains We therefore show examples in which each of these requirements is severely violated An ideal one- octave bandpass filter satisfies the localization requirement in the frequency domain but violates it in the spatial domain The reason is that strict band- limiting gives rise to sidelobes in the spatial filter and the consequence of these is that in the zero-crossing image strong intensity changes give rise to echoes as well as to the directly corresponding zero-crossings (see figure 5) These echoes have no direct physical correlate and are therefore undesirable for early visual processing
On the other hand if one cuts off the filter in the spatial domain one acquires sidelobes in the frequency domain Figure 5 also shows a square-wave approxi- mation to the second derivative operator together with an example of the zero- crossings to which i t gives rise This operator sees fewer zero-crossings essentially because i t is averaging out the changes that occur over a wider range of scales
Interestingly Rosenfeld amp Kak (1976 pp 281-4) discuss the Laplacian in relation to edge detection but they do not report its having been used very effectively One reason for this is that i t is not very effective unless i t is used in a band-limited situation and one uses its zero-crossings and these ideas do not appear in the computer vision literature (see for example Rosenfeld amp Kak 1976 fig 10 for how the Laplacian has previously been used) I n fact the idea of using narrow bandpass differential operators did not appear until the human stereo theory of Marr amp Poggio (1979) which was also the first theory to depend primarily on zero-crossings
Another more practical reason why edge-detecting operators have previously been less than optimally successful in computer vision is that most current operators examine only a very small part of the image their receptive fields are of the order of 10 to 20 image points a t most This contrasts sharply with the smallest of Wilsons four psychophysical channels the receptive field of which must cover over 500 foveal cones (see figure 4)
Finally notice that G and hence V2G is approximately a second derivative operator because its Fourier transform is -4n2w2 exp ( -a2w2) which behaves like -w2 near the origin
201 The raw primal sketch
FIGURE6 The image (a)has been convolved with V2G having w = 2rr = 6 12 and 24 pixels These filters span approximately the range of filters that operate in the human fovea I n (b) ( c ) and (d) are shown the zero-crossings thus obtained Notice the h e detail picked up by the smallest This set of figures neatly poses our next problem how does one combine all this information into a single description
COMBININGI N F O R M A T I O N F R O M DIFFERENT CHANNELS
The signals transmitted through channels that do not overlap in the Fourier domain will be generally unrelated unless the underlying signal is constrained The critical question for us here is therefore (and we are indebted to T Poggio for conversations on this point) what additional information needs to be taken into account when we consider how to combine information from the different channels to form a primitive description of the image In other words are there any general physical constraints on the structure of the visual world that allow us to place valid restrictions on the way in which information from the different channels may be combined Figure 6 illustrates the problem that we have to solve
The spatial coincidence assumption
The additional information that we need here comes from the constraint of spatial localization which we defined in the previous section It states that the physical phenomena that give rise to intensity changes in the image are spatially
202 D Marr and E Hildreth
localized Since it is these changes that produce zero-crossings in the filtered images it follows that if a discernible zero-crossing is present in a channel centred on wavelength Ao there should be a corresponding zero-crossing a t the same spatial location in channels for wavelengths A gt A If this ceases to be true a t some wavelength A gt A it will be for one of two reasons either (a) two or more local intensity changes are being averaged together in the larger channel or (b) two independent physical phenomena are operating to produce intensity changes in the same region of the image but a t different scales An example of situation (a) would be a thin bar whose edges will be accurately located by small channels but not by large ones Situations of this kind can be recognized by the presence of two nearby zero-crossings in the smaller channels An example of situation (b) would be a shadow superimposed on a sharp reflectance change and it can be recognized if the zero-crossings in the larger channels are displaced relative to those in the smaller If the shadow has exactly the correct position and orientation the loca- tions of the zero-crossings may not contain enough information to separate the two physical phenomena but in practice this situation will be rare
We can therefore base the parsing of sets of zero-crossing segments from dif- ferent V2G channels on the following assumption which we call the spatial coincidence assumption
If a zero-crossing segment is present in a set of independent V2G channels over a contiguous range of sizes and the segment has the same positioil and orientation in each channel then the set of such zero-crossing segments may may be taken to indicate the presence of an intensity change in the image that is due to a single physical phenomenon (a change in reflectance illumina- tion depth or surface orientation)
I n other words provided that the zero-crossings from independent channels of adjacent sizes coincide they can be taken together If they do not they probably arise from distinct surfaces or physical phenomena It follows that the minimum number of channels required is two and that provided the two channels are reasonably separated in the frequency domain and their zero-crossings agree the combined zero-crossings can be taken to indicate the presence of an edge in the image
The parsing of sets of zero-crossing segments
Figure 6 shows the zero-crossings obtained from two channels whose dimensions are approximately the same as the two sustained channels present a t the fovea in the human visual system (Wilson amp Bergen 1979) We now derive the parsing rules needed for combining zero-crossings from the different channels
Case (1) isolated edges
For an isolated linearly disposed intensity change there is a single zero-crossing present a t the same orientation in all channels above some size that depends upon the channel sensitivity and the spatial extent of the edge This set of zero-
203 The raw primal sketch
crossings may therefore be combined into a symbol that we shall call an edge- segment with the attributes of edge-amplitude and width which we may obtain as follows
Calculation of edge-amplitude Because the assumptions that we have made mean that the type of intensity change involved is a simple one we can in fact use what Marr (1976 figure 1) called the selection criterion according to which one
FIGURE7 Parsing of sets of zero-crossing segments (a) If zero-crossing segments lie close and roughly parallel (as in profile (a) of column 3 above) larger masks cannot be used only the smaller masks There are four possible configurations shown in (1)-(4) and the figure represents the way in which the contrast changes across the edge Each of these cases needs to be detected separately (b) If the bar- or edge-segments are terminated special descriptors are required Doubly terminated bars with I lt 3w are called blobs and the other assertions are labelled terminations These are illustrated here for one contrast sign Termination assertions may mark only a discontinuity in edge orientation but it is often useful later on to have such positions explicitly available
selects the smallest channel to which the intensity change is essentially indis- tinguishable from a step function and uses that channel alone to estimate the contrast by means of the amplitude v derived above If one has just two indepen- dent channels with amplitudes v and v an approximation to the edge amplitude is J(v+vi)
Calculation of width The width of the edge in this case can also be estimated from the channel selected according to the selection criterion For a narrow channel with central wavelength A the physical notion of width corresponds to the distance over which intensity increases This distance is ampA which is approximately w the width of the central excitatory region of the receptive field associated with the most excited channel (in fact h = nw)
Case ( 2 ) bars
If two parallel edges with opposite contrast lie only a small distance d apart in the image zero-crossings from channels with associated wavelength that exceeds about 2d cannot be relied upon to provide accurate information about the positions
D Marr and E Hildreth
FIGURE8 Combination of information from two channels I n (a)and (b) are shoxvn the zero- crossings obtained from one of the images of figure 4 by means of masks with w = 9 and 18 Because there are no zero-crossings in the larger channel that do not correspond to zero-crossings in the smaller channel the locations of the edges in the combined description also correspond to (a) I n (c) (d) and (e) are shown symbolic representations of the descriptors attached to the locations marked in ( a ) (c) shows the blobs (d)the local orientations assigned to the edge segments and (e) the bars These diagrams show only the spatial information contained in the descriptors Typical examples of the full descriptors are as follows
(BLOB (POSITION 146 21) (EDGE (POSITION 104 23) (BAR (POSITION 118 134) (ORIENTATION 105) (ORIENTATION 120) (ORIENTATION 120) (CONTRAST 76) (CONTRAST -25) (CONTRAST -25) (LENGTH 16) (LENGTH 25) (LENGTH 25) (WIDTH 6)) (WIDTH 4)) (WIDW 4))
The descriptors t o which these correspond are marked with arrows The resolution of this analysis of the image of figure 4 roughly corresponds to what a humanwould see when viewing it from a distance of about 6 f t (183rn)
or contrasts of the edges In these circumstances the larger channels must be ignored and the description formed solely from small channels of which the zero- crossing segments do superimpose An edge can have either positive or negative contrast and so two together give us the four situations shown in figure 7 a There is of course no reason why the two edges should have the same contrast and the contrast of each edge must be obtained individually from the smallest channels
205 The raw primal sketch
(w c d) Two other parameters are useful one is the average orientation of the two zero-crossing segments and the other is their average separation
Our case (2) applies only to situations in which neither zero-crossing segment terminates and they both remain approximately parallel (w or less apart) When the two edges are closer together than w for the smallest available channel the zero-crossings associated with even the smallest channel will not accurately reflect the positions of the two edges they will over estimate the distance between them If the two edges have opposite contrasts that are not too different in absolute magnitude the position of the centre of the line segment so formed in the image will be the midpoint of the two corresponding zero-crossings I n these circum- stances the parameters associated with the line segment will be more reliable than those associated with each individual edge
Case (3) blobs and terminations
It frequently happens that the zero-crossing segments do not continue very far across the image Two parallel segments can merge or be joined by a third seg- ment and in textured images they often form small closed curves (see figure 6) which are quite small compared to the underlying field size Both situations can give rise to anomalous effects a t larger channel sizes and so are best made explicit early on Following Marr (1976b) the closed contours we call BLOBS and assign to them a length width orientation and (average) contrast and the terminations are assigned a position and orientation (see figure 7c)
Remarks
Two interesting practical details have emerged from our implementation First the intensity changes a t each edge of a bar are in practice rarely the same so i t is perhaps more proper to think of the BAR descriptor as a primitive grouping predicate that combines two edges the contrasts of which are specified precisely by the smallest channel Brightness within the area of the bar will of course be constant Secondly i t is often the case that the zero-crossings from the small and from the large masks roughly coincide but those from the small mask weave around much more partly because of the image structure and partly because of noise and the image tesselation Local orientation has little meaning over dis- tances shorter than the width w of the central excitatory region of the V2G filter so if the zero-crossings from the smaller filter are changing direction rapidly locally the orientation derived from the larger mask can provide a more stable and more reliable measure
We have presented specific algorithms for the construction of the raw primal sketch and we now ask whether the human visual system implements these algorithms or something close to them There are two empirically accessible
206 D Marr and E Hildreth
characteristics of our scheme The first concerns the underlying convolutions and zero-crossing segments and the second whether zero-crossing segments from the different channels are combined in the way that we have described
Detection of zero-crossing segments
According to our theory the most economical way of detecting zero-crossing segments requires that the image first be filtered through a t least two independent V2G channels and that the zero-crossings then be found in the filtered outputs These zero-crossings may be divided into short oriented zero-crossing segments
The empirical data
Recent psychophysical work by Wilson amp Giese (1977) FVilson amp Bergen (1979) (see also Macleod amp Rosenfeld 1974) has led to a precise quantitative model of the orientation-dependent spatial-frequency-tuned channels discovered by Campbell amp Robson (1968) At each point in the visual field there are four such channels spanning about three octaves and their peak sensitivity wavelength increases linearly with retinal eccentricity The larger two channels at each point are transient and the smaller two are sustained These channels can be realized by linear units with bar-shaped receptive fields made of the difference of two Gaussian distributions with excitatory to inhibitory space constants in the ratio of 1175 for the sustained and 1 30 for the transient channels (Wilson amp Bergen 1979) The largest receptive field a t each point is about four times the smallest
This state of affairs is consistent with the neurophysiology since Hubel amp Wiesel (1962) originally defined simple cells by the linearity of their response and they reported many bar-shaped receptive fields I n addition simple cell receptive field sizes increase linearly with eccentricity (Hubel amp Wiesel 1974 fig 6a) and the scatter in size a t each location seems to be about 4 1 (Hubel amp Wiesel 1974 fig 7) It is therefore tempting to identify a t least some of the simple cells with the psychophysical channels If so the first obvious way of making the identification is to propose that the simple cells measure the second directional derivatives thus perhaps providing the convolution values from which zero-crossing segments are subsequently detected
There are however various reasons why this proposal can probably be excluded They are
(1) If the simple cells are essentially performing a linear convolution that approximates the second directional derivative why are they so orientation sensitive Three measurements in principle suffice to characterize the second derivative completely and in practice the directional derivatives measured along four orientations are apparently enough for this stage (see Marr 19763 Hildreth in preparation) and yet simple cells divide the domain into about 12 orientations
(2) Scl~illeret al (19763 pp 1324-5) found that the orientation sensitivity of simple cells is relatively independent of the strength of flanking inhibition and
207 The raw primal sketch
of the separation and lengths of the positive and negative subfields of the receptive field of the cell In addition tripartite receptive fields did not appear to be more orientation sensitive than bipartite ones These points provide good evidence that simple cells are not linear devices
(3) If the simple cells perform the convolution what elements find the zero- crossings and implement the spatial part of the computation lining the zero- crossings up with the convolution orientations for example
Wilsons channel data i s consistent with V2G
Wilsons Doa functions are very similar to V2G and probably indistinguishable by means of his experimental technique which yields about 10 accuracy (H G Wilson personal communication) In appendix B we show ( a )that V2G is the limit of the DOG function as gige the ratio of the inhibitory to excitatory space constants tends to unity and (b) that if an approximation to V2G is to be constructed out of the difference of two Gaussian distributions one excitatory and the other inhibitory the optimal choice on engineering grounds for gige is about 16
A specific proposal lateral geniculate X-cells carry V2G+ I and some simple cells detect and represent zero-crossing segments
It is known that retinal ganglion X-cells have receptive fields that are accurately described by the difference of two Gaussian distributions (Rodieck amp Stone 1965 Ratliff 1965 Enroth-Cugell amp Robson 1966) The positive and negative parts are not quite balanced (there is a response to diffuse illumination and i t increases with intensity) and since the ganglion cells have a spontaneous resting discharge they signal somewhat more than just the positive or just the negative part of such a convolution Interestingly there is little scatter in receptive field sizes of X-cells a t a given location in the retina (Peichl amp Wassle 1979)
There is some controversy about the way in which lateral geniculate receptive fields are constructed (cf Maffei amp Fiorentini 1972 b) but i t seems most likely that the on-centre geniculate X-cell fields are formed by combining a small number of on-centre retinal ganglion X-cell fields of which the centres approximately coincide (Cleland et al 1971)It seems likely that the scatter in receptive field size arises in this way since the amount of scatter required to account for the psychophysical findings is only a factor of two in both the X and the Y channels Finally lateral geniculate cells give a smaller response to diffuse illumination than do retinal ganglion cells sometimes giving no response a t all (Hubel amp Wiesel 1961)
These facts lead us to a particularly attractive scheme which for simplicity we present in idealized form
(1) Measurement of V2G The sustained or X-cell geniculate fibres can be thought of as carrying either the positive or the negative part of V2G I where the filter V2G of figure 2 is in practice approximated by a difference
208 D Marr and E Hildreth
of Gaussian convolution operator with centre-to-surround space constants in the ratio 1175 (One should probably think of this as being a convolution on linear intensity values rather than on their logarithms The reason for this is that although the nerve signal in the retina is an adaptation term multi- plied by I(I+K) where I is the incident illumination and K = 800 quanta per receptor per second (Alpern et al 1970) in any given image the ratio of the darkest to the brightest portion rarely exceeds 25 (a local ratio of around
-- (XL r -
AND
----
( a )
FIGURE9 Proposed mechanism whereby some simple cells detect zero-crossing segments I n (a ) if P represents an on-centre geniculate X-cell receptive field and Q an off-centre one then if both are active a zero-crossing Z in the Laplacian passes between them If they are connected to a logical AND gate as shown then the gate will detect the presence of the zero-crossing If several are arranged in tandem as in (b) and also connected by logical ANDS the resulting operation detects an oriented zero-crossing segment within the orientation bounds given roughly by the dotted lines This gives our most primitive model for simple cells Ideally one would like gates such that there is a response only if all (P Q) inputs are active and the magnitude of the response then varies with their sum Marr amp Ullman (1979) extend this model to include directional selectivity
30 is seen as a light source (Ullman 1976)) and over such ranges this function does not depart far from linearity) At each point in the visual field there are two sizes of filter (the minimum required for combining zero-crossings between channels) and these correspond to Wilson amp Bergens (1979) N and S chan-nels The one-dimensional projection of the widths w of the central excitatory regions of these two channels scales linearly with eccentricity from 31 and 62 a t the central fovea
The basic idea behind our model for the detection of zero-crossings rests on the following observations if an on-centre geniculate cell is active a t location P and an off-centre cell is active a t nearby location Q then the value of V2G I passes through zero between P and Q (see figure 9 a ) Hence by combining the signals from P and Q through a logical AND operation one can construct an operator for detecting when a zero-crossing segment (at some unknown orientation) passes
209 The raw primal sketch
between P and Q (figure 9a) By adding nonlinear AND operations in the longitu- dinal direction one can in a similar way construct an operator that detects oriented zero-crossing segments It is easy to see that the pure logical operator of figure 9 b will respond only to zero-crossing segments whose orientations lie within its sensitivity range (shown roughly dotted) We therefore propose
(2) Detection and representation of zero-crossing segments Part of the function of one subclass of simple cells is to detect zero-crossing segments Their re- ceptive fields include the construction shown in figure 9b with the proviso that the non-linearities may be weaker than the pure logical ANUS shown there It is however a critical feature of this model that the (PAND Q) inter-action (figure 9a) across the zero-crossing segment should contain a strong nonlinear component and that the longitudinal interaction (eg between the ends in figure 9b) contains a t least a weak nonlinear component Marr amp Ullmans (1979) full model for simple cells contains this organization but includes additional machinery for detecting the direction of movement of the zero-crossing segment and i t is this that provides a role for the two larger transient channels
(3) Signalling amplitude Ideally the output of the cell should be gated by the logical AND function of (2) but its value should be the average local amplitude v associated with the zero-crossings along the segment As we saw earlier this may be found by measuring the average local value of the slope of the zero-crossings which (in suitable units) is equal to the sum of the inputs to the cell
(4) Sampling density Finally for this scheme to be successful the sampling density of the function V2G I must be great enough to ensure that the zero- crossings may subsequently be localized accurately enough to account for the findings about hyperacuity (see for example Westheimer amp McKee 1977) which means roughly to within 5 This implies an extremely high precision of representation but in layer I V of the monkeys striate cortex there apparently exists a myriad of small centre-surround non-oriented cells (Hubel amp Wiesel 1968) Barlow (1979)and Crick et al (1980) have suggested that these cells may be involved in the reconstruction of the VZG function to an adequate precision for hyperacuity
The empirical consequences of this overall scheme are set out by Marr amp Ullman
(1979) Combination of zero-crossings
Empirical predictions for psychophysics
There are several aspects of our algorithm for combining zero-crossings from different channels that are accessible to psychophysical experiment They are (a) the phase relations (b) combination of zero-crossings from different channels and (c) the special cases that arise when zero-crossings lie close to one another
( I ) Phase relations Our theory predicts that descriptors need exist only for sets
210 D Marr and E Hildreth
of zero-crossings from different channels that coincide spatially (ie have a phase relation of 0 or n)Interestingly Atkinson amp Campbell (1974) superimposed 1 and 3 cyclesldeg sinusoidal gratings of the same orientation and found that the number of perceptual fluctuations per minute (which they called rate of monocular rivalry) was low near the in-phase 0 and out-of-phase n positions but reached a high plateau for intermediate phase positions They concluded (p161) that the visual system contains a device that seems to be designed to respond only to 0 and n phase relation When [it] is active it gives rise to a stable percept that is the sum of the two spatial frequency selective channels (cf also Maffeiamp Eiorentini 1972a) Our theory would predict these results if the additional assumption were made that units exist that represent explicitly the edge segment descriptor formed by combining appropriately arranged zero-crossing segments
(2) The parsing process The main point here is that the description of an edge (its width amplitude and orientation) can be obtained from the (smallest) channel whose zero-crossing there has maximum slope As Marr (19766 pp 496-497) observed this is consistent with Harmon amp Juleszs (1973) finding that noise bands spectrally adjacent to the spectrum of a picture are most effective at suppressing recognition since these have their greatest effect on mask response amplitudes near the important mask sizes It also explains why removal of the middle spatial frequencies from such an image leaves a recognizable image of Lincoln behind a visible graticule (see Harmon amp Julesz 1973) The reason is that the zero-crossings from different mask sizes fail to coincide and the gap in the spectrum means that the small bar descriptors fail to account for this discrepancy Hence the assumption of spatial coincidence cannot be used and the outputs from the different mask sizes are assumed to be due to different physical phenomena Accordingly they give rise to independent descriptions
There is another possible but weaker consequence If one makes the extra assumption that the selection criterion is implemented by inhibitory connections between zero-crossing segment detectors that are spatially coincident and lying adjacent in the frequency domain then one would expect to find an inhibitory interaction between channels a t the cortical orientation-dependent level There is in fact evidence that this occurs (see for example Tolhurst 1972 de Valois
1 9 7 7 ~ ) (3) Bar-detectors Case (2) of our parsing algorithm requires the specific detec-
tion of close parallel zero-crossing segments This requires the existence of units sensitive a t each orientation to one of the four cases (black bar white bar two dark edges two light edges) and sensitive to their width (ie the distance separat- ing the edges) rather than to spatial frequency characteristics of the whole pattern Adaptation studies that lead to these conclusions for white bars and for black bars have recently been published (Burton et al 1977 de Valois 19776) If our algo- rithm is implemented by the human visual system the analogous result should hold for the remaining two cases (see figure 7a)
(4) Blob-detectors and terminations Case (3) of our parsing algorithm requires
The raw primal sketch
the explicit representation of (oriented) blobs and terminations Units that re-present them should be susceptible to psychophysical adaptation and in fact Nakayama amp Roberts (1972) and Burton amp Ruddock (1978) have found evidence for units that are sensitive to bars whose length does not exceed three times the width
Consequences for neurophysiology
There are several ways of implementing the parsing process that we have described but i t is probably not worth setting them out in detail until we have good evidence from psychophysics about the parsing algorithm that is actually used and we know whether simple cells in fact implement the detection of zero-crossing segments Without these pieces of information firm predictions cannot be made but we offer the following suggestions as a possible framework for the neural implementation (1) The four types of bar detectors could be implemented a t the very first simple cell level (along the lines of figure 9 but being fed by three rows of centre-surround cells instead of two) (2) For relatively isolated edges there should exist oriented edge-segment-detecting neurons that combine zero-crossing segment detectors (simple cells) from different channels when and only when the segments are spatially coincident (3) Detectors for terminations and blobs (doubly-terminated oriented bars) seem to have been found already (Hubel amp Wiesel 1962 1968) Interestingly Schiller et al (1976a) found that even some simple cells are stopped Our scheme is consistent with this since it requires such detectors a t a very early stage
The concept of an edge has a partly visual and partly physical meaning One of our main purposes in this article is to make explicit this dual dependence our definition of an edge rests lightly on the early assumptions of theorem 1 about directional derivatives and heavily on the constraint of spatial localizatjon
Our theory is based on two main ideas First one simplifies the detection of intensity changes by dealing with the image separately a t different resolutions The detection process can then be based on finding zero-crossings in a second derivative operator which in practice can be the (non-oriented) Laplacian The representation a t this point consists of zero-crossing segments and their slopes This representation is probably complete and is therefore in principle invertible This had previously been given only an empirical demonstration by Marr and by R Woodham (see Marr 1978 fig 7)
The subsequent step of combining information from different channels into a single description rests on the second main idea of the theory which we formu- lated as the spatial coincidence assumption Physical edges will produce roughly coincident zero-crossings in channels of nearby sizes The spatial coincidence assumption asserts that the converse of this is true that is the coincidence of zero-
212 D Marr and E Hildreth
crossings is sufficient evidence for the existence of a real physical edge If the zero-crossings in one channel are not consistent with those in the others they are probably caused by different physical phenomena so descriptions need to be formed from both sources and kept somewhat separate
Finally the basic idea that some simple cells detect and represent zero-crossing segments and that this is carried out simultaneously a t different scales has some implications for Marr amp Poggios (1979)stereo theory According to various neuro- physiological studies (Barlow et al 1967 Poggio amp Fischer 1978 von der Heydt et al 1978) there exist disparity sensitive simple cells The existence of such cells is consisten6 with our suggestion that they detect zero-crossing segments but not with the idea that they perform a linear convolution equivalent to a directional derivative since it is the primitive symbolic descriptions provided by zero-crossing segments that need to be matched between images not the raw convolu- tion values
We thank K Nishihara T Poggio and S Ullman for their illuminating and helpful comments This work was conducted at the Artificial Intelligence Labora- tory a Massachusetts Institute of Technology research program supported in part by the Advanced Research Projects Agency of the Department of Defence and monitored by the Office of Naval Research under contract number N00014- 75-C-0643 D M was also supported by NSF contract number 77-07569-MCS
Alpern M Rushton W A H amp Torii S 1970 The size of rod signals J Physiol Lond 206 193-208
Atkinson J amp Campbell F W 1974 The effect of phase on the perception of compound gratings Vis ion Res 14 159-162
Barlow H B 1969 Pattern recognition and the responses of sensory neurons Ann N Y Acad Xci 156 872-881
Barlow H B 1979 Reconstructing the visual image in space and time Nature Lond 279 189-190
Barlow H B Blakemore C amp Pettigrew J D 1967 The neural mechanism of binocular depth discrimination J Physiol Lond 193 327-342
Bracewell R 1965 T h e Fourier transform and i ts applications New York MacGraw-Hill Burton G JNagshineh S amp Ruddock K H 1977 Processing by the human visual system
of the light and dark contrast components of the retinal image Biol Cybernetics 28 1-9 Burton G J amp Ruddock K H 1978 Visual adaptation to patterns containing two-
dimensional spatial structure Vis ion Res 18 93-99 Campbell F W amp Robson J G 1968 Applications of Fourier analysis to the visibility of
gratings J Physiol Lond 197 551-556 Cleland B G Dubin N W amp Levick W R 1971 Sustained and transient neurones in the
cats retina and lateral geniculate nucleus J Physiol Lond 217 473-496 Cowan J D 1977 Some remarks on channel bandwidths for visual contrast detection
Neurosci Res Prog Bull 15 492-517 Crick F H C Narr D amp Poggio T 1980 An information processing approach to under-
standing the visual cortex To appear in the NRP symposium T h e cerebral cortex (ed F 0 Schmidt amp F G Worden)
213 The raw primal sketch
De Valois K K 1977a Spatial frequency adaptation can enhance contrast sensitivity Vis ion Res 17 1057-1065
De Valois K K 1977 b Independence of black and white phase-specific adaptation Vis ion Res 17 209-215
Enroth-Cugell C amp Robson J G 1966 The contrast sensitivity of retinal ganglion cells of the cat J Physiol Lond 187 517-552
Graham N 1977 Visual detection of aperiodic spatial stimuli by probability summation among narrowband channels Vis ion Res 17 637-652
Harmon L D amp Julesz B 1973 Masking in visual recognition effects of two-dimensional filtered noise Science N Y 180 1194-1 197
von der Heydt R Adorjani Cs Hanny P amp Baumgartner G 1978 Disparity sensitivity and receptive field incongruity of units in the cat striate cortex E s p Bra in Res 31 523-545
Hubel D H amp Wiesel T N 1961 Integrative action in the cats lateral geniculate body J Physiol Lond 155 385-398
Hubel D H amp Wiesel T N 1962 Receptive fields binocular interaction and functional architecture in the cats visual cortex JPhysiol Lond 160 106-154
Hubel D H amp Wiesel T N 1968 Receptive fields and functional architecture of monkey striate cortex JPhysiol Lond 195 215-243
Hubel D H amp Wiesel T N 1974 Uniformity of monkey striate cortex a parallel relation- ship between field size scatter and magnification factor J comp Neurol 158 295-306
Kulikowski J J amp King-Smith P E 1973 Spatial arrangement of line edge and grating detectors revealed by subthreshold summation Vis ion Res 13 1455-1478
Leipnik R 1960 The extended entropy uncertainty principle I n f Control 3 18-25 Logan B F J r 1977 Information in the zero-crossings of bandpass signals Bell Sys t tech
J 56 487-510 Macleod I D G amp Rosenfeld A 1974 The visibility of gratings spatial frequency channels
or bar-detecting units Vis ion Res 14 909-915 Maffei L amp Fiorentini A 1 g 7 z a Process of synthesis in visual perception Nature Lond
240 479-481 Maffei L amp Fiorentini A 1g7zb Retinogeniculate convergence and analysis of contrast
J Neurophysiol 35 65-72 Maffei L amp Fiorentini A 1977 Spatial frequency rows in the striate visual cortex Vis ion
Res 17 257-264 Marr D 1970 A theory for cerebral neocortex Proc R Soc Lond B 176 161-234 Marr D 1976a Analyzing natural images a computational theory of texture vision Cold
Spr ing Harbor S y m p quant Biol 40 647-662 Marr D 19763 Early processing of visual information Phi l T rans R Soc Lond B 275
483-524 Marr D 1978 Representing visual information AAAS 143rd Annual Meeting Sym-
posium on Some mathematical questions in biology February 1977 Published in Lectures o n mathematics in the life sciences 10101-1 80 Also available as M I T AI Lab Memo 41 5
Marr D amp Poggio T 1979 A computational theory of human stereo vision Proc R Soc Lond B 204 301-328
Marr D Poggio T amp Ullman S 1979 Bandpass channels zero-crossings and early visual information processing J opt Soc Am 69 914r916
Marr D amp Ullman S 1979 Directional selectivity and its use in early visual processing (In preparation )
Mayhew J E W amp Frisby J P 1978 Suprathreshold contrast perception and complex random textures Vis ion Res 18 895-897
Nakayama K amp Roberts D J 1972 Line-length detectors in the human visual system evidence from selective adaptation Iision Res 12 1709-1713
Peichl L amp Wassle H 1979 Size scatter and coverage of ganglion cell receptive field centres in the cat retina JPhysiol Lond 291 117-141
Poggio G F amp Fischer B 1978 Binocular interaction and depth sensitivity of striate and prestriate neurons of the behaving rhesus monkey J Neurophysiol 40 1392-1405
214 D Marr and E Hildreth
Pollen D A Lee J R amp Taylor J H 1971 HOW does the striate cortex begin the recon- struction of the visual world Science N P 173 74-77
Ratliff F 1965 Mach bands quantitative studies on neural networks in the retina San Francisco Holden-Day
Rodieck R W amp Stone J 1965 Analysis of receptive fields of cat retinal ganglion cells JNeurophysiol 28 833-849
Rosenfeld A amp Kak A C 1976 Digital picture processing New York Academic Press Sachs M B Nachmias J amp Robson J G 1971 Spatial-frequency channels in human
vision J opt Soc Am 61 1176-1186 Shapley R M amp Tolhurst D J 1973 Edge detectors in human vision J Physiol Lond
229 165-183 Schiller P H Finlay B L amp Volman S F 1976a Quantitative studies of single-cell
properties in monkey striate cortex I Spatiotemporal organization of receptive fields J Neurophysiol 39 1288-1319
Schiller P H Finlay B L amp Volman S F 1976b Quantitative studies of single-oell properties in monkey striate cortex 11 Orientation specificity and ocular dominance JNeurophysiol 39 1320-1333
Ullman S 1976 On visual detection of light sources Biol Cybernetics 21 205-212 Westheimer G amp McKee S P 1977 Spatial configurations for visual hyperacuity Vision
Res 17 941-947 Wilson H R amp Bergen J R 1979 A four mechanism model for spatial vision Vision Res
19 19-32 Wilson H R amp Giese S C 1977 Threshold visibility of frequency gradient patterns Vision
Res 17 1177-1190
Let I be an open line segment of the y-axis containing the origin 0 Suppose that f(x y) is twice continuously differentiable and that N(1) is an open two- dimensional neighbourhood of I Assume that i32fi3x2 = 0 on I Then if i3fi3y is constant in N(I) the slope of the second directional derivative taken perpendicular to I (ie the slope of i32fi3x2) is greater than the slope of the zero-crossing along any other line through 0
Proof
Consider the line segment Q = (r cos 8 r sin 8) for fixed 8 and values of r sufficiently small that Q lies entirely within N(1) (see figure 10) Now writing fxx for i32fi3x2 etc we have
(a2faQ2)= (f cos2 8 +fx 2 sin 8 cos 8 +f sin2O) B
since the condition of the theorem that f be constant implies that f and f are both zero As required therefore the above quantity is zero a t r = 0 and has maximum slope when 8 = 0
The raw primal sketch
FIGURE10 Diagram for theorems 1and 2 1is a segment of the y-axis containing the origin N(1)is a neighbourhood of it Provided that afay is constant in N(l) theorem 1 states that the orientation of the line of zero-crossings is perpendicular to the orientation a t which the zero-crossings have maximum slope
THEOREM2
Let f (x y) be a real-valued twice continuously differelltiable function on the plane Let 1 be an open line segment along the axis x = 0 Then the two conditions
(i) V2f = 0 on I
and (ii) a2fax2 = 0 on I
are equivalent if and only if f(O y) is constant or linear on I
Proof
If f(0 y) is linear on I a2fay2 = 0 on 1 Hence V2f = 0 there implies that a2fax2 = 0 on 1 too
Conversely if a2fax2 = V2f = 0 on I then a2fay2 = 0 on Z and so f (0 y) varies a t most linearly on I
APPENDIXB
Doas and V2G v2G is the limit of a DOG
Wilsons Doa function may be written
216 D Marr and E Hildreth
where a and ai are the excitatory and inhibitory space constants Writing a = a and ai = a+65 the right hand side varies with
( l a ) exp ( -x22a2)- [ l ( a + 6a)] exp [- x22(a+6g)2]
= 6a (aau) (IU exp [- x22v2]) (4)
This derivative is equal to - (la2-x2a4) exp ( -x22a2) which equals G up to a constant (text equation 5) )
Approximation of V2Qby a DOG
The function
DOG (a5)= [1(2n)+ael exp ( -x22d)- [1(2n)gflil exp ( -x22a) ( 5 )
has Fourier transform w
DOG (w) = exp ( -a w22)-exp ( -cw22) (6)
Notice that D ~ G(w) behaves like w2 for values of w that are small compared with cr and ai so that these filters in common with V2G approximate a second derivative operator
The problem with using a DOG to approximate V2G is to find a space constant that keeps the bandwidth of the filter small and yet allows the filter adequate sensitivity for clearly as the space constants approach one another the contri- butions of the excitatory and inhibitory components become identical and the sensitivity of the filter is reduced
The bandwidths a t half sensitivity and a t half power and the peak sensitivity all depend together on the value of aiae in a way that is shown in figure 11 From this we see that (i) the bandwidth a t half sensitivity increases very slowly up to about aiae = 16 increases faster from there to CT~CT= 30 and is thereafter approximately constant (ii) the peak sensitivity of the filter is desultory for small CT~CTreaching about 33 at CT~CT= 16 Since our aim is to create a narrow bandpass differential operator tve should choose CT~CTto minimize the bandwidth Since the bandwidth is approximately constant for CT~CTlt 16 and since sensitivity is low there the minimal value one would in practice choose for aa is around 16 giving a half-sensitivity bandwidth of 18 octaves and a half power bandwidth of 13 octaves
The raw primal sketch
FIGURE 11 The values of certain parameters associated with difference-of-Gaussian (DOG)
masks with excitatory and inhibitory space constants a and a (a )For various values of auwe show the half-sensitivity bandwidth ( + ) and the half-power bandwidth (a)of the filter In ( b )is shown its peak sensitivity in the Fourier plane (The peak sensitivity of the excitatory component alone equals 100 on this scale) (c) The arguments in the appendix show that the best engineering approximation to VaG using a DOG occurs with aiuearound 16 In figure (c) this particular Doa is shown dotted against the operator V20 with the appropriate a The two profiles are very similar
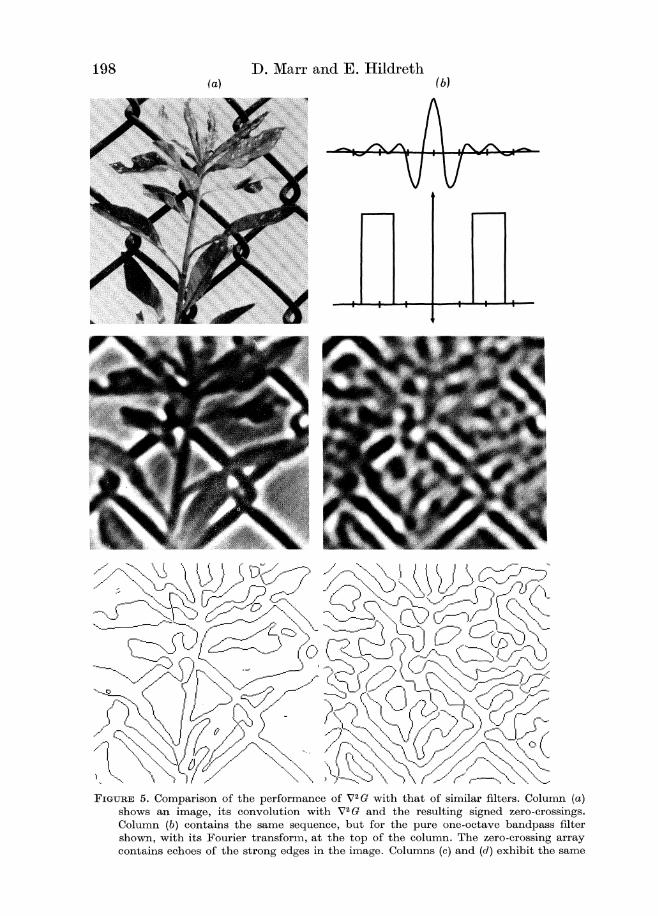
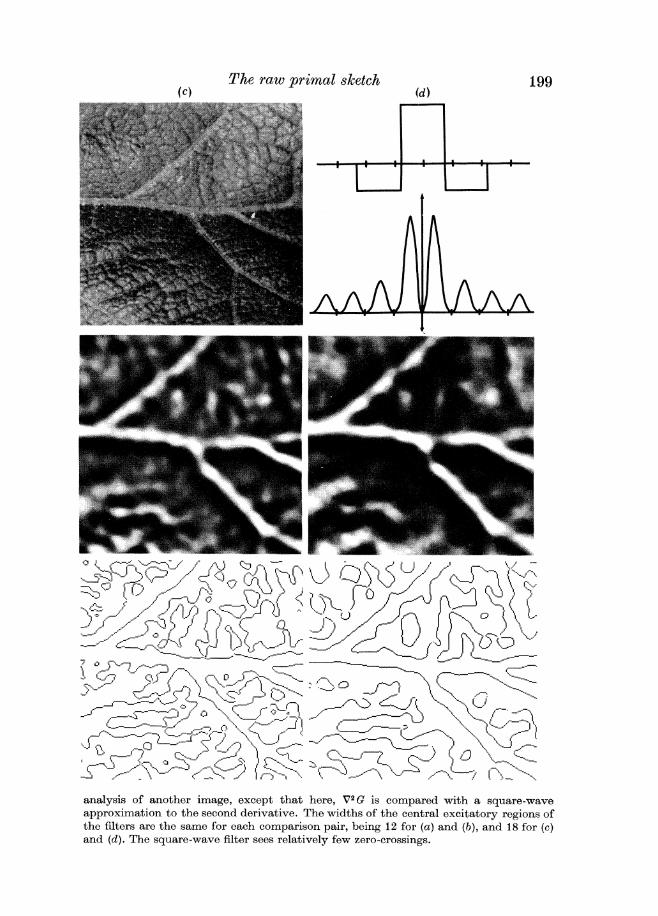
----
The raw primal sketch ( d )
lt (J$6(JJ(-(-- 1- $yd 9 amp
L)(
I) --d
~j
I
_ -1
------7I)-J ----ltc-L_
6$lt -- ----i y ----c-
---1
kf-0-----ltI
1 x ----- I- -I
-lt2----gt_I ----- I t
-gt -
-- ---2
-7tlt--
gt (- s
gt -- analysis of another image except that here V2G is compared with a square-wave approximation to the second derivative The widths of the central excitatory regions of the filters are the same for each comparison pair being 12 for (a )and ( b ) and 18 for (c) and (d) The square-wave filter sees relatively few zero-crossings
200 D Marr and E Hildreth
appear white and very negative ones black I n the third row all positive values appear completely white and all negative ones are black and the fourth row shows just the loci of zero values It will be observed that these delineate well the visible edges in the images (See the legend for more details) It remains only to break the zero value loci into oriented line segments
It is interesting to compare the zero-crossings found by means of V2G with those found by means of similar operators that according to our arguments are not optimal Our choice of the Gaussian filter was based on the requirements of simul- taneous localization in the frequency and spatial domains We therefore show examples in which each of these requirements is severely violated An ideal one- octave bandpass filter satisfies the localization requirement in the frequency domain but violates it in the spatial domain The reason is that strict band- limiting gives rise to sidelobes in the spatial filter and the consequence of these is that in the zero-crossing image strong intensity changes give rise to echoes as well as to the directly corresponding zero-crossings (see figure 5) These echoes have no direct physical correlate and are therefore undesirable for early visual processing
On the other hand if one cuts off the filter in the spatial domain one acquires sidelobes in the frequency domain Figure 5 also shows a square-wave approxi- mation to the second derivative operator together with an example of the zero- crossings to which i t gives rise This operator sees fewer zero-crossings essentially because i t is averaging out the changes that occur over a wider range of scales
Interestingly Rosenfeld amp Kak (1976 pp 281-4) discuss the Laplacian in relation to edge detection but they do not report its having been used very effectively One reason for this is that i t is not very effective unless i t is used in a band-limited situation and one uses its zero-crossings and these ideas do not appear in the computer vision literature (see for example Rosenfeld amp Kak 1976 fig 10 for how the Laplacian has previously been used) I n fact the idea of using narrow bandpass differential operators did not appear until the human stereo theory of Marr amp Poggio (1979) which was also the first theory to depend primarily on zero-crossings
Another more practical reason why edge-detecting operators have previously been less than optimally successful in computer vision is that most current operators examine only a very small part of the image their receptive fields are of the order of 10 to 20 image points a t most This contrasts sharply with the smallest of Wilsons four psychophysical channels the receptive field of which must cover over 500 foveal cones (see figure 4)
Finally notice that G and hence V2G is approximately a second derivative operator because its Fourier transform is -4n2w2 exp ( -a2w2) which behaves like -w2 near the origin
201 The raw primal sketch
FIGURE6 The image (a)has been convolved with V2G having w = 2rr = 6 12 and 24 pixels These filters span approximately the range of filters that operate in the human fovea I n (b) ( c ) and (d) are shown the zero-crossings thus obtained Notice the h e detail picked up by the smallest This set of figures neatly poses our next problem how does one combine all this information into a single description
COMBININGI N F O R M A T I O N F R O M DIFFERENT CHANNELS
The signals transmitted through channels that do not overlap in the Fourier domain will be generally unrelated unless the underlying signal is constrained The critical question for us here is therefore (and we are indebted to T Poggio for conversations on this point) what additional information needs to be taken into account when we consider how to combine information from the different channels to form a primitive description of the image In other words are there any general physical constraints on the structure of the visual world that allow us to place valid restrictions on the way in which information from the different channels may be combined Figure 6 illustrates the problem that we have to solve
The spatial coincidence assumption
The additional information that we need here comes from the constraint of spatial localization which we defined in the previous section It states that the physical phenomena that give rise to intensity changes in the image are spatially
202 D Marr and E Hildreth
localized Since it is these changes that produce zero-crossings in the filtered images it follows that if a discernible zero-crossing is present in a channel centred on wavelength Ao there should be a corresponding zero-crossing a t the same spatial location in channels for wavelengths A gt A If this ceases to be true a t some wavelength A gt A it will be for one of two reasons either (a) two or more local intensity changes are being averaged together in the larger channel or (b) two independent physical phenomena are operating to produce intensity changes in the same region of the image but a t different scales An example of situation (a) would be a thin bar whose edges will be accurately located by small channels but not by large ones Situations of this kind can be recognized by the presence of two nearby zero-crossings in the smaller channels An example of situation (b) would be a shadow superimposed on a sharp reflectance change and it can be recognized if the zero-crossings in the larger channels are displaced relative to those in the smaller If the shadow has exactly the correct position and orientation the loca- tions of the zero-crossings may not contain enough information to separate the two physical phenomena but in practice this situation will be rare
We can therefore base the parsing of sets of zero-crossing segments from dif- ferent V2G channels on the following assumption which we call the spatial coincidence assumption
If a zero-crossing segment is present in a set of independent V2G channels over a contiguous range of sizes and the segment has the same positioil and orientation in each channel then the set of such zero-crossing segments may may be taken to indicate the presence of an intensity change in the image that is due to a single physical phenomenon (a change in reflectance illumina- tion depth or surface orientation)
I n other words provided that the zero-crossings from independent channels of adjacent sizes coincide they can be taken together If they do not they probably arise from distinct surfaces or physical phenomena It follows that the minimum number of channels required is two and that provided the two channels are reasonably separated in the frequency domain and their zero-crossings agree the combined zero-crossings can be taken to indicate the presence of an edge in the image
The parsing of sets of zero-crossing segments
Figure 6 shows the zero-crossings obtained from two channels whose dimensions are approximately the same as the two sustained channels present a t the fovea in the human visual system (Wilson amp Bergen 1979) We now derive the parsing rules needed for combining zero-crossings from the different channels
Case (1) isolated edges
For an isolated linearly disposed intensity change there is a single zero-crossing present a t the same orientation in all channels above some size that depends upon the channel sensitivity and the spatial extent of the edge This set of zero-
203 The raw primal sketch
crossings may therefore be combined into a symbol that we shall call an edge- segment with the attributes of edge-amplitude and width which we may obtain as follows
Calculation of edge-amplitude Because the assumptions that we have made mean that the type of intensity change involved is a simple one we can in fact use what Marr (1976 figure 1) called the selection criterion according to which one
FIGURE7 Parsing of sets of zero-crossing segments (a) If zero-crossing segments lie close and roughly parallel (as in profile (a) of column 3 above) larger masks cannot be used only the smaller masks There are four possible configurations shown in (1)-(4) and the figure represents the way in which the contrast changes across the edge Each of these cases needs to be detected separately (b) If the bar- or edge-segments are terminated special descriptors are required Doubly terminated bars with I lt 3w are called blobs and the other assertions are labelled terminations These are illustrated here for one contrast sign Termination assertions may mark only a discontinuity in edge orientation but it is often useful later on to have such positions explicitly available
selects the smallest channel to which the intensity change is essentially indis- tinguishable from a step function and uses that channel alone to estimate the contrast by means of the amplitude v derived above If one has just two indepen- dent channels with amplitudes v and v an approximation to the edge amplitude is J(v+vi)
Calculation of width The width of the edge in this case can also be estimated from the channel selected according to the selection criterion For a narrow channel with central wavelength A the physical notion of width corresponds to the distance over which intensity increases This distance is ampA which is approximately w the width of the central excitatory region of the receptive field associated with the most excited channel (in fact h = nw)
Case ( 2 ) bars
If two parallel edges with opposite contrast lie only a small distance d apart in the image zero-crossings from channels with associated wavelength that exceeds about 2d cannot be relied upon to provide accurate information about the positions
D Marr and E Hildreth
FIGURE8 Combination of information from two channels I n (a)and (b) are shoxvn the zero- crossings obtained from one of the images of figure 4 by means of masks with w = 9 and 18 Because there are no zero-crossings in the larger channel that do not correspond to zero-crossings in the smaller channel the locations of the edges in the combined description also correspond to (a) I n (c) (d) and (e) are shown symbolic representations of the descriptors attached to the locations marked in ( a ) (c) shows the blobs (d)the local orientations assigned to the edge segments and (e) the bars These diagrams show only the spatial information contained in the descriptors Typical examples of the full descriptors are as follows
(BLOB (POSITION 146 21) (EDGE (POSITION 104 23) (BAR (POSITION 118 134) (ORIENTATION 105) (ORIENTATION 120) (ORIENTATION 120) (CONTRAST 76) (CONTRAST -25) (CONTRAST -25) (LENGTH 16) (LENGTH 25) (LENGTH 25) (WIDTH 6)) (WIDTH 4)) (WIDW 4))
The descriptors t o which these correspond are marked with arrows The resolution of this analysis of the image of figure 4 roughly corresponds to what a humanwould see when viewing it from a distance of about 6 f t (183rn)
or contrasts of the edges In these circumstances the larger channels must be ignored and the description formed solely from small channels of which the zero- crossing segments do superimpose An edge can have either positive or negative contrast and so two together give us the four situations shown in figure 7 a There is of course no reason why the two edges should have the same contrast and the contrast of each edge must be obtained individually from the smallest channels
205 The raw primal sketch
(w c d) Two other parameters are useful one is the average orientation of the two zero-crossing segments and the other is their average separation
Our case (2) applies only to situations in which neither zero-crossing segment terminates and they both remain approximately parallel (w or less apart) When the two edges are closer together than w for the smallest available channel the zero-crossings associated with even the smallest channel will not accurately reflect the positions of the two edges they will over estimate the distance between them If the two edges have opposite contrasts that are not too different in absolute magnitude the position of the centre of the line segment so formed in the image will be the midpoint of the two corresponding zero-crossings I n these circum- stances the parameters associated with the line segment will be more reliable than those associated with each individual edge
Case (3) blobs and terminations
It frequently happens that the zero-crossing segments do not continue very far across the image Two parallel segments can merge or be joined by a third seg- ment and in textured images they often form small closed curves (see figure 6) which are quite small compared to the underlying field size Both situations can give rise to anomalous effects a t larger channel sizes and so are best made explicit early on Following Marr (1976b) the closed contours we call BLOBS and assign to them a length width orientation and (average) contrast and the terminations are assigned a position and orientation (see figure 7c)
Remarks
Two interesting practical details have emerged from our implementation First the intensity changes a t each edge of a bar are in practice rarely the same so i t is perhaps more proper to think of the BAR descriptor as a primitive grouping predicate that combines two edges the contrasts of which are specified precisely by the smallest channel Brightness within the area of the bar will of course be constant Secondly i t is often the case that the zero-crossings from the small and from the large masks roughly coincide but those from the small mask weave around much more partly because of the image structure and partly because of noise and the image tesselation Local orientation has little meaning over dis- tances shorter than the width w of the central excitatory region of the V2G filter so if the zero-crossings from the smaller filter are changing direction rapidly locally the orientation derived from the larger mask can provide a more stable and more reliable measure
We have presented specific algorithms for the construction of the raw primal sketch and we now ask whether the human visual system implements these algorithms or something close to them There are two empirically accessible
206 D Marr and E Hildreth
characteristics of our scheme The first concerns the underlying convolutions and zero-crossing segments and the second whether zero-crossing segments from the different channels are combined in the way that we have described
Detection of zero-crossing segments
According to our theory the most economical way of detecting zero-crossing segments requires that the image first be filtered through a t least two independent V2G channels and that the zero-crossings then be found in the filtered outputs These zero-crossings may be divided into short oriented zero-crossing segments
The empirical data
Recent psychophysical work by Wilson amp Giese (1977) FVilson amp Bergen (1979) (see also Macleod amp Rosenfeld 1974) has led to a precise quantitative model of the orientation-dependent spatial-frequency-tuned channels discovered by Campbell amp Robson (1968) At each point in the visual field there are four such channels spanning about three octaves and their peak sensitivity wavelength increases linearly with retinal eccentricity The larger two channels at each point are transient and the smaller two are sustained These channels can be realized by linear units with bar-shaped receptive fields made of the difference of two Gaussian distributions with excitatory to inhibitory space constants in the ratio of 1175 for the sustained and 1 30 for the transient channels (Wilson amp Bergen 1979) The largest receptive field a t each point is about four times the smallest
This state of affairs is consistent with the neurophysiology since Hubel amp Wiesel (1962) originally defined simple cells by the linearity of their response and they reported many bar-shaped receptive fields I n addition simple cell receptive field sizes increase linearly with eccentricity (Hubel amp Wiesel 1974 fig 6a) and the scatter in size a t each location seems to be about 4 1 (Hubel amp Wiesel 1974 fig 7) It is therefore tempting to identify a t least some of the simple cells with the psychophysical channels If so the first obvious way of making the identification is to propose that the simple cells measure the second directional derivatives thus perhaps providing the convolution values from which zero-crossing segments are subsequently detected
There are however various reasons why this proposal can probably be excluded They are
(1) If the simple cells are essentially performing a linear convolution that approximates the second directional derivative why are they so orientation sensitive Three measurements in principle suffice to characterize the second derivative completely and in practice the directional derivatives measured along four orientations are apparently enough for this stage (see Marr 19763 Hildreth in preparation) and yet simple cells divide the domain into about 12 orientations
(2) Scl~illeret al (19763 pp 1324-5) found that the orientation sensitivity of simple cells is relatively independent of the strength of flanking inhibition and
207 The raw primal sketch
of the separation and lengths of the positive and negative subfields of the receptive field of the cell In addition tripartite receptive fields did not appear to be more orientation sensitive than bipartite ones These points provide good evidence that simple cells are not linear devices
(3) If the simple cells perform the convolution what elements find the zero- crossings and implement the spatial part of the computation lining the zero- crossings up with the convolution orientations for example
Wilsons channel data i s consistent with V2G
Wilsons Doa functions are very similar to V2G and probably indistinguishable by means of his experimental technique which yields about 10 accuracy (H G Wilson personal communication) In appendix B we show ( a )that V2G is the limit of the DOG function as gige the ratio of the inhibitory to excitatory space constants tends to unity and (b) that if an approximation to V2G is to be constructed out of the difference of two Gaussian distributions one excitatory and the other inhibitory the optimal choice on engineering grounds for gige is about 16
A specific proposal lateral geniculate X-cells carry V2G+ I and some simple cells detect and represent zero-crossing segments
It is known that retinal ganglion X-cells have receptive fields that are accurately described by the difference of two Gaussian distributions (Rodieck amp Stone 1965 Ratliff 1965 Enroth-Cugell amp Robson 1966) The positive and negative parts are not quite balanced (there is a response to diffuse illumination and i t increases with intensity) and since the ganglion cells have a spontaneous resting discharge they signal somewhat more than just the positive or just the negative part of such a convolution Interestingly there is little scatter in receptive field sizes of X-cells a t a given location in the retina (Peichl amp Wassle 1979)
There is some controversy about the way in which lateral geniculate receptive fields are constructed (cf Maffei amp Fiorentini 1972 b) but i t seems most likely that the on-centre geniculate X-cell fields are formed by combining a small number of on-centre retinal ganglion X-cell fields of which the centres approximately coincide (Cleland et al 1971)It seems likely that the scatter in receptive field size arises in this way since the amount of scatter required to account for the psychophysical findings is only a factor of two in both the X and the Y channels Finally lateral geniculate cells give a smaller response to diffuse illumination than do retinal ganglion cells sometimes giving no response a t all (Hubel amp Wiesel 1961)
These facts lead us to a particularly attractive scheme which for simplicity we present in idealized form
(1) Measurement of V2G The sustained or X-cell geniculate fibres can be thought of as carrying either the positive or the negative part of V2G I where the filter V2G of figure 2 is in practice approximated by a difference
208 D Marr and E Hildreth
of Gaussian convolution operator with centre-to-surround space constants in the ratio 1175 (One should probably think of this as being a convolution on linear intensity values rather than on their logarithms The reason for this is that although the nerve signal in the retina is an adaptation term multi- plied by I(I+K) where I is the incident illumination and K = 800 quanta per receptor per second (Alpern et al 1970) in any given image the ratio of the darkest to the brightest portion rarely exceeds 25 (a local ratio of around
-- (XL r -
AND
----
( a )
FIGURE9 Proposed mechanism whereby some simple cells detect zero-crossing segments I n (a ) if P represents an on-centre geniculate X-cell receptive field and Q an off-centre one then if both are active a zero-crossing Z in the Laplacian passes between them If they are connected to a logical AND gate as shown then the gate will detect the presence of the zero-crossing If several are arranged in tandem as in (b) and also connected by logical ANDS the resulting operation detects an oriented zero-crossing segment within the orientation bounds given roughly by the dotted lines This gives our most primitive model for simple cells Ideally one would like gates such that there is a response only if all (P Q) inputs are active and the magnitude of the response then varies with their sum Marr amp Ullman (1979) extend this model to include directional selectivity
30 is seen as a light source (Ullman 1976)) and over such ranges this function does not depart far from linearity) At each point in the visual field there are two sizes of filter (the minimum required for combining zero-crossings between channels) and these correspond to Wilson amp Bergens (1979) N and S chan-nels The one-dimensional projection of the widths w of the central excitatory regions of these two channels scales linearly with eccentricity from 31 and 62 a t the central fovea
The basic idea behind our model for the detection of zero-crossings rests on the following observations if an on-centre geniculate cell is active a t location P and an off-centre cell is active a t nearby location Q then the value of V2G I passes through zero between P and Q (see figure 9 a ) Hence by combining the signals from P and Q through a logical AND operation one can construct an operator for detecting when a zero-crossing segment (at some unknown orientation) passes
209 The raw primal sketch
between P and Q (figure 9a) By adding nonlinear AND operations in the longitu- dinal direction one can in a similar way construct an operator that detects oriented zero-crossing segments It is easy to see that the pure logical operator of figure 9 b will respond only to zero-crossing segments whose orientations lie within its sensitivity range (shown roughly dotted) We therefore propose
(2) Detection and representation of zero-crossing segments Part of the function of one subclass of simple cells is to detect zero-crossing segments Their re- ceptive fields include the construction shown in figure 9b with the proviso that the non-linearities may be weaker than the pure logical ANUS shown there It is however a critical feature of this model that the (PAND Q) inter-action (figure 9a) across the zero-crossing segment should contain a strong nonlinear component and that the longitudinal interaction (eg between the ends in figure 9b) contains a t least a weak nonlinear component Marr amp Ullmans (1979) full model for simple cells contains this organization but includes additional machinery for detecting the direction of movement of the zero-crossing segment and i t is this that provides a role for the two larger transient channels
(3) Signalling amplitude Ideally the output of the cell should be gated by the logical AND function of (2) but its value should be the average local amplitude v associated with the zero-crossings along the segment As we saw earlier this may be found by measuring the average local value of the slope of the zero-crossings which (in suitable units) is equal to the sum of the inputs to the cell
(4) Sampling density Finally for this scheme to be successful the sampling density of the function V2G I must be great enough to ensure that the zero- crossings may subsequently be localized accurately enough to account for the findings about hyperacuity (see for example Westheimer amp McKee 1977) which means roughly to within 5 This implies an extremely high precision of representation but in layer I V of the monkeys striate cortex there apparently exists a myriad of small centre-surround non-oriented cells (Hubel amp Wiesel 1968) Barlow (1979)and Crick et al (1980) have suggested that these cells may be involved in the reconstruction of the VZG function to an adequate precision for hyperacuity
The empirical consequences of this overall scheme are set out by Marr amp Ullman
(1979) Combination of zero-crossings
Empirical predictions for psychophysics
There are several aspects of our algorithm for combining zero-crossings from different channels that are accessible to psychophysical experiment They are (a) the phase relations (b) combination of zero-crossings from different channels and (c) the special cases that arise when zero-crossings lie close to one another
( I ) Phase relations Our theory predicts that descriptors need exist only for sets
210 D Marr and E Hildreth
of zero-crossings from different channels that coincide spatially (ie have a phase relation of 0 or n)Interestingly Atkinson amp Campbell (1974) superimposed 1 and 3 cyclesldeg sinusoidal gratings of the same orientation and found that the number of perceptual fluctuations per minute (which they called rate of monocular rivalry) was low near the in-phase 0 and out-of-phase n positions but reached a high plateau for intermediate phase positions They concluded (p161) that the visual system contains a device that seems to be designed to respond only to 0 and n phase relation When [it] is active it gives rise to a stable percept that is the sum of the two spatial frequency selective channels (cf also Maffeiamp Eiorentini 1972a) Our theory would predict these results if the additional assumption were made that units exist that represent explicitly the edge segment descriptor formed by combining appropriately arranged zero-crossing segments
(2) The parsing process The main point here is that the description of an edge (its width amplitude and orientation) can be obtained from the (smallest) channel whose zero-crossing there has maximum slope As Marr (19766 pp 496-497) observed this is consistent with Harmon amp Juleszs (1973) finding that noise bands spectrally adjacent to the spectrum of a picture are most effective at suppressing recognition since these have their greatest effect on mask response amplitudes near the important mask sizes It also explains why removal of the middle spatial frequencies from such an image leaves a recognizable image of Lincoln behind a visible graticule (see Harmon amp Julesz 1973) The reason is that the zero-crossings from different mask sizes fail to coincide and the gap in the spectrum means that the small bar descriptors fail to account for this discrepancy Hence the assumption of spatial coincidence cannot be used and the outputs from the different mask sizes are assumed to be due to different physical phenomena Accordingly they give rise to independent descriptions
There is another possible but weaker consequence If one makes the extra assumption that the selection criterion is implemented by inhibitory connections between zero-crossing segment detectors that are spatially coincident and lying adjacent in the frequency domain then one would expect to find an inhibitory interaction between channels a t the cortical orientation-dependent level There is in fact evidence that this occurs (see for example Tolhurst 1972 de Valois
1 9 7 7 ~ ) (3) Bar-detectors Case (2) of our parsing algorithm requires the specific detec-
tion of close parallel zero-crossing segments This requires the existence of units sensitive a t each orientation to one of the four cases (black bar white bar two dark edges two light edges) and sensitive to their width (ie the distance separat- ing the edges) rather than to spatial frequency characteristics of the whole pattern Adaptation studies that lead to these conclusions for white bars and for black bars have recently been published (Burton et al 1977 de Valois 19776) If our algo- rithm is implemented by the human visual system the analogous result should hold for the remaining two cases (see figure 7a)
(4) Blob-detectors and terminations Case (3) of our parsing algorithm requires
The raw primal sketch
the explicit representation of (oriented) blobs and terminations Units that re-present them should be susceptible to psychophysical adaptation and in fact Nakayama amp Roberts (1972) and Burton amp Ruddock (1978) have found evidence for units that are sensitive to bars whose length does not exceed three times the width
Consequences for neurophysiology
There are several ways of implementing the parsing process that we have described but i t is probably not worth setting them out in detail until we have good evidence from psychophysics about the parsing algorithm that is actually used and we know whether simple cells in fact implement the detection of zero-crossing segments Without these pieces of information firm predictions cannot be made but we offer the following suggestions as a possible framework for the neural implementation (1) The four types of bar detectors could be implemented a t the very first simple cell level (along the lines of figure 9 but being fed by three rows of centre-surround cells instead of two) (2) For relatively isolated edges there should exist oriented edge-segment-detecting neurons that combine zero-crossing segment detectors (simple cells) from different channels when and only when the segments are spatially coincident (3) Detectors for terminations and blobs (doubly-terminated oriented bars) seem to have been found already (Hubel amp Wiesel 1962 1968) Interestingly Schiller et al (1976a) found that even some simple cells are stopped Our scheme is consistent with this since it requires such detectors a t a very early stage
The concept of an edge has a partly visual and partly physical meaning One of our main purposes in this article is to make explicit this dual dependence our definition of an edge rests lightly on the early assumptions of theorem 1 about directional derivatives and heavily on the constraint of spatial localizatjon
Our theory is based on two main ideas First one simplifies the detection of intensity changes by dealing with the image separately a t different resolutions The detection process can then be based on finding zero-crossings in a second derivative operator which in practice can be the (non-oriented) Laplacian The representation a t this point consists of zero-crossing segments and their slopes This representation is probably complete and is therefore in principle invertible This had previously been given only an empirical demonstration by Marr and by R Woodham (see Marr 1978 fig 7)
The subsequent step of combining information from different channels into a single description rests on the second main idea of the theory which we formu- lated as the spatial coincidence assumption Physical edges will produce roughly coincident zero-crossings in channels of nearby sizes The spatial coincidence assumption asserts that the converse of this is true that is the coincidence of zero-
212 D Marr and E Hildreth
crossings is sufficient evidence for the existence of a real physical edge If the zero-crossings in one channel are not consistent with those in the others they are probably caused by different physical phenomena so descriptions need to be formed from both sources and kept somewhat separate
Finally the basic idea that some simple cells detect and represent zero-crossing segments and that this is carried out simultaneously a t different scales has some implications for Marr amp Poggios (1979)stereo theory According to various neuro- physiological studies (Barlow et al 1967 Poggio amp Fischer 1978 von der Heydt et al 1978) there exist disparity sensitive simple cells The existence of such cells is consisten6 with our suggestion that they detect zero-crossing segments but not with the idea that they perform a linear convolution equivalent to a directional derivative since it is the primitive symbolic descriptions provided by zero-crossing segments that need to be matched between images not the raw convolu- tion values
We thank K Nishihara T Poggio and S Ullman for their illuminating and helpful comments This work was conducted at the Artificial Intelligence Labora- tory a Massachusetts Institute of Technology research program supported in part by the Advanced Research Projects Agency of the Department of Defence and monitored by the Office of Naval Research under contract number N00014- 75-C-0643 D M was also supported by NSF contract number 77-07569-MCS
Alpern M Rushton W A H amp Torii S 1970 The size of rod signals J Physiol Lond 206 193-208
Atkinson J amp Campbell F W 1974 The effect of phase on the perception of compound gratings Vis ion Res 14 159-162
Barlow H B 1969 Pattern recognition and the responses of sensory neurons Ann N Y Acad Xci 156 872-881
Barlow H B 1979 Reconstructing the visual image in space and time Nature Lond 279 189-190
Barlow H B Blakemore C amp Pettigrew J D 1967 The neural mechanism of binocular depth discrimination J Physiol Lond 193 327-342
Bracewell R 1965 T h e Fourier transform and i ts applications New York MacGraw-Hill Burton G JNagshineh S amp Ruddock K H 1977 Processing by the human visual system
of the light and dark contrast components of the retinal image Biol Cybernetics 28 1-9 Burton G J amp Ruddock K H 1978 Visual adaptation to patterns containing two-
dimensional spatial structure Vis ion Res 18 93-99 Campbell F W amp Robson J G 1968 Applications of Fourier analysis to the visibility of
gratings J Physiol Lond 197 551-556 Cleland B G Dubin N W amp Levick W R 1971 Sustained and transient neurones in the
cats retina and lateral geniculate nucleus J Physiol Lond 217 473-496 Cowan J D 1977 Some remarks on channel bandwidths for visual contrast detection
Neurosci Res Prog Bull 15 492-517 Crick F H C Narr D amp Poggio T 1980 An information processing approach to under-
standing the visual cortex To appear in the NRP symposium T h e cerebral cortex (ed F 0 Schmidt amp F G Worden)
213 The raw primal sketch
De Valois K K 1977a Spatial frequency adaptation can enhance contrast sensitivity Vis ion Res 17 1057-1065
De Valois K K 1977 b Independence of black and white phase-specific adaptation Vis ion Res 17 209-215
Enroth-Cugell C amp Robson J G 1966 The contrast sensitivity of retinal ganglion cells of the cat J Physiol Lond 187 517-552
Graham N 1977 Visual detection of aperiodic spatial stimuli by probability summation among narrowband channels Vis ion Res 17 637-652
Harmon L D amp Julesz B 1973 Masking in visual recognition effects of two-dimensional filtered noise Science N Y 180 1194-1 197
von der Heydt R Adorjani Cs Hanny P amp Baumgartner G 1978 Disparity sensitivity and receptive field incongruity of units in the cat striate cortex E s p Bra in Res 31 523-545
Hubel D H amp Wiesel T N 1961 Integrative action in the cats lateral geniculate body J Physiol Lond 155 385-398
Hubel D H amp Wiesel T N 1962 Receptive fields binocular interaction and functional architecture in the cats visual cortex JPhysiol Lond 160 106-154
Hubel D H amp Wiesel T N 1968 Receptive fields and functional architecture of monkey striate cortex JPhysiol Lond 195 215-243
Hubel D H amp Wiesel T N 1974 Uniformity of monkey striate cortex a parallel relation- ship between field size scatter and magnification factor J comp Neurol 158 295-306
Kulikowski J J amp King-Smith P E 1973 Spatial arrangement of line edge and grating detectors revealed by subthreshold summation Vis ion Res 13 1455-1478
Leipnik R 1960 The extended entropy uncertainty principle I n f Control 3 18-25 Logan B F J r 1977 Information in the zero-crossings of bandpass signals Bell Sys t tech
J 56 487-510 Macleod I D G amp Rosenfeld A 1974 The visibility of gratings spatial frequency channels
or bar-detecting units Vis ion Res 14 909-915 Maffei L amp Fiorentini A 1 g 7 z a Process of synthesis in visual perception Nature Lond
240 479-481 Maffei L amp Fiorentini A 1g7zb Retinogeniculate convergence and analysis of contrast
J Neurophysiol 35 65-72 Maffei L amp Fiorentini A 1977 Spatial frequency rows in the striate visual cortex Vis ion
Res 17 257-264 Marr D 1970 A theory for cerebral neocortex Proc R Soc Lond B 176 161-234 Marr D 1976a Analyzing natural images a computational theory of texture vision Cold
Spr ing Harbor S y m p quant Biol 40 647-662 Marr D 19763 Early processing of visual information Phi l T rans R Soc Lond B 275
483-524 Marr D 1978 Representing visual information AAAS 143rd Annual Meeting Sym-
posium on Some mathematical questions in biology February 1977 Published in Lectures o n mathematics in the life sciences 10101-1 80 Also available as M I T AI Lab Memo 41 5
Marr D amp Poggio T 1979 A computational theory of human stereo vision Proc R Soc Lond B 204 301-328
Marr D Poggio T amp Ullman S 1979 Bandpass channels zero-crossings and early visual information processing J opt Soc Am 69 914r916
Marr D amp Ullman S 1979 Directional selectivity and its use in early visual processing (In preparation )
Mayhew J E W amp Frisby J P 1978 Suprathreshold contrast perception and complex random textures Vis ion Res 18 895-897
Nakayama K amp Roberts D J 1972 Line-length detectors in the human visual system evidence from selective adaptation Iision Res 12 1709-1713
Peichl L amp Wassle H 1979 Size scatter and coverage of ganglion cell receptive field centres in the cat retina JPhysiol Lond 291 117-141
Poggio G F amp Fischer B 1978 Binocular interaction and depth sensitivity of striate and prestriate neurons of the behaving rhesus monkey J Neurophysiol 40 1392-1405
214 D Marr and E Hildreth
Pollen D A Lee J R amp Taylor J H 1971 HOW does the striate cortex begin the recon- struction of the visual world Science N P 173 74-77
Ratliff F 1965 Mach bands quantitative studies on neural networks in the retina San Francisco Holden-Day
Rodieck R W amp Stone J 1965 Analysis of receptive fields of cat retinal ganglion cells JNeurophysiol 28 833-849
Rosenfeld A amp Kak A C 1976 Digital picture processing New York Academic Press Sachs M B Nachmias J amp Robson J G 1971 Spatial-frequency channels in human
vision J opt Soc Am 61 1176-1186 Shapley R M amp Tolhurst D J 1973 Edge detectors in human vision J Physiol Lond
229 165-183 Schiller P H Finlay B L amp Volman S F 1976a Quantitative studies of single-cell
properties in monkey striate cortex I Spatiotemporal organization of receptive fields J Neurophysiol 39 1288-1319
Schiller P H Finlay B L amp Volman S F 1976b Quantitative studies of single-oell properties in monkey striate cortex 11 Orientation specificity and ocular dominance JNeurophysiol 39 1320-1333
Ullman S 1976 On visual detection of light sources Biol Cybernetics 21 205-212 Westheimer G amp McKee S P 1977 Spatial configurations for visual hyperacuity Vision
Res 17 941-947 Wilson H R amp Bergen J R 1979 A four mechanism model for spatial vision Vision Res
19 19-32 Wilson H R amp Giese S C 1977 Threshold visibility of frequency gradient patterns Vision
Res 17 1177-1190
Let I be an open line segment of the y-axis containing the origin 0 Suppose that f(x y) is twice continuously differentiable and that N(1) is an open two- dimensional neighbourhood of I Assume that i32fi3x2 = 0 on I Then if i3fi3y is constant in N(I) the slope of the second directional derivative taken perpendicular to I (ie the slope of i32fi3x2) is greater than the slope of the zero-crossing along any other line through 0
Proof
Consider the line segment Q = (r cos 8 r sin 8) for fixed 8 and values of r sufficiently small that Q lies entirely within N(1) (see figure 10) Now writing fxx for i32fi3x2 etc we have
(a2faQ2)= (f cos2 8 +fx 2 sin 8 cos 8 +f sin2O) B
since the condition of the theorem that f be constant implies that f and f are both zero As required therefore the above quantity is zero a t r = 0 and has maximum slope when 8 = 0
The raw primal sketch
FIGURE10 Diagram for theorems 1and 2 1is a segment of the y-axis containing the origin N(1)is a neighbourhood of it Provided that afay is constant in N(l) theorem 1 states that the orientation of the line of zero-crossings is perpendicular to the orientation a t which the zero-crossings have maximum slope
THEOREM2
Let f (x y) be a real-valued twice continuously differelltiable function on the plane Let 1 be an open line segment along the axis x = 0 Then the two conditions
(i) V2f = 0 on I
and (ii) a2fax2 = 0 on I
are equivalent if and only if f(O y) is constant or linear on I
Proof
If f(0 y) is linear on I a2fay2 = 0 on 1 Hence V2f = 0 there implies that a2fax2 = 0 on 1 too
Conversely if a2fax2 = V2f = 0 on I then a2fay2 = 0 on Z and so f (0 y) varies a t most linearly on I
APPENDIXB
Doas and V2G v2G is the limit of a DOG
Wilsons Doa function may be written
216 D Marr and E Hildreth
where a and ai are the excitatory and inhibitory space constants Writing a = a and ai = a+65 the right hand side varies with
( l a ) exp ( -x22a2)- [ l ( a + 6a)] exp [- x22(a+6g)2]
= 6a (aau) (IU exp [- x22v2]) (4)
This derivative is equal to - (la2-x2a4) exp ( -x22a2) which equals G up to a constant (text equation 5) )
Approximation of V2Qby a DOG
The function
DOG (a5)= [1(2n)+ael exp ( -x22d)- [1(2n)gflil exp ( -x22a) ( 5 )
has Fourier transform w
DOG (w) = exp ( -a w22)-exp ( -cw22) (6)
Notice that D ~ G(w) behaves like w2 for values of w that are small compared with cr and ai so that these filters in common with V2G approximate a second derivative operator
The problem with using a DOG to approximate V2G is to find a space constant that keeps the bandwidth of the filter small and yet allows the filter adequate sensitivity for clearly as the space constants approach one another the contri- butions of the excitatory and inhibitory components become identical and the sensitivity of the filter is reduced
The bandwidths a t half sensitivity and a t half power and the peak sensitivity all depend together on the value of aiae in a way that is shown in figure 11 From this we see that (i) the bandwidth a t half sensitivity increases very slowly up to about aiae = 16 increases faster from there to CT~CT= 30 and is thereafter approximately constant (ii) the peak sensitivity of the filter is desultory for small CT~CTreaching about 33 at CT~CT= 16 Since our aim is to create a narrow bandpass differential operator tve should choose CT~CTto minimize the bandwidth Since the bandwidth is approximately constant for CT~CTlt 16 and since sensitivity is low there the minimal value one would in practice choose for aa is around 16 giving a half-sensitivity bandwidth of 18 octaves and a half power bandwidth of 13 octaves
The raw primal sketch
FIGURE 11 The values of certain parameters associated with difference-of-Gaussian (DOG)
masks with excitatory and inhibitory space constants a and a (a )For various values of auwe show the half-sensitivity bandwidth ( + ) and the half-power bandwidth (a)of the filter In ( b )is shown its peak sensitivity in the Fourier plane (The peak sensitivity of the excitatory component alone equals 100 on this scale) (c) The arguments in the appendix show that the best engineering approximation to VaG using a DOG occurs with aiuearound 16 In figure (c) this particular Doa is shown dotted against the operator V20 with the appropriate a The two profiles are very similar
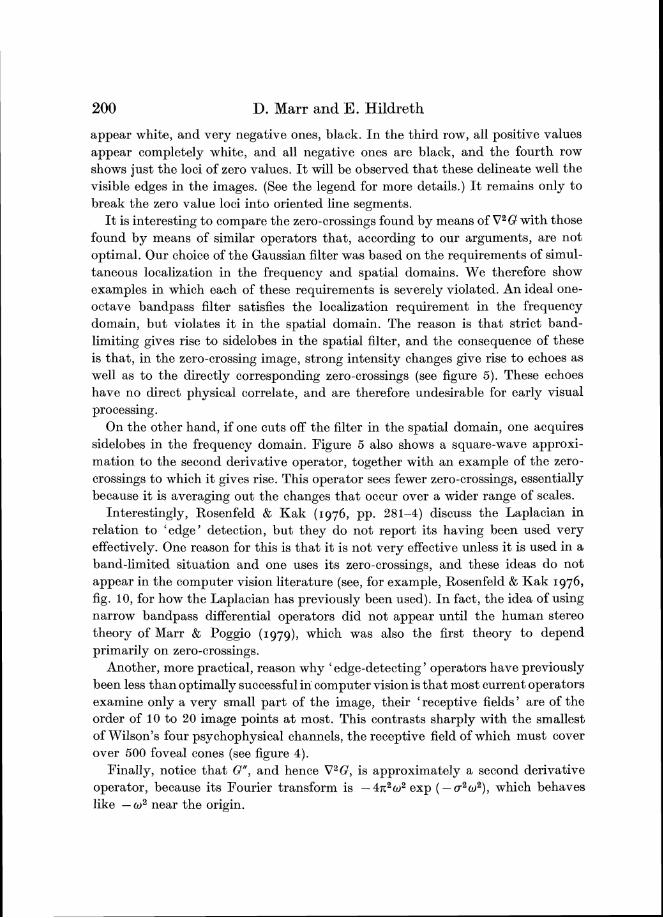
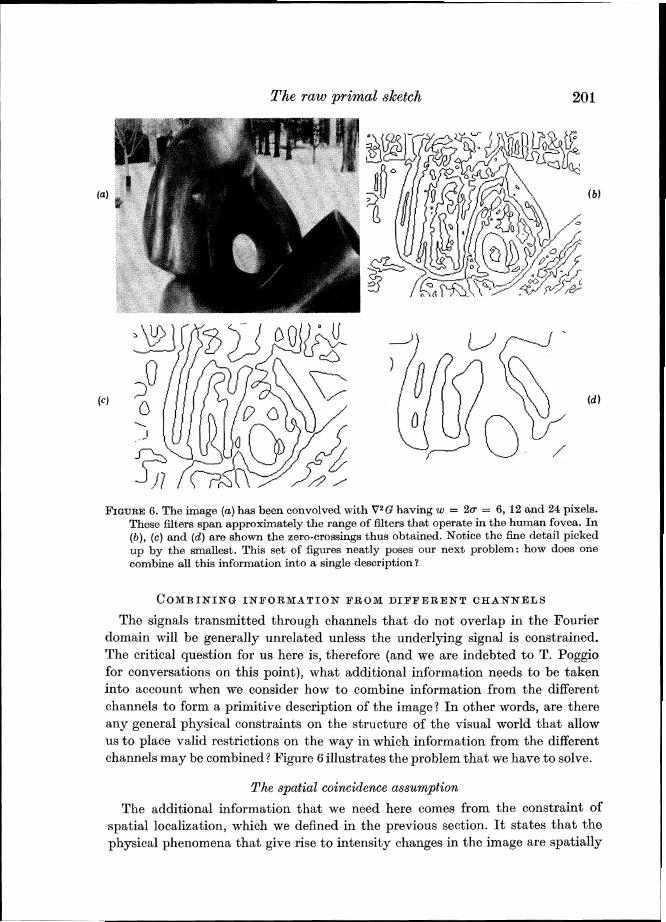
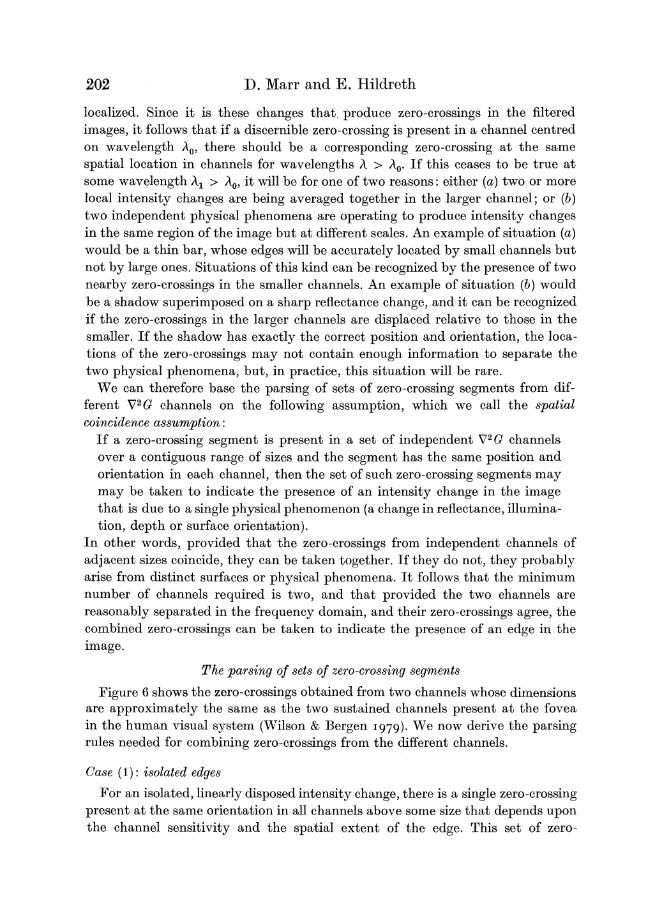
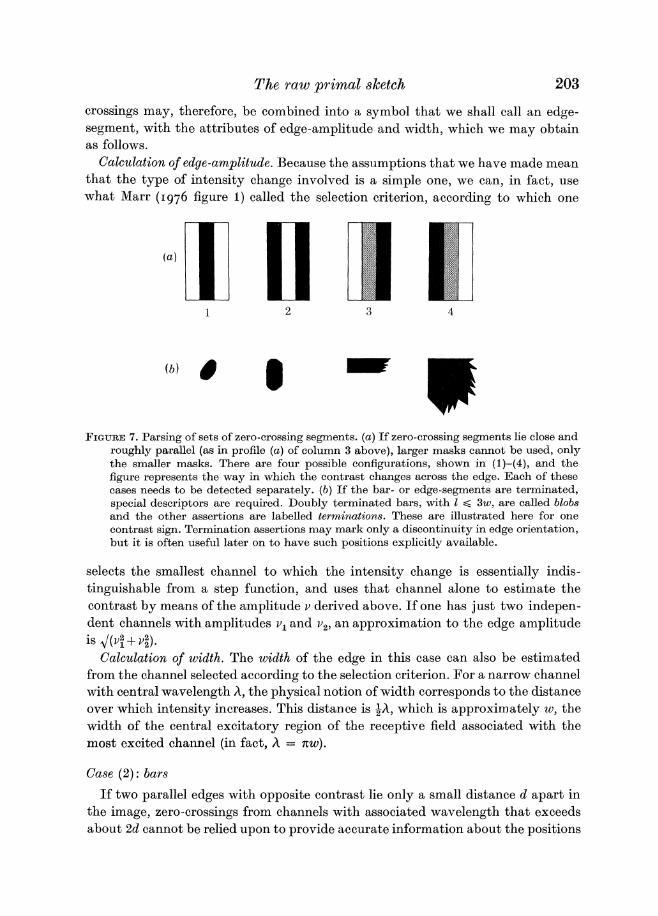
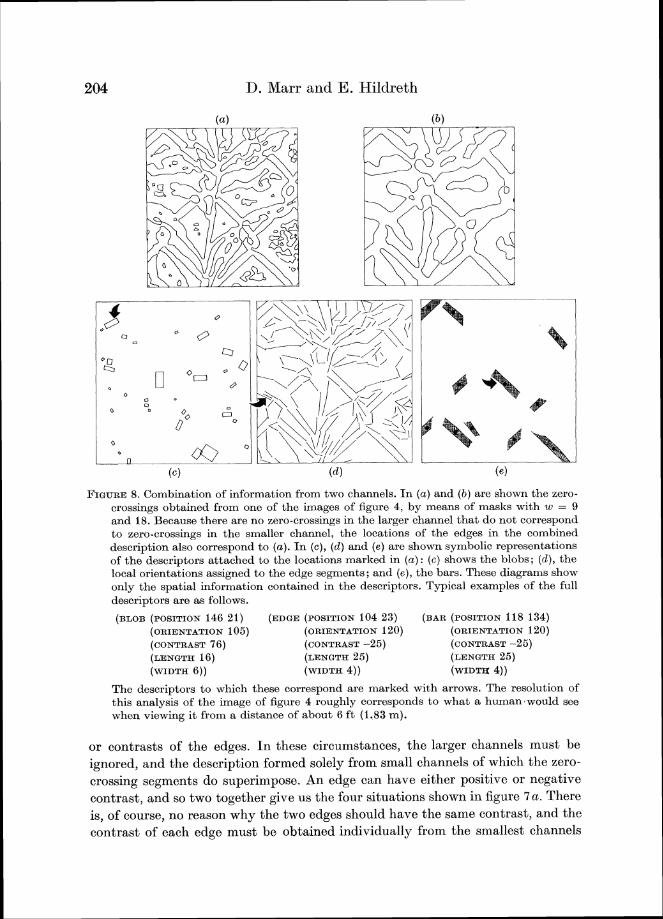
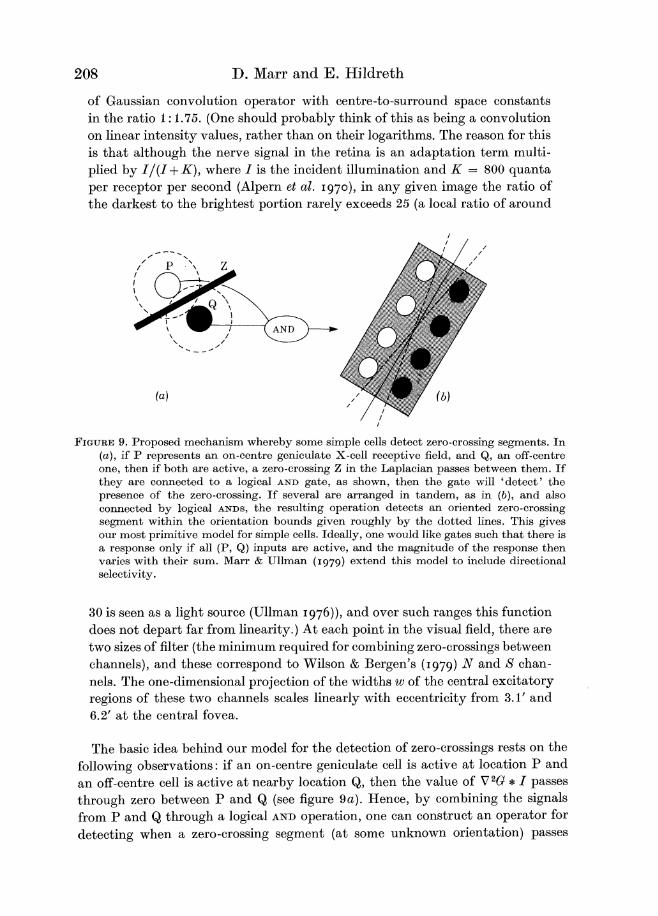
The raw primal sketch
the explicit representation of (oriented) blobs and terminations Units that re-present them should be susceptible to psychophysical adaptation and in fact Nakayama amp Roberts (1972) and Burton amp Ruddock (1978) have found evidence for units that are sensitive to bars whose length does not exceed three times the width
Consequences for neurophysiology
There are several ways of implementing the parsing process that we have described but i t is probably not worth setting them out in detail until we have good evidence from psychophysics about the parsing algorithm that is actually used and we know whether simple cells in fact implement the detection of zero-crossing segments Without these pieces of information firm predictions cannot be made but we offer the following suggestions as a possible framework for the neural implementation (1) The four types of bar detectors could be implemented a t the very first simple cell level (along the lines of figure 9 but being fed by three rows of centre-surround cells instead of two) (2) For relatively isolated edges there should exist oriented edge-segment-detecting neurons that combine zero-crossing segment detectors (simple cells) from different channels when and only when the segments are spatially coincident (3) Detectors for terminations and blobs (doubly-terminated oriented bars) seem to have been found already (Hubel amp Wiesel 1962 1968) Interestingly Schiller et al (1976a) found that even some simple cells are stopped Our scheme is consistent with this since it requires such detectors a t a very early stage
The concept of an edge has a partly visual and partly physical meaning One of our main purposes in this article is to make explicit this dual dependence our definition of an edge rests lightly on the early assumptions of theorem 1 about directional derivatives and heavily on the constraint of spatial localizatjon
Our theory is based on two main ideas First one simplifies the detection of intensity changes by dealing with the image separately a t different resolutions The detection process can then be based on finding zero-crossings in a second derivative operator which in practice can be the (non-oriented) Laplacian The representation a t this point consists of zero-crossing segments and their slopes This representation is probably complete and is therefore in principle invertible This had previously been given only an empirical demonstration by Marr and by R Woodham (see Marr 1978 fig 7)
The subsequent step of combining information from different channels into a single description rests on the second main idea of the theory which we formu- lated as the spatial coincidence assumption Physical edges will produce roughly coincident zero-crossings in channels of nearby sizes The spatial coincidence assumption asserts that the converse of this is true that is the coincidence of zero-
212 D Marr and E Hildreth
crossings is sufficient evidence for the existence of a real physical edge If the zero-crossings in one channel are not consistent with those in the others they are probably caused by different physical phenomena so descriptions need to be formed from both sources and kept somewhat separate
Finally the basic idea that some simple cells detect and represent zero-crossing segments and that this is carried out simultaneously a t different scales has some implications for Marr amp Poggios (1979)stereo theory According to various neuro- physiological studies (Barlow et al 1967 Poggio amp Fischer 1978 von der Heydt et al 1978) there exist disparity sensitive simple cells The existence of such cells is consisten6 with our suggestion that they detect zero-crossing segments but not with the idea that they perform a linear convolution equivalent to a directional derivative since it is the primitive symbolic descriptions provided by zero-crossing segments that need to be matched between images not the raw convolu- tion values
We thank K Nishihara T Poggio and S Ullman for their illuminating and helpful comments This work was conducted at the Artificial Intelligence Labora- tory a Massachusetts Institute of Technology research program supported in part by the Advanced Research Projects Agency of the Department of Defence and monitored by the Office of Naval Research under contract number N00014- 75-C-0643 D M was also supported by NSF contract number 77-07569-MCS
Alpern M Rushton W A H amp Torii S 1970 The size of rod signals J Physiol Lond 206 193-208
Atkinson J amp Campbell F W 1974 The effect of phase on the perception of compound gratings Vis ion Res 14 159-162
Barlow H B 1969 Pattern recognition and the responses of sensory neurons Ann N Y Acad Xci 156 872-881
Barlow H B 1979 Reconstructing the visual image in space and time Nature Lond 279 189-190
Barlow H B Blakemore C amp Pettigrew J D 1967 The neural mechanism of binocular depth discrimination J Physiol Lond 193 327-342
Bracewell R 1965 T h e Fourier transform and i ts applications New York MacGraw-Hill Burton G JNagshineh S amp Ruddock K H 1977 Processing by the human visual system
of the light and dark contrast components of the retinal image Biol Cybernetics 28 1-9 Burton G J amp Ruddock K H 1978 Visual adaptation to patterns containing two-
dimensional spatial structure Vis ion Res 18 93-99 Campbell F W amp Robson J G 1968 Applications of Fourier analysis to the visibility of
gratings J Physiol Lond 197 551-556 Cleland B G Dubin N W amp Levick W R 1971 Sustained and transient neurones in the
cats retina and lateral geniculate nucleus J Physiol Lond 217 473-496 Cowan J D 1977 Some remarks on channel bandwidths for visual contrast detection
Neurosci Res Prog Bull 15 492-517 Crick F H C Narr D amp Poggio T 1980 An information processing approach to under-
standing the visual cortex To appear in the NRP symposium T h e cerebral cortex (ed F 0 Schmidt amp F G Worden)
213 The raw primal sketch
De Valois K K 1977a Spatial frequency adaptation can enhance contrast sensitivity Vis ion Res 17 1057-1065
De Valois K K 1977 b Independence of black and white phase-specific adaptation Vis ion Res 17 209-215
Enroth-Cugell C amp Robson J G 1966 The contrast sensitivity of retinal ganglion cells of the cat J Physiol Lond 187 517-552
Graham N 1977 Visual detection of aperiodic spatial stimuli by probability summation among narrowband channels Vis ion Res 17 637-652
Harmon L D amp Julesz B 1973 Masking in visual recognition effects of two-dimensional filtered noise Science N Y 180 1194-1 197
von der Heydt R Adorjani Cs Hanny P amp Baumgartner G 1978 Disparity sensitivity and receptive field incongruity of units in the cat striate cortex E s p Bra in Res 31 523-545
Hubel D H amp Wiesel T N 1961 Integrative action in the cats lateral geniculate body J Physiol Lond 155 385-398
Hubel D H amp Wiesel T N 1962 Receptive fields binocular interaction and functional architecture in the cats visual cortex JPhysiol Lond 160 106-154
Hubel D H amp Wiesel T N 1968 Receptive fields and functional architecture of monkey striate cortex JPhysiol Lond 195 215-243
Hubel D H amp Wiesel T N 1974 Uniformity of monkey striate cortex a parallel relation- ship between field size scatter and magnification factor J comp Neurol 158 295-306
Kulikowski J J amp King-Smith P E 1973 Spatial arrangement of line edge and grating detectors revealed by subthreshold summation Vis ion Res 13 1455-1478
Leipnik R 1960 The extended entropy uncertainty principle I n f Control 3 18-25 Logan B F J r 1977 Information in the zero-crossings of bandpass signals Bell Sys t tech
J 56 487-510 Macleod I D G amp Rosenfeld A 1974 The visibility of gratings spatial frequency channels
or bar-detecting units Vis ion Res 14 909-915 Maffei L amp Fiorentini A 1 g 7 z a Process of synthesis in visual perception Nature Lond
240 479-481 Maffei L amp Fiorentini A 1g7zb Retinogeniculate convergence and analysis of contrast
J Neurophysiol 35 65-72 Maffei L amp Fiorentini A 1977 Spatial frequency rows in the striate visual cortex Vis ion
Res 17 257-264 Marr D 1970 A theory for cerebral neocortex Proc R Soc Lond B 176 161-234 Marr D 1976a Analyzing natural images a computational theory of texture vision Cold
Spr ing Harbor S y m p quant Biol 40 647-662 Marr D 19763 Early processing of visual information Phi l T rans R Soc Lond B 275
483-524 Marr D 1978 Representing visual information AAAS 143rd Annual Meeting Sym-
posium on Some mathematical questions in biology February 1977 Published in Lectures o n mathematics in the life sciences 10101-1 80 Also available as M I T AI Lab Memo 41 5
Marr D amp Poggio T 1979 A computational theory of human stereo vision Proc R Soc Lond B 204 301-328
Marr D Poggio T amp Ullman S 1979 Bandpass channels zero-crossings and early visual information processing J opt Soc Am 69 914r916
Marr D amp Ullman S 1979 Directional selectivity and its use in early visual processing (In preparation )
Mayhew J E W amp Frisby J P 1978 Suprathreshold contrast perception and complex random textures Vis ion Res 18 895-897
Nakayama K amp Roberts D J 1972 Line-length detectors in the human visual system evidence from selective adaptation Iision Res 12 1709-1713
Peichl L amp Wassle H 1979 Size scatter and coverage of ganglion cell receptive field centres in the cat retina JPhysiol Lond 291 117-141
Poggio G F amp Fischer B 1978 Binocular interaction and depth sensitivity of striate and prestriate neurons of the behaving rhesus monkey J Neurophysiol 40 1392-1405
214 D Marr and E Hildreth
Pollen D A Lee J R amp Taylor J H 1971 HOW does the striate cortex begin the recon- struction of the visual world Science N P 173 74-77
Ratliff F 1965 Mach bands quantitative studies on neural networks in the retina San Francisco Holden-Day
Rodieck R W amp Stone J 1965 Analysis of receptive fields of cat retinal ganglion cells JNeurophysiol 28 833-849
Rosenfeld A amp Kak A C 1976 Digital picture processing New York Academic Press Sachs M B Nachmias J amp Robson J G 1971 Spatial-frequency channels in human
vision J opt Soc Am 61 1176-1186 Shapley R M amp Tolhurst D J 1973 Edge detectors in human vision J Physiol Lond
229 165-183 Schiller P H Finlay B L amp Volman S F 1976a Quantitative studies of single-cell
properties in monkey striate cortex I Spatiotemporal organization of receptive fields J Neurophysiol 39 1288-1319
Schiller P H Finlay B L amp Volman S F 1976b Quantitative studies of single-oell properties in monkey striate cortex 11 Orientation specificity and ocular dominance JNeurophysiol 39 1320-1333
Ullman S 1976 On visual detection of light sources Biol Cybernetics 21 205-212 Westheimer G amp McKee S P 1977 Spatial configurations for visual hyperacuity Vision
Res 17 941-947 Wilson H R amp Bergen J R 1979 A four mechanism model for spatial vision Vision Res
19 19-32 Wilson H R amp Giese S C 1977 Threshold visibility of frequency gradient patterns Vision
Res 17 1177-1190
Let I be an open line segment of the y-axis containing the origin 0 Suppose that f(x y) is twice continuously differentiable and that N(1) is an open two- dimensional neighbourhood of I Assume that i32fi3x2 = 0 on I Then if i3fi3y is constant in N(I) the slope of the second directional derivative taken perpendicular to I (ie the slope of i32fi3x2) is greater than the slope of the zero-crossing along any other line through 0
Proof
Consider the line segment Q = (r cos 8 r sin 8) for fixed 8 and values of r sufficiently small that Q lies entirely within N(1) (see figure 10) Now writing fxx for i32fi3x2 etc we have
(a2faQ2)= (f cos2 8 +fx 2 sin 8 cos 8 +f sin2O) B
since the condition of the theorem that f be constant implies that f and f are both zero As required therefore the above quantity is zero a t r = 0 and has maximum slope when 8 = 0
The raw primal sketch
FIGURE10 Diagram for theorems 1and 2 1is a segment of the y-axis containing the origin N(1)is a neighbourhood of it Provided that afay is constant in N(l) theorem 1 states that the orientation of the line of zero-crossings is perpendicular to the orientation a t which the zero-crossings have maximum slope
THEOREM2
Let f (x y) be a real-valued twice continuously differelltiable function on the plane Let 1 be an open line segment along the axis x = 0 Then the two conditions
(i) V2f = 0 on I
and (ii) a2fax2 = 0 on I
are equivalent if and only if f(O y) is constant or linear on I
Proof
If f(0 y) is linear on I a2fay2 = 0 on 1 Hence V2f = 0 there implies that a2fax2 = 0 on 1 too
Conversely if a2fax2 = V2f = 0 on I then a2fay2 = 0 on Z and so f (0 y) varies a t most linearly on I
APPENDIXB
Doas and V2G v2G is the limit of a DOG
Wilsons Doa function may be written
216 D Marr and E Hildreth
where a and ai are the excitatory and inhibitory space constants Writing a = a and ai = a+65 the right hand side varies with
( l a ) exp ( -x22a2)- [ l ( a + 6a)] exp [- x22(a+6g)2]
= 6a (aau) (IU exp [- x22v2]) (4)
This derivative is equal to - (la2-x2a4) exp ( -x22a2) which equals G up to a constant (text equation 5) )
Approximation of V2Qby a DOG
The function
DOG (a5)= [1(2n)+ael exp ( -x22d)- [1(2n)gflil exp ( -x22a) ( 5 )
has Fourier transform w
DOG (w) = exp ( -a w22)-exp ( -cw22) (6)
Notice that D ~ G(w) behaves like w2 for values of w that are small compared with cr and ai so that these filters in common with V2G approximate a second derivative operator
The problem with using a DOG to approximate V2G is to find a space constant that keeps the bandwidth of the filter small and yet allows the filter adequate sensitivity for clearly as the space constants approach one another the contri- butions of the excitatory and inhibitory components become identical and the sensitivity of the filter is reduced
The bandwidths a t half sensitivity and a t half power and the peak sensitivity all depend together on the value of aiae in a way that is shown in figure 11 From this we see that (i) the bandwidth a t half sensitivity increases very slowly up to about aiae = 16 increases faster from there to CT~CT= 30 and is thereafter approximately constant (ii) the peak sensitivity of the filter is desultory for small CT~CTreaching about 33 at CT~CT= 16 Since our aim is to create a narrow bandpass differential operator tve should choose CT~CTto minimize the bandwidth Since the bandwidth is approximately constant for CT~CTlt 16 and since sensitivity is low there the minimal value one would in practice choose for aa is around 16 giving a half-sensitivity bandwidth of 18 octaves and a half power bandwidth of 13 octaves
The raw primal sketch
FIGURE 11 The values of certain parameters associated with difference-of-Gaussian (DOG)
masks with excitatory and inhibitory space constants a and a (a )For various values of auwe show the half-sensitivity bandwidth ( + ) and the half-power bandwidth (a)of the filter In ( b )is shown its peak sensitivity in the Fourier plane (The peak sensitivity of the excitatory component alone equals 100 on this scale) (c) The arguments in the appendix show that the best engineering approximation to VaG using a DOG occurs with aiuearound 16 In figure (c) this particular Doa is shown dotted against the operator V20 with the appropriate a The two profiles are very similar
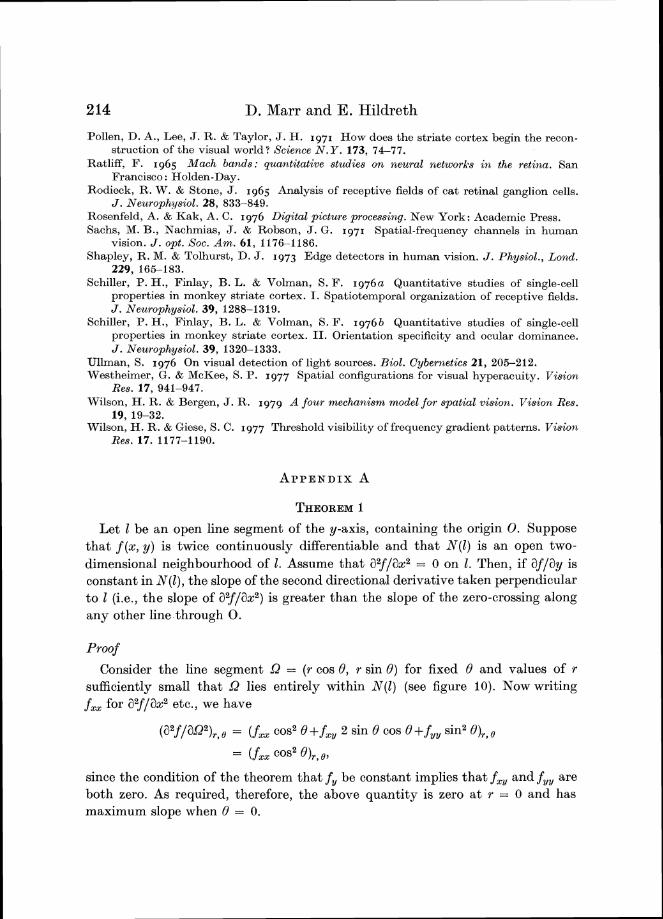
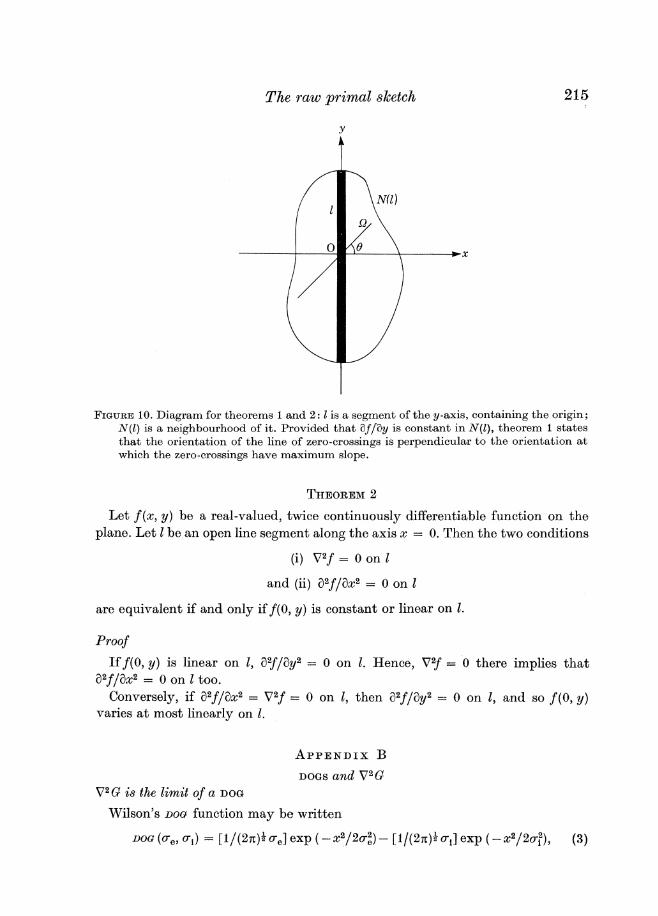
The raw primal sketch
FIGURE10 Diagram for theorems 1and 2 1is a segment of the y-axis containing the origin N(1)is a neighbourhood of it Provided that afay is constant in N(l) theorem 1 states that the orientation of the line of zero-crossings is perpendicular to the orientation a t which the zero-crossings have maximum slope
THEOREM2
Let f (x y) be a real-valued twice continuously differelltiable function on the plane Let 1 be an open line segment along the axis x = 0 Then the two conditions
(i) V2f = 0 on I
and (ii) a2fax2 = 0 on I
are equivalent if and only if f(O y) is constant or linear on I
Proof
If f(0 y) is linear on I a2fay2 = 0 on 1 Hence V2f = 0 there implies that a2fax2 = 0 on 1 too
Conversely if a2fax2 = V2f = 0 on I then a2fay2 = 0 on Z and so f (0 y) varies a t most linearly on I
APPENDIXB
Doas and V2G v2G is the limit of a DOG
Wilsons Doa function may be written
216 D Marr and E Hildreth
where a and ai are the excitatory and inhibitory space constants Writing a = a and ai = a+65 the right hand side varies with
( l a ) exp ( -x22a2)- [ l ( a + 6a)] exp [- x22(a+6g)2]
= 6a (aau) (IU exp [- x22v2]) (4)
This derivative is equal to - (la2-x2a4) exp ( -x22a2) which equals G up to a constant (text equation 5) )
Approximation of V2Qby a DOG
The function
DOG (a5)= [1(2n)+ael exp ( -x22d)- [1(2n)gflil exp ( -x22a) ( 5 )
has Fourier transform w
DOG (w) = exp ( -a w22)-exp ( -cw22) (6)
Notice that D ~ G(w) behaves like w2 for values of w that are small compared with cr and ai so that these filters in common with V2G approximate a second derivative operator
The problem with using a DOG to approximate V2G is to find a space constant that keeps the bandwidth of the filter small and yet allows the filter adequate sensitivity for clearly as the space constants approach one another the contri- butions of the excitatory and inhibitory components become identical and the sensitivity of the filter is reduced
The bandwidths a t half sensitivity and a t half power and the peak sensitivity all depend together on the value of aiae in a way that is shown in figure 11 From this we see that (i) the bandwidth a t half sensitivity increases very slowly up to about aiae = 16 increases faster from there to CT~CT= 30 and is thereafter approximately constant (ii) the peak sensitivity of the filter is desultory for small CT~CTreaching about 33 at CT~CT= 16 Since our aim is to create a narrow bandpass differential operator tve should choose CT~CTto minimize the bandwidth Since the bandwidth is approximately constant for CT~CTlt 16 and since sensitivity is low there the minimal value one would in practice choose for aa is around 16 giving a half-sensitivity bandwidth of 18 octaves and a half power bandwidth of 13 octaves
The raw primal sketch
FIGURE 11 The values of certain parameters associated with difference-of-Gaussian (DOG)
masks with excitatory and inhibitory space constants a and a (a )For various values of auwe show the half-sensitivity bandwidth ( + ) and the half-power bandwidth (a)of the filter In ( b )is shown its peak sensitivity in the Fourier plane (The peak sensitivity of the excitatory component alone equals 100 on this scale) (c) The arguments in the appendix show that the best engineering approximation to VaG using a DOG occurs with aiuearound 16 In figure (c) this particular Doa is shown dotted against the operator V20 with the appropriate a The two profiles are very similar
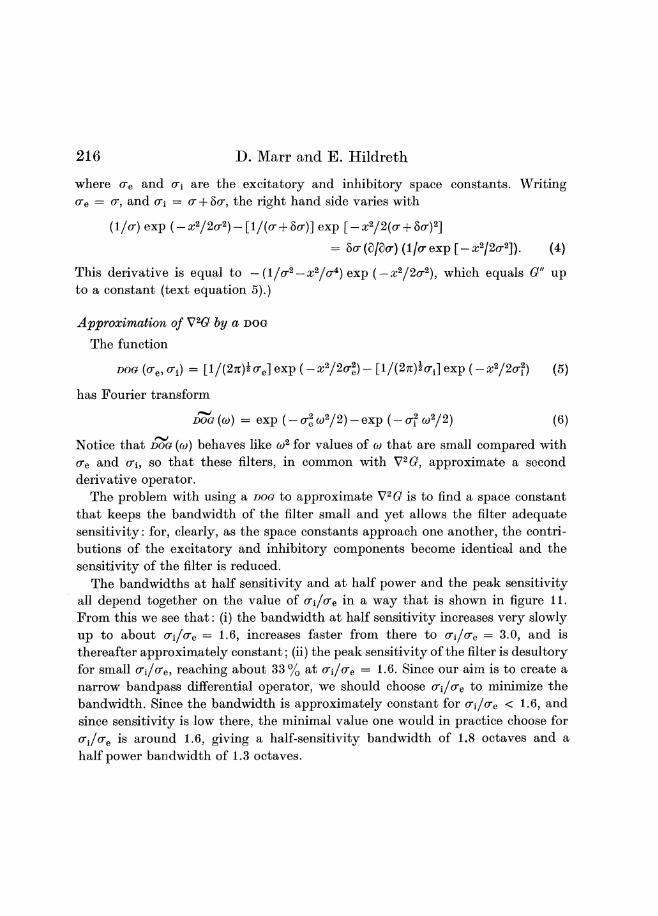
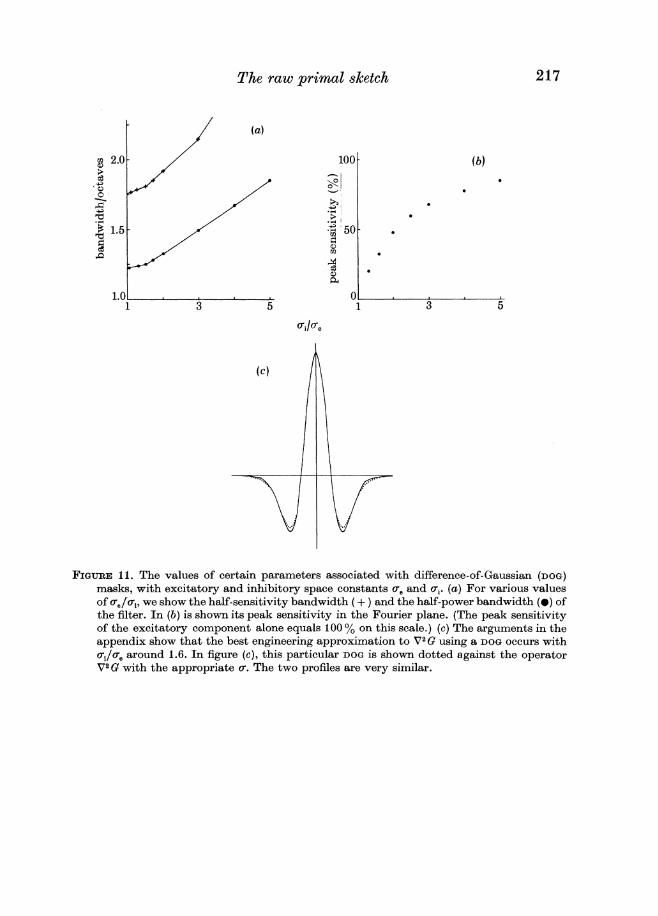


![Volume Visualization - CGL · use the result of an edge detection algorithm by Marr – Hildreth [Kniss-2001-IVR] or the Laplacian operator which uses the second derivation of the](https://img.pdfslide.us/doc/110x75/5f52d4b51e83b15ebb617659/volume-visualization-cgl-use-the-result-of-an-edge-detection-algorithm-by-marr.jpg)