Embed Size (px)
Citation preview

3010 Anal. Chem. 1993, 65, 3010-3014
Theory and Technique for Measuring Mobility Using Ion Mobility Spectrometry Glenn E. Spangler Environmental Technologies Group, Inc., 1400 Taylor Avenue, Baltimore, Maryland 21284-9840
Theory and techniques to measure ion mobilities using ion mobility spectrometry are presented. With two IMS cells of very different designs, reduced mobility data for the protonated water reactant ion were collected at 50-55 "C. Sources of error for the final values are reported.
INTRODUCTION Ion mobility spectrometry (IMS) is an atmospheric pressure
ionization technique in which organic sample molecules are submitted to ionizing reactions to produce product ions. The ionization is accomplished in a reactor by using either a radioactive 'j3Ni, photoionization, or alkali cation thermionic emitting source.14 The radioactive and alkali cation sources generate reactant ions which react with the sample. The photoionization source emits vacuum ultraviolet photons which photoeject valence electrons from the sample. The chemistry of the reactions can be altered by adding reagent gases to the carrier gas.
After the product ions are formed, they are extracted from the reactor by an electric field and introduced into a linear drift tube.5 A shutter grid is opened approximately 100-700 ps to inject a narrow band of the ions into the drift tube. Under the influence of an electric field applied across the drift tube, this band of ions travels toward an ion collector and breaks up as each ion species of the original ion mixture arrives at the collector with different drift times. As they arrive at the collector, the ions generate an ion current which is amplified by an electrometer circuit for data processing. For a more detailed description of IMS, the reader is referred to several review articles and books.Sl0
A parameter of interest to IMS is mobility. Experimentally, it is derived from the time, td, it takes the ions to travel the length of the drift tube. It is obtained from the peak maxima of the ion mobility peaks in the ion mobility spectrum measured relative to the time when the ions were introduced into the drift tube. Theoretically, the drift time is given by
td = ldlvd (1)
where l d is the length of the drift tube, vd is the drift velocity
(1) Cohen, M. J.; Karasek, F. W. J. Chromatogr. Sci. 1970,8,330-337. (2) Leasure, C. S.; Fleischer, M. E.; Anderson, G. K.; Eiceman, G. A.
(3) Baim, M. A.; Eatherton, R. L.; Hill, H. H., Jr. Anal. Chem. 1983,
(4) Roehl, J.; Spangler, G. E.; Donovan, W. H.; Nowak, D. Proceedings 1992 Workshop on Ion Mobility Spectrometry; Mescalero, NM, June 1992; Eiceman, G. A., Ed.; Final Report on Contract DAAL03-91-C-0034; U.S. Army Chemical Research, Development and Engineering Center: Aberdeen Proving Ground, MD 21010, January 27, 1993.
(5) Mason, E. A.; McDaniel, E. W. Transport Properties of Ions in Gases; Wiley: New York, 1988.
(6) Hill, H. H., Jr.; Siems, W. F.;St. Louis, R. H.;McMinn, D. G. Anal. Chem. 1990,62, 1201A-1209A.
(7) St. Louis, R. H.; Hill, H. H., Jr. Crit. Rev. Anal. Chem. 1990, 21,
(8) Eiceman, G. A. Crit . Rev. Anal. Chem. 1991, 22 (1&2), 17-36. (9) Roehl, J. E. Appl . Spectrosc. Rev. 1991, 26 (1&2), 1-57. (10) Carr, T. W. Plasma Chromatography; Plenum: New York, 1984.
Anal. Chem. 1986,58,2142-2147.
55,1761-1766.
321-355.
0003-2700/93/0365-30 10$04.00/0
for the ion, and the mobility K is given by
K = V d I E (2) E is the constant electric field applied across the drift tube. To remove variations due to changing pressure and temper- ature, reduced mobility KO
(3)
is also defined.5 Because of the fundamental nature of reduced mobility to
IMS theory, it is used to compare data generated in different laboratories. One compilation of reduced mobilities has already been assembled for this purpose.ll On the other hand, there is nothing in the literature to assist a researcher desiring to make careful mobility measurements. If the IMS is bought from a reputable manufacturer, a relationship between the measured drift time and mobility may be provided. However, the details supporting this relationship will most likely be lacking. Presently, IMS technology is rapidly expanding and hardware can be purchased from a variety of vendors. More often than not, aminiaturized IMS is used which was originally developed and designed as a detector in an environmental sensor. As such, no information is available to support a researcher desiring to measure mobilities. Furthermore, it is easy for anyone to build an IMS for use in his own laboratory. To reliably measure mobility using these instruments, it is necessary to deduce mobility values from measured drift times and instrument parameters. A systematic approach to measuring mobilities is preferred over making qualitative comparisons with previously published mobility values in the open literature.
This paper concerns the reporting of reduced mobilities from drift time data. Drift time data were collected on the protonated water reactant ion12 by using two IMS cells of very different constructions. Theory and measurement techniques were developed to deduce reduced mobility values from both sets of data. Sources of error for the measurement are evaluated.
EXPERIMENT The first IMS cell was the IMS cell of an ion mobility
spectrometer/mass spectrometer (IMS/MS) previously described in the 1iterat~re.l~ The shutter grid of this cell was two coplanar grids of a Bradbury-Nielsen design,14 which was electronically pulsed by momentarily equalizing the normally unequal potential applied between the two halves of the grid. The drift region was a stacked ring drift tube with the drift length between the shutter grid and aperture grid being 10.92 cm and between the aperture grid and collector being 0.09 cm. All data were collected using an IMS cell temperature of 50 OC (as measured with two
(11) Shumate, C.; St. Louis, R. H.; Hill, H. H., Jr. J. Chromatogr. 1986,
(12) Kim, S. H.; Betty, K. R.; Karasek, F. W. Anal. Chem. 1978, 50, 373, 141-173.
2006-2012.
1983, 52, 267-287. (13) Spangler, G. E.; Carrico, J. P. Int. J. Mass Spectrom. Ion Phys.
(14) Bradbury, N. E.; Nielsen, R. A. Phys. Reu. 1936, 49, 388-393.
0 1993 American Chemical Society
ANALYTICAL CHEMISTRY, VOL. 65, NO. 21, NOVEMBER 1, 1993 3011
thermocouples located between the housing and the electrode structure for the IMS cell) and an IMS cell pressure of atmospheric.
The second IMS cell was a parametric cell assembled to study the effecta of geometric design on the performance of IMS. This cell was a series of ceramic rings stacked on two glass insulated rods inside a rectangular metal box. The ionization source was contained in the first ceramic ring, a reactor ring positioned the ionization source 1 cm from the shutter grid, a parallel plane shutter grid interrupted ion flow from the reactor to the drift tube, a ceramic tube coated internally with thick film resistor ink served as the drift tube,lS and an aperture grid/collector assembly collected the ions. The parallel plane shutter grid consisted of two Buckbee MearsIs photoetched grids separated by 0.14 cm along the axis of the IMS cell. The shutter grid was activated by forward biasing the normally reversed electrostatic field between the two grids. The drift length was 8.06 cm from the last grid of the shutter grid to the aperture grid and 0.71 cm from the aperture grid to the collector. The reactor and drift voltages were independently applied to the reactor and drift tube using two Bertan high-voltage power supplies. All data were collected using an IMS cell temperature of 55 OC (as measured witha thermocouple located between the housing and the ceramic electrode structure for the IMS cell) and an IMS pressure of atmospheric.
Both IMS cella contained a 10-mCi "Ni radioactive source for ionization and air purified to approximately 3 ppm water for the carrier and drift gases. The purified air was laboratory air processed by molecular sieve towers in a pressure/purge cycle of an AADCO 737-R pure air generator." The output of this generator was passed through a thermal converter to oxidize hydrocarbons and through an activated 13X molecular sieve trap to remove COz. The water content of the purified air was 2-4 ppm as measured with a DuPont Instrumenta (now Ametek)'s 303 moisture monitor.
The IMS data are collected with the aid of a Tracor TN-1500 signal averager.le The signal averager was triggered using the positive slope (or trailing edge) of the negative gate pulse applied to the shutter grid. The drift time of ion mobility peaks was determined by recording the channel containing the maximum number of counta in the spectrum.
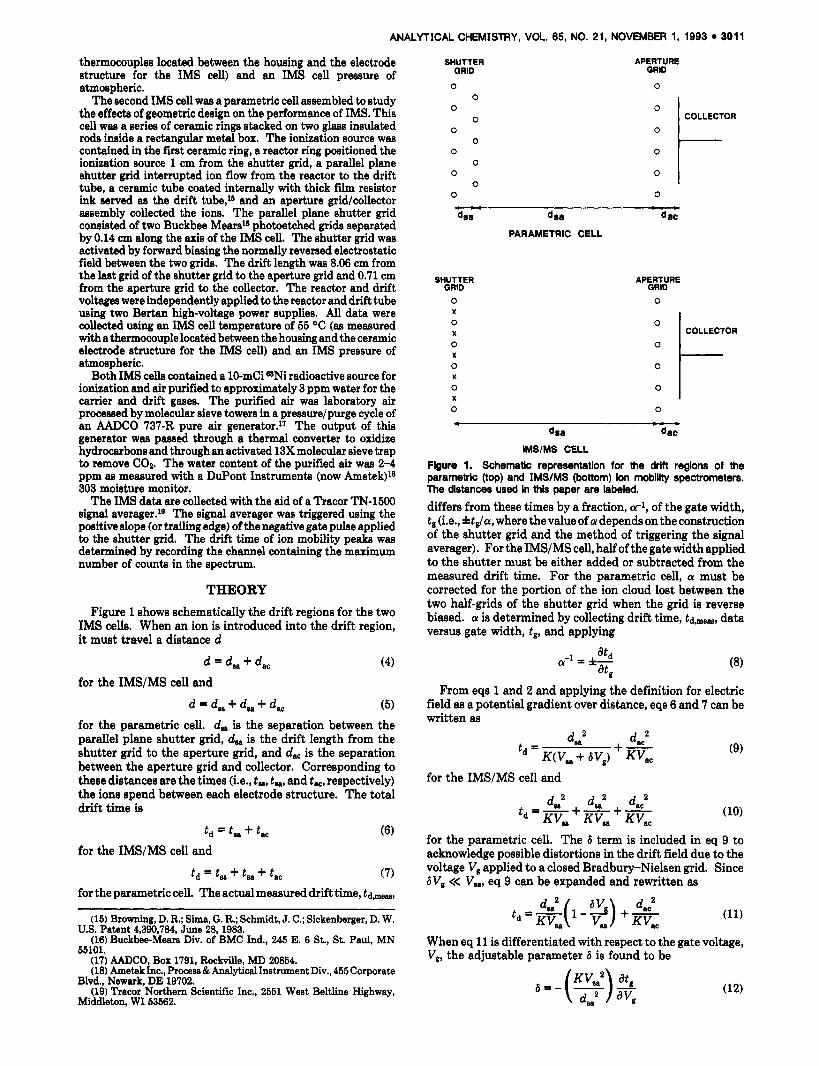
THEORY Figure 1 shows schematically the drift regions for the two
IMS cells. When an ion is introduced into the drift region, it must travel a distance d
(4) d = d, + d,,
d = d, + d, + d,,
for the IMS/MS cell and
(5) for the parametric cell. d, is the separation between the parallel plane shutter grid, d, is the drift length from the shutter grid to the aperture grid, and d, is the separation between the aperture grid and collector. Corresponding to these distances are the times (i.e., t,, t,, and t,, respectively) the ions spend between each electrode structure. The total drift time is
td = t , + t , (6)
td = t , + t , + t , for the IMS/MS cell and
(7) for the parametric cell. The actual measured drift time, td",
(15) Browning, D. R.; Sima, G. R.; Schmidt, J. C.; Sickenberger, D. W.
(16) Buckbee-Meara Div. of BMC Ind., 245 E. 6 St., St. Paul, MN
(17) -0, Box 1791, Rockville, MD 20854. (18) AmetekInc., Proceee & AnalyticalInstnunent Div., 455 Corporate
U.S. Patent 4,390,784, June 28, 1983.
55101.
Blvd.. Newark. DE 19702. (19) Tracor 'Northern Scientific Inc., 2651 West Beltline Highway,
Middleton, WI 53562.
SHUTTER GRID
0
0
0
0
0
0
0
0
0
0
0
APERTURE GRID 0
COLLECTOR
0
0
0 - L-)
ess h a dac
PARAMETRIC CELL
SHUTTER GRID 0 X 0 X
0 X
0 X 0 X 0
APERTURE GRID 0
COLLECTOR
0
0
0
dsa dac
Flgurr 1. Schematic representation for the drift reglons of the parametric (top) and IMSIMS (bottom) lon mobility spectrometers. The distances used in this paper are labeled. differs from these times by a fraction, CY-', of the gate width, t, (i.e., &tB/a, where the value of a depends on the construction of the shutter grid and the method of triggering the signal averager). For the IMS/MS cell, half of the gate width applied to the shutter must be either added or subtracted from the measured drift time. For the parametric cell, a must be corrected for the portion of the ion cloud lost between the two half-grids of the shutter grid when the grid is reverse biased. a is determined by collecting drift time, tda-, data versus gate width, t,, and applying
IMS/MS CELL
a-1 I f- at,
From eqs 1 and 2 and applying the definition for electric field as a potential gradient over distance, eqs 6 and 7 can be written as
- 1 2 - 1 2
for the IMS/MS cell and
d,' dm2 d,: e-+-+-
td KV, KV, KVac (10)
for the parametric cell. The 6 term is included in eq 9 to acknowledge possible distortions in the drift field due to the voltage V, applied to a closed Bradbury-Nielsen grid. Since 6Vg << V,, eq 9 can be expanded and rewritten as
(11)
When eq 11 is differentiated with respect to the gate voltage, V,, the adjustable parameter b is found to be
3012 ANALYTICAL CHEMISTRY, VOL. 65, NO. 21, NOVEMBER 1, 1993
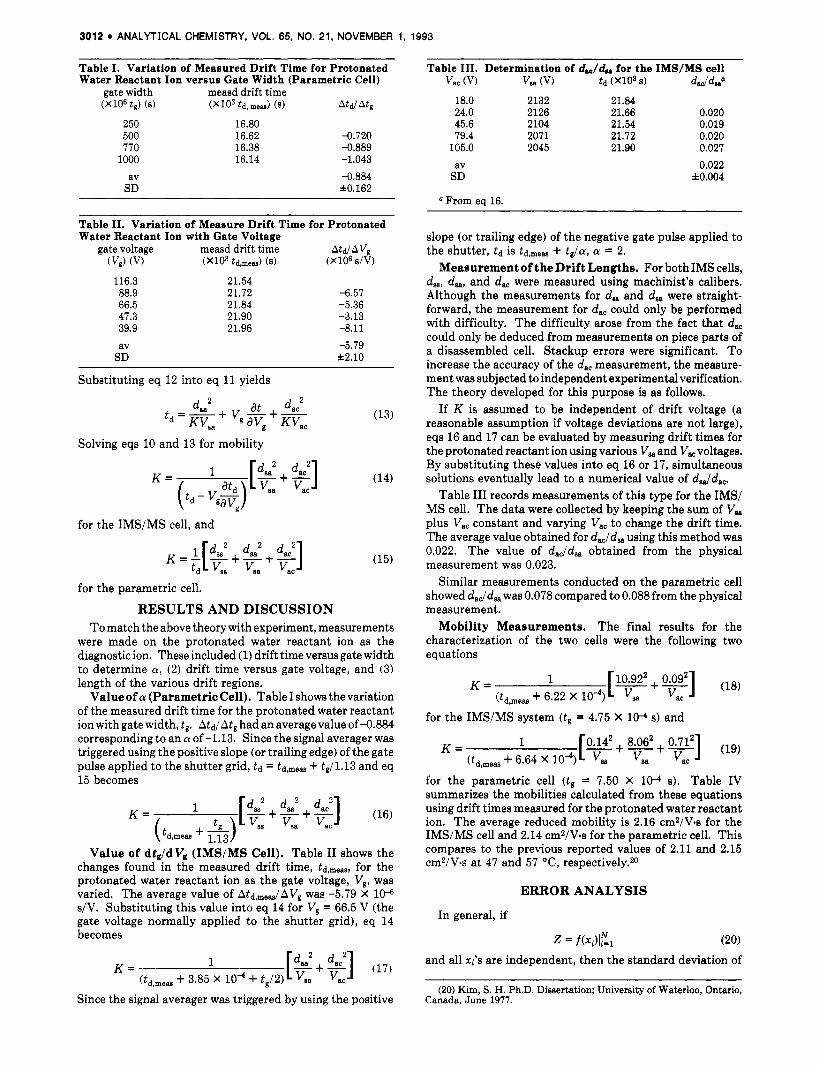
Table I. Variation of Measured Drift Time for Protonated Water Reactant Ion versus Gate Width (Parametric Cell)
gate width measd drift time (Xl06 t r ) ( 8 ) (xio3 td,meas) (5) A t d I A t g
250 500 770
1000 av
SD
16.80 16.62 -0.720 16.38 -0.889
-0.884 *0.162
16.14 -1.043
Table 11. Variation of Measure Drift Time for Protonated Water Reactant Ion with Gate Voltage
gate voltage measd drift time AtdAV, (V,) (V) td,meae) ( 8 ) (X106 S/V)
116.3 88.9 66.5 47.3 39.9 av
SD
21.54 21.72 21.84 21.90 21.96
-6.57 -5.36 -3.13 -8.11
-5.79 f2.10
Substituting eq 12 into eq 11 yields
at dac2 + v - + - 'sa2
t d = KV,, g av, KV,, (13)
Solving eqs 10 and 13 for mobility
for the IMS/MS cell, and
for the parametric cell.
RESULTS AND DISCUSSION To match the above theory withexperiment, measurements
were made on the protonated water reactant ion as the diagnostic ion. These included (1) drift time versus gate width to determine a, (2) drift time versus gate voltage, and (3) length of the various drift regions.
Value of a (Parametric Cell). Table I shows the variation of the measured drift time for the protonated water reactant ion with gate width, t,. &/Atg had an average value of -0.884 corresponding to an a of -1.13. Since the signal averager was triggered using the positive slope (or trailing edge) of the gate pulse applied to the shutter grid, td = td,me@ + tJ1.13 and eq 15 becomes
K = ,[$+"'+"'I 'ea Vac (16)
( td,meas + & Value of dt,/dV, (IMS/MS Cell). Table I1 shows the
changes found in the measured drift time, td,me@, for the protonated water reactant ion as the gate voltage, V,, was varied. The average value of Atd,,,dAv, was -5.79 X 1v s/V. Substituting this value into eq 14 for V, = 66.5 V (the gate voltage normally applied to the shutter grid), eq 14 becomes
K = 1 [".'+GI (17) (td,meas + 3.85 X lo4 + t,/2) 'ac
Since the signal averager was triggered by using the positive
Table 111. Determination of d.,/d, for the IMS/MS cell Vac (V) v, (V) t d 0(io3 8) daJdma
18.0 2132 21.84 24.0 2126 21.66 0.020 45.6 2104 21.54 0.019 79.4 2071 21.72 0.020
105.0 2045 21.90 0.027
av 0.022 SD f0.004
From eq 16.
slope (or trailing edge) of the negative gate pulse applied to
Measurement of the Drift Lengths. For both IMS cells, d,, d,, and d,, were measured using machinist's calibers. Although the measurements for d, and d, were straight- forward, the measurement for d, could only be performed with difficulty. The difficulty arose from the fact that d,, could only be deduced from measurements on piece parts of a disassembled cell. Stackup errors were significant. To increase the accuracy of the dac measurement, the measure- ment was subjected to independent experimental verification. The theory developed for this purpose is as follows.
If K is assumed to be independent of drift voltage (a reasonable assumption if voltage deviations are not large), eqs 16 and 17 can be evaluated by measuring drift times for the protonated reactant ion using various V, and Vac voltages. By substituting these values into eq 16 or 17, simultaneous solutions eventually lead to a numerical value of ddd,,.
Table I11 records measurements of this type for the IMS/ MS cell. The data were collected by keeping the sum of V, plus Vac constant and varying V,, to change the drift time. The average value obtained for d, Jd, using this method was 0.022. The value of daJd, obtained from the physical measurement was 0.023.
Similar measurements conducted on the parametric cell showed dac/dSa was 0.078 compared to 0.088 from the physical measurement.
Mobility Measurements. The final results for the characterization of the two cells were the following two equations
the shutter, td is td,meas t,/a, a = 2.
for the IMS/MS system ( t , = 4.75 X 10⁻⁴ s) and
1 K = (td,meas + 6.64 X lo4)
for the parametric cell (te = 7.50 X 10⁻⁴ s). Table IV summarizes the mobilities calculated from these equations using drift times measured for the protonated water reactant ion. The average reduced mobility is 2.16 cmZ/V-s for the IMS/MS cell and 2.14 cmZ/V.s for the parametric cell. This compares to the previous reported values of 2.11 and 2.15 cm2/V.s at 47 and 57 "C, respectively.20
ERROR ANALYSIS
In general, if
= f ( X & (20) and all xi's are independent, then the standard deviation of
(20) Kim, S. H. Ph.D. Dissertation; University of Waterloo, Ontario, Canada, June 1977.

ANALYTICAL CHEMISTRY, VOL. 65, NO. 21, NOVEMBER 1, 1993 3013
Table IV. Reduced Mobility for the Protonated Water Reactant Ion drifttemp V, VM V, td- K Ko (K) (VI (V) (VI (ma) (cm2/Vd (cm2/V.s)
IMS/MS 51.6 2090.2 59.8 21.84 2.56 2.15 49.6 2090.2 59.8 21.96 2.55 2.16 50.5 2104.4 45.6 21.54 2.58 2.18 av 2.16 SD a0.02
Parametric Cell 56 32 1712 86 16.50 2.57 2.13 57 32 1712 86 16.26 2.61 2.16 53 32 1712 86 16.73 2.54 2.13 av 2.14 SD i0.02
Z satisfies
s* = (g( $)b,.)"' Because of the complex nature of the mobility function of eqs 3, 14, and 15, the expression for KO is broken up into four Parts
KO = ABCD (22) where
(23)
(24)
C = 273.15/(273.15 + 2') (25) D = PI760 (26)
Then,
sc = 273.15sTI(273.15 + n2 (29)
SD = spf760 (30) and
Table V shows typical values for each of these parameters along with their uncertainty. When all the computations are complete, a 1.8% uncertainty in the value of the reduced mobility is found.
An analysis of the contributions to the error shows that the errors associated with the A, B, and D terms are many times more significant than the C term. In fact, a 4 "C variation in temperature can be tolerated before it contributes signif- icantly to the error. The separate contributions by the A, B, and D terms are approximately equal with the D term, becoming insignificant for pressure variations less than 5 mmHg. Long-term (1 year) measurements on the protonated water reactant ion showed a 2.1 % peak-to-peak fluctuation
Table V. Typical Uncertainties for XI Parameters parameter value uncertainty
t , (8) 7.5 x lo-' 2.0 x lV t d (8) 16.5 X 1Oa 8.0 X 1V a 1.13 0.2 v, (V) 32.0 0.5 vm (V) 1712 1 Vac (VI 86.0 0.5 d, (cm) 0.14 0.01 dm (Cm) 8.06 0.01
T ( O C ) 55 1 P (mmHg) 760 10 A (8-1) 58.26 0.49 B (cm2 V-1) 4.44 x 10⁻² 5.1 X lo-' C 0.832 4 X 1 W D 1.0 2x10⁴ KO (cm2 V-18-1) 2.14 0.04
dac (cm) 0.71 0.03
if no attempt was made to adjust for variations in atmospheric pressure. This level of fluctuation corresponds to a relative standard deviation of 1.4%, close to the 1.8% noted above for Table V.
The correction of the measured drift time, td,,,,,ecu, for the gate width, t,, makes asignificant contribution to the A term. If this correction is not included, a 5 % bias in reported mobility values is possible. Similarly, the time spent by the ion in the region between the aperture grid and colledor makes a major contribution to the B term. The issue here is the inability to measure accurately dac. Efforts to reduce this term by increasing the potential applied to the aperture grid aggravates microphonic noise.
Distortion of the drift field by the shutter grid is an insignificant term for purposes of calculating reduced mo- bilities.
CONCLUSIONS
By definition, the mobility of an ion is related to the length of the drift tube used to make ita measurement. However, the procedures used to make the measurement are dependent on the design and construction of the IMS cell. To state that mobility is a proportionality constant between drift velocity and electric field is too simplistic. Corrections must be made for the gate width used to introduce the ions into the drift tube, for the finite separation between the aperture grid and collector, and for atmmpheric pressure. When a parallel plane shutter grid is used to introduce the ions into the drift tube, loss of ions between the two half-grids makes an important contribution.
The theory and procedure(s) of this paper provide a framework within which a careful measurement of mobility can be made. While the procedures are quite complex, calibration is completed when a relationship between the measured drift time and ion mobility is found for a particular IMS cell.
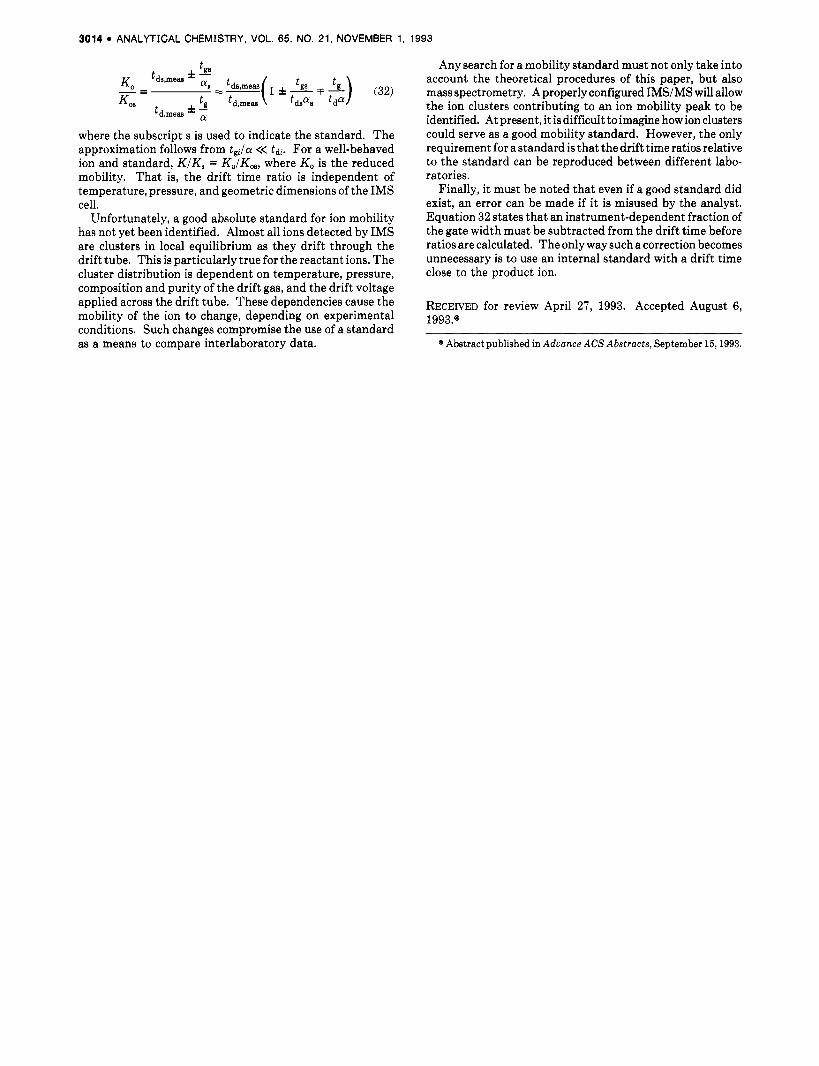
For two reasons, there might be cause to avoid the procedures of this paper. First, exact knowledge of ion mobilities is not necessary to flexibility use IMS as an analytical instrument. Second, increased performance might be obtained from an IMS if nonlinear electric fields are used to transport ions through the cell.21 For these applications, drift time ratios measured relative to a selected standard (e.g., a reactant ion) may be more than adequate. For example if K, is the mobility of the standard, eqs 16 and 17 become
(21) Blanchard, W. C. Znt. J. Mass Spectrom. Zon Processes 1989,95, 199-210.
3014 ANALYTICAL CHEMISTRY, VOL. 65, NO. 21, NOVEMBER 1, 1993
'd,meae
where the subscript s is used to indicate the standard. The approximation follows from t,Ja << t d i . For a well-behaved ion and standard, KIK, = K,/K,, where KO is the reduced mobility. That is, the drift time ratio is independent of temperature, pressure, and geometric dimensions of the IMS cell.
Unfortunately, a good absolute standard for ion mobility has not yet been identified. Almost all ions detected by IMS are clusters in local equilibrium as they drift through the drift tube. This is particularly true for the reactant ions. The cluster distribution is dependent on temperature, pressure, composition and purity of the drift gas, and the drift voltage applied across the drift tube. These dependencies cause the mobility of the ion to change, depending on experimental conditions. Such changes compromise the use of a standard as a means to compare interlaboratory data.
Any search for a mobility standard must not only take into account the theoretical procedures of this paper, but also mass spectrometry. A properly configured IMS/MS will allow the ion clusters contributing to an ion mobility peak to be identified. At present, it is difficult to imagine how ion clusters could serve as a good mobility standard. However, the only requirement for a standard is that the drift time ratios relative to the standard can be reproduced between different labo- ratories.
Finally, it must be noted that even if a good standard did exist, an error can be made if it is misused by the analyst. Equation 32 states that an instrument-dependent fraction of the gate width must be subtracted from the drift time before ratios are calculated. The only way such a correction becomes unnecessary is to use an internal standard with a drift time close to the product ion.
RECEIVED for review April 27, 1993. Accepted August 6 , 1993.e
Abstract published in Aduance ACS Abstracts, September 15,1993.