Embed Size (px)
Citation preview

Theory and Application of Electrochemical Impedance Spectroscopy for Fuel Cell Characterization
Wagner N., Schiller G., Friedrich K.A. Deutsches Zentrum für Luft-
und Raumfahrt e.V. (DLR)
Institut für Technische Thermodynamik Pfaffenwaldring 38-40, 70569 Stuttgart
Presentation
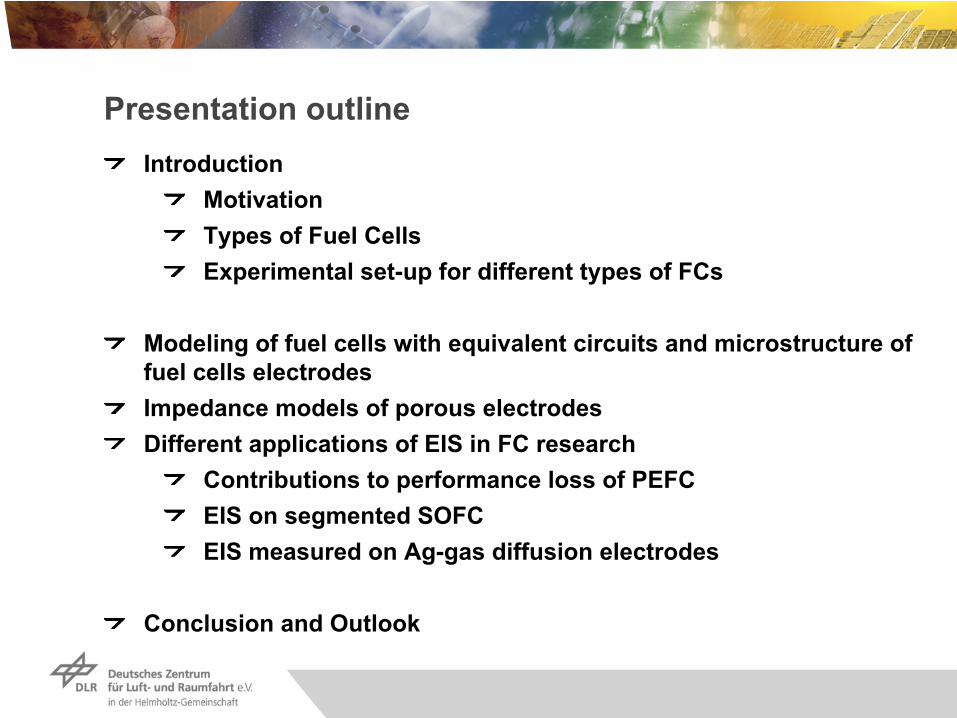
outlineIntroduction
MotivationTypes
of Fuel
Cells
Experimental set-up
for
different types
of FCs
Modeling
of fuel
cells
with
equivalent
circuits
and microstructure
of fuel
cells
electrodes
Impedance
models
of porous
electrodesDifferent applications
of EIS in FC research
Contributions
to performance
loss
of PEFCEIS on segmented
SOFC
EIS measured
on Ag-gas
diffusion
electrodes
Conclusion
and Outlook

Motivation
Characterization of Fuel Cells by Electrochemical Impedance Spectroscopy:
Determination of electrode structure and reactivity, separation of electrode structure from electrocatalytical
activity
Determination of electrochemical active surface (locally resolved)Determination of reaction mechanism and separation of different overvoltage contributions to the fuel cell performance lossDetermination of degradation mechanism of electrodes, electrolyte and other fuel cell components (bipolar plates, end plates, sealings, etc.)Determination of optimum operation condition (e.g. gas composition, temperature, partial pressure), cell design (flow field) and stack design

Schematic
representation
of main
types
of fuel
cells
AFC80 °C
PEM80 °C
PAFC200 °C
MCFC650 °C
SOFC1000 °C
O2
H2
AlkalineFC
PhosphoricAcidFC
MoltenCarbonate
FC
SolidOxide
FC
PolymerElectrolyt
MembraneFC
H2
OH-
H+
H+
CO3
-2 O-2
O H O2 2
H H O2 2
O H O2 2
H H OCO CO
2 2
2
H H OCO CO
2 2
2
CO O2 2 O2Current
Load
Oxidant
Anode
Tem perature
Charge carrierin electrolyte
Cathode
Fuel gas

Experimental set
up and cells
used
for
EIS
Fuel
„half“
cell
with
liquid electrolyte
Segmented
and single
PEFC cell
(polymer electrolyte)
Test cell
for
SOFC (short
stack)
(Solid Oxide Electrolyte)

Fuel
cell
overvoltage
and current
density
/ voltage
characteristic
Cathode
d +(r )P
oten
tial
Current density (Current/Surface?)
0, Cathode
ct,C
d +(r )
ct,AAnode
Cell
Voltage
(UC
)
Hydrogen Oxidation Reaction (HOR):
H2 = RT/2F i/i*
Oxygen Reduction Reaction (ORR):
O2/air = RT/[(1-)2F] [ln i - ln i*]
Ohmic loss
= iR
Transport limitation (diffusion)
d = -
RT/2F ln (1 - i/ilim )
Fuel cell voltage
UC
= U0
-
ct,H2
-
ct,O2/air
-
d
-
U0
0Cathode

Electrochemical
Impedance
Spectroscopy: Application
to Fuel
Cells

Electrochemical
Impedance
Spectroscopy: Application
to Fuel
Cells
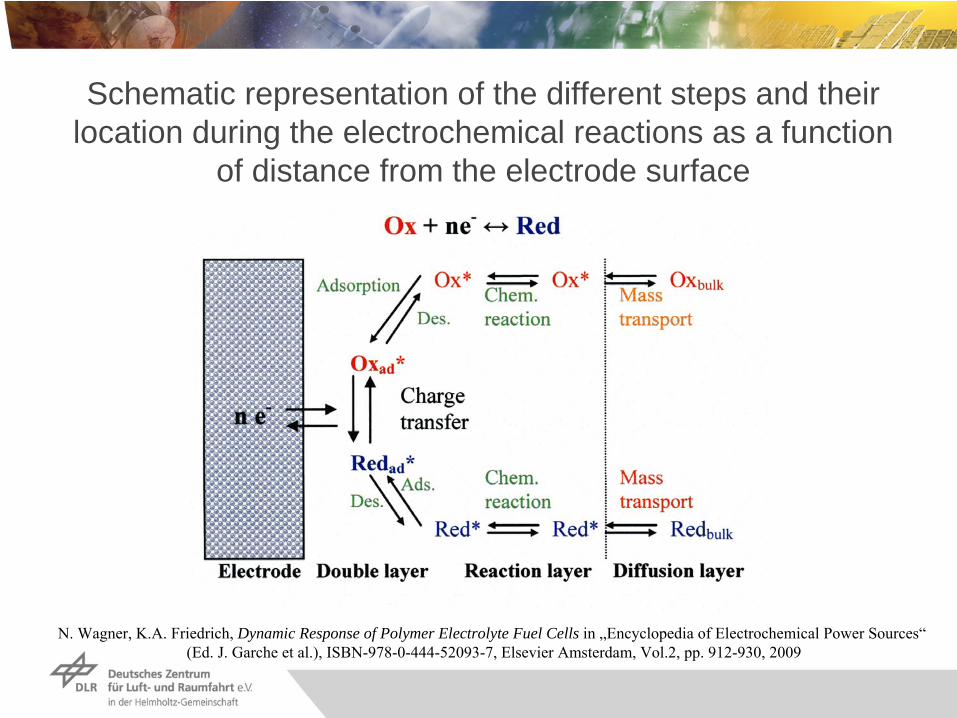
Schematic representation of the different steps and their location during the electrochemical reactions as a function
of distance from the electrode surface
N. Wagner, K.A. Friedrich, Dynamic Response of Polymer Electrolyte Fuel Cells in „Encyclopedia of Electrochemical
Power Sources“
(Ed. J. Garche
et al.), ISBN-978-0-444-52093-7, Elsevier
Amsterdam, Vol.2, pp. 912-930, 2009

Overview
of the
wide
range
of dynamic
processes
in FC
10-6 10-5 10-4 10-3 10-2 10-1 100 101 102 103 104 105 106 107 108
microseconds milliseconds seconds minutes hours days months
Electric double layercharging
Charge transfer fuel cellreactions
Gas diffusion processes
Membrane humidification
Liquid watertransport
Changes in catalyticproperties / poisoning
Temperatureeffects
Degradation and ageing effects
Time / s10-6 10-5 10-4 10-3 10-2 10-1 100 101 102 103 104 105 106 107 108
microseconds milliseconds seconds minutes hours days months
Electric double layercharging
Charge transfer fuel cellreactions
Gas diffusion processes
Membrane humidification
Liquid watertransport
Changes in catalyticproperties / poisoning
Temperatureeffects
Degradation and ageing effects
Time / s

Bode representation of EIS measured at different current densities, PEFC operated at 80°C with H2
and O2
at 2 bar
Phase o Impedance / m
Frequency / Hz
0
20
40
60
80
10
20
15
30
50
10m 100m 1 10 100 1K 10K 100K
Diffusion RMCharge transfer
of ORR
O
V=597 mV; i=400 mAcm-2
V=497 mV; i=530 mAcm-2
V=397 mV; i=660 mAcm-2
+
V=317 mV; i=760 mAcm-2
Charge transfer
of HOR

PEFC: Schematic
Diagram (cross section)
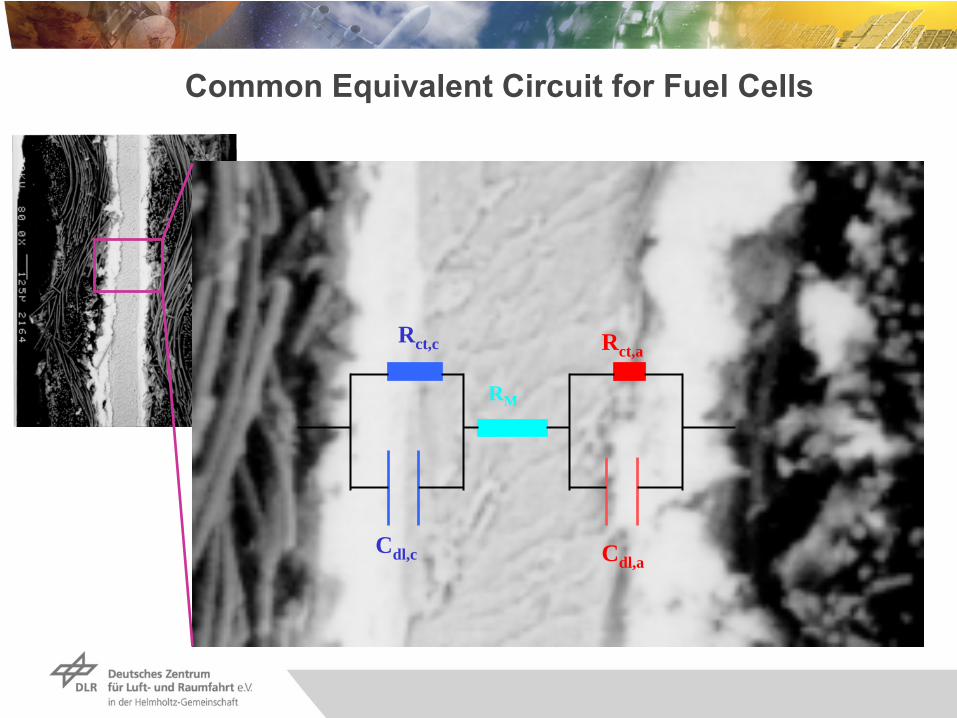
Common Equivalent
Circuit
for
Fuel
Cells
Cdl,a
RM
Rct,a
Cdl,c
Rct,c
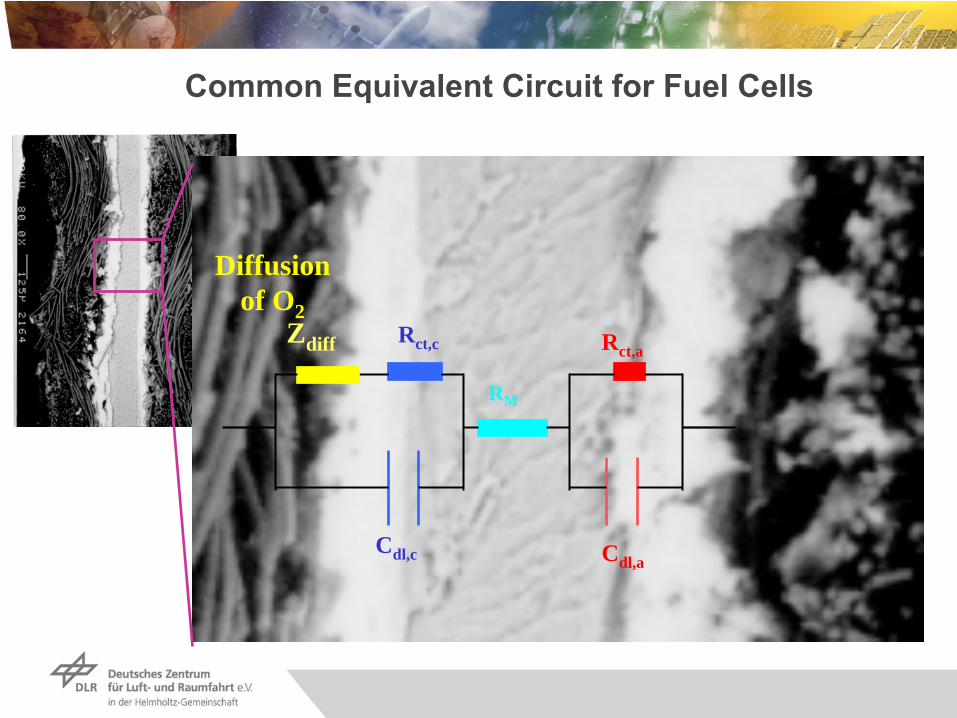
Common Equivalent
Circuit
for
Fuel
Cells
Cdl,a
RM
Rct,a
Cdl,c
Rct,cZdiff
Diffusion of O2

Common Equivalent
Circuit
for
Fuel
Cells
Cdl,a
RM
Rct,a
Cdl,c
Rct,c ZdiffZdiff
Diffusion of H2
?

SEM micrograph
of PEFC elctrode
(Pt/C+PTFE)
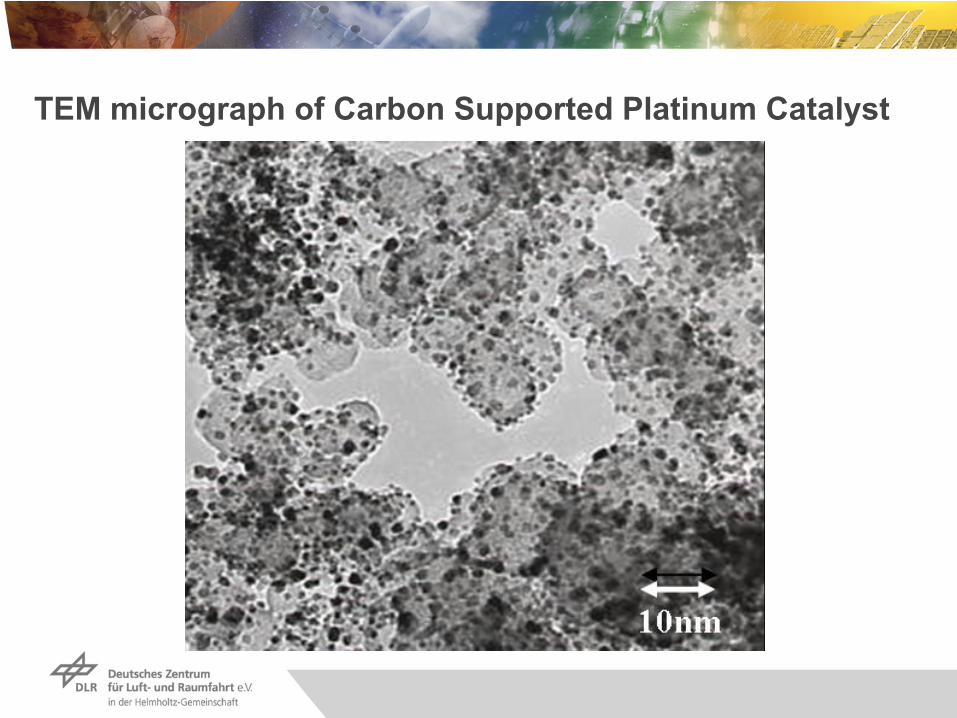
TEM micrograph
of Carbon
Supported
Platinum
Catalyst

SEM-picture
of Silver-Gas
Diffusion Cathode
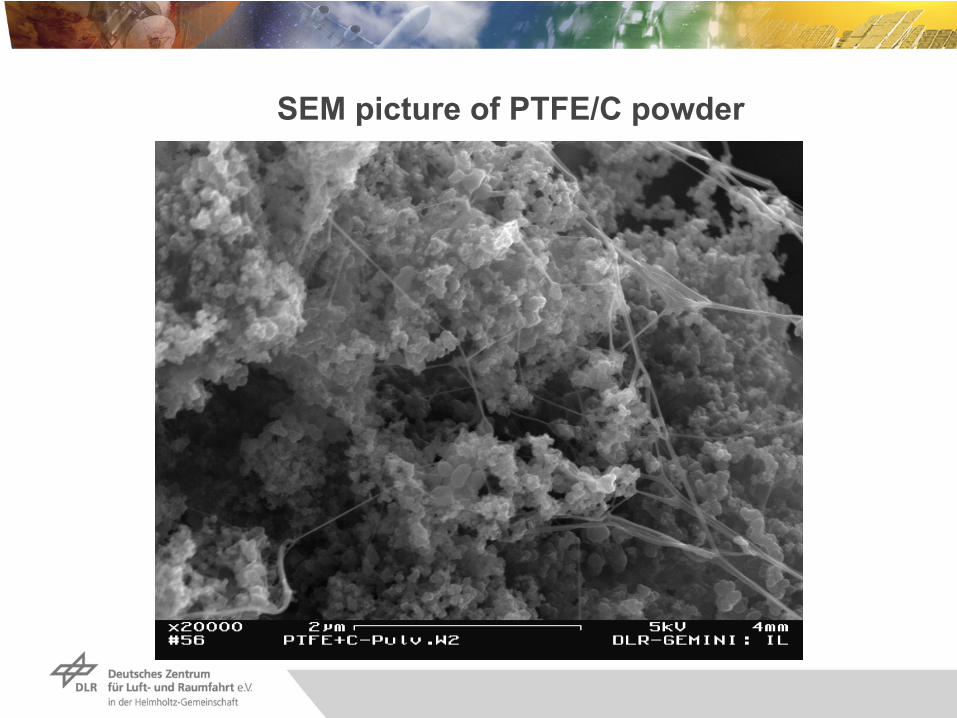
SEM picture
of PTFE/C powder

Field
of application
of porous
electrodesBatteries
and supercaps
Process
fluids
Hydro- gen
GDE
Packed
bed
cathodeMembrane
Auxiliary
supply
Current
collector
Water purification
and treatment
(Bio)-Organic
synthesis
Fuel
Cells
O22H
O22H O ,membranereaction layerdiffusion layer
flow field/current collector
electrons
l c i o ee e tr cal p w r
r t np o o s
a h danode c t o e
Electrolysis
(Water, NaCl, HCl, etc.)
NaCl H2 O
NaOH
Cl-Na+
OH-+ -
Cl2
O2

imag
inar
y pa
rt /
real part /
0
-3
-2
-2.5
-1
-1.5
-0.5
-1 -0.5 0 0.5 1 1.5 2
C=500mFPore
Nyquist representation
of Impedance
of RC- transmission
line, model
of a flooded
pore
R
C
R = 3 Ω C = 0.5 F
RCiCi
RiZ
coth)(
R0 R0
= R/3 = δL/3πr2
δ
= specific
electrolyte
resistancer = pore
radius
L = pore
lenght
Lr
100 mHz

Nyquist representation
of porous
electrode impedance
with
faradaic
impedance
element
imag
inar
y pa
rt /
real part /
0
-3
-2
-2.5
-1
-1.5
-0.5
-0.5 0 0.5 1 1.5 2 2.5
C=500mFC+Rpor(3 Ohm)C//R(1.5 Ohm)
r
c rct
r = 3 c = 500 mFrct
= 1.5

Agglomerated
Electrodes
Hierarchical model (Cantor-block model)
metal side
electrolyte sideionic current
Gas (backing) side
electrolyte sideionic current
M. Eikerling, A.A. Kornyshev, E. Lust J. Electrochem. Soc., 152
(2005) E24
ll
l/al/alz
lz/az
n = 0
n = 1
ll
l/al/alz
lz/azn = 2
S.H. Liu, Phys. Rev. Letters, 55(1985) 5289T.Kaplan, L.J.Gray, and S.H.Liu, Phys. Rev. B 35 (1987) 5379

mZZe
Current collector GDL
electrolyte pores
porous layer
Zs1 ZsnZsi
ZpnZpiZp1
Z q1 Zqi Zqn
H. Göhr in Electrochemical Applications/97, www.zahner.de
Cylindrical homogeneous porous electrode model (H. Göhr)
Ions (H+, OH -,..)
I I
Por
e
Ele
ctro
de, p
orou
s lay
er
Electrolyte Zq
Zp ZS
Zo
Zn
Current (e-)

Electrochemical
Impedance
Spectroscopy: Experimental Set-up
Electrochemical workstation
PEFC
Flow contollerPressure regulator
Humidifier

Bode diagram of measured EIS at different cell voltages
Phaseo
Impedance /
Frequency / Hz
0
20
40
60
80
10m
30m
100m
300m
1
3
10m 100m 1 10 100 1K 10K 100K
O
E=1024 mV; I=0 mA
E=841 mV; I=1025 mA
E=597 mV; I=9023 mA+
E=317 mV; I=17510 mA
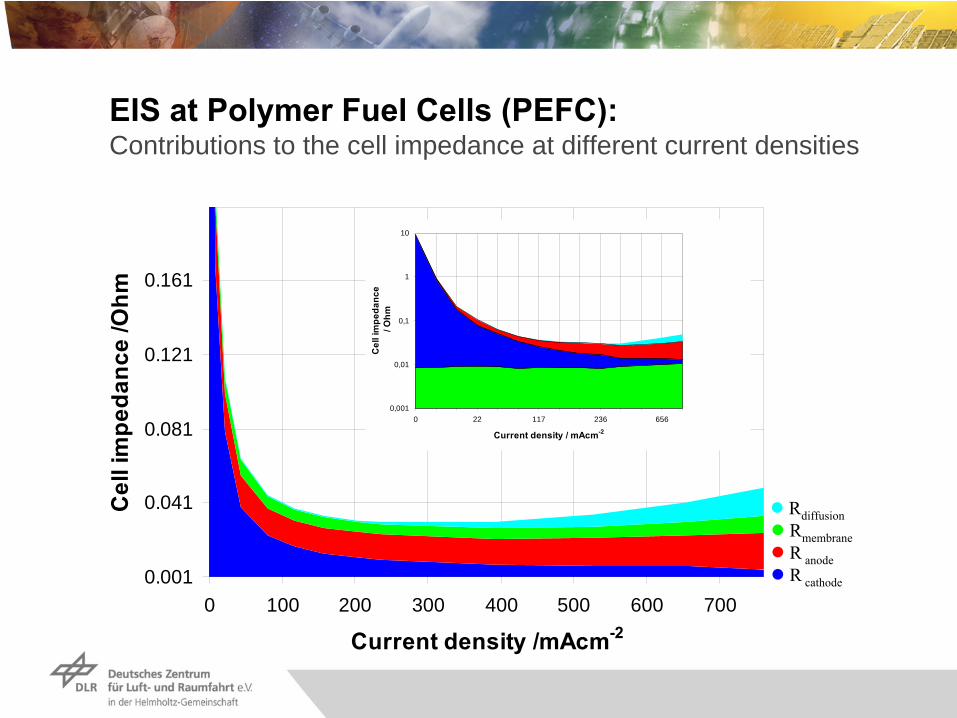
EIS at Polymer Fuel
Cells
(PEFC): Contributions to the cell impedance at different current densities
0.001
0.041
0.081
0.121
0.161
0 100 200 300 400 500 600 700
Current density /mAcm-2
Cel
l im
peda
nce
/Ohm
Rdiffusion
Rmembrane
R anode
R cathode
0,001
0,01
0,1
1
10
0 22 117 236 656
Current density / mAcm-2
Cel
l im
peda
nce
/ O
hm

EIS at Polymer Fuel
Cells
(PEFC): Contributions to the overal U-i characteristic determined by EIS
200300400500600700800900
10001100
0 100 200 300 400 500 600 700 800
Current
density
/ mAcm-2
Cel
l vol
tage
/ mV
E0
EC
EA
EM
EDiff.
Cdl,a
RM
RA
Cdl,c
RK
CN
RN

0
5
10
15
20
25
30
35
40
0 2 4 6 8 10 12 14 16 18
Current / A
Pore
ele
ctro
lyte
resi
stan
ce /
mO
hm
0
200
400
600
800
1000
1200
Cel
l vol
tage
/ m
V
Evaluation of EIS with the porous electrode model Summary of current density dependency of pore resistance elements
Pore Electrolyte
Resistance
AnodePore Electrolyte
Resistance
Cathode

Segmented
SOFC cell
design
with
segmented
bipolar plates
16 Segments withfuel
gas channels Capillary for gas chromatography
Current
probe 16 Segments withair
flow
channels
Voltageprobe
Metallic housing
Thermo- couple
SOFC
13 14 15 16
9 10 11 12
5 6 7 8
1 2 3 4
fuel
gas air
22
20 lnHO
OHrevrev pp
pzFRTUU
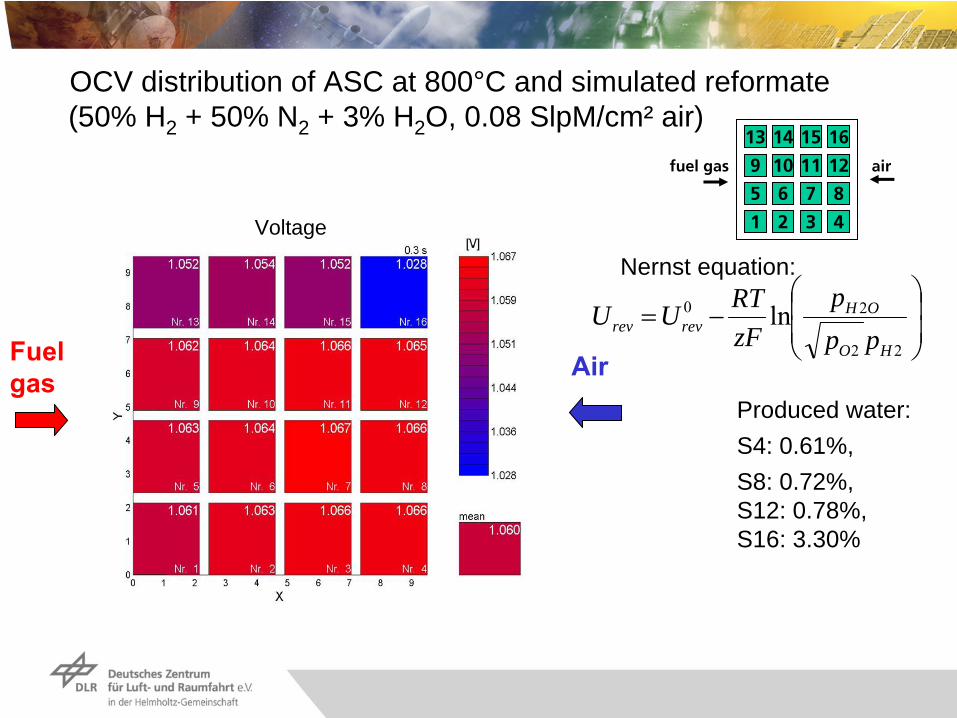
Nernst equation:
Produced water:S4: 0.61%, S8: 0.72%, S12: 0.78%, S16: 3.30%
OCV distribution of ASC at 800°C and simulated reformate (50% H2 + 50% N2 + 3% H2 O, 0.08 SlpM/cm² air)
Fuel gas Air
Voltage

EIS at OCV, ASC with
segmented
cathode, 77.44 cm2
Dry
hydrogen
Hydrogen+ 3% H2
O

Bode Diagram of EIS, measured
at PEFC, 75°C, 0.5 Acm-2 Variation of gas flow
rates
0
15
30
45
60
75
90
2
5
10
20
1 3 10 100 1K 10K
O
1.5H; Air = 1.2; E = 644 mV+
1.5H; Air = 1.5; E = 675 mV
1.1H; Air = 2; E = 653 mV
1.5H; Air = 2; E = 654 mV active surface area 50 cm2
Impedance / m Phase / °
o

EIS on PEFC, 80°C, 5 A, cathode fed with different gas composition, λ=1.5, N111 IP CCM (Ion Power Inc.)
100m 1 2 5 10 30 100 300 1K 3K
8
10
20
15
25
|Z| / m
0
15
30
45
60
75
90|phase| / o
frequency / Hz
Air 5 A
50% He+50% O2 5 A50% N2+50% O2 5 A
Oxygen 5 A
10 15 20 25
0
-10
-5
5
Z' / m
Z'' / m
Air 5 A
50% He+50% O2 5 A50% N2+50% O2 5 A
Oxygen 5 A

Reactive
Mixing
and Rolling (RMR) GDE Production
Technique
for
AFC Electrodes

Schematically
representation
of cell
voltage
and potentials
in an alkaline
fuel
cell
AFC
Cathode
with
ORRO2 + 2 H2
O + 4 e-→ 4 OH-
Anode 2 H2 + 4 OH-
→ 4 H2
O + 4 e-
Current
density
Cell
Voltage
[V]
-0.83
+1.36
+0.40
ΔE0
= 1.23V

Current
density
/ potential characteristic
Cathode
Pot
entia
l
Current density
0, Cathode
k,C
d
U0
0Cathode
Reference
CE RE ODCHg/HgO
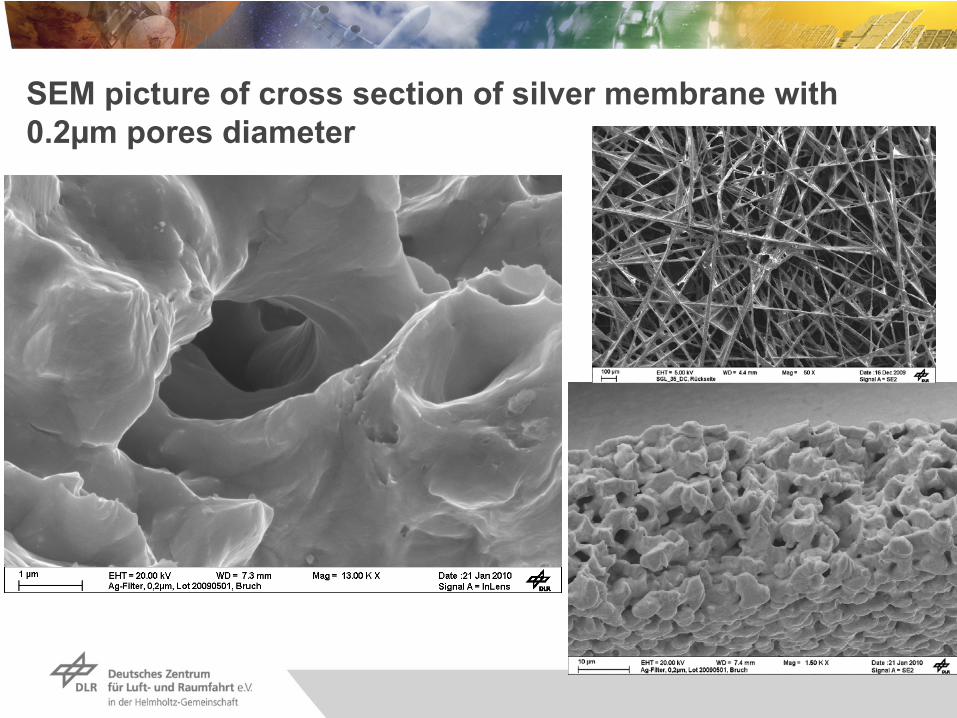
SEM picture
of cross section
of silver
membrane
with 0.2µm pores
diameter

CV‘s
(1 mV/s) from
-700 mV to 450 mV vs. Hg/HgO
bei 80°C in 10 M NaOH, O2
-600 -400 -200 0 200 400
0
-400
-200
200
Potential / mV
Current / mA
0.2um
0.8um
0.45um
1.2um3.0um
5.0um

Vergleich Impedanzspektren, aufgenommen in 10 M NaOH bei 80°C, -700 mV vs. Hg/HgO
nach 60 Minuten
1 2 5 10 30 100 300 1K 3K 10K 30K
500m
700m
1
1.5
|Z| /
0
15
30
45
60
75
90|phase| / o
frequency / Hz
1.2um
0.45um
3.0um
0.2um0.8um
5.0um
0.6 0.8 1 1.2 1.4 1.6
0
-800
-600
-400
-200
200
400
Z' /
Z'' / m
1.2um
0.45um3.0um 0.2um0.8um5.0um
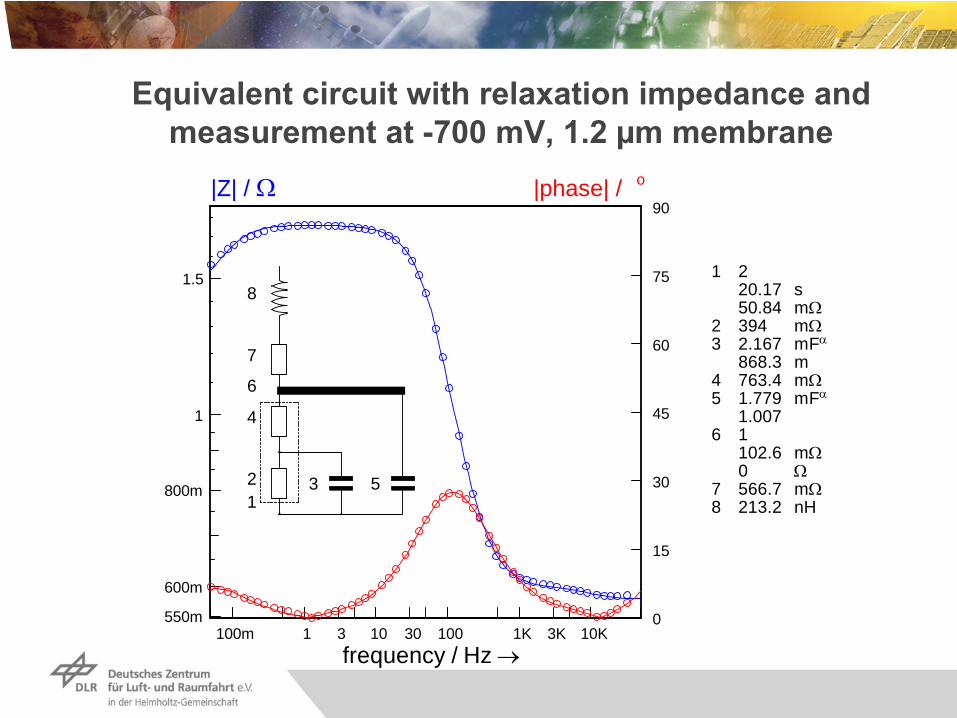
Equivalent
circuit
with
relaxation
impedance
and measurement
at -700 mV, 1.2 µm membrane
100m 1 3 10 30 100 1K 3K 10K
600m
550m
800m
1
1.5
|Z| /
0
15
30
45
60
75
90|phase| / o
frequency / Hz
1 2
4
6
7
8
3 5
1 2 20.17 s 50.84 m
2 394 m3 2.167 mF
868.3 m 4 763.4 m5 1.779 mF
1.007 6 1
102.6 m 0
7 566.7 m8 213.2 nH

Conclusion
Determination of the individual potential losses during fuel cell operation
Determination of degradation mechanism and performance loss
Improvement of fuel cell performance and stability by understanding instead of trial and error
Determination of critical
operation
conditions
of fuel
cells