Embed Size (px)
Citation preview
Theoretical and Experimental Factors Influencing the Accuracy of Analytical Rate Measurements
J. D. Ingle, Jr., and S . R. Crouch Department of Chemistry, Michigan State University, East Lansing, Mich. 48823
A theoretical treatment of various rate equations in- dicates that the choice of rate measurement approach depends on the characteristics of the reaction used for analysis, the kinetic role of the sought-for species, and the signal-concentration relationship of the trans- ducer used to follow the reaction. The fixed-time ap- proach is superior for first or pseudo-first order re- actions and determinations of substrate concentra- tions in enzyme reactions. In contrast, rate analysis of enzyme activity or other catalysts is best suited for the variable-time procedure. The variable-time approach is also advantageous for nonlinear response curves.
RECENT WORK with digital instrumentation for reaction rate methods has shown that the two integral rate approaches, the fixed-time and the variable-time, can be implemented with high accuracy and precision ( I , 2). Relative errors and stan- dard deviations have been reduced to the 0.1 level for mea- surements on synthetically generated slopes which simulate the outputs of typical transducers used to monitor chemical reactions. The application of these rate computation sys- tems to real chemical samples has improved the reliability of the kinetic approach to analysis and reduced the relative errors and standard deviations to the 1-2
Because of the increased reliability of rate computation systems, a very important factor in developing improved reaction rate methods is the choice of the proper measure- ment approach. Since both of the integral approaches in- volve finite concentration changes, errors can result merely by choosing the wrong approach for a given situation. In addition, integral rate methods can be accurate for a wide dynamic range of rates if the correct approach is chosen.
Equations are developed here to point out the factors which influence the choice of measurement approach and to de- scribe the errors that can be encountered as a result of the incorrect approach. Although a previous theoretical treat- ment of kinetic methods has been made (3), the results ob- tained her? point out in detail the unique situations in which the variable-time method is the method of choice and those in which the fixed-time approach is superior. The results of the calculations indicate that the choice of measurement ap- proach depends strongly on the kinetic characteristics of the reaction being utilized for analysis. In addition, the charac- teristics of the instrumental technique used to follow the reac- tion and the kinetic role of the sought-for species are impor- tant factors. For instrumental systems giving a linear con- centration-signal relationship, the fixed-time approach is shown to be superior to the variabie-time method when first or pseudo-first order reactions are used or when substrates are determined using enzyme catalyzed reactions. The variable-time method is superior in most cases involving non- linear response curves (3). In addition, the results derived
(1) J. D. Ingle, Jr., and S. R. Crouch, ANAL. CHEM., 42, 1055
(2) R. A. Parker. H. L. Pardue, and B. G. Willis, ibid., p 56. (3) H. L. Pardue in “Advances in Analytical Chemistry and In-
strumentation,” C. N. Reilley and F. W. McLafferty, Ed., Vol. 7, Wiley-Interscience, New York, N. Y . , 1969, pp 141-207.
range.
(1 970).
here indicate that the variable-time approach is also superior for enzyme activity measurements and for all catalytic re- actions where the catalyst is the sought-for species.
MATHEMATICAL TREATMENT
The fixed-time approach to reaction rate analysis involves the measurement of the concentration change which occurs during a preselected time interval, while the variable-time technique measures the time required for a fixed concentration change to occur. As will be shown below, considerable sim- plification of the relationships between the measured quantity and initial concentrations results if measurements are made near the beginning of the reaction where pseudo-zero order kinetics prevail. However, as will be seen, both of the in- tegral rate approaches are uniquely suited for certain situa- tions, and for these, it is no longer necessary to make measure- ments during the initial stages of the reaction Hence for these favorable cases, a large dynamic range of concentrations can be measured with little restriction.
There are several types of reactions that have been utilized for kinetic methods. A previous theoretical treatment has considered a completely generalized reaction (3) , but this approach fails to point out several unique features. First or pseudo-first order uncatalyzed reactions are first considered, followed by a discussion of enzyme catalyzed reactions for determinations of enzyme activities and substrate concen- trations. Other homogeneous catalytic reactions for the determination of the catalyst concentration are then discussed. Finally, the characteristics of the instrumental technique used for following the reaction are examined.
Pseudo-First Order Reactions. GENERAL TREATMENT. In many analytical rate methods, conditions are controlled so that pseudo-first order kinetics exist. For irreversible cases, the reaction can be written as
k R + P
where k is the pseudo-first order rate constant. The concen- tration of R at any time is given by
[R] = [R]oe-kt
where [RI0 is the initial concentration of R . The theoretical rate a t any time is found by differentiating Equation 2:
- k[R] = ~ k [ R ] , e - ~ ~ Ratet = ~ - - d[Rl
dt (3)
With the integral rate methods, either A[R] is measured for a fixed-time interval, At, or At is measured for a constant A[R]. The relationship of the measured quantity to initial concentration can be obtained by integrating Equation 3
-A[R] = [R],(e-kt’ - e-k tz ) (4)
where t l and t2 are the starting and finishing times of the mea- surement. Here it is assumed that the reaction can be followed by some reaction monitor whose response is linear with con- centration or can be electronically linearized so that the change
ANALYTICAL CHEMISTRY, VOL. 43, NO. 6, MAY 1971 697
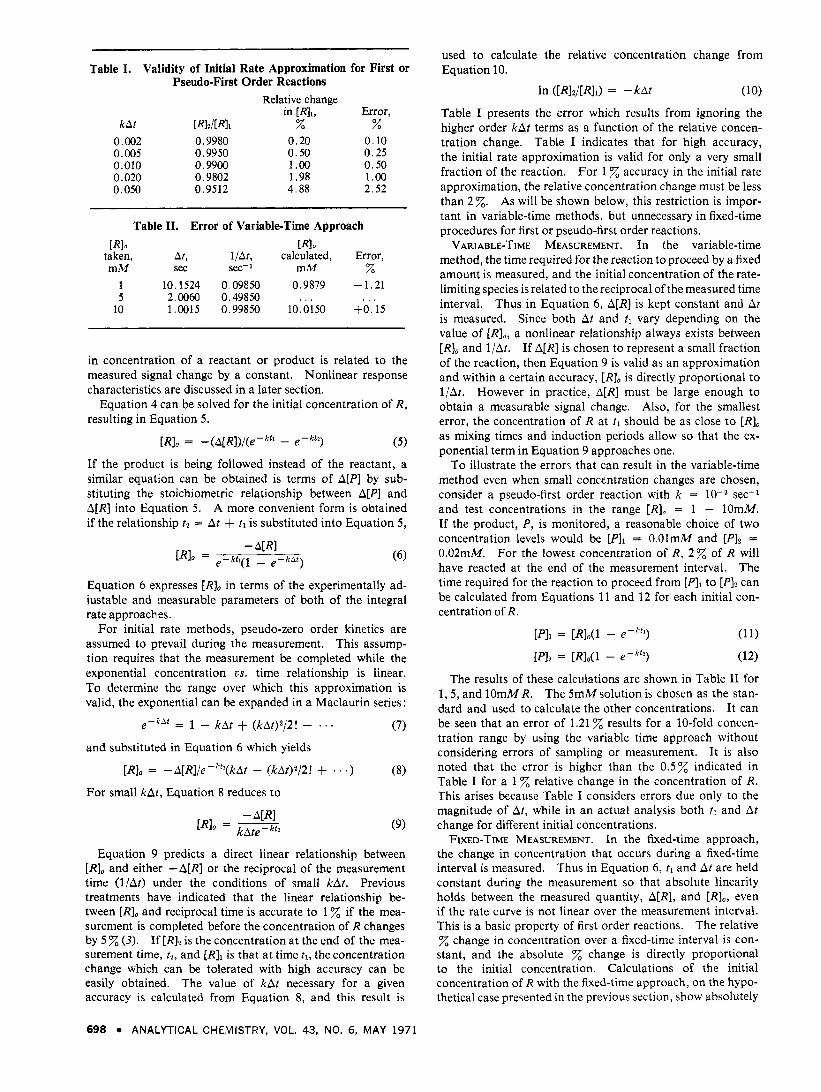
Table I. Validity of Initial Rate Approximation for First or Pseudo-First Order Reactions
Relative change in [Rh, Error,
k a t [RIZ/[Rll z z 0.002 0.9980 0.20 0.10 0.005 0.9950 0.50 0.25 0.010 0.9900 1.00 0.50 0.020 0.9802 1.98 1 .00 0.050 0.9512 4.88 2.52
Table 11. Error of Variable-Time Approach [Rlo [RIO
taken, At, l / A t , calculated, Error, mM sec sec-l mM z
1 10.1524 0.09850 0.9879 -1.21 5 2.0060 0.49850 . . . . . .
10 1.0015 0.99850 10.0150 $0.15
in concentration of a reactant or product is related to the measured signal change by a constant. Nonlinear response characteristics are discussed in a later section.
Equation 4 can be solved for the initial concentration of R, resulting in Equation 5.
[R] , = - (AIR])/ (e-kf l - e -k t* ) (5)
If the product is being followed instead of the reactant, a similar equation can be obtained is terms of A[P] by sub- stituting the stoichiometric relationship between A[P] and A[R] into Equation 5. A more convenient form is obtained if the relationship f 2 = At + tl is substituted into Equation 5,
Equation 6 expresses [R] , in terms of the experimentally ad- justable and measurable parameters of both of the integral rate approaches.
For initial rate methods, pseudo-zero order kinetics are assumed to prevail during the measurement. This assump- tion requires that the measurement be completed while the exponential concentration ES. time relationship is linear. To determine the range over which this approximation is valid, the exponential can be expanded in a Maclaurin series:
e - -kAf = 1 - kAt + ( k A p / 2 ! - . . .
[RI, = -AIRl/e-ktl(kAt - (kAt)*/2! + - . .)
(7) and substituted in Equation 6 which yields
(8) For small kAt, Equation 8 reduces to
(9)
Equation 9 predicts a direct linear relationship between [RI, and either -A[R] or the reciprocal of the measurement time ( l / A r ) under the conditions of small kAt. Previous treatments have indicated that the linear relationship be- tween [R] , and reciprocal time is accurate to l % if the mea- surement is completed before the concentration of R changes by 5 % (3) . If [RI2 is the concentration at the end of the mea- surement time, t2, and [RI1 is that at time tl, the concentration change which can be tolerated with high accuracy can be easily obtained. The value of kAt necessary for a given accuracy is calculated from Equation 8, and this result is
used to calculate the relative concentration change from Equation 10.
In (IRIP/[RIJ = - k a t (10)
Table I presents the error which results from ignoring the higher order kAr terms as a function of the relative concen- tration change. Table I indicates that for high accuracy, the initial rate approximation is valid for only a very small fraction of the reaction. For 1 % accuracy in the initial rate approximation, the relative concentration change must be less than 2 %. As will be shown below, this restriction is impor- tant in variable-time methods, but unnecessary in fixed-time procedures for first or pseudo-first order reactions.
VARIABLE-TIME MEASUREMENT. In the variable-time method, the time required for the reaction to proceed by a fixed amount is measured, and the initial concentration of the rate- limiting species is related to the reciprocal of the measured time interval. Thus in Equation 6, A[R] is kept constant and At is measured. Since both At and tl vary depending on the value of [R] , , a nonlinear relationship always exists between [R] , and l /At. If A[R] is chosen to represent a small fraction of the reaction, then Equation 9 is valid as an approximation and within a certain accuracy, [R], is directly proportional to l/Ar. However in practice, A[R] must be large enough to obtain a measurable signal change. Also, for the smallest error, the concentration of R at t l should be as close to [R] , as mixing times and induction periods allow so that the ex- ponential term in Equation 9 approaches one.
To illustrate the error3 that can result in the variable-time method even when small concentration changes are chosen, consider a pseudo-first order reaction with k = loF3 sec-l and test concentrations in the range [RI0 = 1 - 10mM. If the product, P, is monitored, a reasonable choice of two concentration levels would be [PI1 = 0.OlmM and [PI2 = 0.02mM. For the lowest concentration of R , 2 z of R will have reacted at the end of the measurement interval. The time required for the reaction to proceed from [PIl to [PI2 can be calculated from Equations 11 and 12 for each initial con- centration of R.
The results of these calculations are shown in Table 11 for 1,5, and lOmMR. The 5mMsolutionis chosen as the stan- dard and used to calculate the other concentrations. It can be seen that an error of 1.21 results for a 10-fold concen- tration range by using the variable time approach without considering errors of sampling or measurement. It is also noted that the error is higher than the 0.5% indicated in Table I for a 1 % relative change in the concentration of R. This arises because Table I considers errors due only to the magnitude of At, while in an actual analysis both tl and At change for different initial concentrations.
FIXED-TIME MEASUREMENT. In the fixed-time approach, the change in concentration that occurs during a fixed-time interval is measured. Thus in Equation 6, tl and At are held constant during the measurement so that absolute linearity holds between the measured quantity, A[R] , and [R] , , even if the rate curve is not linear over the measurement interval. This is a basic property of first order reactions. The relative
change in concentration over a fixed-time interval is con- stant, and the absolute % change is directly proportional to the initial concentration. Calculations of the initial concentration of R with the fixed-time approach, on the hypo- thetical case presented in the previous section, show absolutely
698 ANALYTICAL CHEMISTRY, VOL. 43, NO. 6, MAY 1971
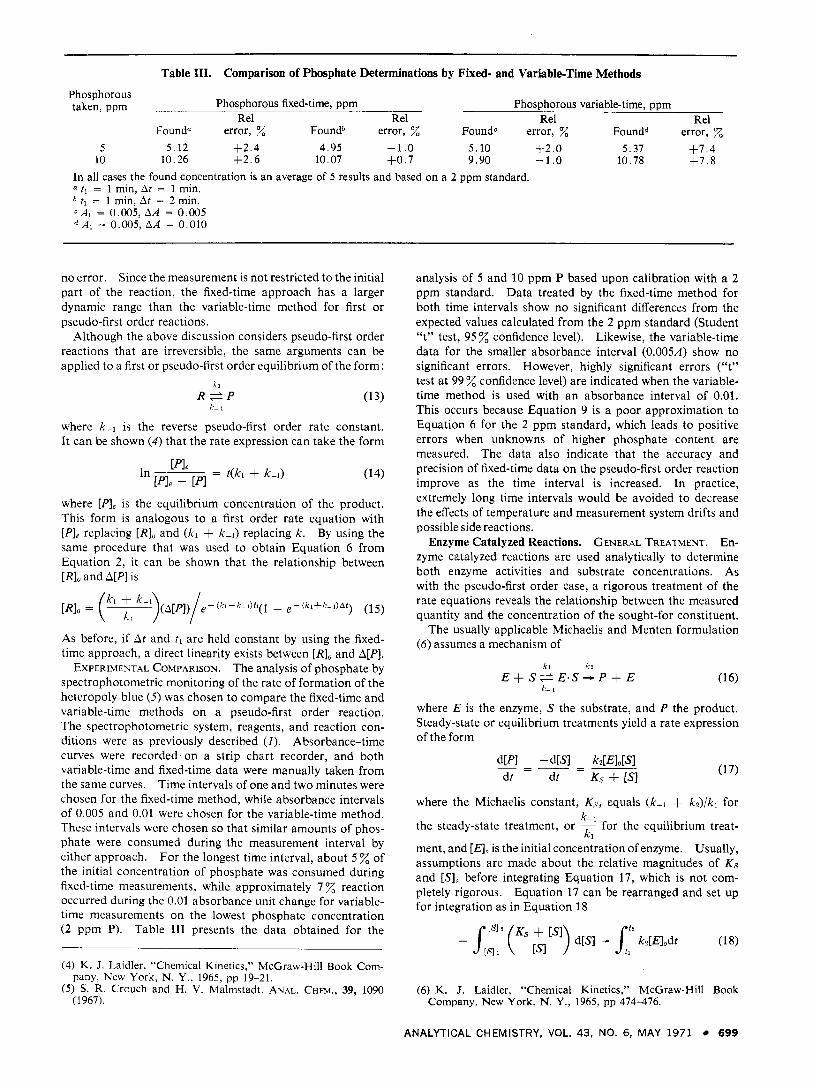
Table 111. Comparison of Phosphate Determinations by Fixed- and Variable-Time Methods
Phosphorous taken, ppm __ Phosphorous fixed-time, ppm Phosphorous variable-time, ppm
Re1 Re1 Re1 Re1 Founda error, Foundb error, FoundC error, Foundd error, %
5 5.12 +2.4 4.95 - 1 .o 5.10 +2.0 5.37 +7.4 10 10.26 + 2 . 6 10.07 +0.7 9.90 -1.0 10.78 +7.8
In all cases the found concentration is an average of 5 results and based on a 2 ppm standard. a ti = 1 min, At = 1 min. b tl = 1 min, At = 2 min. CAI = 0.005, AA 0.005
A1 = 0.005, AA = 0.010
no error. Since the measurement is not restricted to the initial part of the reaction, the fixed-time approach has a larger dynamic range than the variable-time method for first or pseudo-first order reactions.
Although the above discussion considers pseudo-first order reactions that are irreversible, the same arguments can be applied to a first or pseudo-first order equilibrium of the form:
k1
6- 1 R e P
where k - , is the reverse pseudo-first order rate constant. I t can be shown ( 4 ) that the rate expression can take the form
where [PI, is the equilibrium concentration of the product. This form is analogous to a first order rate equation with [PIp replacing [R], and ( k l + kl) replacing k . By using the same procedure that was used to obtain Equation 6 from Equation 2, it can be shown that the relationship between [R], and A[P] is
As before, if At and tl are held constant by using the fixed- time approach, a direct linearity exists between [R], and A[P].
EXPERIMENTAL COMPARISON. The analysis of phosphate by spectrophotometric monitoring of the rate of formation of the heteropoly blue ( 5 ) was chosen to compare the fixed-time and variable-time methods on a pseudo-first order reaction. The spectrophotometric system, reagents, and reaction con- ditions were as previously described (I). Absorbance-time curves were recorded on a strip chart recorder, and both variable-time and fixed-time data were manually taken from the same curves. Time intervals of one and two minutes were chosen for the fixed-time method, while absorbance intervals of 0.005 and 0.01 were chosen for the variable-time method. These intervals were chosen so that similar amounts of phos- phate were consumed during the measurement interval by either approach. For the longest time interval, about 5 of the initial concentration of phosphate was consumed during fixed-time measurements, while approximately 7 reaction occurred during the 0.01 absorbance unit change for variable- time measurements on the lowest phosphate concentration (2 ppm P). Table 111 presents the data obtained for the
(4) K. J. Laidler, “Chemical Kinetics,” McGraw-Hill Book Com-
( 5 ) S. R. Crouch and H. V. Malmstadt, ANAL. CHEM., 39, 1090 pany, New York, N. Y . . 1965, pp 19-21.
(1967).
analysis of 5 and 10 ppm P based upon calibration with a 2 ppm standard. Data treated by the fixed-time method for both time intervals show no significant differences from the expected values calculated from the 2 ppm standard (Student “t” test, 95 x confidence level). Likewise, the variable-time data for the smaller absorbance interval (0.005A) show no significant errors. However, highly significant errors (“t” test a t 99 confidence level) are indicated when the variable- time method is used with a n absorbance interval of 0.01. This occurs because Equation 9 is a poor approximation to Equation 6 for the 2 ppm standard, which leads to positive errors when unknowns of higher phosphate content are measured. The data also indicate that the accuracy and precision of fixed-time data on the pseudo-first order reaction improve as the time interval is increased. In practice, extremely long time intervals would be avoided to decrease the effects of temperature and measurement system drifts and possible side reactions.
Enzyme Catalyzed Reactions. GENERAL TREATMENT. En- zyme catalyzed reactions are used analytically to determine both enzyme activities and substrate concentrations. As with the pseudo-first order case, a rigorous treatment of the rate equations reveals the relationship between the measured quantity and the concentration of the sought-for constituent.
The usually applicable Michaelis and Menten formulation (6) assumes a mechanism of
kl k2
I;- 1
E + S e E.S* P + E (16)
where E is the enzyme, S the substrate, and P the product. Steady-state or equilibrium treatments yield a rate expression of the form
(17) d[Pl -d[Sl kz[ElDl dt dt Ks + [SI
_ _ _ _ _ _ ~ - -
where the Michaelis constant, K,y, equals (k- l + k2) /k l for
the steady-state treatment, or - for the equilibrium treat-
ment, and [Elo is the initial concentration of enzyme. Usually, assumptions are made about the relative magnitudes of Ks and [SI, before integrating Equation 17, which is not com- pletely rigorous. Equation 17 can be rearranged and set up for integration as in Equation 18
k-i ki
( 6 ) K. J. Laidler, “Chemical Kinetics,” McGraw-Hill Book Company, New York, N. Y . , 1965, pp 474-476.
ANALYTICAL CHEMISTRY, VOL. 43, NO. 6, MAY 1971 699
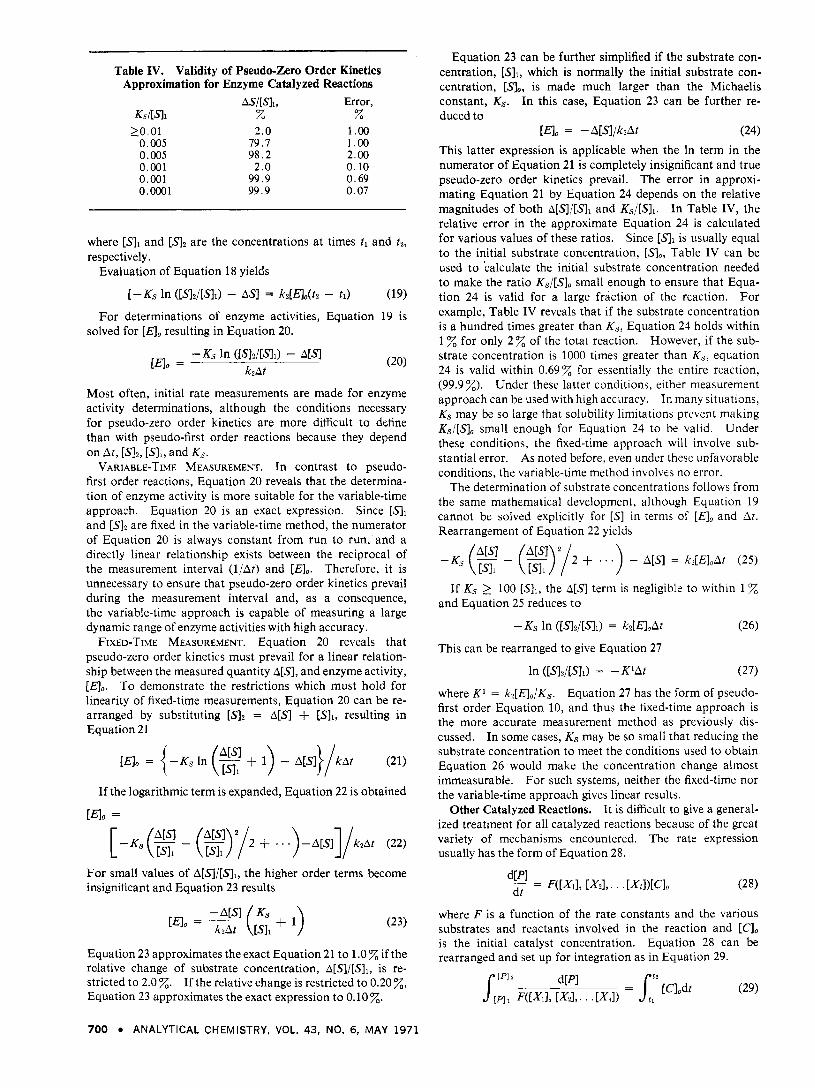
Table IV. Validity of Pseudo-Zero Order Kinetics Approximation for Enzyme Catalyzed Reactions
AS/[sll, Error, Ka/[sli z z
20.01 2.0 1 .OO 0.005 79.7 1.00 0.005 98 .2 2.00 0.001 2.0 0.10 0.001 99.9 0.69 o.ooo1 99.9 0.07
where [SI1 and [SI2 are the concentrations at times tl and f z , respectively.
Evaluation of Equation 18 yields
[- K8 In Us12/[SI1) - AS1 = kd%(tz - tl) (19)
For determinations of enzyme activities, Equation 19 is solved for [El, resulting in Equation 20.
Most often, initial rate measurements are made for enzyme activity determinations, although the conditions necessary for pseudo-zero order kinetics are more difficult to define than with pseudo-first order reactions because they depend on At, [Sh, [SIi, and Ks.
VARIABLE-TIME MEASUREMENT. In contrast to pseudo- first order reactions, Equation 20 reveals that the determina- tion of enzyme activity is more suitable for the variable-time approach. Equation 20 is an exact expression. Since [SI1 and [S ly are fixed in the variable-time method, the numerator of Equation 20 is always constant from run to run, and a directly linear relationship exists between the reciprocal of the measurement interval ( l /At) and [a,. Therefore, it is unnecessary to ensure that pseudo-zero order kinetics prevail during the measurement interval and, as a consequence, the variable-time approach is capable of measuring a large dynamic range of enzyme activities with high accuracy.
FIXED-TIME MEASUREMENT. Equation 20 reveals that pseudo-zero order kinetics must prevail for a linear relation- ship between the measured quantity A[S], and enzyme activity, [El,. To demonstrate the restrictions which must hold for linearity of fixed-time measurements, Equation 20 can be re- arranged by substituting [SIz = A[S] + [SI1, resulting in Equation 21
[E10 = -Ks In + 1 - A[S] kAt (21) { (PIl ) }/ If the logarithmic term is expanded, Equation 22 is obtained
[a0 =
[ -Ks (E - r$) 7 2 + . . .) - A [ a ] / k ~ A t (22)
For small values of A[S]/[SI l , the higher order terms become insignificant and Equation 23 results
Equation 23 approximates the exact Equation 21 to 1 .O if the relative change of substrate concentration, A[S]/[S]l, is re- stricted to 2.0%. If the relative change is restricted to 0.20%, Equation 23 approximates the exact expression to 0.10%.
Equation 23 can be further simplified if the substrate con- centration, [SI1, which is normally the initial substrate con- centration, [SI,, is made much larger than the Michaelis constant, K8. In this case, Equation 23 can be further re- duced to
This latter expression is applicable when the In term in the numerator of Equation 21 is completely insignificant and true pseudo-zero order kinetics prevail. The error in approxi- mating Equation 21 by Equation 24 depends on the relative magnitudes of both A[S]/[S] , and K8/[SIl. In Table IV, the relative error in the approximate Equation 24 is calculated for various values of these ratios. Since [SI, is usually equal to the initial substrate concentration, [SI,, Table IV can be used to 'calculate the initial substrate concentration needed to make the ratio K8/[SIO small enough to ensure that Equa- tion 24 is valid for a large fraction of the reaction. For example, Table IV reveals that if the substrate concentration is a hundred times greater than Ks, Equation 24 holds within 1 for only 2 of the total reaction. However, if the sub- strate concentration is 1000 times greater than Ks, equation 24 is valid within 0.69% for essentially the entire reaction, (99.9 x). Under these latter conditions, either measurement approach can be used with high accuracy. In many situations, Ks may be so large that solubility limitations prevent making Ks/[S], small enough for Equation 24 to be valid. Under these conditions, the fixed-time approach will involve sub- stantial error. As noted before, even under these unfavorable conditions, the variable-time method involves no error.
The determination of substrate concentrations follows from the same mathematical development, although Equation 19 cannot be solved explicitly for [SI in terms o f [E], and At. Rearrangement of Equation 22 yields
[El, = - A[s1/k2Af (24)
-Ks r$ - ( % ) 7 2 + . . .) - A[S] = k,[E],At (25)
If Ks 2 100 [SIl, the A [ s ] term is negligible to within 1 and Equation 25 reduces to
- Ks In ([s12/[S11) = ks[EI,At (26)
This can be rearranged to give Equation 27
In ([s12/[S11) = -KIAt (27)
where K 1 = k2[EI,/Ks. Equation 27 has the form of pseudo- first order Equation 10, and thus the fixed-time approach is the more accurate measurement method as previously dis- cussed. In some cases, K8 may be so small that reducing the substrate concentration to meet the conditions used to obtain Equation 26 would make the concentration change almost immeasurable. For such systems, neither the fixed-time nor the variable-time approach gives linear results.
Other Catalyzed Reactions. It is difficult to give a general- ized treatment for all catalyzed reactions because of the great variety of mechanisms encountered. The rate expression usually has the form of Equation 28.
where F is a function of the rate constants and the various substrates and reactants involved in the reaction and [C], is the initial catalyst concentration. Equation 28 can be rearranged and set up for integration as in Equation 29.
700 ANALYTICAL CHEMISTRY, VOL. 43, NO. 6, MAY 1971
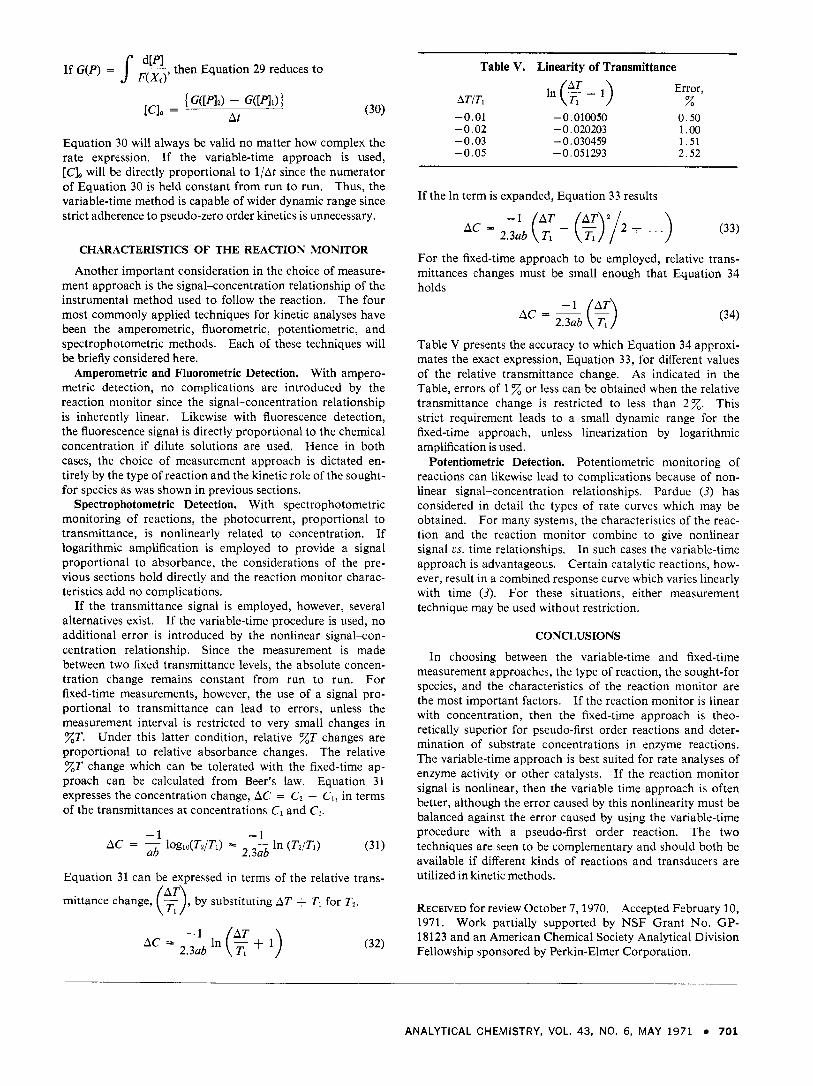
Table V. Linearity of Transmittance
Equation 30 will always be valid no matter how complex the rate expression. If the variable-time approach is used, [C], will be directly proportional to l/At since the numerator of Equation 30 is held constant from run to run. Thus, the variable-time method is capable of wider dynamic range since strict adherence to pseudo-zero order kinetics is unnecessary.
CHARACTERISTICS OF THE REACTION MONITOR
Another important consideration in the choice of measure- ment approach is the signal-concentration relationship of the instrumental method used to follow the reaction. The four most commonly applied techniques for kinetic analyses have been the amperometric, fluorometric, potentiometric, and spectrophotometric methods. Each of these techniques will be briefly considered here.
Amperometric and Fluorometric Detection. With ampero- metric detection, no complications are introduced by the reaction monitor since the signal-concentration relationship is inherently linear. Likewise with fluorescence detection, the fluorescence signal is directly proportional to the chemical concentration if dilute solutions are used. Hence in both cases, the choice of measurement approach is dictated en- tirely by the type of reaction and the kinetic role of the sought- for species as was shown in previous sections.
Spectrophotometric Detection. With spectrophotometric monitoring of reactions, the photocurrent, proportional to transmittance, is nonlinearly related to concentration. If logarithmic amplification is employed to provide a signal proportional to absorbance, the considerations of the pre- vious sections hold directly and the reaction monitor charac- teristics add no complications.
If the transmittance signal is employed, however, several alternatives exist. If the variable-time procedure is used, no additional error is introduced by the nonlinear s ignakon- centration relationship. Since the measurement is made between two fixed transmittance levels, the absolute concen- tration change remains constant from run to run. For fixed-time measurements, however, the use of a signal pro- portional to transmittance can lead to errors, unless the measurement interval is restricted to very small changes in ZT. Under this latter condition, relative Z T changes are proportional to relative absorbance changes. The relative ZZ‘ change which can be tolerated with the fixed-time ap- proach can be calculated from Beer’s law. Equation 31 expresses the concentration change, AC = Cz - C1, in terms of the transmittances at concentrations C1 and CI.
Equation 31 can be expressed in terms of the relative trans-
mittance change, gj, by substituting AT + TI for T2.
AC=-ln(:+l> -1 2.3ab
Error, x -0.01 - 0.01OO50 0.50 -0.02 -0.020203 1 .oo -0.03 - 0.030459 1.51 -0.05 -0.051293 2.52
If the In term is expanded, Equation 33 results
-1 AT AC = 2 .3~6 ~ (- Tl - ($)I2 + . . .) (33)
For the fixed-time approach to be employed, relative trans- mittances changes must be small enough that Equation 34 holds
-1 AT Ac = 2.3ab (x) (34)
Table V presents the accuracy to which Equation 34 approxi- mates the exact expression, Equation 33, for different values of the relative transmittance change. As indicated in the Table, errors of 1 Z or less can be obtained when the relative transmittance change is restricted to less than 2%. This strict requirement leads to a small dynamic range for the fixed-time approach, unless linearization by logarithmic amplification is used.
Potentiometric Detection. Potentiometric monitoring of reactions can likewise lead to complications because of non- linear signal-concentration relationships. Pardue (3) has considered in detail the types of rate curves which may be obtained. For many systems, the characteristics of the reac- tion and the reaction monitor combine to give nonlinear signal cs. time relationships. In such cases the variable-time approach is advantageous. Certain catalytic reactions, how- ever, result in a combined response curve which varies linearly with time (3). For these situations, either measurement technique may be used without restriction.
CONCLUSIONS
In choosing between the variable-time and fixed-time measurement approaches, the type of reaction, the sought-for species, and the characteristics of the reaction monitor are the most important factors. If the reaction monitor is linear with concentration, then the fixed-time approach is theo- retically superior for pseudo-first order reactions and deter- mination of substrate concentrations in enzyme reactions. The variable-time approach is best suited for rate analyses of enzyme activity or other catalysts. If the reaction monitor signal is nonlinear, then the variable time approach is often better, although the error caused by this nonlinearity must be balanced against the error caused by using the variable-time procedure with a pseudo-first order reaction. The two techniques are seen to be complementary and should both be available if different kinds of reactions and transducers are utilized in kinetic methods.
RECEIVED for review October 7,1970. Accepted February 10, 1971. Work partially supported by NSF Grant No. GP- 18123 and an American Chemical Society Analytical Division Fellowship sponsored by Perkin-Elmer Corporation.
ANALYTICAL CHEMISTRY, VOL. 43, NO. 6, MAY 1971 701