Embed Size (px)
Citation preview
283
Theoretical and Empirical Comparison of theMokken and the Rasch Approach to IRTRob R. Meijer and Klaas Sijtsma, Free University of Amsterdam
Nico G. Smid, Philips, Eindhoven, The Netherlands
The Mokken model of monotone homogeneity,the Mokken model of double monotonicity, andthe Rasch model are theoretically and empiricallycompared. These models are compared with respectto restrictiveness to empirical test data, propertiesof the scale, and accuracy of measurement. Appli-cation of goodness-of-fit procedures to empiricaldata largely confirmed the expected order of themodels according to restrictiveness: Almost allitems were in concordance with the model of mono-
tone homogeneity, and fewer items complied withthe model of double monotonicity and the Raschmodel. The model of monotone homogeneity wasfound to be a suitable alternative to more restric-tive models for basic testing applications; moresophisticated applications, such as equating andadaptive testing, appear to require the use of para-metric models. Index terms: goodness-of-fit, itemresponse theory, measurement properties, Mokkenmodel, Rasch model.
In item response theory (IRT), test behavior is explained by taking into account attributes of bothpersons and items. An important notion in IRT is the item characteristic curve, or item response func-tion (IRF). For dichotomously-scored items, it provides the probability of persons answering an itempositively as a function of the latent trait. IRT test models are formulated so as to permit the deriva-tion of consequences that can be checked empirically. Therefore, fit of the model to the data playsan important role in IRT.
In recent years much empirical research has used three IRT models: the Mokken models of mono-tone homogeneity and double monotonicity, and the Rasch model. See Mokken (1971), Stokman (1977),and Kingma and ten Vergert (1985) for empirical applications of the Mokken models. Empirical ap-plications of the Rasch model can be found in van den Wollenberg (1979), Schmitt (1981), and deJong-Gierveld and Kamphuis (1985).
Data are analyzed most often with a single model. As a result, a systematic comparison of modelsis often difficult to achieve. In this study, the three models were compared both theoretically andempirically. First, the models are briefly introduced and compared on three important characteris-tics : restrictiveness with respect to empirical data, measurement properties of the scale, and methodsto determine reliability of measurement. Second, the fit of the three models to the same set of empir-ical data is investigated. Differences and resemblances between the models are illustrated on the basisof the results from the empirical analyses.
Theoretical Considerations
The IRT models proposed by Mokken (1971) are called nonparametric because the ntFs are notparametrically defined, and because no assumptions are made concerning the distribution of the latenttrait. The model of monotone homogeneity is based on the assumptions of unidimensionality, localstochastic independence, and monotonicity in the latent attribute. Unidimensional measurement
APPLIED PSYCHOLOGICAL MEASUREMENTVol. 14, No. 3, September 1990, pp. 283-298@ Copyright 1990 Apphed Psychological Measurement Inc.0146-6216/90/030283-16$2 05
Downloaded from the Digital Conservancy at the University of Minnesota, http://purl.umn.edu/93227. May be reproduced with no cost by students and faculty for academic use. Non-academic reproduction
requires payment of royalties through the Copyright Clearance Center, http://www.copyright.com/
284
states that within a specified population, response behavior on the test can be explained by a singleunderlying attribute. This attribute is measured on a scale denoted by 0. Local stochastic indepen-dence implies that the response behavior of a person on an arbitrarily selected item g is not influencedby his or her responses on previous items, nor will it affect response behavior on subsequent items.This assumption is a logical consequence of unidimensionality, but the reverse is not true.
The assumption of monotonicity in the latent attribute specifies that a higher attribute value im-plies an increasing probability of responding positively to an item. Because present psychologicaltheories seem to offer no viable alternatives, it may indeed be plausible that someone with a higherability, aptitude, attitude, or trait does not have a smaller probability of answering items positivelythan someone with a lower level of that variable.
Let P denote a probability, in general, and let P(6,) denote the probability of person i obtaininga positive response on item g. Formally, the model of monotone homogeneity implies for two per-sons i and j and an item g, that if 0, < 6,, then
When items conform to the model, persons can be ordered according to the latent attribute (Mok-ken, 1971). Because 0 is not estimated numerically in the model of monotone homogeneity, the or-dering according to 0 is replaced by the ordering according to the true score T from classical testtheory (C’t&dquo;r’; Lord & Novick, 1968). Mokken (1971) showed that T and 0 have the same order. Thenumber-correct score X is used as an estimator for T; an ordering according to X, therefore, givesan estimate of the ordering according to 6. Grayson (1988) also showed that the number-correct scoreX has a monotone likelihood ratio in 0 for all models complying with monotone homogeneity.
The model of double monotonicity is based on the same set of assumptions as the model of mono-tone homogeneity, plus the additional assumption of monotonicity in the item difficulties. Togetherthese assumptions imply that the IRFs do not intersect, but may touch or coincide. Formally, theproperty of nonintersecting IRFS can be stated as follows: Let 5 denote the common item difficultyfrom IRT; then for two items g and h with 8, < 8h,
In addition to ordering persons according to 0, the model allows an ordering of items accordingto their difficulties. Apart from ties, this order is the same in each subpopulation of the populationwhere the model holds. In the model of double monotonicity, the true score T is used for orderingpersons, and 1tg, the proportion of persons giving a positive response to item g, is used for orderingitems. Mokken (1971) showed that the order according to 1tg is the reverse of the order according tothe difficulty parameter 8, from the parametric IRT models. Mokken and Lewis (1982), Niemollerand van Schuur (1983), and Sijtsma (1988) provide an introduction to the Mokken model.
In the one-parameter logistic (Rasch) model, test behavior is explained by the difficulty of an itemand the attribute value of a person (Fischer, 1974; Rasch, 1960). This model is based on the sameset of assumptions as the Mokken model of monotone homogeneity, plus the assumption of minimalsufficiency of the unweighted person and item sum scores for the estimation of the 0 and 8 parameters,respectively. Given these four assumptions, the probability of positively answering an item is given by:
Downloaded from the Digital Conservancy at the University of Minnesota, http://purl.umn.edu/93227. May be reproduced with no cost by students and faculty for academic use. Non-academic reproduction
requires payment of royalties through the Copyright Clearance Center, http://www.copyright.com/
285
Sometimes it is convenient to use the transformation 0 = In ~ and 8, = In e~, and Equation 3 thenbecomes
This equation is used in the next section.An important characteristic of the Rasch model is that it enables so-called specifically objective
measurement (Fischer, 1974, 1987; Wright, 1977). Furthermore, it can be shown (e.g., Fischer, 1974)that, for both person Os and item 8s, the Rasch model allows measurement on a difference or a ratioscale.
Comparison of the Models
In ordering the models on the basis of their restrictiveness for empirical data, the model of mono-tone homogeneity is least restrictive and the Rasch model is most restrictive. This is clear from aconsideration of the assumptions on which the models are based.
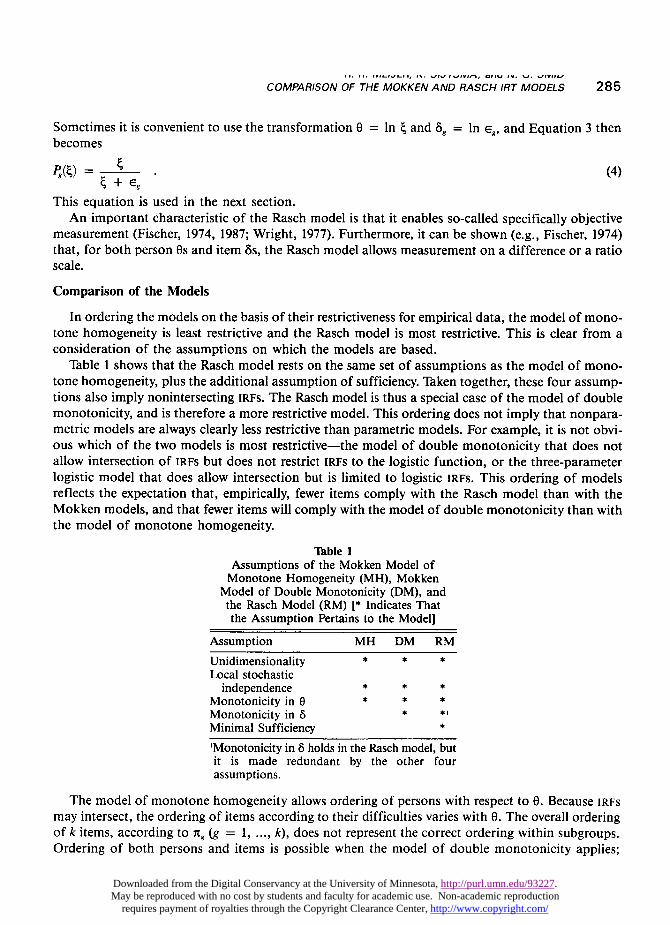
Table 1 shows that the Rasch model rests on the same set of assumptions as the model of mono-tone homogeneity, plus the additional assumption of sufficiency. Taken together, these four assump-tions also imply nonintersecting IRFS. The Rasch model is thus a special case of the model of doublemonotonicity, and is therefore a more restrictive model. This ordering does not imply that nonpara-metric models are always clearly less restrictive than parametric models. For example, it is not obvi-ous which of the two models is most restrictive-the model of double monotonicity that does notallow intersection of IRFS but does not restrict IRFS to the logistic function, or the three-parameterlogistic model that does allow intersection but is limited to logistic IRFS. This ordering of modelsreflects the expectation that, empirically, fewer items comply with the Rasch model than with theMokken models, and that fewer items will comply with the model of double monotonicity than withthe model of monotone homogeneity.
Table 1
Assumptions of the Mokken Model ofMonotone Homogeneity (MH), Mokken
Model of Double Monotonicity (DM), andthe Rasch Model (RM) [* Indicates Thatthe Assumption Pertains to the Model]
’Monotonicity in 8 holds in the Rasch model, butit is made redundant by the other four
assumptions.
The model of monotone homogeneity allows ordering of persons with respect to 0. Because IRFsmay intersect, the ordering of items according to their difficulties varies with 0. The overall orderingof k items, according to 1tg (g = 1, ..., k), does not represent the correct ordering within subgroups.Ordering of both persons and items is possible when the model of double monotonicity applies;
Downloaded from the Digital Conservancy at the University of Minnesota, http://purl.umn.edu/93227. May be reproduced with no cost by students and faculty for academic use. Non-academic reproduction
requires payment of royalties through the Copyright Clearance Center, http://www.copyright.com/
286
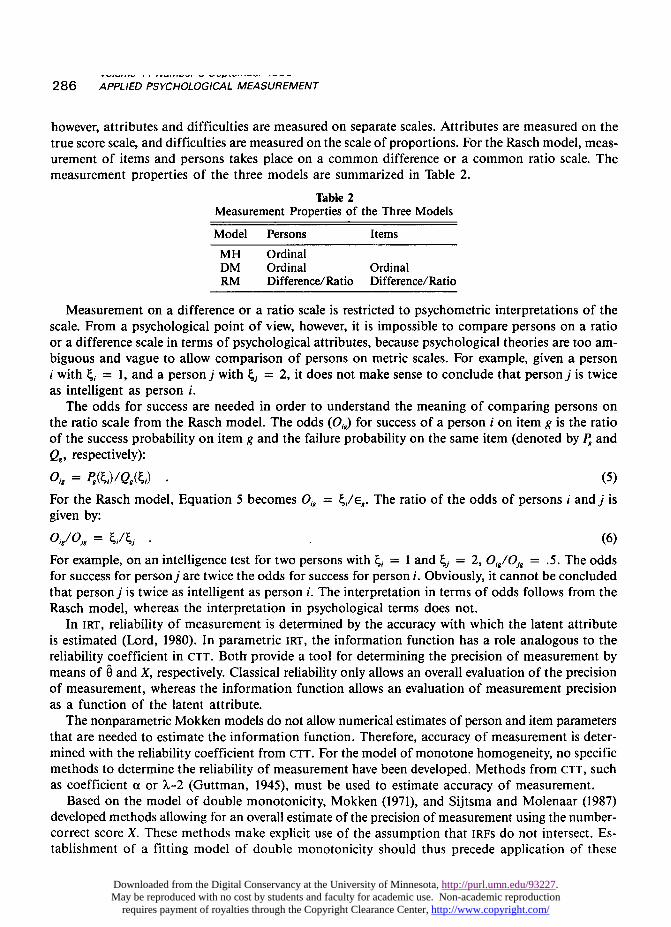
however, attributes and difficulties are measured on separate scales. Attributes are measured on thetrue score scale, and difficulties are measured on the scale of proportions. For the Rasch model, meas-urement of items and persons takes place on a common difference or a common ratio scale. Themeasurement properties of the three models are summarized in Table 2.
Table 2Measurement Properties of the Three Models
Measurement on a difference or a ratio scale is restricted to psychometric interpretations of thescale. From a psychological point of view, however, it is impossible to compare persons on a ratioor a difference scale in terms of psychological attributes, because psychological theories are too am-biguous and vague to allow comparison of persons on metric scales. For example, given a personi with ~, = 1, and a person j with 4, = 2, it does not make sense to conclude that person j is twiceas intelligent as person i.
The odds for success are needed in order to understand the meaning of comparing persons onthe ratio scale from the Rasch model. The odds (OJ for success of a person i on item g is the ratioof the success probability on item g and the failure probability on the same item (denoted by P andQ., respectively):
For the Rasch model, Equation 5 becomes O,g = ~,/€~. The ratio of the odds of persons i and j isgiven by:
For example, on an intelligence test for two persons with ~, = 1 and ~, = 2, O,/O}8 = .5. The oddsfor success for person j are twice the odds for success for person i. Obviously, it cannot be concludedthat person j is twice as intelligent as person i. The interpretation in terms of odds follows from theRasch model, whereas the interpretation in psychological terms does not.
In IRT, reliability of measurement is determined by the accuracy with which the latent attributeis estimated (Lord, 1980). In parametric IRT, the information function has a role analogous to thereliability coefficient in CTT. Both provide a tool for determining the precision of measurement bymeans of 6 and X, respectively. Classical reliability only allows an overall evaluation of the precisionof measurement, whereas the information function allows an evaluation of measurement precisionas a function of the latent attribute.
The nonparametric Mokken models do not allow numerical estimates of person and item parametersthat are needed to estimate the information function. Therefore, accuracy of measurement is deter-mined with the reliability coefficient from CTT. For the model of monotone homogeneity, no specificmethods to determine the reliability of measurement have been developed. Methods from CTT, suchas coefficient a or X-2 (Guttman, 1945), must be used to estimate accuracy of measurement.
Based on the model of double monotonicity, Mokken (1971), and Sijtsma and Molenaar (1987)developed methods allowing for an overall estimate of the precision of measurement using the number-correct score X. These methods make explicit use of the assumption that IRFS do not intersect. Es-tablishment of a fitting model of double monotonicity should thus precede application of these
Downloaded from the Digital Conservancy at the University of Minnesota, http://purl.umn.edu/93227. May be reproduced with no cost by students and faculty for academic use. Non-academic reproduction
requires payment of royalties through the Copyright Clearance Center, http://www.copyright.com/
287
methods.In the Rasch model, the information function is given by
This function gives information about the precision of measurement using the reciprocal of the con-ditional variance of the maximum likelihood estimate of 0. It has been shown (Lord, 1980) that thecontribution of an item to the precision of measurement is independent of the other items in thetest. The test information function allows an evaluation of measurement precision on each point ofthe scale.
Gustafsson (1977) discussed the index of examinee separation in the context of the Rasch model.In contrast to the information function, this index expresses the overall reliability of the maximumlikelihood estimate 6, and can thus be seen as an IRT counterpart of the classical reliability coeffi-cient for the number-correct score X.
Method
Data
The goodness-of-fit procedures of the three models are illustrated with an analysis of data froma widely-used Dutch verbal intelligence test-the Verbal Analogies Test (Drenth & van Wieringen,1969). This test contains 40 items that measure &dquo;verbal intelligence.&dquo; Each item consists of a sentencein which the first- and the last-item word have been removed. Two rows of five words each are listedbelow the sentence. The examinee has to identify one word from the first row (numbered 1 through5) as the first word of the sentence, and one word from the second row (lettered A through E) asthe last word of the sentence. An example of an item is:... is to love as hostility is to ...
The test was developed for examinees at or beyond the college/university level. The administrationtime of the test is 40 minutes. For the present analysis, a sample of 990 examinees was used; mostof the examinees graduated from high school.
The dataset used archival data that were collected in the context of selection of personnel for com-puter occupations, such as systems analyst and programmer. Because the test has a time limit, anda persons-by-items matrix containing correct-incorrect scores was available, it was unknown whethereach examinee had attempted each item. Therefore, a 0 score in the data matrix may have meant&dquo;omitted&dquo; (due to time limit), as well as &dquo;incorrectly answered.&dquo;
To minimize the probability that part of the data analyzed was not attempted by all examinees,the analysis was restricted to the first 32 items. This decision was based on the observation that afterItem 32, there was a sudden decrease of the items’ 1tg values, the proportion of correct responses.Because the last eight items did not differ in task from the first 32 items, this sudden decrease wasassumed to be caused by the time limit and not by real differences in difficulty.Goodness-of-Fit Methods
Monotone homogeneity. The data were first analyzed by methods for evaluating goodness-of-fitof the model of monotone homogeneity. Given the assumptions of this model, Mokken (1971) showedthat inter-item covariances are nonnegative. Furthermore, the overall scalability coefficient H (Mok-ken, 1971; Mokken & Lewis, 1982; see also Cliff, 1977, who denotes this coefficient by cr3) and thetwo related coefficients for individual items (denoted by Hg) and pairs of items (denoted by Hgh) also
Downloaded from the Digital Conservancy at the University of Minnesota, http://purl.umn.edu/93227. May be reproduced with no cost by students and faculty for academic use. Non-academic reproduction
requires payment of royalties through the Copyright Clearance Center, http://www.copyright.com/
288
have nonnegative values. A positive value, however, does not guarantee monotone homogeneity (e.g.,Mokken & Lewis, 1982). Positive values thus constitute necessary conditions for monotone homogenei-ty. For practical test construction purposes, Mokken (1971) recommended the value H = .3 as a low-er bound for a set of items comprising a test; Mokken, Lewis, and Sijtsma (1986) discussed the rationaleunderlying this choice.
Because H ~ 0 is a necessary condition for monotone homogeneity, the empirical data were firstinvestigated with respect to this restriction. Many researchers use H = .3 as a practical lower bound(Mokken, 1971), and therefore the data were also investigated using this lower bound.A second procedure used to evaluate the assumption of monotone homogeneity in these data is
that proposed by Molenaar (1982; 1983a). In this method, given an item g (g = 1, ..., k), for eachperson the &dquo;rest&dquo; score S = X - Xg is determined (see Rosenbaum, 1984, for the use of rest scorerather than raw score). Persons having the same rest score together constitute a rest score group. Therest score groups are ordered according to increasing rest score S (S = 0, ... , k - 1). The proportionof persons answering positively to item g is estimated within each rest score group, and the propor-tion is denoted by 1tSg’ 1tsg is estimated by 11:Sg = nsglnf, where nsg denotes the number of persons inthe sample having a rest score equal to S who give a positive answer to item g, and ns is the numberof persons having a rest score equal to S.
Provided the model of monotone homogeneity holds (given increasing rest score) for a fixed itemg, the proportions 1tsg are nondecreasing. When a sample proportion 11:s-l.g is followed by a smallerproportion 11:Sg, the null hypothesis of equal proportions is tested against the alternative of 11:s-l,g > 11:Sg.For small samples this is done with Fisher’s exact probability test, and for large samples with thex2 test for independent samples (Siegel, 1956, p. 96-111) in the two-by-two table of rest score groups(S - 1, S) by item score Xg (0,1).
Data analysis was done using the program MOKKEN SCALE (Niemoller & van Schuur, 1980; seeDebets, Sijtsma, Brouwer, & Molenaar, 1989, for a program that handles polychotomous scores, aswell). This program contains a bottom-up item selection procedure that starts by selecting the pairof items for which (1) Hgh is significantly larger than 0, and (2) Hgh is the largest among the coeffi-cients for all possible item pairs. Then a third item f is selected that (3) correlates positively withthe items already selected, (4) has an Hf coefficient with respect to the items selected that is signifi-cantly larger than 0, and (5) has an Hf coefficient that is larger than a user specified value c; in thisstudy, two analyses were performed using c = 0 and c = .3, respectively.
From the pool of items, an item is selected that maximizes the overall H of g, h, and f. A fourthitem is selected that satisfies conditions 3, 4, and 5, above, and that maximizes the overall coefficientof the four items selected. The program continues to select items as long as items are available thatsatisfy conditions 3, 4, and 5. During the selection process a large number of significance tests arecomputed, so there is a great danger of capitalization on chance. In order to reduce this danger, thesignificance level is automatically adapted throughout the procedure to the number of tests in eachselection step. The data were analyzed once with, and once without, this selection procedure.
Double monotonicity. To determine whether the model of double monotonicity adequatelyexplained response behavior, Mokken (1971) proposed a visual inspection method for the evaluationof the complete dataset with the order properties within two matrices. The P matrix has order k x kand contains the proportions 1tgh (g,h = 1, ..., k, g # h) of persons giving correct answers to a pairof items. The items across rows and columns are ordered according to increasing order of overall1tg values. Given the assumption of double monotonicity, the rows and columns are nondecreasing(Mokken, 1971). The P’l) matrix also has order k x k, and contains the proportions 1tgh (g,h = 1,..., k, g ~ h) of persons giving negative responses to a pair of items. Given double monotonicity,
Downloaded from the Digital Conservancy at the University of Minnesota, http://purl.umn.edu/93227. May be reproduced with no cost by students and faculty for academic use. Non-academic reproduction
requires payment of royalties through the Copyright Clearance Center, http://www.copyright.com/
289
the rows and columns in this matrix are nonincreasing. These expected ordering properties in theP and P’ll matrices in the sample are used to evaluate double monotonicity.
Another possibility for investigating the model of double monotonicity is based on the item-by-item cross table (Molenaar, 1982; 1986) for test score groups. Let 1tg;; denote the proportion of per-sons having a positive response on item g and a negative response on item h, and let 1tih denote theproportion of persons having a negative response on item g and a positive response on item h. Giventhe model of double monotonicity, with 1tg :S 1th in the population, it can be shown (Molenaar, 1982)that in each subgroup (e.g., test score group) 1tg;; :S 1tjh’ Sample results in the opposite direction (i.e.,itg;; > ngh) may be indicative of violations of the overall item order. The null hypothesis of equalproportions, nghl(ngh + 1tih) = .5, against the alternative that 1tg;;/(1tg;; + 1tgh) > .5, can be testedfor test score groups with the McNemar test (Siegel, 1956, p. 63-67).
Rasch homogeneity. In order to select Rasch homogeneous sets of items from a larger set, Ander-sen’s (1973) conditional likelihood ratio test was used for globally testing the assumptions of monoton-icity in 0 and sufficiency (van den Wollenberg, 1979). The sample of persons was divided into twodisjoint subsamples of about equal size, one containing examinees having the higher raw scores, andthe other containing examinees having lower raw scores. Item parameters were estimated in these sub-samples. If the model held, the same parameters were estimated in the subsamples, and the x2 dis-tributed test statistic had a value reflecting only random fluctuations. If the model was globally rejected,in the next step of the analysis the test proposed by Molenaar (1983b; see also Glas, 1989, for newproposals) was used for detecting deviant items.
With this test, for an item g within each test score group, the proportion of positive answers iscompared with the expected proportion, given that the model holds. For item g, the standardizeddifferences are combined across the lower and higher test score groups into the test statistic U. Thistest statistic is approximately standard normally distributed. As is shown below, practical use of Uis more complicated than simply removing items having significant U values (see also Molenaar,1983b).
After removal of items based on the U analyses, response behavior on the remaining items wastested with respect to the assumptions of unidimensionality and local stochastic independence usingAndersen’s conditional likelihood ratio test. For this purpose, subgroups were constructed with split-ter items (van den Wollenberg, 1982).A splitter item is an item with which the sample is partitioned into two subsamples, one consisting
of examinees responding positively to the item, and the other containing examinees responding nega-tively. Under the alternative hypothesis of multidimensionality, some of the items in the test measurethe same attribute as the splitter item, and other items do not. Van den Wollenberg (1982) arguedthat in this situation, item parameter estimates belonging to items related to the splitter item differsystematically across the subsamples, resulting in a significant value of Andersen’s test statistic. Acomparison of item parameter estimates in both groups may reveal deviant items, and may suggestwhich items should be removed or which unidimensional subscales may be appropriate.
The splitter item technique resembles the use of the P and P(l) matrices for evaluating the modelof double monotonicity. For example, the P matrix contains all bivariate proportions 1tfig = 1, ...,
k) in row f, and if 1tg :S nh, then 1tfg :S 1tjh’ Division of 1tfg and 1tjh by 1tf shows that the ordering ofitem difficulties holds in the group responding correctly to item f. This ordering also holds in thegroup giving a negative response to item f (1tfg :S nA), and corresponds in the Pl) matrix with7Efi - 1tjh’ Thus the technique of inspection of the ordering in rows f in the P and P(l) matricesis likely an adaptation of the splitter item technique for the model of double monotonicity (Molenaar,1982). In practice, however, inspection of these matrices is never used as a check on unidimensionali-
Downloaded from the Digital Conservancy at the University of Minnesota, http://purl.umn.edu/93227. May be reproduced with no cost by students and faculty for academic use. Non-academic reproduction
requires payment of royalties through the Copyright Clearance Center, http://www.copyright.com/
290
ty, but rather as a check on the property of nonintersecting IRFS.Another test for unidimensionality was provided by Martin-L6f (1973), and Wainer, Morgan, and
Gustafsson (1980). To use the Martin-L6f test, the item set is divided into two disjoint subsets ofitems that hypothetically measure different attributes. Because the Verbal Analogies Test was intend-ed to be unidimensional, it was difficult to group the items on an a priori basis. Therefore, the itemset was divided into two subsets of items on the basis of their 1tg values. The idea behind this divi-sion was that difficult items may measure another dimension than easy items. An explicit procedurefor evaluating unidimensionality is notably absent in both Mokken models.
Precision of Measurement
In addition to an investigation of model fit, the precision of measurement was also examined foreach model. Coefficient a was estimated for the model of monotone homogeneity. Mokken’s Method1 (Mokken, 1971), and a method proposed by Sijtsma and Molenaar (1987) were used to estimateprecision of measurement for the model of double monotonicity. These methods are less biased thanMokken’s Method 2 (Sijtsma, 1988; Sijtsma & Molenaar, 1987). For the Rasch model, precision ofmeasurement was determined with the test information function and the index of examinee separation.
Results
Analysis of Monotone Homogeneity
The 32 items were analyzed as a test. Then the item selection algorithm was used to explicitly selectitems conforming to the model of monotone homogeneity.
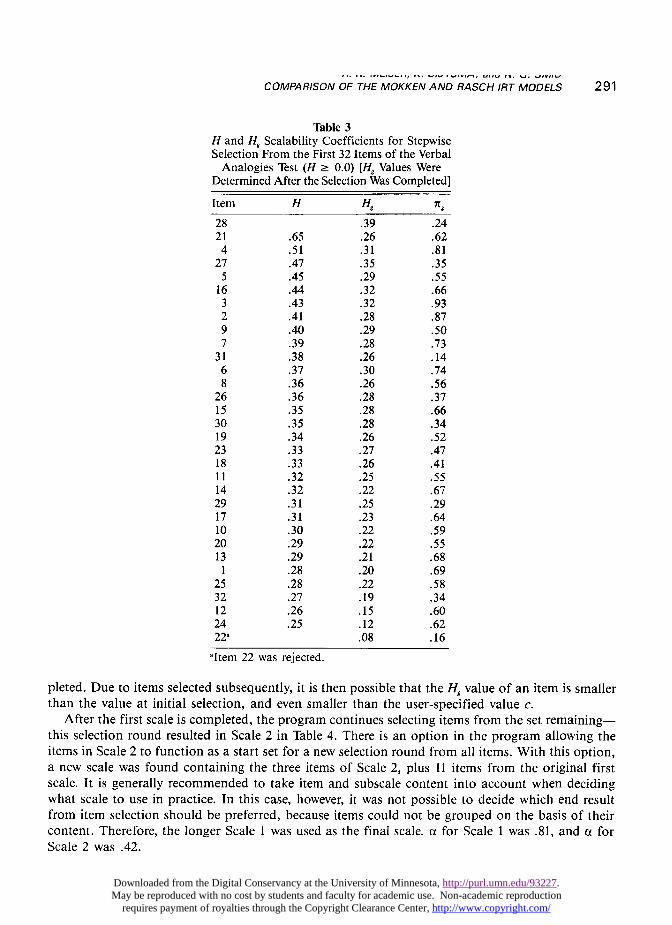
Without selection, all items had positive H, values ranging from .09 to .38. For the complete setof 32 items, H = .25. The H and the H. values resulting from the stepwise item selection using H = 0as a lower bound are shown in Table 3. Only Item 22 violated the model of monotone homogeneity.This item correlated negatively with Items 3, 6, and 12.
The trend of the overall H coefficient during the stepwise selection process revealed that H decreasedrelatively quickly during the selection of the first few items, but then tended to stabilize. This is inagreement with results from a simulation study by Sijtsma and Prins (1986) in which items were selectedfrom a set of equidistant Rasch items.
The ng values in Table 3 are spaced rather evenly. Although these 1tg values are not linearly relatedto the latent difficulty (8) parameters from the Rasch model, this spacing suggests approximatelyequidistant 8 parameters, as in the simulation study. Furthermore, because Hg is related to the dis-criminating power of an item, with the variance of the person distribution and the distance of theitem difficulties held constant (Mokken et al., 1986), the small dispersion of most Hg coefficients(in Table 3, 23 out of 31 coefficients have values between .2 and .3) may point in the direction ofonly modest differences in discriminating power across the items. Therefore, similar results concern-ing the trend of H during the selection of items found by Sijtsma and Prins (1986) and found inthis study may be explained by comparable latent item characteristics. The estimation of reliabilityof the unweighted total score with a for 31 items resulted in a = .86.
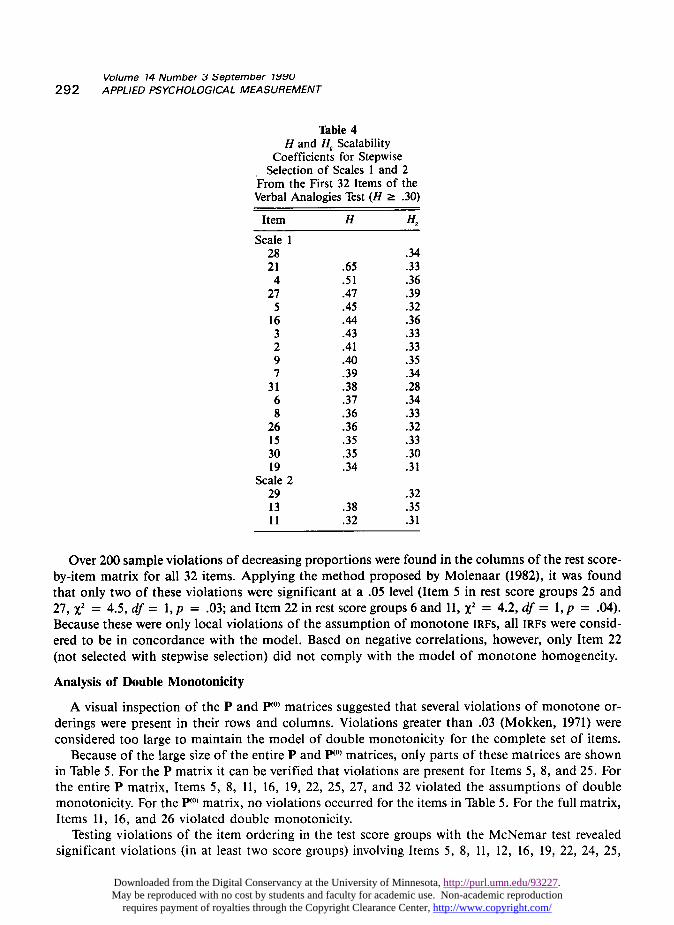
Table 4 shows results for the item selection using the lower bound H = .3. This additional restric-tion resulted in the selection of two subscales. Table 4 shows for Item 31 that it is possible that someHg values could be smaller than .3 after item selection is completed. One explanation for such smallvalues is that when an item is selected, this decision is based on its HK value with regard to the itemsalready selected. When selected, the Hx value is not smaller than the user-specified value, but thefinal Hg value is estimated with respect to all items selected in the scale when the selection is com-
Downloaded from the Digital Conservancy at the University of Minnesota, http://purl.umn.edu/93227. May be reproduced with no cost by students and faculty for academic use. Non-academic reproduction
requires payment of royalties through the Copyright Clearance Center, http://www.copyright.com/
291
Table 3
H and Hg Scalability Coefficients for StepwiseSelection From the First 32 Items of the Verbal
Analogies Test (H a 0.0) [Hg Values WereDetermined After the Selection Was Completed]
pleted. Due to items selected subsequently, it is then possible that the Hg value of an item is smallerthan the value at initial selection, and even smaller than the user-specified value c.
After the first scale is completed, the program continues selecting items from the set remaining-this selection round resulted in Scale 2 in Table 4. There is an option in the program allowing theitems in Scale 2 to function as a start set for a new selection round from all items. With this option,a new scale was found containing the three items of Scale 2, plus 11 items from the original firstscale. It is generally recommended to take item and subscale content into account when decidingwhat scale to use in practice. In this case, however, it was not possible to decide which end resultfrom item selection should be preferred, because items could not be grouped on the basis of theircontent. Therefore, the longer Scale 1 was used as the final scale. a for Scale 1 was .81, and a forScale 2 was .42.
Downloaded from the Digital Conservancy at the University of Minnesota, http://purl.umn.edu/93227. May be reproduced with no cost by students and faculty for academic use. Non-academic reproduction
requires payment of royalties through the Copyright Clearance Center, http://www.copyright.com/
292
Table 4H and Hg Scalability
Coefficients for StepwiseSelection of Scales 1 and 2
From the First 32 Items of theVerbal Analogies Test (H > .30)
Over 200 sample violations of decreasing proportions were found in the columns of the rest score-by-item matrix for all 32 items. Applying the method proposed by Molenaar (1982), it was foundthat only two of these violations were significant at a .05 level (Item 5 in rest score groups 25 and27, x2 = 4.5, df = 1, p = .03; and Item 22 in rest score groups 6 and 11, x2 = 4.2, df = 1, p = .04).Because these were only local violations of the assumption of monotone IRFS, all IRFs were consid-ered to be in concordance with the model. Based on negative correlations, however, only Item 22(not selected with stepwise selection) did not comply with the model of monotone homogeneity.
Analysis of Double Monotonicity
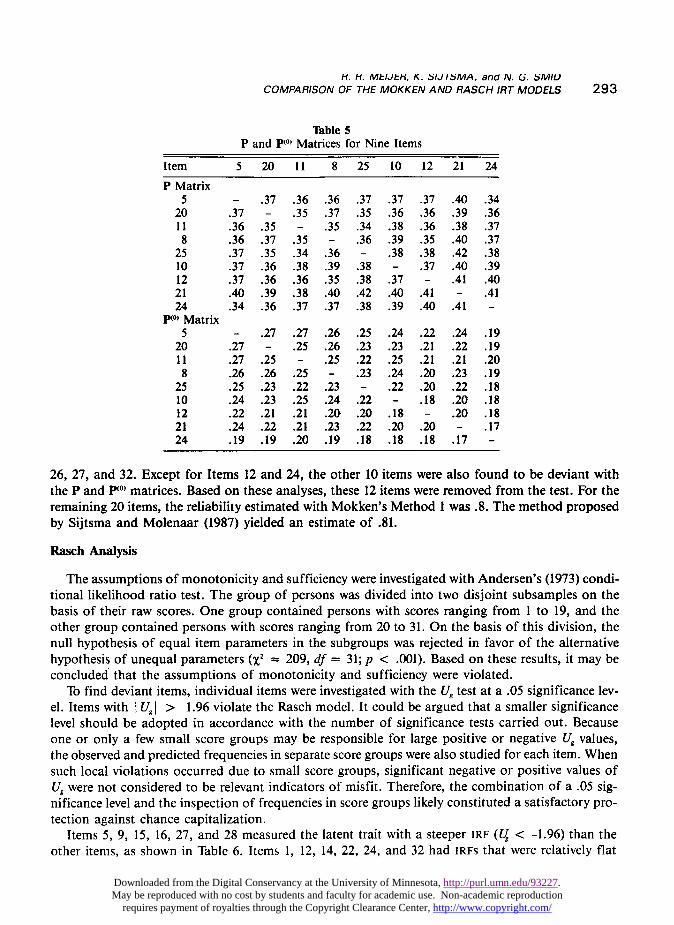
A visual inspection of the P and P(Ol matrices suggested that several violations of monotone or-derings were present in their rows and columns. Violations greater than .03 (Mokken, 1971) wereconsidered too large to maintain the model of double monotonicity for the complete set of items.
Because of the large size of the entire P and P(O) matrices, only parts of these matrices are shownin Table 5. For the P matrix it can be verified that violations are present for Items 5, 8, and 25. Forthe entire P matrix, Items 5, 8, 11, 16, 19, 22, 25, 27, and 32 violated the assumptions of doublemonotonicity. For the P(l) matrix, no violations occurred for the items in Table 5. For the full matrix,Items 11, 16, and 26 violated double monotonicity.
Testing violations of the item ordering in the test score groups with the McNemar test revealedsignificant violations (in at least two score groups) involving Items 5, 8, 11, 12, 16, 19, 22, 24, 25,
Downloaded from the Digital Conservancy at the University of Minnesota, http://purl.umn.edu/93227. May be reproduced with no cost by students and faculty for academic use. Non-academic reproduction
requires payment of royalties through the Copyright Clearance Center, http://www.copyright.com/
293
Table 5P and PO) Matrices for Nine Items
26, 27, and 32. Except for Items 12 and 24, the other 10 items were also found to be deviant withthe P and PIO’ matrices. Based on these analyses, these 12 items were removed from the test. For theremaining 20 items, the reliability estimated with Mokken’s Method 1 was .8. The method proposedby Sijtsma and Molenaar (1987) yielded an estimate of .81.
Rasch Analysis
The assumptions of monotonicity and sufficiency were investigated with Andersen’s (1973) condi-tional likelihood ratio test. The group of persons was divided into two disjoint subsamples on thebasis of their raw scores. One group contained persons with scores ranging from 1 to 19, and theother group contained persons with scores ranging from 20 to 31. On the basis of this division, thenull hypothesis of equal item parameters in the subgroups was rejected in favor of the alternativehypothesis of unequal parameters (x.2 :::::: 209, df = 31; p < .001). Based on these results, it may beconcluded that the assumptions of monotonicity and sufficiency were violated.
To find deviant items, individual items were investigated with the Ug test at a .05 significance lev-el. Items with I Ug > 1.96 violate the Rasch model. It could be argued that a smaller significancelevel should be adopted in accordance with the number of significance tests carried out. Becauseone or only a few small score groups may be responsible for large positive or negative U8 values,the observed and predicted frequencies in separate score groups were also studied for each item. Whensuch local violations occurred due to small score groups, significant negative or positive values ofUg were not considered to be relevant indicators of misfit. Therefore, the combination of a .05 sig-nificance level and the inspection of frequencies in score groups likely constituted a satisfactory pro-tection against chance capitalization.
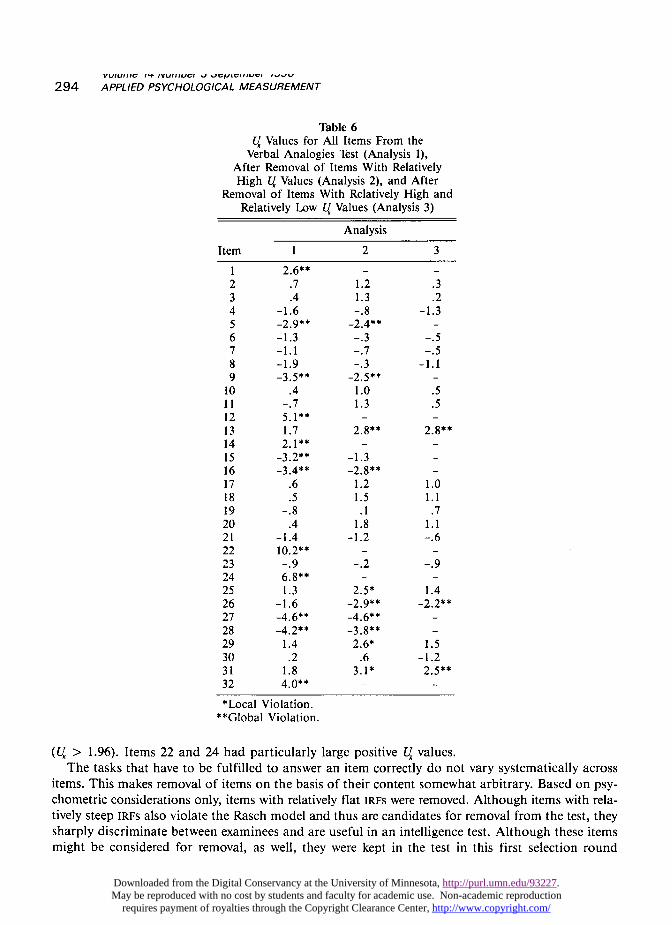
Items 5, 9, 15, 16, 27, and 28 measured the latent trait with a steeper IRF (U < -1.96) than theother items, as shown in Table 6. Items 1, 12, 14, 22, 24, and 32 had IRFS that were relatively flat
Downloaded from the Digital Conservancy at the University of Minnesota, http://purl.umn.edu/93227. May be reproduced with no cost by students and faculty for academic use. Non-academic reproduction
requires payment of royalties through the Copyright Clearance Center, http://www.copyright.com/
294
Table 6
U Values for All Items From theVerbal Analogies Test (Analysis 1),
After Removal of Items With RelativelyHigh U Values (Analysis 2), and After
Removal of Items With Relatively High andRelatively Low U Values (Analysis 3)
*Local Violation.**Global Violation.
(U > 1.96). Items 22 and 24 had particularly large positive U, values.The tasks that have to be fulfilled to answer an item correctly do not vary systematically across
items. This makes removal of items on the basis of their content somewhat arbitrary. Based on psy-chometric considerations only, items with relatively flat IRFS were removed. Although items with rela-tively steep IRFs also violate the Rasch model and thus are candidates for removal from the test, theysharply discriminate between examinees and are useful in an intelligence test. Although these itemsmight be considered for removal, as well, they were kept in the test in this first selection round
Downloaded from the Digital Conservancy at the University of Minnesota, http://purl.umn.edu/93227. May be reproduced with no cost by students and faculty for academic use. Non-academic reproduction
requires payment of royalties through the Copyright Clearance Center, http://www.copyright.com/
295
for practical reasons. Further, experience indicated that the U value of items with relatively steepcurves may improve when items with positive U values were removed.
After removal of Items 1, 12, 14, 22, 24, and 32, the remaining items still violated the assumptionsof monotonicity and/or sufficiency. The results for the Andersen test statistic were XI =z 75, df = 25,p < .001. Table 6 shows the U values after removal of the six weakly-discriminating items (Analysis2). Removal of these items, as well as removal of items with relatively steep IRFS, gave a better fitof the model. The Andersen test for score groups (high-low partitioning) was X2 - 33, df = 19,p = .02.
Although Items 13 and 31 still had relatively flat IRFS, and the IRF of Item 26 was too steep (Anal-ysis 3 in Table 6), the selection of items was terminated to avoid chance capitalization. The remainingset of 20 items was analyzed with respect to unidimensionality, using the Martin-L6f test and theAndersen test using splitter items. For the Martin-L6f test, the set of 20 remaining items was dividedinto two disjoint subsets-one containing the relatively easy items (Items 2, 3, 4, 6, 7, 8, 11, 13, 17,and 21), and the other containing the relatively difficult items (Items 10, 18, 19, 20, 23, 25, 26, 29,30, and 31). The results for the Martin-L6f statistic were X2 = 106, df = 109, p = .54. It can thusbe assumed that the remaining items allowed for unidimensional measurement.
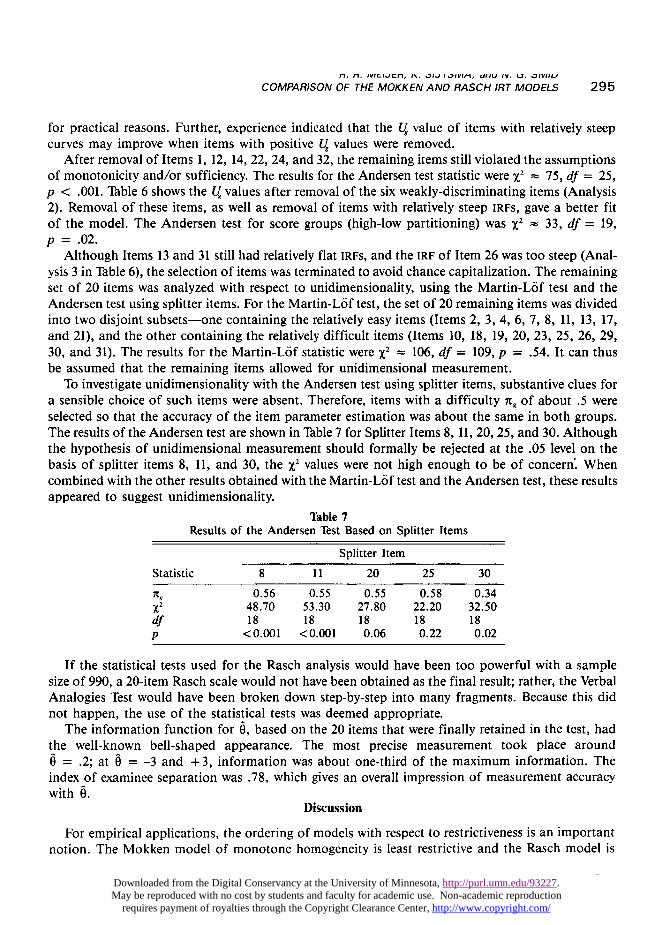
To investigate unidimensionality with the Andersen test using splitter items, substantive clues fora sensible choice of such items were absent. Therefore, items with a difficulty 1tg of about .5 wereselected so that the accuracy of the item parameter estimation was about the same in both groups.The results of the Andersen test are shown in Table 7 for Splitter Items 8, 11, 20, 25, and 30. Althoughthe hypothesis of unidimensional measurement should formally be rejected at the .05 level on thebasis of splitter items 8, 11, and 30, the x2 values were not high enough to be of concern’ Whencombined with the other results obtained with the Martin-L6f test and the Andersen test, these results
appeared to suggest unidimensionality.Table 7
Results of the Andersen Test Based on Splitter Items
If the statistical tests used for the Rasch analysis would have been too powerful with a samplesize of 990, a 20-item Rasch scale would not have been obtained as the final result; rather, the VerbalAnalogies Test would have been broken down step-by-step into many fragments. Because this didnot happen, the use of the statistical tests was deemed appropriate.
The information function for 6, based on the 20 items that were finally retained in the test, hadthe well-known bell-shaped appearance. The most precise measurement took place around6 = .2; at 6 = -3 and + 3, information was about one-third of the maximum information. Theindex of examinee separation was .78, which gives an overall impression of measurement accuracywith 6.
Discussion
For empirical applications, the ordering of models with respect to restrictiveness is an importantnotion. The Mokken model of monotone homogeneity is least restrictive and the Rasch model is
Downloaded from the Digital Conservancy at the University of Minnesota, http://purl.umn.edu/93227. May be reproduced with no cost by students and faculty for academic use. Non-academic reproduction
requires payment of royalties through the Copyright Clearance Center, http://www.copyright.com/
296
most restrictive. This order usually will appear in analyses of empirical data: The Rasch model ex-plains behavior on fewer items than the model of double monotonicity, and fewer items should bein concordance with this model than the model of monotone homogeneity.
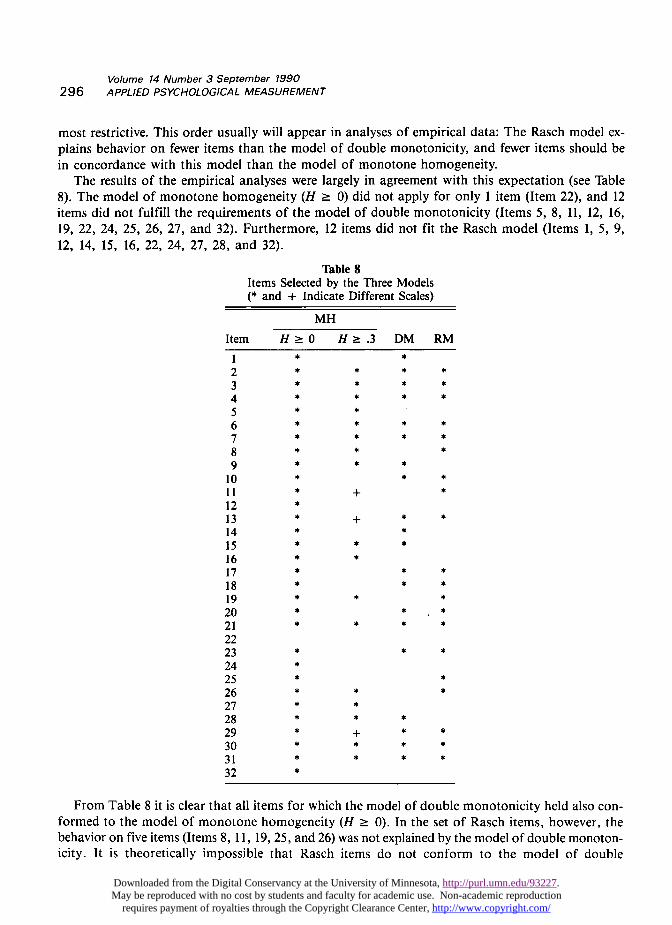
The results of the empirical analyses were largely in agreement with this expectation (see Table8). The model of monotone homogeneity (H >_ 0) did not apply for only 1 item (Item 22), and 12items did not fulfill the requirements of the model of double monotonicity (Items 5, 8, 11, 12, 16,19, 22, 24, 25, 26, 27, and 32). Furthermore, 12 items did not fit the Rasch model (Items 1, 5, 9,12, 14, 15, 16, 22, 24, 27, 28, and 32).
Table 8Items Selected by the Three Models(* and + Indicate Different Scales)
From Table 8 it is clear that all items for which the model of double monotonicity held also con-formed to the model of monotone homogeneity (H >_ 0). In the set of Rasch items, however, thebehavior on five items (Items 8, 11, 19, 25, and 26) was not explained by the model of double monoton-icity. It is theoretically impossible that Rasch items do not conform to the model of double
Downloaded from the Digital Conservancy at the University of Minnesota, http://purl.umn.edu/93227. May be reproduced with no cost by students and faculty for academic use. Non-academic reproduction
requires payment of royalties through the Copyright Clearance Center, http://www.copyright.com/
297
monotonicity. The misfit of these five items can thus be explained by properties of the methods forchecking the goodness-of-fit of the three models, such as the power of tests, and the arbitrarinessof some decisions based on statistics.
With respect to the methods for evaluating the fit of the three models, a problem was caused bythe way the items of the Verbal Analogies Test are constructed. The tasks that have to be performedto solve an item correctly do not vary systematically across items. This means that it was not possibleto create subsets of items that might measure hypothetically different attributes. Consequently, statisti-cal indicators had to be relied on for the analyses; item content was disregarded.
The results of the stepwise selection of items for the model of monotone homogeneity (H 2: .3)indicate that this additional restriction yielded sets of items that discriminate better among persons,in comparison with sets of items selected by using H = 0 as a lower bound. As Table 8 shows, if
. H ? .3, fewer items form one scale; this table also shows that H 2: .3 may result in the rejectionof some items that are included in the final Rasch scale.
The Rasch model has interesting measurement properties, such as specifically-objective measure-ment and measurement of items and persons on a metric scale. However, much of the research hasshown that items do not easily fit this model. The present Rasch analysis also showed that manyitems did not fit the model, whereas the behavior on almost all items was explained by the modelof monotone homogeneity.
In many testing applications, it often suffices to know the order of persons on an attribute (e.g.,in selection problems). Therefore, the Mokken model of monotone homogeneity seems to be an at-tractive model for two reasons. First, ordinal measurement of persons is guaranteed when the modelapplies to the data. Second, the model is not as restrictive with respect to empirical data as are theMokken model of double monotonicity and the Rasch model. If, in addition, an invariant orderingof items is required for all examinees (e.g., in intelligence testing), the model of double monotonicitymay be appropriate. More sophisticated applications, however, such as equating, item banking, andadaptive testing, preferably require measurement on metric scales. If such applications are envisaged,response behavior must comply with the demands of parametric models such as the Rasch model.
References
Andersen, E. B. (1973). A goodness of fit test for theRasch model. Psychometrika, 38, 123-140.
Cliff, N. (1977). A theory of consistency of orderinggeneralizable to tailored testing. Psychometrika, 42,375-401.
Debets, P., Sijtsma, K., Brouwer, E., & Molenaar, I.W. (1989). MSP: A computer program for itemanalysis according to a nonparametric IRT ap-proach. Psychometrika, 54, 534-536.
Drenth, P. J. D., & van Wieringen, P. (1969). VerbaleAanleg Test [Verbal Ability Test]. Amsterdam: Swets& Zeitlinger.
Fischer, G. H. (1974). Einführung in die Theorie psy-chologischer Tests [Introduction to psychological testtheory]. Bern: Huber.
Fischer, G. H. (1987). Applying the principles of specif-ic objectivity and of generalizability to the meas-urement of change. Psychometrika, 52, 565-587.
Glas, C. A. W. (1989). Contributions to estimating andtesting Rasch models. Unpublished doctoral dis-
sertation, Universiteit Twente, Enschede.Grayson, D. A. (1988). Two-group classification in
latent trait theory: Scores with monotone likelihoodratio. Psychometrika, 53, 383-392.
Gustafsson, J. E. (1977). The Rasch model for dichoto-mous items: Theory, applications and a computer pro-gram. Institute of Education, University of
Göteborg, Sweden.Guttman, L. (1945). A basis for analyzing test-retest
reliability. Psychometrika, 10, 255-282.de Jong-Gierveld, J., & Kamphuis, F. (1985). The de-
velopment of a Rasch-type loneliness scale. AppliedPsychological Measurement, 9, 289-299.
Kingma, J., & Ten Vergert, E. M. (1985). A nonpara-metric scale analysis of the development of conser-vation. Applied Psychological Measurement, 9,375-387.
Lord, F. M. (1980). Applications of item response the-ory to practical testing problems. Hillsdale NJ:Erlbaum.
Downloaded from the Digital Conservancy at the University of Minnesota, http://purl.umn.edu/93227. May be reproduced with no cost by students and faculty for academic use. Non-academic reproduction
requires payment of royalties through the Copyright Clearance Center, http://www.copyright.com/
298
Lord, F. M., & Novick, M. R. (1968). Statistical the-ories of mental test scores. Reading MA: Addison-Wesley.
Martin-Löf, P. (1973). Statistika Modeller. Antecknin-gar frän seminarier Läsaret 1969-70 utarbetade av RolfSundberg, 2: a uppl. [Statistical models. Notes fromseminars 1969-70 by Rolf Sundberg, 2nd ed.]. Stock-holm : Institute för Försäkrungsmatematik ochMatematisk Statistik vid Stockholms Universitet.
Mokken, R. J. (1971). A theory and procedure of scaleanalysis. The Hague: Mouton/New York, Berlin:de Gruyter.
Mokken, R. J., & Lewis, C. (1982). A nonparametricapproach to the analysis of dichotomous itemresponses. Applied Psychological Measurement, 6,417-430.
Mokken, R. J., Lewis, C., & Sijtsma, K. (1986). Re-joinder to "The Mokken Scale: A critical dicus-sion." Applied Psychological Measurement, 10,279-285.
Molenaar, I. W. (1982). Een tweede weging van deMokken schaal [A second weighing of the Mok-ken scaling procedure]. Tijdschrift voor Onderwijs-research, 7, 172-181.
Molenaar, I. W. (1983a). Rasch, Mokken en school-beleving [Rasch, Mokken and school experience].In S. Lindenberg & F. N. Stokman (Eds.), Modellenin de sociologie. Deventer: Van Loghum Slaterus.
Molenaar, I. W. (1983b). Some improved diagnosticsfor failure of the Rasch model. Psychometrika, 48,49-72.
Molenaar, I. W. (1986). Een vingeroefening in itemresponse theorie voor drie geordende antwoord-categorieën [An exercise in item response theory forthree ordered response categories]. In G. F. Pik-kemaat & J. J. A. Moors (Eds.), Liber AmicorumJaap Muilwijk. Groningen: Econometrisch Instituut.
Niemöller, B., & van Schuur, W. H. (1980). Mokken test.STAP user’s manual (Volume 4). Amsterdam: Univer-sity of Amsterdam Press.
Niemöller, B., & van Schuur, W.H. (1983). Stochasticmodels for unidimensional scaling: Mokken andRasch. In D. McKay, N. Schofield, & P. Whiteley(Eds.), Data analysis and the social sciences. Lon-don : Frances Pinter Publications.
Rasch, G. (1960). Probabilistic models for some intelli-gence and attainment tests. Copenhagen: Nielsen &Lydiche.
Rosenbaum, P. R. (1984). Testing the conditional in-dependence and monotonicity assumptions of itemresponse theory. Psychometrika, 49, 425-435.
Schmitt, N. (1981). Rasch analysis of the Central LifeInterest Measure. Applied Psychological Measure-ment, 5, 3-10.
Siegel, S. (1956). Nonparametric statistics. New York:McGraw Hill.
Sijtsma, K. (1988). Contributions to Mokken’s nonpara-metric item response theory. Amsterdam: Free
University Press.Sijtsma, K., & Molenaar, I. W. (1987). Reliability of
test scores in nonparametric item response theory.Psychometrika, 52, 79-97.
Sijtsma, K., & Prins, P. M. (1986). Itemselectie in hetMokken model [Item selection in the Mokken
model]. Tijdschrift voor Onderwijsresearch, 11,121-129.
Stokman, F. N. (1977). Roll calls and sponsorship: Amethodological analysis of third world group forma-tion in the United Nations. Leyden: Sijthoff.
Wainer, H., Morgan, A., & Gustafsson, J. E. (1980).A review of estimation procedures for the Raschmodel with an eye toward longish tests. Journal ofEducational Statistics, 5, 35-64.
van den Wollenberg, A. L. (1979). The Rasch model andtime-limit tests. Nijmegen: Stichting StudentenpersNijmegen.
van den Wollenberg, A. L. (1982). A simple and ef-fective method to test the dimensionality axiom ofthe Rasch model. Applied Psychological Measure-ment, 6, 83-91.
Wright, B. D. (1977). Solving measurement problemswith the Rasch model. Journal of Educational Meas-urement, 14, 97-116.
Author’s Address
Send requests for reprints or further information toRob R. Meijer, Vrije Universiteit, Vakgroep Arbeidsen Organisatiepsychologie, De Boelelaan 1081, 1081HV Amsterdam, The Netherlands.
Downloaded from the Digital Conservancy at the University of Minnesota, http://purl.umn.edu/93227. May be reproduced with no cost by students and faculty for academic use. Non-academic reproduction
requires payment of royalties through the Copyright Clearance Center, http://www.copyright.com/