Embed Size (px)
Citation preview

1
Bulletin of the JSME
Journal of Advanced Mechanical Design, Systems, and ManufacturingVol.8, No.3, 2014
Paper No.14-00061© 2014 The Japan Society of Mechanical Engineers[DOI: 10.1299/jamdsm.2014jamdsm0022]
Theoretical analysis and measurement of sound transmission
loss in louver elements with a sound attenuating function
using a Helmholtz resonator array
1. Introduction
Louvers are used in a wide variety of applications. With the advantage that they can be placed in apertures
requiring ventilation, adjusting the angle of louver element (slat) can control air flow direction, light, and visibility;
they also serve to guard against rain. However, sound transmission loss is generally small in louvers that have thin slats
with high aperture ratios. Several researches are being conducted on sound absorbing louvers (Yamaguchi, et al., 2010)
(Matsumoto and Okubo, 2011). There are also attempts active noise control (Suzuki, et al., 2010) by adding sound
sources to louvers.
This study focuses on louvers with sound reduction structures. In a previous report (Sakamoto, et al., 2013a), the
authors obtained an effective sound reduction effect while maintaining a high aperture ratio by incorporating a silencer
array in a thin board configuration that lined up narrow tube elements into a louver element. In this study, we examine
Helmholtz resonators, which can achieve sound reduction effects with simpler structures. Silencers using Helmholtz
resonators have the benefit of being produced simply by opening holes in a sealed space. For example,
aluminum-extruded materials used for louver elements often have internal cavities. With proper design, louver elements
Shuichi SAKAMOTO*, Ryohei SUGAHARA**, Toshihiro NAGUMO**, Arata NAKANO** and Hiromichi KAWASE***
* Department of Mechanical and Production Engineering, Niigata University
2-8050 Ikarashi, Nishi-ku, Niigata, 950-2181, Japan
E-mail: [email protected]
** Graduate School of Science and Technology, Niigata University
2-8050 Ikarashi, Nishi-ku, Niigata, 950-2181, Japan
*** Dainichi Co., Ltd., 780-6 Kita-Tanaka, Minami-ku, Niigata, Japan
Received 31 January 2014
Abstract This paper discusses a noise reduction structure with a thin Helmholtz resonator array integrated in louver elements. Using theoretical analysis, we derived the propagation constant and characteristic acoustic impedance with consideration for sound wave attenuation in the clearance between two planes for a thin cavity within the louver. The experiments with variation in three conditions were also performed: number of necks, internal thickness of the cavity, and number of partitions. Another experiment was conducted to verify that sound reduction characteristics change depending on the number of holes. The results closely matched with those calculated with consideration for attenuation, demonstrating the validity of the theoretical analysis. With respect to changes in the internal thickness of the cavity, experimental results showed that attenuation increased for clearances of 2 mm, causing significant differences in the sound reduction characteristics. At clearances of 8 mm, there was almost no attenuation in the clearance. Louvers with thin internal dimensions, in which holes diameter equal to the internal thickness of the cavity had been formed, created a larger effect than those with normal open end correction length. This resulted in a reduction in sound reduction frequency. Additionally, when cavities seen from the neck are created on the end face of the louver element as acoustic tubes, the properties of the acoustic tubes are added to the properties of the air spring. This achieved a significant reduction in the sound reduction peak frequency without increasing the volume of the cavity.
Key words : Sound and acoustics, Noise control, Sound transmission loss, Array silencer, Helmholtz resonator,
Silencer designs

22
Sakamoto, Sugahara, Nagumo, Nakano and Kawase, Journal of Advanced Mechanical Design, Systems, and Manufact, Vol.8, No.3 (2014)
© 2014 The Japan Society of Mechanical Engineers[DOI: 10.1299/jamdsm.2014jamdsm0022]
with added sound reduction capability can be realized.
In this study, we constructed sample louver elements incorporating Helmholtz resonators in a number of
configurations and then conducted experimental and theoretical analyses. The theoretical analysis revealed unique sound
reduction characteristics with respect to sound wave attenuation in the clearance between two planes when a Helmholtz
resonator is added to a thin board type louver element. With the Helmholtz resonator incorporated into a thin board
louver element, sound wave attenuation in the clearance between two planes within the cavity is significant (Sakamoto,
et al., 2013b). Similar to the case of porous sound absorption materials that have continuous pores, sound wave
attenuation mainly occurred because of friction caused by viscosity in the boundary layer (Wesley, 1958) on the wall
within the cavity. To consider sound wave attenuation due to air viscosity within the cavity, we used Navier–Stokes
equations to calculate the propagation constant and characteristic acoustic impedance. Then, sound transmission loss
was calculated by using the transfer matrix method. In the experiment, sound transmission loss was measured by using
a 4-microphone impedance measurement tube. By comparing sound transmission loss between the experimental and
calculated results, the sound reduction characteristics which reported in this paper was verified.
2. Test sample and measuring apparatus used for measurement
2.1 Test sample used in measurement
This section provides an overview of the test sample using Type 01 as a reference sample. As shown in Fig. 1, we
attached multiple louver elements to the internal face of a cylinder with an external diameter of 100 mm and a thickness
of 0.5 mm. As shown in Fig. 2, the louver elements form a Helmholtz resonator with an internal cavity. Stainless steel
panels with a thickness of 1.0 mm were the main material for the louver elements. The dimensions of the cavity were as
follows: internal depth in the longitudinal direction l=60 mm, internal width 64 mm, internal thickness Ti, and external
thickness To. The diameter of the neck was dn=2 mm, the length of the neck was ln=1 mm (equal to the thickness of the
panel material), and the number of holes in each cavity (hereafter, referred to as the number of holes) was N.
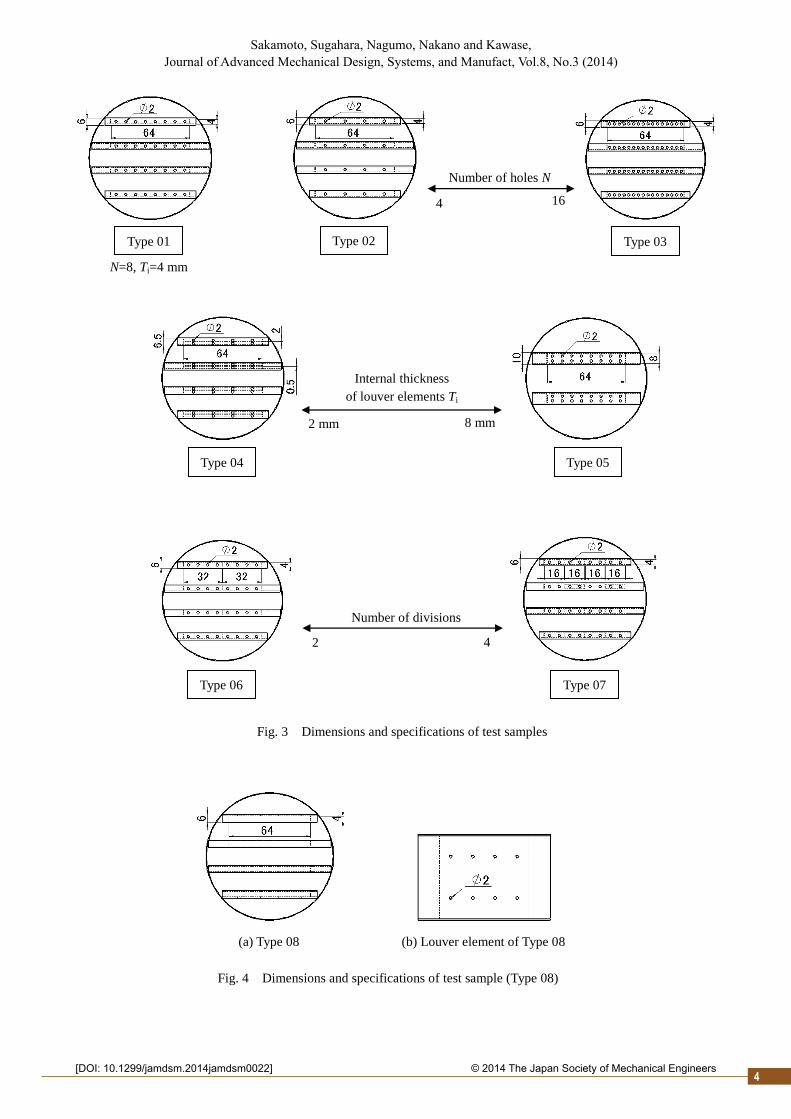
As shown in the upper, middle, and lower portions of Fig. 3, experiments were conducted on the Type 01 test
sample by varying three conditions. First, we varied the number of holes N because the sound reduction characteristics
change with the number of necks in the Helmholtz resonator (upper portion of Fig. 3). Then, with the varied internal
thickness of the cavity Ti (middle portion of Fig. 3) and number of partitions in the cavity (lower portion of Fig. 3),
comparisons were made. Table 1 summarizes the specifications of the test sample.
The Type 01 sample had four louver elements. The dimensions of the cavity were: an internal depth l of 60 mm,
internal width of 64 mm, internal thickness Ti of 4 mm, and external thickness To of 6 mm. The diameter dn of the neck
was 2 mm, length ln of the neck was 1 mm, and number N of holes was 8.
Fig. 1 Typical dimensions of test sample
Louver element
Fig. 2 Schematic of each louver element

33
Sakamoto, Sugahara, Nagumo, Nakano and Kawase, Journal of Advanced Mechanical Design, Systems, and Manufact, Vol.8, No.3 (2014)
© 2014 The Japan Society of Mechanical Engineers[DOI: 10.1299/jamdsm.2014jamdsm0022]
In the Type 02 (N=4) and Type 03 (N=16) samples, the number of holes N in the neck was varied to 4 (1/2 Type
01) and 16 (2 × Type 01), respectively. The number of louver elements and dimensions of the cavity and neck were
identical to those of the Type 01 (N=8) sample.
Type 04, Type 01, and Type 05 samples have internal thickness Ti values of 2 mm, 4 mm and 8 mm, respectively.
The Type 04 (Ti=2 mm) and Type 05 (Ti=8 mm) samples have the same total cavity volume for the louver elements and
the same total number of necks as in the Type 01 (Ti=4 mm) sample. Thus, by comparing the three sample types, we
can observe the isolated effects of the internal thickness of the cavity. The Type 04 (Ti=2 mm) sample is structured so
that the internal thickness of the louver elements, as in Type 01 (Ti=4 mm), is divided in half by a 0.5 mm-thick
partition, effectively creating 8 louver elements grouped into 4 panels. The louver elements of the Type 05 (Ti=8 mm)
sample have the internal thickness twice that of Type 01 (Ti=4 mm) and half of the number of louver elements of Type
01 (Ti=4 mm).
The Type 06 sample is structured so that the 64 mm internal width of the Type 01 cavity is divided in half, creating
two resonators with an internal width of 32 mm, each. The Type 07 sample is structured so that the Type 01 internal
cavity is divided into four divisions in the width direction, creating four resonators with an internal width of 16 mm,
each.
The Type 08 sample is shown in Fig. 4. It has necks on the side plane of the cavity, but otherwise has all the same
specifications as Type 01.
Figure 5 shows the Type 01 to Type 08 samples.
Type 01 Type 02 Type 03 Type 04 Type 05 Type 06 Type 07 Type 08
Number of holes per
unit volume of Type 01
slat
8 4 16 8
Internal thickness
of the cavity [mm] 4 2 8 4
Number of divisions 1 2 4 1
Aperture area of
test sample [mm2]
5659 5497 5914 5659
Aperture ratio of
test sample 0.735 0.714 0.768 0.735
Table 1 Typical specifications of test samples
44
Sakamoto, Sugahara, Nagumo, Nakano and Kawase, Journal of Advanced Mechanical Design, Systems, and Manufact, Vol.8, No.3 (2014)
© 2014 The Japan Society of Mechanical Engineers[DOI: 10.1299/jamdsm.2014jamdsm0022]
(a) Type 08 (b) Louver element of Type 08
Fig. 4 Dimensions and specifications of test sample (Type 08)
Fig. 3 Dimensions and specifications of test samples
16 4
Number of holes N
8 mm 2 mm
Internal thickness
of louver elements Ti
2 4
Number of divisions
Type 02
N=8, Ti=4 mm
Type 01 Type 03
Type 04 Type 05
Type 07
Type 06

55
Sakamoto, Sugahara, Nagumo, Nakano and Kawase, Journal of Advanced Mechanical Design, Systems, and Manufact, Vol.8, No.3 (2014)
© 2014 The Japan Society of Mechanical Engineers[DOI: 10.1299/jamdsm.2014jamdsm0022]
2.2 Apparatus used to measure transmission loss
The configuration of the measuring apparatus is shown in Fig. 6. The test sample was shielded in a Brüel & Kjær
type 4206T 4-microphone impedance measurement tube. Two microphones were placed on each of the wall surfaces
before and behind the test sample. Sound waves were created using a reference signal and the sound pressure before
and after transmission through the test sample was measured with the microphones using an FFT analyzer. The normal
incident transmission loss was calculated on the basis of the standard test method ASTM E2611-09. The sound pressure
level measured with the microphone was approximately 102 dB. In a preliminary experiment, we changed the sound
pressure level within the tube to a range of approximately 30 dB to verify that there were no nonlinear trends.
The test sample with the sample frame was inserted into the impedance measurement tube along with it's inner face.
The ends of the frame and inner face of the impedance tube were sealed with modeling clay to avoid sound absorption by
a clearance between the tube face and sample frame.
Fig. 6 Four microphone impedance tube for transmission loss measurement
Fig. 5 Photographs of test samples
Type 01 Type 02 Type 03
Type 04 Type 05
Type 08 Type 07
Type 06
Louver element of Type 08
measurement tube
Test sample
Impedance
Microphone FFT
1-ch
2-ch
4-ch
PC
4-ch
3-ch
2-ch
1-ch
Analyzer
Amplifier
3-ch
amplifier
End of impedance tube
Loudspeaker
Microphone
Signal
generator

66
Sakamoto, Sugahara, Nagumo, Nakano and Kawase, Journal of Advanced Mechanical Design, Systems, and Manufact, Vol.8, No.3 (2014)
© 2014 The Japan Society of Mechanical Engineers[DOI: 10.1299/jamdsm.2014jamdsm0022]
3. Theoretical analysis
3.1 The four-terminal constants of the acoustic tube element
When observing the cavity from the end with the neck in a louver element, a plane wave forms. Thus, the cavity
can be treated as an acoustic tube. We analyzed the louver element cavity, using the transfer matrix method related to
sound pressure and volume velocity on the basis of a one-dimensional wave equation. Using the cavity cross sectional
area S, length l, characteristic acoustic impedance of the medium Zc, and propagation constant γ, the transfer matrix
with considering attenuation Tloss and four-terminal constants of the sound tube elements Aloss through Dloss are
expressed by Eq. (1).
(1)
Next, it is assumed that Tless is the transfer matrix without considering attenuation within the tube, which is used for
the main tube portion excluding the louver element. In this case, characteristic acoustic impedance Zc in Eq. (1) is
expressed by the product of the speed of sound in air c0 (343.7 m/s) and density of air 0 (1.2046 kg/m3); where j is
expressed in the imaginary units, and the propagation constant γ in Eq. (1) without considering attenuation is expressed
by the wave number k only in the imaginary part. Accordingly, the four-terminal constants without considering
attenuation Aless through Dless are expressed by Eq. (2).
(2)
3.2 Acoustic impedance of the cavity
For the entrance (neck side) and terminal end of the cavity, which is treated as an acoustic tube, assuming that the
respective sound pressures are p1, p2, and the particle velocities are u1, u2, the transfer matrix is expressed by the
following formula. Equation (1) is used when considering attenuation within the tube, and Eq. (2) is used otherwise.
(3)
The particle velocity u2 at the rigid-wall terminal end of the acoustic tube is 0, giving the following formula.
(4)
The acoustic impedance Zcav observed from the entrance of the acoustic tube is expressed by the following formula
based on Eq. (4).
(5)
)cosh()sinh(
)sinh()cosh(
c
c
lossloss
losslossloss
llZ
S
lS
Zl
DC
BAT
klklc
Sj
klS
cjkl
DC
BAT
cossin
sincos
00
00
lessless
lesslessless
2
2
1
1
Su
p
DC
BA
Su
p
2
2
1
1
Cp
Ap
Su
p
C
A
Su
pZ
1
1cav

77
Sakamoto, Sugahara, Nagumo, Nakano and Kawase, Journal of Advanced Mechanical Design, Systems, and Manufact, Vol.8, No.3 (2014)
© 2014 The Japan Society of Mechanical Engineers[DOI: 10.1299/jamdsm.2014jamdsm0022]
3.3 Acoustic impedance of the neck
The neck is assumed to be an orifice. The acoustic impedance Zn of the orifice is expressed by the formula below
(Ingård, 1953).
(6)
Where, is the angular frequency, Sn is the cross sectional area of the neck, and ∆ln is the end correction length of
the neck. With a baffle, ∆ln is set to 0.85 of the radius of the hole (Benade, 1967). R, which stands for the acoustic
resistance based on the acoustic energy consumption due to heat conduction and viscosity on the internal wall surface
of the orifice, is expressed by the following formula.
(7)
Where, f is the frequency, RS is the surface resistance (≈0.83 f1/2
× 10-2
), and lR is the resistance end correction (≈dn)
(Ingård, 1953).
Figure 7 shows an equivalent circuit for the louver elements including the impedance tubes on both sides of it's.
Each acoustic impedance of the resonator is connected in parallel within the main tube in the equivalent circuit.
When the acoustic impedance of each resonator is connected in parallel within the main tube, their connecting positions
are determined only by the longitudinal direction within a tube in which plane wave form. For the Types 01 through 07
samples, all of which have the resonator necks at the same points in the longitudinal direction, they are connected to the
starting points of the louver elements.
Figure 7 also shows neck side on the sound source side (in the image, the sound source is on the left side). With a
opposite side on the sound source side, the sound source is found on the right side of Fig. 7. Equation (13) below
mathematically proves that transmission loss in both of these cases is equal, thus the calculation results are equal. (For
this reason, the experimental results obtained for the neck side and opposite side in section 4 are nearly the same.)
fS
dl
d
ll
S
RR
n
nn2
n
Rn
n
S 11083.044
n
nn0n
2
S
lljRZ
Fig. 7 Equivalent circuit for Helmholtz resonators and opening area between louver elements.
(Zn: Impedance of each neck, Zcav: Impedance of each cavity, Tap: Transfer matrix of
opening area between louver elements, T0: Transfer matrix of impedance tube)
Sound source side:
(Case of neck side faced to
sound source)
Sound source side:
(Case of opposite side faced to
sound source)

88
Sakamoto, Sugahara, Nagumo, Nakano and Kawase, Journal of Advanced Mechanical Design, Systems, and Manufact, Vol.8, No.3 (2014)
© 2014 The Japan Society of Mechanical Engineers[DOI: 10.1299/jamdsm.2014jamdsm0022]
Resonator acoustic impedance Zres, which is a series connection between acoustic impedance in both the cavity and
neck, is expressed by the following formula.
(8)
Next, we express N resonator acoustic impedances as single acoustic impedance ZA in the following formula.
(9)
The transfer matrix for the parallel impedance for the resonator acoustic impedance ZA is expressed below.
(10)
After subtracting the cross sectional area of the louver elements from that of the impedance tube, the resulting cross
sectional area is that of the louver opening, Sap.
Assuming that the louver opening from the entrance to exit is an acoustic tube of the cross sectional area Sap and
length lap, its transfer matrix Tap can be expressed by the following formula.
(11)
Thus, the transfer matrix of the entire louver is expressed as follows.
(12)
Using the four-terminal constants on the left side of Eq. (12), the transmission loss of the entire louver TL can
expressed as shown in Eq. (13). The cross sectional area SItube of the impedance tube, front and back side of the test
sample, is reflected in the calculation results for Eq. (13).
(13)
N
ZZ res
A
11
01
AZ
apap
00
ap
ap
ap
00ap
Aallall
allall
cossin
sincos
11
01
klklc
Sj
klS
cjkl
ZDC
BA
4log10
2
allallItube
00all
00
Itubeall
10
DCS
cB
c
SA
TL
cavnres ZZZ
apap00
ap
apap
00ap
apap
apap
ap
cossin
sincos
klklc
Sj
klS
cjkl
DC
BAT

99
Sakamoto, Sugahara, Nagumo, Nakano and Kawase, Journal of Advanced Mechanical Design, Systems, and Manufact, Vol.8, No.3 (2014)
© 2014 The Japan Society of Mechanical Engineers[DOI: 10.1299/jamdsm.2014jamdsm0022]
3.4 Propagation constant and characteristic impedance with consideration for sound wave attenuation
within the cavity
With regard to sound wave attenuation in the tube, the attenuation constant, which represents the real part of the
propagation constant, was found experimentally for an electric resistance welded tube with an internal diameter of over
20 mm (Suyama and Hirata, 1979). Theoretical analyses which the viscosity of the boundary layer was taken into
account have been carried out in the cylindrical tube (Tijdeman, 1975), and in the clearance between two parallel plates
(Beltman, et al., 1998), (Stinson and Champou, 1992). Consequently, the propagation constant could be derived.
We have converted the cylindrical coordinate system of the Tijdeman’s method mentioned above into the Cartesian
system to take into account the attenuation of the sound waves in the clearance of a cavity thickness Ti and have used
the converted method. A clearance between two planes of thickness Ti is shown in a Cartesian coordinate system in Fig.
8. The propagation constant γ and characteristic impedance Zc for a clearance between two planes was derived by
solving Navier-Stokes equations, continuity equation, gas state equation, and energy equation through approximation.
Here, authors treat air as a compressible fluid and assume air viscosity to be unchanged. For the boundary condition, it
was assumed that particle velocity on the cavity wall plane was 0 and the wall was isothermal.
The propagation constant γ for a clearance between two planes with consideration for attenuation is shown below
(Tijdeman, 1975). Where, κ is the ratio of specific heat, σ is the square root of the Prandtl number (0.8677), and µ is air
viscosity (1.869 × 10⁻⁵
Pa·s).
(14)
Next, we show the characteristic acoustic impedance Zc within the cavity with consideration for attenuation.
For a traveling wave particle velocity u+ and sound pressure p
+, the characteristic acoustic impedance Zc is
expressed by the following formula.
(15)
u+ and p
+ in a cavity with attenuation are shown in Eq.s (16) and (17) below (Tijdeman, 1975). Where, is an
arbitrary constant and Ps is air pressure (1.013 × 10⁵ Pa).
(16)
(17)
u
pZc
xek
jsBcu
)(0
xPp es
, ,
0iTs
sB
sBkj
1
1sinh
cosh12
sjsj
sjsB
1sinh
cosh12
sjsj
sjsB
Fig. 8 Cartesian coordinate system for parallel clearance between a pair of planes.
x y
z
iT
0
Surrounding wall

1010
Sakamoto, Sugahara, Nagumo, Nakano and Kawase, Journal of Advanced Mechanical Design, Systems, and Manufact, Vol.8, No.3 (2014)
© 2014 The Japan Society of Mechanical Engineers[DOI: 10.1299/jamdsm.2014jamdsm0022]
The propagation constant γ and characteristic acoustic impedance Zc were found using Eq.s (14) and (15),
respectively. By substituting these values into Eq. (1), we were able to consider sound wave attenuation within the
cavity.
Figures 9 and 10 show the real and imaginary parts of the characteristic acoustic impedance Zc found in Eq. (15)
normalized by characteristic impedance of air ρ0c0. Figure 11 shows the attenuation constant, the real part of the
propagation constant γ found in Eq. (14), followed by conversion into the amount of sound wave attenuation over
distance. Figure 12 shows the phase constant, the imaginary part of the propagation constant γ, converted to phase
velocity.
In Fig.s 9 and 10, the real and imaginary parts of the characteristic acoustic impedance approach 1 and 0,
respectively, as frequency increases, showing the same trend as that for porous material in which solid-borne sound can
be ignored (Koshiroi and Tateishi, 2012). Also, the value for the characteristic acoustic impedance Zc diverges from the
characteristic impedance of air as the clearance decreases in size, showing the same trend of narrower clearances in
porous material.
In Fig. 11, attenuation increases at higher frequencies, and in Fig. 12, sound velocity decreases at lower
frequencies. In these cases as well, we see trends similar to those for porous materials in which the solid-borne sound
can be ignored (Koshiroi and Tateishi, 2012). As the clearance becomes narrower, attenuation increases, as seen in Fig.
11 and sound velocity further decreases, as seen in Fig. 12. These results match with commonly known trends.
Looking at Fig.s 9 through 12 overall, the effects of attenuation are significant for a clearance of 2 mm. However,
estimated values for clearances of 8 mm are similar to air constants, and the effects of attenuation can mostly be
ignored.
0 500 1000 15001
1.05
Ch
ara
cte
rist
ics
imp
ed
an
ce R
e(Z
c)
Internal thickness=2 mm Internal thickness=4 mm Internal thickness=8 mm
Frequency f [Hz]0 500 1000 1500
-0.05
0
Frequency f [Hz]
Internal thickness=2 mm Internal thickness=4 mm Internal thickness=8 mm
Char
acte
rist
ics
imp
edan
ce I
m(Z
c)
0 500 1000 15000
5
10
15
Frequency f [Hz]
Att
enuati
on c
oef
ficie
nt
8.6
85
9 R
e(
) [d
B/m
]
Internal thickness=2 mm Internal thickness=4 mm Internal thickness=8 mm
0 500 1000 1500300
310
320
330
340
350
Frequency f [Hz]
Ph
ase
velo
cit
y
/Im
()
[m/s
]
Internal thickness=2 mm Internal thickness=4 mm Internal thickness=8 mm
Fig. 11 Attenuation constant of dB/meter
(-20 log10exp(-Re()) =8.6859 Re() )
Fig. 12 Phase velocity (Im() )
Fig. 10 Characteristic impedance Im (Zc)by Eq. (15)
(Normalized by 0c0)
Fig. 9 Characteristic impedance Re (Zc) by Eq. (15)
(Normalized by 0c0)

1111
Sakamoto, Sugahara, Nagumo, Nakano and Kawase, Journal of Advanced Mechanical Design, Systems, and Manufact, Vol.8, No.3 (2014)
© 2014 The Japan Society of Mechanical Engineers[DOI: 10.1299/jamdsm.2014jamdsm0022]
4. Comparing calculated results with measured results
4.1 Type 01
In this subsection, the calculated and experimental results among all the samples, Types 01 through 08 were
compared. First, the experimental and calculated results for the Type 01 sample are shown in Fig. 13.
As mentioned in subsection 3.3, results are thought to be the same for either side of test sample faced to the sound
source, but we show the results for both conditions for verification of our experimental results. Nearly same results
were obtained from the two experiments. In the Type 01 sample test, the transmission loss peak appeared at
approximately 1000 Hz, with a peak value of approximately 8 dB.
Calculated results are shown for those with and without consideration for sound wave attenuation within the cavity.
While the results calculated without consideration for attenuation show a sharp peak, the results calculated with
consideration for attenuation match well with the experimental results. This shows that sound wave attenuation cannot
be ignored for the 4 mm clearance of the cavity in the Type 01 sample.
In addition, the experimental result of the solid slat louver whose external dimensions are identical with Type 01 is
shown in Fig. 13. This result evidently shows that the transmission loss due to the slat itself is small.
4.2 Comparisons among Types 01, 02, and 03 (with the varied number of holes in the neck)
Each of Type 02 and Type 03 samples has the number of holes in the neck varied relative to that of Type 01. The
Type 02 sample has 4 holes, half the number in Type 01, while the Type 03 sample has 16 holes, twice the number in
Type 01.
Figures 14 and 15 show experimental and calculated results for the Type 02 and Type 03 samples. Experimental
results for the Type 02, Type 03, and Type 01 samples are shown in Fig. 16. Calculated results for the Type 02, Type 03,
and Type 01 samples are shown in Fig. 17.
In the experimental results for the Type 02 sample shown in Fig. 14, since the number of holes was half the number
in Type 01, the transmission loss peak shifted to a lower frequency of approximately 800 Hz, while the peak value fell
down to just above 5 dB.
In the experimental results for the Type 03 sample shown in Fig. 15, since the number of holes was twice the
number in Type 01, the transmission loss peak shifted to a higher frequency of approximately 1100 Hz, while the peak
value rose to approximately 10 dB.
For both Type 02 and Type 03 samples in Fig.s 14 and 15, values calculated without consideration for sound wave
attenuation within the cavity show sharp peaks, while values with consideration for attenuation match well with
experimental values. Slight differences can be seen in the peak frequencies between the experimental and calculated
results for the Type 02 and Type 03 samples. This is thought to be due to dimensional errors in the test samples, which
were manually prepared.
As shown in Fig. 16, as the number of holes was reduced, peak frequencies for transmission loss fell in the order of
Type 03, Type 01, and Type 02. This may be because the reciprocal of the number of holes in the Helmholtz resonator
corresponds to the mass in the spring and mass vibration system.
Fig. 13 Experiments and calculations (Type 01: N=8, Ti=4 mm)
0 500 1000 15000
5
10
Tra
nsm
issi
on
lo
ss [
dB
]
Frequency f [Hz]
Measured value Upstream side open Downstream side open
Theoretical value With attenuation Without attenuation
Measured value Solid slat (w/o resonators)

1212
Sakamoto, Sugahara, Nagumo, Nakano and Kawase, Journal of Advanced Mechanical Design, Systems, and Manufact, Vol.8, No.3 (2014)
© 2014 The Japan Society of Mechanical Engineers[DOI: 10.1299/jamdsm.2014jamdsm0022]
As shown in Fig. 17, the two types of calculated values show a trend similar to the falling trend of the peak value
in the experimental values because of a reduction in the number of holes. Thus, we find that reductions in the
transmission loss peak value due to reductions in the number of holes is reflected in the calculated values through
“acoustic resistance R in the neck holes” in the equivalent circuit.
0 500 1000 15000
5
10
15
Tra
nsm
issi
on l
oss
[dB
]
Frequency f [Hz]
Type 01 (N=8) With attenuation Without attenuation
Type 02 (N=4) With attenuation Without attenuation
Type 03 (N=16) With attenuation Without attenuation
0 500 1000 15000
5
10
15
Tra
nsm
issi
on l
oss
[dB
]
Frequency f [Hz]
Type 01 (N=8) Upstream side open Downstream side open
Type 02 (N=4) Upstream side open Downstream side open
Type 03 (N=16) Upstream side open Downstream side open
0 500 1000 15000
5
10
15
Tra
nsm
issi
on l
oss
[dB
]
Frequency f [Hz]
Measured value Upstream side open Downstream side open
Theoretical value With attenuation Without attenuation
0 500 1000 15000
5
10
Tra
nsm
issi
on
lo
ss [
dB
]
Frequency f [Hz]
Measured value Upstream side open Downstream side open
Theoretical value With attenuation Without attenuation
Fig. 16 Comparison between experiments
Fig. 17 Comparison between calculations
Fig. 14 Experiments and calculations
(Type 02: N=4)
Fig. 15 Experiments and calculations
(Type 03: N=16)

1313
Sakamoto, Sugahara, Nagumo, Nakano and Kawase, Journal of Advanced Mechanical Design, Systems, and Manufact, Vol.8, No.3 (2014)
© 2014 The Japan Society of Mechanical Engineers[DOI: 10.1299/jamdsm.2014jamdsm0022]
Fig. 20 Comparison between experiments
Fig. 21 Comparison between calculations
4.3 Comparisons of Type 01, Type 04, and Type 05 (changing the internal thickness of the cavity Ti)
The Type 04 and Type 05 samples have the internal thickness of the cavity Ti varied relative to the Type 01 sample. In
the Type 04 sample, Ti is 2 mm, half that of Type 01, while in the Type 05 sample Ti is doubled to 8 mm.
Figures 18 and 19 show experimental and calculated results for the Type 04 and Type 05 samples. Experimental
results for the Type 04, Type 05, and Type 01 samples are shown in Fig. 20. Calculated results for the Type 04, Type 05,
and Type 01 samples are shown in Fig. 21.
In the experimental results for the Type 04 sample shown in Fig. 18, the transmission loss peak value is
approximately 7 dB, lower than that of Type 01. This may be because Ti of the Type 04 sample is half that of Type 01, so
the effects of friction appear at the boundary layer of the inner wall of the cavity. The peak frequency of transmission loss
is also slightly different between the calculated and experimental values. The reason for this is explained below. Since Ti
and the hole diameter dn are 2 mm, the inner wall of the cavity and circumference of the hole are in contact. Reports
(Kawanishi, et al., 1996) show that when a wall exists in contact with the circumference of the hole, as in this case, the
end correction length is larger than normal. Thus, it is thought that in the Type 04 sample, an effect in which the end
correction length of the neck is lengthened by the two walls within the cavity is seen. Using this phenomenon, we can
obtain the same effect for long necks (= a number of production steps) by opening holes in contact with a louver’s
internal wall with thin internal dimensions, such as in the Type 04 sample, allowing us to reduce the sound reduction
frequency. Increasing the volume is necessary to reduce the sound reduction frequency in the Helmholtz resonator, but it
is difficult to ensure the volume in these types of thin louver elements. Thus, the above effect is applicable to muffler
design.
In the experimental results for the Type 05 sample shown in Fig. 19, the transmission loss peak value is
approximately 9 dB, higher than that of Type 01. This may be because Ti of the Type 05 sample is twice that of Type 01,
so the effects of friction at the boundary layer of the inner wall of the cavity are lessened.
0 500 1000 15000
5
10
Tra
nsm
issi
on
lo
ss [
dB
]
Frequency f [Hz]
Type 01 (Ti=4 mm) With attenuation Without attenuation
Type 04 (Ti=2 mm) With attenuation Without attenuation
Type 05 (Ti=8 mm) With attenuation Without attenuation
0 500 1000 15000
5
10
Tra
nsm
issi
on l
oss
[dB
]
Frequency f [Hz]
Type 01 (Ti=4 mm) Upstream side open Downstream side open
Type 04 (Ti=2 mm) Upstream side open Downstream side open
Type 05 (Ti=8 mm) Upstream side open Downstream side open
Fig. 18 Experiments and calculations
(Type 04: Ti=2 mm)
Fig. 19 Experiments and calculations
(Type 05: Ti=8 mm)
0 500 1000 15000
5
10
Tra
nsm
issi
on
lo
ss [
dB
]
Frequency f [Hz]
Measured value Upstream side open Downstream side open
Theoretical value With attenuation Without attenuation
0 500 1000 15000
5
10
Tra
nsm
issi
on
lo
ss [
dB
]
Frequency f [Hz]
Measured value Upstream side open Downstream side open
Theoretical value With attenuation Without attenuation

1414
Sakamoto, Sugahara, Nagumo, Nakano and Kawase, Journal of Advanced Mechanical Design, Systems, and Manufact, Vol.8, No.3 (2014)
© 2014 The Japan Society of Mechanical Engineers[DOI: 10.1299/jamdsm.2014jamdsm0022]
For the Type 04 and Type 05 samples in Fig.s 18 and 19, values calculated with consideration for attenuation match
well with experimental values. In the Type 05 sample, as shown in Fig. 19, the experimental and calculated (two types of)
values are all close to each other. This may be because, since Ti is large (8 mm), almost no effects of attenuation within
the cavity are seen in the experimental values, resulting in only small difference between the calculated values with and
without consideration for attenuation.
As shown in Fig. 20, as Ti was reduced, peak frequencies for transmission loss fell in the order of Type 05, Type 01,
and Type 04. This may be because, as noted above, the effects of friction at the boundary layer of the inner wall of the
cavity increase as Ti is reduced. Type 05, Type 01, and Type 04 samples have equal numbers of holes for cavity volume.
For this reason, transmission loss peak frequency was approximately 1000 Hz for all three types.
As shown in Fig. 21, transmission loss peak value calculated with consideration for attenuation fell in the order of
Type 05, Type 01, and Type 04 as Ti was reduced, like the results in Fig. 20. Since this trend is the same as that observed
in the experimental values, it is thought that calculations with consideration for attenuation reflect actual phenomena. In
calculations without consideration for attenuation, since the same problems (the same problems as those given in the
following section) might occur as those occurring when partitioning the same cavity volume by 2, 4, or 8 partitions, we
obtained the same calculated results for all three types.
4.4 Comparisons among Types 01, 06, and 07 (effects of divisions)
The Type 06 and Type 07 samples have the internal width of the cavity divided into 2 and 4 segments, respectively
relative to Type 01.
Experimental results for the Type 06, Type 07, and Type 01 samples are shown in Fig. 22. Since the calculated values
for the Types 06 and 07 samples were equal to those of Type 01, we omit comparisons between the experimental and
calculated values for Type 06 and Type 07 samples here. For the same reason, comparisons of the calculated results
among there three sample types are also omitted.
Figure 22 shows that the experimental results of all three sample types were nearly equal. This demonstrates that
partitioning the cavity does not affect sound reduction characteristics. For example, it is known that the same results are
obtained regardless of whether individual necks are partitioned into discrete cavities, as with the perforated acoustic
board with a back air space specified in JIS A6301. In this study, we found that, just as with a perforated acoustic board,
the presence of partitions in a thin Helmholtz resonator with necks on the end does not affect the acoustic properties.
Here, we also consider such a case that, contrary to this experiment, the internal width of the cavity is increased.
Under conditions in which the internal width of the cavity surpasses the half wavelength of the sound wave, a plane wave
does not develop in the depth direction from the neck. Thus, to obtain experimental results that match with the calculated
results for samples Types 01 through 07, we must create partitions to decrease the internal width of the cavity to a value
below the half wavelength of the frequency applied.
Here, differences in the sound reduction peak widths among samples Type 01, Type 06, and Type 07 are thought to
be due to discrepancies in the cavity width (intervals between partitions). Because of the error in the cavity width, the
resonating frequency of each cavity divided by partitions will be slightly different, leading to a slight drop in the peak
value and a slight increase in the peak width in the frequency axis direction.
4.5 Type 8 (with a neck formed on the cavity side plane)
The Type 08 sample includes a neck on the side plane of the cavity, and is, in all other specifications, the same as
those of Type 01.
It is known that in the case in which a neck is located on the end plane of the cavity, as in samples Types 01 through
07, under conditions in which a plane wave forms on the cross section of the cavity (4 × 64 mm), the cavity has air spring
effects and acoustic tube effects (Sasao, 2006). The Type 08 sample was constructed to remove acoustic tube effects from
Type 01.
Figure 23 shows the experimental and calculated results for the Type 08 sample. Type 08, in which a neck is placed
on the side plane of the cavity, is a Helmholtz resonator without acoustic tube effects. Thus, the transmission loss peak
frequency is high in comparison with the Type 01 sample. This shows that in samples Types 01 through 07, formation of
a neck on the end plane of the cavity achieves a large reduction in sound reduction peak frequency with no increase in
volume of the cavity.
The calculated values for the Type 08 sample were obtained assuming that it was a Helmholtz resonator with

1515
Sakamoto, Sugahara, Nagumo, Nakano and Kawase, Journal of Advanced Mechanical Design, Systems, and Manufact, Vol.8, No.3 (2014)
© 2014 The Japan Society of Mechanical Engineers[DOI: 10.1299/jamdsm.2014jamdsm0022]
consideration only for acoustic resistance within the neck R. In other words, the values were calculated using Eq. (2)
without consideration for attenuation, assuming that the cavity was an acoustic tube with a cylindrical cross section equal
to the cross sectional area as seen from the neck (longitudinal direction 4 mm, height and width 60 × 64 mm). In this case,
the cavity is calculated as air spring. The connecting point with the neck in the equivalent circuit in Fig. 7 was the center
along the depth of the louver aperture. Since the Type 08 sample was designed to show sound reduction characteristics
different from those in Type 01, we did not consider attenuation between two planes in the clearance.
5. Conclusion
We conducted a study of sound reduction structures with thin Helmholtz resonator arrays integrated into louver
elements and obtained the following results.
By theoretical analysis, we calculated the propagation constant and characteristic acoustic impedance with
consideration for sound wave attenuation in the clearance between two planes for a thin cavity within the louver. The
experiments with variation in three conditions were also performed: the number of necks, internal thickness of the
cavity, and number of partitions.
We performed another experiment to verify that the sound-reduction characteristics change depending on the
number of holes. The experimental results closely matched with the results calculated with consideration for
attenuation, demonstrating the validity of the theoretical analysis.
We next performed an experiment with the varied internal thickness of the cavity. The results showed that
attenuation increased for clearances of 2 mm and significant differences were observed in the sound reduction
characteristics. At clearances of 8 mm, there was almost no attenuation.
Louvers with thin internal dimensions, in which holes diameter equal to the internal thickness of the cavity had
been formed, created a larger effect than those with a normal open end correction length. This allowed us to reduce the
sound reduction frequency.
We also performed experiments using partitions that divided the cavity, but this had no effect within the range of
the experiment. It is thought that this same result occurs in perforated acoustic boards.
When cavities seen from the neck are created on the end face of the louver element formed as acoustic tubes, the
properties of the acoustic tubes can be added to the properties of the air spring. This achieved a great reduction in sound
reduction peak frequency without increasing the volume of the cavity.
Acknowledgment
This work was supported by Sasaki Environment Technology Foundation.
0 500 1000 15000
5
10
Tra
nsm
issi
on
lo
ss [
dB
]Frequency f [Hz]
Measured value Type 08 (necks on the side)
Type 01 (necks on the end) (Upstream side open) (Downstream side open)
Theoretical value Type 08 (necks on the side)
(Without attenuation)
0 500 1000 15000
5
10
Tra
nsm
issi
on
lo
ss [
dB
]
Frequency f [Hz]
Type 01 (w/o divisions) Upstream side open Downstream side open
Type 06 (2 divisions) Upstream side open Downstream side open
Type 07 (4 divisions) Upstream side open Downstream side open
Fig. 22 Comparison between experiments
Fig. 23 Experiments and calculations
(Type 08 and Type 01)

1616
Sakamoto, Sugahara, Nagumo, Nakano and Kawase, Journal of Advanced Mechanical Design, Systems, and Manufact, Vol.8, No.3 (2014)
© 2014 The Japan Society of Mechanical Engineers[DOI: 10.1299/jamdsm.2014jamdsm00 ]22
References
Benade, H. A., Measured end corrections for woodwind toneholes, Journal of the Acoustical Society of America, Vol. 41, No.
6 (1967), p. 1609.
Ingård, U., On the theory and design of acoustic resonators, Journal of the Acoustical Society of America, Vol. 25, No.
6 (1953), pp. 1037-1061.
Kawanishi, Y., Dang, J., Honda, K. and Suzuki, H., Variations of the end correction coefficient of branches within an
acoustic tube with their shapes, Technical report of the institute of electronics, information and communication
engineers, Vol. Sp96-4 (1996), pp. 23-30 (in Japanese).
Koshiroi, T. and Tateishi, S., Features of sound absorption data in porous material caused by elastic frame structure, Journal
of Acoustical Society of Japan, Vol. 68, No. 9 (2012), pp. 474-479 (in Japanese).
Matsumoto, T., Okubo, T. and Yamamoto, K., Prediction of sound insulation of absorptive louvers, Journal of Acoustical
Society of Japan, Vol. 67, No. 9 (2011), pp. 385-394 (in Japanese).
Sakamoto, S., Sato, H., Yamazaki, M., Sugahara, R. and Kawase, H., Theoretical analysis and measurement of sound
transmission loss in louver elements with a sound attenuating function using a narrow tube array, Journal of
Advanced Mechanical Design Systems and Manufacturing, Vol. 7, No. 4 (2013a), pp. 690-705.
Sakamoto, S., Saito, K., Murayama, N. and Higuchi, K., Experimental Studies on the sound absorbing materials by
using of the bundle of narrow clearances between two planes, Transactions of the Japan society of Mechanical
Engineers, Series C, Vol. 79, No. 807 (2013b), pp. 4141-4152 (in Japanese).
Sasao, H., A guide to acoustic analysis by Excel - Analysis of an acoustic structural characteristic - (2) Analysis of the
sound absorbing gstructure by Excel, Journal of the Society of Heating, Air-Conditioning and Sanitary Engineers
of Japan, Vol. 80, No. 10 (2006), pp. 919-927 (in Japanese).
Stinson, R. M. and Champou, Y., Propagation of sound and the assignment of shape factors in model porous materials having
simple pore geometries, Journal of the Acoustical Society of America, Vol. 91, No. 2 (1992), pp. 685-695.
Suyama, E. and Hirata M., Attenuation constant of plane wave in a tube : Acoustic characteristic analysis of silencing
systems based on assuming of plane wave propagation with frictional dissipation part 1, Journal of Acoustical Society of
Japan, Vol. 35, No. 4 (1979), pp. 152-164 (in Japanese).
Suzuki, M., Yanagimoto, K., Watanabe, S., Suzuki, D. and Sakamoto, S., Study of active noise control at opening with louver
and slit, Proceedings of the Japan society of Mechanical Engineers, No. 10-8 (2010), Paper No. 755 (in Japanese).
Tijdeman, H., On the propagation of sound waves in cylindrical tubes, Journal of Sound and Vibration, Vol. 39, No. 1 (1975),
pp. 1-33.
Wesley, L. N., Acoustic streaming near a boundary, Journal of the Acoustical Society of America. Vol. 30, No. 4 (1958),
pp. 329-339.
Yamaguchi, G., Tanabe, Y., Wada, N., Kinoshita, K. and Takano, Y., Insertion loss analysis of noise absorption louver,
Proceedings of the Japan society of Mechanical Engineers, No.10-15 (2010), pp. 62-65 (in Japanese).
Beltman, M. W., van der Hoogt, M. J. P., Spiering, J. E. M. R. and Tijdeman, H., Implementation and experimental validation
of new viscothermal acoustic finite element for acousto-elastic problems, Journal of Sound and Vibration, Vol. 216, No.
1 (1998), pp. 159-185.