Embed Size (px)
Citation preview
Thematic Strategy on Thematic Strategy on Air PollutionAir Pollution
CAFE team, DG EnvironmentCAFE team, DG Environment
and streamlined air quality legislation
Thematic Strategy is a Thematic Strategy is a response to 6response to 6thth EAP EAP
• 66thth EAP- Decision of Council & EP of July 2002: EAP- Decision of Council & EP of July 2002: • ‘achieving levels of air quality that do not give rise to
significant negative impacts on and risks to human health and the environment’; (Art 7.1. of 6th EAP)
• Integrated approach; consistency with other environmental policies; exploit synergies;
• Better RegulationBetter Regulation
• supported by thorough impact assessment;
• new legislative proposal to streamline air quality legislation
Objective of Clean Air for Objective of Clean Air for Europe (CAFE) ProgrammeEurope (CAFE) Programme
Established in 2001 to provide the technical input for the Established in 2001 to provide the technical input for the Thematic Strategy on air pollutionThematic Strategy on air pollution
Best available science & transparencyBest available science & transparency Benchmark current and future air pollution with regard to Benchmark current and future air pollution with regard to
significantsignificant impacts impacts Define interim objectives up to 2020 – based on analysis of Define interim objectives up to 2020 – based on analysis of
closing the gap between business as usual and Maximum closing the gap between business as usual and Maximum Technical Feasible improvementTechnical Feasible improvement
Inform the review of air quality legislationInform the review of air quality legislation Starting point in 2000Starting point in 2000
≈ 350,000 premature deaths attributable to PM Average statistical life expectancy shortened by roughly 9 months,
in some MSs: 1 to 2 years.
How were these interim How were these interim objectives defined?objectives defined?
Peer-reviewed health (WHO) and scientific advicePeer-reviewed health (WHO) and scientific advice Assessment of the effect of current policiesAssessment of the effect of current policies Peer-reviewed integrated assessment to develop cost-effective Peer-reviewed integrated assessment to develop cost-effective
solutions for both health and environmentsolutions for both health and environment Peer-reviewed Cost-Benefit AnalysisPeer-reviewed Cost-Benefit Analysis Macro-economic analysisMacro-economic analysis
Lisbon Strategy & Competitiveness Stakeholder involvement and consultation Stakeholder involvement and consultation
Over 100 stakeholder meetings and over 10.000 responses to internet based consultation
Accompanied by comprehensive impact assessment Accompanied by comprehensive impact assessment (170+ pages)(170+ pages)
Impacts addressed by the Impacts addressed by the Strategy (1)Strategy (1)
Health: Fine Particles (PMHealth: Fine Particles (PM2.52.5) & Ozone) & Ozone Range of problems from minor respiratory
effects to premature death; also cardiovascular effects.
No known thresholds for effects Acid rain (SOAcid rain (SO22, NOx, NH, NOx, NH33))
Affects freshwaters and terrestrial ecosystems leads to loss of flora & fauna; reduced growth of
forests, leaching of toxic metals into soil solution
Impacts addressed by the Impacts addressed by the Strategy (2)Strategy (2)
Eutrophication (NOx, NHEutrophication (NOx, NH33)) Excess nutrient nitrogen causes species composition
change & loss of biodiversity Also causes nutrient imbalances in plants/trees -
increases susceptibility to other stresses such as drought Ozone (non-health)Ozone (non-health)
Damages trees and plants including agricultural crops Damages buildings/materials
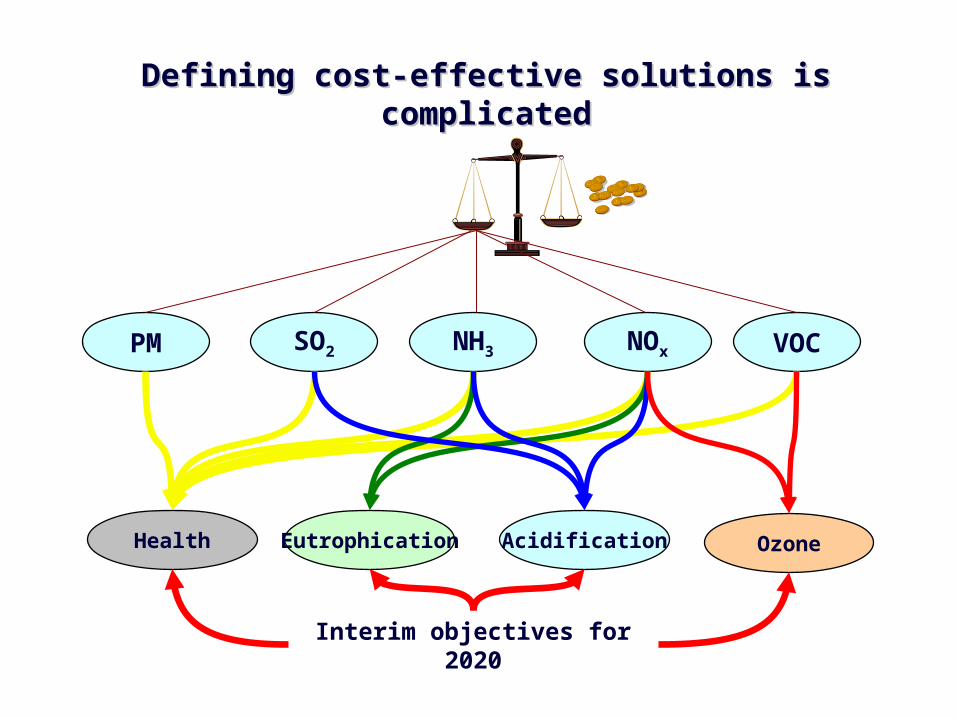
Defining cost-effective solutions is complicatedDefining cost-effective solutions is complicated
SO2 NOx VOCNH3PM
Health AcidificationEutrophication Ozone
Interim objectives for 2020
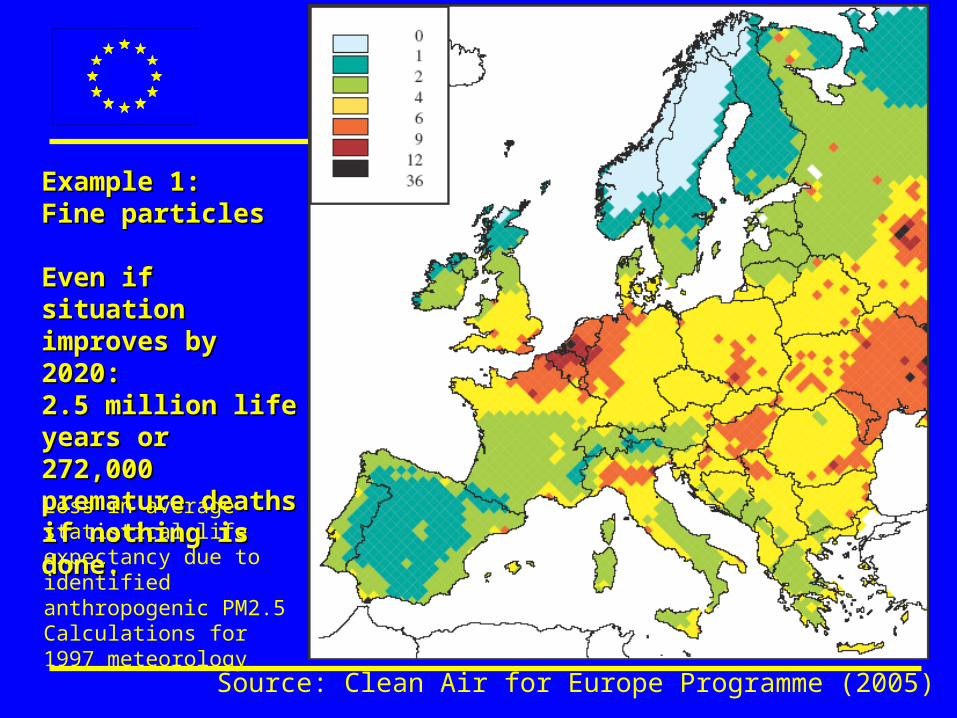
Example 1: Example 1: Fine particlesFine particles
Even if situation Even if situation improves by 2020:improves by 2020:2.5 million life years 2.5 million life years or or 272,000 premature 272,000 premature deathsdeathsif nothing is done. if nothing is done.
Source: Clean Air for Europe Programme (2005)
Loss in average statistical life expectancy due to identified anthropogenic PM2.5Calculations for 1997 meteorology
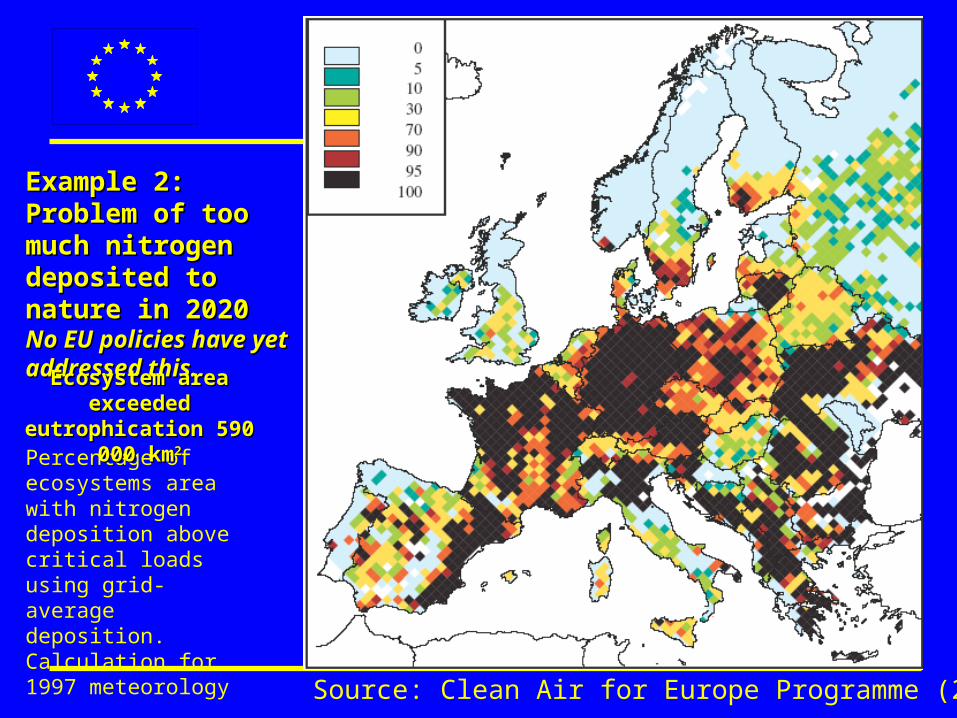
Example 2:Example 2:Problem of too much Problem of too much nitrogen deposited nitrogen deposited to nature in 2020to nature in 2020No EU policies have No EU policies have yet addressed this.yet addressed this.
Source: Clean Air for Europe Programme (2005)
Percentage of ecosystems area with nitrogen deposition above critical loads using grid-average deposition. Calculation for 1997 meteorology
Ecosystem area Ecosystem area exceeded eutrophication exceeded eutrophication
590 000 km590 000 km22
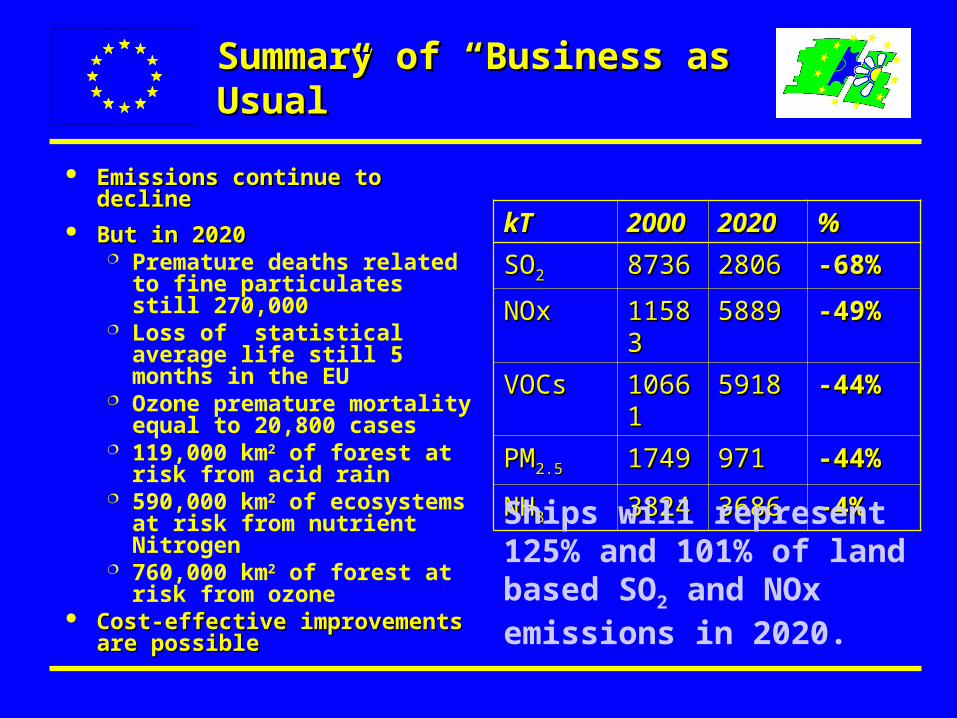
Summary of “Business as Summary of “Business as Usual”Usual”
Emissions continue to decline Emissions continue to decline But in 2020But in 2020
Premature deaths related to fine particulates still 270,000
Loss of statistical average life still 5 months in the EU
Ozone premature mortality equal to 20,800 cases
119,000 km2 of forest at risk from acid rain
590,000 km2 of ecosystems at risk from nutrient Nitrogen
760,000 km2 of forest at risk from ozone
Cost-effective improvements are Cost-effective improvements are possiblepossible
kTkT 20002000 20202020 %%
SOSO22 87368736 28062806 -68%-68%
NOxNOx 1158311583 58895889 -49%-49%
VOCsVOCs 1066110661 59185918 -44%-44%
PMPM2.52.5 17491749 971971 -44%-44%
NHNH33 38243824 36863686 -4%-4%
Ships will represent 125% and 101% of land based SO2 and NOx emissions in 2020.

The StrategyThe Strategy
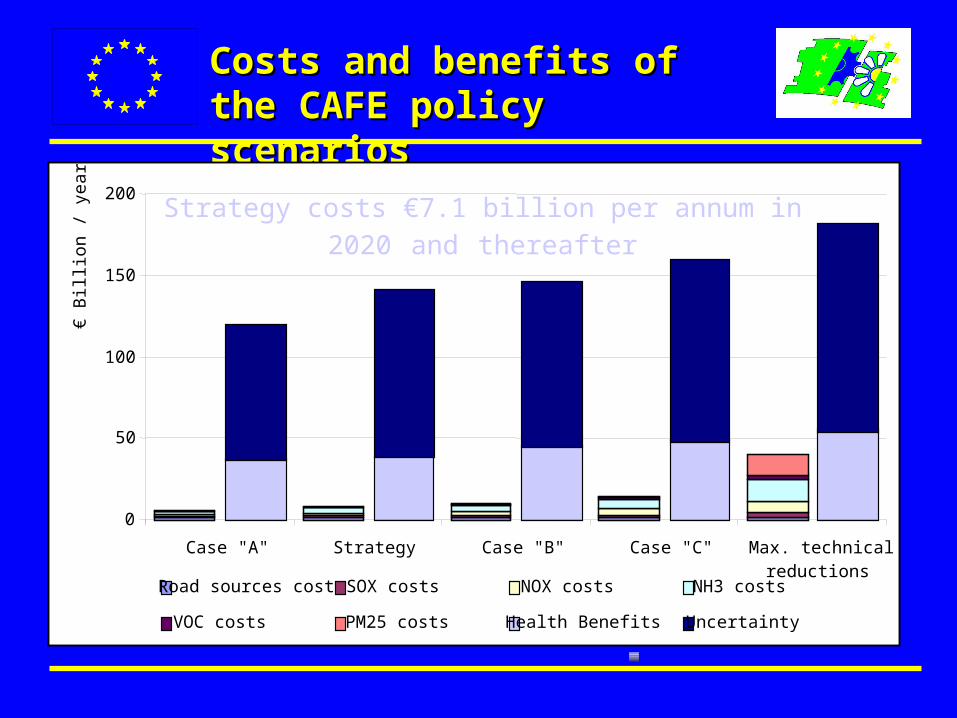
Costs and benefits of the Costs and benefits of the CAFE policy scenariosCAFE policy scenarios
0
50
100
150
200
Case "A" Strategy Case "B" Case "C" Max. technicalreductions
€ B
illio
n / y
ear
Road sources costs SOX costs NOX costs NH3 costs
VOC costs PM25 costs Health Benefits Uncertainty
Strategy costs €7.1 billion per annum in 2020 and thereafter
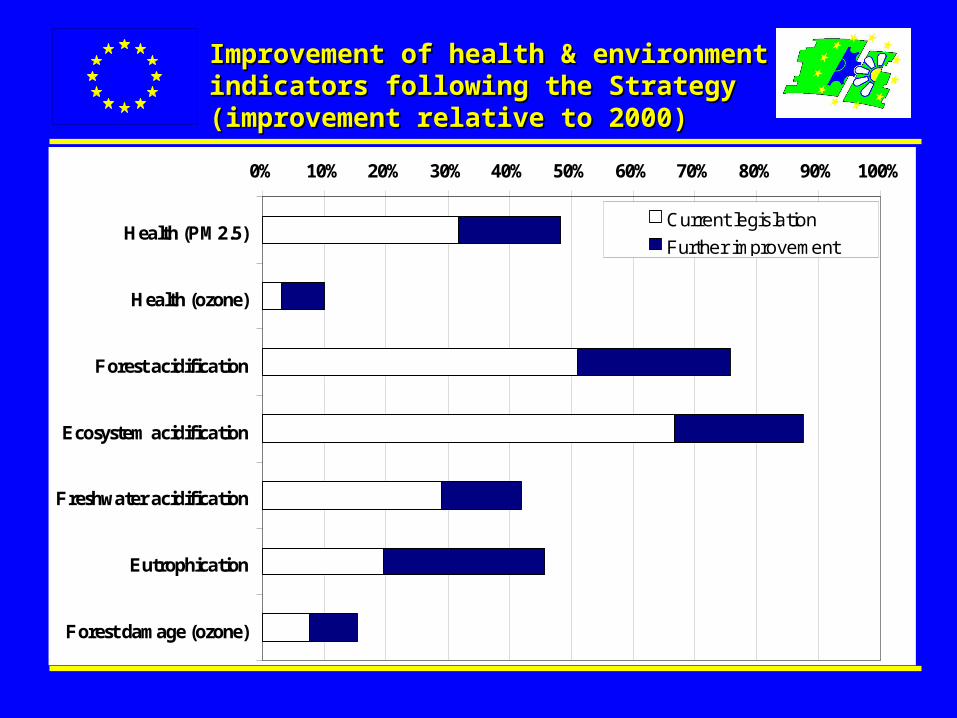
Improvement of health & environment Improvement of health & environment indicators following the Strategy indicators following the Strategy (improvement relative to 2000)(improvement relative to 2000)
0% 10% 20% 30% 40% 50% 60% 70% 80% 90% 100%
Health (PM2.5)
Health (ozone)
Forest acidification
Ecosystem acidification
Freshwater acidification
Eutrophication
Forest damage (ozone)
Current legislation
Further improvement

Summary of Strategy – Summary of Strategy – Costs & BenefitsCosts & Benefits
Ambition level
BenefitsCosts
per annum (€bn)Human health Natural environment
Life Years Lost
(million)PM2.5
Premature deaths (000s)
PM2.5 and
ozone
Range in monetised
health benefits
per annum(€bn)
Ecosystem area exceeded acidification (000 km2)
Ecosystem area
exceeded eutro-
phication (000 km2)
Forest area exceeded
ozone(000 km2)Forests
Semi-natural
Fresh-water
2000 3.62 370 - 243 24 31 733 827 -
Baseline 2020
2.47 293 - 119 8 22 590 764 -
Strategy 1.91 230 42 – 135 63 3 19 416 699 7.1
MTFR 1.72 208 56 – 181 36 1 11 193 381 39.7
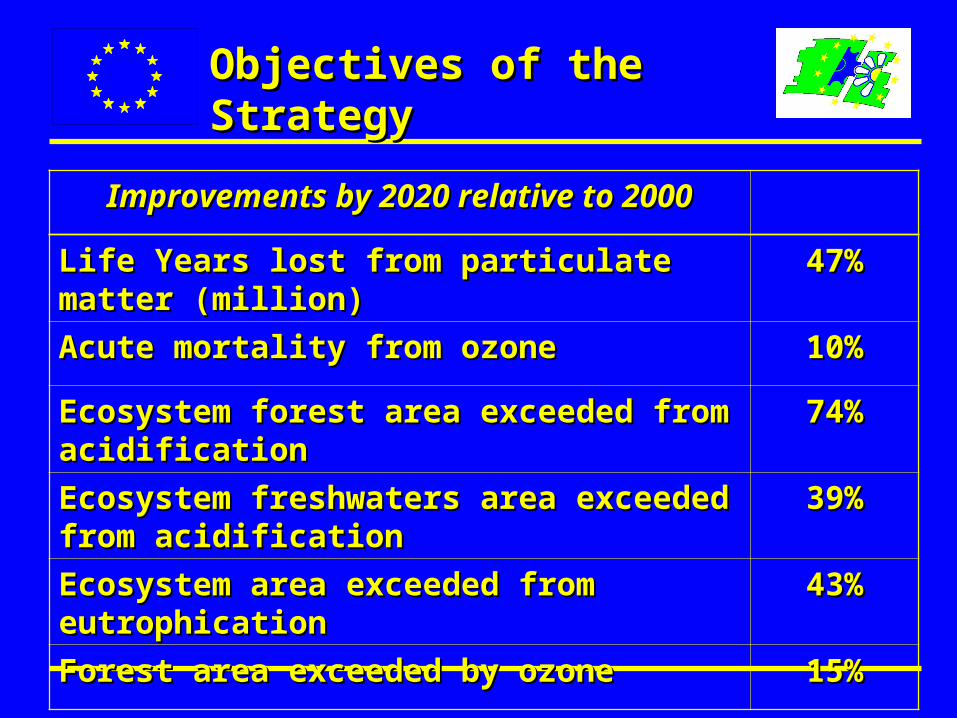
Objectives of the StrategyObjectives of the Strategy
Improvements by 2020 relative to 2000Improvements by 2020 relative to 2000
Life Years lost from particulate matter (million)Life Years lost from particulate matter (million) 47%47%
Acute mortality from ozoneAcute mortality from ozone 10%10%
Ecosystem forest area exceeded from acidificationEcosystem forest area exceeded from acidification 74%74%
Ecosystem freshwaters area exceeded from Ecosystem freshwaters area exceeded from acidificationacidification
39%39%
Ecosystem area exceeded from eutrophicationEcosystem area exceeded from eutrophication 43%43%
Forest area exceeded by ozoneForest area exceeded by ozone 15%15%
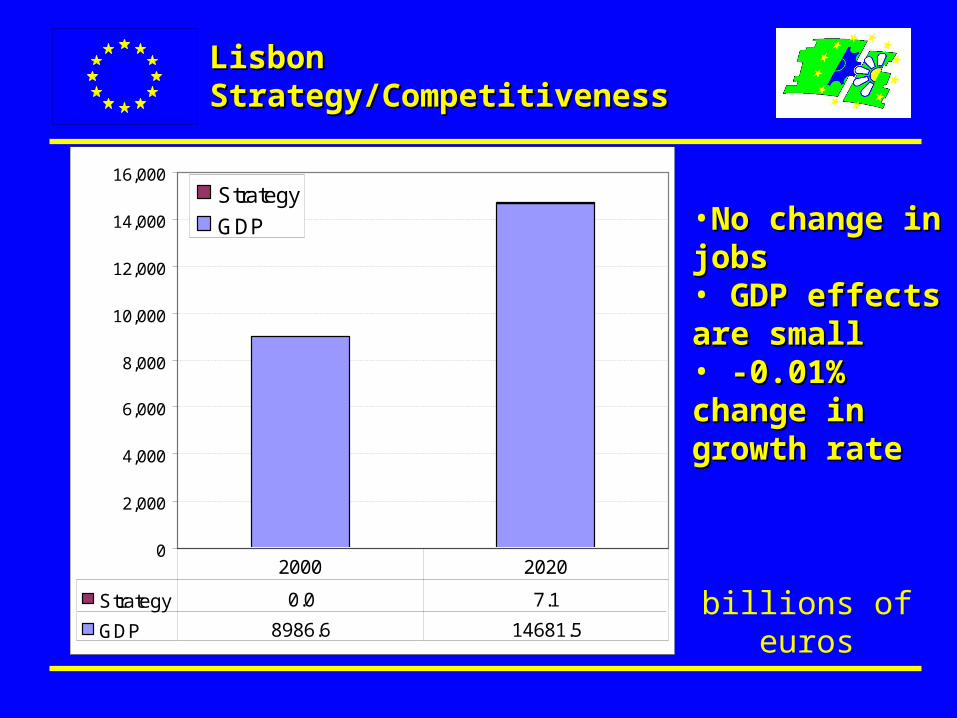
Lisbon Strategy/Competitiveness Lisbon Strategy/Competitiveness
•No change in jobsNo change in jobs• GDP effects are GDP effects are smallsmall • -0.01% change in -0.01% change in growth rategrowth rate
0
2,000
4,000
6,000
8,000
10,000
12,000
14,000
16,000Strategy
GDP
Strategy 0.0 7.1
GDP 8986.6 14681.5
2000 2020
billions of euros
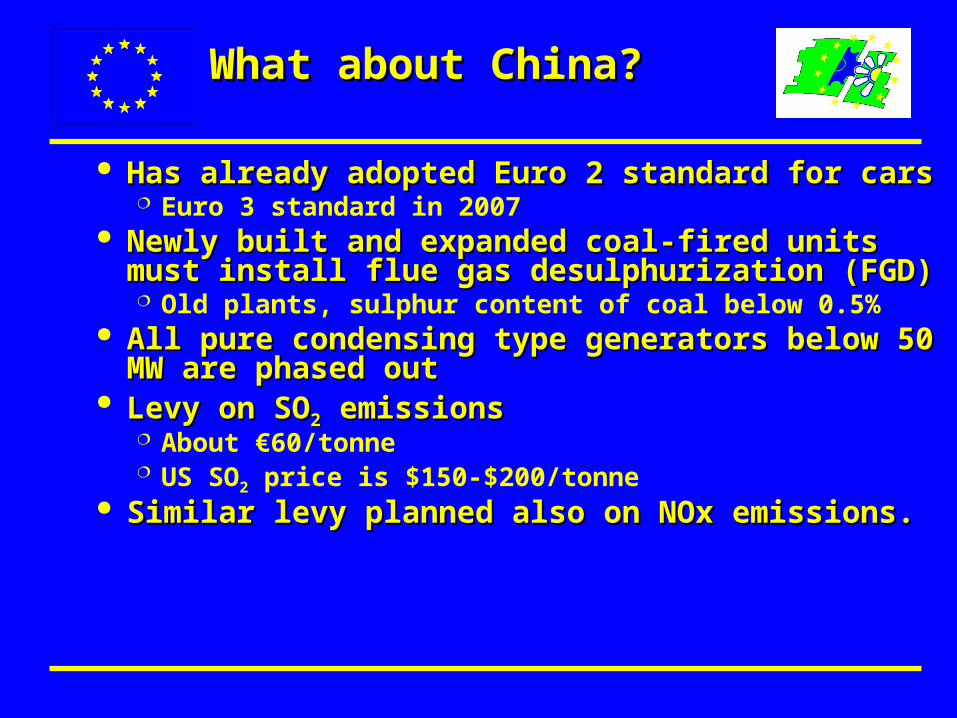
What about China?What about China?
Has already adopted Euro 2 standard for cars Has already adopted Euro 2 standard for cars Euro 3 standard in 2007
Newly built and expanded coal-fired units must Newly built and expanded coal-fired units must install flue gas desulphurization (FGD) install flue gas desulphurization (FGD) Old plants, sulphur content of coal below 0.5%
All pure condensing type generators below 50 MW All pure condensing type generators below 50 MW are phased outare phased out
Levy on SOLevy on SO22 emissions emissions About €60/tonne US SO2 price is $150-$200/tonne
Similar levy planned also on NOx emissions. Similar levy planned also on NOx emissions.
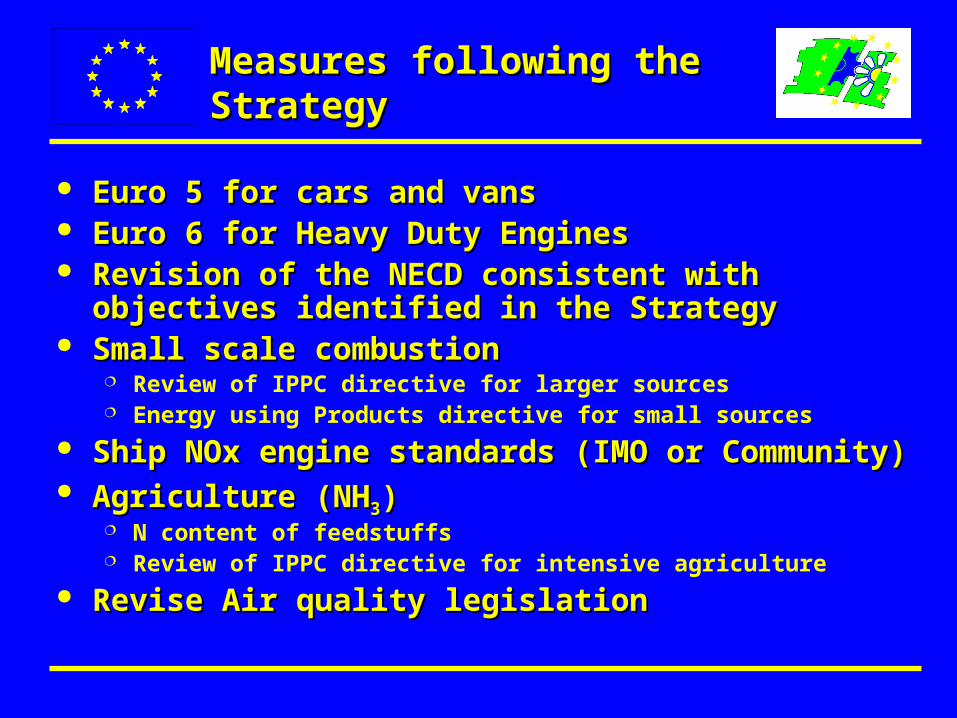
Measures following the Measures following the StrategyStrategy
Euro 5 for cars and vansEuro 5 for cars and vans Euro 6 for Heavy Duty EnginesEuro 6 for Heavy Duty Engines Revision of the NECD consistent with objectives identified Revision of the NECD consistent with objectives identified
in the Strategyin the Strategy Small scale combustionSmall scale combustion
Review of IPPC directive for larger sources Energy using Products directive for small sources
Ship NOx engine standards (IMO or Community)Ship NOx engine standards (IMO or Community) Agriculture (NHAgriculture (NH33))
N content of feedstuffs Review of IPPC directive for intensive agriculture
Revise Air quality legislationRevise Air quality legislation
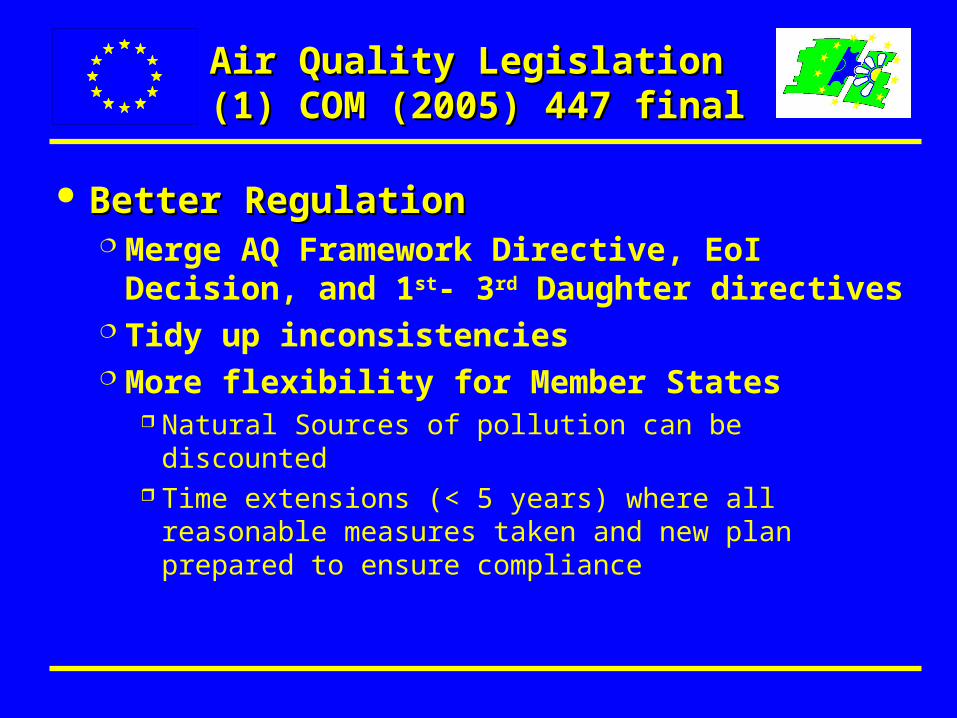
Air Quality Legislation (1) Air Quality Legislation (1) COM (2005) 447 finalCOM (2005) 447 final
Better RegulationBetter Regulation Merge AQ Framework Directive, EoI Decision,
and 1st- 3rd Daughter directives Tidy up inconsistencies More flexibility for Member States
Natural Sources of pollution can be discounted Time extensions (< 5 years) where all reasonable
measures taken and new plan prepared to ensure compliance
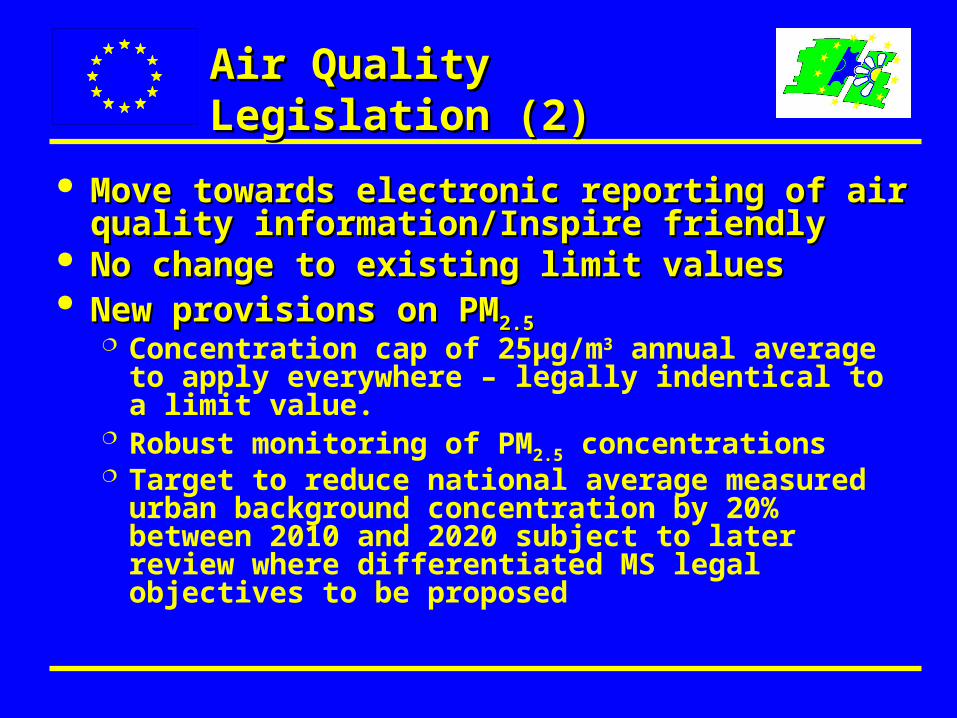
Air Quality Legislation (2)Air Quality Legislation (2)
Move towards electronic reporting of air quality Move towards electronic reporting of air quality information/Inspire friendlyinformation/Inspire friendly
No change to existing limit valuesNo change to existing limit values New provisions on PMNew provisions on PM2.52.5
Concentration cap of 25µg/m3 annual average to apply everywhere – legally indentical to a limit value.
Robust monitoring of PM2.5 concentrations Target to reduce national average measured urban
background concentration by 20% between 2010 and 2020 subject to later review where differentiated MS legal objectives to be proposed
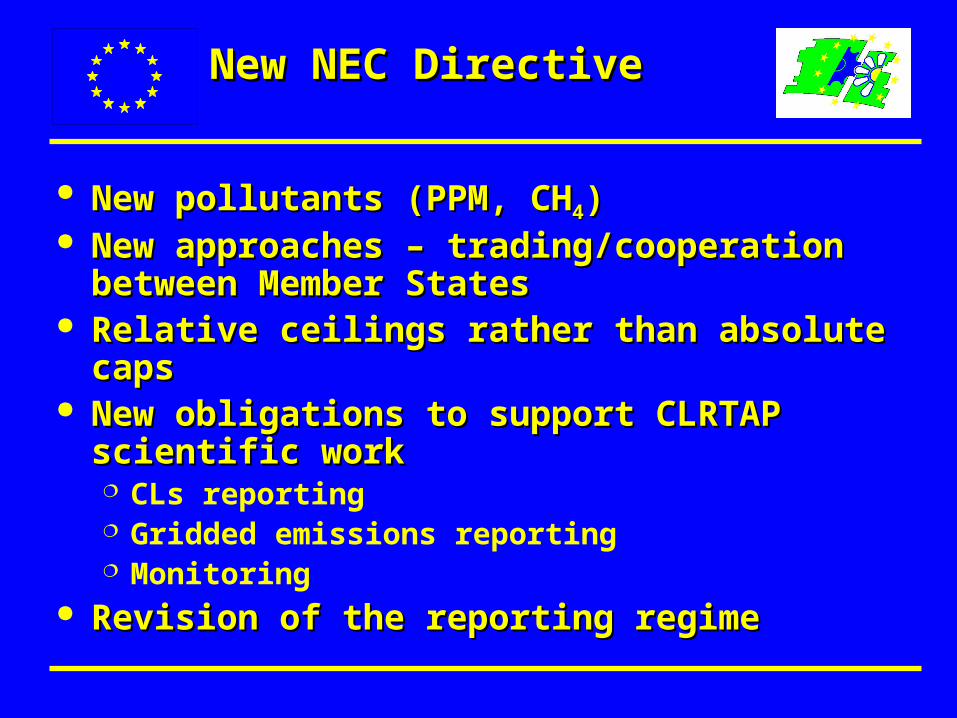
New NEC DirectiveNew NEC Directive
New pollutants (PPM, CHNew pollutants (PPM, CH44)) New approaches – trading/cooperation between New approaches – trading/cooperation between
Member StatesMember States Relative ceilings rather than absolute capsRelative ceilings rather than absolute caps New obligations to support CLRTAP scientific New obligations to support CLRTAP scientific
workwork CLs reporting Gridded emissions reporting Monitoring
Revision of the reporting regimeRevision of the reporting regime
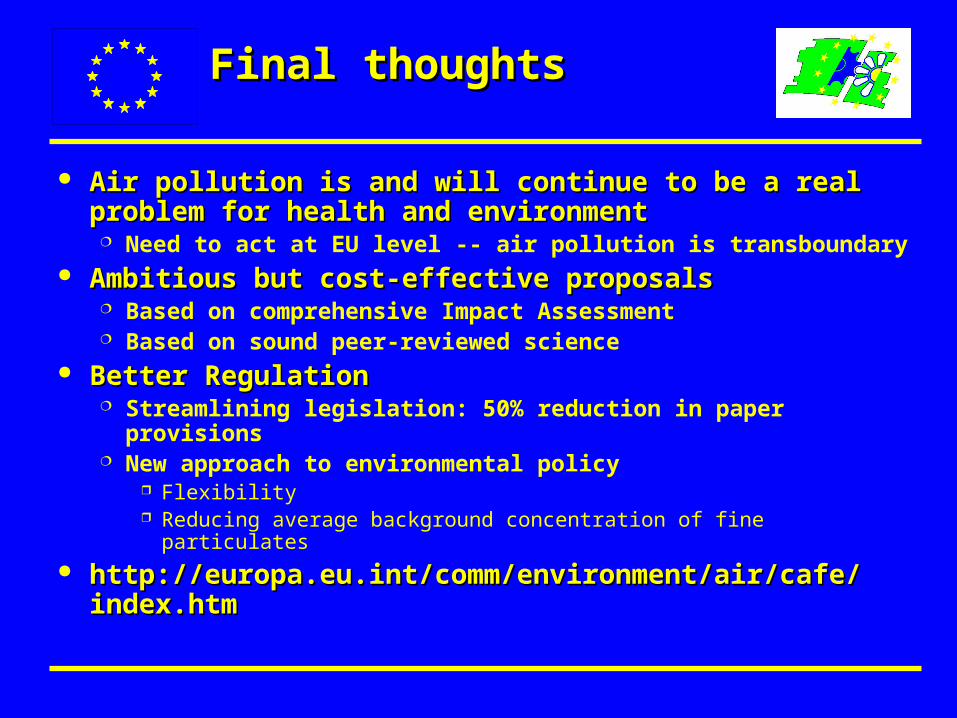
Final thoughtsFinal thoughts
Air pollution is and will continue to be a real problem for Air pollution is and will continue to be a real problem for health and environmenthealth and environment Need to act at EU level -- air pollution is transboundary
Ambitious but cost-effective proposalsAmbitious but cost-effective proposals Based on comprehensive Impact Assessment Based on sound peer-reviewed science
Better RegulationBetter Regulation Streamlining legislation: 50% reduction in paper provisions New approach to environmental policy
Flexibility Reducing average background concentration of fine particulates
http://europa.eu.int/comm/environment/air/cafe/index.htmhttp://europa.eu.int/comm/environment/air/cafe/index.htm