Embed Size (px)
Citation preview
R A M Ó N B U E N OC O R N E L I A H E R Z F E L DE L I Z A B E T H A . S T A N T O NF R A N K A C K E R M A N
Tufts University
May 2008
T H E C O S T S O F I N A C T I O N
THE CARIBBEAN ANDCLIMATE CHANGE

20
10
60708090
Tropic of Cancer Tropic of Cancer
RRííoo
MMaagg
ddaalleenn
aa
N o r t h
A t l a n t i c
O c e a n
Lago de
Golfo deVenezuela
Maracaibo
Orinoco
Canal
Mona
AnegadaPassage
Passage
N o r t h
P a c i f i c
C a r i b b e a n S e a
G u l f o f M e x i c o
Panama
Lago deNicaragua
Stra i ts o fF lo
rida
de
eche
O c e a n
YucatanChannel
WindwardPassage
Río
C O L O M B I A
BRAZIL
GUYANA
HONDURAS
GUATEMALA
MEXICO
JAMAICA
DOMINICANREPUBLIC
UNITEDSTATES
CUBA
(COSTA RICA)
(NETH.)Aruba
(NETH.)Netherlands Antilles
TOBAGOTRINIDAD AND
GRENADA
THE GRENADINESST. VINCENT AND
(FRANCE)
DOMINICA(VENEZUELA)
(FRANCE)
(U.S.)
(U.K.)
(NETH.)(U.S.)
(U.K.)
BARBADOS
Martinique
Guadeloupe
ST. KITTS AND NEVIS
ANTIGUA AND BARBUDA
Anguilla
Puerto Rico
Virgin Is.
BritishVirgin Is.
(U.S.)Island
Navassa
U.S. Naval BaseGuantanamo Bay
THE BAHAMAS
H A I T I
V E N E Z U E L A
Cayman Islands
(U.K.)Montserrat
(Guad. and Neth. Antilles)(Guad.)Neth.
Antilles
(THE BAHAMAS)
(THE BAHAMAS)
(THE BAHAMAS)
(THE BAHAMAS)
NICARAGUAEL SALVADOR
COSTA RICA
PANAMA
(COLOMBIA)
(COLOMBIA)
(U.K.)
(HONDURAS)
BELIZE
Turks andCaicos Islands
(U.K.)
ST. LUCIA
Tampa
Freeport
Miami
Campeche
mosa
z
Boa Vista
GuatemalaCastries
Bridgetown
Georgetown
C ad delmen
nango
St. Petersburg
Flores
PuertoBarrios
Puerto
San Fernando
Arauca
Ayacucho
Pereira
Ibagué
BuenaventuraCali
Bogotá
SantaAna
SalvadorSan
Mérida
Basseterre St. John's
Plymouth
Roseau
Kingstown
Basse-Terre
Fort-de-France
St. Croix
MatanzasSanta Clara
Cienfuegos
Camagüey
Guantánamo
Santiago
Montego Bay
Belize City
La Ceiba
Puerto Lempira
PuertoCabezasCholuteca
Matagalpa
León
BluefieldsGranada
Barranquilla MartaSanta
Cartagena Maracaibo Cumaná
ValenciaBarquisimeto MaracayPuntarenas
Bocasdel Toro Colón
Golfito MonteriaBalboaDavidMérida
Ciudad Guayana
CúcutaSantiago
San Cristóbal
Bucaramanga
Santiagode Cuba
Nassau
Havana
GrandTurk
San JuanSantoDomingo
Belmopan
Tegucigalpa
OranjestadManagua St. George's
Willemstad
Caracas
José
Panama
Port-of-Spain
PuertoLimón
Port-au-Prince
Kingston
George Town
Chetumal
San PedroSula
SanMiguel
Medellín
CabelloPuerto
BarcelonaMaturín
Pinar del Río
Holguín
Nuevitas
Manzanillo
Cap-Haïtien
Cancún
Key West
Les Cayes
San
La Palma
Ciudad Bolívar
Isla del Coco
Rum Cay
San Salvador
Samana Cay
Mayaguana
Great Inagua
AcklinsCay Lobos
Island
Isla de la
Providencia
Isla de San Andrés
Isla de la
SWAN ISLANDS
Cay SalBank
Long Island
Crooked IslandGuinchos Cay
RAGGED
RANGE
Juventud
Trinidad
Marie-Galante
St. MartinSt. Barthelemy
Tobago
IslaMona
ISLAS DELA BAHIÁ
TortugaIsla la
Isla deMargarita
GrandBahama
New
GreatAbaco
Providence Eleuthera
BIMINIISLANDS
IslandCat Island
Exuma
ISLAND
Andros
Great
CozumelIsla
CuraçaoBonaire
Isla Aves
ISLASDEL MAIZ
Lambert Conformal Conic Projection,standard parallels 9˚N and 17˚N
100 200
0 100
B ndary representation is not necessarily authoritative.
Scale 1:12,500,000
300 Kilometers
200 300 Miles
CayosMiskitos
CORDIL
LERA
ORIE
NTAL
Middle
America
Trench
C a y m a n T r e n c h
Trench
RicoPuerto
MADRE
Mos
quito
Coa
st
(deepest point of the
Milwaukee Deep
Atlantic Ocean, -8605 m)
+
Av
es
Rid
ge
Beata
Ridge
Ca m
p e c h e B a n k
A
N
D
S
E
G U I A N A H I G H L A N D S
Gr
ea
tB
ah
am
a
B a n k
Peru
-C
hile
Tre
nch

THE CARIBBEAN ANDCLIMATE CHANGE
TH E COS T S O F I N AC T I ON
RAMÓN BUENOCORNE L I A H ERZ F E LDE L I Z ABE TH A . S TAN TONFRANK ACKERMAN
Stockholm Environment Institute—US CenterGlobal Development and Environment Institute, Tufts University
May 2008
The full report is available online athttp://www.sei-us.org/climate-and-energy/Caribbean_Inaction_Cost.htmhttp://www.gdae.org/CaribbeanClimate.html
2
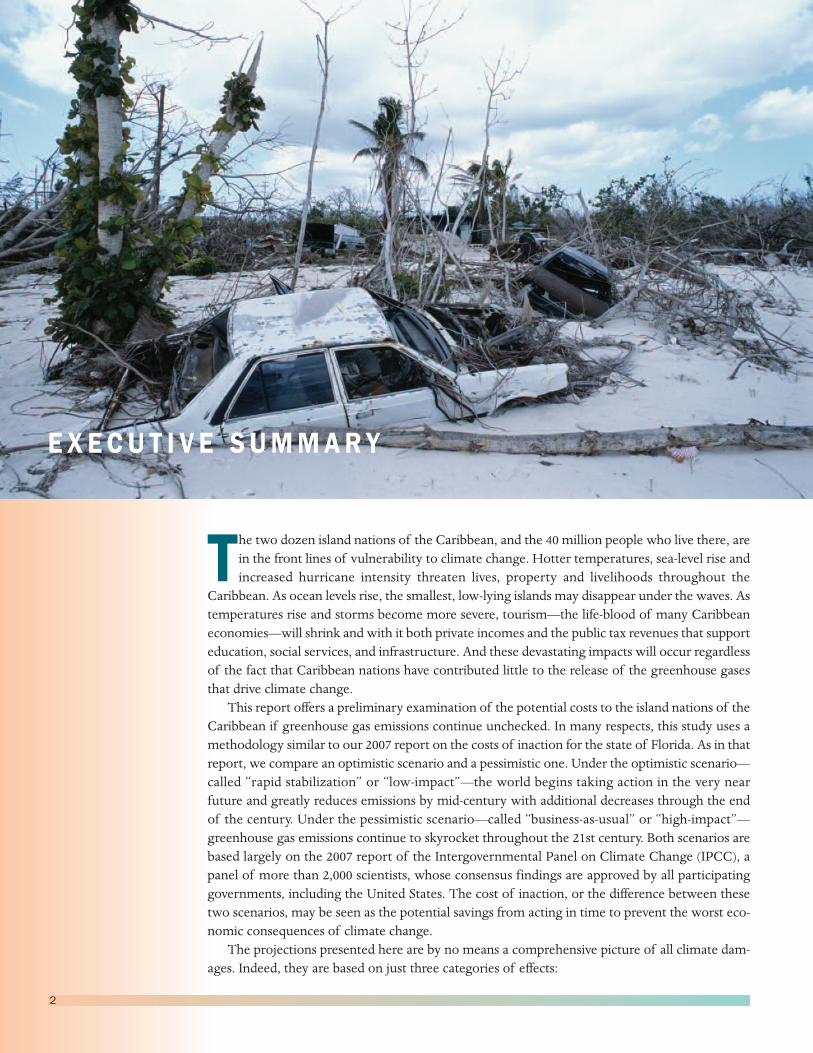
The two dozen island nations of the Caribbean, and the 40 million people who live there, arein the front lines of vulnerability to climate change. Hotter temperatures, sea-level rise andincreased hurricane intensity threaten lives, property and livelihoods throughout the
Caribbean. As ocean levels rise, the smallest, low-lying islands may disappear under the waves. Astemperatures rise and storms become more severe, tourism—the life-blood of many Caribbeaneconomies—will shrink and with it both private incomes and the public tax revenues that supporteducation, social services, and infrastructure. And these devastating impacts will occur regardlessof the fact that Caribbean nations have contributed little to the release of the greenhouse gasesthat drive climate change.This report offers a preliminary examination of the potential costs to the island nations of the
Caribbean if greenhouse gas emissions continue unchecked. In many respects, this study uses amethodology similar to our 2007 report on the costs of inaction for the state of Florida. As in thatreport, we compare an optimistic scenario and a pessimistic one. Under the optimistic scenario—called “rapid stabilization” or “low-impact”—the world begins taking action in the very nearfuture and greatly reduces emissions by mid-century with additional decreases through the endof the century. Under the pessimistic scenario—called “business-as-usual” or “high-impact”—greenhouse gas emissions continue to skyrocket throughout the 21st century. Both scenarios arebased largely on the 2007 report of the Intergovernmental Panel on Climate Change (IPCC), apanel of more than 2,000 scientists, whose consensus findings are approved by all participatinggovernments, including the United States. The cost of inaction, or the difference between thesetwo scenarios, may be seen as the potential savings from acting in time to prevent the worst eco-nomic consequences of climate change.The projections presented here are by no means a comprehensive picture of all climate dam-
ages. Indeed, they are based on just three categories of effects:
EX ECU T I V E SUMMARY
� Hurricane damages, extrapolated from average annual hurricane damages in the recentpast;
� Tourism losses, assumed to be proportional to the current share of tourism in eacheconomy; and
� Infrastructure damages, due to sea-level rise (exclusive of hurricane damage), which areprojected as a constant cost per affected household.
For just these three categories—increased hurricane damages, loss of tourism revenue, and in-frastructure damages—the Caribbean’s annual cost of inaction is projected to total $22 billion an-nually by 2050 and $46 billion by 2100. These costs represent 10 percent and 22 percent,respectively, of the current Caribbean economy.*
Table ES-1. Caribbean Region—Cost of Inaction(High-Impact minus Low-Impact Scenarios)
Total Caribbean Cost of Inaction ($US Billions)2025 2050 2075 2100
Storms $ 1.1 $ 2.8 $ 4.9 $ 7.9
Tourism 1.6 3.2 4.8 6.4
Infrastructure 8.0 15.9 23.9 31.9
Total $10.7 $21.9 $33.7 $46.2
% Current GDP 5.0% 10.3% 15.9% 21.7%
Sources: Authors’ calculations. Amounts in 2007 dollars; percentages based on 2004 GDP.
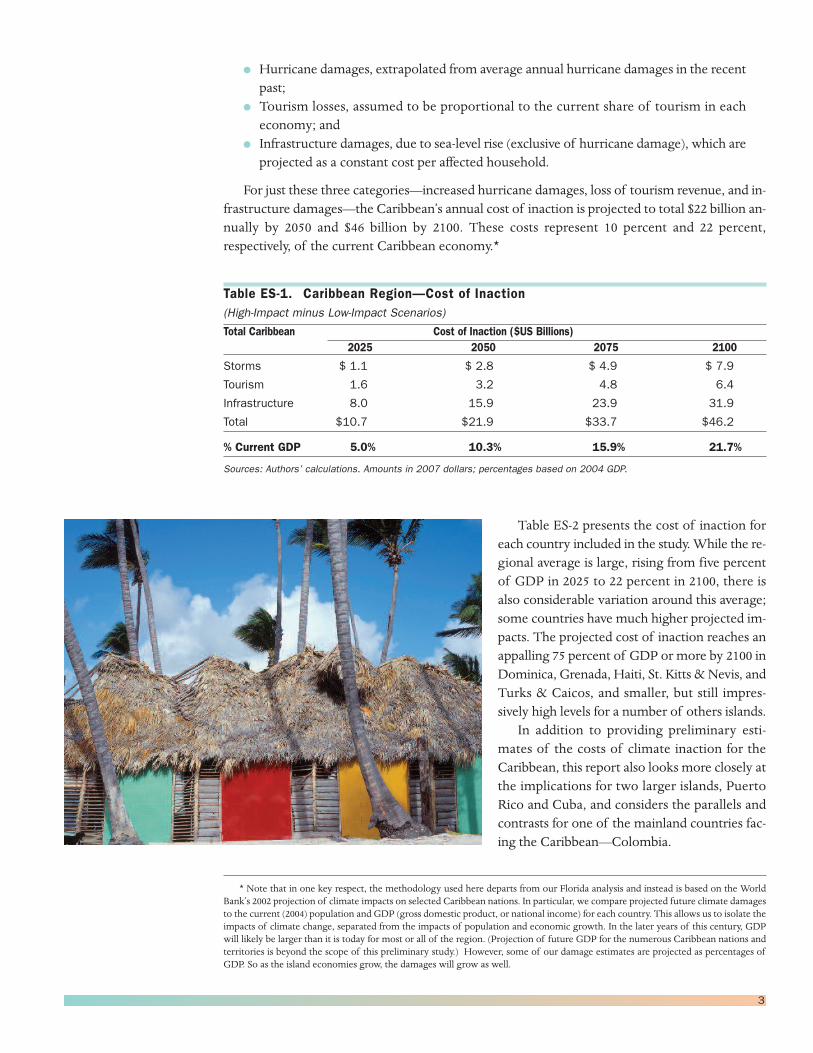
Table ES-2 presents the cost of inaction foreach country included in the study.While the re-gional average is large, rising from five percentof GDP in 2025 to 22 percent in 2100, there isalso considerable variation around this average;some countries have much higher projected im-pacts. The projected cost of inaction reaches anappalling 75 percent of GDP or more by 2100 inDominica, Grenada, Haiti, St. Kitts & Nevis, andTurks & Caicos, and smaller, but still impres-sively high levels for a number of others islands.In addition to providing preliminary esti-
mates of the costs of climate inaction for theCaribbean, this report also looks more closely atthe implications for two larger islands, PuertoRico and Cuba, and considers the parallels andcontrasts for one of the mainland countries fac-ing the Caribbean—Colombia.
3
* Note that in one key respect, the methodology used here departs from our Florida analysis and instead is based on the WorldBank’s 2002 projection of climate impacts on selected Caribbean nations. In particular, we compare projected future climate damagesto the current (2004) population and GDP (gross domestic product, or national income) for each country. This allows us to isolate theimpacts of climate change, separated from the impacts of population and economic growth. In the later years of this century, GDPwill likely be larger than it is today for most or all of the region. (Projection of future GDP for the numerous Caribbean nations andterritories is beyond the scope of this preliminary study.) However, some of our damage estimates are projected as percentages ofGDP. So as the island economies grow, the damages will grow as well.
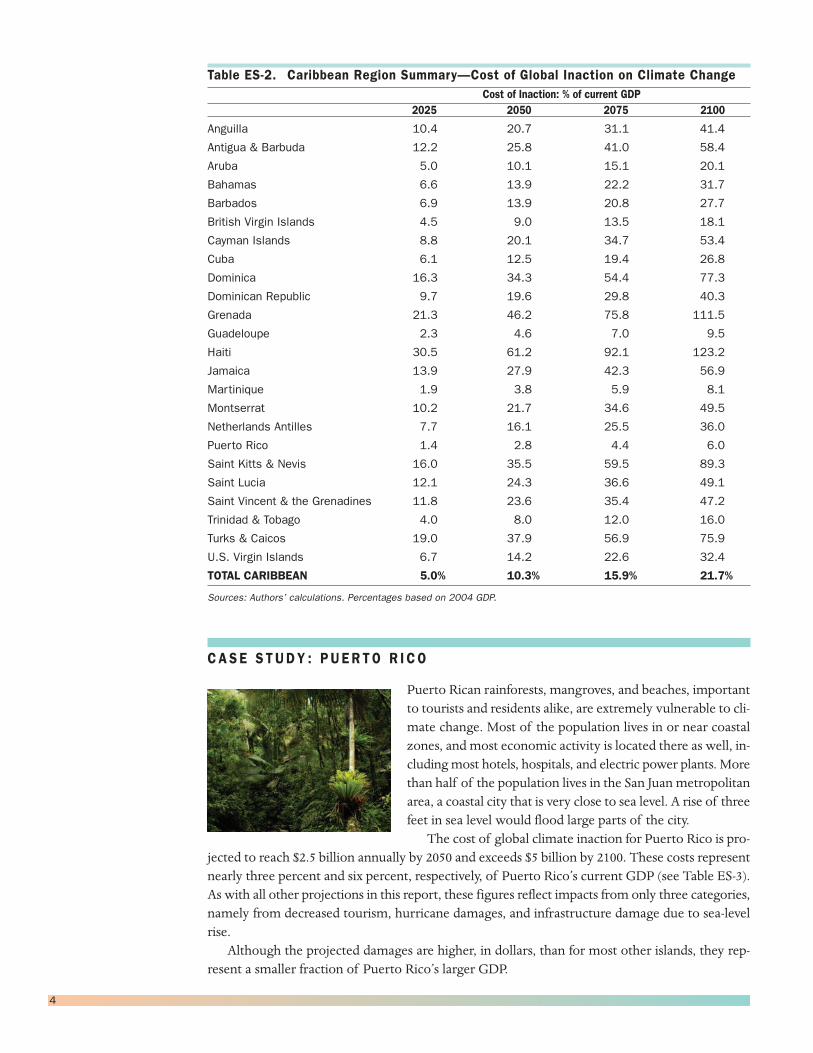
Table ES-2. Caribbean Region Summary—Cost of Global Inaction on Climate ChangeCost of Inaction: % of current GDP
2025 2050 2075 2100
Anguilla 10.4 20.7 31.1 41.4
Antigua & Barbuda 12.2 25.8 41.0 58.4
Aruba 5.0 10.1 15.1 20.1
Bahamas 6.6 13.9 22.2 31.7
Barbados 6.9 13.9 20.8 27.7
British Virgin Islands 4.5 9.0 13.5 18.1
Cayman Islands 8.8 20.1 34.7 53.4
Cuba 6.1 12.5 19.4 26.8
Dominica 16.3 34.3 54.4 77.3
Dominican Republic 9.7 19.6 29.8 40.3
Grenada 21.3 46.2 75.8 111.5
Guadeloupe 2.3 4.6 7.0 9.5
Haiti 30.5 61.2 92.1 123.2
Jamaica 13.9 27.9 42.3 56.9
Martinique 1.9 3.8 5.9 8.1
Montserrat 10.2 21.7 34.6 49.5
Netherlands Antilles 7.7 16.1 25.5 36.0
Puerto Rico 1.4 2.8 4.4 6.0
Saint Kitts & Nevis 16.0 35.5 59.5 89.3
Saint Lucia 12.1 24.3 36.6 49.1
Saint Vincent & the Grenadines 11.8 23.6 35.4 47.2
Trinidad & Tobago 4.0 8.0 12.0 16.0
Turks & Caicos 19.0 37.9 56.9 75.9
U.S. Virgin Islands 6.7 14.2 22.6 32.4
TOTAL CARIBBEAN 5.0% 10.3% 15.9% 21.7%
Sources: Authors’ calculations. Percentages based on 2004 GDP.
CASE S TUDY : PUER TO R I CO
Puerto Rican rainforests, mangroves, and beaches, importantto tourists and residents alike, are extremely vulnerable to cli-mate change. Most of the population lives in or near coastalzones, and most economic activity is located there as well, in-cluding most hotels, hospitals, and electric power plants. Morethan half of the population lives in the San Juan metropolitanarea, a coastal city that is very close to sea level. A rise of threefeet in sea level would flood large parts of the city.The cost of global climate inaction for Puerto Rico is pro-
jected to reach $2.5 billion annually by 2050 and exceeds $5 billion by 2100. These costs representnearly three percent and six percent, respectively, of Puerto Rico’s current GDP (see Table ES-3).As with all other projections in this report, these figures reflect impacts from only three categories,namely from decreased tourism, hurricane damages, and infrastructure damage due to sea-levelrise.Although the projected damages are higher, in dollars, than for most other islands, they rep-
resent a smaller fraction of Puerto Rico’s larger GDP.
4
Table ES-3. Puerto Rico—Cost of Inaction(High-Impact minus Low-Impact Scenarios)
Puerto Rico Cost of Inaction ($US Billions)2025 2050 2075 2100
Storms 0.2 0.4 0.7 1.1
Tourism 0.2 0.5 0.7 1.0
Infrastructure 0.8 1.6 2.4 3.2
Total $1.2 $2.5 $3.8 $5.2
% Current GDP 1.4% 2.8% 4.4% 6.0%
Sources: Authors’ calculations. Amounts in 2007 dollars; percentages based on 2004 GDP.
CASE S TUDY : CUBA
Cuba, the largest island in the Caribbean, faces unique chal-lenges that make it particularly vulnerable to the effects of cli-mate change. Over 10 percent of Cubans live less than a milefrom the shoreline, a lower share than on many smallerCaribbean islands, but a large number of people nonetheless.Cuba has the longest coastline among Caribbean islands, anda land mass big enough to be hit by hurricanes moving alongseveral different storm paths. Its 11 million people have lim-ited income levels and modest living conditions.
The cost of global climate inaction for Cuba is estimated at nearly $5 billion annually by 2050,growing to over $10 billion by 2100, from impacts on tourism, hurricane damage, and infrastruc-ture impacts due to sea-level rise. These losses amount to almost 13 percent and 27 percent, re-spectively, of Cuba’s current GDP (see Table ES-4).
Table ES-4. Cuba—Cost of Inaction(High-Impact minus Low-Impact Scenarios)
Cuba Cost of Inaction ($US Billions)2025 2050 2075 2100
Storms 0.3 0.8 1.4 2.2
Tourism 0.2 0.4 0.6 0.8
Infrastructure 1.8 3.6 5.4 7.3
Total $2.3 $4.8 $7.4 $10.2
% Current GDP 6.1% 12.5% 19.4% 26.8%
Sources: Authors’ calculations. Amounts in 2007 dollars; percentages based on 2004 GDP.
Twenty-two percent of the Caribbean’s total costs of global climate inaction falls on Cuba, re-flecting its status as the region’s largest island. The cost of inaction as a percentage of GDP isslightly above average, although debates over the interpretation of Cuban GDP data make thesepercentages uncertain. Cuba’s projected losses are, however, minimized both by lower-than-average hurricane damages, and by the relatively small size of the tourism industry. As tourismexpands, so too will Cuba’s exposure to climate damages.
5
CASE S TUDY : CO LOMB I A
This report focuses principally on the islands of theCaribbean, but the term “Caribbean” is sometimes used morebroadly to also include the countries of Central America andthe northern coast of South America. While analysis of thecosts of climate inaction for all countries surrounding theCaribbean is beyond the scope of this report, we look brieflyat the impacts on one of the coastal countries, Colombia. Un-like our examination of the Caribbean island nations, how-ever, our discussion of Colombia is solely qualitative and does
not include quantitative projections of economic impacts.Colombia’s Caribbean coastline is over 1,000 miles long and includes several of the country’s
largest cities and much of its economic infrastructure, generating 16 percent of Colombia’s GDP.Agriculture and cattle ranching are important economic activities of the region. Tourism is alsoimportant all along the coast, especially in the colonial city of Cartagena and the Caribbean is-lands of San Andrés and Providencia, although tourism’s contribution to GDP is only 2.3 percent.Colombian studies examining the consequences of a one meter (39 inches) sea-level rise over
the next 100 years conclude that in addition to the erosion of beaches, marshes, and mangroves,there could be permanent flooding of 1,900 square miles in low-lying coastal areas, affecting 1.4million people, 85 percent of them in urban areas. For the Caribbean coastal area, about five per-cent of crop and pasture land would be exposed to various degrees of flooding; nearly half of thatarea is classified as highly vulnerable. At the same time, the intensification of droughts, desertifi-cation, and soil degradation could nearly double the size of Colombia’s northeastern desert. An-other anticipated consequence of climate change is the total loss of glacial ice within 100 years,with perhaps three-fourths lost by 2050. The retreat and disappearance of glaciers will affect wateravailability, hydropower generation and ecosystems.Colombia faces some of the same consequences as Caribbean islands from sea-level rise and
warming, as well as a unique set of challenges from impacts like the ecological and economic con-sequences of melting glaciers at high altitudes. Given Colombia’s economic, social and politicalchallenges, adaptation measures to lessen the impacts of climate change may be difficult to afford.The bottom line remains the same in Colombia as in the Caribbean islands: equitable and sus-
tainable development will face new challenges, as sorely needed resources will be diverted to meetthe rising costs of global inaction, in countries that make only the smallest contributions to theemissions that cause climate change.
ACKNOWLEDGMENTS
We would like to thank Marisa Escobar from the Stockholm Environment Institute for her assis-tance. Thanks also to Karen Florini at Environmental Defense Fund for proposing and support-ing the project, and to Jane Tenenbaum and Clare Kazanski for the design and production of thefinal report.This study was supported by a grant from Environmental Defense Fund. The opinions and
conclusions, as well as any errors, are solely the responsibility of the authors.
6
CONTENTS
7
Executive Summary 2
Acknowledgments 6
Introduction: The Caribbean’s Vulnerability to Climate Change 8
Methodology 11
Results: Projected Costs of Inaction in the Caribbean 13Climate Impacts on Puerto Rico 16Climate Impacts on Cuba 18Climate Impacts on Colombia 20
Appendix I: Model Results—Island Detail 24
Appendix II: Technical Notes on the Model 28
Bibliography 31Notes 33Photo Credits 35
List of Tables
Table ES-1. Caribbean Region—Cost of Inaction 3Table ES-2. Caribbean Region Summary—Cost of Global Inaction on Climate Change 4Table ES-3. Puerto Rico—Cost of Inaction 5Table ES-4. Cuba—Cost of Inaction 5Table 1. Caribbean Region—Cost of Inaction 13Table 2. Caribbean Region—Low- and High-Impact Scenarios 14Table 3. Caribbean Region Summary—Cost of Global Inaction on Climate Change 15Table 4. Puerto Rico—Cost of Inaction 17Table 5. Puerto Rico—Low- and High-Impact Scenarios 18Table 6. Cuba—Cost of Inaction 19Table 7. Cuba—Low- and High-Impact Scenarios 20Table I-1a. Caribbean Region—Low-Impact Scenario—Island Detail—2025, 2050 24Table I-1b. Caribbean Region—Low-Impact Scenario—Island Detail—2075, 2100 25Table I-2a. Caribbean Region—High-Impact Scenario—Island Detail—2025, 2050 26Table I-2b. Caribbean Region—High-Impact Scenario—Island Detail—2075, 2100 27Table II-1. Two Future Climate Scenarios for the Caribbean Region 28Table II-2. Hurricane Damages—Sea-Level Rise Factor 29Table II-3. Hurricane Damages—Storm Intensity Factor 29Table II-4. Hurricane Damages—Climate Change Adjustment Factor 29Table II-5. Reduced Tourism—Detail Factors 30Table II-6. Reduced Tourism—Net Factor 30Table II-7. Infrastructure Damages—Affected Population 30
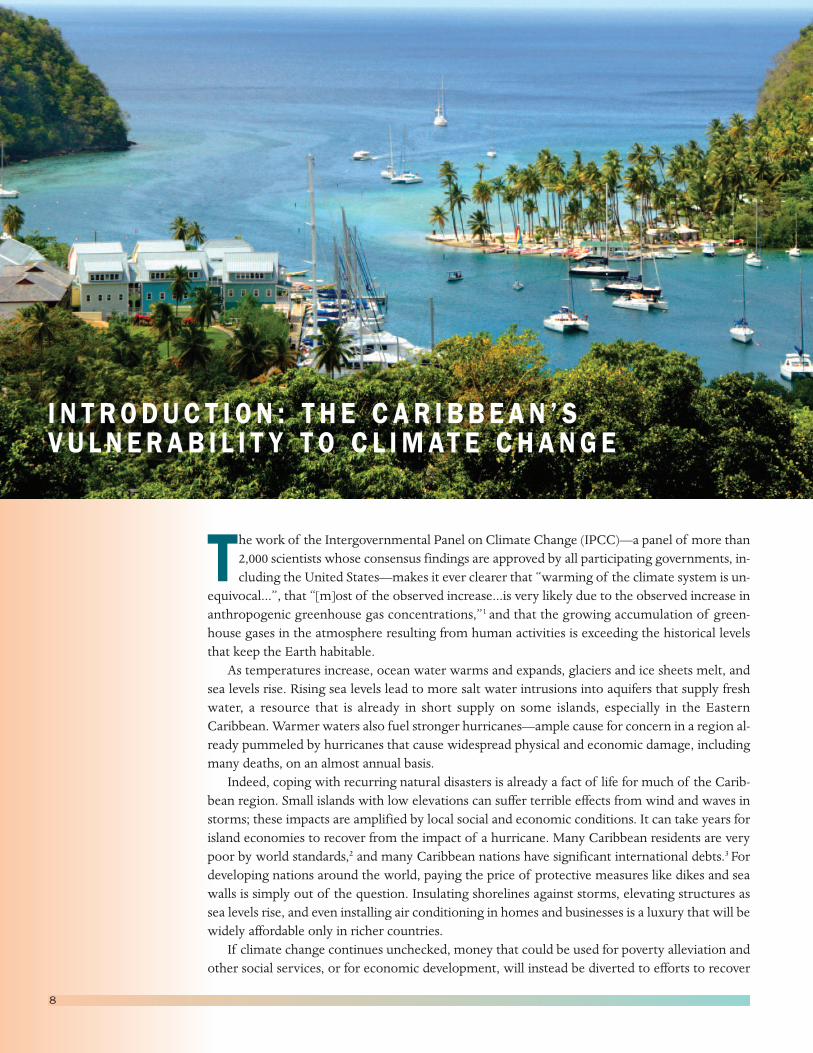
I N T RODUC T I ON : T H E CAR I BB EAN ’ SVU LN ERAB I L I T Y TO C L IMAT E CHANGE
The work of the Intergovernmental Panel on Climate Change (IPCC)—a panel of more than2,000 scientists whose consensus findings are approved by all participating governments, in-cluding the United States—makes it ever clearer that “warming of the climate system is un-
equivocal...”, that “[m]ost of the observed increase...is very likely due to the observed increase inanthropogenic greenhouse gas concentrations,”1 and that the growing accumulation of green-house gases in the atmosphere resulting from human activities is exceeding the historical levelsthat keep the Earth habitable.As temperatures increase, ocean water warms and expands, glaciers and ice sheets melt, and
sea levels rise. Rising sea levels lead to more salt water intrusions into aquifers that supply freshwater, a resource that is already in short supply on some islands, especially in the EasternCaribbean.Warmer waters also fuel stronger hurricanes—ample cause for concern in a region al-ready pummeled by hurricanes that cause widespread physical and economic damage, includingmany deaths, on an almost annual basis.Indeed, coping with recurring natural disasters is already a fact of life for much of the Carib-
bean region. Small islands with low elevations can suffer terrible effects from wind and waves instorms; these impacts are amplified by local social and economic conditions. It can take years forisland economies to recover from the impact of a hurricane. Many Caribbean residents are verypoor by world standards,2 and many Caribbean nations have significant international debts.3 Fordeveloping nations around the world, paying the price of protective measures like dikes and seawalls is simply out of the question. Insulating shorelines against storms, elevating structures assea levels rise, and even installing air conditioning in homes and businesses is a luxury that will bewidely affordable only in richer countries.If climate change continues unchecked, money that could be used for poverty alleviation and
other social services, or for economic development, will instead be diverted to efforts to recover
8

from the impacts of climate change. The unwelcome costs of climate change, imposed by the ac-tions of higher income nations, may make development unaffordable to the people of theCaribbean.The Caribbean population is largely concentrated in coastal areas where much of the infra-
structure may not be able to withstand significantly stronger winds, deeper incursions frommoreforceful ocean surges, and heavier rains. The anticipated climate changes will accelerate the ero-sion of coastal beaches, land and protective mangroves. Coastal houses, hotels and other build-ings, along with roads and other infrastructure are vulnerable, as are those who live and workthere. (Even mainland U.S. infrastructure in coastal regions is highly vulnerable to such effects, asdemonstrated by the aftermath of Hurricane Katrina in 2005.)Still greater vulnerability and higher economic damages will result if new construction and
development along the coast is not built to withstand the impacts of rising sea levels and increas-ing occurrences of floods, and land and mud slides. Conversely, conditions of poverty and inade-quate development in some communities and islands may continue to lead to substandardconstruction of buildings and infrastructure, accentuating their vulnerability.Despite greater precipitation during storms and other peak periods, more frequent and longer
droughts are expected in parts of the Caribbean this century. Negative health impacts will includegreater heat stress for vulnerable populations (such as the elderly), worse sanitation conditionsfrom limited water supplies or contaminated water from floods, and conditions that can favor thespread of water and vector-borne diseases, such as dengue fever, malaria, and diarrhea. Publichealth systems may not be adequate to face greater demands on their services, many of which al-ready are strained by insufficient resources as they face high incidence of HIV and AIDS.4
Higher temperatures also will have serious consequences for agriculture and ecosystems. Im-portant commercial fisheries are at risk as their coral reef habitats are stressed by warmer waters,as was the case during the summer of 2005, which caused record bleaching in coral reefs.5 Coralreefs in the area have already been under stress from other human impacts; climate change nowemerges as a major new threat. Coral reefs are vital to many island economies, providing fishinggrounds, coastal protection, and tourism opportunities.
The Caribbean is one of the world’smost tourism-dependent regions. The in-dustry contributes 15 percent of the re-gion’s national income, or gross domesticproduct (GDP), and much higher frac-tions for some islands—more than two-thirds in several of the smaller countries.In 2004, tourism in the Caribbean was a$28 billion industry and employed 2.4million people. The tourist industry, ofcourse, is entirely dependent on the exis-tence of attractive beaches and other nat-
ural areas, and on comfortable weather. Cruise ship voyages, a market in which the Caribbeanaccounts for half of the global total, are less susceptible (although not entirely invulnerable) toclimate impacts. Despite rapid growth in recent years, cruise ships still account for no more than10 percent of international tourist receipts in the region.6
Most tourists come from colder climates—over 80 percent come from the United States,Canada and Europe—and more of them might vacation closer to home if northern winters be-come milder in future decades.7 Researchers have examined how climate-related changes in tem-perature, health risks, and in other environmental features (e.g., beaches and ecosystems) mayhave a significant impact on tourists’ destination choices within the islands. One survey of visitors
9
to two tourism-dependent islands found that 80 percent of the respondents would be unwillingto revisit the island for the same price if the environmental attractions (coral reefs and beaches,respectively) were negatively affected by climate change.8
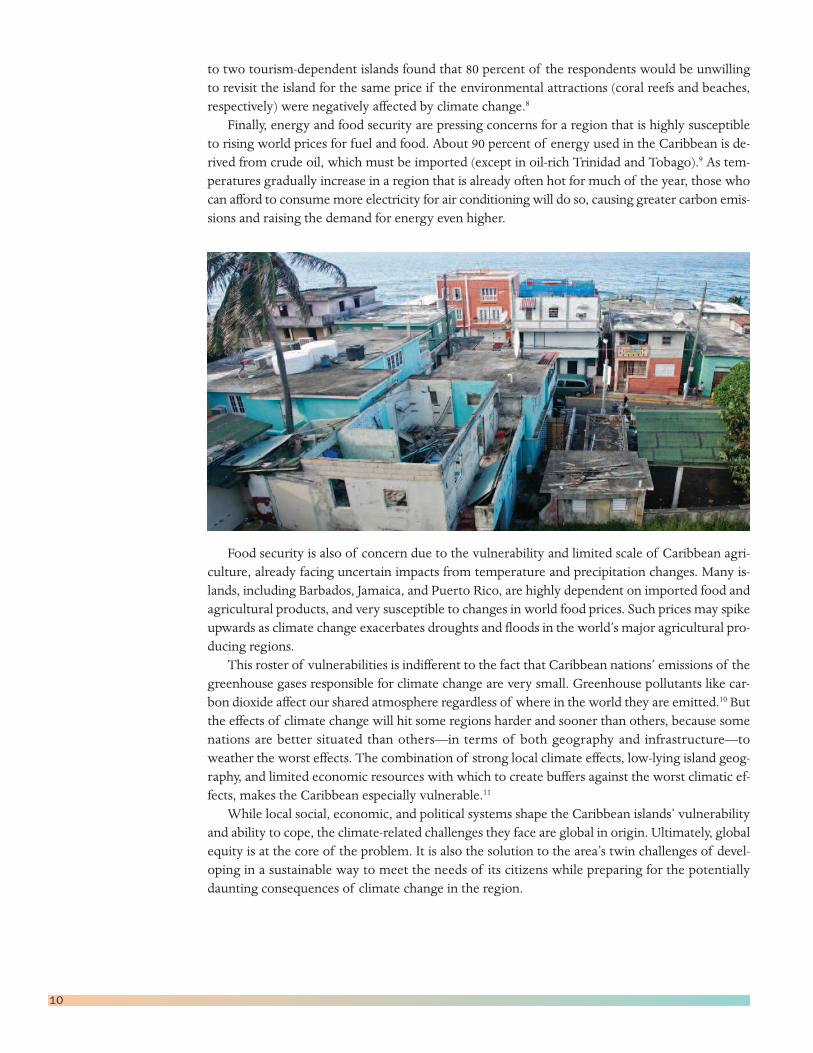
Finally, energy and food security are pressing concerns for a region that is highly susceptibleto rising world prices for fuel and food. About 90 percent of energy used in the Caribbean is de-rived from crude oil, which must be imported (except in oil-rich Trinidad and Tobago).9 As tem-peratures gradually increase in a region that is already often hot for much of the year, those whocan afford to consumemore electricity for air conditioning will do so, causing greater carbon emis-sions and raising the demand for energy even higher.
Food security is also of concern due to the vulnerability and limited scale of Caribbean agri-culture, already facing uncertain impacts from temperature and precipitation changes. Many is-lands, including Barbados, Jamaica, and Puerto Rico, are highly dependent on imported food andagricultural products, and very susceptible to changes in world food prices. Such prices may spikeupwards as climate change exacerbates droughts and floods in the world’s major agricultural pro-ducing regions.This roster of vulnerabilities is indifferent to the fact that Caribbean nations’ emissions of the
greenhouse gases responsible for climate change are very small. Greenhouse pollutants like car-bon dioxide affect our shared atmosphere regardless of where in the world they are emitted.10 Butthe effects of climate change will hit some regions harder and sooner than others, because somenations are better situated than others—in terms of both geography and infrastructure—toweather the worst effects. The combination of strong local climate effects, low-lying island geog-raphy, and limited economic resources with which to create buffers against the worst climatic ef-fects, makes the Caribbean especially vulnerable.11
While local social, economic, and political systems shape the Caribbean islands’ vulnerabilityand ability to cope, the climate-related challenges they face are global in origin. Ultimately, globalequity is at the core of the problem. It is also the solution to the area’s twin challenges of devel-oping in a sustainable way to meet the needs of its citizens while preparing for the potentiallydaunting consequences of climate change in the region.
10
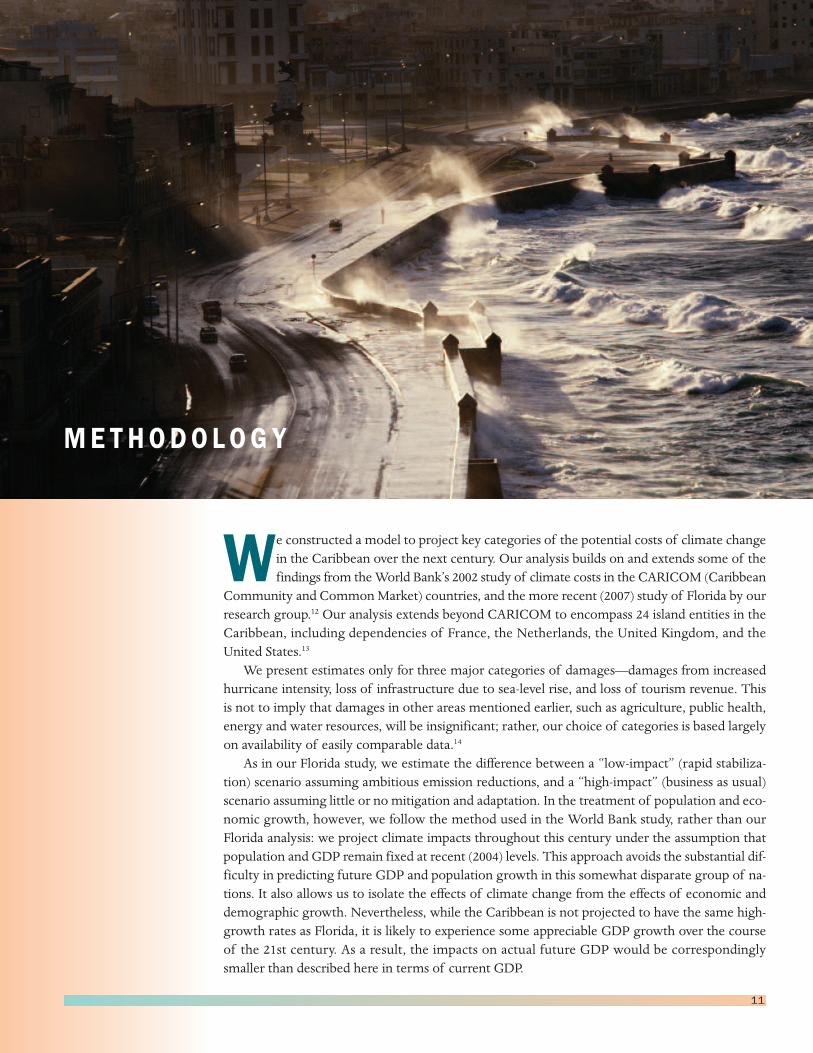
METHODO LOGY
We constructed a model to project key categories of the potential costs of climate changein the Caribbean over the next century. Our analysis builds on and extends some of thefindings from theWorld Bank’s 2002 study of climate costs in the CARICOM (Caribbean
Community and CommonMarket) countries, and the more recent (2007) study of Florida by ourresearch group.12 Our analysis extends beyond CARICOM to encompass 24 island entities in theCaribbean, including dependencies of France, the Netherlands, the United Kingdom, and theUnited States.13
We present estimates only for three major categories of damages—damages from increasedhurricane intensity, loss of infrastructure due to sea-level rise, and loss of tourism revenue. Thisis not to imply that damages in other areas mentioned earlier, such as agriculture, public health,energy and water resources, will be insignificant; rather, our choice of categories is based largelyon availability of easily comparable data.14
As in our Florida study, we estimate the difference between a “low-impact” (rapid stabiliza-tion) scenario assuming ambitious emission reductions, and a “high-impact” (business as usual)scenario assuming little or no mitigation and adaptation. In the treatment of population and eco-nomic growth, however, we follow the method used in the World Bank study, rather than ourFlorida analysis: we project climate impacts throughout this century under the assumption thatpopulation and GDP remain fixed at recent (2004) levels. This approach avoids the substantial dif-ficulty in predicting future GDP and population growth in this somewhat disparate group of na-tions. It also allows us to isolate the effects of climate change from the effects of economic anddemographic growth. Nevertheless, while the Caribbean is not projected to have the same high-growth rates as Florida, it is likely to experience some appreciable GDP growth over the courseof the 21st century. As a result, the impacts on actual future GDP would be correspondinglysmaller than described here in terms of current GDP.
11
The two scenarios used in our Caribbean model are generally consistent with the IPCC’s “B1”and “A2” scenarios. The IPCC does not make a single projection of future climate change, but in-stead calculates a set of six possible futures. Of these, B1 has the slowest growth of emissions, andconsequently the lowest impacts. A2 has the second fastest growth of the six scenarios, and hasbeen widely used to represent the impacts from business-as-usual emissions.As small island nations, the Caribbean countries share many characteristics. Nonetheless, there
are significant differences between the islands in terms of size, population, social and economicconditions, infrastructure, standard of living, etc. Their geographical location within the Carib-bean is crucial in relation to hurricane paths, with some islands suffering frequent damages (e.g.,The Bahamas, Cayman Islands or Cuba) and others infrequently or not at all (e.g., Aruba, Trinidadand Tobago). Temperature increases and sea-level rise interact with island topography (coastallow-lying lands, versus steeper inclines) and with the other physical, social, and economic condi-tions in determining the consequences of extreme climate changes and the islands’ vulnerabilityto them. The importance of tourism to the local island economies varies as well. These factorsexplain the very different impacts seen in our model results for different countries.In order to apply the model across the range of islands, the following simplifying assumptions
were made (see the Appendix II for further details):
Hu r r i c a n e d amag e sFor hurricane damages from increased storm intensity we used historical information on hurri-cane and flood damages, and calculated an average annual cost per island based on the costs be-tween 1990 and 2007.15 From these historical average annual storm damages, projections weremade for damages in 2025, 2050, 2075 and 2100 for both the low- and high-impact scenarios usingthe formulas described in our Florida study:
� In both the low- and high-impact scenarios, doubling of hurricane damages for everymeter (39 inches) of sea-level rise (as discussed in Appendix II, we use a higher sea-levelrise value than does the IPCC to account for recent observed trends).
� In the high-impact scenario only, losses are compounded by an additional doubling ofdamages for each doubling of atmospheric carbon dioxide concentrations in the at-mosphere, which accounts for greater storm intensity.
To u r i smTheWorld Bank study estimated the loss of tourist revenue that could be attributed to increasedtemperature, loss of beaches, and environmental degradation.We used their estimate of the ratioof lost tourist revenue to total tourist expenditures for the CARICOM island countries as a whole,and applied this ratio to the tourist expenditures, as reported by the World Travel & TourismCouncil, on each island for the year 2007.16
I n f r a s t r u c t u r eTheWorld Bank study estimated the cost per affected household of reconstructing housing, otherbuildings, roads, and infrastructure lost to sea-level rise, and estimated that 19 percent of the pop-ulation would be affected in the low-impact case, and 66 percent in the high-impact case. For theislands not in the original World Bank study, we applied the same hypotheses for all except thethree largest (Cuba, Dominican Republic/Haiti and Puerto Rico) where it seems likely thatsmaller fractions of the population live in the coastal areas which are at risk from sea-level rise.17
To be conservative, we used half the World Bank estimates of the affected population for thelargest islands.
12
RESU LT S : P RO J EC T ED COS T SO F I N AC T I ON I N TH E CAR I BB EAN
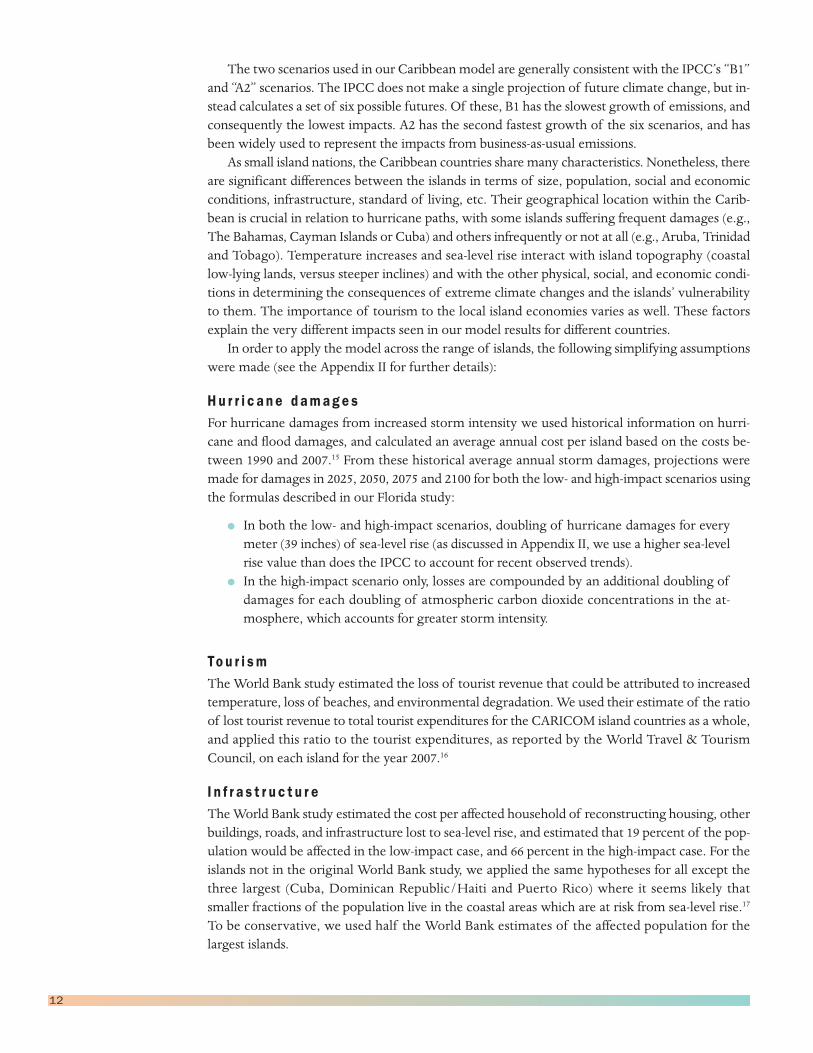
What price will the Caribbean be forced to pay for the impacts of climate change in the21st century?What are the likely costs of inaction—of insufficient efforts world-wide toprevent worsening climate change?
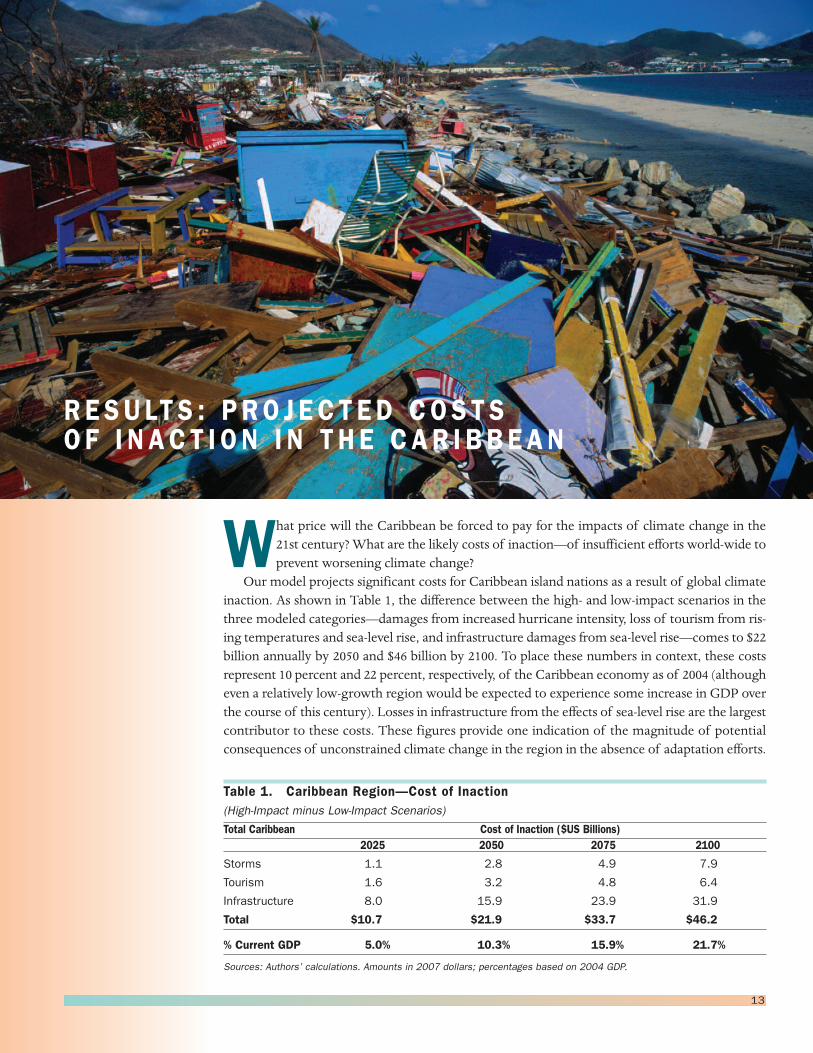
Our model projects significant costs for Caribbean island nations as a result of global climateinaction. As shown in Table 1, the difference between the high- and low-impact scenarios in thethree modeled categories—damages from increased hurricane intensity, loss of tourism from ris-ing temperatures and sea-level rise, and infrastructure damages from sea-level rise—comes to $22billion annually by 2050 and $46 billion by 2100. To place these numbers in context, these costsrepresent 10 percent and 22 percent, respectively, of the Caribbean economy as of 2004 (althougheven a relatively low-growth region would be expected to experience some increase in GDP overthe course of this century). Losses in infrastructure from the effects of sea-level rise are the largestcontributor to these costs. These figures provide one indication of the magnitude of potentialconsequences of unconstrained climate change in the region in the absence of adaptation efforts.
Table 1. Caribbean Region—Cost of Inaction(High-Impact minus Low-Impact Scenarios)
Total Caribbean Cost of Inaction ($US Billions)2025 2050 2075 2100
Storms 1.1 2.8 4.9 7.9
Tourism 1.6 3.2 4.8 6.4
Infrastructure 8.0 15.9 23.9 31.9
Total $10.7 $21.9 $33.7 $46.2
% Current GDP 5.0% 10.3% 15.9% 21.7%
Sources: Authors’ calculations. Amounts in 2007 dollars; percentages based on 2004 GDP.
13
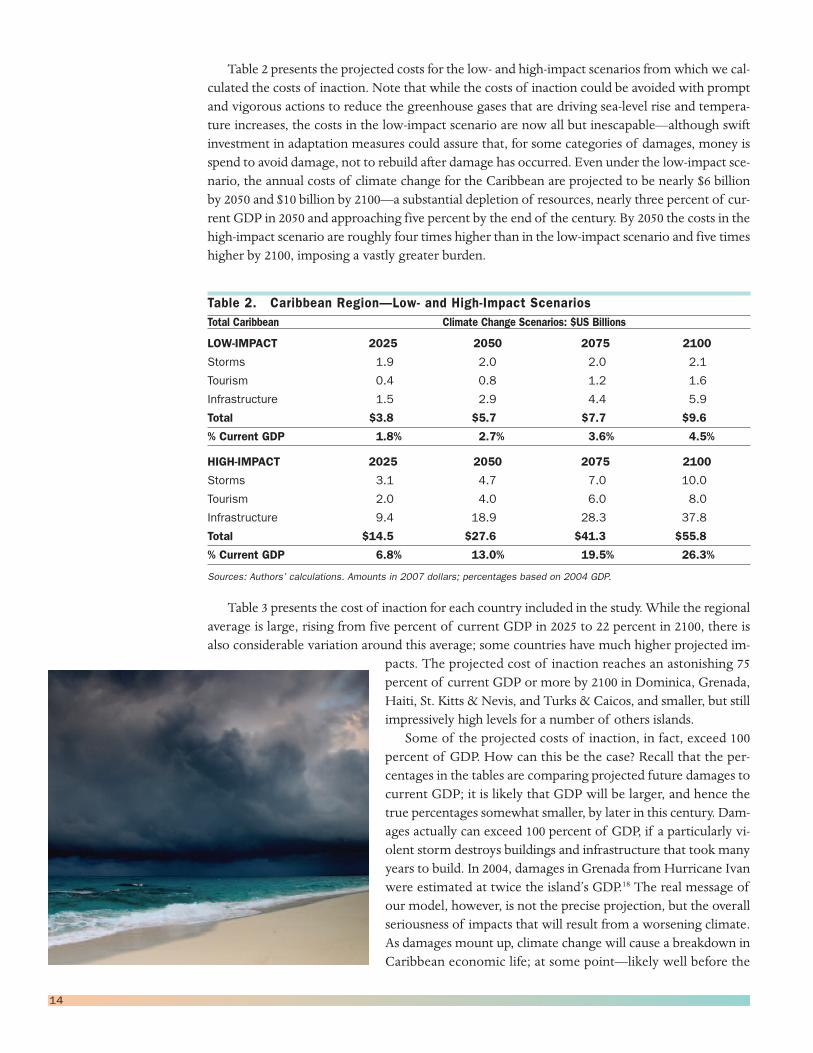
Table 2 presents the projected costs for the low- and high-impact scenarios fromwhich we cal-culated the costs of inaction. Note that while the costs of inaction could be avoided with promptand vigorous actions to reduce the greenhouse gases that are driving sea-level rise and tempera-ture increases, the costs in the low-impact scenario are now all but inescapable—although swiftinvestment in adaptation measures could assure that, for some categories of damages, money isspend to avoid damage, not to rebuild after damage has occurred. Even under the low-impact sce-nario, the annual costs of climate change for the Caribbean are projected to be nearly $6 billionby 2050 and $10 billion by 2100—a substantial depletion of resources, nearly three percent of cur-rent GDP in 2050 and approaching five percent by the end of the century. By 2050 the costs in thehigh-impact scenario are roughly four times higher than in the low-impact scenario and five timeshigher by 2100, imposing a vastly greater burden.
Table 2. Caribbean Region—Low- and High-Impact ScenariosTotal Caribbean Climate Change Scenarios: $US Billions
LOW-IMPACT 2025 2050 2075 2100
Storms 1.9 2.0 2.0 2.1
Tourism 0.4 0.8 1.2 1.6
Infrastructure 1.5 2.9 4.4 5.9
Total $3.8 $5.7 $7.7 $9.6
% Current GDP 1.8% 2.7% 3.6% 4.5%
HIGH-IMPACT 2025 2050 2075 2100
Storms 3.1 4.7 7.0 10.0
Tourism 2.0 4.0 6.0 8.0
Infrastructure 9.4 18.9 28.3 37.8
Total $14.5 $27.6 $41.3 $55.8
% Current GDP 6.8% 13.0% 19.5% 26.3%
Sources: Authors’ calculations. Amounts in 2007 dollars; percentages based on 2004 GDP.
Table 3 presents the cost of inaction for each country included in the study.While the regionalaverage is large, rising from five percent of current GDP in 2025 to 22 percent in 2100, there isalso considerable variation around this average; some countries have much higher projected im-
pacts. The projected cost of inaction reaches an astonishing 75percent of current GDP or more by 2100 in Dominica, Grenada,Haiti, St. Kitts & Nevis, and Turks & Caicos, and smaller, but stillimpressively high levels for a number of others islands.Some of the projected costs of inaction, in fact, exceed 100
percent of GDP. How can this be the case? Recall that the per-centages in the tables are comparing projected future damages tocurrent GDP; it is likely that GDP will be larger, and hence thetrue percentages somewhat smaller, by later in this century. Dam-ages actually can exceed 100 percent of GDP, if a particularly vi-olent storm destroys buildings and infrastructure that took manyyears to build. In 2004, damages in Grenada from Hurricane Ivanwere estimated at twice the island’s GDP.18 The real message ofour model, however, is not the precise projection, but the overallseriousness of impacts that will result from a worsening climate.As damages mount up, climate change will cause a breakdown inCaribbean economic life; at some point—likely well before the
14
projected annual damages reach 100 percent of GDP—it will become impossible to keep restor-ing damaged property, and tourism and other weather-sensitive industries will move elsewhere.Indeed, as sea levels rise, residents of small low-lying islands, like Turks & Caicos, may be unableto continue inhabiting them.
Table 3. Caribbean Region Summary—Cost of Global Inaction on Climate ChangeCost of Inaction: % of current GDP
2025 2050 2075 2100
Anguilla 10.4 20.7 31.1 41.4
Antigua & Barbuda 12.2 25.8 41.0 58.4
Aruba 5.0 10.1 15.1 20.1
Bahamas 6.6 13.9 22.2 31.7
Barbados 6.9 13.9 20.8 27.7
British Virgin Islands 4.5 9.0 13.5 18.1
Cayman Islands 8.8 20.1 34.7 53.4
Cuba 6.1 12.5 19.4 26.8
Dominica 16.3 34.3 54.4 77.3
Dominican Republic 9.7 19.6 29.8 40.3
Grenada 21.3 46.2 75.8 111.5
Guadeloupe 2.3 4.6 7.0 9.5
Haiti 30.5 61.2 92.1 123.2
Jamaica 13.9 27.9 42.3 56.9
Martinique 1.9 3.8 5.9 8.1
Montserrat 10.2 21.7 34.6 49.5
Netherlands Antilles 7.7 16.1 25.5 36.0
Puerto Rico 1.4 2.8 4.4 6.0
Saint Kitts & Nevis 16.0 35.5 59.5 89.3
Saint Lucia 12.1 24.3 36.6 49.1
Saint Vincent & the Grenadines 11.8 23.6 35.4 47.2
Trinidad & Tobago 4.0 8.0 12.0 16.0
Turks & Caicos 19.0 37.9 56.9 75.9
U.S. Virgin Islands 6.7 14.2 22.6 32.4
TOTAL CARIBBEAN 5.0% 10.3% 15.9% 21.7%
Sources: Authors’ calculations. Percentages based on 2004 GDP.
Looking inside our model, there are cases in which countries stand out because of high im-pacts in each of our three cost categories. Average annual hurricane damages in the recent past,used as the basis for our projection of future hurricane damages, vary widely throughout theregion. The regional average is one percent of current GDP, but three countries, the Cayman Is-lands, Grenada, and St. Kitts & Nevis, have had hurricane damages averaging 10–15 percent ofGDP since 1990. In three others, Antigua & Barbuda, Dominica, and Montserrat, hurricane losseshave been roughly five to seven percent of GDP. Our projection of future hurricane damages isproportional to recent past damages, so it is particularly large for these six countries.
Tourism is important to economies throughout the region, but some are much more tourist-dependent than others. The economies of Anguilla and Turks & Caicos appear to be dominatedby tourism; tourism also accounts for a very large share of economic activity in many of the othersmall countries. In contrast, tourism is a smaller than average proportion of GDP in several of thelarger economies, including Cuba, Haiti, Puerto Rico, and Trinidad & Tobago. Our projection of
15
climate-related tourism losses is proportional to the current share of tourism in the economy, sothe more heavily tourist-based economies suffer greater losses in this category.
Infrastructure damages, our largest cost category, is projected as a constant cost per affectedhousehold (as noted above, this approach is modified from the World Bank analysis with regardto the large islands); this category is based on sea-level rise, and excludes hurricane damages. Thusit is largest, as a percentage of GDP, in the lowest income countries. Haiti stands out in this re-spect, as by far the lowest-income country of the region, and it is therefore hardest hit, in per-centage terms, by the projected infrastructure costs. Haiti’s poverty creates unique challenges andlevels of vulnerability, accentuating the problems faced throughout the region. For example, mostforests in Haiti have already been cut down for fuel wood, the affordable fuel for the majority ofHaitians. The loss of forests makes Haiti more vulnerable to greater damages, with less protec-tion against strong winds, floods and mud slides. Hurricane Jeanne in 2004 had devastating im-pacts, leaving over 200,000 people homeless and 3,000 dead, though it was only of tropical stormintensity (technically speaking, not quite a hurricane) when it struck the country.19
CLIMATE IMPACTS ON PUERTO RICO
During the latter half of the 20th century the Commonwealth of Puerto Rico, a “non-incorporated territory” of the United States with a population of nearly four million, un-derwent rapid industrial transformation and commercial development. In nighttime satel-
lite images of the Earth, Puerto Rico stands out in the Caribbean—it is about as bright as theEastern United States, Western Europe, or Japan.20
In 2006, Puerto Rico’s GDP was $86.5 billion while per capita GDP (or average income) wasjust over $22,000. In that year, manufacturing accounted for 42percent of output and 11 percent of employment, while agri-culture accounted for only 0.4 percent of GDP but almost twopercent of the labor force. Annual tourism expenditures exceed$2 billion and create over 50,000 direct and indirect jobs—largeabsolute numbers, but a much smaller percentage of the econ-omy than many smaller islands.21 Average life expectancy is 78years and 94 percent of the population is literate; Puerto Ricowould rank high in terms of the United Nation’s Human De-velopment Index.22
The main island accounts for 99 percent of Puerto Rico’s3,435 square miles; the interior of the main island is mountain-ous with a peak elevation of 4,390 feet above sea level. Viequesand Culebra islands to the east are populated year-round, whileMona to the west is an ecological reserve. Temperatures varybetween the warmer coast and inland mountains, with averageannual temperatures around 84 degrees Fahrenheit (29 degreesCelsius), although temperatures in the 90s (32–37 degrees Cel-sius) are common in the summer months. Puerto Rico is one ofthe richest islands in the region in terms of biodiversity andwildlife species.Puerto Rican rainforests, mangroves, and many miles of
coast, providing beach, sand, and sun to tourists and residentsalike, are extremely vulnerable to climate change.23 Hotter local temperatures, along with warmerwinters in northern latitudes, may eventually reduce the number of tourist visits, especially when
16
combined with the threat of beach erosion from sea-level rise and the destructive forces ofstronger hurricanes, ocean surges and heavy rains.Most of the population lives in or near coastal zones, and most economic activity is located
there as well, including most hotels, hospitals, and electric power plants; some power plants areless than 160 feet from the waterline and less than six feet above sea level. More than half of thepopulation lives in the San Juan metropolitan area, a coastal city that is very close to sea level. Arise of three feet (almost a meter) in sea level would flood large parts of the city.24
Puerto Rico was largely spared bymajor hurricanes during its decades of industrialization afterWorld War II. In the last two decades, however, the island has faced damaging storms. For exam-ple, in 1989 Hurricane Hugo (a Category 3 storm) passed over the northeast corner of PuertoRico and caused an estimated $1 billion in damages; Hurricane Georges (Category 2) crossed theisland in 1998, leaving behind 12 dead and total damages amounting to $2.3 billion.25
Landslide hazards are a growing concern in Puerto Rico. Bursts of heavy rainfall from intensestorms trigger numerous landslides in the mountain areas of the island, causing substantial prop-erty damage and sometimes loss of life.26 With a high and growing population density (higherthan in Japan or in the Netherlands), there is increased construction on vulnerable slopes expos-ing more of the population to these hazards.High urban population density, growing numbers of older people, and other at-risk groups,
and a relatively high poverty rate (by U.S. if not Caribbean standards) increase the island’s socialvulnerability to climate change damages. At the same time, Puerto Rico’s relatively high per capitafuel and energy consumption—in electricity and transportation (one automobile per 1.3 PuertoRicans)—contributes to atmospheric warming and to accelerating import bills for energy.
PUER TO R I CO ’ S COS T O F C L IMATE I NACT I ON
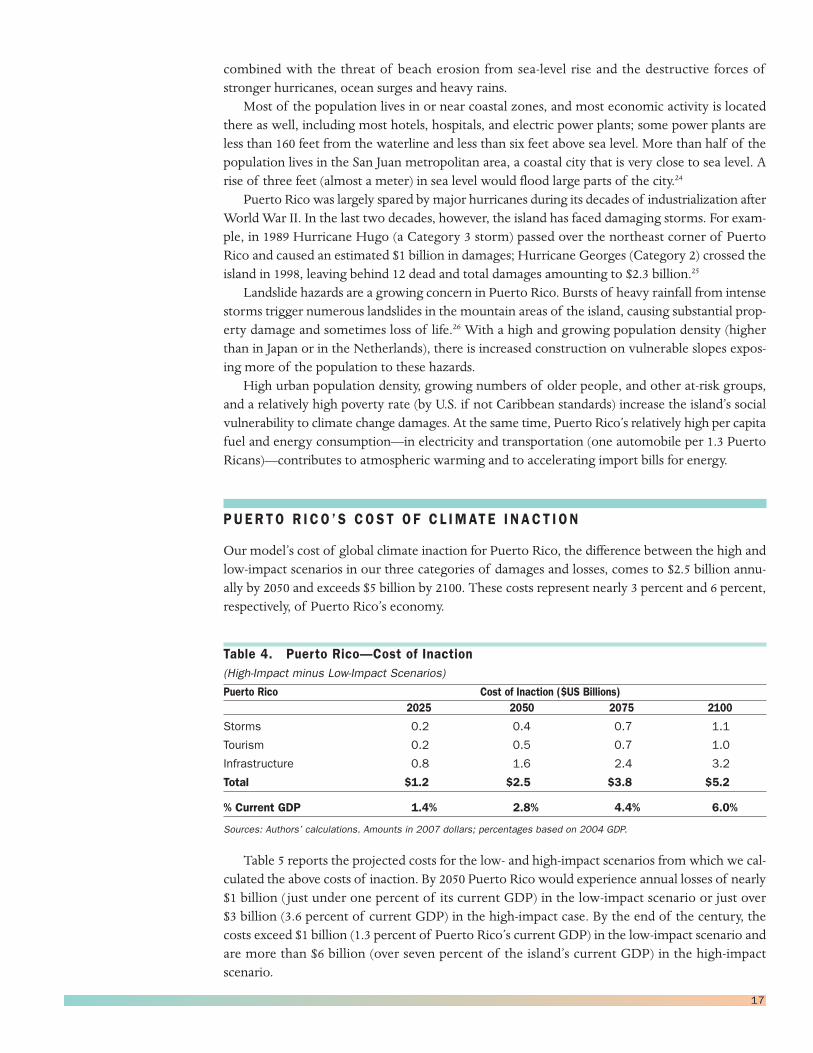
Our model’s cost of global climate inaction for Puerto Rico, the difference between the high andlow-impact scenarios in our three categories of damages and losses, comes to $2.5 billion annu-ally by 2050 and exceeds $5 billion by 2100. These costs represent nearly 3 percent and 6 percent,respectively, of Puerto Rico’s economy.
Table 4. Puerto Rico—Cost of Inaction(High-Impact minus Low-Impact Scenarios)
Puerto Rico Cost of Inaction ($US Billions)2025 2050 2075 2100
Storms 0.2 0.4 0.7 1.1
Tourism 0.2 0.5 0.7 1.0
Infrastructure 0.8 1.6 2.4 3.2
Total $1.2 $2.5 $3.8 $5.2
% Current GDP 1.4% 2.8% 4.4% 6.0%
Sources: Authors’ calculations. Amounts in 2007 dollars; percentages based on 2004 GDP.
Table 5 reports the projected costs for the low- and high-impact scenarios from which we cal-culated the above costs of inaction. By 2050 Puerto Rico would experience annual losses of nearly$1 billion ( just under one percent of its current GDP) in the low-impact scenario or just over$3 billion (3.6 percent of current GDP) in the high-impact case. By the end of the century, thecosts exceed $1 billion (1.3 percent of Puerto Rico’s current GDP) in the low-impact scenario andare more than $6 billion (over seven percent of the island’s current GDP) in the high-impactscenario.
17
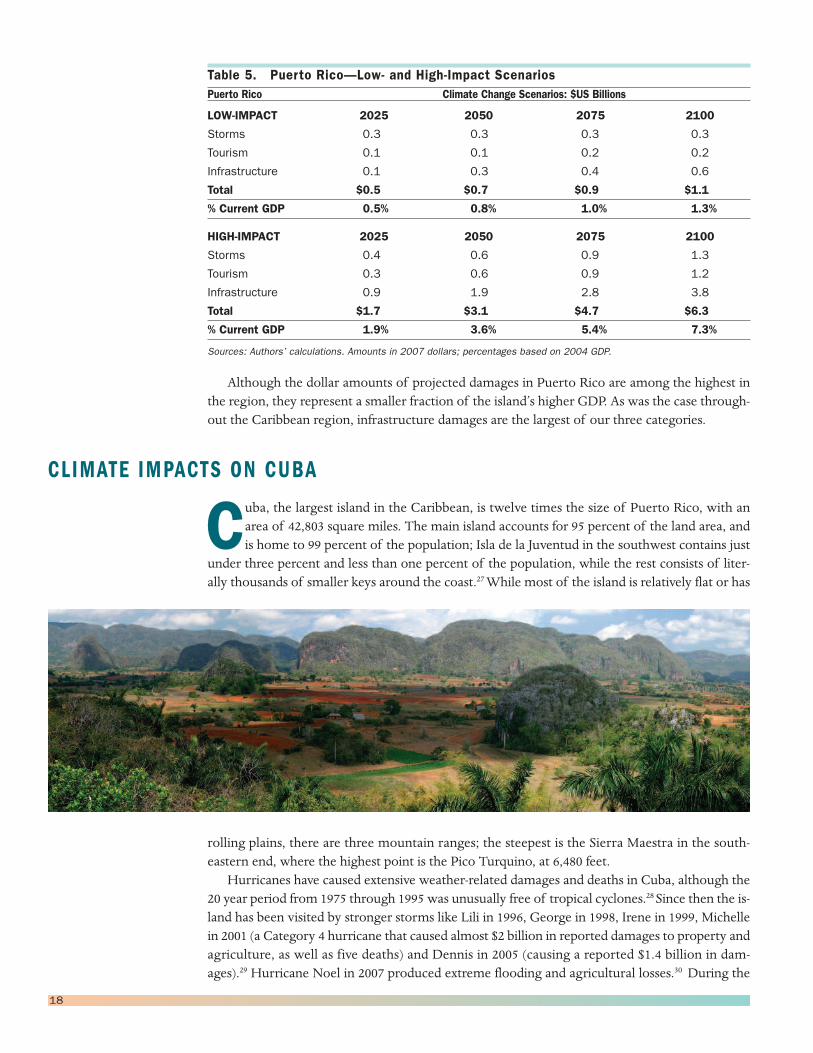
Table 5. Puerto Rico—Low- and High-Impact ScenariosPuerto Rico Climate Change Scenarios: $US Billions
LOW-IMPACT 2025 2050 2075 2100
Storms 0.3 0.3 0.3 0.3
Tourism 0.1 0.1 0.2 0.2
Infrastructure 0.1 0.3 0.4 0.6
Total $0.5 $0.7 $0.9 $1.1
% Current GDP 0.5% 0.8% 1.0% 1.3%
HIGH-IMPACT 2025 2050 2075 2100
Storms 0.4 0.6 0.9 1.3
Tourism 0.3 0.6 0.9 1.2
Infrastructure 0.9 1.9 2.8 3.8
Total $1.7 $3.1 $4.7 $6.3
% Current GDP 1.9% 3.6% 5.4% 7.3%
Sources: Authors’ calculations. Amounts in 2007 dollars; percentages based on 2004 GDP.
Although the dollar amounts of projected damages in Puerto Rico are among the highest inthe region, they represent a smaller fraction of the island’s higher GDP. As was the case through-out the Caribbean region, infrastructure damages are the largest of our three categories.
CLIMATE IMPACTS ON CUBA
Cuba, the largest island in the Caribbean, is twelve times the size of Puerto Rico, with anarea of 42,803 square miles. The main island accounts for 95 percent of the land area, andis home to 99 percent of the population; Isla de la Juventud in the southwest contains just
under three percent and less than one percent of the population, while the rest consists of liter-ally thousands of smaller keys around the coast.27While most of the island is relatively flat or has
rolling plains, there are three mountain ranges; the steepest is the Sierra Maestra in the south-eastern end, where the highest point is the Pico Turquino, at 6,480 feet.Hurricanes have caused extensive weather-related damages and deaths in Cuba, although the
20 year period from 1975 through 1995 was unusually free of tropical cyclones.28 Since then the is-land has been visited by stronger storms like Lili in 1996, George in 1998, Irene in 1999, Michellein 2001 (a Category 4 hurricane that caused almost $2 billion in reported damages to property andagriculture, as well as five deaths) and Dennis in 2005 (causing a reported $1.4 billion in dam-ages).29 Hurricane Noel in 2007 produced extreme flooding and agricultural losses.30 During the
18
second half of the 20th century mean annual air temperature rose 0.9 degree Fahrenheit (0.5 de-gree Celsius) and there were more frequent heavy rains, severe local storms and droughts.31
From a climate change perspective, Cuba faces unique challenges that make it particularly vul-nerable. Over 10 percent of Cubans live less than a mile from the shoreline, a lower share than onmany smaller Caribbean islands, but a large number of people nonetheless.32 Cuba has the longestcoastline among Caribbean islands, and a land mass big enough to be hit by hurricanes movingalong several different storm paths. Its 11 million people have limited income levels and modestliving conditions, which will make them especially vulnerable to worsening climate impacts overthe course of the 21st century.
CHANG I NG ECONOM IC OUT LOOK?
Since the economic collapse of the early 1990s, Cuba’s economy has changed significantly. Sugarproduction, once the dominant industry, has declined sharply, dropping to less than 15 percent ofthe eight million tons reached in 1989, with half of all mills closed by 2002. Mining has expanded,and nickel is now by far the country’s leading export.33
Tourism, along with mining, has become a leading engine of the Cuban economy, with thenumber of tourist visitors growing to over two million per year. The share of tourism in theCuban economy is still quite low by Caribbean standards, but with all indications that the gov-ernment plans an accelerated expansion of tourism, it is likely to grow.34Any future turn towardgreater openness and normalization of relations with the United States, when and if it occurs,would probably expand Cuba’s tourism sector even more. Since tourism is one of the mostclimate-dependent economic sectors, Cuba will be at risk for greater economic damages from cli-mate change as its tourism industry takes off.The capital city of Havana, which faces north to the sea, is vulnerable to rising sea levels and
future hurricanes of greater intensity. Many buildings suffer from gradually deteriorating physi-cal condition, the result of inadequate maintenance over the decades. In some of the extremeweather events of recent years, surging stormwaves flowed over the Malecón boardwalk to floodmany city blocks, further deteriorating the physical infrastructure.
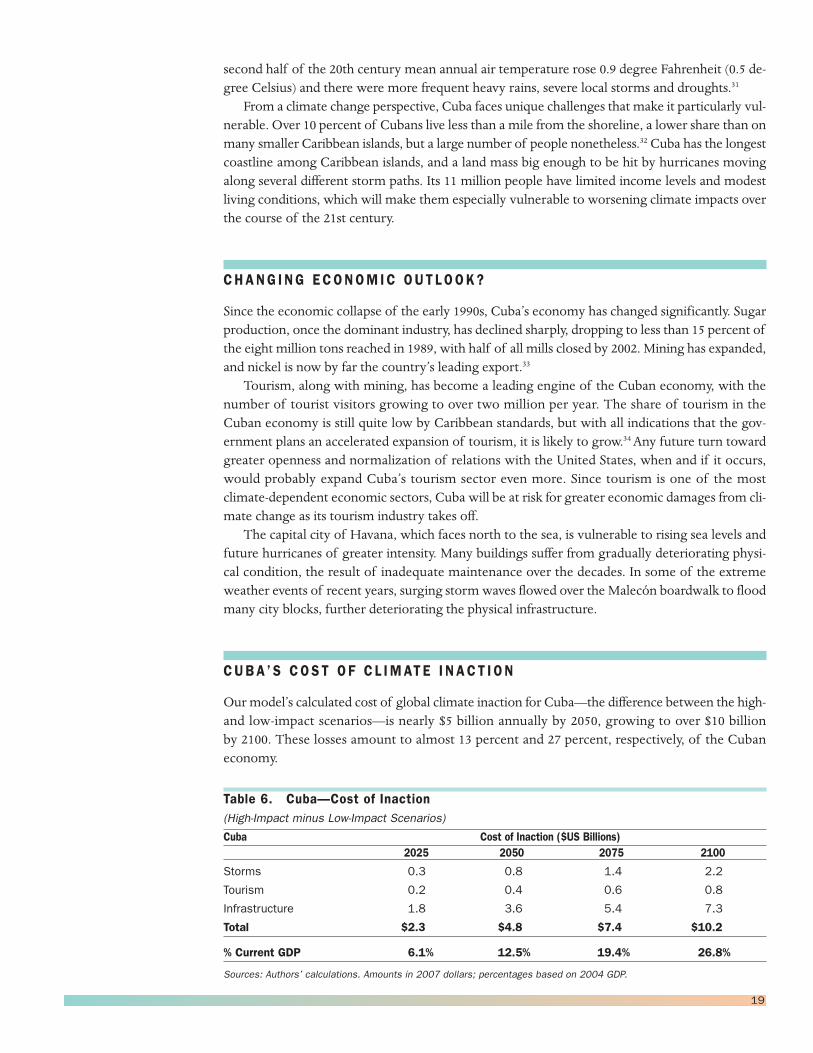
CUBA ’ S COS T O F C L IMATE I NACT I ON
Ourmodel’s calculated cost of global climate inaction for Cuba—the difference between the high-and low-impact scenarios—is nearly $5 billion annually by 2050, growing to over $10 billionby 2100. These losses amount to almost 13 percent and 27 percent, respectively, of the Cubaneconomy.
Table 6. Cuba—Cost of Inaction(High-Impact minus Low-Impact Scenarios)
Cuba Cost of Inaction ($US Billions)2025 2050 2075 2100
Storms 0.3 0.8 1.4 2.2
Tourism 0.2 0.4 0.6 0.8
Infrastructure 1.8 3.6 5.4 7.3
Total $2.3 $4.8 $7.4 $10.2
% Current GDP 6.1% 12.5% 19.4% 26.8%
Sources: Authors’ calculations. Amounts in 2007 dollars; percentages based on 2004 GDP.
19
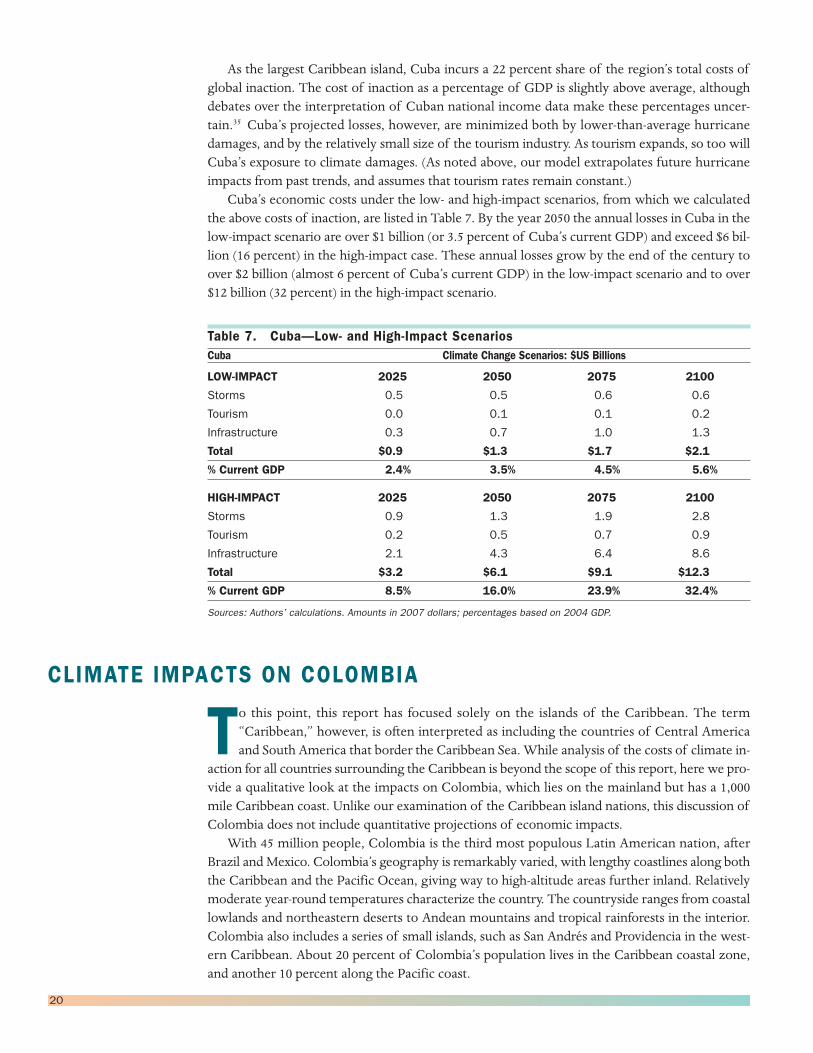
As the largest Caribbean island, Cuba incurs a 22 percent share of the region’s total costs ofglobal inaction. The cost of inaction as a percentage of GDP is slightly above average, althoughdebates over the interpretation of Cuban national income data make these percentages uncer-tain.35 Cuba’s projected losses, however, are minimized both by lower-than-average hurricanedamages, and by the relatively small size of the tourism industry. As tourism expands, so too willCuba’s exposure to climate damages. (As noted above, our model extrapolates future hurricaneimpacts from past trends, and assumes that tourism rates remain constant.)Cuba’s economic costs under the low- and high-impact scenarios, from which we calculated
the above costs of inaction, are listed in Table 7. By the year 2050 the annual losses in Cuba in thelow-impact scenario are over $1 billion (or 3.5 percent of Cuba’s current GDP) and exceed $6 bil-lion (16 percent) in the high-impact case. These annual losses grow by the end of the century toover $2 billion (almost 6 percent of Cuba’s current GDP) in the low-impact scenario and to over$12 billion (32 percent) in the high-impact scenario.
Table 7. Cuba—Low- and High-Impact ScenariosCuba Climate Change Scenarios: $US Billions
LOW-IMPACT 2025 2050 2075 2100
Storms 0.5 0.5 0.6 0.6
Tourism 0.0 0.1 0.1 0.2
Infrastructure 0.3 0.7 1.0 1.3
Total $0.9 $1.3 $1.7 $2.1
% Current GDP 2.4% 3.5% 4.5% 5.6%
HIGH-IMPACT 2025 2050 2075 2100
Storms 0.9 1.3 1.9 2.8
Tourism 0.2 0.5 0.7 0.9
Infrastructure 2.1 4.3 6.4 8.6
Total $3.2 $6.1 $9.1 $12.3
% Current GDP 8.5% 16.0% 23.9% 32.4%
Sources: Authors’ calculations. Amounts in 2007 dollars; percentages based on 2004 GDP.
CLIMATE IMPACTS ON COLOMBIA
To this point, this report has focused solely on the islands of the Caribbean. The term“Caribbean,” however, is often interpreted as including the countries of Central Americaand South America that border the Caribbean Sea. While analysis of the costs of climate in-
action for all countries surrounding the Caribbean is beyond the scope of this report, here we pro-vide a qualitative look at the impacts on Colombia, which lies on the mainland but has a 1,000mile Caribbean coast. Unlike our examination of the Caribbean island nations, this discussion ofColombia does not include quantitative projections of economic impacts.With 45 million people, Colombia is the third most populous Latin American nation, after
Brazil andMexico. Colombia’s geography is remarkably varied, with lengthy coastlines along boththe Caribbean and the Pacific Ocean, giving way to high-altitude areas further inland. Relativelymoderate year-round temperatures characterize the country. The countryside ranges from coastallowlands and northeastern deserts to Andean mountains and tropical rainforests in the interior.Colombia also includes a series of small islands, such as San Andrés and Providencia in the west-ern Caribbean. About 20 percent of Colombia’s population lives in the Caribbean coastal zone,and another 10 percent along the Pacific coast.
20
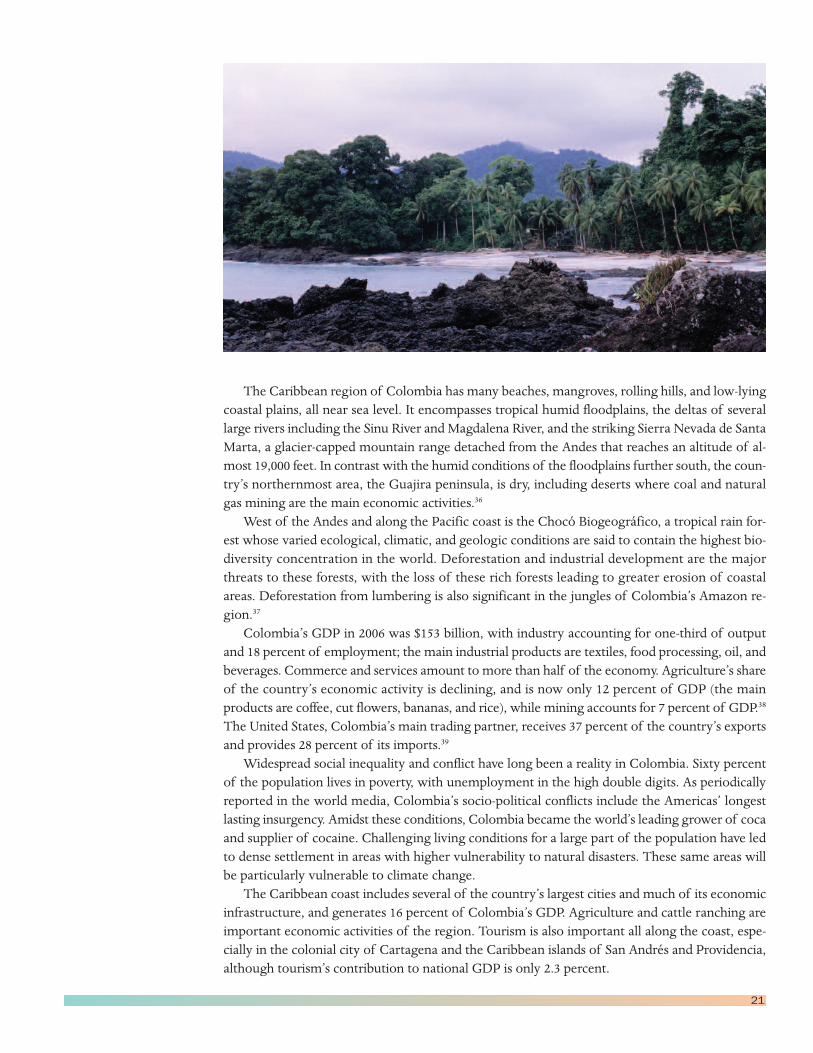
The Caribbean region of Colombia has many beaches, mangroves, rolling hills, and low-lyingcoastal plains, all near sea level. It encompasses tropical humid floodplains, the deltas of severallarge rivers including the Sinu River andMagdalena River, and the striking Sierra Nevada de SantaMarta, a glacier-capped mountain range detached from the Andes that reaches an altitude of al-most 19,000 feet. In contrast with the humid conditions of the floodplains further south, the coun-try’s northernmost area, the Guajira peninsula, is dry, including deserts where coal and naturalgas mining are the main economic activities.36
West of the Andes and along the Pacific coast is the Chocó Biogeográfico, a tropical rain for-est whose varied ecological, climatic, and geologic conditions are said to contain the highest bio-diversity concentration in the world. Deforestation and industrial development are the majorthreats to these forests, with the loss of these rich forests leading to greater erosion of coastalareas. Deforestation from lumbering is also significant in the jungles of Colombia’s Amazon re-gion.37
Colombia’s GDP in 2006 was $153 billion, with industry accounting for one-third of outputand 18 percent of employment; the main industrial products are textiles, food processing, oil, andbeverages. Commerce and services amount to more than half of the economy. Agriculture’s shareof the country’s economic activity is declining, and is now only 12 percent of GDP (the mainproducts are coffee, cut flowers, bananas, and rice), while mining accounts for 7 percent of GDP.38
The United States, Colombia’s main trading partner, receives 37 percent of the country’s exportsand provides 28 percent of its imports.39
Widespread social inequality and conflict have long been a reality in Colombia. Sixty percentof the population lives in poverty, with unemployment in the high double digits. As periodicallyreported in the world media, Colombia’s socio-political conflicts include the Americas’ longestlasting insurgency. Amidst these conditions, Colombia became the world’s leading grower of cocaand supplier of cocaine. Challenging living conditions for a large part of the population have ledto dense settlement in areas with higher vulnerability to natural disasters. These same areas willbe particularly vulnerable to climate change.The Caribbean coast includes several of the country’s largest cities and much of its economic
infrastructure, and generates 16 percent of Colombia’s GDP. Agriculture and cattle ranching areimportant economic activities of the region. Tourism is also important all along the coast, espe-cially in the colonial city of Cartagena and the Caribbean islands of San Andrés and Providencia,although tourism’s contribution to national GDP is only 2.3 percent.
21
FAC I NG C L IMATE CHANGE
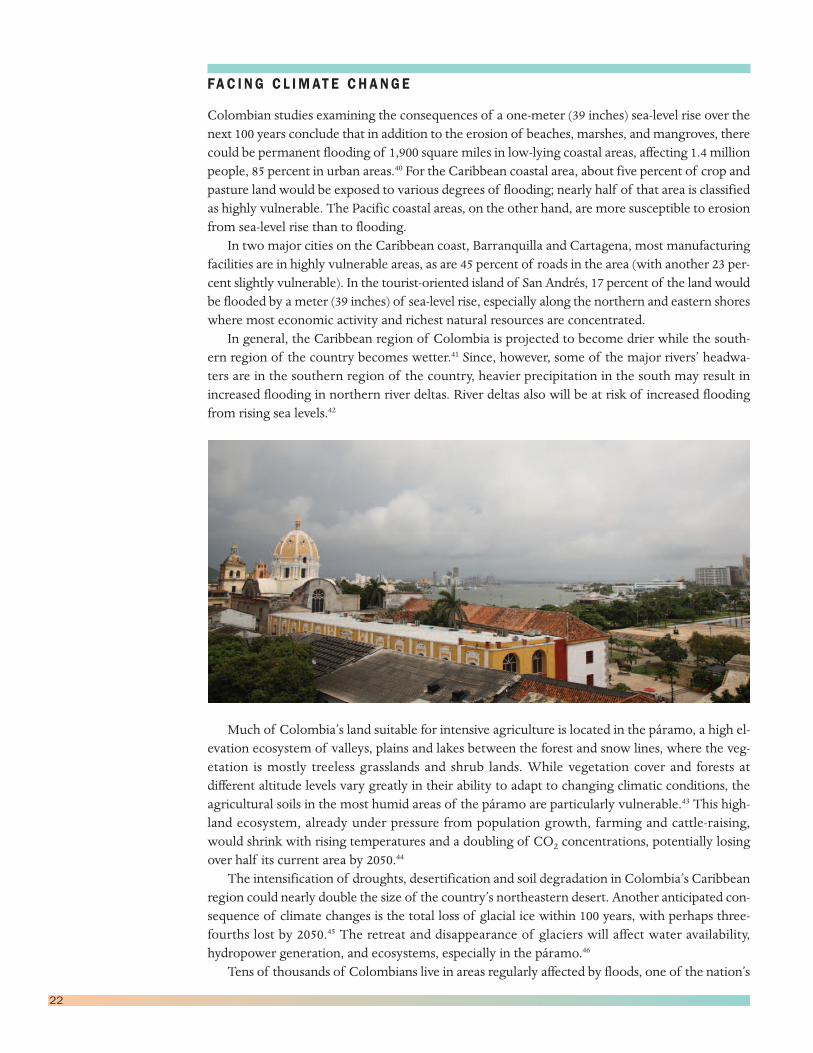
Colombian studies examining the consequences of a one-meter (39 inches) sea-level rise over thenext 100 years conclude that in addition to the erosion of beaches, marshes, and mangroves, therecould be permanent flooding of 1,900 square miles in low-lying coastal areas, affecting 1.4 millionpeople, 85 percent in urban areas.40 For the Caribbean coastal area, about five percent of crop andpasture land would be exposed to various degrees of flooding; nearly half of that area is classifiedas highly vulnerable. The Pacific coastal areas, on the other hand, are more susceptible to erosionfrom sea-level rise than to flooding.In two major cities on the Caribbean coast, Barranquilla and Cartagena, most manufacturing
facilities are in highly vulnerable areas, as are 45 percent of roads in the area (with another 23 per-cent slightly vulnerable). In the tourist-oriented island of San Andrés, 17 percent of the land wouldbe flooded by a meter (39 inches) of sea-level rise, especially along the northern and eastern shoreswhere most economic activity and richest natural resources are concentrated.In general, the Caribbean region of Colombia is projected to become drier while the south-
ern region of the country becomes wetter.41 Since, however, some of the major rivers’ headwa-ters are in the southern region of the country, heavier precipitation in the south may result inincreased flooding in northern river deltas. River deltas also will be at risk of increased floodingfrom rising sea levels.42
Much of Colombia’s land suitable for intensive agriculture is located in the páramo, a high el-evation ecosystem of valleys, plains and lakes between the forest and snow lines, where the veg-etation is mostly treeless grasslands and shrub lands. While vegetation cover and forests atdifferent altitude levels vary greatly in their ability to adapt to changing climatic conditions, theagricultural soils in the most humid areas of the páramo are particularly vulnerable.43 This high-land ecosystem, already under pressure from population growth, farming and cattle-raising,would shrink with rising temperatures and a doubling of CO2 concentrations, potentially losingover half its current area by 2050.44
The intensification of droughts, desertification and soil degradation in Colombia’s Caribbeanregion could nearly double the size of the country’s northeastern desert. Another anticipated con-sequence of climate changes is the total loss of glacial ice within 100 years, with perhaps three-fourths lost by 2050.45 The retreat and disappearance of glaciers will affect water availability,hydropower generation, and ecosystems, especially in the páramo.46
Tens of thousands of Colombians live in areas regularly affected by floods, one of the nation’s
22
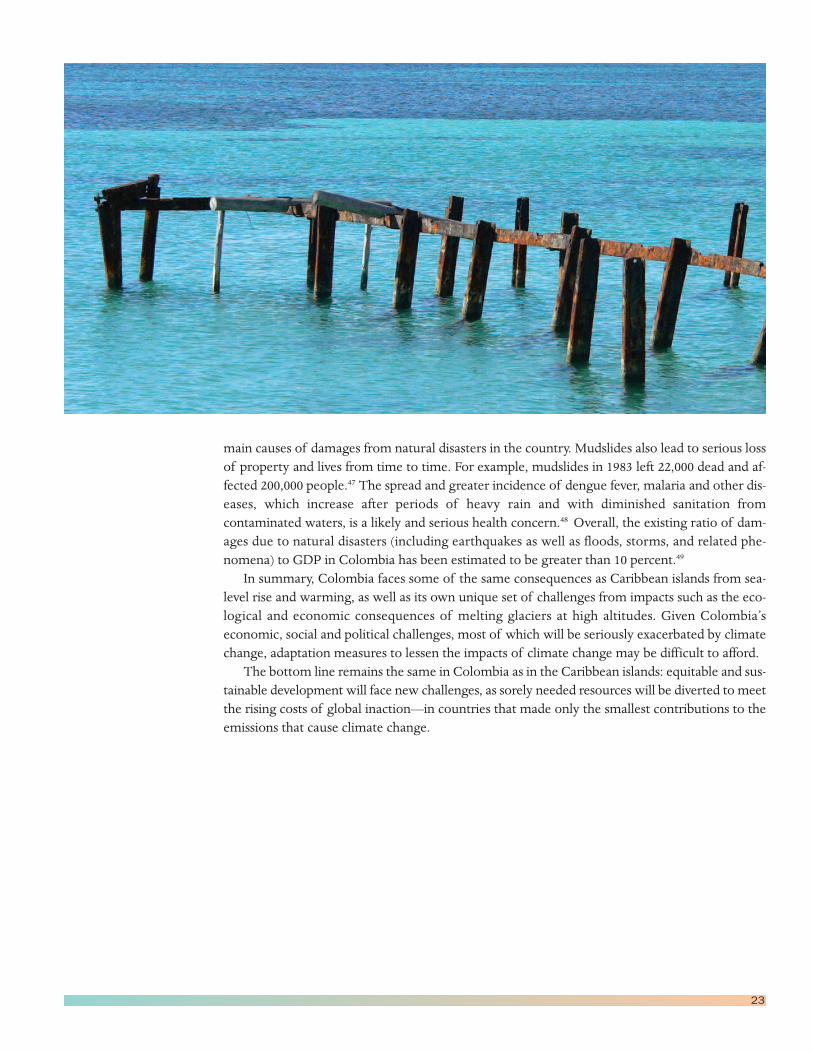
main causes of damages from natural disasters in the country. Mudslides also lead to serious lossof property and lives from time to time. For example, mudslides in 1983 left 22,000 dead and af-fected 200,000 people.47 The spread and greater incidence of dengue fever, malaria and other dis-eases, which increase after periods of heavy rain and with diminished sanitation fromcontaminated waters, is a likely and serious health concern.48 Overall, the existing ratio of dam-ages due to natural disasters (including earthquakes as well as floods, storms, and related phe-nomena) to GDP in Colombia has been estimated to be greater than 10 percent.49
In summary, Colombia faces some of the same consequences as Caribbean islands from sea-level rise and warming, as well as its own unique set of challenges from impacts such as the eco-logical and economic consequences of melting glaciers at high altitudes. Given Colombia’seconomic, social and political challenges, most of which will be seriously exacerbated by climatechange, adaptation measures to lessen the impacts of climate change may be difficult to afford.The bottom line remains the same in Colombia as in the Caribbean islands: equitable and sus-
tainable development will face new challenges, as sorely needed resources will be diverted to meetthe rising costs of global inaction—in countries that made only the smallest contributions to theemissions that cause climate change.
23
APPENDIX IMODEL RESULTS—ISLAND DETAIL
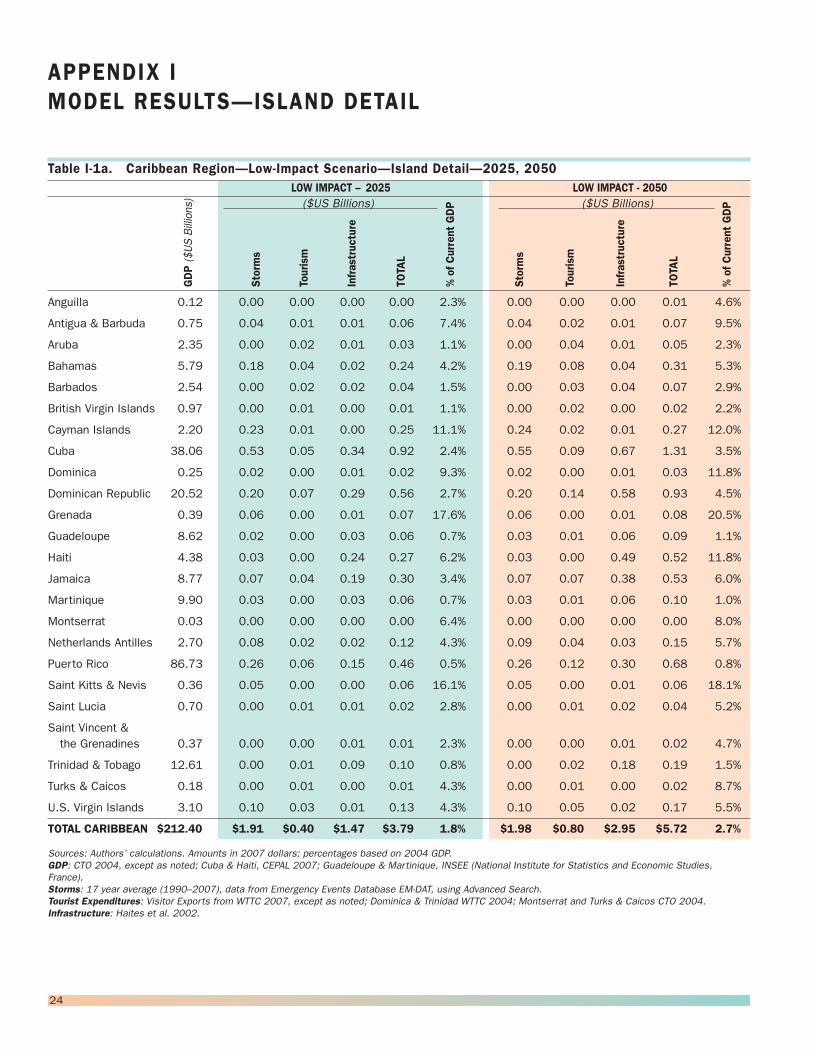
Table I-1a. Caribbean Region—Low-Impact Scenario—Island Detail—2025, 2050LOW IMPACT – 2025 LOW IMPACT - 2050
Anguilla 0.12 0.00 0.00 0.00 0.00 2.3% 0.00 0.00 0.00 0.01 4.6%
Antigua & Barbuda 0.75 0.04 0.01 0.01 0.06 7.4% 0.04 0.02 0.01 0.07 9.5%
Aruba 2.35 0.00 0.02 0.01 0.03 1.1% 0.00 0.04 0.01 0.05 2.3%
Bahamas 5.79 0.18 0.04 0.02 0.24 4.2% 0.19 0.08 0.04 0.31 5.3%
Barbados 2.54 0.00 0.02 0.02 0.04 1.5% 0.00 0.03 0.04 0.07 2.9%
British Virgin Islands 0.97 0.00 0.01 0.00 0.01 1.1% 0.00 0.02 0.00 0.02 2.2%
Cayman Islands 2.20 0.23 0.01 0.00 0.25 11.1% 0.24 0.02 0.01 0.27 12.0%
Cuba 38.06 0.53 0.05 0.34 0.92 2.4% 0.55 0.09 0.67 1.31 3.5%
Dominica 0.25 0.02 0.00 0.01 0.02 9.3% 0.02 0.00 0.01 0.03 11.8%
Dominican Republic 20.52 0.20 0.07 0.29 0.56 2.7% 0.20 0.14 0.58 0.93 4.5%
Grenada 0.39 0.06 0.00 0.01 0.07 17.6% 0.06 0.00 0.01 0.08 20.5%
Guadeloupe 8.62 0.02 0.00 0.03 0.06 0.7% 0.03 0.01 0.06 0.09 1.1%
Haiti 4.38 0.03 0.00 0.24 0.27 6.2% 0.03 0.00 0.49 0.52 11.8%
Jamaica 8.77 0.07 0.04 0.19 0.30 3.4% 0.07 0.07 0.38 0.53 6.0%
Martinique 9.90 0.03 0.00 0.03 0.06 0.7% 0.03 0.01 0.06 0.10 1.0%
Montserrat 0.03 0.00 0.00 0.00 0.00 6.4% 0.00 0.00 0.00 0.00 8.0%
Netherlands Antilles 2.70 0.08 0.02 0.02 0.12 4.3% 0.09 0.04 0.03 0.15 5.7%
Puerto Rico 86.73 0.26 0.06 0.15 0.46 0.5% 0.26 0.12 0.30 0.68 0.8%
Saint Kitts & Nevis 0.36 0.05 0.00 0.00 0.06 16.1% 0.05 0.00 0.01 0.06 18.1%
Saint Lucia 0.70 0.00 0.01 0.01 0.02 2.8% 0.00 0.01 0.02 0.04 5.2%
Saint Vincent &the Grenadines 0.37 0.00 0.00 0.01 0.01 2.3% 0.00 0.00 0.01 0.02 4.7%
Trinidad & Tobago 12.61 0.00 0.01 0.09 0.10 0.8% 0.00 0.02 0.18 0.19 1.5%
Turks & Caicos 0.18 0.00 0.01 0.00 0.01 4.3% 0.00 0.01 0.00 0.02 8.7%
U.S. Virgin Islands 3.10 0.10 0.03 0.01 0.13 4.3% 0.10 0.05 0.02 0.17 5.5%
TOTAL CARIBBEAN $212.40 $1.91 $0.40 $1.47 $3.79 1.8% $1.98 $0.80 $2.95 $5.72 2.7%
Sources: Authors’ calculations. Amounts in 2007 dollars; percentages based on 2004 GDP.GDP: CTO 2004, except as noted; Cuba & Haiti, CEPAL 2007; Guadeloupe & Martinique, INSEE (National Institute for Statistics and Economic Studies,France).Storms: 17 year average (1990–2007), data from Emergency Events Database EM-DAT, using Advanced Search.Tourist Expenditures: Visitor Exports from WTTC 2007, except as noted; Dominica & Trinidad WTTC 2004; Montserrat and Turks & Caicos CTO 2004.Infrastructure: Haites et al. 2002.
24
GDP($USBillions
)
Storms
Tourism
Infrastructure
TOTA
L
%of
Current
GDP
Storms
Tourism
Infrastructure
TOTA
L
%of
Current
GDP($US Billions) ($US Billions)

GDP($USBillions
)
Storms
Tourism
Infrastructure
TOTA
L
%of
Current
GDP
Storms
Tourism
Infrastructure
TOTA
L
%of
Current
GDP
Table I-1b. Caribbean Region—Low-Impact Scenario—Island Detail—2075, 2100LOW IMPACT – 2075 LOW IMPACT – 2100
Anguilla 0.12 0.00 0.01 0.00 0.01 7.0% 0.00 0.01 0.00 0.01 9.3%
Antigua & Barbuda 0.75 0.04 0.02 0.02 0.09 11.6% 0.05 0.03 0.03 0.10 13.7%
Aruba 2.35 0.00 0.06 0.02 0.08 3.4% 0.00 0.08 0.03 0.11 4.6%
Bahamas 5.79 0.19 0.12 0.06 0.37 6.4% 0.20 0.16 0.08 0.44 7.6%
Barbados 2.54 0.00 0.05 0.06 0.11 4.4% 0.00 0.07 0.08 0.15 5.8%
British Virgin Islands 0.97 0.00 0.03 0.00 0.03 3.2% 0.00 0.03 0.01 0.04 4.3%
Cayman Islands 2.20 0.25 0.03 0.01 0.28 12.9% 0.26 0.03 0.01 0.30 13.8%
Cuba 38.06 0.57 0.14 1.01 1.72 4.5% 0.58 0.19 1.34 2.12 5.6%
Dominica 0.25 0.02 0.00 0.02 0.04 14.4% 0.02 0.00 0.02 0.04 17.0%
Dominican Republic 20.52 0.21 0.21 0.88 1.30 6.3% 0.22 0.28 1.17 1.67 8.1%
Grenada 0.39 0.06 0.01 0.02 0.09 23.4% 0.07 0.01 0.03 0.10 26.2%
Guadeloupe 8.62 0.03 0.01 0.09 0.13 1.5% 0.03 0.01 0.12 0.16 1.9%
Haiti 4.38 0.03 0.01 0.73 0.76 17.4% 0.03 0.01 0.97 1.01 23.0%
Jamaica 8.77 0.08 0.11 0.57 0.76 8.6% 0.08 0.15 0.76 0.98 11.2%
Martinique 9.90 0.04 0.01 0.08 0.13 1.3% 0.04 0.02 0.11 0.16 1.6%
Montserrat 0.03 0.00 0.00 0.00 0.00 9.7% 0.00 0.00 0.00 0.00 11.3%
Netherlands Antilles 2.70 0.09 0.06 0.05 0.19 7.0% 0.09 0.07 0.06 0.23 8.4%
Puerto Rico 86.73 0.27 0.18 0.44 0.90 1.0% 0.28 0.24 0.59 1.11 1.3%
Saint Kitts & Nevis 0.36 0.06 0.01 0.01 0.07 20.0% 0.06 0.01 0.01 0.08 22.0%
Saint Lucia 0.70 0.00 0.02 0.03 0.05 7.6% 0.00 0.02 0.05 0.07 10.0%
Saint Vincent &the Grenadines 0.37 0.00 0.01 0.02 0.03 7.0% 0.00 0.01 0.03 0.03 9.3%
Trinidad & Tobago 12.61 0.00 0.02 0.26 0.29 2.3% 0.00 0.03 0.35 0.38 3.0%
Turks & Caicos 0.18 0.00 0.02 0.01 0.02 13.0% 0.00 0.02 0.01 0.03 17.3%
U.S. Virgin Islands 3.10 0.11 0.08 0.02 0.21 6.7% 0.11 0.10 0.03 0.25 7.9%
TOTAL CARIBBEAN $212.40 $2.04 $1.19 $4.42 $7.65 3.6% $2.10 $1.59 $5.90 $9.59 4.5%
Sources: Authors’ calculations. Amounts in 2007 dollars; percentages based on 2004 GDP.
25
($US Billions) ($US Billions)
GDP($USBillions
)
Storms
Tourism
Infrastructure
TOTA
L
%of
Current
GDP
Storms
Tourism
Infrastructure
TOTA
L
%of
Current
GDP
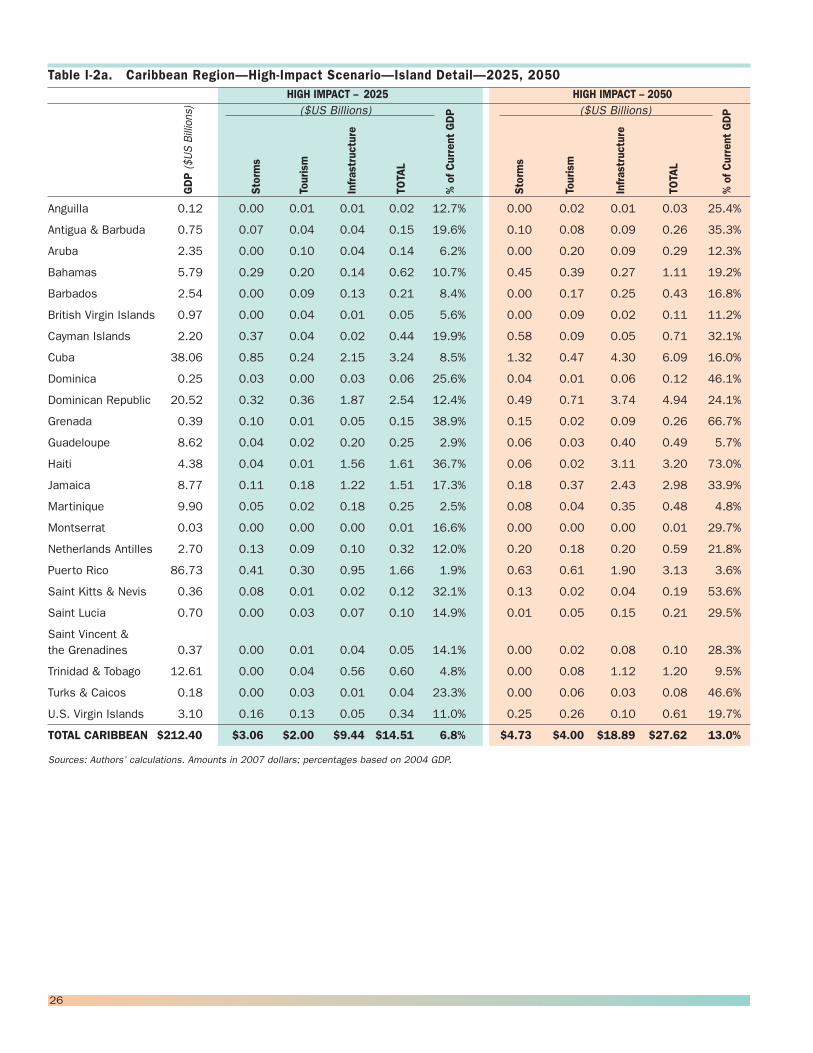
Table I-2a. Caribbean Region—High-Impact Scenario—Island Detail—2025, 2050HIGH IMPACT – 2025 HIGH IMPACT – 2050
Anguilla 0.12 0.00 0.01 0.01 0.02 12.7% 0.00 0.02 0.01 0.03 25.4%
Antigua & Barbuda 0.75 0.07 0.04 0.04 0.15 19.6% 0.10 0.08 0.09 0.26 35.3%
Aruba 2.35 0.00 0.10 0.04 0.14 6.2% 0.00 0.20 0.09 0.29 12.3%
Bahamas 5.79 0.29 0.20 0.14 0.62 10.7% 0.45 0.39 0.27 1.11 19.2%
Barbados 2.54 0.00 0.09 0.13 0.21 8.4% 0.00 0.17 0.25 0.43 16.8%
British Virgin Islands 0.97 0.00 0.04 0.01 0.05 5.6% 0.00 0.09 0.02 0.11 11.2%
Cayman Islands 2.20 0.37 0.04 0.02 0.44 19.9% 0.58 0.09 0.05 0.71 32.1%
Cuba 38.06 0.85 0.24 2.15 3.24 8.5% 1.32 0.47 4.30 6.09 16.0%
Dominica 0.25 0.03 0.00 0.03 0.06 25.6% 0.04 0.01 0.06 0.12 46.1%
Dominican Republic 20.52 0.32 0.36 1.87 2.54 12.4% 0.49 0.71 3.74 4.94 24.1%
Grenada 0.39 0.10 0.01 0.05 0.15 38.9% 0.15 0.02 0.09 0.26 66.7%
Guadeloupe 8.62 0.04 0.02 0.20 0.25 2.9% 0.06 0.03 0.40 0.49 5.7%
Haiti 4.38 0.04 0.01 1.56 1.61 36.7% 0.06 0.02 3.11 3.20 73.0%
Jamaica 8.77 0.11 0.18 1.22 1.51 17.3% 0.18 0.37 2.43 2.98 33.9%
Martinique 9.90 0.05 0.02 0.18 0.25 2.5% 0.08 0.04 0.35 0.48 4.8%
Montserrat 0.03 0.00 0.00 0.00 0.01 16.6% 0.00 0.00 0.00 0.01 29.7%
Netherlands Antilles 2.70 0.13 0.09 0.10 0.32 12.0% 0.20 0.18 0.20 0.59 21.8%
Puerto Rico 86.73 0.41 0.30 0.95 1.66 1.9% 0.63 0.61 1.90 3.13 3.6%
Saint Kitts & Nevis 0.36 0.08 0.01 0.02 0.12 32.1% 0.13 0.02 0.04 0.19 53.6%
Saint Lucia 0.70 0.00 0.03 0.07 0.10 14.9% 0.01 0.05 0.15 0.21 29.5%
Saint Vincent &the Grenadines 0.37 0.00 0.01 0.04 0.05 14.1% 0.00 0.02 0.08 0.10 28.3%
Trinidad & Tobago 12.61 0.00 0.04 0.56 0.60 4.8% 0.00 0.08 1.12 1.20 9.5%
Turks & Caicos 0.18 0.00 0.03 0.01 0.04 23.3% 0.00 0.06 0.03 0.08 46.6%
U.S. Virgin Islands 3.10 0.16 0.13 0.05 0.34 11.0% 0.25 0.26 0.10 0.61 19.7%
TOTAL CARIBBEAN $212.40 $3.06 $2.00 $9.44 $14.51 6.8% $4.73 $4.00 $18.89 $27.62 13.0%
Sources: Authors’ calculations. Amounts in 2007 dollars; percentages based on 2004 GDP.
26
($US Billions) ($US Billions)
GDP($USBillions
)
Storms
Tourism
Infrastructure
TOTA
L
%of
Current
GDP
Storms
Tourism
Infrastructure
TOTA
L
%of
Current
GDP
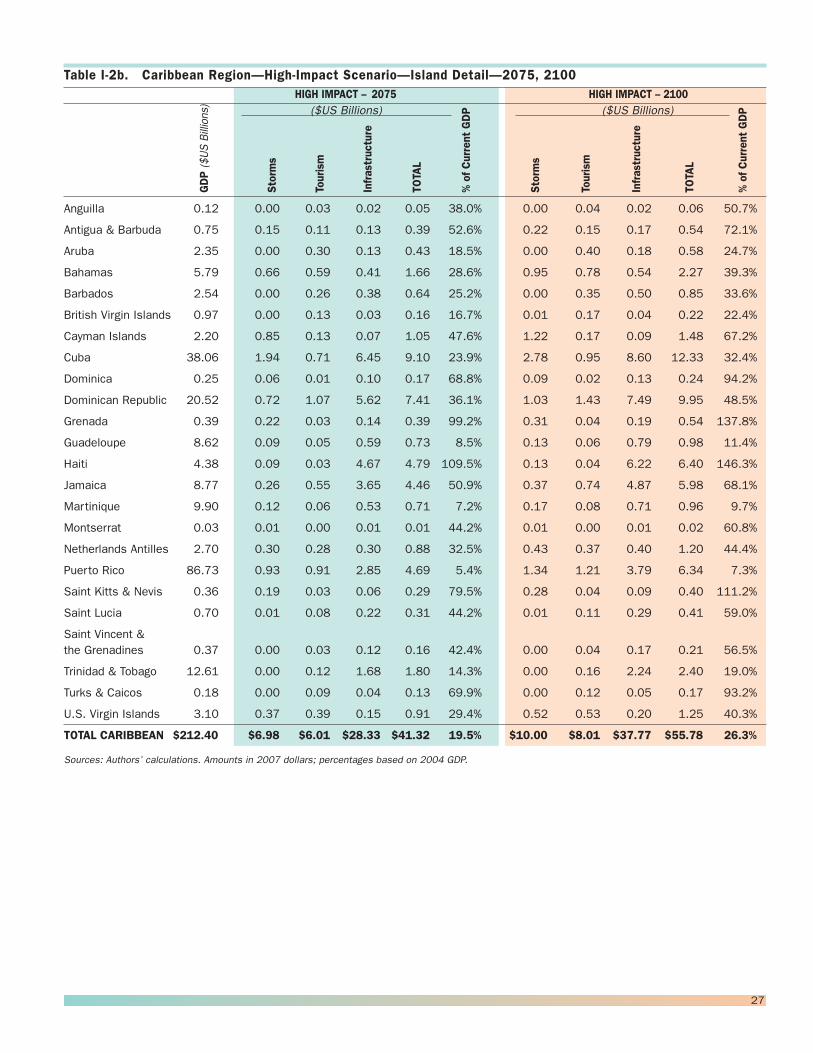
Table I-2b. Caribbean Region—High-Impact Scenario—Island Detail—2075, 2100HIGH IMPACT – 2075 HIGH IMPACT – 2100
Anguilla 0.12 0.00 0.03 0.02 0.05 38.0% 0.00 0.04 0.02 0.06 50.7%
Antigua & Barbuda 0.75 0.15 0.11 0.13 0.39 52.6% 0.22 0.15 0.17 0.54 72.1%
Aruba 2.35 0.00 0.30 0.13 0.43 18.5% 0.00 0.40 0.18 0.58 24.7%
Bahamas 5.79 0.66 0.59 0.41 1.66 28.6% 0.95 0.78 0.54 2.27 39.3%
Barbados 2.54 0.00 0.26 0.38 0.64 25.2% 0.00 0.35 0.50 0.85 33.6%
British Virgin Islands 0.97 0.00 0.13 0.03 0.16 16.7% 0.01 0.17 0.04 0.22 22.4%
Cayman Islands 2.20 0.85 0.13 0.07 1.05 47.6% 1.22 0.17 0.09 1.48 67.2%
Cuba 38.06 1.94 0.71 6.45 9.10 23.9% 2.78 0.95 8.60 12.33 32.4%
Dominica 0.25 0.06 0.01 0.10 0.17 68.8% 0.09 0.02 0.13 0.24 94.2%
Dominican Republic 20.52 0.72 1.07 5.62 7.41 36.1% 1.03 1.43 7.49 9.95 48.5%
Grenada 0.39 0.22 0.03 0.14 0.39 99.2% 0.31 0.04 0.19 0.54 137.8%
Guadeloupe 8.62 0.09 0.05 0.59 0.73 8.5% 0.13 0.06 0.79 0.98 11.4%
Haiti 4.38 0.09 0.03 4.67 4.79 109.5% 0.13 0.04 6.22 6.40 146.3%
Jamaica 8.77 0.26 0.55 3.65 4.46 50.9% 0.37 0.74 4.87 5.98 68.1%
Martinique 9.90 0.12 0.06 0.53 0.71 7.2% 0.17 0.08 0.71 0.96 9.7%
Montserrat 0.03 0.01 0.00 0.01 0.01 44.2% 0.01 0.00 0.01 0.02 60.8%
Netherlands Antilles 2.70 0.30 0.28 0.30 0.88 32.5% 0.43 0.37 0.40 1.20 44.4%
Puerto Rico 86.73 0.93 0.91 2.85 4.69 5.4% 1.34 1.21 3.79 6.34 7.3%
Saint Kitts & Nevis 0.36 0.19 0.03 0.06 0.29 79.5% 0.28 0.04 0.09 0.40 111.2%
Saint Lucia 0.70 0.01 0.08 0.22 0.31 44.2% 0.01 0.11 0.29 0.41 59.0%
Saint Vincent &the Grenadines 0.37 0.00 0.03 0.12 0.16 42.4% 0.00 0.04 0.17 0.21 56.5%
Trinidad & Tobago 12.61 0.00 0.12 1.68 1.80 14.3% 0.00 0.16 2.24 2.40 19.0%
Turks & Caicos 0.18 0.00 0.09 0.04 0.13 69.9% 0.00 0.12 0.05 0.17 93.2%
U.S. Virgin Islands 3.10 0.37 0.39 0.15 0.91 29.4% 0.52 0.53 0.20 1.25 40.3%
TOTAL CARIBBEAN $212.40 $6.98 $6.01 $28.33 $41.32 19.5% $10.00 $8.01 $37.77 $55.78 26.3%
Sources: Authors’ calculations. Amounts in 2007 dollars; percentages based on 2004 GDP.
27
($US Billions) ($US Billions)
APPENDIX IITECHNICAL NOTES ON THE MODEL
SEA - L E V E L R I S E
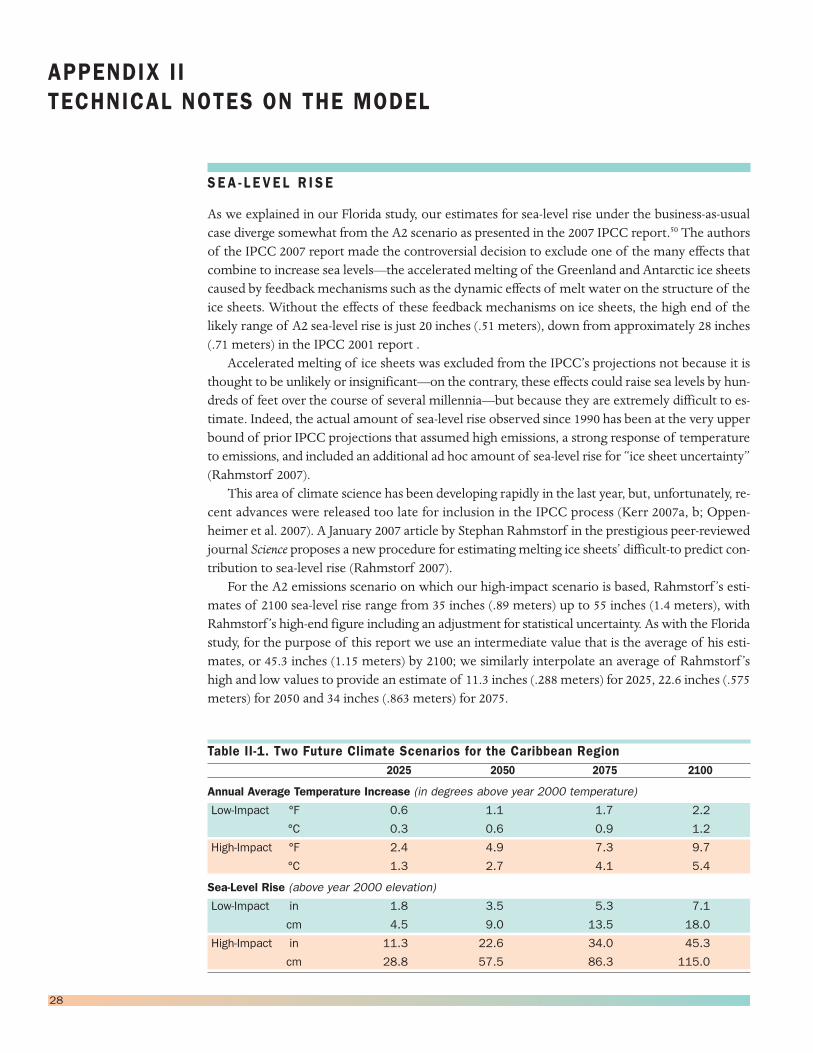
As we explained in our Florida study, our estimates for sea-level rise under the business-as-usualcase diverge somewhat from the A2 scenario as presented in the 2007 IPCC report.50 The authorsof the IPCC 2007 report made the controversial decision to exclude one of the many effects thatcombine to increase sea levels—the accelerated melting of the Greenland and Antarctic ice sheetscaused by feedback mechanisms such as the dynamic effects of melt water on the structure of theice sheets. Without the effects of these feedback mechanisms on ice sheets, the high end of thelikely range of A2 sea-level rise is just 20 inches (.51 meters), down from approximately 28 inches(.71 meters) in the IPCC 2001 report .
Accelerated melting of ice sheets was excluded from the IPCC’s projections not because it isthought to be unlikely or insignificant—on the contrary, these effects could raise sea levels by hun-dreds of feet over the course of several millennia—but because they are extremely difficult to es-timate. Indeed, the actual amount of sea-level rise observed since 1990 has been at the very upperbound of prior IPCC projections that assumed high emissions, a strong response of temperatureto emissions, and included an additional ad hoc amount of sea-level rise for “ice sheet uncertainty”(Rahmstorf 2007).
This area of climate science has been developing rapidly in the last year, but, unfortunately, re-cent advances were released too late for inclusion in the IPCC process (Kerr 2007a, b; Oppen-heimer et al. 2007). A January 2007 article by Stephan Rahmstorf in the prestigious peer-reviewedjournal Science proposes a new procedure for estimating melting ice sheets’ difficult-to predict con-tribution to sea-level rise (Rahmstorf 2007).
For the A2 emissions scenario on which our high-impact scenario is based, Rahmstorf ’s esti-mates of 2100 sea-level rise range from 35 inches (.89 meters) up to 55 inches (1.4 meters), withRahmstorf ’s high-end figure including an adjustment for statistical uncertainty. As with the Floridastudy, for the purpose of this report we use an intermediate value that is the average of his esti-mates, or 45.3 inches (1.15 meters) by 2100; we similarly interpolate an average of Rahmstorf ’shigh and low values to provide an estimate of 11.3 inches (.288 meters) for 2025, 22.6 inches (.575meters) for 2050 and 34 inches (.863 meters) for 2075.
Table II-1. Two Future Climate Scenarios for the Caribbean Region2025 2050 2075 2100
Annual Average Temperature Increase (in degrees above year 2000 temperature)
Low-Impact °F 0.6 1.1 1.7 2.2
°C 0.3 0.6 0.9 1.2
High-Impact °F 2.4 4.9 7.3 9.7
°C 1.3 2.7 4.1 5.4
Sea-Level Rise (above year 2000 elevation)
Low-Impact in 1.8 3.5 5.3 7.1
cm 4.5 9.0 13.5 18.0
High-Impact in 11.3 22.6 34.0 45.3
cm 28.8 57.5 86.3 115.0
28
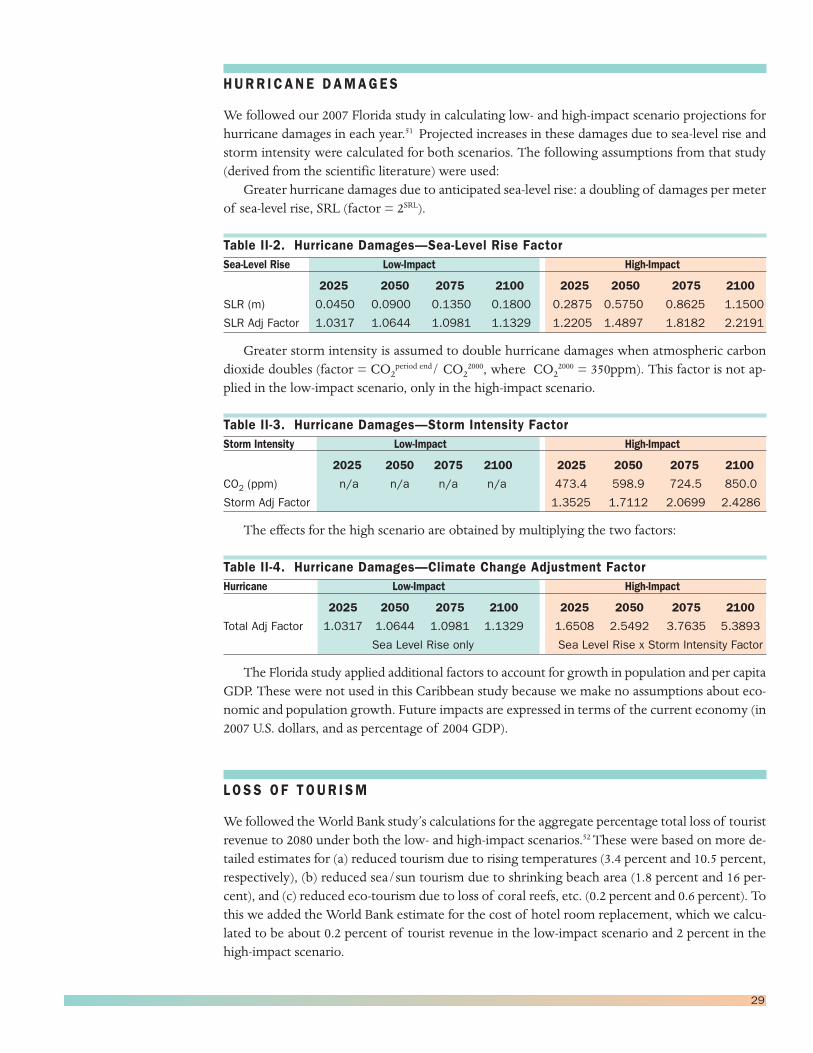
HURR I CANE DAMAGES
We followed our 2007 Florida study in calculating low- and high-impact scenario projections forhurricane damages in each year.51 Projected increases in these damages due to sea-level rise andstorm intensity were calculated for both scenarios. The following assumptions from that study(derived from the scientific literature) were used:Greater hurricane damages due to anticipated sea-level rise: a doubling of damages per meter
of sea-level rise, SRL (factor = 2SRL).
Table II-2. Hurricane Damages—Sea-Level Rise FactorSea-Level Rise Low-Impact High-Impact
2025 2050 2075 2100 2025 2050 2075 2100
SLR (m) 0.0450 0.0900 0.1350 0.1800 0.2875 0.5750 0.8625 1.1500
SLR Adj Factor 1.0317 1.0644 1.0981 1.1329 1.2205 1.4897 1.8182 2.2191
Greater storm intensity is assumed to double hurricane damages when atmospheric carbondioxide doubles (factor = CO2
period end/ CO22000, where CO2
2000 = 350ppm). This factor is not ap-plied in the low-impact scenario, only in the high-impact scenario.
Table II-3. Hurricane Damages—Storm Intensity FactorStorm Intensity Low-Impact High-Impact
2025 2050 2075 2100 2025 2050 2075 2100
CO2 (ppm) n/a n/a n/a n/a 473.4 598.9 724.5 850.0
Storm Adj Factor 1.3525 1.7112 2.0699 2.4286
The effects for the high scenario are obtained by multiplying the two factors:
Table II-4. Hurricane Damages—Climate Change Adjustment FactorHurricane Low-Impact High-Impact
2025 2050 2075 2100 2025 2050 2075 2100
Total Adj Factor 1.0317 1.0644 1.0981 1.1329 1.6508 2.5492 3.7635 5.3893
Sea Level Rise only Sea Level Rise x Storm Intensity Factor
The Florida study applied additional factors to account for growth in population and per capitaGDP. These were not used in this Caribbean study because we make no assumptions about eco-nomic and population growth. Future impacts are expressed in terms of the current economy (in2007 U.S. dollars, and as percentage of 2004 GDP).
L OSS OF TOUR I SM
We followed theWorld Bank study’s calculations for the aggregate percentage total loss of touristrevenue to 2080 under both the low- and high-impact scenarios.52 These were based on more de-tailed estimates for (a) reduced tourism due to rising temperatures (3.4 percent and 10.5 percent,respectively), (b) reduced sea/sun tourism due to shrinking beach area (1.8 percent and 16 per-cent), and (c) reduced eco-tourism due to loss of coral reefs, etc. (0.2 percent and 0.6 percent). Tothis we added the World Bank estimate for the cost of hotel room replacement, which we calcu-lated to be about 0.2 percent of tourist revenue in the low-impact scenario and 2 percent in thehigh-impact scenario.
29
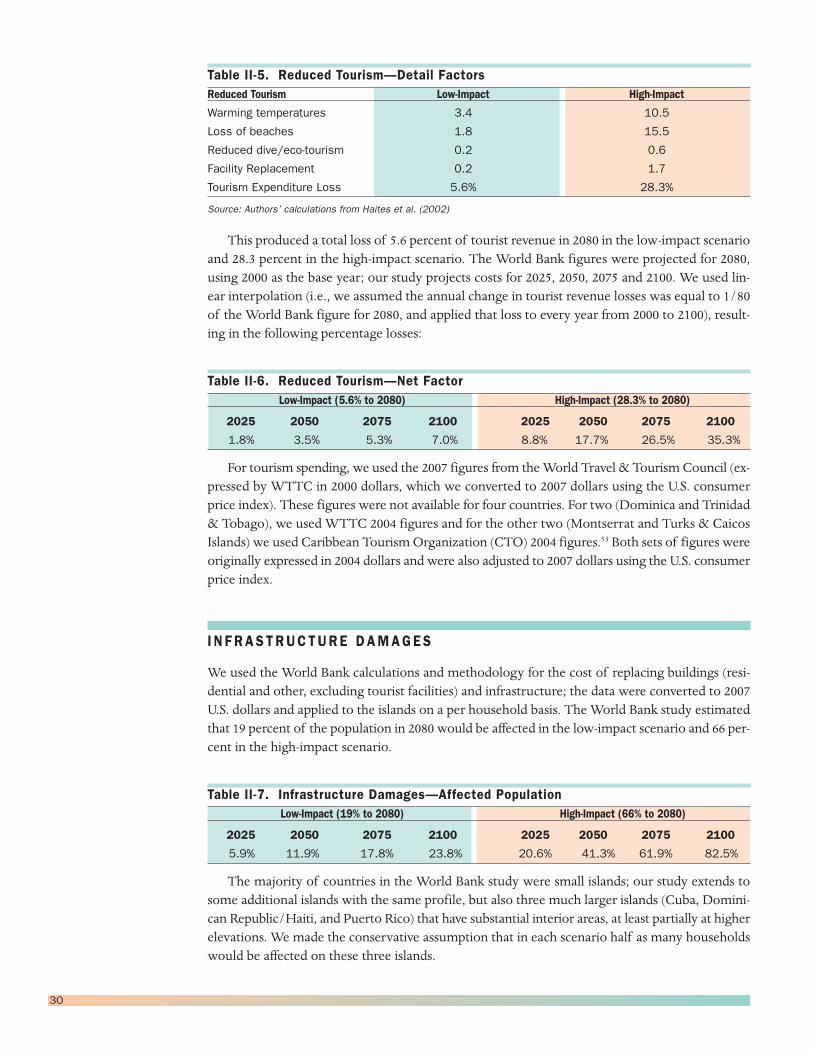
30
Table II-5. Reduced Tourism—Detail FactorsReduced Tourism Low-Impact High-Impact
Warming temperatures 3.4 10.5
Loss of beaches 1.8 15.5
Reduced dive/eco-tourism 0.2 0.6
Facility Replacement 0.2 1.7
Tourism Expenditure Loss 5.6% 28.3%
Source: Authors’ calculations from Haites et al. (2002)
This produced a total loss of 5.6 percent of tourist revenue in 2080 in the low-impact scenarioand 28.3 percent in the high-impact scenario. The World Bank figures were projected for 2080,using 2000 as the base year; our study projects costs for 2025, 2050, 2075 and 2100. We used lin-ear interpolation (i.e., we assumed the annual change in tourist revenue losses was equal to 1/80of the World Bank figure for 2080, and applied that loss to every year from 2000 to 2100), result-ing in the following percentage losses:
Table II-6. Reduced Tourism—Net FactorLow-Impact (5.6% to 2080) High-Impact (28.3% to 2080)
2025 2050 2075 2100 2025 2050 2075 2100
1.8% 3.5% 5.3% 7.0% 8.8% 17.7% 26.5% 35.3%
For tourism spending, we used the 2007 figures from theWorld Travel & Tourism Council (ex-pressed by WTTC in 2000 dollars, which we converted to 2007 dollars using the U.S. consumerprice index). These figures were not available for four countries. For two (Dominica and Trinidad& Tobago), we used WTTC 2004 figures and for the other two (Montserrat and Turks & CaicosIslands) we used Caribbean Tourism Organization (CTO) 2004 figures.53 Both sets of figures wereoriginally expressed in 2004 dollars and were also adjusted to 2007 dollars using the U.S. consumerprice index.
I N FRAS TRUCTURE DAMAGES
We used the World Bank calculations and methodology for the cost of replacing buildings (resi-dential and other, excluding tourist facilities) and infrastructure; the data were converted to 2007U.S. dollars and applied to the islands on a per household basis. The World Bank study estimatedthat 19 percent of the population in 2080 would be affected in the low-impact scenario and 66 per-cent in the high-impact scenario.
Table II-7. Infrastructure Damages—Affected PopulationLow-Impact (19% to 2080) High-Impact (66% to 2080)
2025 2050 2075 2100 2025 2050 2075 2100
5.9% 11.9% 17.8% 23.8% 20.6% 41.3% 61.9% 82.5%
The majority of countries in the World Bank study were small islands; our study extends tosome additional islands with the same profile, but also three much larger islands (Cuba, Domini-can Republic/Haiti, and Puerto Rico) that have substantial interior areas, at least partially at higherelevations. We made the conservative assumption that in each scenario half as many householdswould be affected on these three islands.
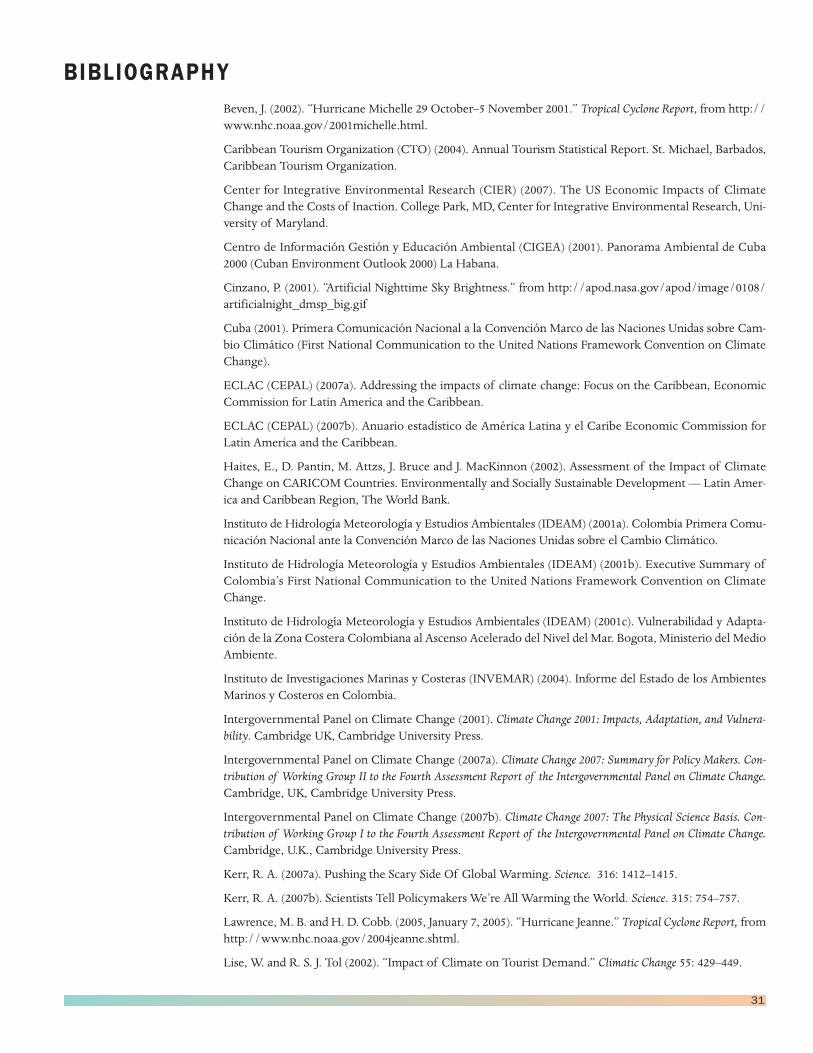
BIBLIOGRAPHYBeven, J. (2002). “Hurricane Michelle 29 October–5 November 2001.” Tropical Cyclone Report, from http://www.nhc.noaa.gov/2001michelle.html.
Caribbean Tourism Organization (CTO) (2004). Annual Tourism Statistical Report. St. Michael, Barbados,Caribbean Tourism Organization.
Center for Integrative Environmental Research (CIER) (2007). The US Economic Impacts of ClimateChange and the Costs of Inaction. College Park, MD, Center for Integrative Environmental Research, Uni-versity of Maryland.
Centro de Información Gestión y Educación Ambiental (CIGEA) (2001). Panorama Ambiental de Cuba2000 (Cuban Environment Outlook 2000) La Habana.
Cinzano, P. (2001). “Artificial Nighttime Sky Brightness.” from http://apod.nasa.gov/apod/image/0108/artificialnight_dmsp_big.gif
Cuba (2001). Primera Comunicación Nacional a la Convención Marco de las Naciones Unidas sobre Cam-bio Climático (First National Communication to the United Nations Framework Convention on ClimateChange).
ECLAC (CEPAL) (2007a). Addressing the impacts of climate change: Focus on the Caribbean, EconomicCommission for Latin America and the Caribbean.
ECLAC (CEPAL) (2007b). Anuario estadístico de América Latina y el Caribe Economic Commission forLatin America and the Caribbean.
Haites, E., D. Pantin, M. Attzs, J. Bruce and J. MacKinnon (2002). Assessment of the Impact of ClimateChange on CARICOM Countries. Environmentally and Socially Sustainable Development — Latin Amer-ica and Caribbean Region, The World Bank.
Instituto de Hidrología Meteorología y Estudios Ambientales (IDEAM) (2001a). Colombia Primera Comu-nicación Nacional ante la Convención Marco de las Naciones Unidas sobre el Cambio Climático.
Instituto de Hidrología Meteorología y Estudios Ambientales (IDEAM) (2001b). Executive Summary ofColombia’s First National Communication to the United Nations Framework Convention on ClimateChange.
Instituto de Hidrología Meteorología y Estudios Ambientales (IDEAM) (2001c). Vulnerabilidad y Adapta-ción de la Zona Costera Colombiana al Ascenso Acelerado del Nivel del Mar. Bogota, Ministerio del MedioAmbiente.
Instituto de Investigaciones Marinas y Costeras (INVEMAR) (2004). Informe del Estado de los AmbientesMarinos y Costeros en Colombia.
Intergovernmental Panel on Climate Change (2001). Climate Change 2001: Impacts, Adaptation, and Vulnera-bility. Cambridge UK, Cambridge University Press.
Intergovernmental Panel on Climate Change (2007a). Climate Change 2007: Summary for Policy Makers. Con-tribution of Working Group II to the Fourth Assessment Report of the Intergovernmental Panel on Climate Change.Cambridge, UK, Cambridge University Press.
Intergovernmental Panel on Climate Change (2007b). Climate Change 2007: The Physical Science Basis. Con-tribution of Working Group I to the Fourth Assessment Report of the Intergovernmental Panel on Climate Change.Cambridge, U.K., Cambridge University Press.
Kerr, R. A. (2007a). Pushing the Scary Side Of Global Warming. Science. 316: 1412–1415.
Kerr, R. A. (2007b). Scientists Tell Policymakers We’re All Warming the World. Science. 315: 754–757.
Lawrence, M. B. and H. D. Cobb. (2005, January 7, 2005). “Hurricane Jeanne.” Tropical Cyclone Report, fromhttp://www.nhc.noaa.gov/2004jeanne.shtml.
Lise, W. and R. S. J. Tol (2002). “Impact of Climate on Tourist Demand.” Climatic Change 55: 429–449.
31
Nagy, Caffera and Aparicio-Barrenechea (2006). Understanding the potential impact of Climate Change andVulnerability in Latin America and the Caribbean.
National Oceanic & Atmospheric Administration. (2007, October 22). “Ocean and Coastal Management inPuerto Rico.” Ocean and Coastal Resource Management, from http://coastalmanagement.noaa.gov/mystate/p_rico.html.
Oppenheimer, M., B. C. O’Neill, M. Webster and S. Agrawala (2007). CLIMATE CHANGE: The Limits ofConsensus. Science. 317: 1505–1506.
Rahmstorf, S. (2007). A Semi-Empirical Approach to Projecting Future Sea-Level Rise. Science. 315: 368–370.
Stanton, E. A. and F. Ackerman (2007). Florida and Climate Change: The Costs of Inaction. Medford, MA,Tufts University Global Development and Environment Institute and Stockholm Environment Institute—US Center.
The World Bank (2000). HIV/AIDS in the Caribbean: Issues and Options. A Background Report HumanDevelopment and Sector Management Unit Latin America and the Caribbean Region. The World Bank.
Toba, N. (2007). Economic Impacts of Climate Change on Caribbean Community — DRAFT. Environ-mentally and Socially Sustainable Development — Latin America and Caribbean Region, TheWorld Bank.
Trotz, U. O. D. (2008). “Climate Change and Development in the Caribbean Sub-Region.” Caribbean Com-munity Climate Change Center
U.S. Geological Survey. (2006). “Fact Sheet (Puerto Rico) FS-051-96,” from http://pubs.usgs.gov/fs/FS-051-96/.
United Nations Environment Programme (PNUMA) (2005). Perspectivas del medio ambiente en el Caribe.Nairobi, United Nations Environment Programme.
Uyarra, M., I. M. Cote, J. A. Gill, R. R. T. Tinch, D. Viner and A. R.Watkinson (2005). “Island-specific pref-erences of tourists for environmental features: implications of climate change for tourism-dependentstates.” Environmental Conservation 32(1): 11–19.
Vergara, W. (2005). Adapting to Climate Change: Lessons Learned, Work in Progress, and Proposed NextSteps for the World Bank in Latin America. Latin America and Caribbean Region, Environmentally and SociallySustainable Development Department. The World Bank.
Vergara, W. (2007). Visalizing Future Climate in Latin America: Results for the application of the Earth Sim-ulator. The World Bank.
Wilkinson, C. and D. Souter (2008). Status of Caribbean coral reefs after bleaching and hurricanes in 2005.Townsville, Australia, Global Coral Reef Monitoring Network–Reef and Rainforest Research Center.
World Rainforest Movement. (2001). “The Colombian Chocó: Amegadiverse region in a megadiverse coun-try . . . for how long?” from http://www.wrm.org.uy/bulletin/44/Colombia.html.
World Travel and Tourism Council (WTTC) (2004). The Caribbean: The Impact of Travel & Tourism onJobs and the Economy.
World Travel and Tourism Council (WTTC) (2008). “Tourism Satellite Accounting Tool—Visitor Exportsby country in 2007.” from http://www.wttc.travel/eng/Tourism_Research/Tourism_Satellite_Accounting_Tool/.
World Wildlife Fund. (2001). “Chocó-Darién moist forests (NT0115).” from http://www.wwfus.org/wildworld/profiles/terrestrial/nt/nt0115_full.html.
Zapata Marti, R. (2006). Los efectos de los desastres en 2004 y 2005: la necesidad de adaptacion de largoplazo. Estudios y perspectivas, CEPAL.
32
NOTES1 IPCC (2007a).2 Though the regional average per capita GDP among the Caribbean island nations and dependencies
is above $5,000 in 2007, more than 80 percent of the region’s population of roughly 40 million lives in coun-tries whose per capita GDP is below that figure. There is significant inequality both within and between in-dividual Caribbean countries.
3 For Caribbean nations’ debt burden see the World Bank’s Development Data and Statistics, “GlobalDevelopment Finance,” http://www.worldbank.org.
4 “Higher prevalence rates are found only in sub-Saharan Africa, making the Caribbean the second-most affected region in the world.” http://www.avert.org/caribbean.htm. See also TheWorld Bank (2000).
5 Wilkinson and Souter (2008).6 WTTC (2004) , amounts in 2004 dollars.7 Lise and Tol (2002).8 Uyarra et al. (2005).9 PNUMA (2005).10 For Caribbean nations’ emissions of greenhouse gases see UNDP (2007) Human Development Re-
port 2007/2008. Table 24 “Carbon dioxide emissions and stocks.” http://www.undp.org.11 Trotz (2008); ECLAC (2007a).12 Haites et al. (2002). After the publication of the IPCC’s Fourth Assessment Report (2007b), theWorld
Bank commissioned an update to the Haites study, with completion expected in 2009. The draft of the up-date available at the time of this writing (Toba 2007) did not include key features such as high and low cli-mate impact scenarios. The CARICOM (Caribbean Community and Common Market) countries in thatstudy included the islands of Antigua & Barbuda, The Bahamas, Barbados, Dominica, Grenada, Jamaica,St. Kitts & Nevis, St. Lucia, St. Vincent & the Grenadines, Trinidad & Tobago plus the continental coun-tries of Belize and Guyana (Haiti and Monserrat became members of CARICOM after the World Bankstudy was conducted). For Florida, see Stanton and Ackerman (2007).
13 Our report includes the 10 islands in the World Bank study and these 14 additional island countriesor dependencies: Anguilla, Aruba, British Virgin Islands, Cayman Islands, Cuba, Dominican Republic,Guadeloupe, Haiti, Martinique, Montserrat, Netherlands Antilles, Puerto Rico, Turks & Caicos and U.S.Virgin Islands.
14 We have omitted some impact categories included in Haites et al. (2002), for which the monetaryestimates were very small.
15 The data come from the EM-DAT database compiled by the Centre for Research on the Epidemi-ology of Disasters (CRED), Université Catholique de Louvain, Brussels, Belgium. These data may under-state actual storm damages, but we were unable to explore other complementary sources in greater detailwithin the scope of this report.
16 WTTC (2008).17 Geometry dictates that larger islands have a smaller fraction of their land area as coastline compared
to smaller islands.18 ECLAC, 25 November 2004. “Hurricane season in the Caribbean causes more than US$2.2 billion
in losses.” http://www.eclac.org/cgi-bin/getProd.asp?xml=/prensa/noticias/comunicados/1/20371/P20371.xml&xsl=/prensa/tpl-i/p6f.xsl&base=/prensa/tpl-i/top-bottom.xsl.
19 Lawrence and Cobb (2005).20 Cinzano (2001).21 http://www.gobierno.pr/GPRPortal/Inicio/PuertoRico/.22 Government Development Bank for Puerto Rico, Puerto Rico Fact Sheet (http://www.gdb-pur
.com/economy/factsheet/documents/PR.Eco.Fact.Sheet.pdf ).23 NOAA (2007). See also the on-line documents from the May 8-10, 2007 roundtable of experts “Fac-
ing the Consequences of Climate Change in Puerto Rico,” organized by The University of Puerto Rico atMayagüez (UPRM): http://academic.uprm.edu/abe/ClimateChangePR.
24 University of Arizona, Department of Geosciences, Environmental Studies Laboratory http://geongrid.geo.arizona.edu/arcims/website/slrus48prvi/viewer.htm), has mapped the effect of sea-level rise be-tween 1 and 6 meters.
25 CIER (2007).
33
26 USGS (2006) documents an example of the interplay and destructive feedback cycle between humancoastal development and accelerated shoreline erosion rates near Rincón, in western Puerto Rico, notinghow stabilization responses via structures like seawalls, “may result in the rapid destruction of localbeaches”.
27 Cuban Census, Table II.4 (www.cubagov.cu/oltras_info/censo/publacion.htm).28 Climate descriptions (prior to 2001) are based on Cuba (2001).29 Beven (2002) “Michelle was the strongest hurricane to hit Cuba since Hurricane Fox in October 1952.
Preliminary reports from the government of Cuba indicate widespread damage over the central and west-ern parts of the island, with the provinces of Matanzas, Villa Clara, and Cienfuegos the hardest hit. Tenthousand homes were reported destroyed with another 100,000 others damaged. Additional damage oc-curred to as yet uncounted businesses and other structures. Severe damage was also reported to the sugarcane crop near the path of the storm.” Five deaths were reported.
30 Agence France-Presse, Havana, Nov 8, 2007, reported “[t]he worst flooding in 40 years in Cuba hasleft one person dead and almost 500 million dollars in damages, authorities said in a statement publishedThursday.” http://www.reliefweb.int/rw/rwb.nsf/db900sid/KHII-78S83N?OpenDocument.
31 Cuba (2001).32 CIGEA (2001).33 UNCTAD/WTO, “International Trade Statistics 2001-2005,” http://www.intracen.org/tradstat/
sitc3-3d/er192.htm.34 See http://www.elnuevoherald.com/noticias/america_latina/cuba/story/177741.html. 30 new
hotels were announced to be built by 2010, aiming to increase hotel rooms from 46,000 to 56,000 for inter-national tourists. March 20, 2008, EFE. Or: http://www.sun-sentinel.com/news/local/cuba/sfl-0321havanadaily,0,6327367.column. “Cuba hopes 10,000 new hotel rooms will attract tourists”, Ray Sanchez,March 21, 2008.
35 For Cuban GDP we use the national accounts published by ECLAC (2007b).36 INVEMAR (2004).37 World Wildlife Fund (2001); World Rainforest Movement (2001).38 Vergara (2007). World Bank (www.worldbank.org “Colombia Data Profile”).39 Bladex, The Latin American Export Bank (http://www.blx.com “Colombia”).40 IDEAM (2001c). See also the IDEAM (2001b); IPCC (2007a Chapter 13).41 Nagy et al. (2006).42 IPCC (2001 Chapter 14); Vergara (2005).43 More than half of the páramo is located in Colombia.44 IDEAM (2001a).45 IDEAM (2001a).46 IPCC (2007a Chapter 13).47 Zapata Marti (2006).48 IPCC (2007a Chapter 13).49 Nagy et al. (2006).50 Stanton and Ackerman (2007).51 Stanton and Ackerman (2007).52 Haites et al. (2002).53 CTO (2004).
34

PHOTO CREDITSCover (top) iStockphoto; (bottom) PhotodiskInside front cover Central Intelligence AgencyPage 2 Noel Hendrickson/Getty ImagesPage 3 iStockphotoPage 4 iStockphotoPage 5 iStockphotoPage 6 iStockphotoPage 8 iStockphotoPage 9 iStockphotoPage 10 iStockphotoPage 11 Sexto Sol/Getty ImagesPage 13 Amanda Clement/Getty ImagesPage 14 iStockphotoPage 16 iStockphotoPage 18 iStockphotoPage 19 iStockphotoPage 21 iStockphotoPage 22 iStockphotoPage 23 iStockphoto
35


![HERZFELD M. [Lévi-Strauss in the Nation-State]](https://img.pdfslide.us/doc/110x75/577cd18c1a28ab9e7894b7ac/herzfeld-m-levi-strauss-in-the-nation-state.jpg)