Embed Size (px)
Citation preview

John G.C. KesterDirector
Tourism Market Trends Programme
World Tourism Trends
IPK 22st World Travel Monitor Forum
Pisa, Italy28-29 October, 2014
Note: this presentation is not subject to confidentiality.
Information included may be quoted provided the source is given
accurately and clearly.
The World Tourism Organization (UNWTO)
- a specialized agency of the United Nations (UN) and the leading international organization in the field of tourism. It serves as a global forum for tourism policy issues and a practical source of tourism know-how
- plays a central and decisive role in promoting the development of responsible, sustainable and universally accessible tourism, paying particular attention to the interests of developing countries
- intergovernmental organization with membership includes 162 countries and territoriesand over 400 Affiliate Members representing the private sector, educational institutions, tourism associations and local tourism authorities
- encourages the implementation of the Global Code of Ethics for Tourism, with a view to ensuring that member countries, tourist destinations and businesses maximize the positive economic, social and cultural effects of tourism and fully reap its benefits, while minimizing its negative social and environmental impacts
- committed to the United Nations Millennium Development Goals, geared toward reducing poverty and fostering sustainable development
www2.unwto.org/en/content/who-we-are-0

Results 2013
International tourist arrivals1087 million
+4.8%
International tourism receipts(BOP Travel)
US$ 1198 billion (euro 902 bn)+5.1% (real terms)
+International passenger transport
(BOP Transport, passenger)US$ 214 billion (euro 161 bn)
www.unwto.org/facts
International tourist arrivals and tourism receipts
Source: World Tourism Organization (UNWTO)

International Tourism Arrivals and Receipts, World
-6
-5
-4
-3
-2
-1
0
1
2
3
4
5
6
7
8
9
10
11
'90/89
'91/90
'92/91
'93/92
'94/93
'95/94
'96/95
'97/96
'98/97
'99/98
'00/99
'01/00
'02/01
'03/02
'04/03
'05/04
'06/05
'07/06
'08/07
'09/08
'10/09
'11/10
'12/11
'13*/1
2
% c
ha
ng
e o
ve
r p
rev
iou
s y
ea
r
International tourist arrivals
International tourism receipts (local currencies, constant prices)
growth in receipts follows growth in arrivals closely
Asian financial and economic crisis: receipts grew slower
11S, SARS, economic downturn:receipts more affected
‘Great recession’:receipts more affected and slower to recover
Source: World Tourism Organization (UNWTO)
International tourism receipts 2013:
US$ 1,198 billion euro 902 billion
(miles de millones)
Inbound tourism: World
International tourism, 1995-2013* (index, 2006=100)
6266
69 7073
79 79 81 81
89
95100
106 108104
111
117122
127
7074
77 7882
88 86 86 84
9295
100
106 107
101
108112
117
123
40
50
60
70
80
90
100
110
120
130
140
1995 1996 1997 1998 1999 2000 2001 2002 2003 2004 2005 2006 2007 2008 2009 2010 2011 2012 2013*
International tourist arrivals
International tourism receipts
Source: World Tourism Organization (UNWTO)

2014
International Tourist Arrivals, monthly evolution
World (% change)
Source: World Tourism Organization (UNWTO) ©
-15
-10
-5
0
5
10
15
2009 2010 2011 2012 2013 2014*
International tourism maintains strength
-3.9% +6.5% +5.1% +4.8%+4.1% +4.7%

International Tourist Arrivals, monthly evolution
World (million)
Source: World Tourism Organization (UNWTO) ©
50
60
70
80
90
100
110
120
130
140
1 2 3 4 5 6 7 8 9 10 11 12
2014*
2013
2012
2011
2010
781 million intnl tourist arrivals through August, 36 million more than in the same period of 2013
International Tourist Arrivals (% change)
Source: World Tourism Organization (UNWTO) ©
4.8
6.8
3.4
5.6
-2.9
54
5
8
3 3
4.7
-4
-2
0
2
4
6
8
World Europe Asia andthe Pacific
Americas Africa Middle East
13/12 14*/13 Jan-Aug
2013 and 2014 year to date by region
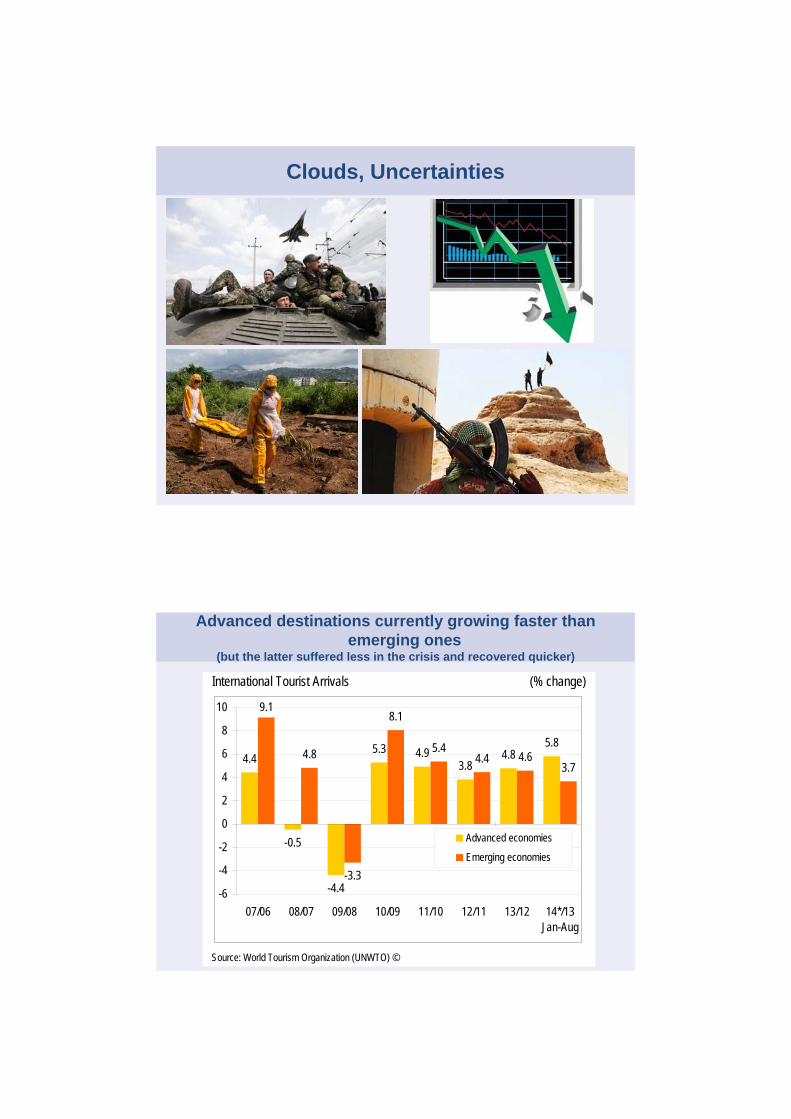
Clouds, Uncertainties
International Tourist Arrivals (% change)
Source: World Tourism Organization (UNWTO) ©
-0.5
-4.4
5.3 4.93.8
4.85.8
9.1
4.8
-3.3
8.1
5.44.4 4.6
3.74.4
-6
-4
-2
0
2
4
6
8
10
07/06 08/07 09/08 10/09 11/10 12/11 13/12 14*/13Jan-Aug
Advanced economies
Emerging economies
Advanced destinations currently growing faster than emerging ones
(but the latter suffered less in the crisis and recovered quicker)

International Tourist Arrivals, Americas (% change)
Source: World Tourism Organization (UNWTO) ©
3.9
2.3 2.6 2.5
89
6 67
3.4
-4
-2
0
2
4
6
8
10
Americas North America Caribbean CentralAmerica
South America
13/12 14*/13 Jan-Aug
2013 and 2014 year to date by subregion
International Tourist Arrivals, Asia and the Pacific (% change)
Source: World Tourism Organization (UNWTO) ©
3.4
11.3
4.6
11.1
5
7
2
6
86.8
-4
-2
0
2
4
6
8
10
12
Asia and thePacific
North-EastAsia
South-EastAsia
Oceania South Asia
13/12 14*/13 Jan-Aug
2013 and 2014 year to date by subregion

International Tourist Arrivals, Africa & Middle East (% change)
Source: World Tourism Organization (UNWTO) ©
6.15.3
-2.9
34
3 3
5.6
-4
-2
0
2
4
6
8
Africa North Africa SubsaharanAfrica
Middle East
13/12 14*/13 Jan-Aug
2013 and 2014 year to date by subregion
Europe 2014

International Tourist Arrivals, monthly evolution
Europe (% change)
Source: World Tourism Organization (UNWTO) ©
-20
-15
-10
-5
0
5
10
15
2009 2010 2011 2012 2013 2014*
Europe: growth well above long-term trend
-5.0% +3.1% +6.6% +4.2%+3.7% +4.8%
International Tourist Arrivals, monthly evolution
Europe (million)
Source: World Tourism Organization (UNWTO) ©
0
10
20
30
40
50
60
70
80
90
1 2 3 4 5 6 7 8 9 10 11 12
2010
2011
2012
2013
2014*
Europe 413 million intnl tourist arrivals through August, 17 mn more than in the same period of 2013

International Tourist Arrivals, Europe (% change)
Source: World Tourism Organization (UNWTO) ©
4.1
2.7
7.1
5.6
4
7
3
-1
7
4.8
-4
-2
0
2
4
6
8
Europe NorthernEurope
WesternEurope
Central/Eastern Eu.
Southern/Mediter. Eu.
13/12 14*/13 Jan-Aug
International Tourist Arrivals, Europe (% change)
Source: World Tourism Organization (UNWTO) ©
4.1
2.7
7.1
5.6
4
7
3
-1
7
4.8
-4
-2
0
2
4
6
8
10
Europe NorthernEurope
WesternEurope
Central/Eastern Eu.
Southern/Mediter. Eu.
13/12 14*/13 Jan-Aug
2013 and 2014 year to date by subregion
International Tourism Arrivals and Receipts, Europe
-6
-5
-4
-3
-2
-1
0
1
2
3
4
5
6
7
8
9
10
11
'90/89
'91/90
'92/91
'93/92
'94/93
'95/94
'96/95
'97/96
'98/97
'99/98
'00/99
'01/00
'02/01
'03/02
'04/03
'05/04
'06/05
'07/06
'08/07
'09/08
'10/09
'11/10
'12/11
'13*/1
2
% c
ha
ng
e o
ve
r p
rev
iou
s y
ea
r
International tourist arrivals
International tourism receipts (local currencies, constant prices)
growth in receipts follows growth in arrivals closely
Asian financial and economic crisis: receipts grew slower
11S, SARS, economic downturn:receipts more affected
‘Great recession’:receipts more affected and slower to recover
Source: World Tourism Organization (UNWTO)
International tourism receipts 2013:US$ 493 billion euro 371 billion
(miles de millones)

Inbound tourism: Europe
International tourism, 1995-2013* (index, 2006=100)
6468
72 7476
81 82 84 8690
95100
105 105100
103
109113
119
7174
78
84 86
9593 93 91
9496
100102 101
95 9599 101
105
40
50
60
70
80
90
100
110
120
130
1995 1996 1997 1998 1999 2000 2001 2002 2003 2004 2005 2006 2007 2008 2009 2010 2011 2012 2013*
International tourist arrivals
International tourism receipts
Source: World Tourism Organization (UNWTO)
Outbound markets

World and regions: Outbound Tourism
International Tourism Expenditure (euro billion)
China
United States
Germany
Russian FederationUnited Kingdom
FranceCanadaAustraliaItalyBrazilSingaporeJapanKorea, Republic ofBelgiumHong Kong (China)
Source: World Tourism Organization (UNWTO) ©
0
10
20
30
40
50
60
70
80
90
100
'95 '96 '97 '98 '99 '00 '01 '02 '03 '04 '05 '06 '07 '08 '09 '10 '11 '12 '13
Emerging outbound markets remainedhot in 2013
International Tourism Expenditure: increase 2006-2013 (euro billion)
-15
-10
-5
0
5
10
15
20
25
30
35
40
45
50
55
60
65
70
75
80
China
Russia
n Fed
eration
United
StatesBraz
il
Austra
lia
Singapo
re
Canad
a
German
y
Untd Arab
Emirates
Malays
ia
Norway
Hong K
ong (
China)
Switzerl
and
Philipp
ines
France
SwedenQata
r
BelgiumKuw
aitInd
ia
Taiwan
Indon
esia
Ukraine
Colombia
Netherl
ands
Argenti
na
Thaila
nd
Denmark
Finland
Leba
non
Turkey
Poland
Czech
Rep
Mexico
New Ze
aland
Irelan
dSpa
inJa
pan
United
Kingdo
m
€ b
illio
n
International Tourism Expenditure:between 2006 and 2013 total up by euro 292 billion
(US$ 432 bn), from euro 610 bn (US$ 766 bn) in 2006 to 902 bn (US$ 1,198 billion) in 2013 (current terms) in
spite of crisisAverage annual growth rate in real terms +2.7% a year
High potential outbound markets
Source: World Tourism Organization (UNWTO)

International Tourism Expenditure (% change of same period year before, local currencies current prices)
-15
-10
-5
0
5
10
15
20
25
30
35
China
United S
tates
German
y
Russia
n Fed
eratio
n
United
Kingdo
mFran
ce
Canad
a
Austra
lia Italy
Brazil
Singap
ore
Belgium
Japa
n
Korea,
Repub
lic of
Hong K
ong (
China)
Netherl
ands
Norway
Untd Arab
Emirates
Saudi
Arabia
Sweden
Spain
Switzerl
and
Taiwan
(pr. o
f Chin
a)
Malays
iaInd
ia
2013 2014* ytd
Major outbound markets2014 hot markets
B
RC
Source: World Tourism Organization (UNWTO)
I
UNWTO Tourism Confidence Index

abs. number (n=303)
Source: World Tourism Organization (UNWTO) ©
UNWTO Panel of Tourism Experts
1%7%
32%
58%
6%1%
14%
35%
44%
6%
0%
10%
20%
30%
40%
50%
60%
70%
[0] Much worse [50] Worse [100] Equal [150] Better [200] Muchbetter
Prospects May-Aug. 2014
Prospects Sept.-Dec. 2014
Confidence slightly declining from high level
UNWTO Panel of Tourism Experts: World
Better
Equal
Worse
Source: World Tourism Organization (UNWTO) ©
25
50
75
100
125
150
175
t1 t2'03
t3 t1 t2'04
t3 t1 t2'05
t3 t1 t2'06
t3 t1 t2'07
t3 t1 t2'08
t3 t1 t2'09
t3 t1 t2'10
t3 t1 t2'11
t3 t1 t2'12
t3 t1 t2'13
t3 t1 t2'14
t3
Prospects (before)
Evaluation (after)
Confidence slightly declining from high level

UNWTO Panel of Tourism Experts: Europe
Better
Equal
Worse
Source: World Tourism Organization (UNWTO) ©
25
50
75
100
125
150
175
t1 t2'03
t3 t1 t2'04
t3 t1 t2'05
t3 t1 t2'06
t3 t1 t2'07
t3 t1 t2'08
t3 t1 t2'09
t3 t1 t2'10
t3 t1 t2'11
t3 t1 t2'12
t3 t1 t2'13
t3 t1 t2'14
t3
Prospects (before)
Evaluation (after)
Europe confidence index remains high
UNWTO tourism business-cycle clock
May 2004
Upswing May 2003 Boom
Sep 2014
May 2009
Recession Downswing
Pros
pect
s co
min
g 4
mon
ths
Evaluation past 4 months
50
75
100
125
150
25 50 75 100 125 150 175
UNWTO tourism business-cycle clock, World

UNWTO tourism business-cycle clock
May 2003 May 2004
Upswing Boom
Sep 2014
Recession DownswingMay 2009
Pros
pect
s co
min
g 4
mon
ths
Evaluation past 4 months
50
75
100
125
150
25 50 75 100 125 150 175
UNWTO tourism business-cycle clock, Europe

Economic growth projections by the International Monetary Fund (IMF)
-4
-2
0
2
4
6
8
2000 2001 2002 2003 2004 2005 2006 2007 2008 2009 2010 2011 2012 2013 2014* 2015* 2016* 2017* 2018* 2019*
Advanced economiesEmerging economies
Source: International Monetary Fund (IMF)
IMF: Legacies, Clouds, Uncertaintiesan uneven global recovery continues
chan
ge(%
)
Crude Oil Spot Price Brent (daily)
(US$ per barrel)
Source: US Department of Energy, Energy Information Administration
0
20
40
60
80
100
120
140
160
1987 1989 1991 1993 1995 1997 1999 2001 2003 2005 2007 2009 2011 2013 2015
¿Cheaper oil?

Outlook
Projection 2014
(issued January)
Actual data
3.0%
3.1%
7.9%
5.0%
4.2%
4.8%
2014 Jan.-Aug.2013
World 4.7% +4% and +4.5%
Europe 4.8% +3% and +4%
Asia and the Pacific 6.8% +5% and +6%
Americas 3.4% +3% and +4%
Africa 5.6% +4% and +6%
Middle East -2.9% +0% and +5%
International tourism: projection full year 2013
Source: World Tourism Organization (UNWTO)

Source: World Tourism Organization (UNWTO)
International tourist arrivals
7.8
0.2
3.1
-0.6
10.4
5.9 5.76.5
1.9
-3.9
6.5
5.14.1
4.7
-6
-4
-2
0
2
4
6
8
10
12
2000 2001 2002 2003 2004 2005 2006 2007 2008 2009 2010 2011 2012 2013 2014*2015*
Forecast 2014: 4% to 4.5%(issued January)
Outlook: World ch
ange
(%)
?
International tourist arrivals
7.3
0.4
3.4
2.2
4.85.4
5.0 4.6
0.3
-5.0
3.1
6.6
3.7
4.8
-6
-4
-2
0
2
4
6
8
2000 2001 2002 2003 2004 2005 2006 2007 2008 2009 2010 2011 2012 2013 2014*2015*
Forecast 2014: 2% to 4%(issued January)
Source: World Tourism Organization (UNWTO)
chan
ge(%
)
Outlook: Europe
?

International Tourist Arrivals
0
200
400
600
800
1,000
1,200
1,400
1,600
1,800
1995 2000 2005 2010 2015 2020 2025 2030
milli
on
Trend 1995-2010Tourism Towards 2030 projectionActual 1995-2013*
1.4 bn
1,087 mn
1.8 bn
527 mn
Source: World Tourism Organization (UNWTO)
Actual Trend vs. Tourism Towards 2030 projectionWorld
UNWTO jointly with partners is working closely with stakeholders to move agenda forward
A number of meetings have taken place and three reports have been prepared taking stock of and analysing the current situation:
For more information and download of reports, see http://rcm.unwto.org/en/content/facilitation-tourist-travel

Thank you very much for your attention!John G.C. Kester
Tourism Market Trends Programme
World Tourism Organization (UNWTO)
www.unwto.org