Embed Size (px)
Citation preview
THE WMUR GRANITE STATE POLL
May 7, 2015 NOVEMBER 2016: CLINTON LOSES GROUND AGAINST GOP CANDIDATES IN NH By: Andrew E. Smith, Ph.D. Zachary S. Azem, M.A. UNH Survey Center 603/862-2226 www.unh.edu/survey-center DURHAM, NH –Democratic frontrunner Hillary Clinton is locked in tight matchups with five potential Republican challengers. Support for Clinton in the Granite State against potential Republicans has declined significantly since February.
These findings are based on the latest WMUR Granite State Poll, conducted by the University of New Hampshire Survey Center. Seven hundred and six (706) randomly selected New Hampshire adults were interviewed by landline and cellular telephone between April 24 and May 3, 2015. The margin of sampling error is +/- 3.7 percent. Included were two hundred ninety-three (293) likely 2016 Republican Primary voters (MSE = +/-5.7), two hundred twenty-nine (229) likely 2016 Democratic Primary voters (MSE = +/-6.5), and six hundred and twenty-seven (627) likely 2016 presidential election voters (MSE = +/- 3.9).
2016 U.S. Presidential Election
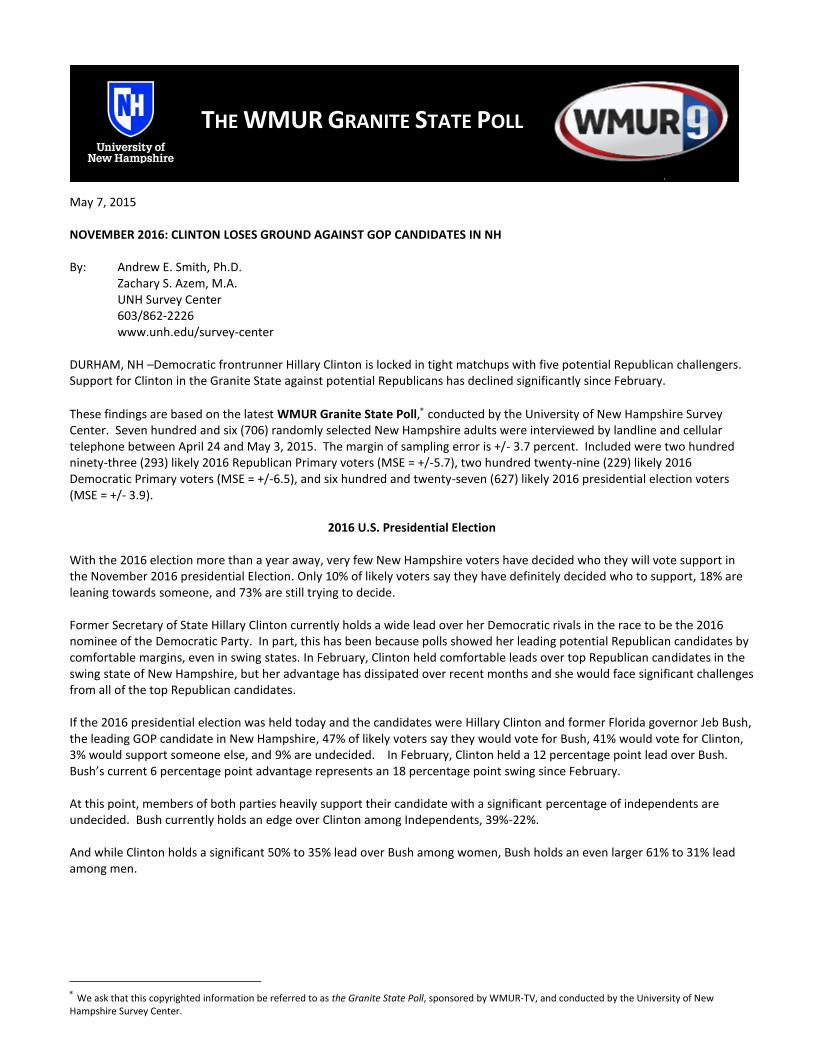
With the 2016 election more than a year away, very few New Hampshire voters have decided who they will vote support in the November 2016 presidential Election. Only 10% of likely voters say they have definitely decided who to support, 18% are leaning towards someone, and 73% are still trying to decide. Former Secretary of State Hillary Clinton currently holds a wide lead over her Democratic rivals in the race to be the 2016 nominee of the Democratic Party. In part, this has been because polls showed her leading potential Republican candidates by comfortable margins, even in swing states. In February, Clinton held comfortable leads over top Republican candidates in the swing state of New Hampshire, but her advantage has dissipated over recent months and she would face significant challenges from all of the top Republican candidates. If the 2016 presidential election was held today and the candidates were Hillary Clinton and former Florida governor Jeb Bush, the leading GOP candidate in New Hampshire, 47% of likely voters say they would vote for Bush, 41% would vote for Clinton, 3% would support someone else, and 9% are undecided. In February, Clinton held a 12 percentage point lead over Bush. Bush’s current 6 percentage point advantage represents an 18 percentage point swing since February. At this point, members of both parties heavily support their candidate with a significant percentage of independents are undecided. Bush currently holds an edge over Clinton among Independents, 39%-22%. And while Clinton holds a significant 50% to 35% lead over Bush among women, Bush holds an even larger 61% to 31% lead among men.
We ask that this copyrighted information be referred to as the Granite State Poll, sponsored by WMUR-TV, and conducted by the University of New Hampshire Survey Center.
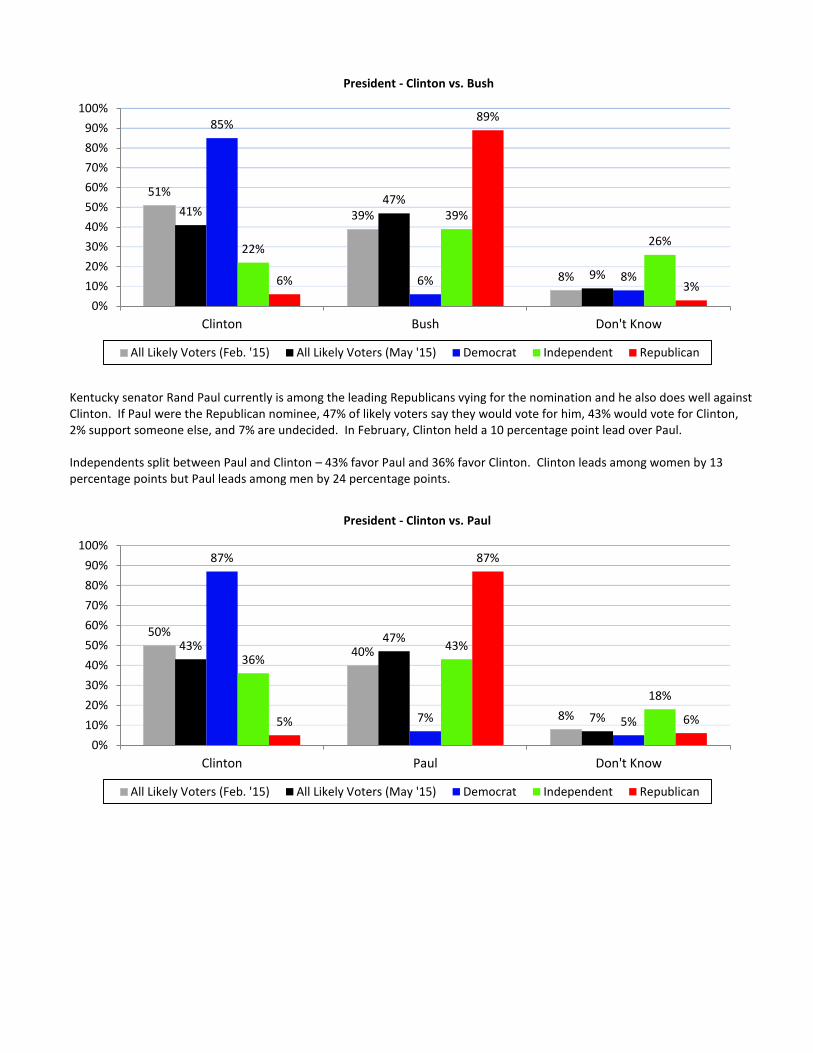
Kentucky senator Rand Paul currently is among the leading Republicans vying for the nomination and he also does well against Clinton. If Paul were the Republican nominee, 47% of likely voters say they would vote for him, 43% would vote for Clinton, 2% support someone else, and 7% are undecided. In February, Clinton held a 10 percentage point lead over Paul. Independents split between Paul and Clinton – 43% favor Paul and 36% favor Clinton. Clinton leads among women by 13 percentage points but Paul leads among men by 24 percentage points.
51%
39%
8%
41% 47%
9%
85%
6% 8%
22%
39%
26%
6%
89%
3%
0%
10%
20%
30%
40%
50%
60%
70%
80%
90%
100%
Clinton Bush Don't Know
President - Clinton vs. Bush
All Likely Voters (Feb. '15) All Likely Voters (May '15) Democrat Independent Republican
50%
40%
8%
43% 47%
7%
87%
7% 5%
36% 43%
18%
5%
87%
6%
0%
10%
20%
30%
40%
50%
60%
70%
80%
90%
100%
Clinton Paul Don't Know
President - Clinton vs. Paul
All Likely Voters (Feb. '15) All Likely Voters (May '15) Democrat Independent Republican
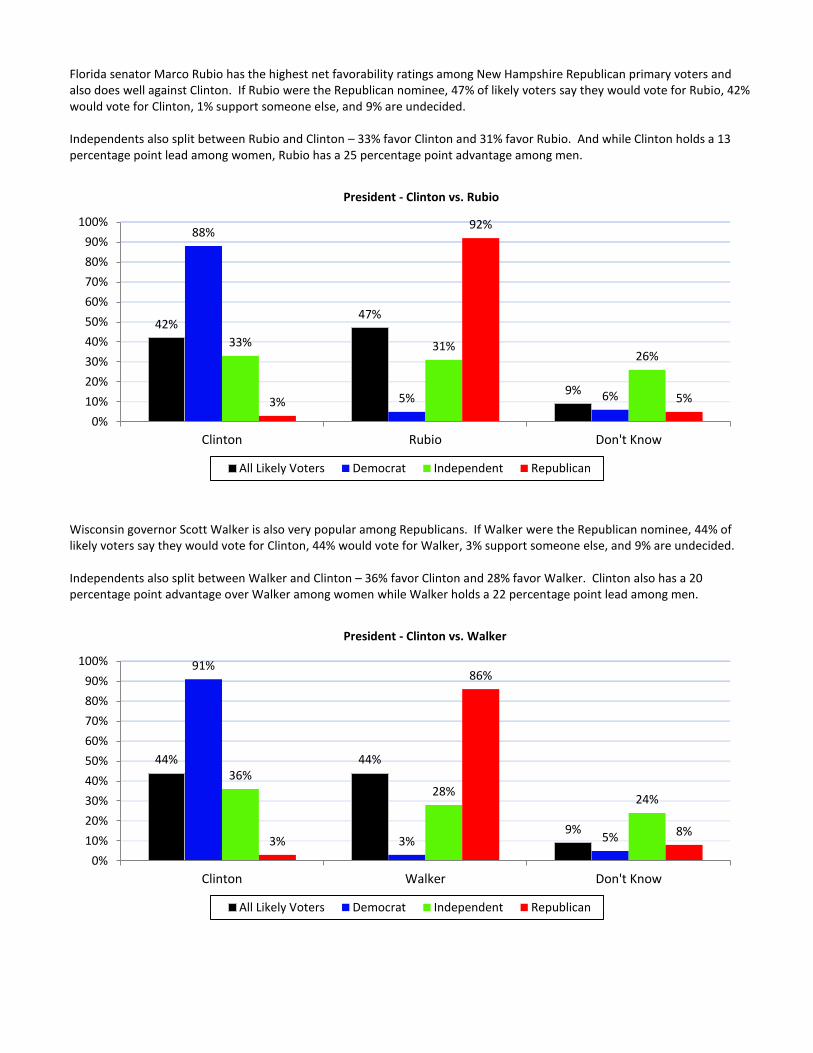
Florida senator Marco Rubio has the highest net favorability ratings among New Hampshire Republican primary voters and also does well against Clinton. If Rubio were the Republican nominee, 47% of likely voters say they would vote for Rubio, 42% would vote for Clinton, 1% support someone else, and 9% are undecided. Independents also split between Rubio and Clinton – 33% favor Clinton and 31% favor Rubio. And while Clinton holds a 13 percentage point lead among women, Rubio has a 25 percentage point advantage among men.
Wisconsin governor Scott Walker is also very popular among Republicans. If Walker were the Republican nominee, 44% of likely voters say they would vote for Clinton, 44% would vote for Walker, 3% support someone else, and 9% are undecided. Independents also split between Walker and Clinton – 36% favor Clinton and 28% favor Walker. Clinton also has a 20 percentage point advantage over Walker among women while Walker holds a 22 percentage point lead among men.
42% 47%
9%
88%
5% 6%
33% 31% 26%
3%
92%
5%
0%
10%
20%
30%
40%
50%
60%
70%
80%
90%
100%
Clinton Rubio Don't Know
President - Clinton vs. Rubio
All Likely Voters Democrat Independent Republican
44% 44%
9%
91%
3% 5%
36% 28%
24%
3%
86%
8%
0%
10%
20%
30%
40%
50%
60%
70%
80%
90%
100%
Clinton Walker Don't Know
President - Clinton vs. Walker
All Likely Voters Democrat Independent Republican
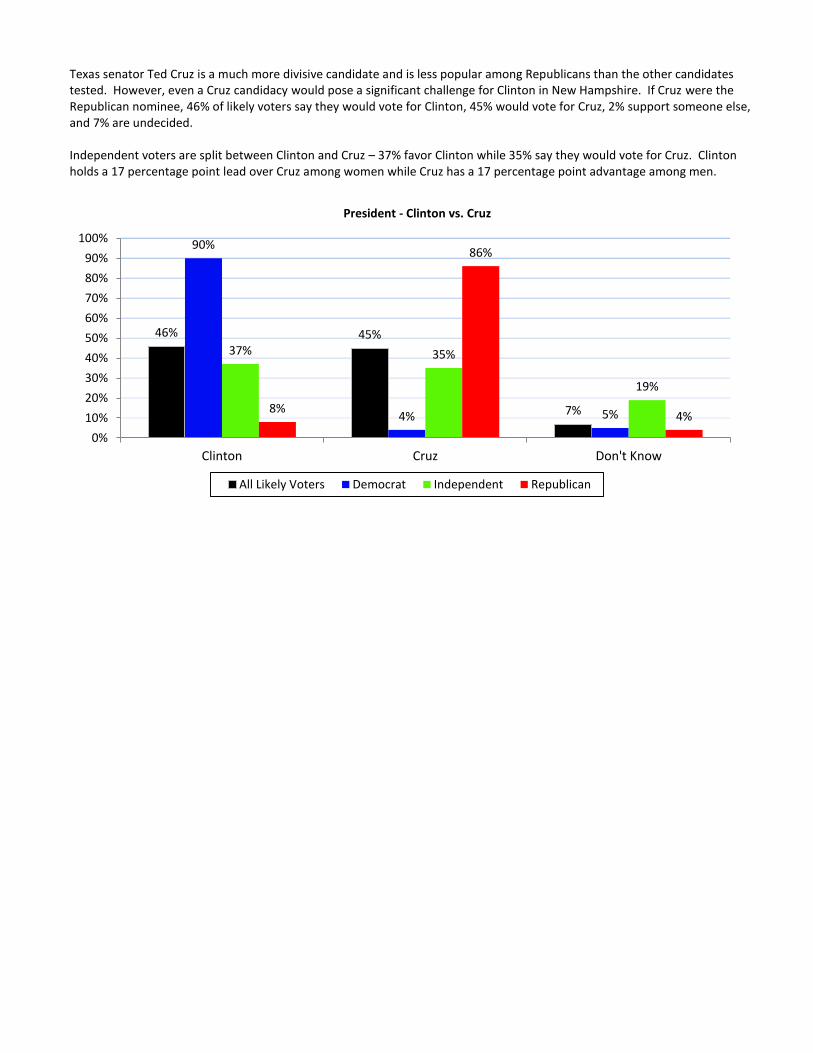
Texas senator Ted Cruz is a much more divisive candidate and is less popular among Republicans than the other candidates tested. However, even a Cruz candidacy would pose a significant challenge for Clinton in New Hampshire. If Cruz were the Republican nominee, 46% of likely voters say they would vote for Clinton, 45% would vote for Cruz, 2% support someone else, and 7% are undecided. Independent voters are split between Clinton and Cruz – 37% favor Clinton while 35% say they would vote for Cruz. Clinton holds a 17 percentage point lead over Cruz among women while Cruz has a 17 percentage point advantage among men.
46% 45%
7%
90%
4% 5%
37% 35%
19%
8%
86%
4%
0%
10%
20%
30%
40%
50%
60%
70%
80%
90%
100%
Clinton Cruz Don't Know
President - Clinton vs. Cruz
All Likely Voters Democrat Independent Republican
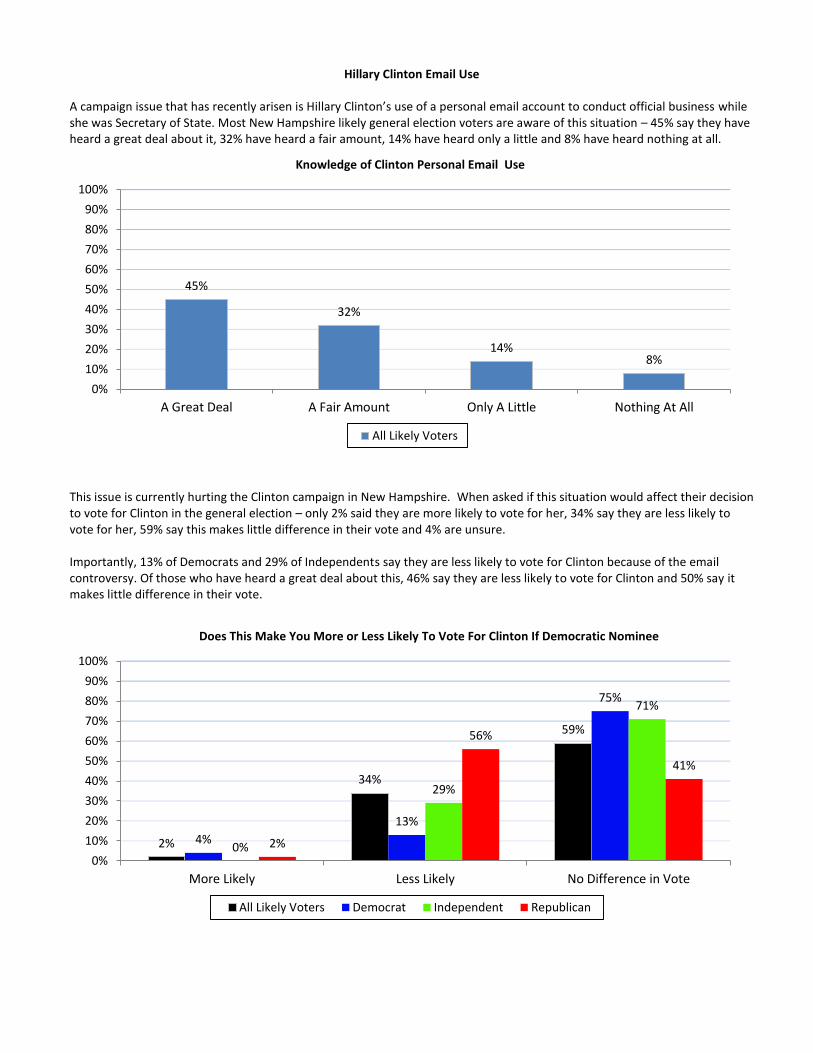
Hillary Clinton Email Use A campaign issue that has recently arisen is Hillary Clinton’s use of a personal email account to conduct official business while she was Secretary of State. Most New Hampshire likely general election voters are aware of this situation – 45% say they have heard a great deal about it, 32% have heard a fair amount, 14% have heard only a little and 8% have heard nothing at all.
This issue is currently hurting the Clinton campaign in New Hampshire. When asked if this situation would affect their decision to vote for Clinton in the general election – only 2% said they are more likely to vote for her, 34% say they are less likely to vote for her, 59% say this makes little difference in their vote and 4% are unsure. Importantly, 13% of Democrats and 29% of Independents say they are less likely to vote for Clinton because of the email controversy. Of those who have heard a great deal about this, 46% say they are less likely to vote for Clinton and 50% say it makes little difference in their vote.
45%
32%
14% 8%
0%
10%
20%
30%
40%
50%
60%
70%
80%
90%
100%
A Great Deal A Fair Amount Only A Little Nothing At All
Knowledge of Clinton Personal Email Use
All Likely Voters
2%
34%
59%
4%
13%
75%
0%
29%
71%
2%
56%
41%
0%
10%
20%
30%
40%
50%
60%
70%
80%
90%
100%
More Likely Less Likely No Difference in Vote
Does This Make You More or Less Likely To Vote For Clinton If Democratic Nominee
All Likely Voters Democrat Independent Republican
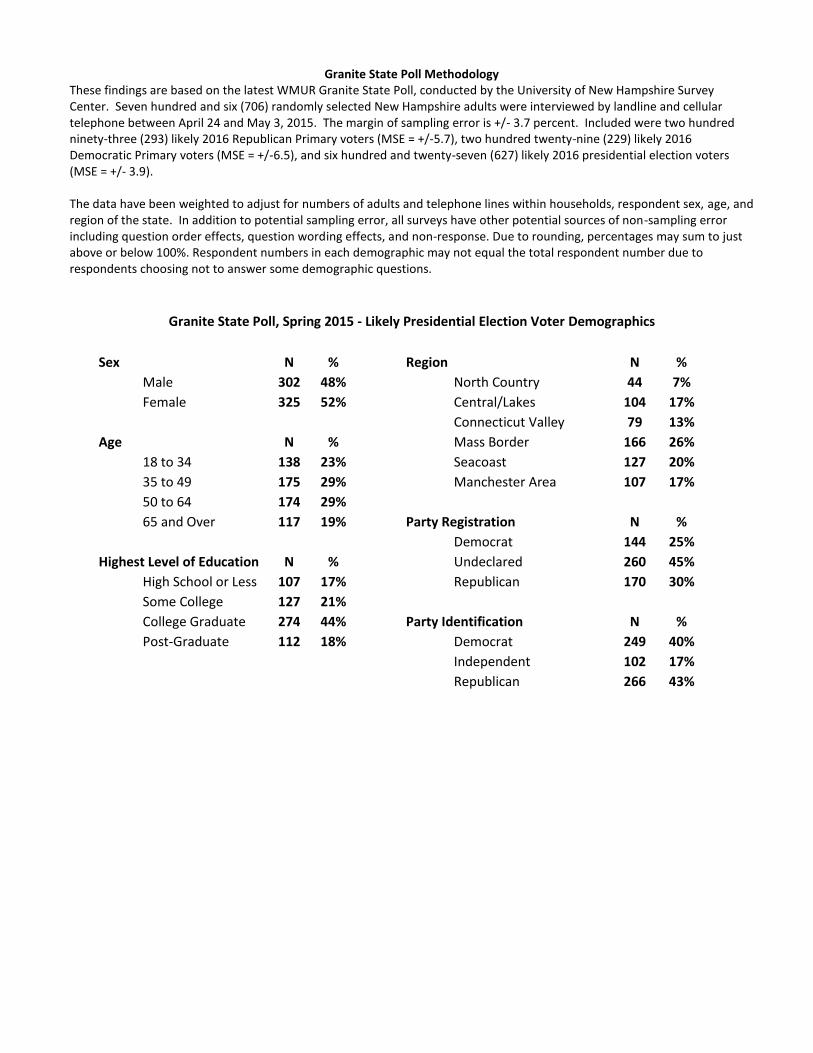
Granite State Poll Methodology These findings are based on the latest WMUR Granite State Poll, conducted by the University of New Hampshire Survey Center. Seven hundred and six (706) randomly selected New Hampshire adults were interviewed by landline and cellular telephone between April 24 and May 3, 2015. The margin of sampling error is +/- 3.7 percent. Included were two hundred ninety-three (293) likely 2016 Republican Primary voters (MSE = +/-5.7), two hundred twenty-nine (229) likely 2016 Democratic Primary voters (MSE = +/-6.5), and six hundred and twenty-seven (627) likely 2016 presidential election voters (MSE = +/- 3.9). The data have been weighted to adjust for numbers of adults and telephone lines within households, respondent sex, age, and region of the state. In addition to potential sampling error, all surveys have other potential sources of non-sampling error including question order effects, question wording effects, and non-response. Due to rounding, percentages may sum to just above or below 100%. Respondent numbers in each demographic may not equal the total respondent number due to respondents choosing not to answer some demographic questions.
Granite State Poll, Spring 2015 - Likely Presidential Election Voter Demographics
Sex N % Region N %
Male 302 48% North Country 44 7%
Female 325 52% Central/Lakes 104 17%
Connecticut Valley 79 13%
Age N % Mass Border 166 26%
18 to 34 138 23% Seacoast 127 20%
35 to 49 175 29% Manchester Area 107 17%
50 to 64 174 29%
65 and Over 117 19% Party Registration N %
Democrat 144 25%
Highest Level of Education N % Undeclared 260 45%
High School or Less 107 17% Republican 170 30%
Some College 127 21%
College Graduate 274 44% Party Identification N %
Post-Graduate 112 18% Democrat 249 40%
Independent 102 17%
Republican 266 43%
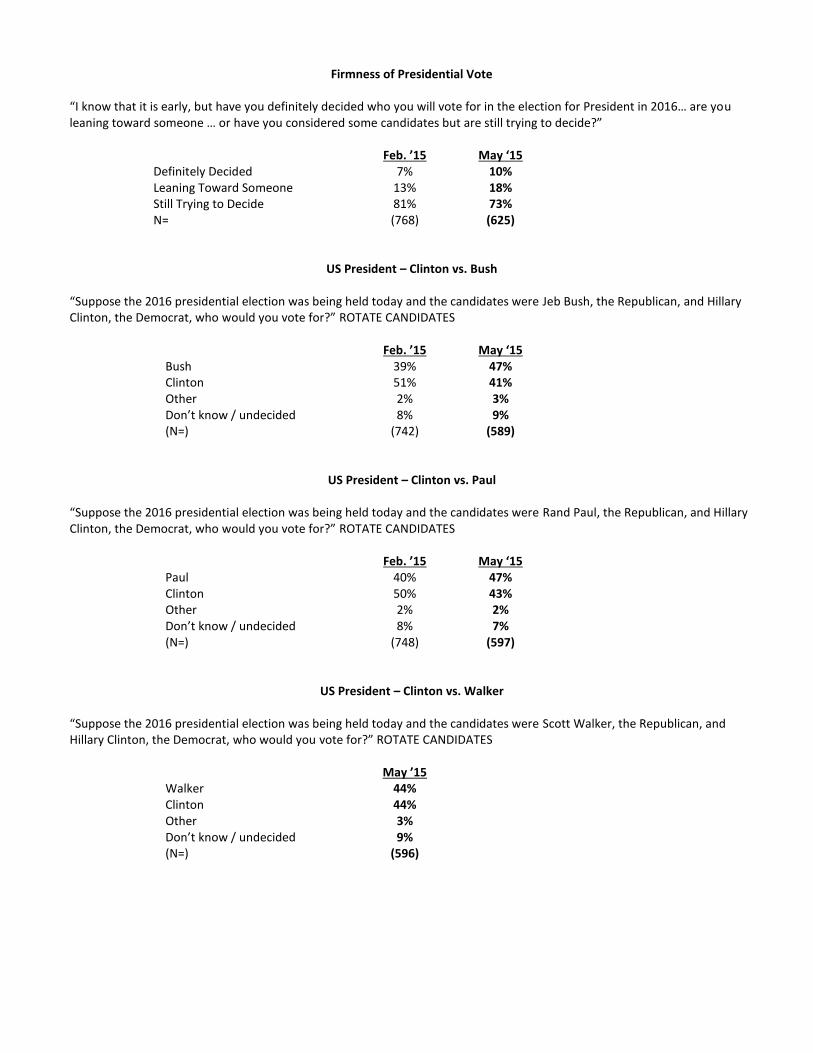
Firmness of Presidential Vote “I know that it is early, but have you definitely decided who you will vote for in the election for President in 2016… are you leaning toward someone … or have you considered some candidates but are still trying to decide?”
Feb. ’15 May ‘15 Definitely Decided 7% 10% Leaning Toward Someone 13% 18% Still Trying to Decide 81% 73% N= (768) (625)
US President – Clinton vs. Bush “Suppose the 2016 presidential election was being held today and the candidates were Jeb Bush, the Republican, and Hillary Clinton, the Democrat, who would you vote for?” ROTATE CANDIDATES Feb. ’15 May ‘15 Bush 39% 47% Clinton 51% 41% Other 2% 3% Don’t know / undecided 8% 9% (N=) (742) (589)
US President – Clinton vs. Paul “Suppose the 2016 presidential election was being held today and the candidates were Rand Paul, the Republican, and Hillary Clinton, the Democrat, who would you vote for?” ROTATE CANDIDATES Feb. ’15 May ‘15 Paul 40% 47% Clinton 50% 43% Other 2% 2% Don’t know / undecided 8% 7% (N=) (748) (597)
US President – Clinton vs. Walker
“Suppose the 2016 presidential election was being held today and the candidates were Scott Walker, the Republican, and Hillary Clinton, the Democrat, who would you vote for?” ROTATE CANDIDATES May ’15 Walker 44% Clinton 44% Other 3% Don’t know / undecided 9% (N=) (596)
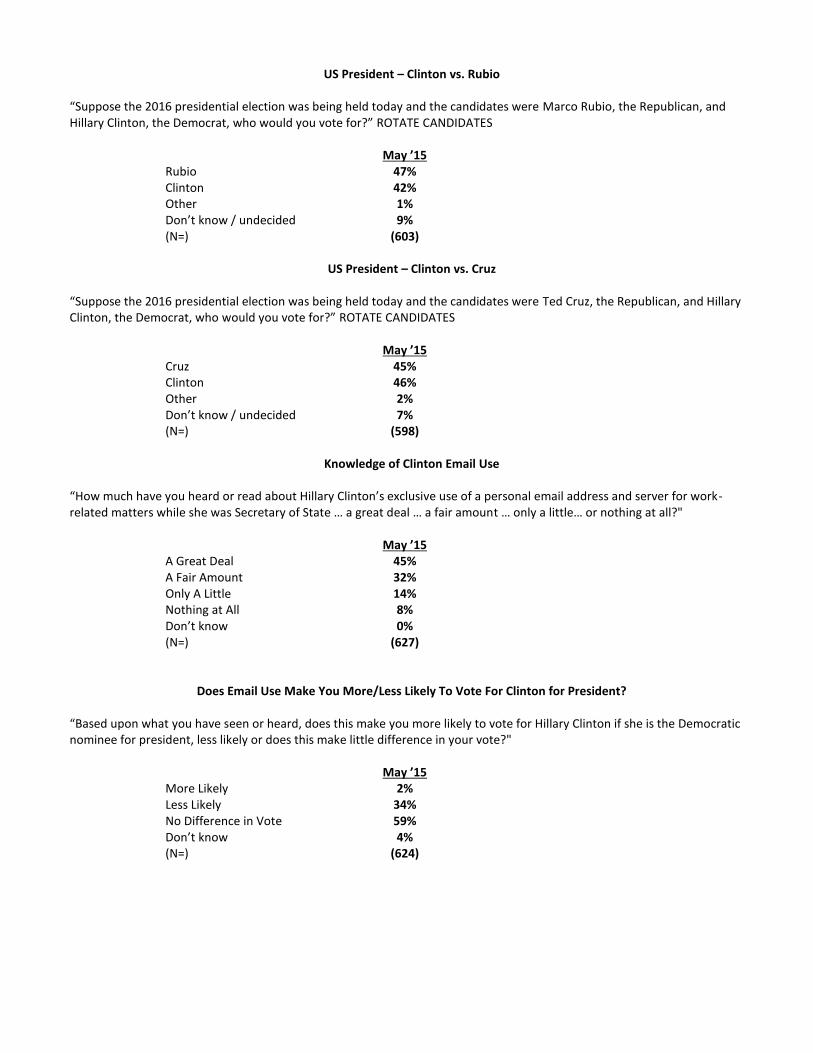
US President – Clinton vs. Rubio “Suppose the 2016 presidential election was being held today and the candidates were Marco Rubio, the Republican, and Hillary Clinton, the Democrat, who would you vote for?” ROTATE CANDIDATES May ’15 Rubio 47% Clinton 42% Other 1% Don’t know / undecided 9% (N=) (603)
US President – Clinton vs. Cruz “Suppose the 2016 presidential election was being held today and the candidates were Ted Cruz, the Republican, and Hillary Clinton, the Democrat, who would you vote for?” ROTATE CANDIDATES May ’15 Cruz 45% Clinton 46% Other 2% Don’t know / undecided 7% (N=) (598)
Knowledge of Clinton Email Use “How much have you heard or read about Hillary Clinton’s exclusive use of a personal email address and server for work-related matters while she was Secretary of State … a great deal … a fair amount … only a little… or nothing at all?" May ’15 A Great Deal 45% A Fair Amount 32% Only A Little 14% Nothing at All 8% Don’t know 0% (N=) (627)
Does Email Use Make You More/Less Likely To Vote For Clinton for President? “Based upon what you have seen or heard, does this make you more likely to vote for Hillary Clinton if she is the Democratic nominee for president, less likely or does this make little difference in your vote?" May ’15 More Likely 2% Less Likely 34% No Difference in Vote 59% Don’t know 4% (N=) (624)
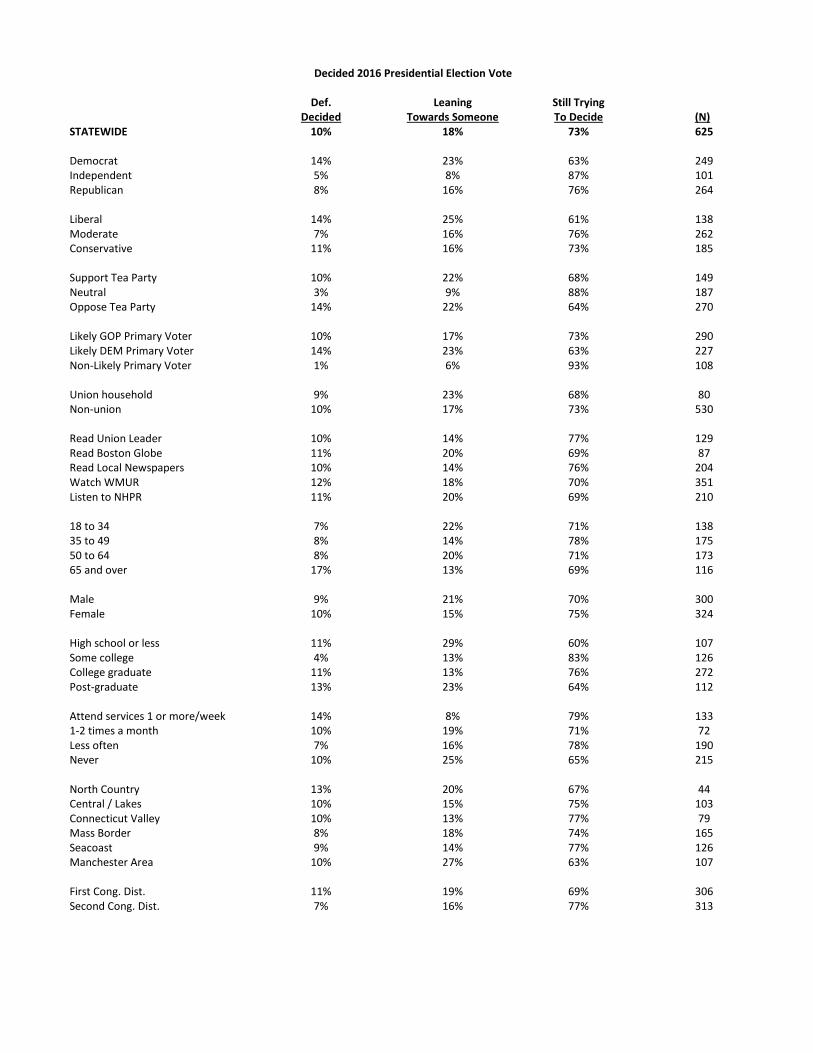
Decided 2016 Presidential Election Vote Def. Leaning Still Trying Decided Towards Someone To Decide (N) STATEWIDE 10% 18% 73% 625 Democrat 14% 23% 63% 249 Independent 5% 8% 87% 101 Republican 8% 16% 76% 264 Liberal 14% 25% 61% 138 Moderate 7% 16% 76% 262 Conservative 11% 16% 73% 185 Support Tea Party 10% 22% 68% 149 Neutral 3% 9% 88% 187 Oppose Tea Party 14% 22% 64% 270 Likely GOP Primary Voter 10% 17% 73% 290 Likely DEM Primary Voter 14% 23% 63% 227 Non-Likely Primary Voter 1% 6% 93% 108 Union household 9% 23% 68% 80 Non-union 10% 17% 73% 530 Read Union Leader 10% 14% 77% 129 Read Boston Globe 11% 20% 69% 87 Read Local Newspapers 10% 14% 76% 204 Watch WMUR 12% 18% 70% 351 Listen to NHPR 11% 20% 69% 210 18 to 34 7% 22% 71% 138 35 to 49 8% 14% 78% 175 50 to 64 8% 20% 71% 173 65 and over 17% 13% 69% 116 Male 9% 21% 70% 300 Female 10% 15% 75% 324 High school or less 11% 29% 60% 107 Some college 4% 13% 83% 126 College graduate 11% 13% 76% 272 Post-graduate 13% 23% 64% 112 Attend services 1 or more/week 14% 8% 79% 133 1-2 times a month 10% 19% 71% 72 Less often 7% 16% 78% 190 Never 10% 25% 65% 215 North Country 13% 20% 67% 44 Central / Lakes 10% 15% 75% 103 Connecticut Valley 10% 13% 77% 79 Mass Border 8% 18% 74% 165 Seacoast 9% 14% 77% 126 Manchester Area 10% 27% 63% 107 First Cong. Dist. 11% 19% 69% 306 Second Cong. Dist. 7% 16% 77% 313
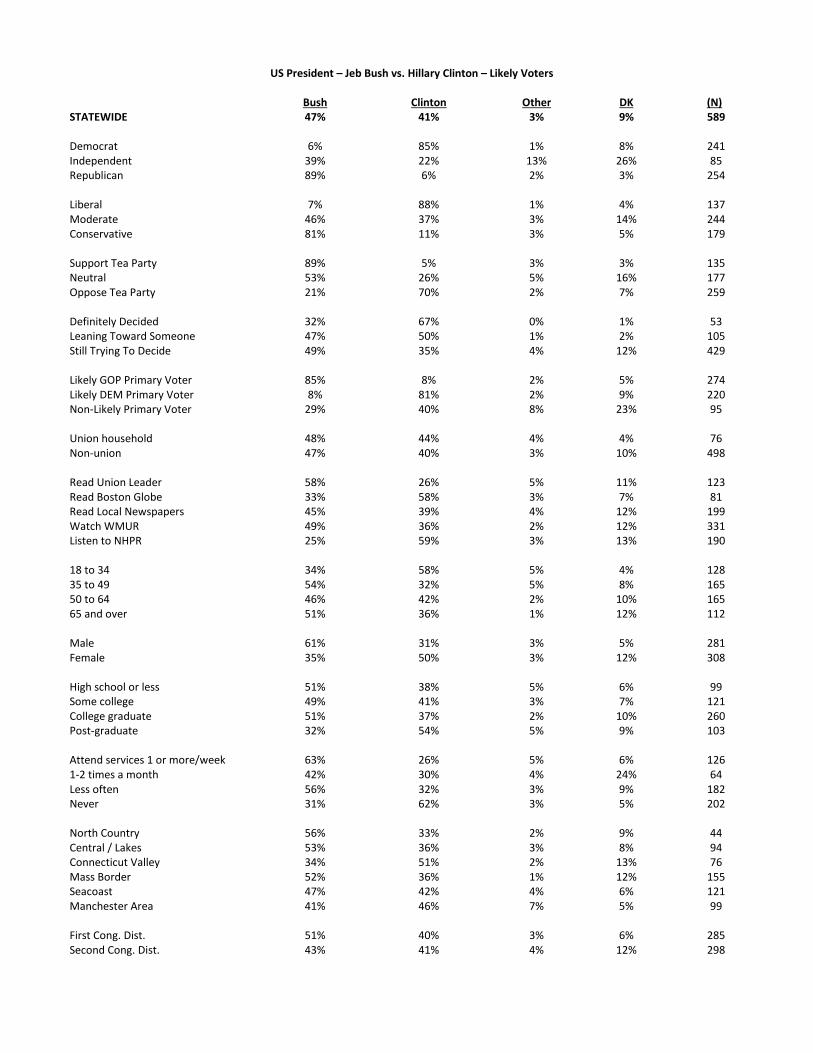
US President – Jeb Bush vs. Hillary Clinton – Likely Voters Bush Clinton Other DK (N) STATEWIDE 47% 41% 3% 9% 589 Democrat 6% 85% 1% 8% 241 Independent 39% 22% 13% 26% 85 Republican 89% 6% 2% 3% 254 Liberal 7% 88% 1% 4% 137 Moderate 46% 37% 3% 14% 244 Conservative 81% 11% 3% 5% 179 Support Tea Party 89% 5% 3% 3% 135 Neutral 53% 26% 5% 16% 177 Oppose Tea Party 21% 70% 2% 7% 259 Definitely Decided 32% 67% 0% 1% 53 Leaning Toward Someone 47% 50% 1% 2% 105 Still Trying To Decide 49% 35% 4% 12% 429 Likely GOP Primary Voter 85% 8% 2% 5% 274 Likely DEM Primary Voter 8% 81% 2% 9% 220 Non-Likely Primary Voter 29% 40% 8% 23% 95 Union household 48% 44% 4% 4% 76 Non-union 47% 40% 3% 10% 498 Read Union Leader 58% 26% 5% 11% 123 Read Boston Globe 33% 58% 3% 7% 81 Read Local Newspapers 45% 39% 4% 12% 199 Watch WMUR 49% 36% 2% 12% 331 Listen to NHPR 25% 59% 3% 13% 190 18 to 34 34% 58% 5% 4% 128 35 to 49 54% 32% 5% 8% 165 50 to 64 46% 42% 2% 10% 165 65 and over 51% 36% 1% 12% 112 Male 61% 31% 3% 5% 281 Female 35% 50% 3% 12% 308 High school or less 51% 38% 5% 6% 99 Some college 49% 41% 3% 7% 121 College graduate 51% 37% 2% 10% 260 Post-graduate 32% 54% 5% 9% 103 Attend services 1 or more/week 63% 26% 5% 6% 126 1-2 times a month 42% 30% 4% 24% 64 Less often 56% 32% 3% 9% 182 Never 31% 62% 3% 5% 202 North Country 56% 33% 2% 9% 44 Central / Lakes 53% 36% 3% 8% 94 Connecticut Valley 34% 51% 2% 13% 76 Mass Border 52% 36% 1% 12% 155 Seacoast 47% 42% 4% 6% 121 Manchester Area 41% 46% 7% 5% 99 First Cong. Dist. 51% 40% 3% 6% 285 Second Cong. Dist. 43% 41% 4% 12% 298
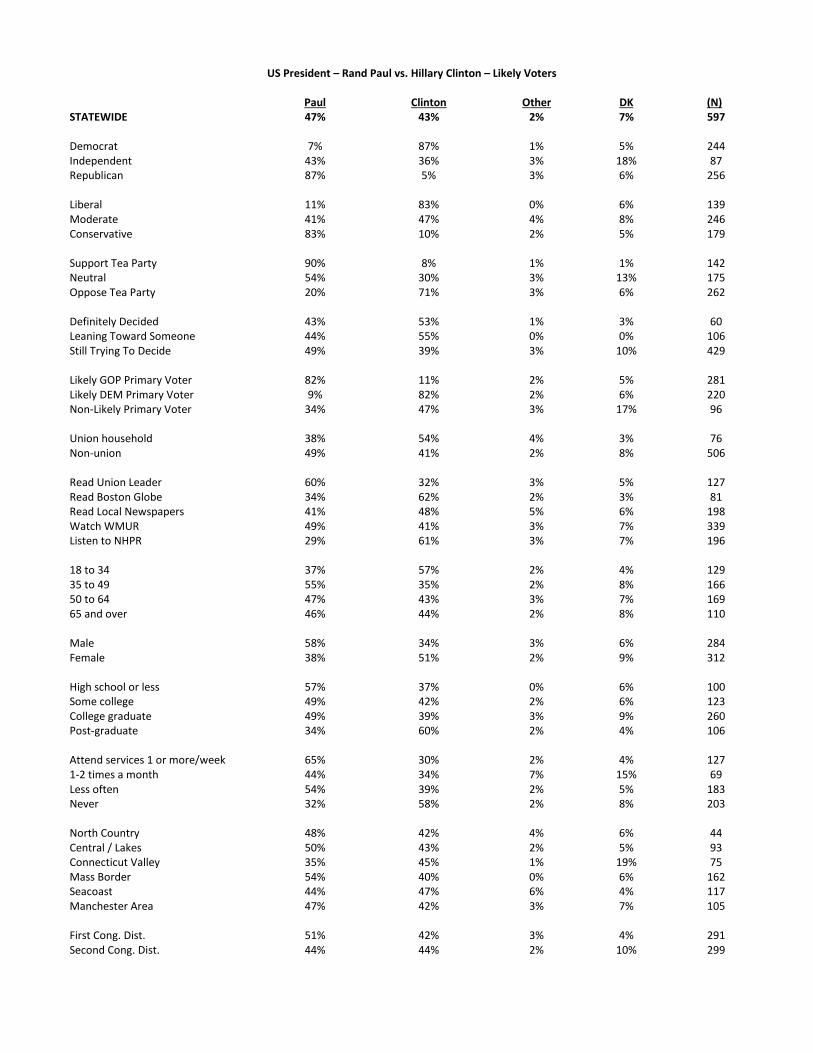
US President – Rand Paul vs. Hillary Clinton – Likely Voters Paul Clinton Other DK (N) STATEWIDE 47% 43% 2% 7% 597 Democrat 7% 87% 1% 5% 244 Independent 43% 36% 3% 18% 87 Republican 87% 5% 3% 6% 256 Liberal 11% 83% 0% 6% 139 Moderate 41% 47% 4% 8% 246 Conservative 83% 10% 2% 5% 179 Support Tea Party 90% 8% 1% 1% 142 Neutral 54% 30% 3% 13% 175 Oppose Tea Party 20% 71% 3% 6% 262 Definitely Decided 43% 53% 1% 3% 60 Leaning Toward Someone 44% 55% 0% 0% 106 Still Trying To Decide 49% 39% 3% 10% 429 Likely GOP Primary Voter 82% 11% 2% 5% 281 Likely DEM Primary Voter 9% 82% 2% 6% 220 Non-Likely Primary Voter 34% 47% 3% 17% 96 Union household 38% 54% 4% 3% 76 Non-union 49% 41% 2% 8% 506 Read Union Leader 60% 32% 3% 5% 127 Read Boston Globe 34% 62% 2% 3% 81 Read Local Newspapers 41% 48% 5% 6% 198 Watch WMUR 49% 41% 3% 7% 339 Listen to NHPR 29% 61% 3% 7% 196 18 to 34 37% 57% 2% 4% 129 35 to 49 55% 35% 2% 8% 166 50 to 64 47% 43% 3% 7% 169 65 and over 46% 44% 2% 8% 110 Male 58% 34% 3% 6% 284 Female 38% 51% 2% 9% 312 High school or less 57% 37% 0% 6% 100 Some college 49% 42% 2% 6% 123 College graduate 49% 39% 3% 9% 260 Post-graduate 34% 60% 2% 4% 106 Attend services 1 or more/week 65% 30% 2% 4% 127 1-2 times a month 44% 34% 7% 15% 69 Less often 54% 39% 2% 5% 183 Never 32% 58% 2% 8% 203 North Country 48% 42% 4% 6% 44 Central / Lakes 50% 43% 2% 5% 93 Connecticut Valley 35% 45% 1% 19% 75 Mass Border 54% 40% 0% 6% 162 Seacoast 44% 47% 6% 4% 117 Manchester Area 47% 42% 3% 7% 105 First Cong. Dist. 51% 42% 3% 4% 291 Second Cong. Dist. 44% 44% 2% 10% 299

US President – Scott Walker vs. Hillary Clinton – Likely Voters Walker Clinton Other DK (N) STATEWIDE 44% 44% 3% 9% 596 Democrat 3% 91% 0% 5% 244 Independent 28% 36% 12% 24% 85 Republican 86% 3% 3% 8% 257 Liberal 7% 86% 2% 5% 137 Moderate 39% 47% 2% 12% 249 Conservative 79% 11% 3% 7% 180 Support Tea Party 88% 7% 2% 2% 140 Neutral 50% 31% 5% 15% 175 Oppose Tea Party 16% 73% 2% 9% 263 Definitely Decided 38% 61% 1% 0% 59 Leaning Toward Someone 45% 52% 2% 1% 106 Still Trying To Decide 44% 40% 3% 13% 429 Likely GOP Primary Voter 83% 9% 1% 7% 282 Likely DEM Primary Voter 5% 85% 2% 7% 221 Non-Likely Primary Voter 17% 53% 8% 22% 93 Union household 36% 55% 3% 6% 78 Non-union 45% 42% 3% 10% 503 Read Union Leader 55% 35% 2% 8% 127 Read Boston Globe 27% 64% 2% 7% 86 Read Local Newspapers 40% 47% 5% 8% 200 Watch WMUR 45% 40% 3% 12% 338 Listen to NHPR 24% 65% 2% 10% 197 18 to 34 32% 59% 5% 4% 130 35 to 49 50% 36% 2% 13% 166 50 to 64 44% 44% 3% 8% 166 65 and over 46% 42% 1% 10% 111 Male 56% 34% 3% 6% 284 Female 33% 53% 2% 12% 312 High school or less 46% 38% 5% 11% 99 Some college 44% 45% 2% 8% 123 College graduate 50% 39% 2% 9% 260 Post-graduate 27% 62% 4% 7% 107 Attend services 1 or more/week 60% 30% 4% 6% 123 1-2 times a month 42% 32% 6% 21% 68 Less often 49% 41% 2% 8% 184 Never 30% 60% 2% 7% 206 North Country 44% 40% 2% 15% 44 Central / Lakes 53% 41% 1% 6% 95 Connecticut Valley 32% 48% 1% 20% 75 Mass Border 49% 41% 3% 7% 159 Seacoast 41% 51% 5% 3% 118 Manchester Area 40% 44% 4% 12% 104 First Cong. Dist. 47% 43% 4% 7% 292 Second Cong. Dist. 41% 45% 2% 12% 298
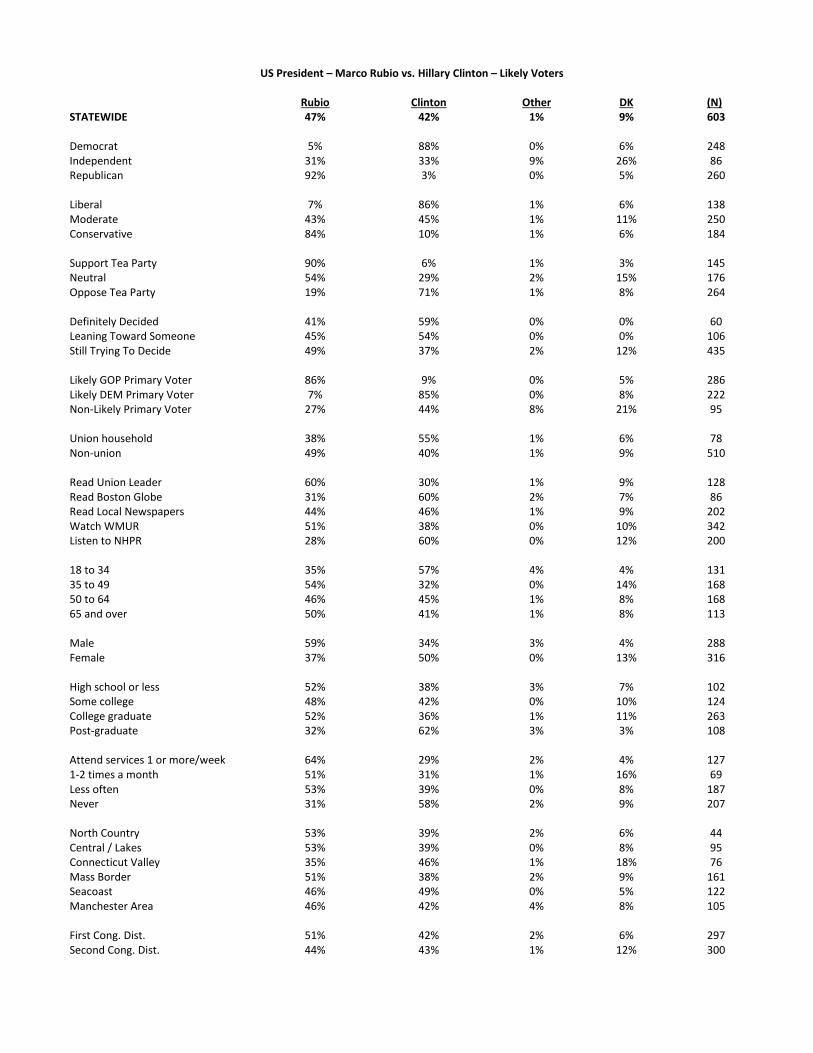
US President – Marco Rubio vs. Hillary Clinton – Likely Voters Rubio Clinton Other DK (N) STATEWIDE 47% 42% 1% 9% 603 Democrat 5% 88% 0% 6% 248 Independent 31% 33% 9% 26% 86 Republican 92% 3% 0% 5% 260 Liberal 7% 86% 1% 6% 138 Moderate 43% 45% 1% 11% 250 Conservative 84% 10% 1% 6% 184 Support Tea Party 90% 6% 1% 3% 145 Neutral 54% 29% 2% 15% 176 Oppose Tea Party 19% 71% 1% 8% 264 Definitely Decided 41% 59% 0% 0% 60 Leaning Toward Someone 45% 54% 0% 0% 106 Still Trying To Decide 49% 37% 2% 12% 435 Likely GOP Primary Voter 86% 9% 0% 5% 286 Likely DEM Primary Voter 7% 85% 0% 8% 222 Non-Likely Primary Voter 27% 44% 8% 21% 95 Union household 38% 55% 1% 6% 78 Non-union 49% 40% 1% 9% 510 Read Union Leader 60% 30% 1% 9% 128 Read Boston Globe 31% 60% 2% 7% 86 Read Local Newspapers 44% 46% 1% 9% 202 Watch WMUR 51% 38% 0% 10% 342 Listen to NHPR 28% 60% 0% 12% 200 18 to 34 35% 57% 4% 4% 131 35 to 49 54% 32% 0% 14% 168 50 to 64 46% 45% 1% 8% 168 65 and over 50% 41% 1% 8% 113 Male 59% 34% 3% 4% 288 Female 37% 50% 0% 13% 316 High school or less 52% 38% 3% 7% 102 Some college 48% 42% 0% 10% 124 College graduate 52% 36% 1% 11% 263 Post-graduate 32% 62% 3% 3% 108 Attend services 1 or more/week 64% 29% 2% 4% 127 1-2 times a month 51% 31% 1% 16% 69 Less often 53% 39% 0% 8% 187 Never 31% 58% 2% 9% 207 North Country 53% 39% 2% 6% 44 Central / Lakes 53% 39% 0% 8% 95 Connecticut Valley 35% 46% 1% 18% 76 Mass Border 51% 38% 2% 9% 161 Seacoast 46% 49% 0% 5% 122 Manchester Area 46% 42% 4% 8% 105 First Cong. Dist. 51% 42% 2% 6% 297 Second Cong. Dist. 44% 43% 1% 12% 300
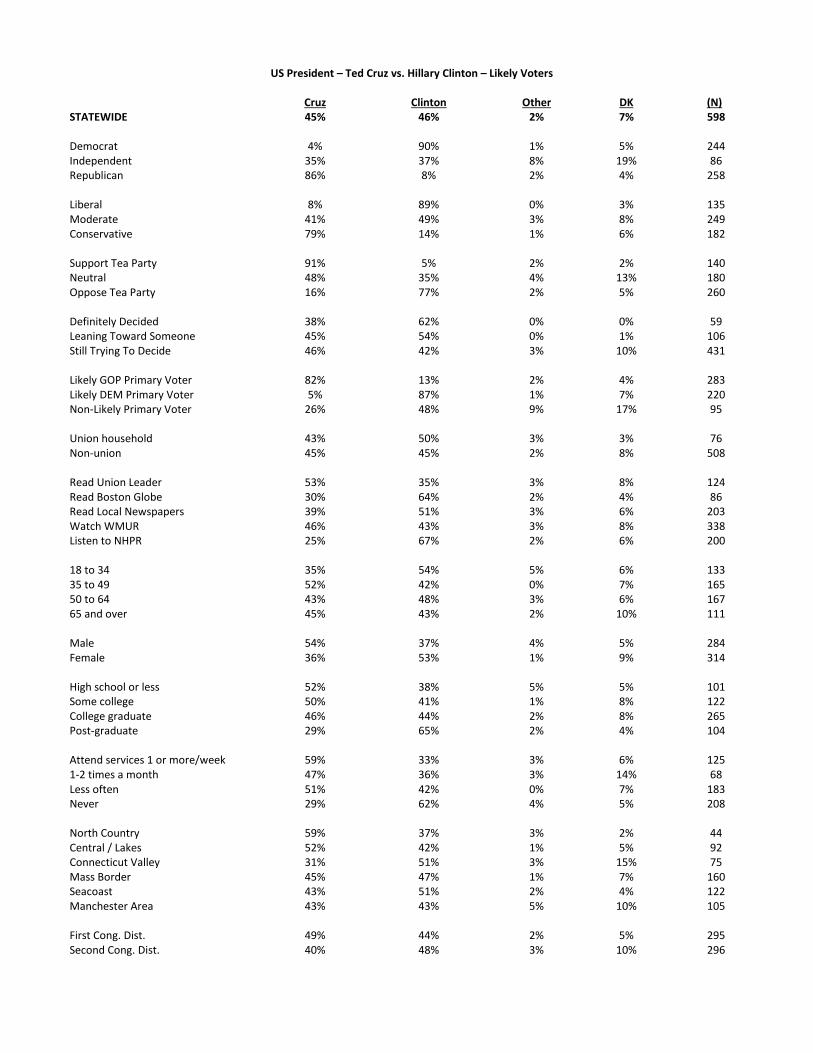
US President – Ted Cruz vs. Hillary Clinton – Likely Voters Cruz Clinton Other DK (N) STATEWIDE 45% 46% 2% 7% 598 Democrat 4% 90% 1% 5% 244 Independent 35% 37% 8% 19% 86 Republican 86% 8% 2% 4% 258 Liberal 8% 89% 0% 3% 135 Moderate 41% 49% 3% 8% 249 Conservative 79% 14% 1% 6% 182 Support Tea Party 91% 5% 2% 2% 140 Neutral 48% 35% 4% 13% 180 Oppose Tea Party 16% 77% 2% 5% 260 Definitely Decided 38% 62% 0% 0% 59 Leaning Toward Someone 45% 54% 0% 1% 106 Still Trying To Decide 46% 42% 3% 10% 431 Likely GOP Primary Voter 82% 13% 2% 4% 283 Likely DEM Primary Voter 5% 87% 1% 7% 220 Non-Likely Primary Voter 26% 48% 9% 17% 95 Union household 43% 50% 3% 3% 76 Non-union 45% 45% 2% 8% 508 Read Union Leader 53% 35% 3% 8% 124 Read Boston Globe 30% 64% 2% 4% 86 Read Local Newspapers 39% 51% 3% 6% 203 Watch WMUR 46% 43% 3% 8% 338 Listen to NHPR 25% 67% 2% 6% 200 18 to 34 35% 54% 5% 6% 133 35 to 49 52% 42% 0% 7% 165 50 to 64 43% 48% 3% 6% 167 65 and over 45% 43% 2% 10% 111 Male 54% 37% 4% 5% 284 Female 36% 53% 1% 9% 314 High school or less 52% 38% 5% 5% 101 Some college 50% 41% 1% 8% 122 College graduate 46% 44% 2% 8% 265 Post-graduate 29% 65% 2% 4% 104 Attend services 1 or more/week 59% 33% 3% 6% 125 1-2 times a month 47% 36% 3% 14% 68 Less often 51% 42% 0% 7% 183 Never 29% 62% 4% 5% 208 North Country 59% 37% 3% 2% 44 Central / Lakes 52% 42% 1% 5% 92 Connecticut Valley 31% 51% 3% 15% 75 Mass Border 45% 47% 1% 7% 160 Seacoast 43% 51% 2% 4% 122 Manchester Area 43% 43% 5% 10% 105 First Cong. Dist. 49% 44% 2% 5% 295 Second Cong. Dist. 40% 48% 3% 10% 296
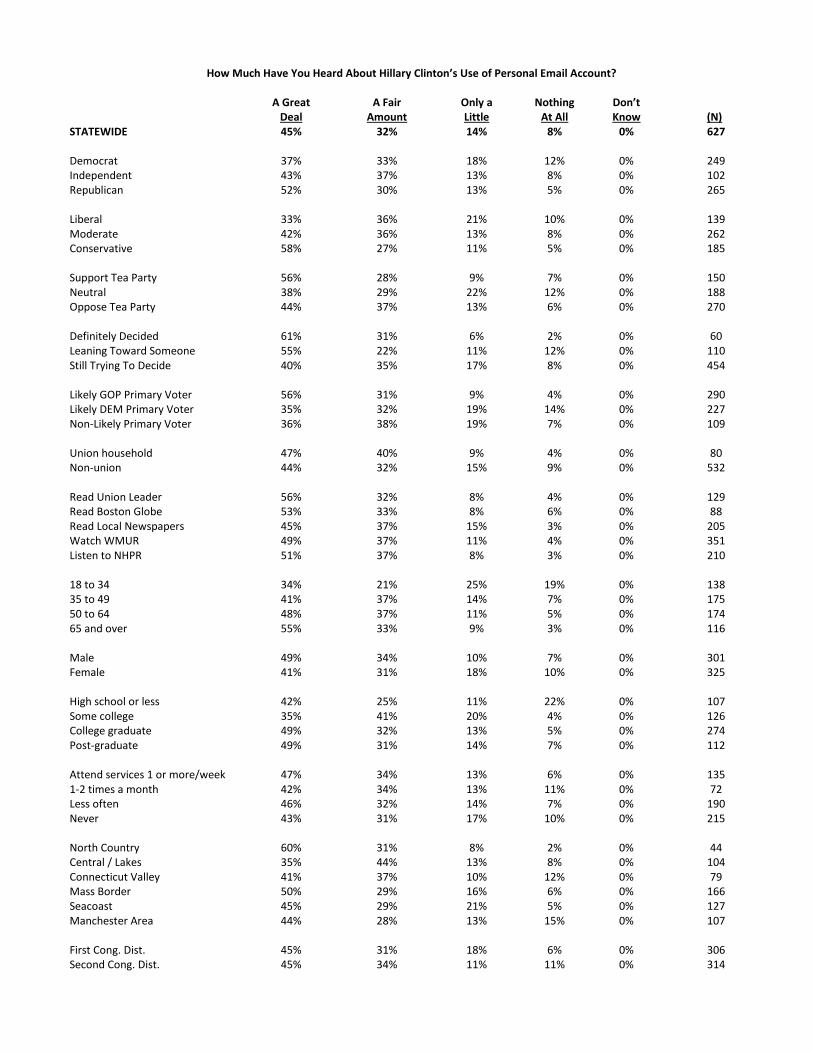
How Much Have You Heard About Hillary Clinton’s Use of Personal Email Account? A Great A Fair Only a Nothing Don’t Deal Amount Little At All Know (N) STATEWIDE 45% 32% 14% 8% 0% 627 Democrat 37% 33% 18% 12% 0% 249 Independent 43% 37% 13% 8% 0% 102 Republican 52% 30% 13% 5% 0% 265 Liberal 33% 36% 21% 10% 0% 139 Moderate 42% 36% 13% 8% 0% 262 Conservative 58% 27% 11% 5% 0% 185 Support Tea Party 56% 28% 9% 7% 0% 150 Neutral 38% 29% 22% 12% 0% 188 Oppose Tea Party 44% 37% 13% 6% 0% 270 Definitely Decided 61% 31% 6% 2% 0% 60 Leaning Toward Someone 55% 22% 11% 12% 0% 110 Still Trying To Decide 40% 35% 17% 8% 0% 454 Likely GOP Primary Voter 56% 31% 9% 4% 0% 290 Likely DEM Primary Voter 35% 32% 19% 14% 0% 227 Non-Likely Primary Voter 36% 38% 19% 7% 0% 109 Union household 47% 40% 9% 4% 0% 80 Non-union 44% 32% 15% 9% 0% 532 Read Union Leader 56% 32% 8% 4% 0% 129 Read Boston Globe 53% 33% 8% 6% 0% 88 Read Local Newspapers 45% 37% 15% 3% 0% 205 Watch WMUR 49% 37% 11% 4% 0% 351 Listen to NHPR 51% 37% 8% 3% 0% 210 18 to 34 34% 21% 25% 19% 0% 138 35 to 49 41% 37% 14% 7% 0% 175 50 to 64 48% 37% 11% 5% 0% 174 65 and over 55% 33% 9% 3% 0% 116 Male 49% 34% 10% 7% 0% 301 Female 41% 31% 18% 10% 0% 325 High school or less 42% 25% 11% 22% 0% 107 Some college 35% 41% 20% 4% 0% 126 College graduate 49% 32% 13% 5% 0% 274 Post-graduate 49% 31% 14% 7% 0% 112 Attend services 1 or more/week 47% 34% 13% 6% 0% 135 1-2 times a month 42% 34% 13% 11% 0% 72 Less often 46% 32% 14% 7% 0% 190 Never 43% 31% 17% 10% 0% 215 North Country 60% 31% 8% 2% 0% 44 Central / Lakes 35% 44% 13% 8% 0% 104 Connecticut Valley 41% 37% 10% 12% 0% 79 Mass Border 50% 29% 16% 6% 0% 166 Seacoast 45% 29% 21% 5% 0% 127 Manchester Area 44% 28% 13% 15% 0% 107 First Cong. Dist. 45% 31% 18% 6% 0% 306 Second Cong. Dist. 45% 34% 11% 11% 0% 314
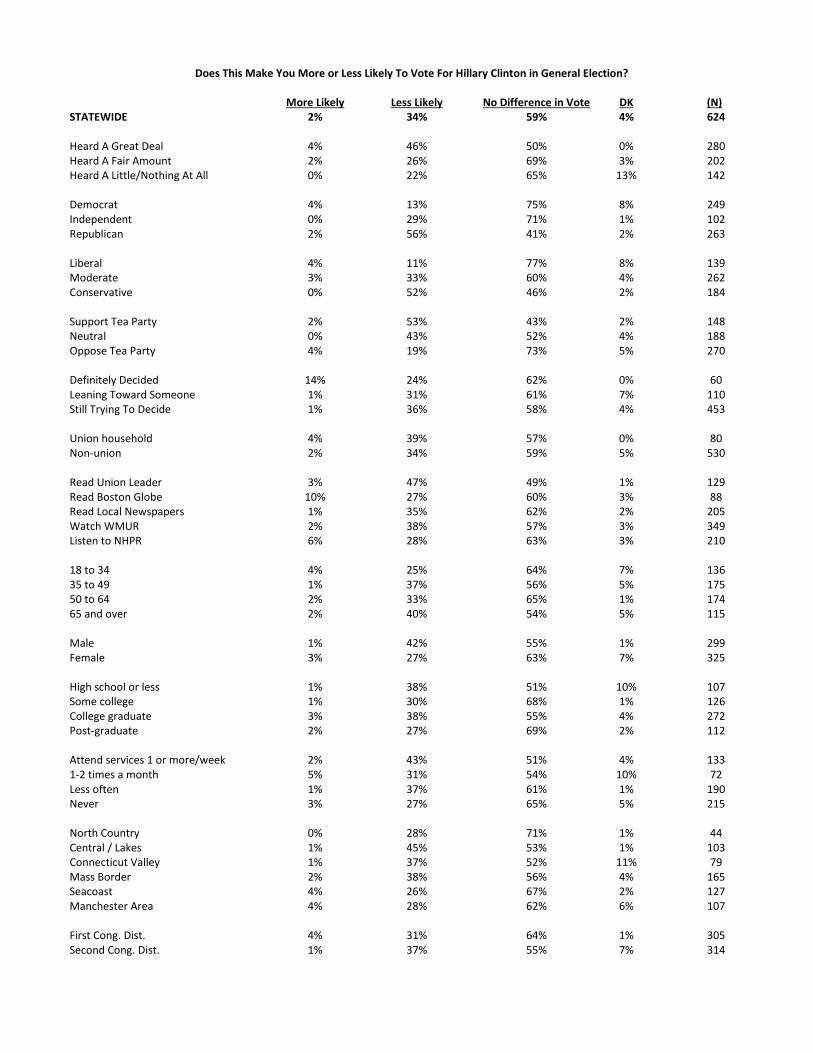
Does This Make You More or Less Likely To Vote For Hillary Clinton in General Election? More Likely Less Likely No Difference in Vote DK (N) STATEWIDE 2% 34% 59% 4% 624 Heard A Great Deal 4% 46% 50% 0% 280 Heard A Fair Amount 2% 26% 69% 3% 202 Heard A Little/Nothing At All 0% 22% 65% 13% 142 Democrat 4% 13% 75% 8% 249 Independent 0% 29% 71% 1% 102 Republican 2% 56% 41% 2% 263 Liberal 4% 11% 77% 8% 139 Moderate 3% 33% 60% 4% 262 Conservative 0% 52% 46% 2% 184 Support Tea Party 2% 53% 43% 2% 148 Neutral 0% 43% 52% 4% 188 Oppose Tea Party 4% 19% 73% 5% 270 Definitely Decided 14% 24% 62% 0% 60 Leaning Toward Someone 1% 31% 61% 7% 110 Still Trying To Decide 1% 36% 58% 4% 453 Union household 4% 39% 57% 0% 80 Non-union 2% 34% 59% 5% 530 Read Union Leader 3% 47% 49% 1% 129 Read Boston Globe 10% 27% 60% 3% 88 Read Local Newspapers 1% 35% 62% 2% 205 Watch WMUR 2% 38% 57% 3% 349 Listen to NHPR 6% 28% 63% 3% 210 18 to 34 4% 25% 64% 7% 136 35 to 49 1% 37% 56% 5% 175 50 to 64 2% 33% 65% 1% 174 65 and over 2% 40% 54% 5% 115 Male 1% 42% 55% 1% 299 Female 3% 27% 63% 7% 325 High school or less 1% 38% 51% 10% 107 Some college 1% 30% 68% 1% 126 College graduate 3% 38% 55% 4% 272 Post-graduate 2% 27% 69% 2% 112 Attend services 1 or more/week 2% 43% 51% 4% 133 1-2 times a month 5% 31% 54% 10% 72 Less often 1% 37% 61% 1% 190 Never 3% 27% 65% 5% 215 North Country 0% 28% 71% 1% 44 Central / Lakes 1% 45% 53% 1% 103 Connecticut Valley 1% 37% 52% 11% 79 Mass Border 2% 38% 56% 4% 165 Seacoast 4% 26% 67% 2% 127 Manchester Area 4% 28% 62% 6% 107 First Cong. Dist. 4% 31% 64% 1% 305 Second Cong. Dist. 1% 37% 55% 7% 314