Embed Size (px)
Citation preview

THE WMUR GRANITE STATE POLL
August 5, 2015 CLINTON LEADS TRUMP IN NH, DEADLOCKED WITH OTHER GOP CANDIDATES By: Andrew E. Smith, Ph.D. Zachary S. Azem, M.A. UNH Survey Center 603/862-2226 www.unh.edu/survey-center DURHAM, NH –Democratic frontrunner Hillary Clinton is locked in tight matchups with four potential Republican challengers, but holds a lead over the current leader of the New Hampshire Republican field, Donald Trump.
These findings are based on the latest WMUR Granite State Poll, conducted by the University of New Hampshire Survey Center. Seven hundred and twenty-two (722) randomly selected New Hampshire adults were interviewed by landline and cellular telephone between July 22 and July 30, 2015. The margin of sampling error is +/- 3.6 percent. Included were three hundred nine (309) likely 2016 Republican Primary voters (MSE = +/-5.6), two hundred seventy-six (276) likely 2016 Democratic Primary voters (MSE = +/-5.9), and six hundred and fifty-two (652) likely 2016 presidential election voters (MSE = +/- 3.8).
2016 U.S. Presidential Election
With the 2016 election more than a year away, very few New Hampshire voters have decided who they will vote support in the November 2016 presidential Election. Only 16% of likely voters say they have definitely decided who to support, 22% are leaning towards someone, and 62% are still trying to decide. Former Secretary of State Hillary Clinton currently is in a tight race with Bernie Sanders in New Hampshire to be the 2016 nominee of the Democratic Party. One of her strongest arguments has been her electability in part because polls have shown her leading potential Republican candidates by comfortable margins, even in swing states. In February, Clinton held comfortable leads over top Republican candidates in the swing state of New Hampshire, but her advantage has dissipated over recent months and she would face significant challenges from all of the top Republican candidates. If the 2016 presidential election was held today and the candidates were Hillary Clinton and former Florida governor Jeb Bush, 46% of likely voters say they would vote for Bush, 45% would vote for Clinton, 3% would support someone else, and 6% are undecided. At this point, members of both parties heavily support their candidate and a significant percentage of independents are undecided. Bush has a 14 point edge among male voters, while Clinton has a 10 point advantage among female voters.
We ask that this copyrighted information be referred to as the Granite State Poll, sponsored by WMUR-TV, and conducted by the University of New Hampshire Survey Center.

Kentucky senator Rand Paul currently is among the leading Republicans vying for the nomination but represents a more libertarian wing of the party. If Paul were the Republican nominee, 45% of likely voters say they would vote for him, 43% would vote for Clinton, 3% support someone else, and 9% are undecided. Independents lean toward Paul over Clinton – 39% favor Paul and 31% favor Clinton. Clinton leads among women by 14 percentage points but Paul leads among men by 20 percentage points.
51%
39%
8%
41% 47%
9%
45% 46%
6%
85%
7% 5%
38% 37%
19%
6%
90%
3%
0%
10%
20%
30%
40%
50%
60%
70%
80%
90%
100%
Clinton Bush Don't Know
President - Clinton vs. Bush
All Likely Voters (Feb. '15) All Likely Voters (May '15) All Likely Voters (July '15)
Democrat Independent Republican
50%
40%
8%
43% 47%
7%
43% 45%
9%
84%
7% 6%
31% 39%
24%
6%
88%
5%
0%
10%
20%
30%
40%
50%
60%
70%
80%
90%
100%
Clinton Paul Don't Know
President - Clinton vs. Paul
All Likely Voters (Feb. '15) All Likely Voters (May '15) All Likely Voters (July '15)
Democrat Independent Republican

Florida senator Marco Rubio also does well against Clinton. If Rubio were the Republican nominee, 44% of likely voters say they would vote for Clinton, 43% would vote for Rubio, 3% support someone else, and 10% are undecided. Independents also split between Rubio and Clinton – 37% favor Clinton and 36% favor Rubio. Clinton holds a 15 percentage point lead among women, while Rubio has a 15 percentage point advantage among men.
Wisconsin governor Scott Walker, who is currently the most popular candidate among New Hampshire likely Republican primary voters, is also deadlocked in a hypothetical matchup with Clinton. If Walker were the Republican nominee, 45% of likely voters say they would vote for Walker, 43% would vote for Clinton, 2% support someone else, and 10% are undecided. Independents lean toward Walker over Clinton – 39% favor Walker and 32% favor Clinton. The gender gap between Clinton and Walker is a wash as Clinton has a 15 percentage point advantage over Walker among women and Walker holds a 19 percentage point lead among men.
42% 47%
9%
44% 43%
10%
82%
5% 10%
37% 36%
21%
7%
85%
5%
0%
10%
20%
30%
40%
50%
60%
70%
80%
90%
100%
Clinton Rubio Don't Know
President - Clinton vs. Rubio
All Likely Voters (May '15) All Likely Voters (July '15) Democrat Independent Republican
44% 44%
9%
43% 45%
10%
84%
5% 8%
32% 39%
26%
6%
88%
5%
0%
10%
20%
30%
40%
50%
60%
70%
80%
90%
100%
Clinton Walker Don't Know
President - Clinton vs. Walker
All Likely Voters (May '15) All Likely Voters (July '15) Democrat Independent Republican

Businessman Donald Trump, who now tops the New Hampshire Republican primary field, does not do as well in a matchup with Clinton as other Republicans. If Trump were the Republican nominee, 50% of likely voters say they would vote for Clinton, 40% would vote for Trump, 2% support someone else, and 7% are undecided. Independent voters lean to Clinton over Trump – 43% favor Clinton while 33% say they would vote for Trump. There is a significant gender gap between Clinton and Trump with Clinton holding a 26 percentage point lead over Trump among women while Trump has only a 6 percentage point advantage among men.
50%
40%
7%
90%
5% 3%
43%
33%
20%
11%
81%
6%
0%
10%
20%
30%
40%
50%
60%
70%
80%
90%
100%
Clinton Trump Don't Know
President - Clinton vs. Trump
All Likely Voters Democrat Independent Republican

Granite State Poll Methodology These findings are based on the latest WMUR Granite State Poll, conducted by the University of New Hampshire Survey Center and funded by WMUR-TV, Manchester, NH. Seven hundred and twenty-two (722) randomly selected New Hampshire adults were interviewed by landline and cellular telephone between July 22 and July 30, 2015. The margin of sampling error is +/- 3.6 percent for the entire sample. Included were three hundred nine (309) likely 2016 Republican Primary voters (MSE = +/-5.6), two hundred seventy-six (276) likely 2016 Democratic Primary voters (MSE = +/-5.9), and six hundred and fifty-two (652) likely 2016 presidential election voters (MSE = +/- 3.8). These MSE’s have not been adjusted for design effect. The design effect for the survey is 1.1% and 1.1% for the sample of likely 2016 general election voters. The random sample used in the WMUR Granite State Poll was purchased from Scientific Telephone Samples (STS), Foothill Ranch, CA. STS screens each selected telephone number to eliminate non-working numbers, disconnected numbers, and business numbers to improve the efficiency of the sample, reducing the amount of time interviewers spend calling non-usable numbers. The data have been weighted to adjust for numbers of adults and telephone lines within households, respondent sex, age, and region of the state. In addition to potential sampling error, all surveys have other potential sources of non-sampling error including question order effects, question wording effects, and non-response. Due to rounding, percentages may not sum to 100%. The number of respondents in each demographic below may not equal the number reported in cross-tabulation tables as some respondents choose not to answer some questions. For more information about the methodology used in the WMUR Granite State Poll, contact Dr. Andrew Smith at (603) 862-2226 or by email at [email protected].
Granite State Poll, Summer 2015 Demographics
Sex
N %
Region N %
Male 353 49%
North Country 56 8%
Female 369 51%
Central/Lakes 117 16%
Connecticut Valley 112 16%
Age N % Mass Border 197 27%
18 to 34 185 26%
Seacoast 123 17%
35 to 49 186 27% Manchester Area 117 16%
50 to 64 204 29%
65 and Over 126 18%
Party Registration N %
Democrat 163 27%
Highest Level of Education N %
Undeclared 294 48%
High School or Less 123 17%
Republican 157 26%
Some College 171 24%
College Graduate 256 36%
Party Identification N %
Post-Graduate 163 23% Democrat 290 41%
Independent 123 18%
Republican 290 41%

Granite State Poll, Summer 2015 - Likely Presidential Election Voter Demographics
Sex N % Region N %
Male 317 49% North Country 54 8%
Female 335 51% Central/Lakes 106 16%
Connecticut Valley 99 15%
Age N % Mass Border 175 27%
18 to 34 160 25% Seacoast 112 17%
35 to 49 162 25% Manchester Area 106 16%
50 to 64 195 31%
65 and Over 118 19% Party Registration N %
Democrat 158 27%
Highest Level of Education N % Undeclared 279 47%
High School or Less 94 15% Republican 151 26%
Some College 157 24%
College Graduate 238 37% Party Identification N %
Post-Graduate 156 24% Democrat 275 43%
Independent 100 15%
Republican 268 42%

Firmness of Presidential Vote “I know that it is early, but have you definitely decided who you will vote for in the election for President in 2016… are you leaning toward someone … or have you considered some candidates but are still trying to decide?”
Feb. ’15 May ’15 July ‘15 Definitely Decided 7% 10% 16% Leaning Toward Someone 13% 18% 22% Still Trying to Decide 81% 73% 62% N= (768) (625) (650)
US President – Clinton vs. Bush “Suppose the 2016 presidential election was being held today and the candidates were Jeb Bush, the Republican, and Hillary Clinton, the Democrat, who would you vote for?” ROTATE CANDIDATES Feb. ’15 May ’15 July ‘15 Bush 39% 47% 46% Clinton 51% 41% 45% Other 2% 3% 3% Don’t know / undecided 8% 9% 6% (N=) (742) (589) (631)
US President – Clinton vs. Paul “Suppose the 2016 presidential election was being held today and the candidates were Rand Paul, the Republican, and Hillary Clinton, the Democrat, who would you vote for?” ROTATE CANDIDATES Feb. ’15 May ’15 July ‘15 Paul 40% 47% 45% Clinton 50% 43% 43% Other 2% 2% 3% Don’t know / undecided 8% 7% 9% (N=) (748) (597) (632)
US President – Clinton vs. Walker
“Suppose the 2016 presidential election was being held today and the candidates were Scott Walker, the Republican, and Hillary Clinton, the Democrat, who would you vote for?” ROTATE CANDIDATES May ’15 July ‘15 Walker 44% 45% Clinton 44% 43% Other 3% 2% Don’t know / undecided 9% 10% (N=) (596) (638)

US President – Clinton vs. Rubio “Suppose the 2016 presidential election was being held today and the candidates were Marco Rubio, the Republican, and Hillary Clinton, the Democrat, who would you vote for?” ROTATE CANDIDATES May ’15 July ‘15 Rubio 47% 43% Clinton 42% 44% Other 1% 3% Don’t know / undecided 9% 10% (N=) (603) (641)
US President – Clinton vs. Trump “Suppose the 2016 presidential election was being held today and the candidates were Donald Trump, the Republican, and Hillary Clinton, the Democrat, who would you vote for?” ROTATE CANDIDATES July ’15 Trump 40% Clinton 50% Other 2% Don’t know / undecided 7% (N=) (619)

Decided 2016 Presidential Election Vote Def. Leaning Still Trying Decided Towards Someone To Decide (N) STATEWIDE 16% 22% 62% 650 Democrat 22% 25% 53% 273 Independent 9% 16% 74% 100 Republican 12% 22% 66% 267 Liberal 22% 29% 49% 170 Moderate 10% 17% 73% 255 Conservative 18% 25% 56% 188 Support Tea Party 19% 28% 53% 145 Neutral 8% 14% 78% 200 Oppose Tea Party 21% 26% 53% 268 Definitely Decided 100% 0% 0% 104 Leaning Toward Someone 0% 100% 0% 145 Still Trying To Decide 0% 0% 100% 401 Likely GOP Primary Voter 12% 22% 65% 296 Likely DEM Primary Voter 22% 25% 53% 274 Non-Likely Primary Voter 7% 15% 79% 80 Union household 22% 18% 60% 77 Non-union 15% 23% 62% 562 Read Union Leader 14% 19% 68% 129 Read Boston Globe 23% 20% 58% 98 Read Local Newspapers 17% 24% 58% 248 Watch WMUR 14% 23% 64% 351 Listen to NHPR 23% 23% 55% 211 18 to 34 13% 21% 65% 160 35 to 49 20% 22% 58% 160 50 to 64 12% 23% 65% 195 65 and over 19% 25% 55% 117 Male 19% 28% 54% 317 Female 13% 17% 70% 333 High school or less 17% 28% 55% 94 Some college 13% 25% 62% 156 College graduate 13% 18% 69% 237 Post-graduate 22% 24% 54% 156 Attend services 1 or more/week 15% 27% 58% 135 1-2 times a month 8% 24% 68% 74 Less often 14% 21% 65% 189 Never 21% 22% 57% 234 North Country 21% 14% 65% 54 Central / Lakes 14% 18% 68% 104 Connecticut Valley 9% 32% 60% 99 Mass Border 19% 23% 58% 175 Seacoast 17% 24% 59% 112 Manchester Area 15% 19% 65% 105 First Cong. Dist 17% 22% 61% 310 Second Cong. Dist 15% 23% 63% 339

US President – Jeb Bush vs. Hillary Clinton – Likely Voters Bush Clinton Other DK (N) STATEWIDE 46% 45% 3% 6% 631 Democrat 7% 85% 2% 5% 270 Independent 37% 38% 6% 19% 93 Republican 90% 6% 1% 3% 259 Liberal 13% 80% 4% 3% 167 Moderate 45% 43% 2% 10% 252 Conservative 82% 13% 2% 2% 176 Support Tea Party 81% 12% 2% 5% 136 Neutral 58% 30% 3% 8% 195 Oppose Tea Party 19% 73% 3% 5% 263 Definitely Decided 31% 63% 4% 3% 99 Leaning Toward Someone 43% 52% 3% 2% 140 Still Trying To Decide 52% 37% 2% 9% 389 Likely GOP Primary Voter 87% 9% 2% 2% 283 Likely DEM Primary Voter 7% 83% 3% 7% 268 Non-Likely Primary Voter 35% 41% 4% 19% 79 Union household 45% 43% 5% 7% 74 Non-union 46% 45% 2% 6% 546 Read Union Leader 54% 36% 4% 6% 125 Read Boston Globe 34% 62% 1% 3% 99 Read Local Newspapers 41% 51% 2% 5% 240 Watch WMUR 50% 44% 1% 5% 341 Listen to NHPR 31% 62% 2% 5% 203 18 to 34 34% 55% 3% 8% 151 35 to 49 52% 40% 2% 6% 160 50 to 64 45% 47% 2% 5% 186 65 and over 52% 39% 3% 6% 116 Male 51% 37% 4% 8% 301 Female 42% 52% 1% 5% 329 High school or less 53% 36% 8% 4% 92 Some college 47% 42% 2% 9% 149 College graduate 52% 42% 2% 5% 230 Post-graduate 32% 59% 2% 7% 153 Attend services 1 or more/week 63% 31% 1% 5% 132 1-2 times a month 47% 41% 2% 10% 74 Less often 47% 43% 4% 6% 183 Never 34% 57% 3% 6% 225 North Country 57% 39% 0% 5% 54 Central / Lakes 49% 46% 1% 4% 104 Connecticut Valley 47% 48% 4% 1% 91 Mass Border 45% 44% 4% 7% 169 Seacoast 39% 51% 2% 8% 110 Manchester Area 48% 38% 2% 12% 102 First Cong. Dist 48% 43% 1% 8% 305 Second Cong. Dist 44% 46% 4% 5% 326
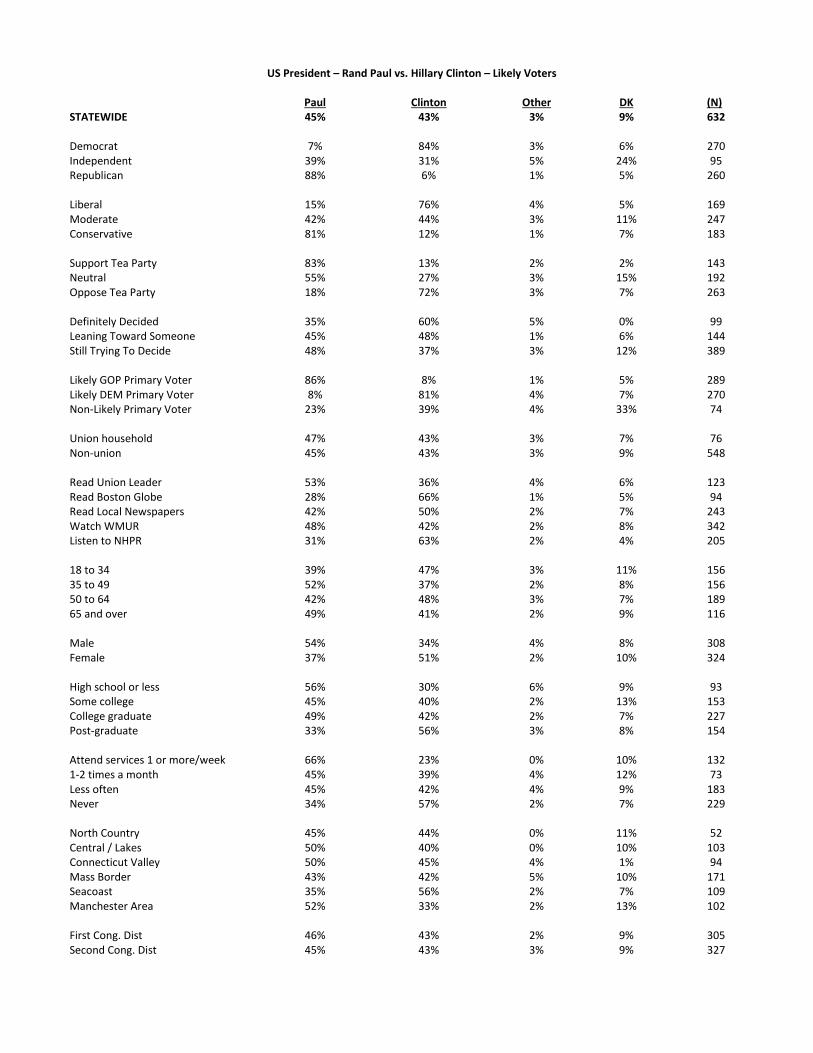
US President – Rand Paul vs. Hillary Clinton – Likely Voters Paul Clinton Other DK (N) STATEWIDE 45% 43% 3% 9% 632 Democrat 7% 84% 3% 6% 270 Independent 39% 31% 5% 24% 95 Republican 88% 6% 1% 5% 260 Liberal 15% 76% 4% 5% 169 Moderate 42% 44% 3% 11% 247 Conservative 81% 12% 1% 7% 183 Support Tea Party 83% 13% 2% 2% 143 Neutral 55% 27% 3% 15% 192 Oppose Tea Party 18% 72% 3% 7% 263 Definitely Decided 35% 60% 5% 0% 99 Leaning Toward Someone 45% 48% 1% 6% 144 Still Trying To Decide 48% 37% 3% 12% 389 Likely GOP Primary Voter 86% 8% 1% 5% 289 Likely DEM Primary Voter 8% 81% 4% 7% 270 Non-Likely Primary Voter 23% 39% 4% 33% 74 Union household 47% 43% 3% 7% 76 Non-union 45% 43% 3% 9% 548 Read Union Leader 53% 36% 4% 6% 123 Read Boston Globe 28% 66% 1% 5% 94 Read Local Newspapers 42% 50% 2% 7% 243 Watch WMUR 48% 42% 2% 8% 342 Listen to NHPR 31% 63% 2% 4% 205 18 to 34 39% 47% 3% 11% 156 35 to 49 52% 37% 2% 8% 156 50 to 64 42% 48% 3% 7% 189 65 and over 49% 41% 2% 9% 116 Male 54% 34% 4% 8% 308 Female 37% 51% 2% 10% 324 High school or less 56% 30% 6% 9% 93 Some college 45% 40% 2% 13% 153 College graduate 49% 42% 2% 7% 227 Post-graduate 33% 56% 3% 8% 154 Attend services 1 or more/week 66% 23% 0% 10% 132 1-2 times a month 45% 39% 4% 12% 73 Less often 45% 42% 4% 9% 183 Never 34% 57% 2% 7% 229 North Country 45% 44% 0% 11% 52 Central / Lakes 50% 40% 0% 10% 103 Connecticut Valley 50% 45% 4% 1% 94 Mass Border 43% 42% 5% 10% 171 Seacoast 35% 56% 2% 7% 109 Manchester Area 52% 33% 2% 13% 102 First Cong. Dist 46% 43% 2% 9% 305 Second Cong. Dist 45% 43% 3% 9% 327

US President – Scott Walker vs. Hillary Clinton – Likely Voters Walker Clinton Other DK (N) STATEWIDE 45% 43% 2% 10% 638 Democrat 5% 84% 4% 8% 269 Independent 39% 32% 3% 26% 97 Republican 88% 6% 0% 5% 264 Liberal 14% 81% 3% 2% 167 Moderate 40% 42% 3% 16% 254 Conservative 84% 12% 0% 4% 183 Support Tea Party 83% 12% 0% 5% 144 Neutral 55% 29% 2% 14% 198 Oppose Tea Party 17% 72% 4% 7% 261 Definitely Decided 34% 62% 2% 1% 100 Leaning Toward Someone 49% 48% 1% 2% 142 Still Trying To Decide 46% 37% 2% 15% 394 Likely GOP Primary Voter 85% 8% 1% 5% 293 Likely DEM Primary Voter 7% 82% 3% 7% 269 Non-Likely Primary Voter 22% 38% 3% 38% 76 Union household 44% 42% 4% 10% 77 Non-union 45% 43% 2% 10% 552 Read Union Leader 50% 37% 2% 10% 125 Read Boston Globe 26% 61% 0% 13% 98 Read Local Newspapers 41% 49% 2% 8% 248 Watch WMUR 47% 43% 1% 10% 348 Listen to NHPR 28% 63% 2% 7% 208 18 to 34 39% 47% 5% 9% 155 35 to 49 50% 36% 1% 13% 160 50 to 64 42% 48% 1% 8% 191 65 and over 48% 42% 2% 9% 116 Male 53% 34% 3% 10% 310 Female 37% 52% 1% 10% 328 High school or less 54% 32% 6% 9% 93 Some college 48% 39% 0% 13% 156 College graduate 49% 40% 1% 10% 231 Post-graduate 30% 60% 3% 7% 154 Attend services 1 or more/week 66% 27% 0% 7% 131 1-2 times a month 49% 38% 3% 10% 74 Less often 44% 42% 3% 11% 186 Never 32% 55% 2% 10% 232 North Country 41% 42% 6% 11% 53 Central / Lakes 48% 42% 0% 10% 104 Connecticut Valley 47% 41% 4% 8% 96 Mass Border 46% 40% 4% 10% 172 Seacoast 37% 54% 1% 9% 111 Manchester Area 48% 40% 0% 13% 103 First Cong. Dist 47% 43% 1% 9% 309 Second Cong. Dist 43% 43% 3% 11% 329

US President – Marco Rubio vs. Hillary Clinton – Likely Voters Rubio Clinton Other DK (N) STATEWIDE 43% 44% 3% 10% 641 Democrat 5% 82% 3% 10% 270 Independent 36% 37% 6% 21% 99 Republican 85% 7% 3% 5% 265 Liberal 13% 78% 3% 5% 167 Moderate 38% 43% 4% 15% 254 Conservative 81% 13% 2% 3% 184 Support Tea Party 82% 12% 2% 4% 144 Neutral 50% 33% 4% 13% 200 Oppose Tea Party 17% 70% 4% 9% 262 Definitely Decided 33% 62% 4% 1% 101 Leaning Toward Someone 43% 51% 2% 4% 144 Still Trying To Decide 46% 36% 4% 14% 394 Likely GOP Primary Voter 81% 10% 3% 6% 294 Likely DEM Primary Voter 8% 80% 3% 8% 268 Non-Likely Primary Voter 21% 44% 4% 31% 79 Union household 44% 40% 6% 9% 77 Non-union 43% 44% 3% 10% 555 Read Union Leader 53% 34% 5% 8% 126 Read Boston Globe 26% 68% 1% 5% 96 Read Local Newspapers 37% 52% 3% 8% 245 Watch WMUR 48% 42% 2% 9% 346 Listen to NHPR 29% 60% 3% 8% 208 18 to 34 33% 51% 6% 10% 156 35 to 49 48% 36% 2% 13% 160 50 to 64 42% 48% 2% 8% 192 65 and over 49% 41% 3% 8% 117 Male 51% 36% 5% 7% 313 Female 36% 51% 1% 12% 328 High school or less 48% 32% 8% 12% 94 Some college 47% 41% 3% 10% 156 College graduate 46% 42% 2% 10% 232 Post-graduate 33% 56% 3% 8% 154 Attend services 1 or more/week 71% 24% 0% 5% 133 1-2 times a month 44% 39% 2% 15% 74 Less often 40% 44% 5% 11% 187 Never 29% 57% 4% 10% 231 North Country 41% 41% 6% 12% 53 Central / Lakes 45% 43% 0% 12% 105 Connecticut Valley 49% 42% 4% 5% 96 Mass Border 42% 44% 5% 8% 170 Seacoast 38% 54% 1% 7% 111 Manchester Area 43% 36% 5% 17% 106 First Cong. Dist 44% 42% 3% 10% 311 Second Cong. Dist 42% 45% 4% 9% 330

US President – Donald Trump vs. Hillary Clinton – Likely Voters Trump Clinton Other DK (N) STATEWIDE 40% 50% 2% 7% 619 Democrat 5% 90% 2% 3% 269 Independent 33% 43% 4% 20% 95 Republican 81% 11% 2% 6% 247 Liberal 10% 86% 2% 3% 166 Moderate 36% 52% 3% 8% 243 Conservative 77% 15% 1% 7% 174 Support Tea Party 80% 15% 2% 3% 136 Neutral 46% 40% 1% 13% 189 Oppose Tea Party 15% 78% 4% 3% 260 Definitely Decided 37% 60% 2% 0% 102 Leaning Toward Someone 42% 54% 2% 2% 140 Still Trying To Decide 41% 46% 2% 11% 375 Likely GOP Primary Voter 77% 17% 2% 4% 279 Likely DEM Primary Voter 5% 88% 2% 5% 268 Non-Likely Primary Voter 31% 41% 2% 26% 72 Union household 39% 49% 5% 7% 74 Non-union 41% 50% 2% 7% 535 Read Union Leader 45% 46% 1% 8% 117 Read Boston Globe 19% 75% 1% 5% 92 Read Local Newspapers 37% 56% 2% 5% 236 Watch WMUR 43% 49% 2% 6% 335 Listen to NHPR 23% 70% 2% 5% 201 18 to 34 30% 59% 4% 7% 155 35 to 49 45% 46% 2% 7% 153 50 to 64 40% 53% 2% 4% 181 65 and over 47% 43% 1% 8% 115 Male 47% 41% 3% 8% 303 Female 34% 60% 1% 5% 316 High school or less 58% 35% 3% 4% 90 Some college 43% 44% 2% 12% 152 College graduate 43% 52% 1% 4% 222 Post-graduate 24% 64% 4% 7% 150 Attend services 1 or more/week 58% 28% 1% 13% 126 1-2 times a month 43% 48% 3% 6% 72 Less often 39% 53% 2% 7% 178 Never 32% 62% 3% 4% 227 North Country 36% 47% 6% 10% 52 Central / Lakes 42% 47% 0% 10% 99 Connecticut Valley 40% 53% 3% 5% 91 Mass Border 41% 52% 2% 4% 166 Seacoast 34% 57% 1% 9% 108 Manchester Area 46% 43% 3% 7% 103 First Cong. Dist 43% 48% 2% 7% 297 Second Cong. Dist 38% 53% 2% 7% 322