Embed Size (px)
Citation preview
Economic insights
CIBC World Markets Inc. • PO Box 500, 161 Bay Street, Brookfield Place, Toronto, Canada M5J 2S8 • Bloomberg @ CIBC • (416) 594-7000C I B C W o r l d M a r k e t s C o r p • 3 0 0 M a d i s o n A v e n u e , N e w Yo r k , N Y 1 0 0 1 7 • ( 2 1 2 ) 8 5 6 - 4 0 0 0 , ( 8 0 0 ) 9 9 9 - 6 7 2 6
Economics
Avery Shenfeld(416) 594-7356
Benjamin Tal(416) 956-3698
Andrew Grantham(416) 956-3219
Royce Mendes(416) 594-7354
Nick Exarhos(416) 956-6527
“text text text”
h t t p : / / r e s e a r c h .cibcwm.com/res/Eco/EcoResearch.html
It’s unusual for us to want to reconsider a full-year outlook that we published only a month ago, but then again, these are unusual times. Oil’s further plunge, and a similar malaise across most of the resource space (see pages 3-6), continues to push back the timetable for reaching a bottom in related capital spending in Canada.
Our already below-consensus forecast for Q4 growth had to be revised to virtually zero after October data rolled in. It now looks like 2016 will be below 1.5% real GDP growth rather than our prior 1.7% call. Even to achieve that pace, we’re allowing for an additional $10 bn in stimulus relative to the election platform and a $30 bn in federal deficit, and a slightly weaker track for the Canadian dollar.
While the country’s GDP is less heavily weighted to resource sector spending than it was a year ago, we’re only in the early stages of the negative spillover effects on other sectors. Indeed, it’s only because employment grew that we didn’t record an official recession, since real GDP fell slightly in the year to October 2015. That employment trend looks vulnerable in the affected provinces given signs of accelerating layoffs in the resource sector, and the fact that job creation has been leaning so heavily on self-employment rather than business hiring.
What’s added to the downdraft on Canada, and on asset markets, is a winter of discontent in investor sentiment globally.
That’s been most visible in the sharp retreat in equities, but is showing up in everything from rising corporate and provincial bond spreads, a flatter US Treasuries curve, and a build-up of cash in the Canadian household sector (see pages 9-11).
We may now be overdosing on pessimism relative to what actually lies ahead, opening up opportunities for contrarian investors. One call where we see limited reason to turn bearish is on 2016 US growth. You don’t get the hiring of hundreds of thousands of new workers without a degree of optimism among employers, and the US shrugged off a similar malaise in factory output and exports during the Asian crisis of 1998.
What about the plunge in Chinese equities? Nobody asked us about the implications of the Shanghai market when it was soaring a year ago. Nor should we pay heed to a likely depreciation in the yuan; larger FX swings happen all the time in other trading partners. If anything, recent import volumes suggest that even if the official data decelerate, the Chinese economy might actually be doing better of late.
The winter’s chill in sentiment could give way to a more balanced view of the world come spring, if US data on Q1 growth looks better, and China fears move past page one. Canada will be sluggish as noted, but risk assets could at least stabilize if views on the rest of the world don’t look as ugly as we move through the year.
The Winter of Our Discontentby Avery Shenfeld
January 28, 2016
CIBC World Markets InC. Economic Insights - January 28, 2016
2
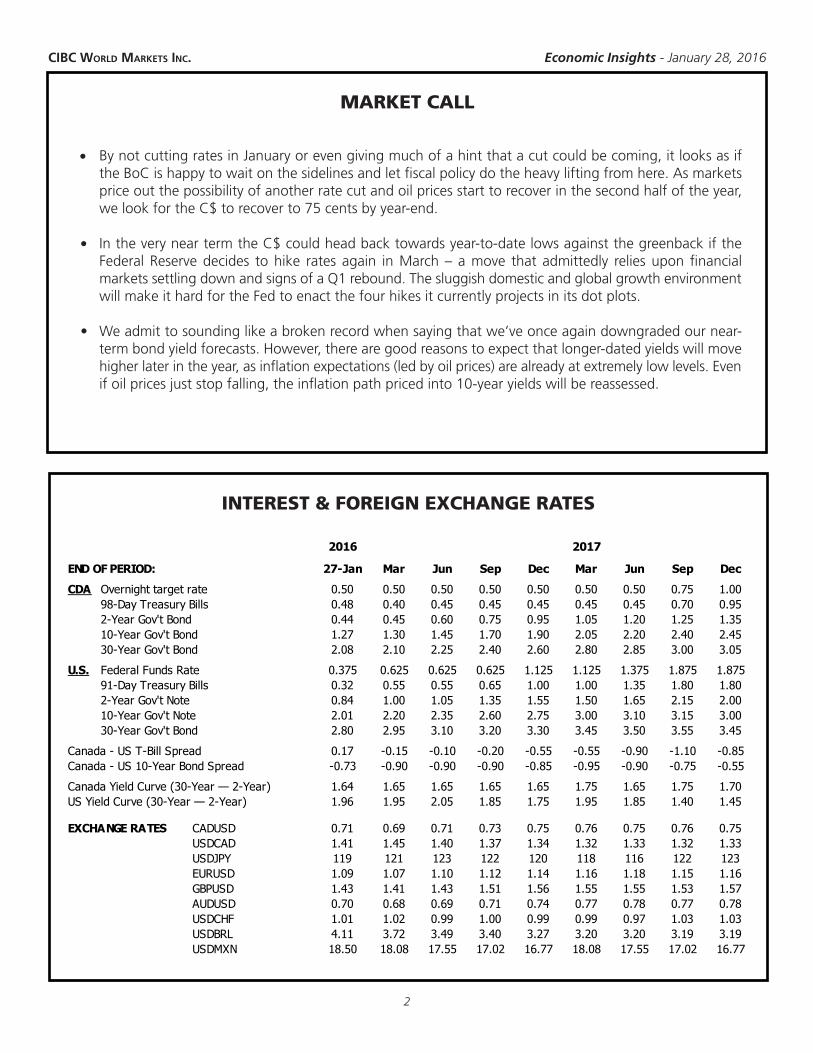
MARKET CALL
INTEREST & FOREIGN EXCHANGE RATES
By not cutting rates in January or even giving much of a hint that a cut could be coming, it looks as if the BoC is happy to wait on the sidelines and let fiscal policy do the heavy lifting from here. As markets price out the possibility of another rate cut and oil prices start to recover in the second half of the year, we look for the C$ to recover to 75 cents by year-end.
In the very near term the C$ could head back towards year-to-date lows against the greenback if the Federal Reserve decides to hike rates again in March – a move that admittedly relies upon financial markets settling down and signs of a Q1 rebound. The sluggish domestic and global growth environment will make it hard for the Fed to enact the four hikes it currently projects in its dot plots.
We admit to sounding like a broken record when saying that we’ve once again downgraded our near-term bond yield forecasts. However, there are good reasons to expect that longer-dated yields will move higher later in the year, as inflation expectations (led by oil prices) are already at extremely low levels. Even if oil prices just stop falling, the inflation path priced into 10-year yields will be reassessed.
•
•
•
bullets: Position: hanging left ind: 0.3125first line: -0.25
2016 2017
END OF PERIOD: 27-Jan Mar Jun Sep Dec Mar Jun Sep Dec
CDA Overnight target rate 0.50 0.50 0.50 0.50 0.50 0.50 0.50 0.75 1.0098-Day Treasury Bills 0.48 0.40 0.45 0.45 0.45 0.45 0.45 0.70 0.952-Year Gov't Bond 0.44 0.45 0.60 0.75 0.95 1.05 1.20 1.25 1.3510-Year Gov't Bond 1.27 1.30 1.45 1.70 1.90 2.05 2.20 2.40 2.4530-Year Gov't Bond 2.08 2.10 2.25 2.40 2.60 2.80 2.85 3.00 3.05
U.S. Federal Funds Rate 0.375 0.625 0.625 0.625 1.125 1.125 1.375 1.875 1.87591-Day Treasury Bills 0.32 0.55 0.55 0.65 1.00 1.00 1.35 1.80 1.802-Year Gov't Note 0.84 1.00 1.05 1.35 1.55 1.50 1.65 2.15 2.0010-Year Gov't Note 2.01 2.20 2.35 2.60 2.75 3.00 3.10 3.15 3.0030-Year Gov't Bond 2.80 2.95 3.10 3.20 3.30 3.45 3.50 3.55 3.45
Canada - US T-Bill Spread 0.17 -0.15 -0.10 -0.20 -0.55 -0.55 -0.90 -1.10 -0.85Canada - US 10-Year Bond Spread -0.73 -0.90 -0.90 -0.90 -0.85 -0.95 -0.90 -0.75 -0.55
Canada Yield Curve (30-Year — 2-Year) 1.64 1.65 1.65 1.65 1.65 1.75 1.65 1.75 1.70US Yield Curve (30-Year — 2-Year) 1.96 1.95 2.05 1.85 1.75 1.95 1.85 1.40 1.45
EXCHANGE RATES CADUSD 0.71 0.69 0.71 0.73 0.75 0.76 0.75 0.76 0.75USDCAD 1.41 1.45 1.40 1.37 1.34 1.32 1.33 1.32 1.33USDJPY 119 121 123 122 120 118 116 122 123EURUSD 1.09 1.07 1.10 1.12 1.14 1.16 1.18 1.15 1.16GBPUSD 1.43 1.41 1.43 1.51 1.56 1.55 1.55 1.53 1.57AUDUSD 0.70 0.68 0.69 0.71 0.74 0.77 0.78 0.77 0.78USDCHF 1.01 1.02 0.99 1.00 0.99 0.99 0.97 1.03 1.03USDBRL 4.11 3.72 3.49 3.40 3.27 3.20 3.20 3.19 3.19USDMXN 18.50 18.08 17.55 17.02 16.77 18.08 17.55 17.02 16.77
CIBC World Markets InC. Economic Insights - January 28, 2016
3
Commodity Outlook:Is it Safe to Get Back in The Water?
Nick Exarhos and Andrew Grantham
The sharks have been circling commodity markets for a while now, with large bites taken out of the prices of oil and many metals. However, commodity markets often overshoot, and looking beyond the very near term there are good reasons to dip a toe back in the water.
Even with China continuing to slow, growth in other emerging markets shouldn’t be as bad as 2015. Add in a further modest acceleration in Europe, and global growth should be a bit better this year and in 2017 (Table 1). And with supply finally starting to fall off in some areas, modest price recoveries should be in the cards as the market eyes brighter days in 2017.
Fragile China
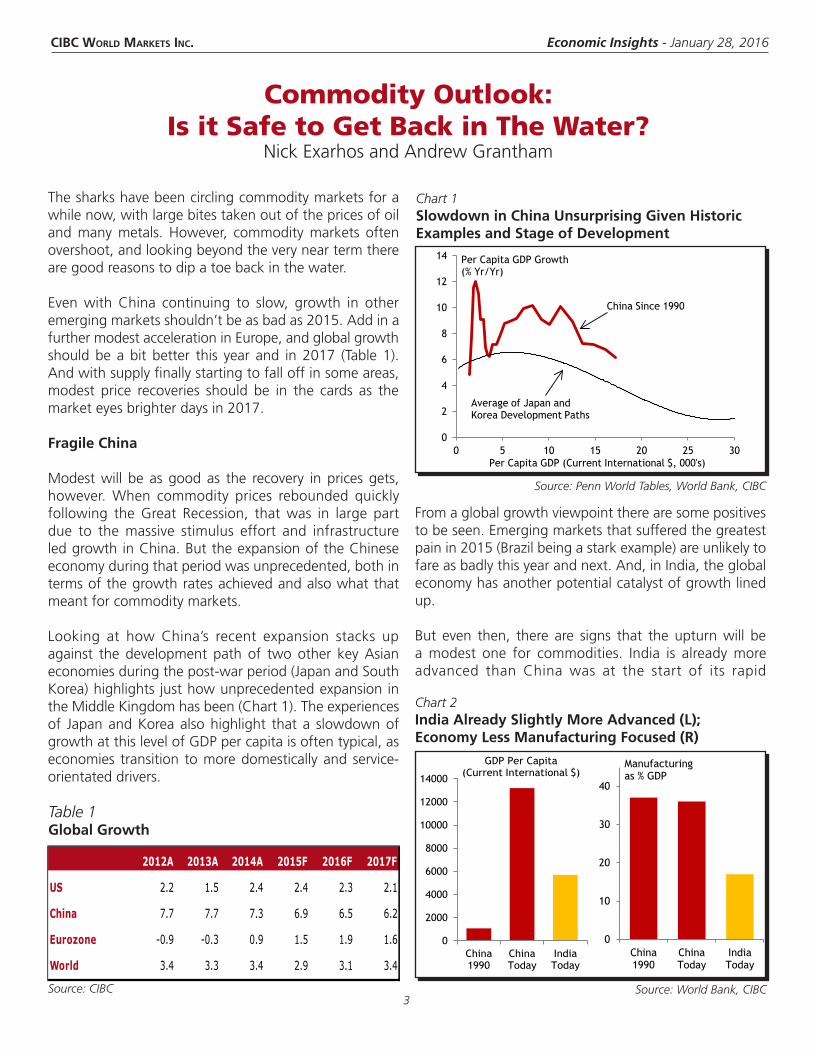
Modest will be as good as the recovery in prices gets, however. When commodity prices rebounded quickly following the Great Recession, that was in large part due to the massive stimulus effort and infrastructure led growth in China. But the expansion of the Chinese economy during that period was unprecedented, both in terms of the growth rates achieved and also what that meant for commodity markets.
Looking at how China’s recent expansion stacks up against the development path of two other key Asian economies during the post-war period (Japan and South Korea) highlights just how unprecedented expansion in the Middle Kingdom has been (Chart 1). The experiences of Japan and Korea also highlight that a slowdown of growth at this level of GDP per capita is often typical, as economies transition to more domestically and service-orientated drivers.
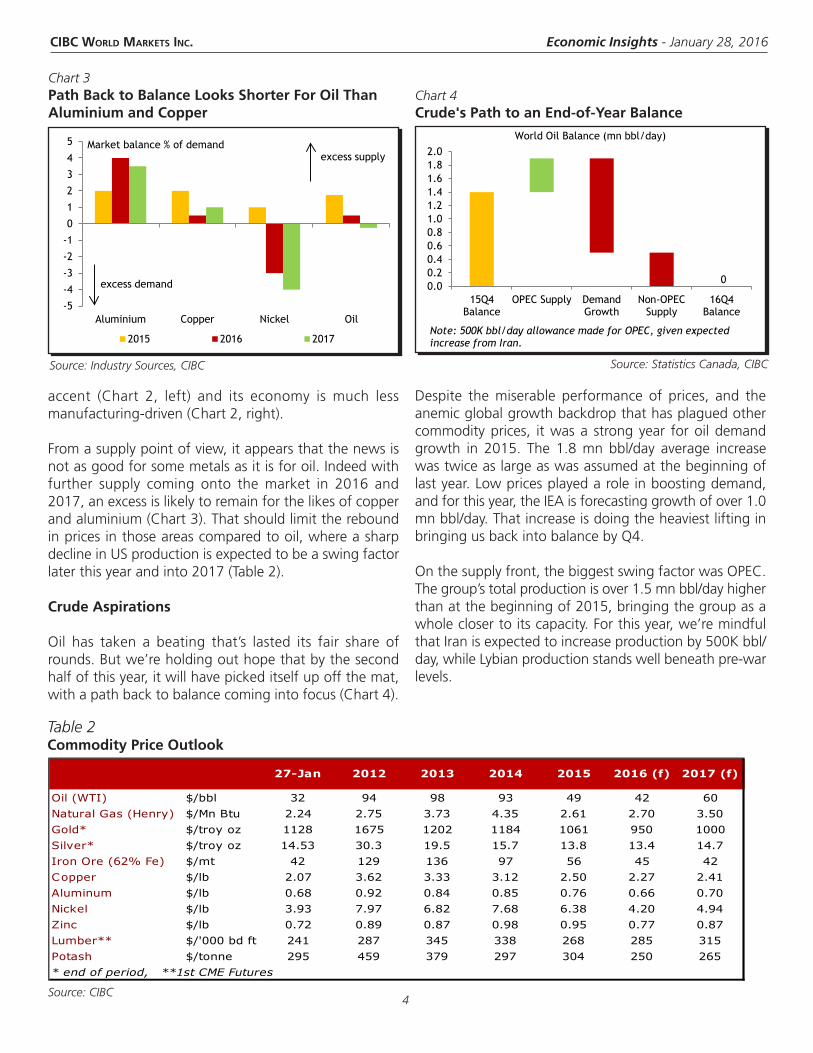
From a global growth viewpoint there are some positives to be seen. Emerging markets that suffered the greatest pain in 2015 (Brazil being a stark example) are unlikely to fare as badly this year and next. And, in India, the global economy has another potential catalyst of growth lined up.
But even then, there are signs that the upturn will be a modest one for commodities. India is already more advanced than China was at the start of its rapid
Chart 1Slowdown in China Unsurprising Given Historic Examples and Stage of Development
Source: Penn World Tables, World Bank, CIBC
0
2
4
6
8
10
12
14
0 5 10 15 20 25 30Per Capita GDP (Current International $, 000's)
Per Capita GDP Growth (% Yr/Yr)
China Since 1990
Average of Japan and Korea Development Paths
Chart 2India Already Slightly More Advanced (L);Economy Less Manufacturing Focused (R)
Source: World Bank, CIBC
0
2000
4000
6000
8000
10000
12000
14000
China1990
ChinaToday
IndiaToday
GDP Per Capita (Current International $)
0
10
20
30
40
China1990
ChinaToday
IndiaToday
Manufacturing as % GDP
Table 1Global Growth
Source: CIBC
2012A 2013A 2014A 2015F 2016F 2017F
US 2.2 1.5 2.4 2.4 2.3 2.1
China 7.7 7.7 7.3 6.9 6.5 6.2
Eurozone -0.9 -0.3 0.9 1.5 1.9 1.6
World 3.4 3.3 3.4 2.9 3.1 3.4
CIBC World Markets InC. Economic Insights - January 28, 2016
4
accent (Chart 2, left) and its economy is much less manufacturing-driven (Chart 2, right).
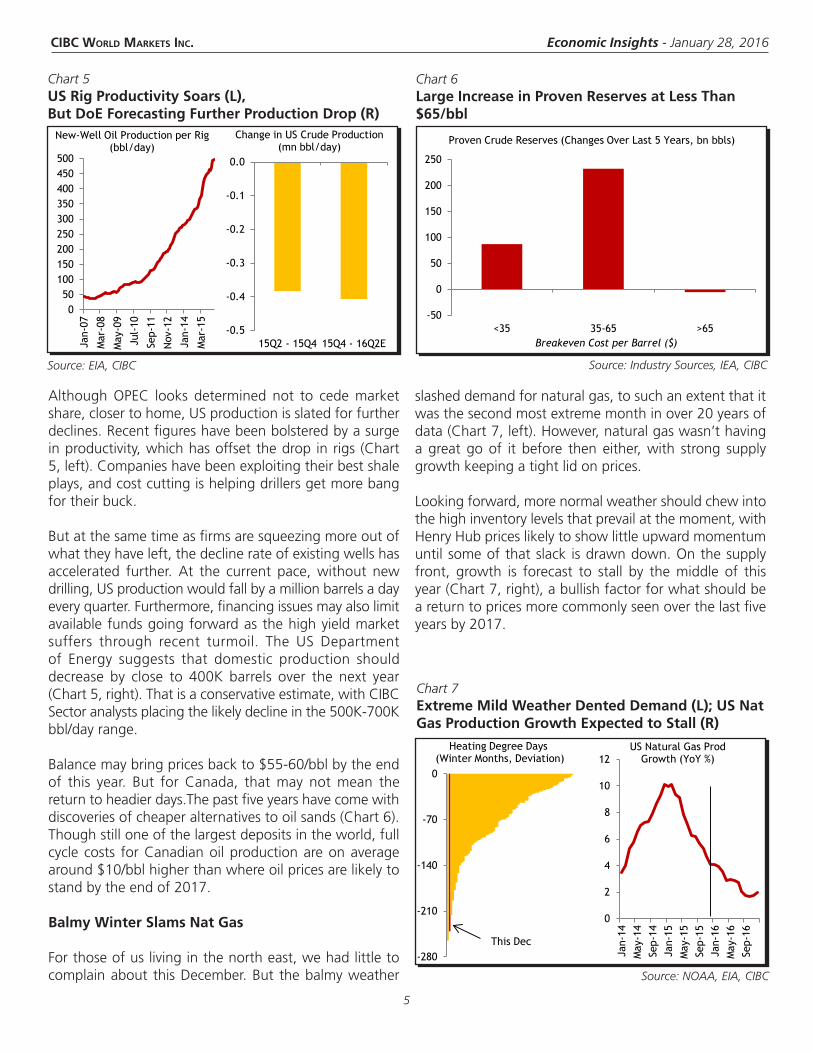
From a supply point of view, it appears that the news is not as good for some metals as it is for oil. Indeed with further supply coming onto the market in 2016 and 2017, an excess is likely to remain for the likes of copper and aluminium (Chart 3). That should limit the rebound in prices in those areas compared to oil, where a sharp decline in US production is expected to be a swing factor later this year and into 2017 (Table 2).
Crude Aspirations
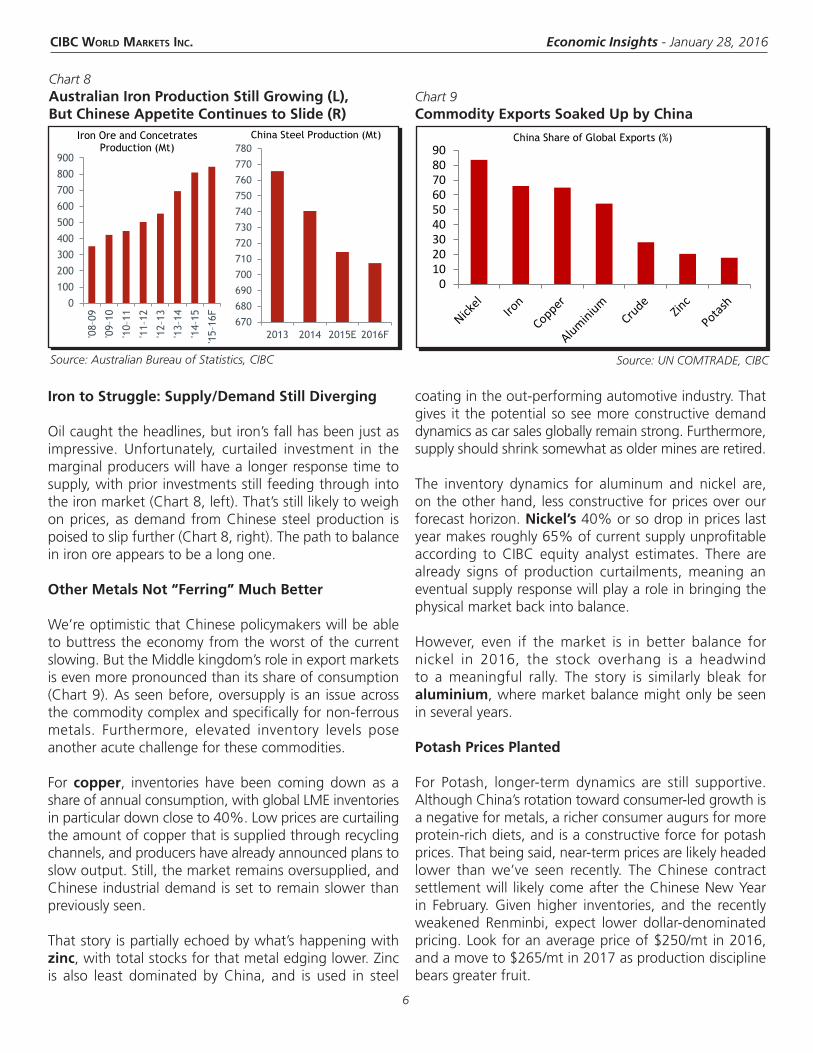
Oil has taken a beating that’s lasted its fair share of rounds. But we’re holding out hope that by the second half of this year, it will have picked itself up off the mat, with a path back to balance coming into focus (Chart 4).
Despite the miserable performance of prices, and the anemic global growth backdrop that has plagued other commodity prices, it was a strong year for oil demand growth in 2015. The 1.8 mn bbl/day average increase was twice as large as was assumed at the beginning of last year. Low prices played a role in boosting demand, and for this year, the IEA is forecasting growth of over 1.0 mn bbl/day. That increase is doing the heaviest lifting in bringing us back into balance by Q4.
On the supply front, the biggest swing factor was OPEC. The group’s total production is over 1.5 mn bbl/day higher than at the beginning of 2015, bringing the group as a whole closer to its capacity. For this year, we’re mindful that Iran is expected to increase production by 500K bbl/day, while Lybian production stands well beneath pre-war levels.
Chart 3Path Back to Balance Looks Shorter For Oil Than Aluminium and Copper
Source: Statistics Canada, CIBCSource: Industry Sources, CIBC
-5
-4
-3
-2
-1
0
1
2
3
4
5
Aluminium Copper Nickel Oil
2015 2016 2017
Market balance % of demand
excess demand
excess supply
Chart 4Crude's Path to an End-of-Year Balance
0.00.20.40.60.81.01.21.41.61.82.0
15Q4Balance
OPEC Supply DemandGrowth
Non-OPECSupply
16Q4Balance
World Oil Balance (mn bbl/day)
0
Note: 500K bbl/day allowance made for OPEC, given expected increase from Iran.
Table 2Commodity Price Outlook
Source: CIBC
27-Jan 2012 2013 2014 2015 2016 (f) 2017 (f)
Oil (WTI) $/bbl 32 94 98 93 49 42 60Natural Gas (Henry) $/Mn Btu 2.24 2.75 3.73 4.35 2.61 2.70 3.50Gold* $/troy oz 1128 1675 1202 1184 1061 950 1000Silver* $/troy oz 14.53 30.3 19.5 15.7 13.8 13.4 14.7Iron Ore (62% Fe) $/mt 42 129 136 97 56 45 42Copper $/lb 2.07 3.62 3.33 3.12 2.50 2.27 2.41Aluminum $/lb 0.68 0.92 0.84 0.85 0.76 0.66 0.70Nickel $/lb 3.93 7.97 6.82 7.68 6.38 4.20 4.94Zinc $/lb 0.72 0.89 0.87 0.98 0.95 0.77 0.87Lumber** $/'000 bd ft 241 287 345 338 268 285 315Potash $/tonne 295 459 379 297 304 250 265* end of period, **1st CME Futures
CIBC World Markets InC. Economic Insights - January 28, 2016
5
Although OPEC looks determined not to cede market share, closer to home, US production is slated for further declines. Recent figures have been bolstered by a surge in productivity, which has offset the drop in rigs (Chart 5, left). Companies have been exploiting their best shale plays, and cost cutting is helping drillers get more bang for their buck.
But at the same time as firms are squeezing more out of what they have left, the decline rate of existing wells has accelerated further. At the current pace, without new drilling, US production would fall by a million barrels a day every quarter. Furthermore, financing issues may also limit available funds going forward as the high yield market suffers through recent turmoil. The US Department of Energy suggests that domestic production should decrease by close to 400K barrels over the next year (Chart 5, right). That is a conservative estimate, with CIBC Sector analysts placing the likely decline in the 500K-700K bbl/day range.
Balance may bring prices back to $55-60/bbl by the end of this year. But for Canada, that may not mean the return to headier days.The past five years have come with discoveries of cheaper alternatives to oil sands (Chart 6). Though still one of the largest deposits in the world, full cycle costs for Canadian oil production are on average around $10/bbl higher than where oil prices are likely to stand by the end of 2017.
Balmy Winter Slams Nat Gas
For those of us living in the north east, we had little to complain about this December. But the balmy weather
slashed demand for natural gas, to such an extent that it was the second most extreme month in over 20 years of data (Chart 7, left). However, natural gas wasn’t having a great go of it before then either, with strong supply growth keeping a tight lid on prices.
Looking forward, more normal weather should chew into the high inventory levels that prevail at the moment, with Henry Hub prices likely to show little upward momentum until some of that slack is drawn down. On the supply front, growth is forecast to stall by the middle of this year (Chart 7, right), a bullish factor for what should be a return to prices more commonly seen over the last five years by 2017.
Chart 5US Rig Productivity Soars (L),But DoE Forecasting Further Production Drop (R)
Source: EIA, CIBC
Chart 6Large Increase in Proven Reserves at Less Than $65/bbl
Source: Industry Sources, IEA, CIBC
050
100150200250300350400450500
Jan-
07
Mar
-08
May
-09
Jul-
10
Sep-
11
Nov
-12
Jan-
14
Mar
-15
New-Well Oil Production per Rig(bbl/day)
-0.5
-0.4
-0.3
-0.2
-0.1
0.0
15Q2 - 15Q4 15Q4 - 16Q2E
Change in US Crude Production(mn bbl/day)
-50
0
50
100
150
200
250
<35 35-65 >65
Proven Crude Reserves (Changes Over Last 5 Years, bn bbls)
Breakeven Cost per Barrel ($)
Chart 7Extreme Mild Weather Dented Demand (L); US Nat Gas Production Growth Expected to Stall (R)
Source: NOAA, EIA, CIBC
-280
-210
-140
-70
0
Heating Degree Days (Winter Months, Deviation)
This Dec
0
2
4
6
8
10
12
Jan-
14M
ay-1
4Se
p-14
Jan-
15M
ay-1
5Se
p-15
Jan-
16M
ay-1
6Se
p-16
US Natural Gas ProdGrowth (YoY %)
CIBC World Markets InC. Economic Insights - January 28, 2016
6
Iron to Struggle: Supply/Demand Still Diverging
Oil caught the headlines, but iron’s fall has been just as impressive. Unfortunately, curtailed investment in the marginal producers will have a longer response time to supply, with prior investments still feeding through into the iron market (Chart 8, left). That’s still likely to weigh on prices, as demand from Chinese steel production is poised to slip further (Chart 8, right). The path to balance in iron ore appears to be a long one.
Other Metals Not “Ferring” Much Better
We’re optimistic that Chinese policymakers will be able to buttress the economy from the worst of the current slowing. But the Middle kingdom’s role in export markets is even more pronounced than its share of consumption (Chart 9). As seen before, oversupply is an issue across the commodity complex and specifically for non-ferrous metals. Furthermore, elevated inventory levels pose another acute challenge for these commodities.
For copper, inventories have been coming down as a share of annual consumption, with global LME inventories in particular down close to 40%. Low prices are curtailing the amount of copper that is supplied through recycling channels, and producers have already announced plans to slow output. Still, the market remains oversupplied, and Chinese industrial demand is set to remain slower than previously seen.
That story is partially echoed by what’s happening with zinc, with total stocks for that metal edging lower. Zinc is also least dominated by China, and is used in steel
coating in the out-performing automotive industry. That gives it the potential so see more constructive demand dynamics as car sales globally remain strong. Furthermore, supply should shrink somewhat as older mines are retired.
The inventory dynamics for aluminum and nickel are, on the other hand, less constructive for prices over our forecast horizon. Nickel’s 40% or so drop in prices last year makes roughly 65% of current supply unprofitable according to CIBC equity analyst estimates. There are already signs of production curtailments, meaning an eventual supply response will play a role in bringing the physical market back into balance.
However, even if the market is in better balance for nickel in 2016, the stock overhang is a headwind to a meaningful rally. The story is similarly bleak for aluminium, where market balance might only be seen in several years.
Potash Prices Planted
For Potash, longer-term dynamics are still supportive. Although China’s rotation toward consumer-led growth is a negative for metals, a richer consumer augurs for more protein-rich diets, and is a constructive force for potash prices. That being said, near-term prices are likely headed lower than we’ve seen recently. The Chinese contract settlement will likely come after the Chinese New Year in February. Given higher inventories, and the recently weakened Renminbi, expect lower dollar-denominated pricing. Look for an average price of $250/mt in 2016, and a move to $265/mt in 2017 as production discipline bears greater fruit.
Source: UN COMTRADE, CIBC
Chart 9Commodity Exports Soaked Up by China
Chart 8Australian Iron Production Still Growing (L), But Chinese Appetite Continues to Slide (R)
Source: Australian Bureau of Statistics, CIBC
0
100
200
300
400
500
600
700
800
900
'08–
09
'09–
10
'10–
11
'11–
12
'12–
13
'13–
14
'14–
15
'15–
16F
Iron Ore and ConcetratesProduction (Mt)
670
680
690
700
710
720
730
740
750
760
770
780
2013 2014 2015E 2016F
China Steel Production (Mt)
0102030405060708090
China Share of Global Exports (%)
CIBC World Markets InC. Economic Insights - January 28, 2016
7
Growing Their Own Revenue:The Fiscal Impacts of Cannabis Legalization
Avery Shenfeld
US$700 mn in sales as it ramped up legal operations in 2014, yielding sales tax and licensing revenues of about $75 mn, and was targeting about $US 1 bn in 2016. The equivalent in Canadian dollars, adjusted to Canada’s population, would imply a roughly C$10 bn national market here.
Other reports, that put Canadian consumption at 770,000 kg, would suggest a recreational market of roughly half that size, or $5 bn. On a per capita basis, that would be in line with recent daily sales volumes under legalization in the State of Washington. By comparison, Health Canada expects a mature medical marijuana market to be in the order of $1.3 bn. Results in US states that have legalized have not pointed to a large increase in usage post-legalization.
One factor lifting the Colorado data was the presence of tourist buyers, those crossing into the state from others where the drug remains illegal. The Netherlands experiences similar tourist inflows. Canada’s lower drinking age attracts those in the under-21 cohort in cities like Montreal and Windsor. The desirability of increased marijuana tourism inflows will be questioned, no doubt, but they would generate additional fiscal revenues for government on their other tourist spending.
What will be the government’s take from cannabis? Assuming it was all domestically supplied, $5-$10 bn in final sales would also be essentially the equivalent in nominal GDP. Canadian federal/provincial revenues collectively add up to about 30% of GDP, so the revenue take would be in the order of $2-3 bn.
That, however, assumes that cannabis will be taxed at the equivalent rate of other economic activities, which is not the prevailing practice for comparable goods like tobacco and alcohol. So called “sin taxes” typically entail a fatter take from government. Ontario, for example, reaps a 35% net profit margin on sales through the LCBO, a figure that would not capture the personal income taxes of its employees, or taxes paid on supplier’s profits and payrolls.
The incoming Liberal government pledged to legalize recreational cannabis use in Canada, a step that raises health, social policy, and criminal justice issues, but also entails economic and fiscal impacts. A full assessment of all of these cross currents isn’t within our scope, but with federal and provincial budgets facing revenue challenges, it’s worth exploring the potential fiscal consequences for Canada. Already, provinces like Ontario, for example, are eagerly eyeing the use of their monopoly alcohol retailing arms as suitable for expansion into cannabis sales, with commensurate tax revenues.
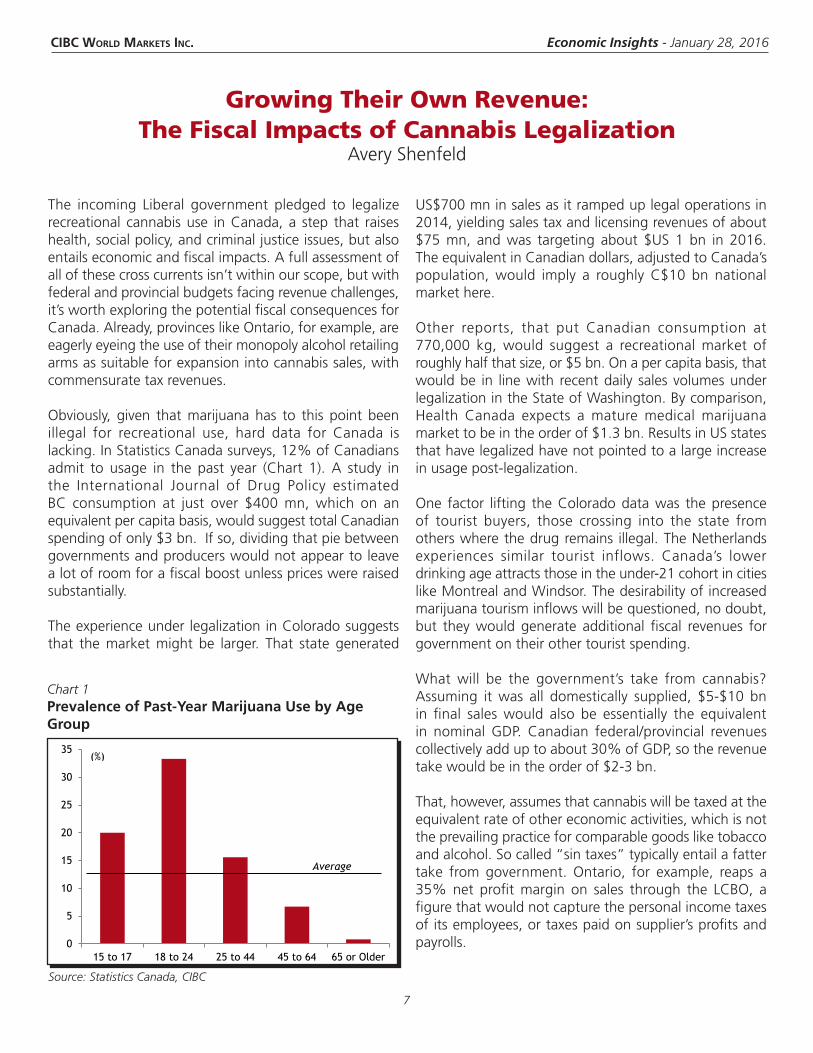
Obviously, given that marijuana has to this point been illegal for recreational use, hard data for Canada is lacking. In Statistics Canada surveys, 12% of Canadians admit to usage in the past year (Chart 1). A study in the International Journal of Drug Policy estimated BC consumption at just over $400 mn, which on an equivalent per capita basis, would suggest total Canadian spending of only $3 bn. If so, dividing that pie between governments and producers would not appear to leave a lot of room for a fiscal boost unless prices were raised substantially.
The experience under legalization in Colorado suggests that the market might be larger. That state generated
Chart 1Prevalence of Past-Year Marijuana Use by Age Group
Source: Statistics Canada, CIBC
0
5
10
15
20
25
30
35
15 to 17 18 to 24 25 to 44 45 to 64 65 or Older
(%)
Average
CIBC World Markets InC. Economic Insights - January 28, 2016
8
That could easily push a total government share to 50% or more. Of note, Colorado did not experience any reduction in alcohol sales revenues after cannabis legalization, suggesting that cannabis sales will not cut into existing receipts from alcoholic beverages.
Studies found that Canada has been a sizeable exporter of illegal cannibus, with a University of Ottawa Medical School report citing that only 30% of what’s grown here is domestically consumed. That part of the supply chain would clearly remain underground, and therefore not directly taxed.
But if governments increased enforcement to ensure their monopoly position in the domestic market was not undermined, a consequence could be a reduction in illegal growing and exporting. Although that sector would not be captured in GDP initially, its shrinkage could show up in a negative multiplier effect from the cut in spending by those involved.
The other fiscal implications are on the cost side, as many US states looking at the issue have cited reductions in the enforcement costs associated with the criminal status of cannabis. The Ottawa Medical School cited Canadian enforcement costs of $0.5 bn per annum, a figure in line with the per capita cost savings anticipated in Colorado.
However, if governments sought to maximize tax revenue spin-offs, legalization might not yield any enforcement benefits. Canada’s treaty obligations would likely require it to maintain efforts to curtail growth for exports. As is the case in tobacco, when governments opt for a high-tax regime to boost revenue, the illegal untaxed market can flourish unless enforcement efforts and penalties are sufficient to shut it down. Self-growing would appear to be less difficult for marijuana than tobacco, given the lesser volumes consumed. The presence of legal sales to adults would likely require increased enforcement levels to protect against redistribution to minors.
The bottom line is that federal/provincial governments might reap as much as $5 bn from legalization, but only if all the underground sales are effectively curtailed. That’s on the order of 0.25% of GDP, no barnburner.
Measured GDP would be lifted as underground activity gets reported, but again, we’re talking about only a half percent or so lift in measured national output, less if we think about actual as opposed to measured GDP. Deficits won’t simply go up in smoke as a result.
CIBC World Markets InC. Economic Insights - January 28, 2016
9
With an ocean of fear dominating financial markets, Canadians have been swimming back to shore. Building on already elevated cash positions, investors are accumulating cash at a rate not seen in more than four years.
In fact, Canadians are already sitting on a record $75 billion of excess cash which they would typically have invested. What’s worse is that, similar to the past, investors are likely going to hang onto their cash positions for too long and miss out on billions of dollars in returns.
Markets Taking an Overly Sour View of Canada
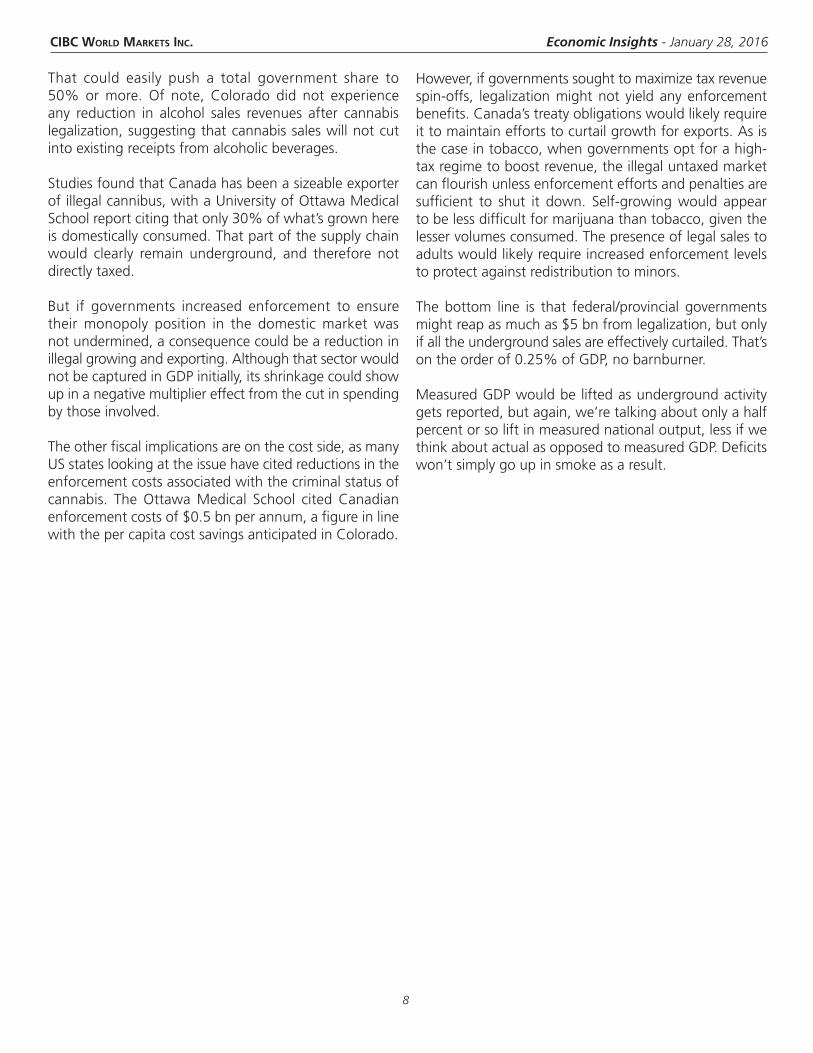
Even outside of Canada, sentiment toward the country has become very dark. Global bond traders were pricing 5-year US Treasury bonds to yield 100bps more than their Canadian counterparts earlier this month (Chart 1). That represents the widest margin on record and suggests that markets expect the current divergence in monetary policy between the US and Canada to persist for much longer than appears reasonable.
The ‘short Canada’ mentality hasn’t been confined to the bond market. The environment surrounding Canadian stocks is also grim, with domestic equities trading more like those of emerging markets (Chart 2). Granted
Canada and emerging market economies have both been adversely affected by the fall in commodity prices. But the correlation between the TSX and MSCI Emerging Markets Index shows that the negative sentiment surrounding Canada is overshooting fundamentals.
Cashing In On FearBenjamin Tal and Royce Mendes
Chart 1Bond Market Signaling Canada is in the Worst Shape Ever Relative to the US
Source: Bloomberg, CIBC
Source: Bloomberg, CIBC
Chart 2As Commodity Prices Slide, Canada’s Stock Market Has Been Unjustly Painted With the Same Brush as Emerging Markets
-4
-3
-2
-1
0
1
2
US-Canada 5-Year Bond Yield Spread
-0.2
0.0
0.2
0.4
0.6
0.8
1.0
Jan-
2014
May
-201
4
Sep-
2014
Jan-
2015
May
-201
5
Sep-
2015
Jan-
2016
52-week Correlation -S&P TSX & MSCI Emerging
Markets Index
400
600
800
1000
1200
1400
10000
11000
12000
13000
14000
15000
16000
17000
18000
S&P TSX (L)MSCI Emerging Markets Idx (R)
4-week MovingAvg.
Source: Bank of Canada, CIBC
Chart 3Seeking Asylum
0
2
4
6
8
10
12
Jan-
13M
ar-1
3M
ay-1
3Ju
l-13
Sep-
13N
ov-1
3Ja
n-14
Mar
-14
May
-14
Jul-
14Se
p-14
Nov
-14
Jan-
15M
ar-1
5M
ay-1
5Ju
l-15
Sep-
15N
ov-1
5EJa
n-16
EGrowth in Personal Deposits at Canadian Banks (YoY, %)
CIBC World Markets InC. Economic Insights - January 28, 2016
10
Cash is King
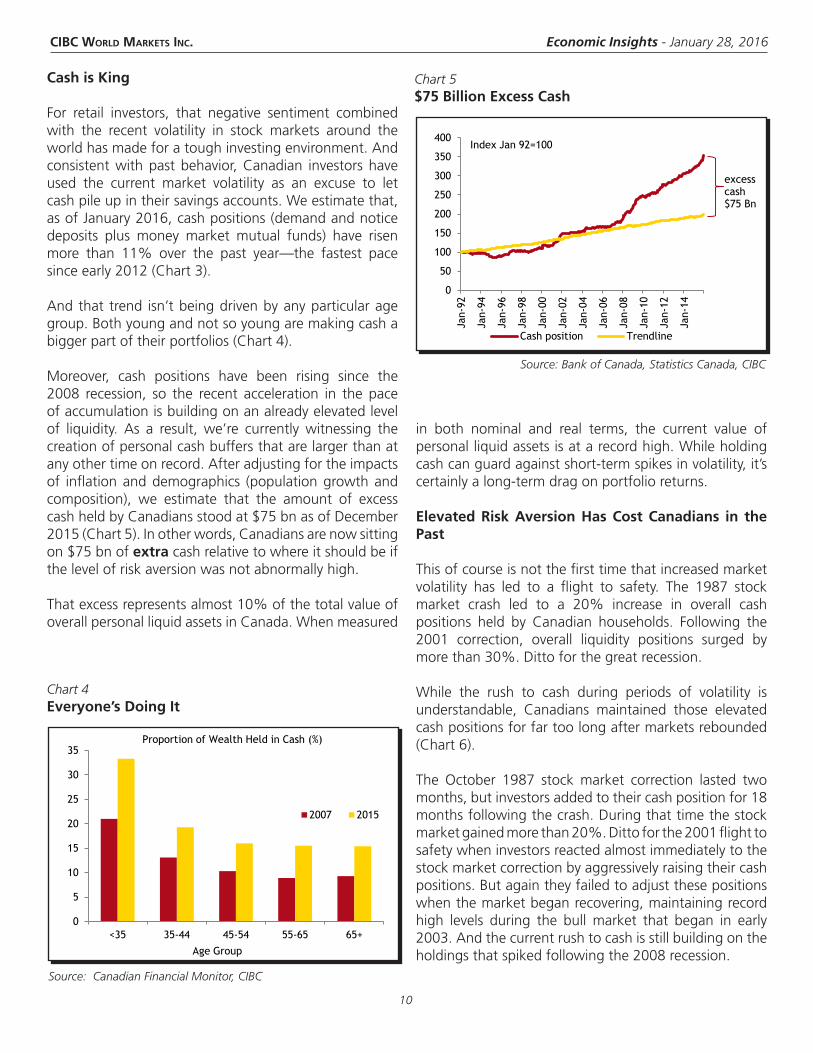
For retail investors, that negative sentiment combined with the recent volatility in stock markets around the world has made for a tough investing environment. And consistent with past behavior, Canadian investors have used the current market volatility as an excuse to let cash pile up in their savings accounts. We estimate that, as of January 2016, cash positions (demand and notice deposits plus money market mutual funds) have risen more than 11% over the past year—the fastest pace since early 2012 (Chart 3).
And that trend isn’t being driven by any particular age group. Both young and not so young are making cash a bigger part of their portfolios (Chart 4).
Moreover, cash positions have been rising since the 2008 recession, so the recent acceleration in the pace of accumulation is building on an already elevated level of liquidity. As a result, we’re currently witnessing the creation of personal cash buffers that are larger than at any other time on record. After adjusting for the impacts of inflation and demographics (population growth and composition), we estimate that the amount of excess cash held by Canadians stood at $75 bn as of December 2015 (Chart 5). In other words, Canadians are now sitting on $75 bn of extra cash relative to where it should be if the level of risk aversion was not abnormally high.
That excess represents almost 10% of the total value of overall personal liquid assets in Canada. When measured
in both nominal and real terms, the current value of personal liquid assets is at a record high. While holding cash can guard against short-term spikes in volatility, it’s certainly a long-term drag on portfolio returns.
Elevated Risk Aversion Has Cost Canadians in the Past
This of course is not the first time that increased market volatility has led to a flight to safety. The 1987 stock market crash led to a 20% increase in overall cash positions held by Canadian households. Following the 2001 correction, overall liquidity positions surged by more than 30%. Ditto for the great recession.
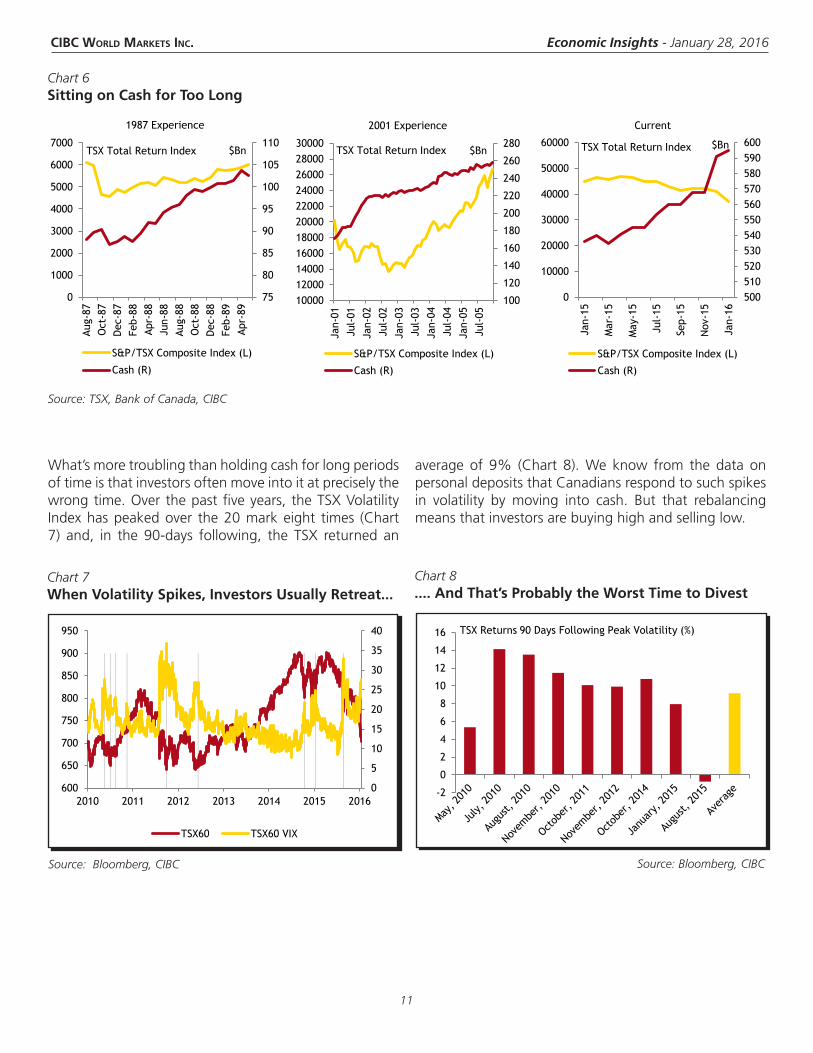
While the rush to cash during periods of volatility is understandable, Canadians maintained those elevated cash positions for far too long after markets rebounded (Chart 6).
The October 1987 stock market correction lasted two months, but investors added to their cash position for 18 months following the crash. During that time the stock market gained more than 20%. Ditto for the 2001 flight to safety when investors reacted almost immediately to the stock market correction by aggressively raising their cash positions. But again they failed to adjust these positions when the market began recovering, maintaining record high levels during the bull market that began in early 2003. And the current rush to cash is still building on the holdings that spiked following the 2008 recession.
Source: Bank of Canada, Statistics Canada, CIBC
Chart 5$75 Billion Excess Cash
0
50
100
150
200
250
300
350
400
Jan-
92
Jan-
94
Jan-
96
Jan-
98
Jan-
00
Jan-
02
Jan-
04
Jan-
06
Jan-
08
Jan-
10
Jan-
12
Jan-
14
Cash position Trendline
Index Jan 92=100
excess cash $75 Bn
Source: Canadian Financial Monitor, CIBC
Chart 4Everyone’s Doing It
0
5
10
15
20
25
30
35
<35 35-44 45-54 55-65 65+
Age Group
Proportion of Wealth Held in Cash (%)
2007 2015
CIBC World Markets InC. Economic Insights - January 28, 2016
11
Source: TSX, Bank of Canada, CIBC
Chart 6Sitting on Cash for Too Long
Source: Bloomberg, CIBC
Chart 7When Volatility Spikes, Investors Usually Retreat...
Source: Bloomberg, CIBC
Chart 8.... And That’s Probably the Worst Time to Divest
-2
0
2
4
6
8
10
12
14
16 TSX Returns 90 Days Following Peak Volatility (%)
0
5
10
15
20
25
30
35
40
600
650
700
750
800
850
900
950
2010 2011 2012 2013 2014 2015 2016
TSX60 TSX60 VIX
75
80
85
90
95
100
105
110
0
1000
2000
3000
4000
5000
6000
7000
Aug-
87O
ct-8
7D
ec-8
7Fe
b-88
Apr-
88Ju
n-88
Aug-
88O
ct-8
8D
ec-8
8Fe
b-89
Apr-
89
1987 Experience
S&P/TSX Composite Index (L)
Cash (R)
TSX Total Return Index $Bn
100
120
140
160
180
200
220
240
260
280
1000012000140001600018000200002200024000260002800030000
Jan-
01Ju
l-01
Jan-
02Ju
l-02
Jan-
03Ju
l-03
Jan-
04Ju
l-04
Jan-
05Ju
l-05
2001 Experience
S&P/TSX Composite Index (L)
Cash (R)
$BnTSX Total Return Index
500510520530540550560570580590600
0
10000
20000
30000
40000
50000
60000
Jan-
15
Mar
-15
May
-15
Jul-
15
Sep-
15
Nov
-15
Jan-
16
Current
S&P/TSX Composite Index (L)
Cash (R)
$BnTSX Total Return Index
What’s more troubling than holding cash for long periods of time is that investors often move into it at precisely the wrong time. Over the past five years, the TSX Volatility Index has peaked over the 20 mark eight times (Chart 7) and, in the 90-days following, the TSX returned an
average of 9% (Chart 8). We know from the data on personal deposits that Canadians respond to such spikes in volatility by moving into cash. But that rebalancing means that investors are buying high and selling low.
CIBC World Markets InC. Economic Insights - January 28, 2016
12
CANADA
ECONOMIC UPDATE
UNITED STATES
This report is issued and approved for distribution by (a) in Canada, CIBC World Markets Inc., a member of the Investment Industry Regulatory Organization of Canada, the Toronto Stock Exchange, the TSX Venture Exchange and a Member of the Canadian Investor Protection Fund, (b) in the United Kingdom, CIBC World Markets plc, which is regulated by the Financial Services Authority, and (c) in Australia, CIBC Australia Limited, a member of the Australian Stock Exchange and regulated by the ASIC (collectively, “CIBC”) and (d) in the United States either by (i) CIBC World Markets Inc. for distribution only to U.S. Major Institutional Investors (“MII”) (as such term is defined in SEC Rule 15a-6) or (ii) CIBC World Markets Corp., a member of the Financial Industry Regulatory Authority. U.S. MIIs receiving this report from CIBC World Markets Inc. (the Canadian broker-dealer) are required to effect transactions (other than negotiating their terms) in securities discussed in the report through CIBC World Markets Corp. (the U.S. broker-dealer). This report is provided, for informational purposes only, to institutional investor and retail clients of CIBC World Markets Inc. in Canada, and does not constitute an offer or solicitation to buy or sell any securities discussed herein in any jurisdiction where such offer or solicitation would be prohibited. This document and any of the products and information contained herein are not intended for the use of private investors in the United Kingdom. Such investors will not be able to enter into agreements or purchase products mentioned herein from CIBC World Markets plc. The comments and views expressed in this document are meant for the general interests of wholesale clients of CIBC Australia Limited. This report does not take into account the investment objectives, financial situation or specific needs of any particular client of CIBC. Before making an investment decision on the basis of any information contained in this report, the recipient should consider whether such information is appropriate given the recipient’s particular investment needs, objectives and financial circumstances. CIBC suggests that, prior to acting on any information contained herein, you contact one of our client advisers in your jurisdiction to discuss your particular circumstances. Since the levels and bases of taxation can change, any reference in this report to the impact of taxation should not be construed as offering tax advice; as with any transaction having potential tax implications, clients should consult with their own tax advisors. Past performance is not a guarantee of future results.The information and any statistical data contained herein were obtained from sources that we believe to be reliable, but we do not represent that they are accurate or complete, and they should not be relied upon as such. All estimates and opinions expressed herein constitute judgments as of the date of this report and are subject to change without notice.This report may provide addresses of, or contain hyperlinks to, Internet web sites. CIBC has not reviewed the linked Internet web site of any third party and takes no responsibility for the contents thereof. Each such address or hyperlink is provided solely for the recipient’s convenience and information, and the content of linked third-party web sites is not in any way incorporated into this document. Recipients who choose to access such third-party web sites or follow such hyperlinks do so at their own risk. © 2016 CIBC World Markets Inc. All rights reserved. Unauthorized use, distribution, duplication or disclosure without the prior written permission of CIBC World Markets Inc. is prohibited by law and may result in prosecution.
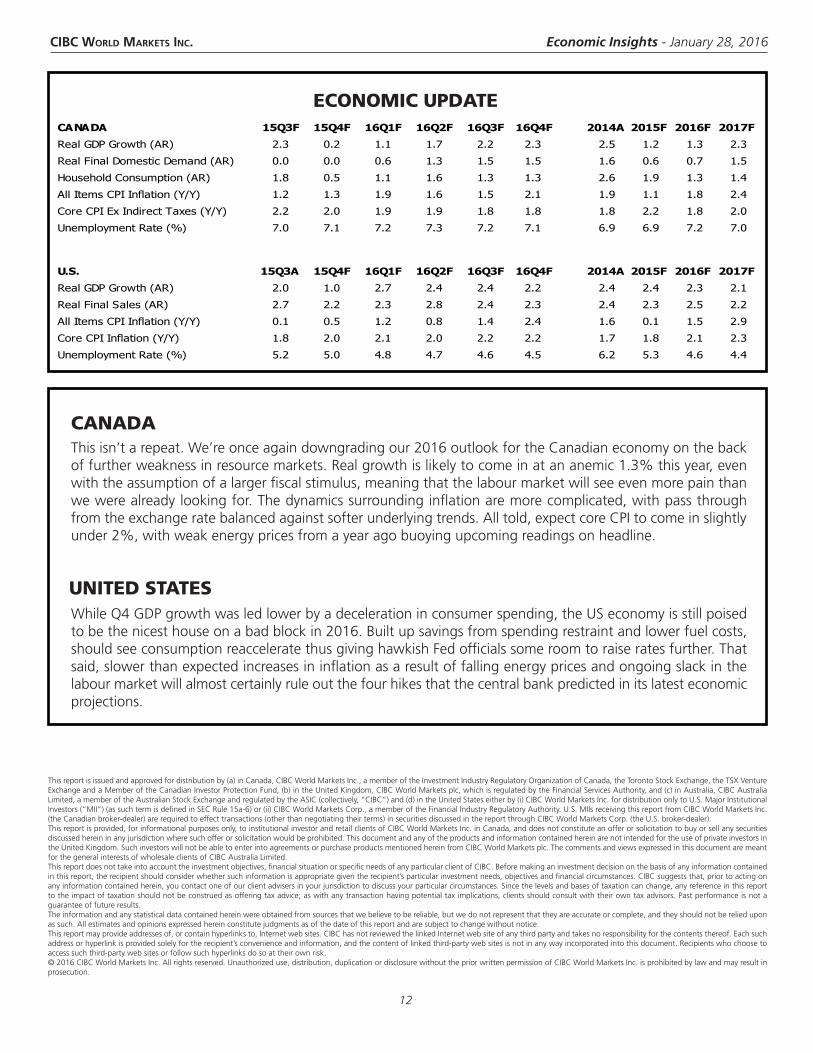
While Q4 GDP growth was led lower by a deceleration in consumer spending, the US economy is still poised to be the nicest house on a bad block in 2016. Built up savings from spending restraint and lower fuel costs, should see consumption reaccelerate thus giving hawkish Fed officials some room to raise rates further. That said, slower than expected increases in inflation as a result of falling energy prices and ongoing slack in the labour market will almost certainly rule out the four hikes that the central bank predicted in its latest economic projections.
This isn’t a repeat. We’re once again downgrading our 2016 outlook for the Canadian economy on the back of further weakness in resource markets. Real growth is likely to come in at an anemic 1.3% this year, even with the assumption of a larger fiscal stimulus, meaning that the labour market will see even more pain than we were already looking for. The dynamics surrounding inflation are more complicated, with pass through from the exchange rate balanced against softer underlying trends. All told, expect core CPI to come in slightly under 2%, with weak energy prices from a year ago buoying upcoming readings on headline.
CANADA 15Q3F 15Q4F 16Q1F 16Q2F 16Q3F 16Q4F 2014A 2015F 2016F 2017F
Real GDP Growth (AR) 2.3 0.2 1.1 1.7 2.2 2.3 2.5 1.2 1.3 2.3
Real Final Domestic Demand (AR) 0.0 0.0 0.6 1.3 1.5 1.5 1.6 0.6 0.7 1.5
Household Consumption (AR) 1.8 0.5 1.1 1.6 1.3 1.3 2.6 1.9 1.3 1.4
All Items CPI Inflation (Y/Y) 1.2 1.3 1.9 1.6 1.5 2.1 1.9 1.1 1.8 2.4
Core CPI Ex Indirect Taxes (Y/Y) 2.2 2.0 1.9 1.9 1.8 1.8 1.8 2.2 1.8 2.0
Unemployment Rate (%) 7.0 7.1 7.2 7.3 7.2 7.1 6.9 6.9 7.2 7.0
U.S. 15Q3A 15Q4F 16Q1F 16Q2F 16Q3F 16Q4F 2014A 2015F 2016F 2017F
Real GDP Growth (AR) 2.0 1.0 2.7 2.4 2.4 2.2 2.4 2.4 2.3 2.1
Real Final Sales (AR) 2.7 2.2 2.3 2.8 2.4 2.3 2.4 2.3 2.5 2.2
All Items CPI Inflation (Y/Y) 0.1 0.5 1.2 0.8 1.4 2.4 1.6 0.1 1.5 2.9
Core CPI Inflation (Y/Y) 1.8 2.0 2.1 2.0 2.2 2.2 1.7 1.8 2.1 2.3
Unemployment Rate (%) 5.2 5.0 4.8 4.7 4.6 4.5 6.2 5.3 4.6 4.4