Embed Size (px)
Citation preview

The William and Flora Hewlett Foundation Financial Statements December 31, 2010 and 2009

Report of Independent Auditors
To The Board of Directors of The William and Flora Hewlett Foundation:
In our opinion, the accompanying statements of financial position and the related statements of activities
and changes in net assets and of cash flows present fairly, in all material respects, the financial position of
The William and Flora Hewlett Foundation (the "Foundation") at December 31, 2010 and 2009, and the
changes in its net assets and its cash flows for the years then ended in conformity with accounting
principles generally accepted in the United States of America. These financial statements are the
responsibility of the Foundation’s management. Our responsibility is to express an opinion on these
financial statements based on our audits. We conducted our audits of these statements in accordance
with auditing standards generally accepted in the United States of America. Those standards require that
we plan and perform the audit to obtain reasonable assurance about whether the financial statements are
free of material misstatement. An audit includes examining, on a test basis, evidence supporting the
amounts and disclosures in the financial statements, assessing the accounting principles used and
significant estimates made by management, and evaluating the overall financial statement presentation.
We believe that our audits provide a reasonable basis for our opinion.
April 22, 2011
PricewaterhouseCoopers LLP, Three Embarcadero Center, San Francisco, CA 94111 T: (415) 498 5000, F: (415) 498 7100, www.pwc.com/us
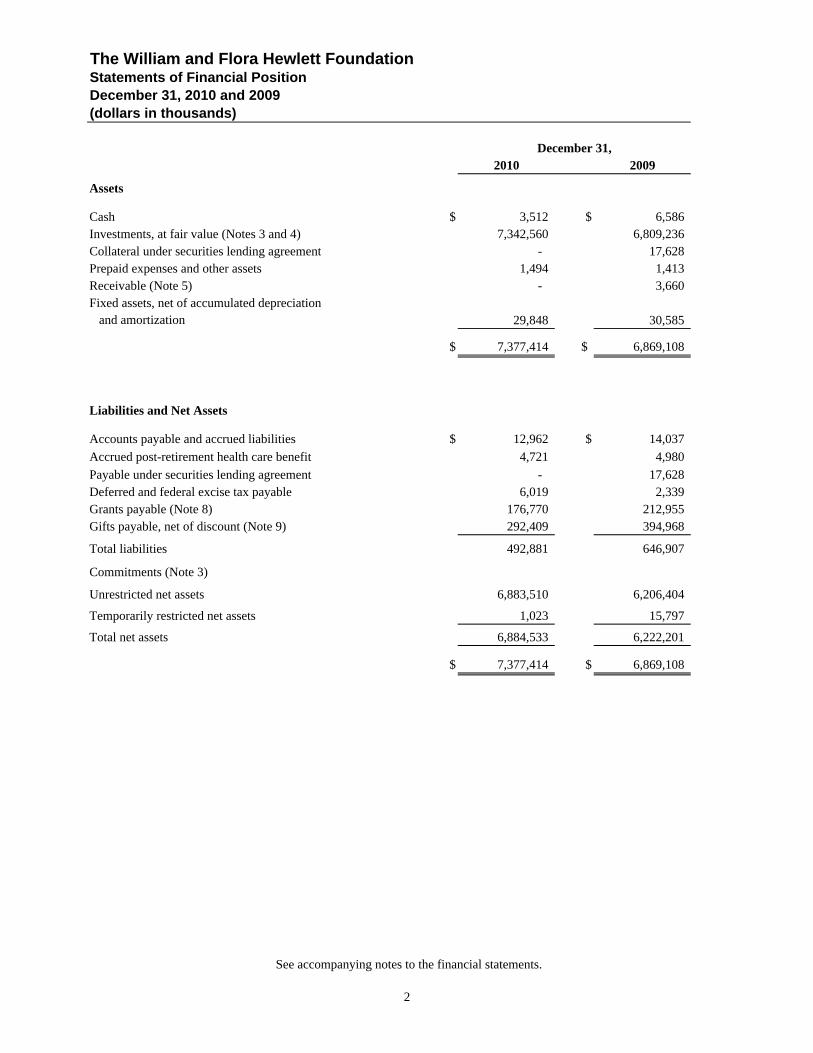
The William and Flora Hewlett FoundationStatements of Financial PositionDecember 31, 2010 and 2009(dollars in thousands)
December 31,2010 2009
Assets
Cash $ 3,512 $ 6,586 Investments, at fair value (Notes 3 and 4) 7,342,560 6,809,236 Collateral under securities lending agreement - 17,628 Prepaid expenses and other assets 1,494 1,413 Receivable (Note 5) - 3,660 Fixed assets, net of accumulated depreciation
29,848 30,585
$ 7,377,414 $ 6,869,108
Liabilities and Net Assets
Accounts payable and accrued liabilities $ 12,962 $ 14,037
Accrued post-retirement health care benefit 4,721 4,980
Payable under securities lending agreement - 17,628 Deferred and federal excise tax payable 6,019 2,339 Grants payable (Note 8) 176,770 212,955 Gifts payable, net of discount (Note 9) 292,409 394,968
Total liabilities 492,881 646,907
Commitments (Note 3)
Unrestricted net assets 6,883,510 6,206,404
Temporarily restricted net assets 1,023 15,797
Total net assets 6,884,533 6,222,201
$ 7,377,414 $ 6,869,108
- -
and amortization
See accompanying notes to the financial statements.
2

The William and Flora Hewlett FoundationStatements of Activities and Changes in Net AssetsYears Ended December 31, 2010 and 2009(dollars in thousands)
Year Ended December 31,2010 2009
Unrestricted Net Assets
Net investment revenues:
Interest, dividends and other $ 92,760 $ 76,891
Gain on investment portfolio 823,684 992,250
Investment management expense (24,929) (23,507)
Net investment income 891,515 1,045,634
Tax expense on investment income (Note 11) (1,863) (248)
Net investment revenues 889,652 1,045,386
Expenses:
Grants awarded, net of cancellations (205,274) (235,100)
Change in gifts discount (Note 9) (12,441) (7,108)
Direct and other charitable activities (8,819) (9,628)
Administrative expenses (25,354) (24,978)
Impact of change in post-retirement plan (Note 7) 1,853 -
Total expenses (250,035) (276,814)
Income before net assets released from time restrictionand contribution 639,617 768,572
Net assets released from time restriction 14,796 14,477
Contribution 22,693 13
Net change in unrestricted net assets 677,106 783,062
Temporarily Restricted Net Assets
Change in temporarily restricted net assets:
Gates Foundation contribution - 13,000
Change in value 22 17
Net assets released from time restriction (14,796) (14,477)
Net change in temporarily restricted net assets (14,774) (1,460)
Change in total net assets 662,332 781,602
Net assets at beginning of year 6,222,201 5,440,599
Net assets at end of year $ 6,884,533 $ 6,222,201
See accompanying notes to the financial statements.
3
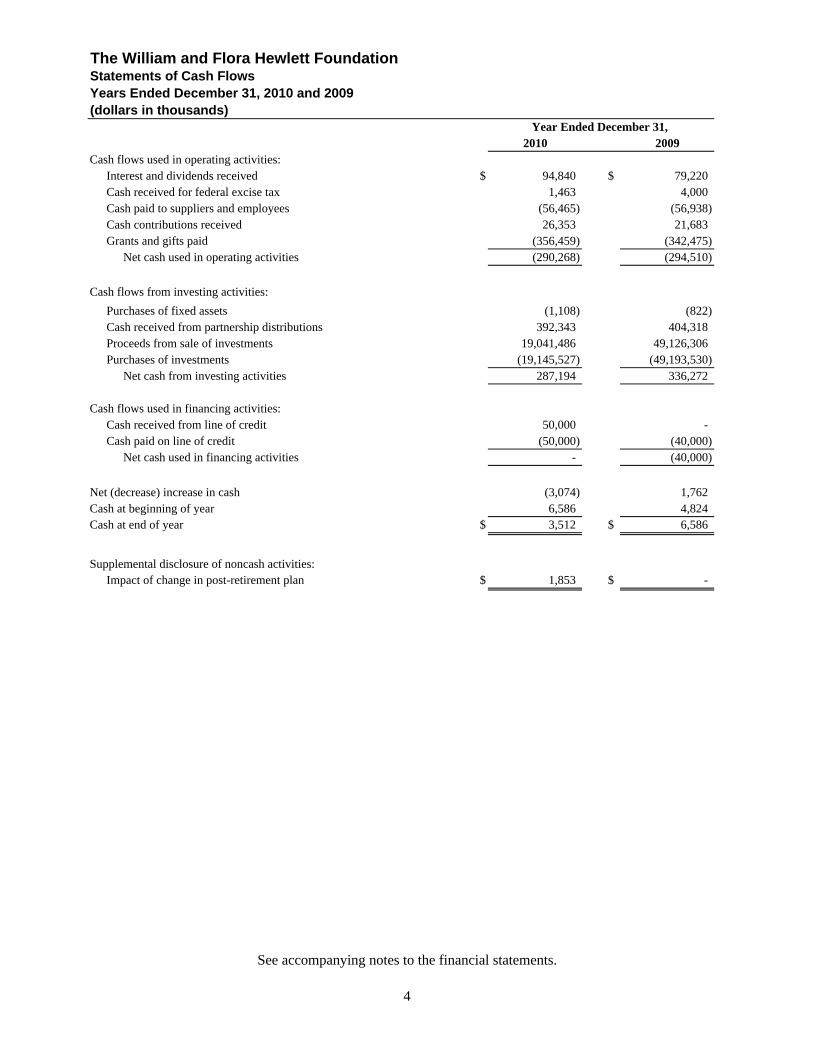
Statements of Cash FlowsYears Ended December 31, 2010 and 2009(dollars in thousands)
2010 2009Cash flows used in operating activities:
Interest and dividends received $ 94,840 $ 79,220 Cash received for federal excise tax 1,463 4,000 Cash paid to suppliers and employees (56,465) (56,938) Cash contributions received 26,353 21,683 Grants and gifts paid (356,459) (342,475)
Net cash used in operating activities (290,268) (294,510)
Cash flows from investing activities:
Purchases of fixed assets (1,108) (822) Cash received from partnership distributions 392,343 404,318 Proceeds from sale of investments 19,041,486 49,126,306 Purchases of investments (19,145,527) (49,193,530)
Net cash from investing activities 287,194 336,272
Cash flows used in financing activities:Cash received from line of credit 50,000 - Cash paid on line of credit (50,000) (40,000)
Net cash used in financing activities - (40,000)
Net (decrease) increase in cash (3,074) 1,762 Cash at beginning of year 6,586 4,824 Cash at end of year $ 3,512 $ 6,586
Supplemental disclosure of noncash activities:Impact of change in post-retirement plan $ 1,853 $ -
The William and Flora Hewlett Foundation
Year Ended December 31,
See accompanying notes to the financial statements.
4

Statements of Cash FlowsYears Ended December 31, 2010 and 2009(dollars in thousands)
2010 2009Reconciliation of change in net assets to net cash used
in operating activities:
Change in total net assets $ 662,332 $ 781,602 Adjustments to reconcile change in net assets
to net cash used in operating activities:Depreciation and amortization on fixed assets 1,588 1,582 Loss on disposal of fixed assets 257 282 Change in gifts discount 12,441 7,108 Net unrealized and realized gain on investments (823,684) (992,250) Increase in deferred and federal excise tax 3,680 2,339 (Decrease) increase in accrued post-retirement
health care benefit (259) 971 Increase in value of temporarily restricted net assets (22) (17)
Changes in operating assets and liabilities:Decrease in interest and dividends receivable 2,080 2,329 (Increase) decrease in prepaid expenses and other assets (81) 2,757 Decrease in receivable 3,660 8,670 Decrease in accounts payable and accrued liabilities (1,075) (2,508) Decrease in grants payable (36,185) (47,375) Decrease in gifts payable (115,000) (60,000) Net cash used in operating activities $ (290,268) $ (294,510)
The William and Flora Hewlett Foundation
Year Ended December 31,
See accompanying notes to the financial statements.
5

The William and Flora Hewlett Foundation Notes to Financial Statements December 31, 2010 and 2009 (dollars in thousands)
6
1. The Organization
The William and Flora Hewlett Foundation (the “Foundation”) is a private foundation incorporated in 1966 as a non-profit 501(c)(3) charitable organization. The Foundation’s grantmaking activities are concentrated in the program areas of education, environment, performing arts, population and global development. More detailed information regarding the Foundation’s charitable activities can be obtained from the Foundation’s website at www.hewlett.org.
2. Significant Accounting Policies
Basis of presentation
The accompanying financial statements have been prepared on the accrual basis of accounting.
Investments
Investments in stocks and bonds which are listed on national securities exchanges, quoted on NASDAQ or on the over-the-counter market are valued at the last reported sale price, or in the absence of a recorded sale, at a value between the most recent bid and asked prices. Futures, forwards, swaps and options that are traded on exchanges are valued at the last reported sale price or, if they are traded over-the-counter, at the most recent bid price. Index swaps, which gain exposure to equities and fixed income securities in a leveraged form, are traded with a counterparty and are valued at each month end. Equity swaps are valued based on the last reported price of the relevant index or ETF. Fixed income swaps are valued at the last reported sale price, or in the absence of a recorded sale, at a value between the most recent bid and asked prices. Short-term investments are valued at amortized cost, which approximates market value. Since there is no readily available market for investments in limited partnerships, such investments are valued at amounts reported to the Foundation by the general partners of such entities. The investments of these limited partnerships, such as venture capital, buyout firms and real estate partnerships, include securities of companies that are not immediately liquid. Accordingly, their values are based upon guidelines established by the general partners. Management believes this method provides a reasonable estimate of fair value. These values may differ significantly from values that would have been used had a readily available market existed for such investments, and the differences could be material to a change in net assets of the Foundation.
Investment transactions are recorded on trade date. Realized gains and losses on sales of investments are determined on the specific identification basis.
Foreign currency amounts are translated into U.S. dollars based upon exchange rates as of December 31. Transactions in foreign currencies are translated into U.S. dollars at the exchange rate prevailing on the transaction date.
Cash equivalents categorized as investments include money market mutual funds, foreign currency held for investment purposes, and fixed income securities with an original or remaining maturity when purchased of three months or less.
The William and Flora Hewlett Foundation Notes to Financial Statements December 31, 2010 and 2009 (dollars in thousands)
7
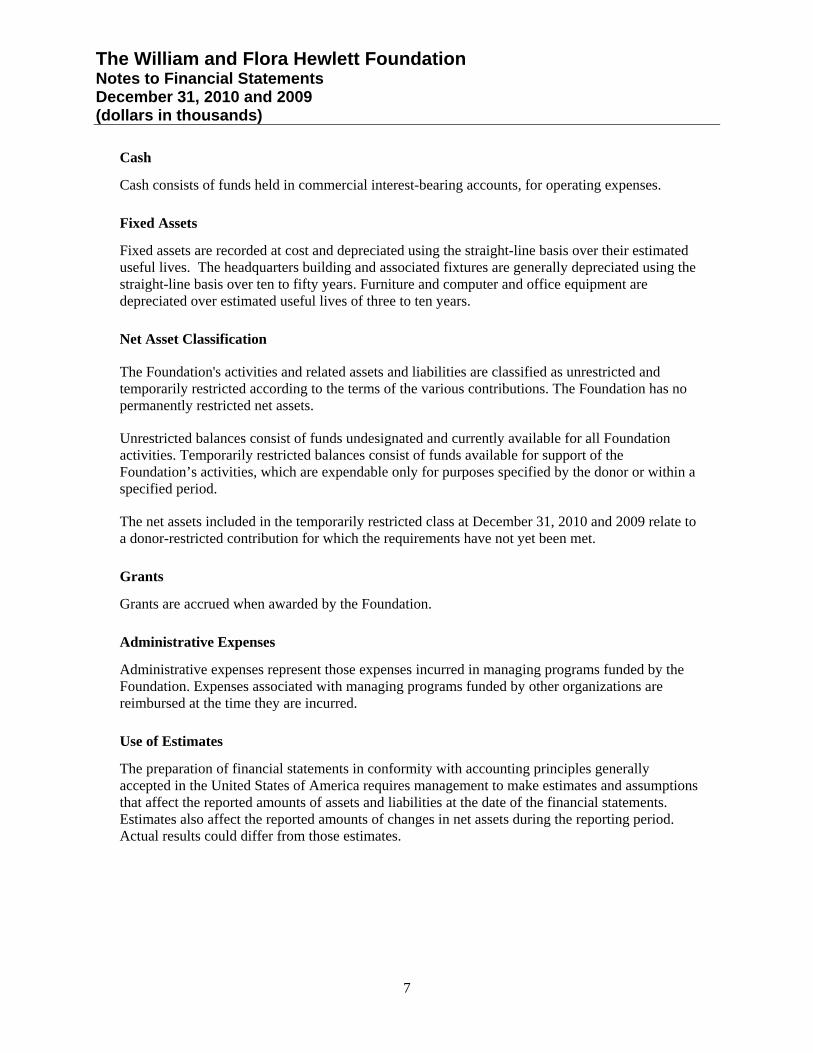
Cash
Cash consists of funds held in commercial interest-bearing accounts, for operating expenses.
Fixed Assets
Fixed assets are recorded at cost and depreciated using the straight-line basis over their estimated useful lives. The headquarters building and associated fixtures are generally depreciated using the straight-line basis over ten to fifty years. Furniture and computer and office equipment are depreciated over estimated useful lives of three to ten years.
Net Asset Classification
The Foundation's activities and related assets and liabilities are classified as unrestricted and temporarily restricted according to the terms of the various contributions. The Foundation has no permanently restricted net assets.
Unrestricted balances consist of funds undesignated and currently available for all Foundation activities. Temporarily restricted balances consist of funds available for support of the Foundation’s activities, which are expendable only for purposes specified by the donor or within a specified period.
The net assets included in the temporarily restricted class at December 31, 2010 and 2009 relate to a donor-restricted contribution for which the requirements have not yet been met.
Grants
Grants are accrued when awarded by the Foundation.
Administrative Expenses
Administrative expenses represent those expenses incurred in managing programs funded by the Foundation. Expenses associated with managing programs funded by other organizations are reimbursed at the time they are incurred.
Use of Estimates
The preparation of financial statements in conformity with accounting principles generally accepted in the United States of America requires management to make estimates and assumptions that affect the reported amounts of assets and liabilities at the date of the financial statements. Estimates also affect the reported amounts of changes in net assets during the reporting period. Actual results could differ from those estimates.
The William and Flora Hewlett Foundation Notes to Financial Statements December 31, 2010 and 2009 (dollars in thousands)
8
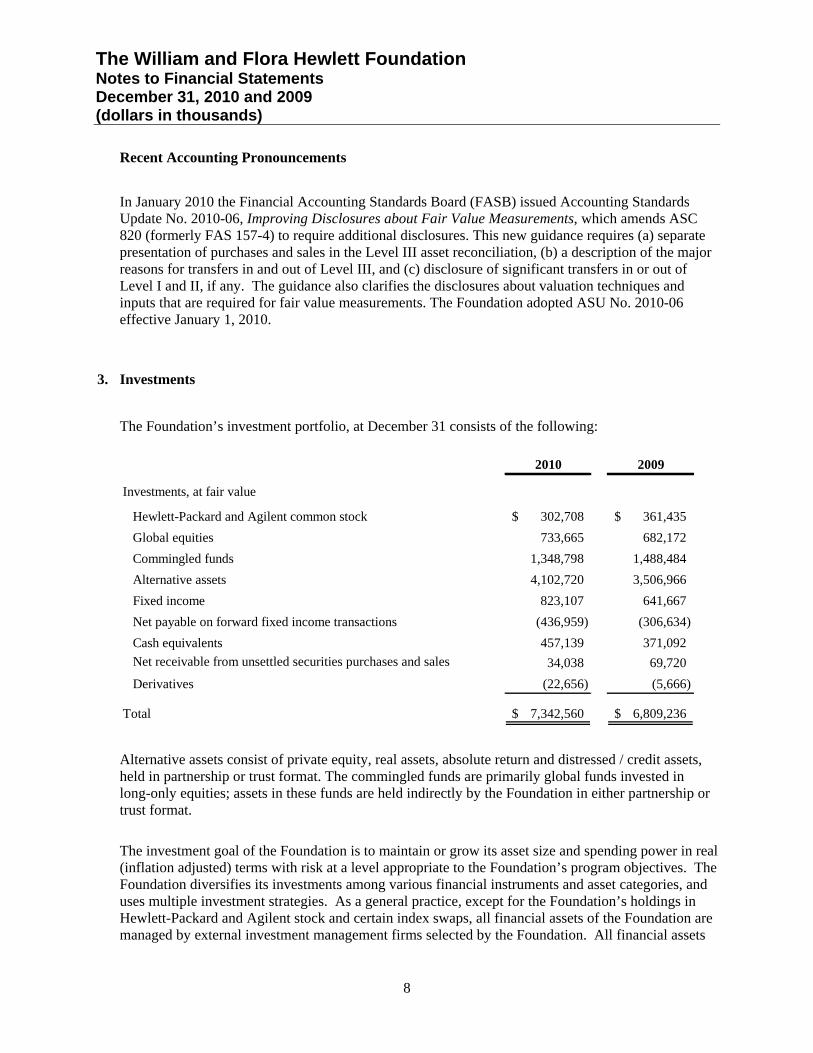
Recent Accounting Pronouncements
In January 2010 the Financial Accounting Standards Board (FASB) issued Accounting Standards Update No. 2010-06, Improving Disclosures about Fair Value Measurements, which amends ASC 820 (formerly FAS 157-4) to require additional disclosures. This new guidance requires (a) separate presentation of purchases and sales in the Level III asset reconciliation, (b) a description of the major reasons for transfers in and out of Level III, and (c) disclosure of significant transfers in or out of Level I and II, if any. The guidance also clarifies the disclosures about valuation techniques and inputs that are required for fair value measurements. The Foundation adopted ASU No. 2010-06 effective January 1, 2010.
3. Investments
The Foundation’s investment portfolio, at December 31 consists of the following:
2010 2009
Investments, at fair value
Hewlett-Packard and Agilent common stock 302,708$ 361,435$
Global equities 733,665 682,172
Commingled funds 1,348,798 1,488,484
Alternative assets 4,102,720 3,506,966
Fixed income 823,107 641,667
Net payable on forward fixed income transactions (436,959) (306,634)
Cash equivalents 457,139 371,092
Net receivable from unsettled securities purchases and sales 34,038 69,720
Derivatives (22,656) (5,666)
Total 7,342,560$ 6,809,236$
Alternative assets consist of private equity, real assets, absolute return and distressed / credit assets, held in partnership or trust format. The commingled funds are primarily global funds invested in long-only equities; assets in these funds are held indirectly by the Foundation in either partnership or trust format.
The investment goal of the Foundation is to maintain or grow its asset size and spending power in real (inflation adjusted) terms with risk at a level appropriate to the Foundation’s program objectives. The Foundation diversifies its investments among various financial instruments and asset categories, and uses multiple investment strategies. As a general practice, except for the Foundation’s holdings in Hewlett-Packard and Agilent stock and certain index swaps, all financial assets of the Foundation are managed by external investment management firms selected by the Foundation. All financial assets

The William and Flora Hewlett Foundation Notes to Financial Statements December 31, 2010 and 2009 (dollars in thousands)
9
of the Foundation are held in custody by a major commercial bank, except for assets invested with partnerships, commingled funds and the overlay swaps, which have separate arrangements related to their legal structure.
Approximately 44% and 48% of the Foundation’s assets at December 31, 2010 and 2009, respectively, are invested (directly or indirectly) in publicly traded equities, which are listed on national exchanges, quoted on NASDAQ, or in the over-the-counter market; treasury and agency bonds of the U.S. government; and investment grade corporate bonds for which active trading markets exist. Net realized and unrealized gains and losses on investments are reflected in the statements of activities and changes in net assets.
The gain or loss on the Foundation’s investment portfolio for the years ended December 31, 2010 and 2009 consists of the following:
2010 2009
Net realized gain / (loss) 294,114$ (16,647)$
Net unrealized gain 529,570 1,008,897
823,684$ 992,250$
Approximately 56% and 52% of the Foundation’s investments at December 31, 2010 and 2009, respectively, were invested with various limited partnerships that invest in the securities of companies that are not immediately liquid, such as venture capital and buyout firms, and in real estate limited partnerships or private REITs that have investments in various types of properties. At December 31, 2010 and 2009, the Foundation’s commitment to contribute additional capital in future years to various partnerships was approximately $1,420,423 and $1,863,932, respectively.
Investment securities are exposed to various risks, such as changes in interest rates or credit ratings and market fluctuations. Due to the level of risk associated with certain investment securities and the level of uncertainty related to changes in the value of investment securities, it is possible that the value of the Foundation’s investments and total net assets balance could fluctuate materially.
Legal, tax and regulatory changes could occur during the term of the Foundation’s fund investments. The regulatory environment for private equity and hedge funds is evolving, and changes in the regulation of these funds may adversely affect the value of investments held by the Foundation. The Foundation believes that the effect of any future regulatory change on the Foundation’s assets would likely not be substantial.
The Foundation maintains a custody account with its primary custodian, The Bank of New York Mellon Corporation (BNY Mellon). Although the Foundation monitors BNY Mellon and believes that it is an appropriate custodian, there is no guarantee that BNY Mellon, or any other custodian that the Foundation may use from time to time, will not become insolvent. The Foundation believes that, in the event of the insolvency of its custodian, some of the Foundation’s assets may be unavailable for a period of time, but that it would ultimately have full recovery of its assets.

The William and Flora Hewlett Foundation Notes to Financial Statements December 31, 2010 and 2009 (dollars in thousands)
10
At December 31, 2010, the Foundation’s net receivable from unsettled securities purchases and sales includes a receivable from brokers of $41,109 and a payable to brokers of $7,071. At December 31, 2009, the net receivable from unsettled securities purchases and sales included a receivable from brokers of $88,410 and a payable to brokers of $18,690. The Foundation held 3.8 million shares of Hewlett-Packard Company (“Hewlett-Packard”) stock with a market price of $42.10 per share at December 31, 2010. At December 31, 2009, the Foundation held 4.1 million shares with a market price of $51.51 per share. The Foundation held 3.4 million shares of Agilent Company (“Agilent”) stock with a market price of $41.43 per share at December 31, 2010. At December 31, 2009, the Foundation held 4.8 million shares of Agilent stock with a market price of $31.07 per share. During 2010, the Foundation discontinued its securities lending program, which had been in place for several years. Cash collateral received for securities on loan was invested on behalf of the Foundation by the securities lending agent. Income generated from the investment of cash collateral, net of negotiated fees and transaction costs, was divided between the Foundation and the securities lending agent. The Foundation's share of this securities lending income was disclosed with interest, dividends and other income in the statement of activities and changes in net assets. At December 31, 2009, the fair value of securities on loan was $16,580. In connection therewith, the Foundation received cash collateral of $17,628, which was invested. As of December 31, 2009 the fair value of the Foundation's collateral holdings was $17,466. In the year ended December 31, 2010, the Foundation earned $50 in securities lending income. In the year ended December 31, 2009, the Foundation earned $550 in securities lending income, which was offset by a realized loss of $(2,119).
Derivative Instruments
In 2008, FASB issued Statement of Financial Accounting Standards No. 161, Disclosures about Derivative Instruments and Hedging Activities. In 2009, FAS 161 was updated and reissued as FASB Accounting Standards Codification ASC 815-10-50. The Foundation adopted the provisions of ASC 815-10-50 effective January 1, 2009. These enhanced disclosures are shown in the description and tables below. The Foundation does not designate any derivative instruments as hedging instruments under GAAP. The Foundation transacts in a variety of derivative instruments including futures, forwards, swaps and options primarily for trading purposes with each instrument's primary risk exposure being interest rate, credit, foreign exchange, equity or commodity risk. The fair value of these derivative instruments, held in the Foundation’s separately managed accounts, is included in the investments line item in the statements of financial position with changes in fair value reflected as realized gains (losses) or unrealized gains (losses) on derivatives within the statements of activities and changes in net assets. Some investment managers retained by the Foundation have been authorized to use certain financial derivative instruments in a manner set forth by either the Foundation’s written investment policy, specific manager guidelines or partnership/fund agreement documents. Specifically, financial

The William and Flora Hewlett Foundation Notes to Financial Statements December 31, 2010 and 2009 (dollars in thousands)
11
derivative instruments may be used for the following purposes: (1) currency forward contracts and options are used to hedge nondollar exposure in foreign investments, or to take positions in managed currency portfolios; (2) futures and swap contracts are used to rebalance asset categories within the portfolio and to manage market exposures in managed portfolios; and (3) futures contracts, swaps and options are used to hedge or leverage positions in managed portfolios.
Certain of the Foundation’s managers purchase or sell fixed income securities on a delayed delivery or forward settled basis. These transactions involve a commitment by the Foundation to purchase or sell securities for a predetermined price or yield, with payment and delivery taking place beyond the customary settlement period, from about 1 to 3 months. When purchasing a security on a delayed delivery basis, the Foundation assumes the rights and risks of ownership of the security, including the risk of price and yield fluctuations, and reflects such fluctuations in its net assets. The manager may dispose of or renegotiate a delayed delivery transaction after it is entered into, and may sell the securities before they are delivered, which may result in a capital gain or loss. At December 31, 2010 and 2009 the net liability for these forward purchases and sales was $436,959 and $306,634, respectively.
Premiums received with respect to open options contracts at December 31, 2010 and 2009 were $22,699 and $17,853, respectively. The total value of investments pledged with respect to options and futures contracts at December 31, 2010 and 2009 was $329,916 and $414,315, respectively. The value of restricted cash held at brokers as collateral for variation margin at December 31, 2010 and 2009 was $3,760 and $(944), respectively.
In the opinion of the Foundation’s management, the use of financial derivative instruments in its investment program is appropriate and customary for the investment strategies employed. Using those instruments reduces certain investment risks and may add value to the portfolio. The instruments themselves, however, do involve investment and counterparty risk in amounts greater than what are reflected in the Foundation’s financial statements. Management does not anticipate that losses, if any, from such instruments would materially affect the financial position of the Foundation.

The William and Flora Hewlett Foundation Notes to Financial Statements December 31, 2010 and 2009 (dollars in thousands)
12
The following table lists fair value of derivatives by contract type as included in the statement of financial position at December 31, 2010. This table excludes exposures relating to derivatives held indirectly through commingled funds.
Balance Average Average
Sheet Notional / Fair Notional / Fair
Location # of Contracts Value # of Contracts Value
Derivatives not designated as hedging instruments under ASC 815
Interest rate contracts Investments 94,200$ 656$ (192,075)$ (2,583)$ Futures - Interest rate contracts* Investments 1 87 0 (316) Credit contracts Investments 79,842 2,205 40,827 (841) Equity contracts* Investments 7 822 (33) (22,853) Foreign exchange contracts Investments 91,387 84,197 (91,237) (84,030)
under ASC 815 87,967$ (110,623)$
* These derivative instruments are reported based on the number of contracts.
Asset Derivatives Liability Derivatives
Total derivatives not designated as hedging instruments
The following table lists fair value of derivatives by contract type as included in the statement of financial position at December 31, 2009. This table excludes exposures relating to derivatives held indirectly through commingled funds.
Balance Average Average
Sheet Notional / Fair Notional / Fair
Location # of Contracts Value # of Contracts Value
Derivatives not designated as hedging instruments under ASC 815
Interest rate contracts Investments 256,575$ # 1,841$ (18,575)$ (1,095)$ Futures - Interest rate contracts* Investments 2 3,418 (0) (803) Credit contracts Investments 66,425 1,254 95,646 (2,923) Equity contracts* Investments 24 1,771 (605) (9,548) Foreign exchange contracts Investments 114,099 74,845 (115,312) (74,426)
under ASC 815 83,129$ (88,795)$
* These derivative instruments are reported based on the number of contracts.
Asset Derivatives Liability Derivatives
Total derivatives not designated as hedging instruments
The William and Flora Hewlett Foundation Notes to Financial Statements December 31, 2010 and 2009 (dollars in thousands)
13
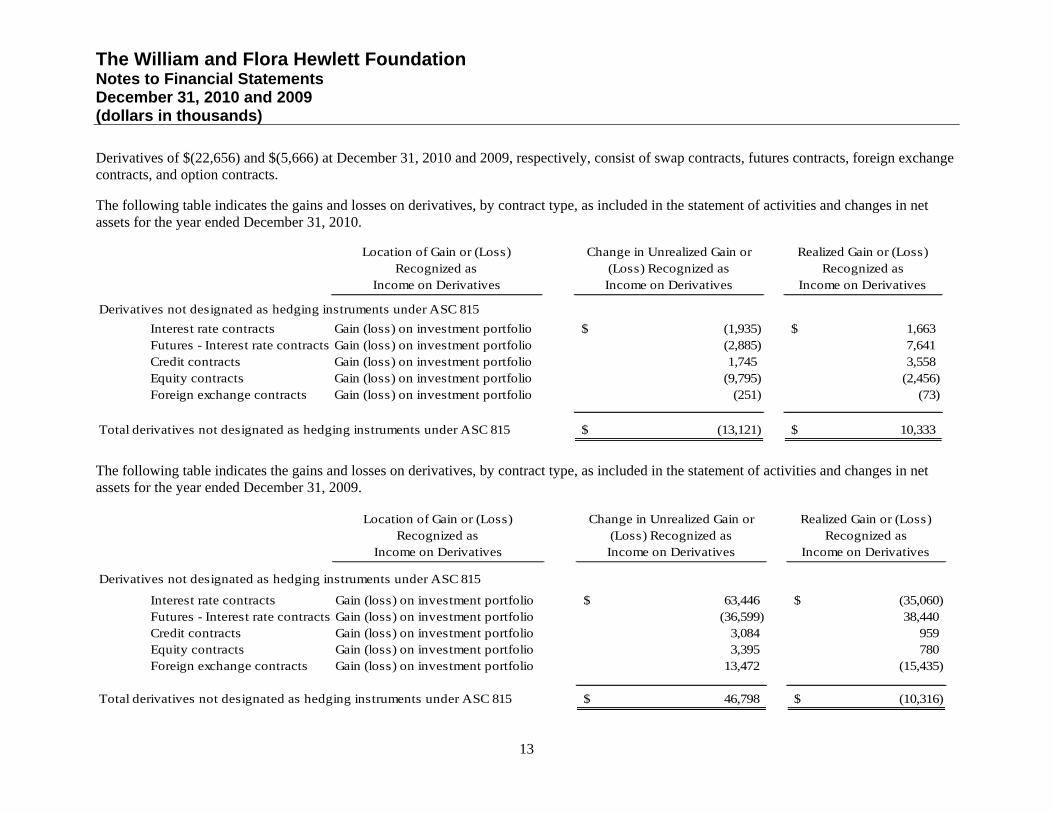
Derivatives of $(22,656) and $(5,666) at December 31, 2010 and 2009, respectively, consist of swap contracts, futures contracts, foreign exchange contracts, and option contracts. The following table indicates the gains and losses on derivatives, by contract type, as included in the statement of activities and changes in net assets for the year ended December 31, 2010.
Location of Gain or (Loss) Recognized as
Income on Derivatives
Change in Unrealized Gain or (Loss) Recognized as Income on Derivatives
Realized Gain or (Loss) Recognized as
Income on Derivatives
Interest rate contracts Gain (loss) on investment portfolio (1,935)$ 1,663$ Futures - Interest rate contracts Gain (loss) on investment portfolio (2,885) 7,641 Credit contracts Gain (loss) on investment portfolio 1,745 3,558 Equity contracts Gain (loss) on investment portfolio (9,795) (2,456) Foreign exchange contracts Gain (loss) on investment portfolio (251) (73)
(13,121)$ 10,333$
Derivatives not designated as hedging instruments under ASC 815
Total derivatives not designated as hedging instruments under ASC 815
The following table indicates the gains and losses on derivatives, by contract type, as included in the statement of activities and changes in net assets for the year ended December 31, 2009.
Location of Gain or (Loss) Recognized as
Income on Derivatives
Change in Unrealized Gain or (Loss) Recognized as Income on Derivatives
Realized Gain or (Loss) Recognized as
Income on Derivatives
Interest rate contracts Gain (loss) on investment portfolio 63,446$ (35,060)$ Futures - Interest rate contracts Gain (loss) on investment portfolio (36,599) 38,440 Credit contracts Gain (loss) on investment portfolio 3,084 959 Equity contracts Gain (loss) on investment portfolio 3,395 780 Foreign exchange contracts Gain (loss) on investment portfolio 13,472 (15,435)
46,798$ (10,316)$ Total derivatives not designated as hedging instruments under ASC 815
Derivatives not designated as hedging instruments under ASC 815

The William and Flora Hewlett Foundation Notes to Financial Statements December 31, 2010 and 2009 (dollars in thousands)
14
Credit Default Swaps The Foundation’s investment managers enter into credit default swaps, generally to simulate long and short bond positions that are either unavailable or considered to be less attractively priced in the bond market. The Foundation managers use these swaps to reduce risk where the Foundation has exposure to the issuer, or to take an active long or short position with respect to the likelihood of an event of default. The reference obligation of the swap can be a single issuer, a “basket” of issuers, or an index. The underlying referenced assets are typically corporate debt, sovereign debt and asset backed securities. The buyer of a credit default swap is generally obligated to pay the seller a periodic stream of payments over the term of the contract in return for a contingent payment upon the occurrence of a credit event with respect to an underlying reference obligation. If a credit event occurs, the seller typically must pay the contingent payment to the buyer, which is typically the par value (full notional value) of the reference obligation, though the actual payment may be mitigated by terms of the International Swaps and Derivative Agreement (“ISDA”), allowing for netting arrangements and collateral. The contingent payment may be a cash settlement or a physical delivery of the reference obligation in return for payment of the face amount of the obligation. If the Foundation’s investment manager is a buyer and no credit event occurs, the Foundation may lose its investment and recover nothing. However, if a credit event occurs, the buyer typically receives full notional value for a reference obligation that may have little or no value. As a seller, the Foundation receives a fixed rate of income throughout the term of the contract, which typically is between one month and five years, provided that no credit event occurs. If a credit event occurs, the seller may be obligated to pay the buyer an amount up to the full notional value of the reference obligation. As of December 31, 2010 and 2009, the Foundation is the buyer (“receiving protection”) on a total notional amount of $25,910 and $15,384, respectively, and is the seller (“providing protection”) on a total notional amount of $162,993 and $88,478, respectively. The notional amounts of the swaps are not recorded in the financial statements; however the notional amount does approximate the maximum potential amount of future payments that the Foundation could be required to make if the Foundation were the seller of protection and a credit event were to occur.

The William and Flora Hewlett Foundation Notes to Financial Statements December 31, 2010 and 2009 (dollars in thousands)
15
Those credit default swaps for which the Foundation is providing protection at December 31, 2010 are summarized as follows:
Written Credit Derivative Contracts
Reference Asset: CorporateDebt
SovereignDebt
Asset BackedSecurities
CorporateDebt
Total
Fair value of written credit derivatives 810$ (19)$ (273)$ 1,124$ 1,642$
Maximum potential amount of future payments 17,200$ 9,300$ 6,800$ 129,693$ 162,993$
Recourse provisions with 3rd parties to recover any amounts paid under the credit derivative
-$ -$ -$ -$ -$
Credit Default Swap Index
Single Name Credit Default Swaps
0-12 1-5 5-10months years years
Current rating on underlying :
AAA $ - $ 8,140 $ 675 $ - 8,815$
AA 2,700 3,600 1,000 6,800 14,100
A 3,800 8,500 - - 12,300
BBB - 86,400 34,578 - 120,978
<BBB - 6,800 - - 6,800
Total $ 6,500 $ 113,440 $ 36,253 $ 6,800 162,993$
Over 10 years Total
Maximum Potential Amount of Future Payments By Contract Term

The William and Flora Hewlett Foundation Notes to Financial Statements December 31, 2010 and 2009 (dollars in thousands)
16
Those credit default swaps for which the Foundation was providing protection at December 31, 2009 are summarized as follows:
Written Credit Derivative Contracts
Reference Asset: CorporateDebt
SovereignDebt
Asset BackedSecurities
CorporateDebt
Total
Fair value of written credit derivatives 163$ 40$ (2,134)$ 182$ (1,749)$
Maximum potential amount of future payments 39,800$ 6,000$ 8,785$ 33,893$ 88,478$
Recourse provisions with 3rd parties to recover any amounts paid under the credit derivative
-$ -$ -$ -$ -$
Credit Default Swap Index
Single Name Credit Default Swaps
0-12 1-5 5-10 10-Maymonths years years years
Current rating on underlying :
AAA $ - $ 2,240 $ 2,275 $ - $ 8,785 13,300$
AA 0 1,900 - - - 1,900
A 0 31,000 - - - 31,000
BBB 0 23,800 12,978 - - 36,778
<BBB 0 5,500 - - - 5,500
Total - $64,440 $15,253 $ 8,785 88,478$
Over 10 years Total
Maximum Potential Amount of Future Payments By Contract Term
4. Valuation of Investments
U. S. GAAP has established a framework to measure fair value, and defined the required disclosures about fair value measurements. FASB Accounting Standards Codification ASC 820 on Fair Value Measurements, previously known as SFAS 157, favors the use of market-based information over entity-specific information. The standard prescribes a three-level hierarchy for fair value measurements based on the transparency of information, such as the pricing source, used in the valuation of an asset as of the measurement date.

The William and Flora Hewlett Foundation Notes to Financial Statements December 31, 2010 and 2009 (dollars in thousands)
17
Investments measured and reported at fair value are classified and disclosed in one of the following categories. There have been no changes in the techniques and inputs used at December, 2010 and 2009.
Level I – Quoted prices are available in active markets for identical investments as of the reporting date, without adjustment. The type of investments in Level I include listed equities held in the name of the Foundation, and exclude listed equities and other securities held indirectly through commingled funds.
Level II – Pricing inputs, including broker quotes, are generally those other than exchange quoted
prices in active markets, which are either directly or indirectly observable as of the measurement date, and fair value is determined through the use of models or other valuation methodologies.
Level III – Pricing inputs are unobservable for the investment and includes situations where there is
little, if any, market activity for the investment. Investments that are included in this category generally include privately held investments and securities held in partnership format, and for these the Net Asset Value (NAV) as a practical expedient has been used.

The William and Flora Hewlett Foundation Notes to Financial Statements December 31, 2010 and 2009 (dollars in thousands)
18
The following table summarizes the valuation of the Foundation’s investments by the ASC 820 fair value hierarchy levels as of December 31, 2010:
Level I Level II Level III Total
Equities and Fixed Income:
Equity Securities - U.S. 656,049$ -$ 2,706$ 658,755$
Equity Securities - Non-U.S. 377,618 - - 377,618
Corporate Debt Securities - 59,914 5,734 65,648
U.S. Government Securities 434,394 207,589 - 641,983
Mortgage-Backed Securities - 9,550 - 9,550
Other Fixed Income Securities 53,455 27,337 25,134 105,926
Commingled Funds 1 - 112,735 1,236,063 1,348,798
Cash Equivalents 42,454 414,653 32 457,139
Alternative Assets:
Private Equity - - 1,418,985 1,418,985
Real Assets - - 1,002,407 1,002,407
Distressed / Credit - - 1,145,935 1,145,935
Absolute Return / Market Neutral - - 535,393 535,393
Derivatives - Assets 84,285 3,682 - 87,967
Assets 1,648,255$ 835,460$ 5,372,389$ 7,856,104$
Derivatives - Liabilities (84,434) (26,189) - (110,623)
Investments, at fair value 1,563,821$ 809,271$ 5,372,389$ 7,745,481 ( , , )
Accrued Income and Net Payables and Receivables (402,921) (6,758,910)
Total Investments 7,342,560$
1 These are directional investments, invested mostly in equity portfolios. These funds invest mostly in long only securities, and some invest in both long and short securities. The investments are public securities, and the funds are held in partnership or trust format.

The William and Flora Hewlett Foundation Notes to Financial Statements December 31, 2010 and 2009 (dollars in thousands)
19
The following table summarizes the valuation of the Foundation’s investments by the ASC 820 fair value hierarchy levels as of December 31, 2009:
Level I Level II Level III Total
Equities and Fixed Income:
Equity Securities - U.S. 596,084$ -$ 325$ 596,409$
Equity Securities - Non-U.S. 447,198 - - 447,198
Corporate Debt Securities - 61,912 852 62,764
U.S. Government Securities 476,753 82,512 - 559,265
Mortgage-Backed Securities - 8,988 - 8,988
Other Fixed Income Securities 337 8,127 2,186 10,650
Commingled Funds 1 - 236,138 1,252,346 1,488,484
Cash Equivalents 67,440 303,652 - 371,092
Alternative Assets:
Private Equity - - 1,103,620 1,103,620
Real Assets - - 816,783 816,783
Distressed / Credit - - 1,177,415 1,177,415
Absolute Return / Market Neutral - - 409,148 409,148
Derivatives - Assets 80,034 3,095 - 83,129
Assets 1,667,846$ 704,424$ 4,762,675$ 7,134,945$
Derivatives - Liabilities (84,775) (4,020) - (88,795)
Investments, at fair value 1,583,071$ 700,404$ 4,762,675$ 7,046,150 (6,758,910)
Accrued Income and Net Payables and Receivables (236,914) (6,758,910)
Total Investments 6,809,236$
1 These are directional investments, invested mostly in equity portfolios. These funds invest mostly in long only securities, and some invest in both long and short securities. The investments are public securities, and the funds are held in partnership or trust format.
The two tables on the following page summarize the Foundation’s Level III reconciliation by the ASC 820 standards as of December 31, 2010 and 2009. Certain reclassifications have been made to the 2009 balances, to conform to the 2010 presentation.

The William and Flora Hewlett Foundation Notes to Financial Statements December 31, 2010 and 2009 (dollars in thousands)
20
Beginning Change in Net Ending
Balance at Realized Unrealized Purchases Sales Transfers Balance at
December 31, Gains Gains and Other and Other In (Out) of December 31,
Level III Assets 2009 (Losses) (Losses) Acquisitions Dispositions Level III 2010
Equity Securities U.S. 325$ 380$ 737$ 42$ (422)$ 1,644$ 2,706$ Corporate Debt Securities 852 - 129 515 (148) 4,386 5,734
Other Fixed Income Securities 2,186 472 (534) 7,853 - 15,157 25,134 Commingled Funds 1,252,346 16,410 180,068 280,909 (493,670) - 1,236,063 Cash and Cash Equivalents - 2 656 233 (856) (3) 32 Private Equity 1,103,620 72,053 131,797 195,581 (84,066) - 1,418,985 Real Assets 816,783 70,137 55,264 124,106 (63,883) 1,002,407 Distressed / Credit 1,177,415 39,256 61,880 87,192 (219,808) - 1,145,935 Abs. Return / Market Neutral 409,148 3,101 40,071 278,234 (195,161) - 535,393
Total 4,762,675$ 201,811$ 470,068$ 974,665$ (1,058,014)$ 21,184$ 5,372,389$
Beginning Change in Net Ending
Balance at Realized Unrealized Purchases Sales Transfers Balance at
December 31, Gains Gains and Other and Other In (Out) of December 31,
Level III Assets 2008 (Losses) (Losses) Acquisitions Dispositions Level III 2009
Equity Securities U.S. 34,633$ -$ 30$ -$ -$ (34,338)$ 325$ Equity Securities Non-U.S. 478 - - - - (478) - Corporate Debt Securities 8,216 (59) 897 4,158 (9,050) (3,310) 852
U.S. Gov't Securities - 58 - 24,168 (24,226) - -
Other Fixed Income Securities 7,251 (200) 3,875 4,429 (13,122) (47) 2,186 Commingled Funds 1,266,887 (11,616) 322,414 116,009 (267,613) (173,735) 1,252,346 Cash and Cash Equivalents 1,750 (3,913) (833) 215,046 (36,610) (175,440) - Private Equity 884,146 11,021 47,742 338,024 (177,313) - 1,103,620 Real Assets 834,895 16,889 (132,383) 158,701 (61,319) - 816,783 Distressed / Credit 1,318,858 47,111 150,879 136,654 (476,087) - 1,177,415 Abs. Return / Market Neutral 301,489 (20,223) 62,439 92,500 (27,057) - 409,148
Total 4,658,603$ 39,068$ 455,060$ 1,089,689$ (1,092,397)$ (387,348)$ 4,762,675$
Net Transfers In (Out) include investments which have been reclassified to Level II as the Foundation has the ability to redeem these at NAV in the near term. This column also includes situations where pricing inputs became unobservable for certain Level II investments. All transfer amounts are based on the fair value at the beginning of the fiscal year. The amount included in the statement of activities for the period which is attributable to the change in unrealized gains (losses) related to assets still held at December 31, 2010 and 2009 was $551,680 and $(9,661), respectively.

The William and Flora Hewlett Foundation Notes to Financial Statements December 31, 2010 and 2009 (dollars in millions)
21
The Foundation uses the NAV as a practical expedient to determine the fair value of all the underlying investments which (a) do not have a readily determinable fair value and (b) prepare their financial statements consistent with the measurement principles of an investment company or have the attributes of an investment company. The following table lists investments in investment funds (in partnership format) by major category as of December 31, 2010:
Remaining
Life Unfunded Redemption Redemption
Strategy Fair Value (Years) Commitments Terms Restrictions
Private Equity Venture and buyout, in the U.S. and international
1,419$ 1 to 10 805$ Not eligible for redemption Not redeemable
Real Assets Real estate and natural resources, primarily in the U.S.
1,003 1 to 12 503 Not eligible for redemption Not redeemable
Distressed / Credit
Distressed asset funds & credit strategies, globally
1,146 1 to 12 112 59% by value are in private equity structure, with no redemption ability. For the rest, terms range between quarterly redemption with 60 days' notice, to annual redemption with 45 - 120 days' notice.
2% by value (1 fund) has a lock up provision of 2 years. Side pockets exist for approximately 2% by value.
Absolute Return - Market Neutral
Global equity and fixed income funds in market neutral strategies
535 N.A. - 14% by value are in private equity structure, with no redemption ability. For the rest, terms range between monthly and quarterly redemption with 5 - 65 days' notice, to annual redemption with 60 days' notice.
17% by value (2 funds) have lock up provision of 1 year.
Commingled funds
Global funds, primarily long-only and primarily in equities
1,349 N.A. - Range from 1 to 90 days' notice. 4% by value (2 funds) have lock up provisions of 2 years.
Total 5,452$ 1,420$

The William and Flora Hewlett Foundation Notes to Financial Statements December 31, 2010 and 2009 (dollars in millions)
22
The following table lists investments in investment funds (in partnership format) by major category as of December 31, 2009:
Remaining
Life Unfunded Redemption Redemption
Strategy Fair Value (Years) Commitments Terms Restrictions
Private Equity Venture and buyout, in the U.S. and international
1,104$ 1 to10 1,064$ Not eligible for redemption Not redeemable
Real Assets Real estate and natural resources, primarily in the U.S.
817 1 to 12 689 Not eligible for redemption Not redeemable
Distressed / Credit
Distressed asset funds & credit strategies, globally
1,177 1 to 5 111 63% by value are in private equity structure, with no redemption ability. For the rest, terms range between quarterly redemption with 45 days' notice, to annual redemption with 90 days' notice.
15% by value (3 funds) have lock up provisions of up to 2 years. Side pockets exist for approximately 4% by value.
Absolute Return - Market Neutral
Global equity and fixed income funds in market neutral strategies
409 N.A. - 19% by value are in private equity structure, with no redemption ability. For the rest, terms range between quarterly redemption with 45 days' notice, to annual redemption with 90 days' notice.
15% by value (1 fund) has a lock up provision of 1 year.
Commingled funds
Global funds, primarily long-only and primarily in equities
1,488 N.A. - Range from 1 to 90 days' notice. 2% by value (1 fund) has a lock up provision of 3 years.
Total 4,995$ 1,864$

The William and Flora Hewlett Foundation Notes to Financial Statements December 31, 2010 and 2009 (dollars in thousands)
23
5. Contributions
In 2006 the Foundation entered into an agreement with the Bill and Melinda Gates Foundation to administer a program charged with improving quality education in developing countries. In addition to reimbursing associated administrative expenses, the Bill and Melinda Gates Foundation pledged $40,000 over five years to the William and Flora Hewlett Foundation to do grant-making in this area; this contribution was reported as a change in temporarily restricted net assets in 2006. The final $3,660 of this pledge was received during 2010. $8,670 was received during 2009. In 2009 the Foundation entered into another agreement with the Bill and Melinda Gates Foundation for further grant-making in this area, under which agreement the Foundation received $13,000. This contribution was reported as a change in temporarily restricted net assets in 2009. In 2010 the Foundation received approximately $23,000 as the residual beneficiary of the Hewlett Marital Trust. These proceeds are reported as an unrestricted contribution.
6. Fixed Assets
Fixed assets consist of the following at December 31, 2010 and 2009:
2010 2009
Building, land lease and land improvements 34,357$ 34,360$ Furniture and fixtures 5,481 5,461Computer and office equipment 2,237 2,109
42,075 41,930Less accumulated depreciation and amortization (12,227) (11,345)
29,848$ 30,585$
7. Benefit Plans
Retirement Plans The Foundation sponsors a 403(b) defined contribution plan for its eligible employees. Foundation contributions to the plan totaled $1,741 and $1,722 in 2010 and 2009, respectively. The Foundation also has an unfunded 457(b) deferred compensation plan. Subject to statutory limits, the Foundation contributes to the plan on behalf of eligible employees that did not receive their full contributions to the defined contribution plan due to Internal Revenue Service limits. At December 31, 2010, the Foundation held other assets of $635 that are included in prepaid expenses and other assets. These assets are designated by the Foundation to pay future plan liabilities of $635 as of December 31, 2010. This liability is included in accounts payable and accrued liabilities.

The William and Flora Hewlett Foundation Notes to Financial Statements December 31, 2010 and 2009 (dollars in thousands)
24
Postretirement Healthcare Benefits The Foundation provides healthcare benefits to retired employees and their eligible dependents. Net periodic benefit costs totaled $551 and $911 in 2010 and 2009, respectively. The Foundation recorded a liability for postretirement benefit obligations of $4,721 and $4,980 as of December 31, 2010 and 2009, respectively. In 2010 the plan was revised, introducing new eligibility requirements and defining a limit on the Foundation's contribution per retiree per year.
The weighted average discount rate assumptions used for the plan are shown below:
2010 2009
Discount rate to determine benefit obligations 5.5% 6.0%Discount rate to determine the net periodic benefit cost 6.0% 6.0%
8. Grants Payable
Grant requests are recorded as grants payable when they are awarded. Some of the grants are payable in installments, generally over a two or three-year period. Grants authorized but unpaid at December 31, 2010 are payable as follows:
Year Payable Amount
2011 133,022$ 2012 28,3382013 and thereafter 15,410
176,770$
9. Gifts Payable
The Foundation made a commitment of $113,000 in August of 2007 to the University of California, Berkeley, over seven years, for a challenge grant to endow 100 faculty chairs and for the creation of an in-house investment company. The obligation was discounted to a net present value as of December 31, 2010 and 2009 using a discount rate of 4.33%. Payments of $15,000 and $10,000 were made in 2010 and 2009, respectively.
The Foundation made a commitment of $461,095 in July of 2008 to ClimateWorks Foundation for an initiative to mitigate global climate change. The obligation is expected to be paid over a period of five years and was discounted to a net present value as of December 31, 2010 and 2009, using a discount rate of 3.19%. Payments of $100,000 and $50,000 were made in 2010 and 2009, respectively.

The William and Flora Hewlett Foundation Notes to Financial Statements December 31, 2010 and 2009 (dollars in thousands)
25
The total gifts payable at December 31, net of discount, is as follows:
2010 2009
Gifts payable 311,000$ 426,000$ Less unamortized discount (18,591) (31,032)
Gifts payable, net of discount 292,409$ 394,968$
10. Credit Facility
The Foundation has a collateralized revolving line of credit (“LOC”) of $200,000 with BNY Mellon. This LOC note does not have an expiration date. At December 31, 2010 and 2009 the outstanding principal balance on the line of credit was nil. The interest rate on the LOC is variable and is indexed to the one month London Interbank Offered Rate (“Libor”).
In addition, in 2010 the Foundation entered into a one-year collateralized committed revolving LOC of $100,000, a two-year collateralized committed revolving LOC of $100,000, and a one-year demand revolving LOC of $100,000 with JP Morgan Chase. At December 31, 2010, the outstanding principal balance on these three lines of credit was nil. The interest rate on these lines of credit is variable and is indexed to the one, two and three month London Interbank Offered Rate (“Libor”).
11. Federal Excise and Unrelated Business Income Tax
The William and Flora Hewlett Foundation is a private foundation and qualifies as a tax-exempt organization under Section 501(c)(3) of the Internal Revenue Code and corresponding California provisions. Private foundations are subject to a federal excise tax on net investment income and may reduce their federal excise tax rate from 2% to 1% by exceeding a certain payout target for the year. The Foundation qualified for the 1% tax rate in 2009, and expects to qualify for the 1% tax rate for 2010. Each year, current federal excise tax is levied on interest and dividend income and net realized gains of the Foundation; net investment losses do not reduce investment income. At December 31, 2010 and 2009, deferred federal excise tax is provided at 1.5%, which is the average effective rate expected to be paid on unrealized gains on investments. The income from certain investments is subject to unrelated business income tax.

The William and Flora Hewlett Foundation Notes to Financial Statements December 31, 2010 and 2009 (dollars in thousands)
26
2010 2009
Current federal excise tax expense 359$ 1,673$
Deferred federal excise tax expense 6,019 -
Excise tax expense 6,378 1,673
UBIT - Unrelated business income tax benefit (4,515) (1,425)
1,863$ 248$
The Foundation believes that it has appropriate support for the excise tax positions taken and, as such, does not have any uncertain tax positions that result in a material impact on the Foundation’s financial position or statement of activities.
12. Subsequent Events
The Foundation has evaluated subsequent events for the period from December 31, 2010 through April 22, 2011, the date the financial statements were issued, and believes no additional disclosures are required in the financial statements.