Embed Size (px)
Citation preview
Copyright © 2016 ● All rights reserved ● This report is intended for institutional investors only and may not be reproduced or distributed without written permission from its publisher.
TIFF Multi-Asset FundDecember 31, 2015A Quarterly Report of TIFF ADVISORY SERVICES
BOARD MEMBERS
Seth Alexander, President MIT Investment Management Company Cambridge, Massachusetts (TAS)
Craig Carnaroli, Executive Vice President University of Pennsylvania Philadelphia, Pennsylvania (TIP)
Collette Chilton, Chief Investment Officer Williams College Investment Office Boston, Massachusetts (TAS)
Richard Flannery, CEO of TAS President and CEO of TIP Radnor, Pennsylvania (TAS)
Erik Lundberg, Chief Investment Officer University of Michigan Ann Arbor, Michigan (TAS)
Scott Malpass, VP and Chief Investment Officer University of Notre Dame Notre Dame, Indiana (TAS)
Ana Marshall, VP and Chief Investment Officer The William and Flora Hewlett Foundation Menlo Park, California (TAS)
William McCalpin, Former CEO Imprint Capital Advisors LLC San Francisco, California (TIP)
N.P. Narvekar, President and CEO Columbia Investment Management Company New York, New York (TIP)
Sandra Robertson, CIO and CEO Oxford University Endowment Management Ltd. Oxford, UK (TAS)
Amy Robinson, VP and Chief Financial Officer The Kresge Foundation Troy, Michigan (TIP)
Dennis Sugino, Senior Adviser Aristotle Capital Management LLC Los Angeles, California (TAS)
TAS TIFF Advisory Services, a regulated investment advisor for TIFF vehicles
TIP TIFF Investment Program, a mutual fund family open primarily to non-profits
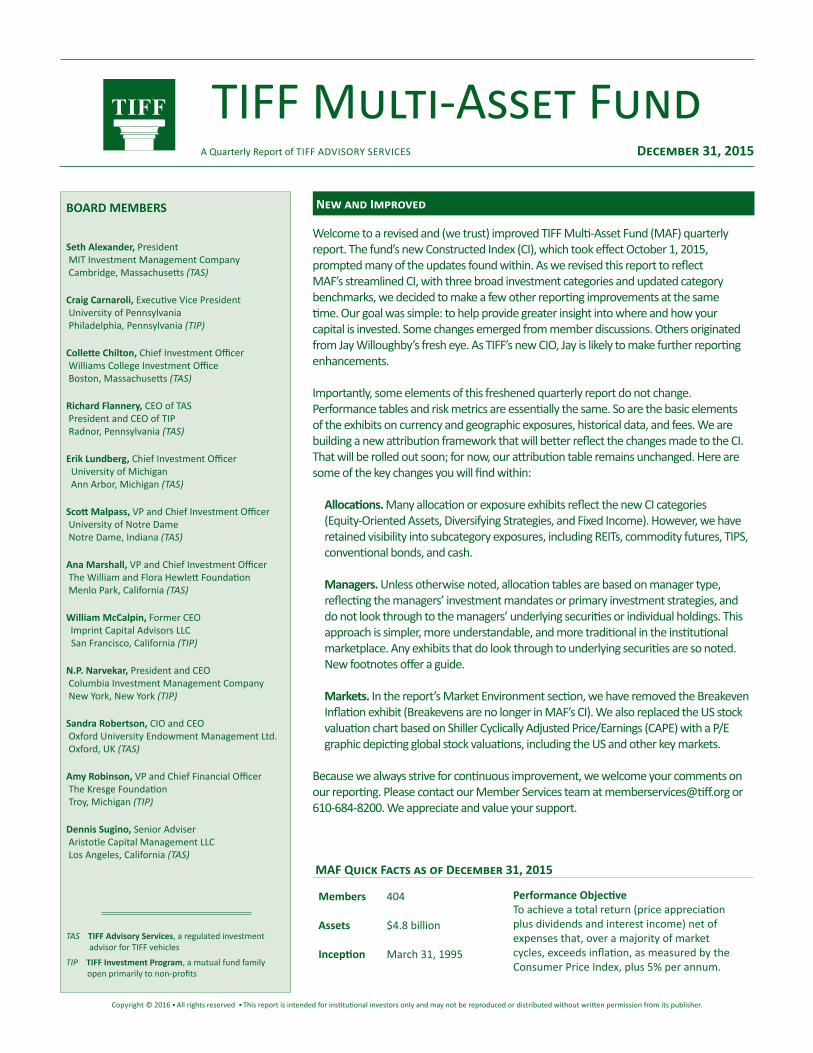
MAF Quick Facts as of December 31, 2015
Members 404 Performance ObjectiveTo achieve a total return (price appreciationplus dividends and interest income) net of expenses that, over a majority of market cycles, exceeds inflation, as measured by the Consumer Price Index, plus 5% per annum.
Assets $4.8 billion
Inception March 31, 1995
Welcome to a revised and (we trust) improved TIFF Multi-Asset Fund (MAF) quarterly report. The fund’s new Constructed Index (CI), which took effect October 1, 2015, prompted many of the updates found within. As we revised this report to reflect MAF’s streamlined CI, with three broad investment categories and updated category benchmarks, we decided to make a few other reporting improvements at the same time. Our goal was simple: to help provide greater insight into where and how your capital is invested. Some changes emerged from member discussions. Others originated from Jay Willoughby’s fresh eye. As TIFF’s new CIO, Jay is likely to make further reporting enhancements. Importantly, some elements of this freshened quarterly report do not change. Performance tables and risk metrics are essentially the same. So are the basic elements of the exhibits on currency and geographic exposures, historical data, and fees. We are building a new attribution framework that will better reflect the changes made to the CI. That will be rolled out soon; for now, our attribution table remains unchanged. Here are some of the key changes you will find within:
Allocations. Many allocation or exposure exhibits reflect the new CI categories (Equity-Oriented Assets, Diversifying Strategies, and Fixed Income). However, we have retained visibility into subcategory exposures, including REITs, commodity futures, TIPS, conventional bonds, and cash.
Managers. Unless otherwise noted, allocation tables are based on manager type, reflecting the managers’ investment mandates or primary investment strategies, and do not look through to the managers’ underlying securities or individual holdings. This approach is simpler, more understandable, and more traditional in the institutional marketplace. Any exhibits that do look through to underlying securities are so noted. New footnotes offer a guide.
Markets. In the report’s Market Environment section, we have removed the Breakeven Inflation exhibit (Breakevens are no longer in MAF’s CI). We also replaced the US stock valuation chart based on Shiller Cyclically Adjusted Price/Earnings (CAPE) with a P/E graphic depicting global stock valuations, including the US and other key markets.
Because we always strive for continuous improvement, we welcome your comments on our reporting. Please contact our Member Services team at [email protected] or 610-684-8200. We appreciate and value your support.
New and Improved
December 31, 2015 • TIFF Multi-Asset Fund • Copyright © 2016 • All rights reserved • This report may not be reproduced or distributed without written permission from its publisher.
2
Ex. 1: Performance Through December 31, 2015 (%)Total Return Annualized Total Return
2014Expense
Ratio Fund / BenchmarkCurrentQuarter
YTD2015 1 Yr 3 Yrs 5 Yrs 10 Yrs 15 Yrs 20 Yrs
SinceInception
3/31/1995
TIFF Multi-Asset Fund (MAF) [a] 1.73 -1.72 -1.72 4.21 4.87 6.11 6.73 7.23 7.64 1.71
Constructed Index (CI) [b] 3.55 -2.00 -2.00 2.94 3.72 4.55 5.25 6.51 6.92
65/35 Mix [c] 3.07 -1.17 -1.17 5.59 5.35 5.06 4.80 6.09 6.56
CPI + 5 per annum 0.63 5.76 5.76 6.04 6.61 6.94 7.16 7.28 7.27
Performance
Performance data quoted represent past performance; past performance does not guarantee future results. The investment return and principal value of an investment will fluctuate so that an investor’s shares, when redeemed, may be worth more or less than their original cost. Current performance of the fund may be lower or higher than the performance quoted. Total return assumes reinvestment of dividends. Performance data for the most recent month-end and additional performance information may be obtained by visiting TIFF’s website at www.tiff.org. MAF charges entry fees on purchases and exit fees on redemptions in the amount of 0.50%. MAF’s returns and comparative performance results on this page reflect the deduction of fees and expenses comprising the fund’s annualized expense ratio but do not reflect the deduction of entry and exit fees, except as noted. Were entry and exit fees to be deducted from performance, the reported performance would be reduced, as shown in Exhibit 2. While the fund is no-load, management fees and other expenses will apply. Please refer to the prospectus for further details.
The fund may use leverage; invests in illiquid securities, non-US securities, small capitalization stocks, derivatives, below investment grade bonds, and real estate-oriented investments; and engages in short-selling. Non-US securities may entail political, economic, and currency risks different from those of US securities and may be issued by entities adhering to different accounting standards than those governing US issuers. Small capitalization stocks may entail different risks than larger capitalization stocks, including potentially lesser degrees of liquidity. The fund or certain of its money managers invest routinely and, at times, significantly in derivatives, certain of which are deemed by the SEC to be highly speculative. Short selling of securities may increase the potential for loss if a manager has difficulty covering a short position. Leverage may accelerate the velocity and magnitude of potential losses. Not more than 20% of the fund’s assets may be invested in debt obligations rated below investment grade (i.e., having a rating lower than BBB by Standard & Poor’s or Baa by Moody’s) or unrated but deemed to be of similar quality. Bonds rated below investment grade are commonly referred to as “junk bonds.” Investors should be aware of the risks involved with investing in REITs and real estate securities, such as declines in the value of real estate and increased susceptibility to adverse economic or regulatory developments. As a multi-manager fund, the fund may experience higher transaction costs than a fund managed by a single manager, and the fund may not be able to combine money managers such that their styles are complementary.
Notes. [a] Returns reflect the deduction of fees and expenses comprising the fund’s annualized expense ratio but do not reflect the deduction of entry and exit fees paid to the fund. See Exhibit 2. [b] Performance of the CI generated from 7/1/2009 through 9/30/2015 was reduced by 20 basis points per annum, prorated monthly. This reduction reflected an estimate of the costs of investing in the CI’s asset segments through index funds or other instruments. (One cannot invest directly in an index, and unmanaged indices do not incur fees and expenses.) The reported performance of the CI would increase in the absence of a 20 basis point reduction. The CI is described on page 12. Historical performance reported for the CI is not adjusted when the composition of the CI changes. Therefore, past performance reflects the allocations, segment weights, and segment benchmarks that were in place at the time the performance was generated. [c] 65% MSCI All Country World Index, 35% Barclays US Aggregate Bond Index.
Ex. 2: Impact of Entry and Exit Fees (%) MAF Annualized Total Return for Periods Ending 12/31/2015
1Yr
5Yrs
10Yrs
15Yrs
20 Yrs
SinceIncep.
3/31/95
Before Entry/Exit Fees -1.72 4.87 6.11 6.73 7.23 7.64After Entry/Exit Fees -2.72 4.66 6.01 6.66 7.18 7.59
Ex. 3: 2014 Fees, Expenses, Expense Ratio (%)
TIFF
TIFF Management Fee 0.20
TIFF Administrative Fee 0.02
TIFF Fees 0.22
Exte
rnal
M
anag
ers Separate Account Manager Fees 0.47
Acquired Fund Fees and Expenses [a] 0.35
External Manager Fees 0.82
Oth
erEx
pens
es Operational Expenses [b] 0.16
Subtotal Fees and Expenses 1.20
Interest Expense, Dividends on Short Sales [c] 0.51
Annualized Expense Ratio 1.71
Notes to Exhibit 2. Returns “Before Entry/Exit Fees” do not reflect deduction of the 0.50% entry and exit fees levied on member purchases and redemptions; returns “After Entry/Exit Fees” do, assuming a single purchase at the start of the reporting period and a single redemption at its end, with no intra-period member transactions. The fees are paid to the fund rather than to TAS or any other vendors employed by the fund. All returns reflect the deduction of fees and expenses comprising the fund’s annualized expense ratio. MAF does not charge a sales load.
Notes to Exhibit 3. Source: TIP Prospectus dated April 30, 2015. Expense ratios reflect fund expenses for the year ended December 31, 2014, and are expected to vary over time. Data are expressed as a percentage of average net assets. [a] Acquired Fund is defined in the Glossary. The line’s total may vary by period as incentive fees change. Excludes interest expense and dividends paid on securities sold short. [b] Includes certain administration, custody, professional, and other expenses. [c] Represents all
such expenses on transactions entered into by TAS (0%), separate account managers (0.33%), and acquired funds (0.18%). Interest and dividends on long positions enhance fund performance, while interest expense and dividends paid on short positions reduce performance. Regulatory requirements mandate, however, that payments related to short sales be reflected as an expense in the annualized expense ratio.
December 31, 2015 • TIFF Multi-Asset Fund • Copyright © 2016 • All rights reserved • This report may not be reproduced or distributed without written permission from its publisher.
3
The fourth quarter of 2015 is in the books. MAF had a difficult quarter for a number of reasons, which we describe below.
Before getting to the numbers, we want to thank you for giving us the opportunity to demonstrate what a new Constructed Index (CI), two new senior investment team leaders, and a renewed and sharper focus on the components of the CI can do. First, as you have probably heard from us by now, the new CI is designed to give MAF the best chance to meet its performance objective of earning 5% real returns over time. The fund will not achieve that goal every year, of course, but if the long span of history is any guide, we would expect MAF to be able to meet this goal over a majority of market cycles. Second, Dave Fallace has joined our team from the Alaska Permanent Fund Corp. (APFC). Dave and Jay Willoughby, our new CIO, worked together on many innovative transactions at APFC, and they intend to build on their track record at TIFF. Finally, we have organized our strong group of investment professionals into teams that can, in our view, better add value to the asset categories of the new CI. We have confidence in this new structure and are excited to see it begin to bear fruit. Now, on to the numbers.
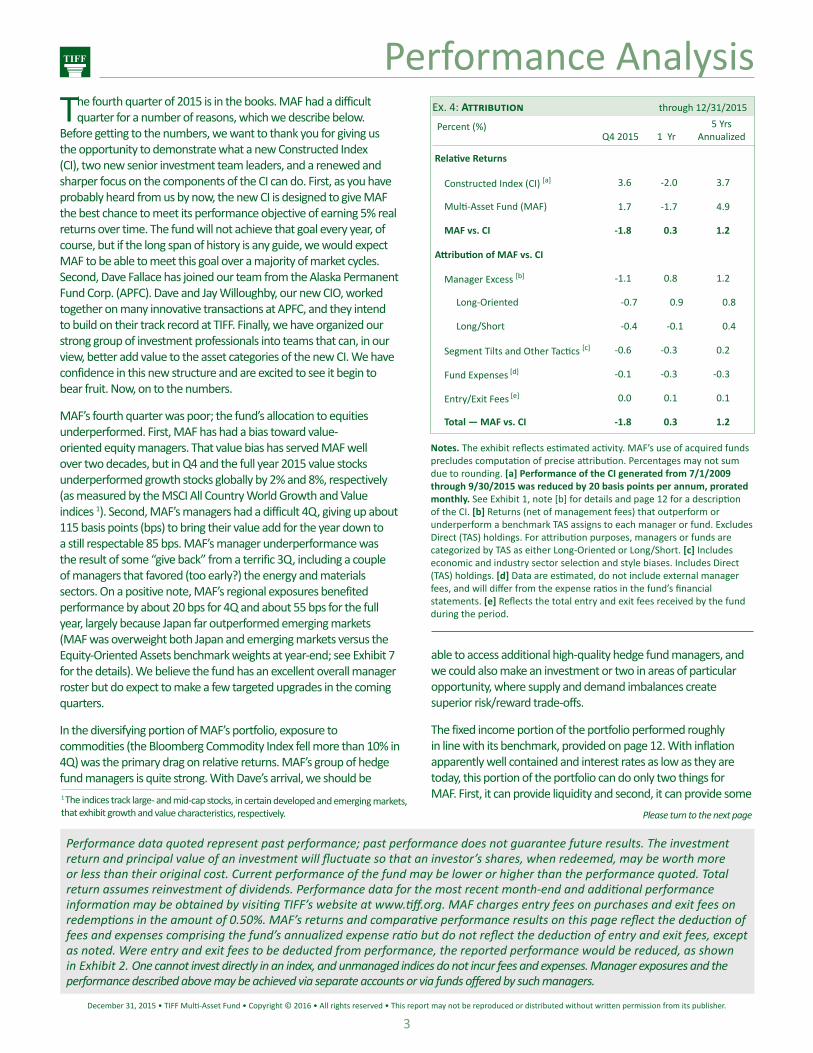
MAF’s fourth quarter was poor; the fund’s allocation to equities underperformed. First, MAF has had a bias toward value-oriented equity managers. That value bias has served MAF well over two decades, but in Q4 and the full year 2015 value stocks underperformed growth stocks globally by 2% and 8%, respectively (as measured by the MSCI All Country World Growth and Value indices 1). Second, MAF’s managers had a difficult 4Q, giving up about 115 basis points (bps) to bring their value add for the year down to a still respectable 85 bps. MAF’s manager underperformance was the result of some “give back” from a terrific 3Q, including a couple of managers that favored (too early?) the energy and materials sectors. On a positive note, MAF’s regional exposures benefited performance by about 20 bps for 4Q and about 55 bps for the full year, largely because Japan far outperformed emerging markets (MAF was overweight both Japan and emerging markets versus the Equity-Oriented Assets benchmark weights at year-end; see Exhibit 7 for the details). We believe the fund has an excellent overall manager roster but do expect to make a few targeted upgrades in the coming quarters.
In the diversifying portion of MAF’s portfolio, exposure to commodities (the Bloomberg Commodity Index fell more than 10% in 4Q) was the primary drag on relative returns. MAF’s group of hedge fund managers is quite strong. With Dave’s arrival, we should be 1 The indices track large- and mid-cap stocks, in certain developed and emerging markets, that exhibit growth and value characteristics, respectively.
Performance data quoted represent past performance; past performance does not guarantee future results. The investment return and principal value of an investment will fluctuate so that an investor’s shares, when redeemed, may be worth more or less than their original cost. Current performance of the fund may be lower or higher than the performance quoted. Total return assumes reinvestment of dividends. Performance data for the most recent month-end and additional performance information may be obtained by visiting TIFF’s website at www.tiff.org. MAF charges entry fees on purchases and exit fees on redemptions in the amount of 0.50%. MAF’s returns and comparative performance results on this page reflect the deduction of fees and expenses comprising the fund’s annualized expense ratio but do not reflect the deduction of entry and exit fees, except as noted. Were entry and exit fees to be deducted from performance, the reported performance would be reduced, as shown in Exhibit 2. One cannot invest directly in an index, and unmanaged indices do not incur fees and expenses. Manager exposures and the performance described above may be achieved via separate accounts or via funds offered by such managers.
Performance Analysis
Notes. The exhibit reflects estimated activity. MAF’s use of acquired funds precludes computation of precise attribution. Percentages may not sum due to rounding. [a] Performance of the CI generated from 7/1/2009 through 9/30/2015 was reduced by 20 basis points per annum, prorated monthly. See Exhibit 1, note [b] for details and page 12 for a description of the CI. [b] Returns (net of management fees) that outperform or underperform a benchmark TAS assigns to each manager or fund. Excludes Direct (TAS) holdings. For attribution purposes, managers or funds are categorized by TAS as either Long-Oriented or Long/Short. [c] Includes economic and industry sector selection and style biases. Includes Direct (TAS) holdings. [d] Data are estimated, do not include external manager fees, and will differ from the expense ratios in the fund’s financial statements. [e] Reflects the total entry and exit fees received by the fund during the period.
Ex. 4: Attribution through 12/31/2015
Percent (%)Q4 2015 1 Yr
5 YrsAnnualized
Relative Returns
Constructed Index (CI) [a] 3.6 -2.0 3.7
Multi-Asset Fund (MAF) 1.7 -1.7 4.9
MAF vs. CI -1.8 0.3 1.2
Attribution of MAF vs. CI
Manager Excess [b] -1.1 0.8 1.2
Long-Oriented -0.7 0.9 0.8
Long/Short -0.4 -0.1 0.4
Segment Tilts and Other Tactics [c] -0.6 -0.3 0.2
Fund Expenses [d] -0.1 -0.3 -0.3
Entry/Exit Fees [e] 0.0 0.1 0.1
Total — MAF vs. CI -1.8 0.3 1.2
Please turn to the next page
able to access additional high-quality hedge fund managers, and we could also make an investment or two in areas of particular opportunity, where supply and demand imbalances create superior risk/reward trade-offs.
The fixed income portion of the portfolio performed roughly in line with its benchmark, provided on page 12. With inflation apparently well contained and interest rates as low as they are today, this portion of the portfolio can do only two things for MAF. First, it can provide liquidity and second, it can provide some
December 31, 2015 • TIFF Multi-Asset Fund • Copyright © 2016 • All rights reserved • This report may not be reproduced or distributed without written permission from its publisher.
4
Performance Analysis
Fund Allocations
Continued from the prior page
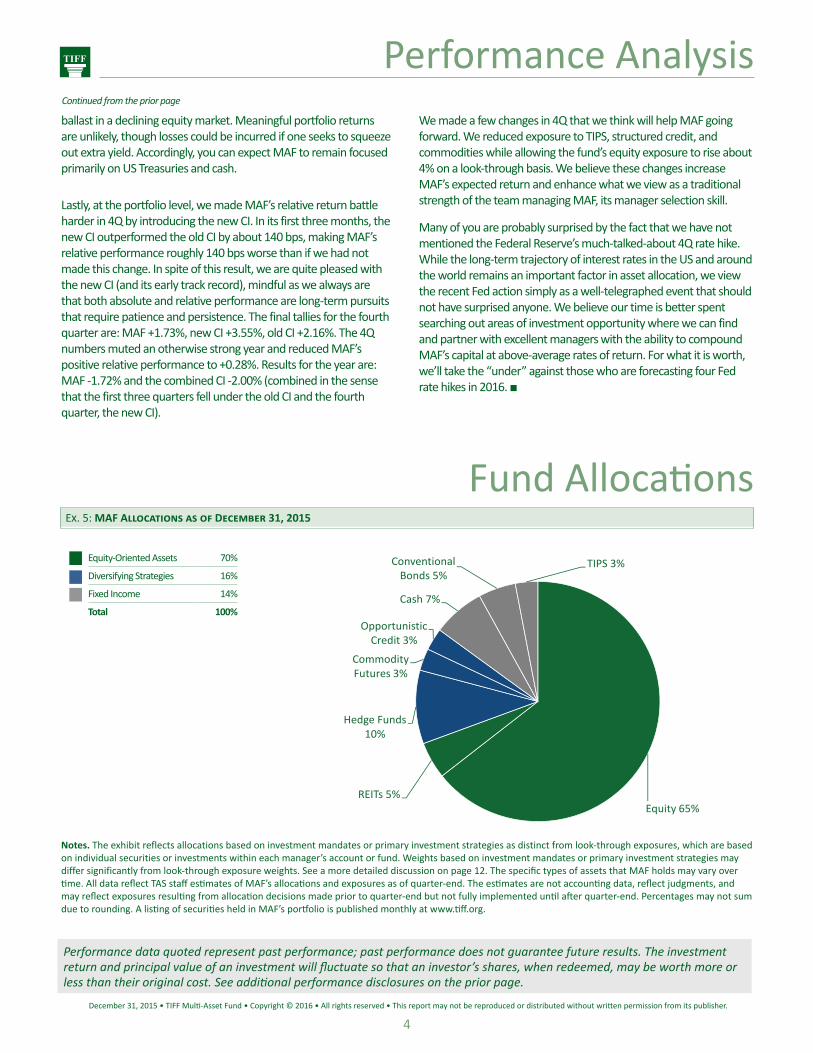
Ex. 5: MAF Allocations as of December 31, 2015
Equity 65%REITs 5%
Hedge Funds 10%
Commodity Futures 3%
Opportunistic Credit 3%
Cash 7%
Conventional Bonds 5%
TIPS 3%Equity-Oriented Assets 70%
Diversifying Strategies 16%
Fixed Income 14%
Total 100%
Notes. The exhibit reflects allocations based on investment mandates or primary investment strategies as distinct from look-through exposures, which are based on individual securities or investments within each manager’s account or fund. Weights based on investment mandates or primary investment strategies may differ significantly from look-through exposure weights. See a more detailed discussion on page 12. The specific types of assets that MAF holds may vary over time. All data reflect TAS staff estimates of MAF’s allocations and exposures as of quarter-end. The estimates are not accounting data, reflect judgments, and may reflect exposures resulting from allocation decisions made prior to quarter-end but not fully implemented until after quarter-end. Percentages may not sum due to rounding. A listing of securities held in MAF’s portfolio is published monthly at www.tiff.org.
Performance data quoted represent past performance; past performance does not guarantee future results. The investment return and principal value of an investment will fluctuate so that an investor’s shares, when redeemed, may be worth more or less than their original cost. See additional performance disclosures on the prior page.
ballast in a declining equity market. Meaningful portfolio returns are unlikely, though losses could be incurred if one seeks to squeeze out extra yield. Accordingly, you can expect MAF to remain focused primarily on US Treasuries and cash.
Lastly, at the portfolio level, we made MAF’s relative return battle harder in 4Q by introducing the new CI. In its first three months, the new CI outperformed the old CI by about 140 bps, making MAF’s relative performance roughly 140 bps worse than if we had not made this change. In spite of this result, we are quite pleased with the new CI (and its early track record), mindful as we always are that both absolute and relative performance are long-term pursuits that require patience and persistence. The final tallies for the fourth quarter are: MAF +1.73%, new CI +3.55%, old CI +2.16%. The 4Q numbers muted an otherwise strong year and reduced MAF’s positive relative performance to +0.28%. Results for the year are: MAF -1.72% and the combined CI -2.00% (combined in the sense that the first three quarters fell under the old CI and the fourth quarter, the new CI).
We made a few changes in 4Q that we think will help MAF going forward. We reduced exposure to TIPS, structured credit, and commodities while allowing the fund’s equity exposure to rise about 4% on a look-through basis. We believe these changes increase MAF’s expected return and enhance what we view as a traditional strength of the team managing MAF, its manager selection skill.
Many of you are probably surprised by the fact that we have not mentioned the Federal Reserve’s much-talked-about 4Q rate hike. While the long-term trajectory of interest rates in the US and around the world remains an important factor in asset allocation, we view the recent Fed action simply as a well-telegraphed event that should not have surprised anyone. We believe our time is better spent searching out areas of investment opportunity where we can find and partner with excellent managers with the ability to compound MAF’s capital at above-average rates of return. For what it is worth, we’ll take the “under” against those who are forecasting four Fed rate hikes in 2016. ■
December 31, 2015 • TIFF Multi-Asset Fund • Copyright © 2016 • All rights reserved • This report may not be reproduced or distributed without written permission from its publisher.
5
Equity-Oriented AssetsMAF’s Equity-Oriented Assets returned 3.3% in 4Q 2015,
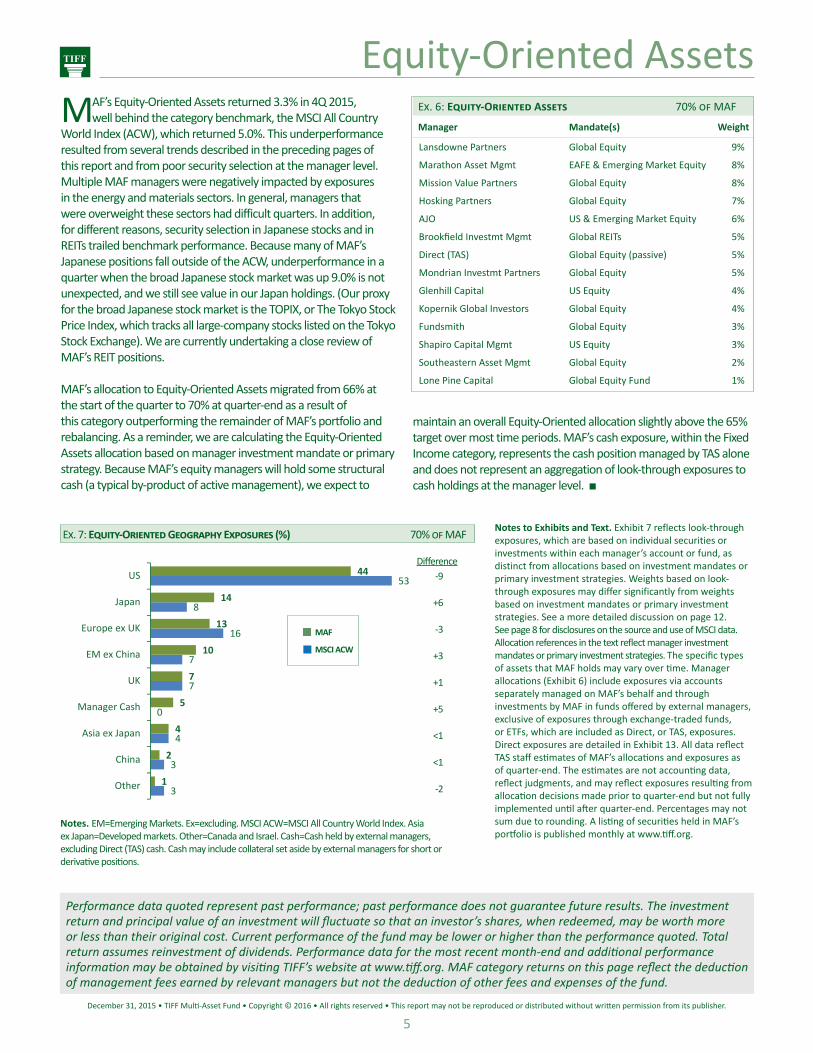
well behind the category benchmark, the MSCI All CountryWorld Index (ACW), which returned 5.0%. This underperformanceresulted from several trends described in the preceding pages of this report and from poor security selection at the manager level. Multiple MAF managers were negatively impacted by exposures in the energy and materials sectors. In general, managers that were overweight these sectors had difficult quarters. In addition, for different reasons, security selection in Japanese stocks and in REITs trailed benchmark performance. Because many of MAF’s Japanese positions fall outside of the ACW, underperformance in a quarter when the broad Japanese stock market was up 9.0% is not unexpected, and we still see value in our Japan holdings. (Our proxy for the broad Japanese stock market is the TOPIX, or The Tokyo Stock Price Index, which tracks all large-company stocks listed on the Tokyo Stock Exchange). We are currently undertaking a close review of MAF’s REIT positions.
MAF’s allocation to Equity-Oriented Assets migrated from 66% atthe start of the quarter to 70% at quarter-end as a result ofthis category outperforming the remainder of MAF’s portfolio andrebalancing. As a reminder, we are calculating the Equity-OrientedAssets allocation based on manager investment mandate or primarystrategy. Because MAF’s equity managers will hold some structuralcash (a typical by-product of active management), we expect to
Notes to Exhibits and Text. Exhibit 7 reflects look-through exposures, which are based on individual securities or investments within each manager’s account or fund, as distinct from allocations based on investment mandates or primary investment strategies. Weights based on look-through exposures may differ significantly from weights based on investment mandates or primary investment strategies. See a more detailed discussion on page 12. See page 8 for disclosures on the source and use of MSCI data. Allocation references in the text reflect manager investment mandates or primary investment strategies. The specific types of assets that MAF holds may vary over time. Manager allocations (Exhibit 6) include exposures via accounts separately managed on MAF’s behalf and through investments by MAF in funds offered by external managers, exclusive of exposures through exchange-traded funds, or ETFs, which are included as Direct, or TAS, exposures. Direct exposures are detailed in Exhibit 13. All data reflect TAS staff estimates of MAF’s allocations and exposures as of quarter-end. The estimates are not accounting data, reflect judgments, and may reflect exposures resulting from allocation decisions made prior to quarter-end but not fully implemented until after quarter-end. Percentages may not sum due to rounding. A listing of securities held in MAF’s portfolio is published monthly at www.tiff.org.
Ex. 7: Equity-Oriented Geography Exposures (%) 70% of MAF
-9
+6
-3
+3
+1
+5
<1
<1
-2
Difference
Notes. EM=Emerging Markets. Ex=excluding. MSCI ACW=MSCI All Country World Index. Asia ex Japan=Developed markets. Other=Canada and Israel. Cash=Cash held by external managers, excluding Direct (TAS) cash. Cash may include collateral set aside by external managers for short or derivative positions.
Ex. 6: Equity-Oriented Assets 70% of MAF
Manager Mandate(s) Weight
Lansdowne Partners Global Equity 9%
Marathon Asset Mgmt EAFE & Emerging Market Equity 8%
Mission Value Partners Global Equity 8%
Hosking Partners Global Equity 7%
AJO US & Emerging Market Equity 6%
Brookfield Investmt Mgmt Global REITs 5%
Direct (TAS) Global Equity (passive) 5%
Mondrian Investmt Partners Global Equity 5%
Glenhill Capital US Equity 4%
Kopernik Global Investors Global Equity 4%
Fundsmith Global Equity 3%
Shapiro Capital Mgmt US Equity 3%
Southeastern Asset Mgmt Global Equity 2%
Lone Pine Capital Global Equity Fund 1%
1
2
4
5
7
10
13
14
44
3
3
4
0
7
7
16
8
53
Other
China
Asia ex Japan
Manager Cash
UK
EM ex China
Europe ex UK
Japan
US
MAF
MSCI ACW
Performance data quoted represent past performance; past performance does not guarantee future results. The investment return and principal value of an investment will fluctuate so that an investor’s shares, when redeemed, may be worth more or less than their original cost. Current performance of the fund may be lower or higher than the performance quoted. Total return assumes reinvestment of dividends. Performance data for the most recent month-end and additional performance information may be obtained by visiting TIFF’s website at www.tiff.org. MAF category returns on this page reflect the deduction of management fees earned by relevant managers but not the deduction of other fees and expenses of the fund.
maintain an overall Equity-Oriented allocation slightly above the 65% target over most time periods. MAF’s cash exposure, within the Fixed Income category, represents the cash position managed by TAS alone and does not represent an aggregation of look-through exposures to cash holdings at the manager level. ■
December 31, 2015 • TIFF Multi-Asset Fund • Copyright © 2016 • All rights reserved • This report may not be reproduced or distributed without written permission from its publisher.
6
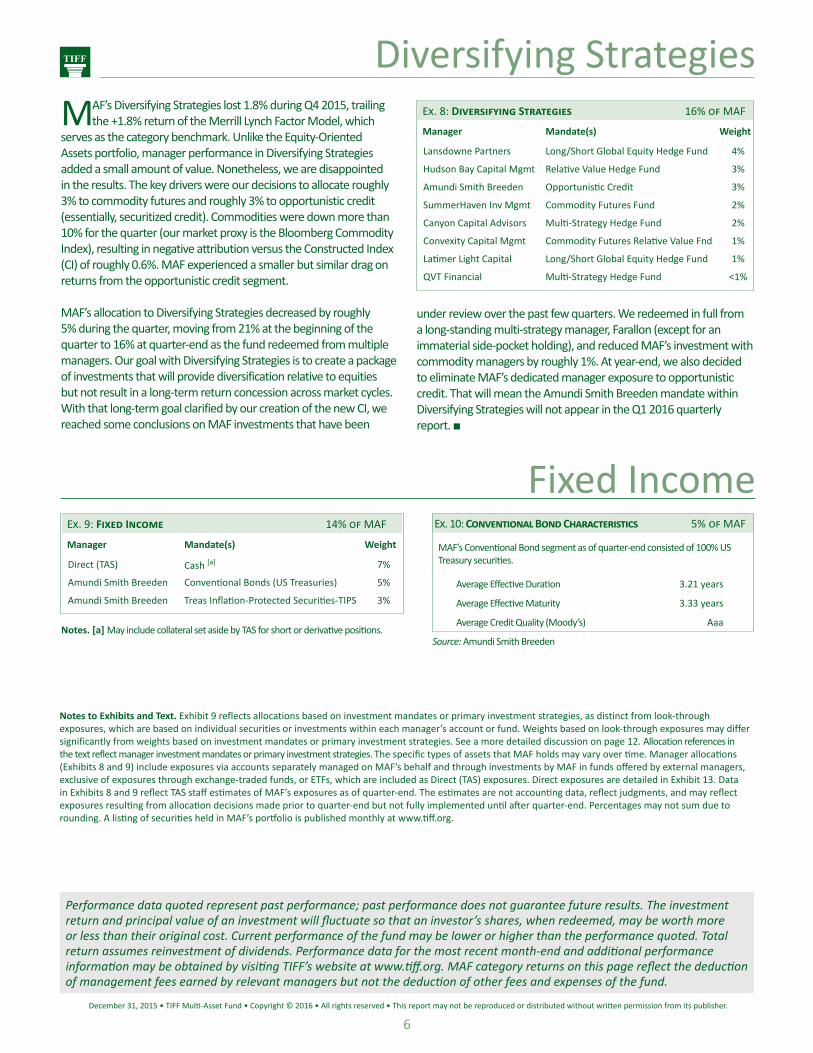
MAF’s Diversifying Strategies lost 1.8% during Q4 2015, trailing the +1.8% return of the Merrill Lynch Factor Model, which
serves as the category benchmark. Unlike the Equity-Oriented Assets portfolio, manager performance in Diversifying Strategies added a small amount of value. Nonetheless, we are disappointed in the results. The key drivers were our decisions to allocate roughly 3% to commodity futures and roughly 3% to opportunistic credit (essentially, securitized credit). Commodities were down more than 10% for the quarter (our market proxy is the Bloomberg Commodity Index), resulting in negative attribution versus the Constructed Index (CI) of roughly 0.6%. MAF experienced a smaller but similar drag on returns from the opportunistic credit segment.
MAF’s allocation to Diversifying Strategies decreased by roughly 5% during the quarter, moving from 21% at the beginning of the quarter to 16% at quarter-end as the fund redeemed from multiple managers. Our goal with Diversifying Strategies is to create a package of investments that will provide diversification relative to equities but not result in a long-term return concession across market cycles. With that long-term goal clarified by our creation of the new CI, we reached some conclusions on MAF investments that have been
Diversifying Strategies
Fixed IncomeEx. 9: Fixed Income 14% of MAF
Manager Mandate(s) Weight
Direct (TAS) Cash [a] 7%
Amundi Smith Breeden Conventional Bonds (US Treasuries) 5%
Amundi Smith Breeden Treas Inflation-Protected Securities-TIPS 3%
Ex. 8: Diversifying Strategies 16% of MAF
Manager Mandate(s) Weight
Lansdowne Partners Long/Short Global Equity Hedge Fund 4%
Hudson Bay Capital Mgmt Relative Value Hedge Fund 3%
Amundi Smith Breeden Opportunistic Credit 3%
SummerHaven Inv Mgmt Commodity Futures Fund 2%
Canyon Capital Advisors Multi-Strategy Hedge Fund 2%
Convexity Capital Mgmt Commodity Futures Relative Value Fnd 1%
Latimer Light Capital Long/Short Global Equity Hedge Fund 1%
QVT Financial Multi-Strategy Hedge Fund <1%
under review over the past few quarters. We redeemed in full from a long-standing multi-strategy manager, Farallon (except for an immaterial side-pocket holding), and reduced MAF’s investment with commodity managers by roughly 1%. At year-end, we also decided to eliminate MAF’s dedicated manager exposure to opportunistic credit. That will mean the Amundi Smith Breeden mandate within Diversifying Strategies will not appear in the Q1 2016 quarterly report. ■
Notes to Exhibits and Text. Exhibit 9 reflects allocations based on investment mandates or primary investment strategies, as distinct from look-through exposures, which are based on individual securities or investments within each manager’s account or fund. Weights based on look-through exposures may differ significantly from weights based on investment mandates or primary investment strategies. See a more detailed discussion on page 12. Allocation references in the text reflect manager investment mandates or primary investment strategies. The specific types of assets that MAF holds may vary over time. Manager allocations (Exhibits 8 and 9) include exposures via accounts separately managed on MAF’s behalf and through investments by MAF in funds offered by external managers, exclusive of exposures through exchange-traded funds, or ETFs, which are included as Direct (TAS) exposures. Direct exposures are detailed in Exhibit 13. Data in Exhibits 8 and 9 reflect TAS staff estimates of MAF’s exposures as of quarter-end. The estimates are not accounting data, reflect judgments, and may reflect exposures resulting from allocation decisions made prior to quarter-end but not fully implemented until after quarter-end. Percentages may not sum due to rounding. A listing of securities held in MAF’s portfolio is published monthly at www.tiff.org.
Ex. 10: Conventional Bond Characteristics 5% of MAF
MAF’s Conventional Bond segment as of quarter-end consisted of 100% US Treasury securities.
Average Effective Duration 3.21 years
Average Effective Maturity 3.33 years
Average Credit Quality (Moody’s) Aaa
Source: Amundi Smith BreedenNotes. [a] May include collateral set aside by TAS for short or derivative positions.
Performance data quoted represent past performance; past performance does not guarantee future results. The investment return and principal value of an investment will fluctuate so that an investor’s shares, when redeemed, may be worth more or less than their original cost. Current performance of the fund may be lower or higher than the performance quoted. Total return assumes reinvestment of dividends. Performance data for the most recent month-end and additional performance information may be obtained by visiting TIFF’s website at www.tiff.org. MAF category returns on this page reflect the deduction of management fees earned by relevant managers but not the deduction of other fees and expenses of the fund.
December 31, 2015 • TIFF Multi-Asset Fund • Copyright © 2016 • All rights reserved • This report may not be reproduced or distributed without written permission from its publisher.
7
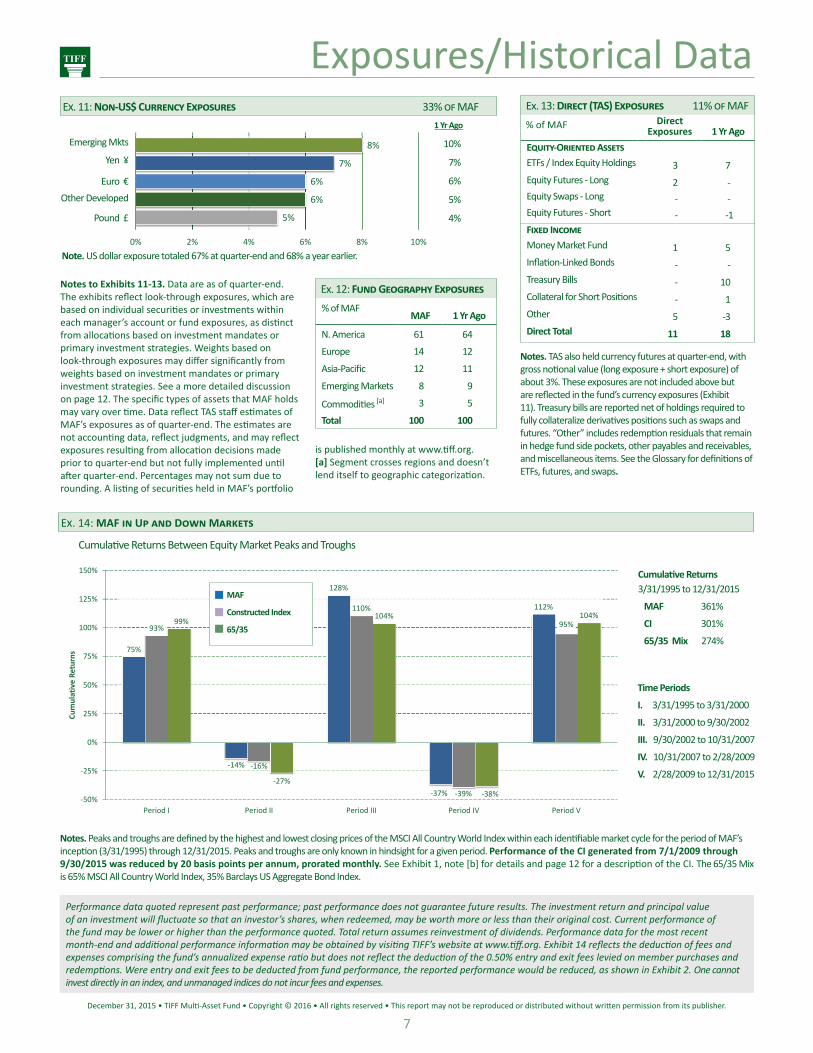
Notes. Peaks and troughs are defined by the highest and lowest closing prices of the MSCI All Country World Index within each identifiable market cycle for the period of MAF’s inception (3/31/1995) through 12/31/2015. Peaks and troughs are only known in hindsight for a given period. Performance of the CI generated from 7/1/2009 through 9/30/2015 was reduced by 20 basis points per annum, prorated monthly. See Exhibit 1, note [b] for details and page 12 for a description of the CI. The 65/35 Mix is 65% MSCI All Country World Index, 35% Barclays US Aggregate Bond Index.
Time Periods
I. 3/31/1995 to 3/31/2000
II. 3/31/2000 to 9/30/2002
III. 9/30/2002 to 10/31/2007
IV. 10/31/2007 to 2/28/2009
V. 2/28/2009 to 12/31/2015
Ex. 14: MAF in Up and Down Markets
Cumulative Returns3/31/1995 to 12/31/2015
MAF 361%
CI 301%
65/35 Mix 274%
Cumulative Returns Between Equity Market Peaks and Troughs
75%
‐14%
128%
‐37%
112%
93%
‐16%
110%
‐39%
95%99%
‐27%
104%
‐38%
104%
‐50%
‐25%
0%
25%
50%
75%
100%
125%
150%
Period I Period II Period III Period IV Period V
Cumulative Re
turns
MAF Constructed Index 65/35 Mix
Performance data quoted represent past performance; past performance does not guarantee future results. The investment return and principal value of an investment will fluctuate so that an investor’s shares, when redeemed, may be worth more or less than their original cost. Current performance of the fund may be lower or higher than the performance quoted. Total return assumes reinvestment of dividends. Performance data for the most recent month-end and additional performance information may be obtained by visiting TIFF’s website at www.tiff.org. Exhibit 14 reflects the deduction of fees and expenses comprising the fund’s annualized expense ratio but does not reflect the deduction of the 0.50% entry and exit fees levied on member purchases and redemptions. Were entry and exit fees to be deducted from fund performance, the reported performance would be reduced, as shown in Exhibit 2. One cannot invest directly in an index, and unmanaged indices do not incur fees and expenses.
Notes to Exhibits 11-13. Data are as of quarter-end. The exhibits reflect look-through exposures, which are based on individual securities or investments within each manager’s account or fund exposures, as distinct from allocations based on investment mandates or primary investment strategies. Weights based on look-through exposures may differ significantly from weights based on investment mandates or primary investment strategies. See a more detailed discussion on page 12. The specific types of assets that MAF holds may vary over time. Data reflect TAS staff estimates of MAF’s exposures as of quarter-end. The estimates are not accounting data, reflect judgments, and may reflect exposures resulting from allocation decisions made prior to quarter-end but not fully implemented until after quarter-end. Percentages may not sum due to rounding. A listing of securities held in MAF’s portfolio
Exposures/Historical Data
Note. US dollar exposure totaled 67% at quarter-end and 68% a year earlier.
1 Yr Ago
10%
7%
6%
5%
4%
Ex. 11: Non-US$ Currency Exposures 33% of MAF
Emerging Mkts
Yen ¥
Euro €Other Developed
Pound £ 5%
6%
6%
7%
8%
0% 2% 4% 6% 8% 10%
Ex. 13: Direct (TAS) Exposures 11% of MAF % of MAF Direct
Exposures 1 Yr AgoEquity-Oriented AssetsETFs / Index Equity Holdings 3 7Equity Futures - Long 2 -Equity Swaps - Long - -Equity Futures - Short - -1Fixed IncomeMoney Market Fund 1 5Inflation-Linked Bonds - -Treasury Bills - 10Collateral for Short Positions - 1Other 5 -3Direct Total 11 18
Notes. TAS also held currency futures at quarter-end, with gross notional value (long exposure + short exposure) of about 3%. These exposures are not included above but are reflected in the fund’s currency exposures (Exhibit 11). Treasury bills are reported net of holdings required to fully collateralize derivatives positions such as swaps and futures. “Other” includes redemption residuals that remain in hedge fund side pockets, other payables and receivables, and miscellaneous items. See the Glossary for definitions of ETFs, futures, and swaps.
Ex. 12: Fund Geography Exposures % of MAF
MAF 1 Yr Ago
N. America 61 64
Europe 14 12
Asia-Pacific 12 11
Emerging Markets 8 9
Commodities [a] 3 5
Total 100 100
MAF
Constructed Index
65/35
is published monthly at www.tiff.org. [a] Segment crosses regions and doesn’t lend itself to geographic categorization.
December 31, 2015 • TIFF Multi-Asset Fund • Copyright © 2016 • All rights reserved • This report may not be reproduced or distributed without written permission from its publisher.
8
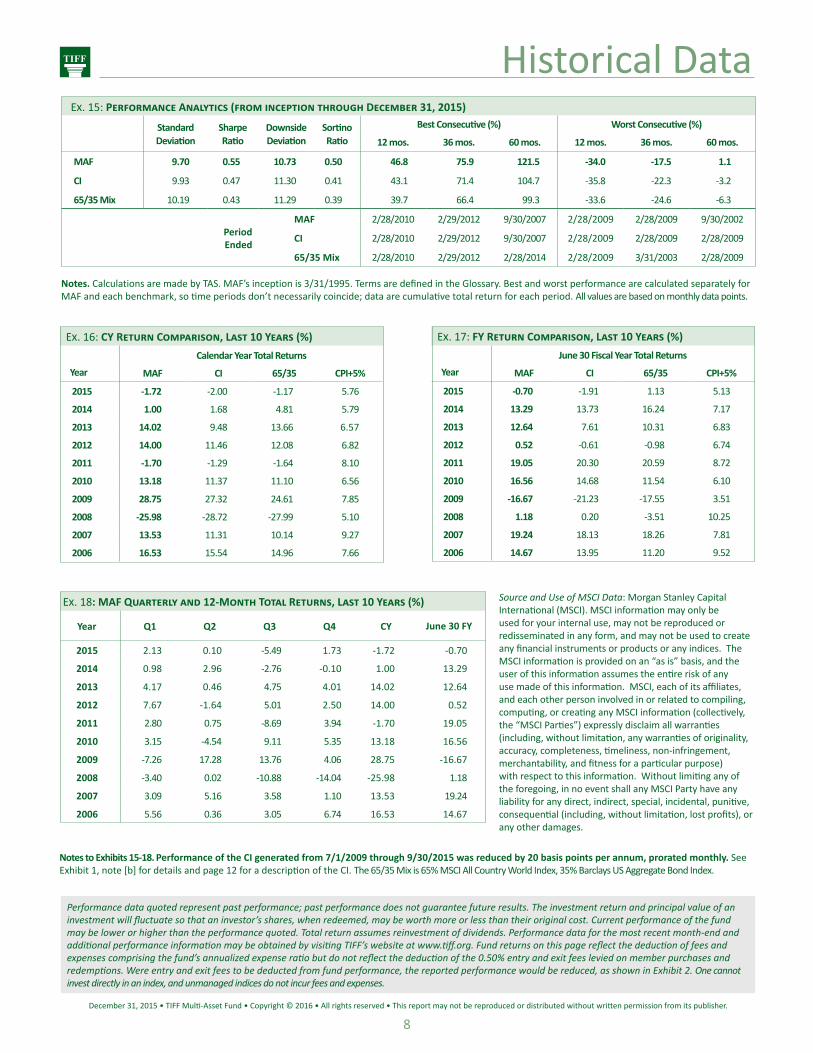
Ex. 15: Performance Analytics (from inception through December 31, 2015)
Standard Deviation
Sharpe Ratio
DownsideDeviation
SortinoRatio
Best Consecutive (%) Worst Consecutive (%)
12 mos. 36 mos. 60 mos. 12 mos. 36 mos. 60 mos.
MAF 9.70 0.55 10.73 0.50 46.8 75.9 121.5 -34.0 -17.5 1.1
CI 9.93 0.47 11.30 0.41 43.1 71.4 104.7 -35.8 -22.3 -3.2
65/35 Mix 10.19 0.43 11.29 0.39 39.7 66.4 99.3 -33.6 -24.6 -6.3
Period Ended
MAF 2/28/2010 2/29/2012 9/30/2007 2/28/2009 2/28/2009 9/30/2002
CI 2/28/2010 2/29/2012 9/30/2007 2/28/2009 2/28/2009 2/28/2009
65/35 Mix 2/28/2010 2/29/2012 2/28/2014 2/28/2009 3/31/2003 2/28/2009
Notes. Calculations are made by TAS. MAF’s inception is 3/31/1995. Terms are defined in the Glossary. Best and worst performance are calculated separately for MAF and each benchmark, so time periods don’t necessarily coincide; data are cumulative total return for each period. All values are based on monthly data points.
Ex. 16: CY Return Comparison, Last 10 Years (%)
Year
Calendar Year Total Returns
MAF CI 65/35 CPI+5%
2015 -1.72 -2.00 -1.17 5.76
2014 1.00 1.68 4.81 5.79
2013 14.02 9.48 13.66 6.57
2012 14.00 11.46 12.08 6.82
2011 -1.70 -1.29 -1.64 8.10
2010 13.18 11.37 11.10 6.56
2009 28.75 27.32 24.61 7.85
2008 -25.98 -28.72 -27.99 5.10
2007 13.53 11.31 10.14 9.27
2006 16.53 15.54 14.96 7.66
Ex. 17: FY Return Comparison, Last 10 Years (%)
Year
June 30 Fiscal Year Total Returns
MAF CI 65/35 CPI+5%
2015 -0.70 -1.91 1.13 5.13
2014 13.29 13.73 16.24 7.17
2013 12.64 7.61 10.31 6.83
2012 0.52 -0.61 -0.98 6.74
2011 19.05 20.30 20.59 8.72
2010 16.56 14.68 11.54 6.10
2009 -16.67 -21.23 -17.55 3.51
2008 1.18 0.20 -3.51 10.25
2007 19.24 18.13 18.26 7.81
2006 14.67 13.95 11.20 9.52
Historical Data
Ex. 18: MAF Quarterly and 12-Month Total Returns, Last 10 Years (%)
Year Q1 Q2 Q3 Q4 CY June 30 FY
2015 2.13 0.10 -5.49 1.73 -1.72 -0.70
2014 0.98 2.96 -2.76 -0.10 1.00 13.29
2013 4.17 0.46 4.75 4.01 14.02 12.64
2012 7.67 -1.64 5.01 2.50 14.00 0.52
2011 2.80 0.75 -8.69 3.94 -1.70 19.05
2010 3.15 -4.54 9.11 5.35 13.18 16.56
2009 -7.26 17.28 13.76 4.06 28.75 -16.67
2008 -3.40 0.02 -10.88 -14.04 -25.98 1.18
2007 3.09 5.16 3.58 1.10 13.53 19.24
2006 5.56 0.36 3.05 6.74 16.53 14.67
Source and Use of MSCI Data: Morgan Stanley Capital International (MSCI). MSCI information may only be used for your internal use, may not be reproduced or redisseminated in any form, and may not be used to create any financial instruments or products or any indices. The MSCI information is provided on an “as is” basis, and the user of this information assumes the entire risk of any use made of this information. MSCI, each of its affiliates, and each other person involved in or related to compiling, computing, or creating any MSCI information (collectively, the “MSCI Parties”) expressly disclaim all warranties (including, without limitation, any warranties of originality, accuracy, completeness, timeliness, non-infringement, merchantability, and fitness for a particular purpose) with respect to this information. Without limiting any of the foregoing, in no event shall any MSCI Party have any liability for any direct, indirect, special, incidental, punitive, consequential (including, without limitation, lost profits), or any other damages.
Performance data quoted represent past performance; past performance does not guarantee future results. The investment return and principal value of an investment will fluctuate so that an investor’s shares, when redeemed, may be worth more or less than their original cost. Current performance of the fund may be lower or higher than the performance quoted. Total return assumes reinvestment of dividends. Performance data for the most recent month-end and additional performance information may be obtained by visiting TIFF’s website at www.tiff.org. Fund returns on this page reflect the deduction of fees and expenses comprising the fund’s annualized expense ratio but do not reflect the deduction of the 0.50% entry and exit fees levied on member purchases and redemptions. Were entry and exit fees to be deducted from fund performance, the reported performance would be reduced, as shown in Exhibit 2. One cannot invest directly in an index, and unmanaged indices do not incur fees and expenses.
Notes to Exhibits 15-18. Performance of the CI generated from 7/1/2009 through 9/30/2015 was reduced by 20 basis points per annum, prorated monthly. See Exhibit 1, note [b] for details and page 12 for a description of the CI. The 65/35 Mix is 65% MSCI All Country World Index, 35% Barclays US Aggregate Bond Index.
December 31, 2015 • TIFF Multi-Asset Fund • Copyright © 2016 • All rights reserved • This report may not be reproduced or distributed without written permission from its publisher.
9
1.4
‐0.2
‐0.9
‐2.4
‐0.8
0.1
‐5.7
‐14.9
‐4.4
0.9
‐0.3
1.5
‐24.7
0.2
0.5
0.9
‐1.7
1.2
0.9
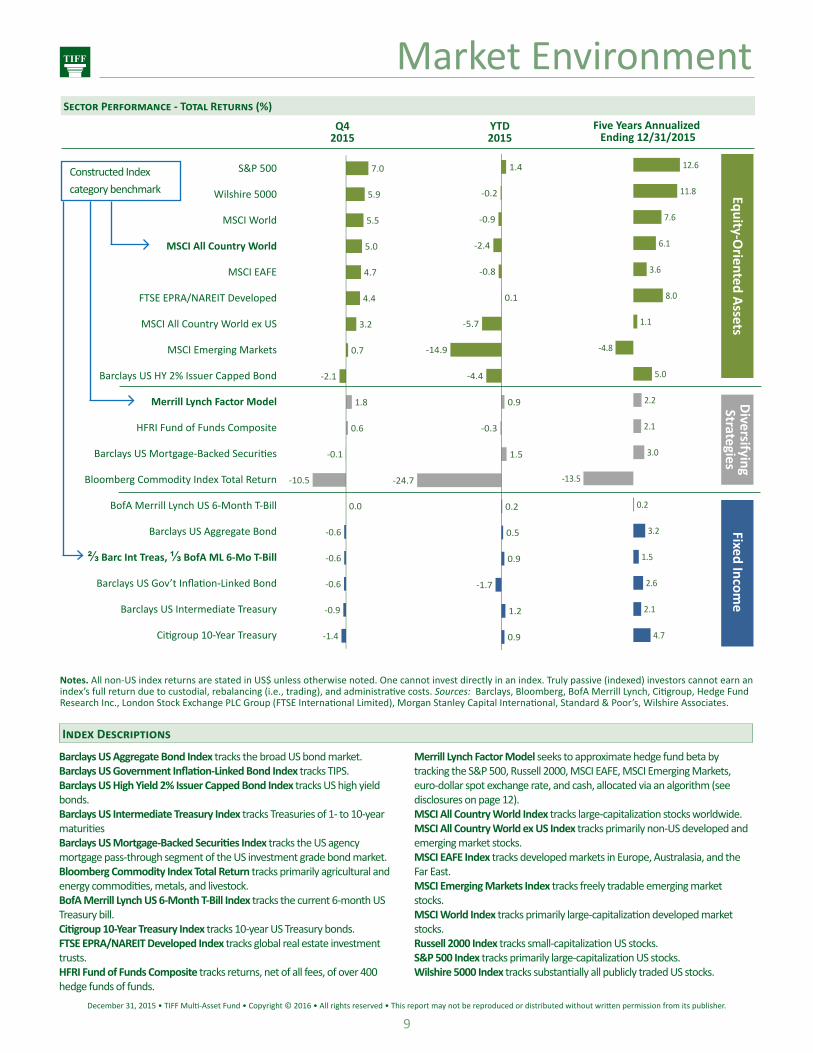
Market Environment
Notes. All non-US index returns are stated in US$ unless otherwise noted. One cannot invest directly in an index. Truly passive (indexed) investors cannot earn an index’s full return due to custodial, rebalancing (i.e., trading), and administrative costs. Sources: Barclays, Bloomberg, BofA Merrill Lynch, Citigroup, Hedge Fund Research Inc., London Stock Exchange PLC Group (FTSE International Limited), Morgan Stanley Capital International, Standard & Poor’s, Wilshire Associates.
Barclays US Aggregate Bond Index tracks the broad US bond market.Barclays US Government Inflation-Linked Bond Index tracks TIPS.Barclays US High Yield 2% Issuer Capped Bond Index tracks US high yield bonds.Barclays US Intermediate Treasury Index tracks Treasuries of 1- to 10-year maturitiesBarclays US Mortgage-Backed Securities Index tracks the US agency mortgage pass-through segment of the US investment grade bond market.Bloomberg Commodity Index Total Return tracks primarily agricultural and energy commodities, metals, and livestock. BofA Merrill Lynch US 6-Month T-Bill Index tracks the current 6-month US Treasury bill.Citigroup 10-Year Treasury Index tracks 10-year US Treasury bonds.FTSE EPRA/NAREIT Developed Index tracks global real estate investment trusts.HFRI Fund of Funds Composite tracks returns, net of all fees, of over 400 hedge funds of funds.
Merrill Lynch Factor Model seeks to approximate hedge fund beta by tracking the S&P 500, Russell 2000, MSCI EAFE, MSCI Emerging Markets, euro-dollar spot exchange rate, and cash, allocated via an algorithm (see disclosures on page 12). MSCI All Country World Index tracks large-capitalization stocks worldwide.MSCI All Country World ex US Index tracks primarily non-US developed and emerging market stocks.MSCI EAFE Index tracks developed markets in Europe, Australasia, and the Far East. MSCI Emerging Markets Index tracks freely tradable emerging market stocks. MSCI World Index tracks primarily large-capitalization developed market stocks.Russell 2000 Index tracks small-capitalization US stocks.S&P 500 Index tracks primarily large-capitalization US stocks. Wilshire 5000 Index tracks substantially all publicly traded US stocks.
Index Descriptions
Constructed Index category benchmark
Sector Performance - Total Returns (%) Five Years Annualized Ending 12/31/2015
Q42015
7.0
5.9
5.5
5.0
4.7
4.4
3.2
0.7
‐2.1
1.8
0.6
‐0.1
‐10.5
0.0
‐0.6
‐0.6
‐0.6
‐0.9
‐1.4
YTD2015
12.6
11.8
7.6
6.1
3.6
8.0
1.1
‐4.8
5.0
2.2
2.1
3.0
‐13.5
0.2
3.2
1.5
2.6
2.1
4.7
Equity-Oriented Assets
DiversifyingStrategies
Fixed Income
S&P 500
Wilshire 5000
MSCI World
MSCI All Country World
MSCI EAFE
FTSE EPRA/NAREIT Developed
MSCI All Country World ex US
MSCI Emerging Markets
Barclays US HY 2% Issuer Capped Bond
Merrill Lynch Factor Model
HFRI Fund of Funds Composite
Barclays US Mortgage-Backed Securities
Bloomberg Commodity Index Total Return
BofA Merrill Lynch US 6-Month T-Bill
Barclays US Aggregate Bond
⅔ Barc Int Treas, ⅓ BofA ML 6-Mo T-Bill
Barclays US Gov’t Inflation-Linked Bond
Barclays US Intermediate Treasury
Citigroup 10-Year Treasury
December 31, 2015 • TIFF Multi-Asset Fund • Copyright © 2016 • All rights reserved • This report may not be reproduced or distributed without written permission from its publisher.
10
0
10
20
30
40
50
60
Dec‐79
Dec‐80
Dec‐81
Dec‐82
Dec‐83
Dec‐84
Dec‐85
Dec‐86
Dec‐87
Dec‐88
Dec‐89
Dec‐90
Dec‐91
Dec‐92
Dec‐93
Dec‐94
Dec‐95
Dec‐96
Dec‐97
Dec‐98
Dec‐99
Dec‐00
Dec‐01
Dec‐02
Dec‐03
Dec‐04
Dec‐05
Dec‐06
Dec‐07
Dec‐08
Dec‐09
Dec‐10
Dec‐11
Dec‐12
Dec‐13
Dec‐14
Dec‐15
US
Europe ex UK
China
UK
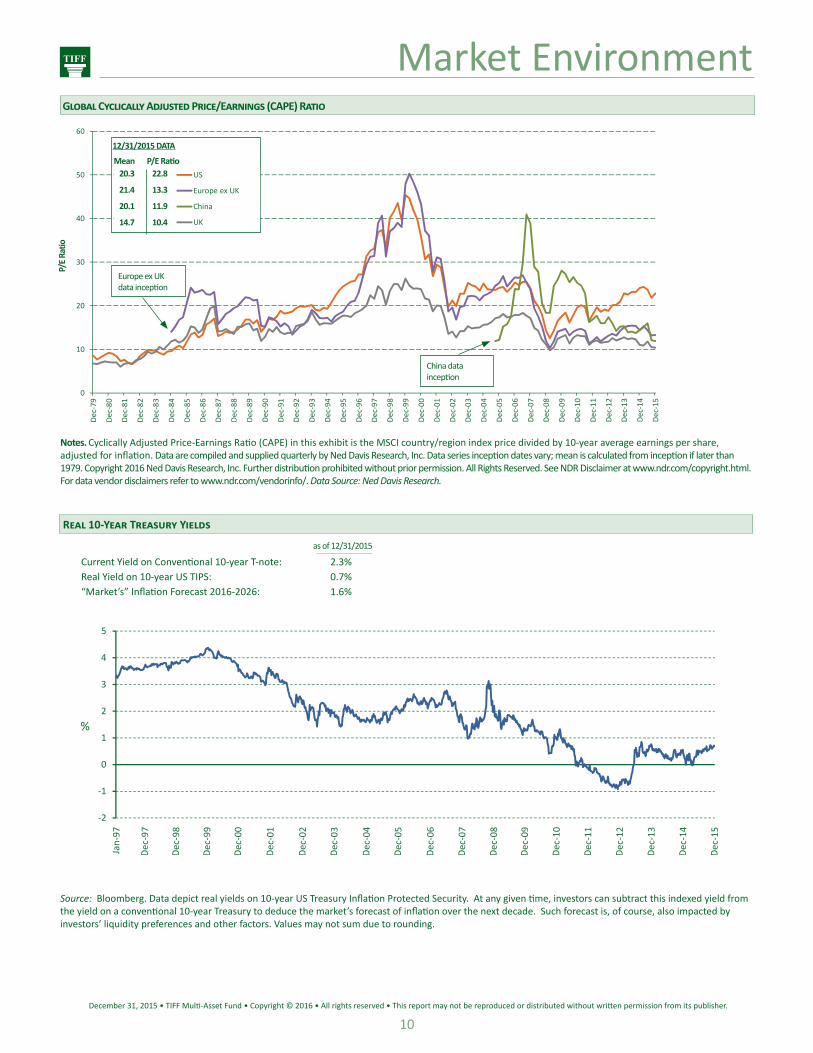
20.3 22.8
21.4 13.3
20.1 11.9
14.7 10.4
Market Environment Global Cyclically Adjusted Price/Earnings (CAPE) Ratio
Europe ex UK data inception
China data inception
12/31/2015 DATA
Mean P/E Ratio
Real 10-Year Treasury Yields
Source: Bloomberg. Data depict real yields on 10-year US Treasury Inflation Protected Security. At any given time, investors can subtract this indexed yield from the yield on a conventional 10-year Treasury to deduce the market’s forecast of inflation over the next decade. Such forecast is, of course, also impacted by investors’ liquidity preferences and other factors. Values may not sum due to rounding.
Current Yield on Conventional 10-year T-note: 2.3%Real Yield on 10-year US TIPS: 0.7%“Market’s” Inflation Forecast 2016-2026: 1.6%
‐2
‐1
0
1
2
3
4
5
%
as of 12/31/2015
P/E
Ratio
Notes. Cyclically Adjusted Price-Earnings Ratio (CAPE) in this exhibit is the MSCI country/region index price divided by 10-year average earnings per share, adjusted for inflation. Data are compiled and supplied quarterly by Ned Davis Research, Inc. Data series inception dates vary; mean is calculated from inception if later than 1979. Copyright 2016 Ned Davis Research, Inc. Further distribution prohibited without prior permission. All Rights Reserved. See NDR Disclaimer at www.ndr.com/copyright.html. For data vendor disclaimers refer to www.ndr.com/vendorinfo/. Data Source: Ned Davis Research.
December 31, 2015 • TIFF Multi-Asset Fund • Copyright © 2016 • All rights reserved • This report may not be reproduced or distributed without written permission from its publisher.
11
0
1
2
3
4
3 mo
6 mo
2 yr
5 yr
10 yr
30 yr
%
Market Environment
0
200
400
600
800
1000
Basis
Points
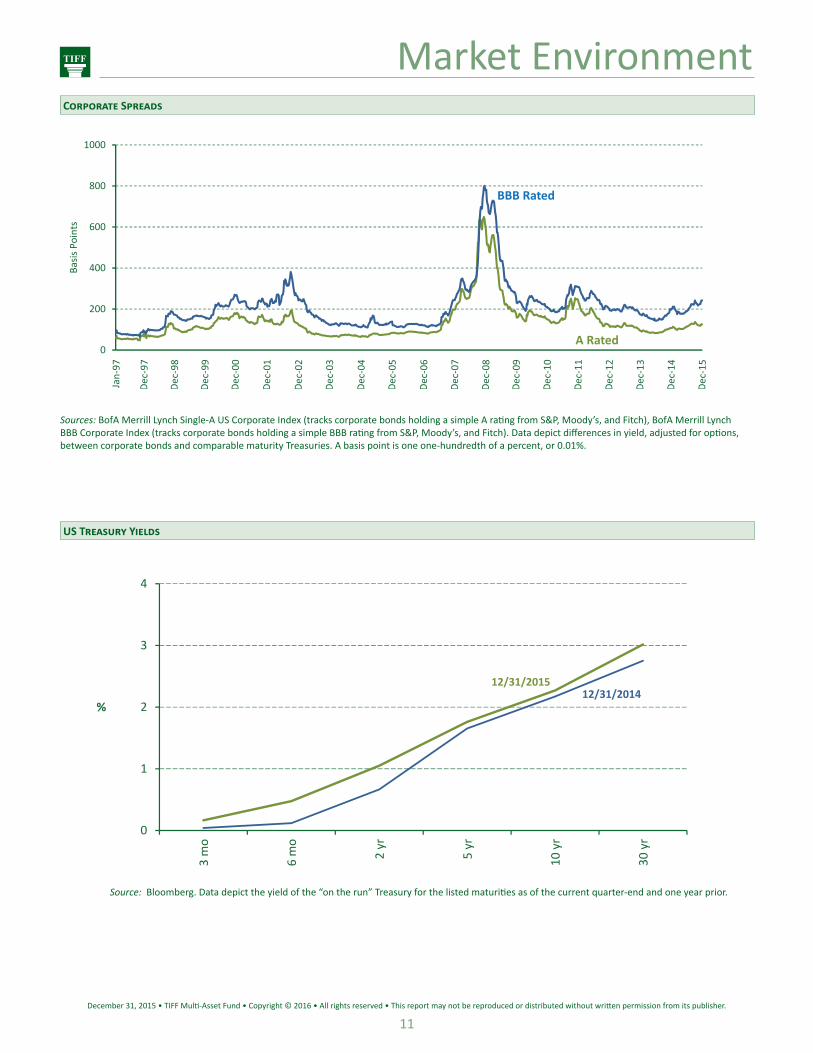
Sources: BofA Merrill Lynch Single-A US Corporate Index (tracks corporate bonds holding a simple A rating from S&P, Moody’s, and Fitch), BofA Merrill Lynch BBB Corporate Index (tracks corporate bonds holding a simple BBB rating from S&P, Moody’s, and Fitch). Data depict differences in yield, adjusted for options, between corporate bonds and comparable maturity Treasuries. A basis point is one one-hundredth of a percent, or 0.01%.
BBB Rated
A Rated
Corporate Spreads
US Treasury Yields
Source: Bloomberg. Data depict the yield of the “on the run” Treasury for the listed maturities as of the current quarter-end and one year prior.
12/31/201412/31/2015
December 31, 2015 • TIFF Multi-Asset Fund • Copyright © 2016 • All rights reserved • This report may not be reproduced or distributed without written permission from its publisher.
12
TIFF “seeks to enhance the investment returns of non-profit organizations,” according to the organization’s long-standing mission. With that objective firmly in mind, TIFF’s investment team and boards spent considerable time in 2015 deliberating on an appropriate update to MAF’s Constructed Index (CI), a blended benchmark and policy portfolio for the fund. The team and board members believe that a portfolio pursuing CPI + 5% must over the long term have a high structural allocation to equity-oriented assets and that the new CI weights, which became effective October 1, 2015, reflect an asset allocation that is well positioned for a wide array of market outcomes. TIFF is also charged with helping “non-profit organizations monitor and evaluate their investment performance.” Thus, the CI was simplified from prior versions in a manner designed to be more straightforward and clear.
TIFF Advisory Services, Inc. (TAS), MAF’s investment advisor, believes that MAF’s primary benchmark, the Consumer Price Index (CPI) plus 5% per annum, is an appropriate long-term performance benchmark for MAF but may not be meaningful over shorter time periods, especially those in which markets are highly volatile (e.g., calendar year 2008). Accordingly, at MAF’s inception on March 31, 1995, TAS staff, in consultation with the boards of directors of TAS and the TIFF Investment Program (TIP), created the Constructed Index (CI) as a further means of assessing MAF’s performance. TAS believes that the CI is a relevant performance benchmark for both short- and long-term periods.
The CI (a/k/a policy portfolio) is a blended index now comprised of three broad investment categories, weighted according to policy norms, with each category assigned a benchmark selected by TAS. The TAS and TIP boards view the CI, in general, as an appropriate long-term asset mix for non-profit organizations that seek to maintain the inflation-adjusted value of their assets while distributing 5% of these assets annually. The CI is also intended to help such organizations better assess MAF’s performance by providing a comparison of the active strategies pursued by TAS and external managers versus the returns of relevant benchmarks. In TAS’s view, the CI also helps convey to MAF investors a general sense of the overall investment risks to which their capital might be subject (although the CI is only one of several tools that TAS staff uses internally to assess investment risks in MAF).
TAS has changed the composition of the CI over time, including the most recent change (effective October 1, 2015) from a CI comprised of various
asset segments to a CI comprised of three broad investment categories. In the past, TAS has changed the CI’s policy norms (or weights), asset segments, and segment benchmarks. TAS’s ongoing review of the CI may cause TAS to make additional changes in the future. Such changes are made only after careful study and consultation with the TAS and TIP boards. Past versions of the CI segments, benchmarks, and weights may be obtained by contacting TIFF at 610-684-8200.
TAS assigns each manager account, underlying acquired fund, or direct investment selected by TAS (each such manager account, underlying acquired fund, and direct investment is referred to as a “holding”) to one of the three CI categories. To select an appropriate category, TAS takes into account such characteristics as the holding’s stated investment mandate and expected investment strategy as well as an assessment of the holding’s risk characteristics. The assignment process may not reflect, or look through to, the entirety of the individual securities or investments comprising each holding. For example, an account pursuing a global equity mandate will be categorized as an “Equity-Oriented Asset” if its primary investment strategy is to invest in equity securities, even if it also holds a certain amount of uninvested cash, fixed income securities, or other investments that are not commonly thought of as equity securities. Holdings in the “Diversifying Strategies” category include those that display significant diversifying characteristics to either or both of the “Equity-Oriented Assets” and the “Fixed Income” categories. TAS expects that most of MAF’s holdings in privately offered investment funds commonly known as hedge funds will be categorized as “Diversifying Strategies.” However, certain of MAF’s hedge fund holdings may be categorized as “Equity-Oriented Assets” or “Fixed Income” if they do not display significant diversifying characteristics but rather display significant equity or fixed income characteristics. As a result of this method of categorizing holdings, the exposures and weights reported for MAF within each CI category should be thought of as investment mandate weights and not “look-through” asset class weights. Look-through asset class weights may differ, at times significantly, from the investment mandate weights reported.
CI weights are rebalanced by TAS at each month-end; those from July 1, 2009, through December 31, 2015, reflected quarter-end rebalancing. Actual weights in MAF tend to vary over time.
Multi-Asset Fund Constructed Index Effective October 1, 2015
Constructed Index
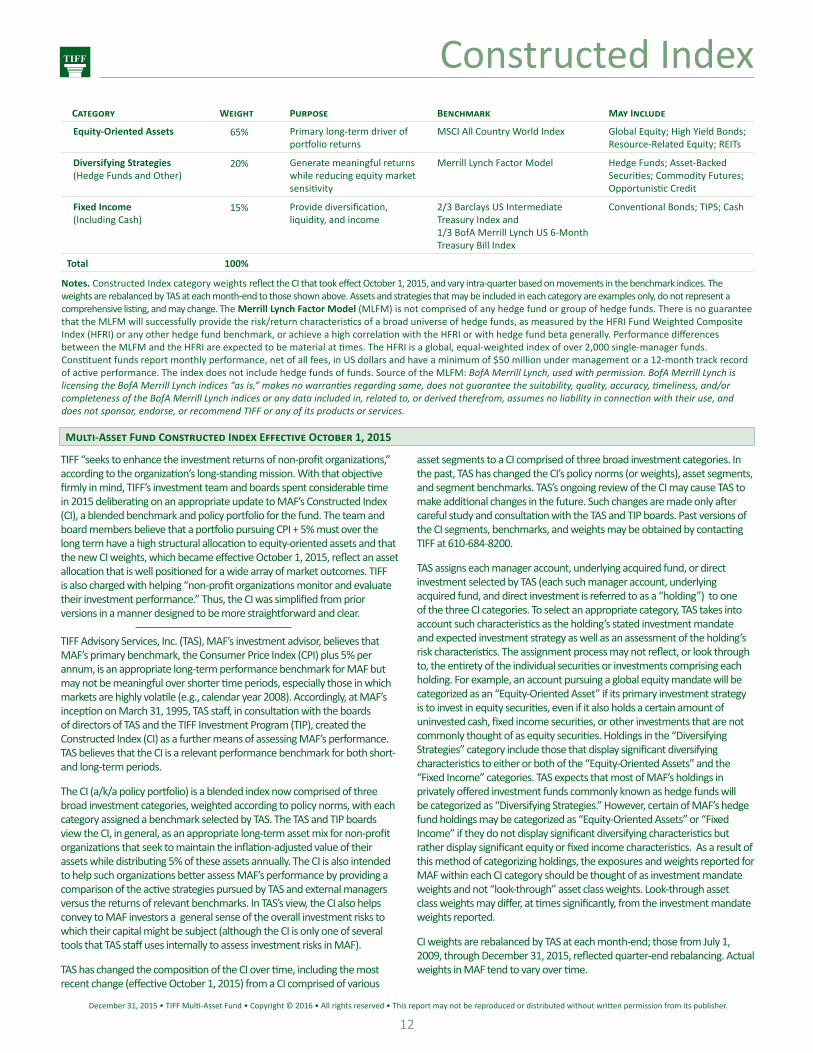
Notes. Constructed Index category weights reflect the CI that took effect October 1, 2015, and vary intra-quarter based on movements in the benchmark indices. The weights are rebalanced by TAS at each month-end to those shown above. Assets and strategies that may be included in each category are examples only, do not represent a comprehensive listing, and may change. The Merrill Lynch Factor Model (MLFM) is not comprised of any hedge fund or group of hedge funds. There is no guarantee that the MLFM will successfully provide the risk/return characteristics of a broad universe of hedge funds, as measured by the HFRI Fund Weighted Composite Index (HFRI) or any other hedge fund benchmark, or achieve a high correlation with the HFRI or with hedge fund beta generally. Performance differences between the MLFM and the HFRI are expected to be material at times. The HFRI is a global, equal-weighted index of over 2,000 single-manager funds. Constituent funds report monthly performance, net of all fees, in US dollars and have a minimum of $50 million under management or a 12-month track record of active performance. The index does not include hedge funds of funds. Source of the MLFM: BofA Merrill Lynch, used with permission. BofA Merrill Lynch is licensing the BofA Merrill Lynch indices “as is,” makes no warranties regarding same, does not guarantee the suitability, quality, accuracy, timeliness, and/or completeness of the BofA Merrill Lynch indices or any data included in, related to, or derived therefrom, assumes no liability in connection with their use, and does not sponsor, endorse, or recommend TIFF or any of its products or services.
Category Weight Purpose Benchmark May Include
Equity-Oriented Assets 65% Primary long-term driver of portfolio returns
MSCI All Country World Index Global Equity; High Yield Bonds; Resource-Related Equity; REITs
Diversifying Strategies(Hedge Funds and Other)
20% Generate meaningful returns while reducing equity market sensitivity
Merrill Lynch Factor Model Hedge Funds; Asset-Backed Securities; Commodity Futures; Opportunistic Credit
Fixed Income(Including Cash)
15% Provide diversification,liquidity, and income
2/3 Barclays US Intermediate Treasury Index and1/3 BofA Merrill Lynch US 6-Month Treasury Bill Index
Conventional Bonds; TIPS; Cash
Total 100%
December 31, 2015 • TIFF Multi-Asset Fund • Copyright © 2016 • All rights reserved • This report may not be reproduced or distributed without written permission from its publisher.
13
GlossaryAcquired Funds are investment funds such as exchange-traded funds, open-end mutual funds, and privately offered investment funds commonly known as hedge funds that buy assets and charge to investors certain costs, fees, and expenses, typically in proportion to each investor’s investment in such acquired funds. Separate Account Managers offer segregated accounts in which assets owned directly by MAF are managed according to customized guidelines. The term Manager, as used in this report, encompasses both acquired fund managers and separate account managers.
Alpha represents the amount of a stock’s return, on average, that is independent of the market’s return. Beta is an asset’s sensitivity to market moves. If the market gains 10%, an asset with a beta of 1.0 will, on average, gain 10%. Basis Point is one one-hundredth of a percent, or 0.01%.
Correlation refers to the degree to which asset prices move in tandem. A correlation of +1.0 results when two securities move in the same direction in lockstep. A -1.0 correlation results when the movement is directly opposite. A zero correlation implies complete randomness, or no correlation.
Derivatives are instruments, such as options and futures, whose price is derived from fluctuations in underlying assets. Typically, derivatives take the form of contracts between two parties. Futures contracts obligate a buyer to purchase an asset at a future date and price. Options contracts give a buyer the right to buy or sell an asset at an agreed price over a specified period or on a specified date. Swaps involve the exchange of an asset or security for another when the parties perceive mutual advantage. Swaps may involve, for example, currencies, debt instruments, or exchanges of debt for equity.
Direct (TAS) exposures reflect primarily passive exposures to asset segments implemented by MAF’s investment advisor, TIFF Advisory Services Inc. (TAS), as detailed in Exhibit 13.
Downside Deviation measures the volatility of negative returns.
Duration is a measure of the sensitivity of the price of a debt security or portfolio of debt securities to a change in interest rates. The higher the duration, the more sensitive a debt security is to interest rate changes.
ETFs, or exchange-traded funds, are generally funds that are constructed like a mutual fund but are traded throughout the trading day on an exchange at a market price and often track market indices.
Hedge funds are privately offered investment funds. They typically pursue returns that are not highly correlated to more traditional long-only strategies and often utilize “hedging” strategies that take both long positions, expecting an asset to rise in value, and short positions, expecting an asset to decline in value. A short position generally entails borrowing shares of a security while expecting a decline in value, selling the units, and then returning an equivalent number of shares. However, some hedge funds engage only in “buy and hold” strategies or other strategies that may not involve hedging in the traditional sense. Hedge funds are managed by professional investment management firms that buy assets and charge investors certain costs, fees, and expenses, typically in proportion to each
investor’s investment in such hedge funds.
Liquidity refers to the ease with which an asset can be converted to cash. For purposes of MAF’s restrictions on illiquid holdings, an investment is considered to be illiquid if it cannot be redeemed or otherwise disposed of in the ordinary course of business within seven days at approximately the price at which it is being carried on the fund’s books.
Long-Oriented refers to managers that generally take positions in securities or purchase assets with the expectation they will rise in value. Long/Short (or L/S) refers to managers that may take both long positions, expecting an asset to rise in value, and short positions, expecting an asset to decline in value. A short position generally entails borrowing shares of a security while expecting a decline in value, selling the units, and then returning an equivalent number of shares. In MAF, long/short managers represent funds or accounts in which shorting is expected to be a substantial source of added value.
Nominal Treasury Bonds are conventional bonds issued by the US Treasury that deliver interest payments (yield) with no adjustment of principal for inflation. Treasury Inflation Protected Securities (TIPS) are US Treasury bonds whose principal is adjusted for inflation.
Opportunistic Credit is an asset category that includes structured securitized credit securities and distressed credit securities.
Price-to-Book is a ratio comparing a company’s current share price to the company’s value as presented on its balance sheet. Price/Earnings Ratio (P/E) is the current price of a share of stock divided by the trailing 12-month earnings per share. Cyclically Adjusted Price-Earnings Ratio (CAPE) is based on average inflation-adjusted earnings from the prior 10 years.
Real Yield is the yield on a security in excess of inflation. In this report, it refers to the stated yield on an inflation-linked bond.
Repurchase Agreements are sales of securities together with an agreement by the seller to buy them back at a later date at a specified price.
Sharpe Ratio is a measurement of risk-adjusted performance. It is calculated by subtracting a “risk-free” rate – in this report a 0- to 3-month Treasury bill index – from the portfolio return and dividing the result by the portfolio’s standard deviation.
Sortino Ratio is a measurement of risk-adjusted performance that focuses on downward price volatility. It is calculated like the Sharpe Ratio but takes only downside deviation into account.
Standard Deviation in investing is a measure of a portfolio’s volatility. It reveals the dispersion of all return data from the mean, or average. The Evolving Mean is the average of all data points.
December 31, 2015 • TIFF Multi-Asset Fund • Copyright © 2016 • All rights reserved • This report may not be reproduced or distributed without written permission from its publisher.
14
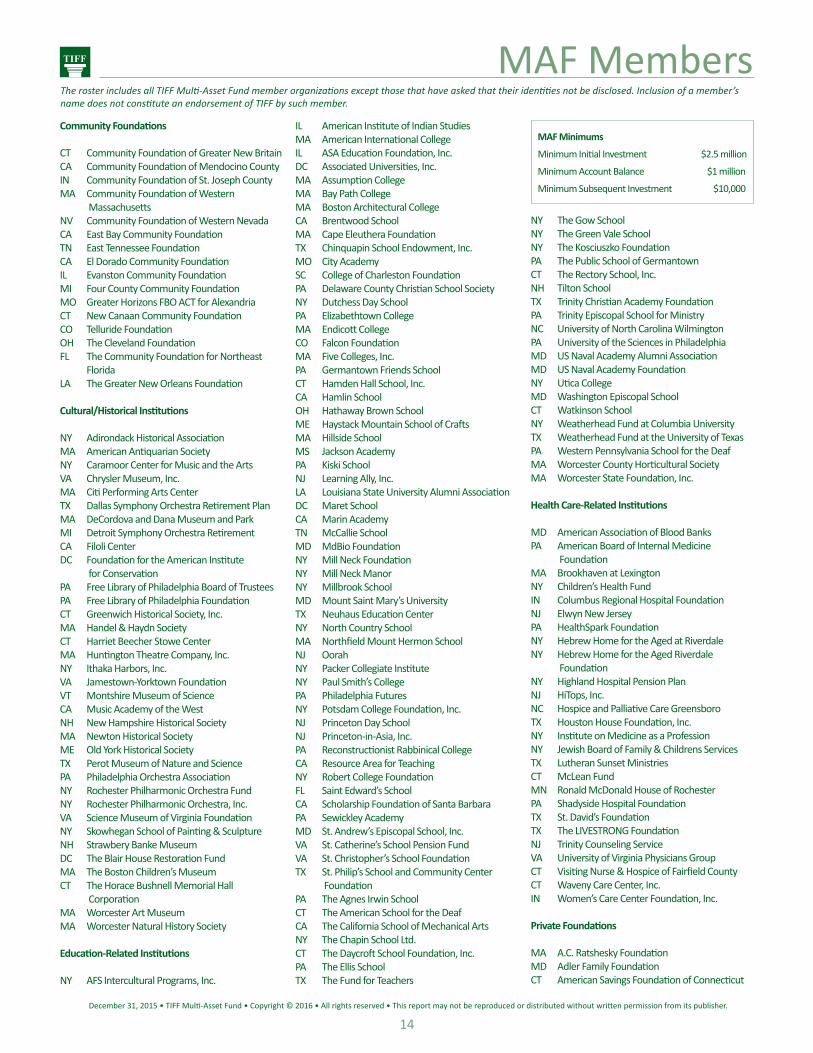
MAF MembersThe roster includes all TIFF Multi-Asset Fund member organizations except those that have asked that their identities not be disclosed. Inclusion of a member’s name does not constitute an endorsement of TIFF by such member.
Community Foundations CT Community Foundation of Greater New BritainCA Community Foundation of Mendocino CountyIN Community Foundation of St. Joseph CountyMA Community Foundation of Western MassachusettsNV Community Foundation of Western NevadaCA East Bay Community FoundationTN East Tennessee FoundationCA El Dorado Community FoundationIL Evanston Community FoundationMI Four County Community FoundationMO Greater Horizons FBO ACT for AlexandriaCT New Canaan Community FoundationCO Telluride FoundationOH The Cleveland FoundationFL The Community Foundation for Northeast FloridaLA The Greater New Orleans Foundation Cultural/Historical Institutions
NY Adirondack Historical AssociationMA American Antiquarian SocietyNY Caramoor Center for Music and the ArtsVA Chrysler Museum, Inc.MA Citi Performing Arts CenterTX Dallas Symphony Orchestra Retirement PlanMA DeCordova and Dana Museum and ParkMI Detroit Symphony Orchestra RetirementCA Filoli CenterDC Foundation for the American Institute for ConservationPA Free Library of Philadelphia Board of TrusteesPA Free Library of Philadelphia FoundationCT Greenwich Historical Society, Inc.MA Handel & Haydn SocietyCT Harriet Beecher Stowe CenterMA Huntington Theatre Company, Inc.NY Ithaka Harbors, Inc.VA Jamestown-Yorktown FoundationVT Montshire Museum of ScienceCA Music Academy of the WestNH New Hampshire Historical SocietyMA Newton Historical SocietyME Old York Historical SocietyTX Perot Museum of Nature and SciencePA Philadelphia Orchestra AssociationNY Rochester Philharmonic Orchestra FundNY Rochester Philharmonic Orchestra, Inc.VA Science Museum of Virginia FoundationNY Skowhegan School of Painting & SculptureNH Strawbery Banke MuseumDC The Blair House Restoration FundMA The Boston Children’s MuseumCT The Horace Bushnell Memorial Hall CorporationMA Worcester Art MuseumMA Worcester Natural History Society Education-Related Institutions NY AFS Intercultural Programs, Inc.
IL American Institute of Indian StudiesMA American International CollegeIL ASA Education Foundation, Inc.DC Associated Universities, Inc.MA Assumption CollegeMA Bay Path CollegeMA Boston Architectural CollegeCA Brentwood SchoolMA Cape Eleuthera FoundationTX Chinquapin School Endowment, Inc.MO City AcademySC College of Charleston FoundationPA Delaware County Christian School SocietyNY Dutchess Day SchoolPA Elizabethtown CollegeMA Endicott CollegeCO Falcon FoundationMA Five Colleges, Inc.PA Germantown Friends SchoolCT Hamden Hall School, Inc.CA Hamlin SchoolOH Hathaway Brown SchoolME Haystack Mountain School of CraftsMA Hillside SchoolMS Jackson AcademyPA Kiski SchoolNJ Learning Ally, Inc.LA Louisiana State University Alumni AssociationDC Maret SchoolCA Marin AcademyTN McCallie SchoolMD MdBio FoundationNY Mill Neck FoundationNY Mill Neck ManorNY Millbrook SchoolMD Mount Saint Mary’s UniversityTX Neuhaus Education CenterNY North Country SchoolMA Northfield Mount Hermon SchoolNJ OorahNY Packer Collegiate InstituteNY Paul Smith’s CollegePA Philadelphia FuturesNY Potsdam College Foundation, Inc.NJ Princeton Day SchoolNJ Princeton-in-Asia, Inc.PA Reconstructionist Rabbinical CollegeCA Resource Area for TeachingNY Robert College FoundationFL Saint Edward’s SchoolCA Scholarship Foundation of Santa BarbaraPA Sewickley AcademyMD St. Andrew’s Episcopal School, Inc.VA St. Catherine’s School Pension FundVA St. Christopher’s School FoundationTX St. Philip’s School and Community Center FoundationPA The Agnes Irwin SchoolCT The American School for the DeafCA The California School of Mechanical ArtsNY The Chapin School Ltd.CT The Daycroft School Foundation, Inc.PA The Ellis SchoolTX The Fund for Teachers
NY The Gow SchoolNY The Green Vale SchoolNY The Kosciuszko FoundationPA The Public School of GermantownCT The Rectory School, Inc.NH Tilton SchoolTX Trinity Christian Academy FoundationPA Trinity Episcopal School for MinistryNC University of North Carolina WilmingtonPA University of the Sciences in PhiladelphiaMD US Naval Academy Alumni AssociationMD US Naval Academy FoundationNY Utica CollegeMD Washington Episcopal SchoolCT Watkinson SchoolNY Weatherhead Fund at Columbia UniversityTX Weatherhead Fund at the University of TexasPA Western Pennsylvania School for the DeafMA Worcester County Horticultural SocietyMA Worcester State Foundation, Inc. Health Care-Related Institutions MD American Association of Blood Banks PA American Board of Internal Medicine FoundationMA Brookhaven at LexingtonNY Children’s Health FundIN Columbus Regional Hospital FoundationNJ Elwyn New JerseyPA HealthSpark FoundationNY Hebrew Home for the Aged at RiverdaleNY Hebrew Home for the Aged Riverdale FoundationNY Highland Hospital Pension PlanNJ HiTops, Inc.NC Hospice and Palliative Care GreensboroTX Houston House Foundation, Inc.NY Institute on Medicine as a ProfessionNY Jewish Board of Family & Childrens ServicesTX Lutheran Sunset MinistriesCT McLean FundMN Ronald McDonald House of RochesterPA Shadyside Hospital FoundationTX St. David’s FoundationTX The LIVESTRONG FoundationNJ Trinity Counseling ServiceVA University of Virginia Physicians GroupCT Visiting Nurse & Hospice of Fairfield CountyCT Waveny Care Center, Inc.IN Women’s Care Center Foundation, Inc. Private Foundations
MA A.C. Ratshesky FoundationMD Adler Family FoundationCT American Savings Foundation of Connecticut
MAF Minimums
Minimum Initial Investment $2.5 million
Minimum Account Balance $1 million
Minimum Subsequent Investment $10,000
December 31, 2015 • TIFF Multi-Asset Fund • Copyright © 2016 • All rights reserved • This report may not be reproduced or distributed without written permission from its publisher.
15
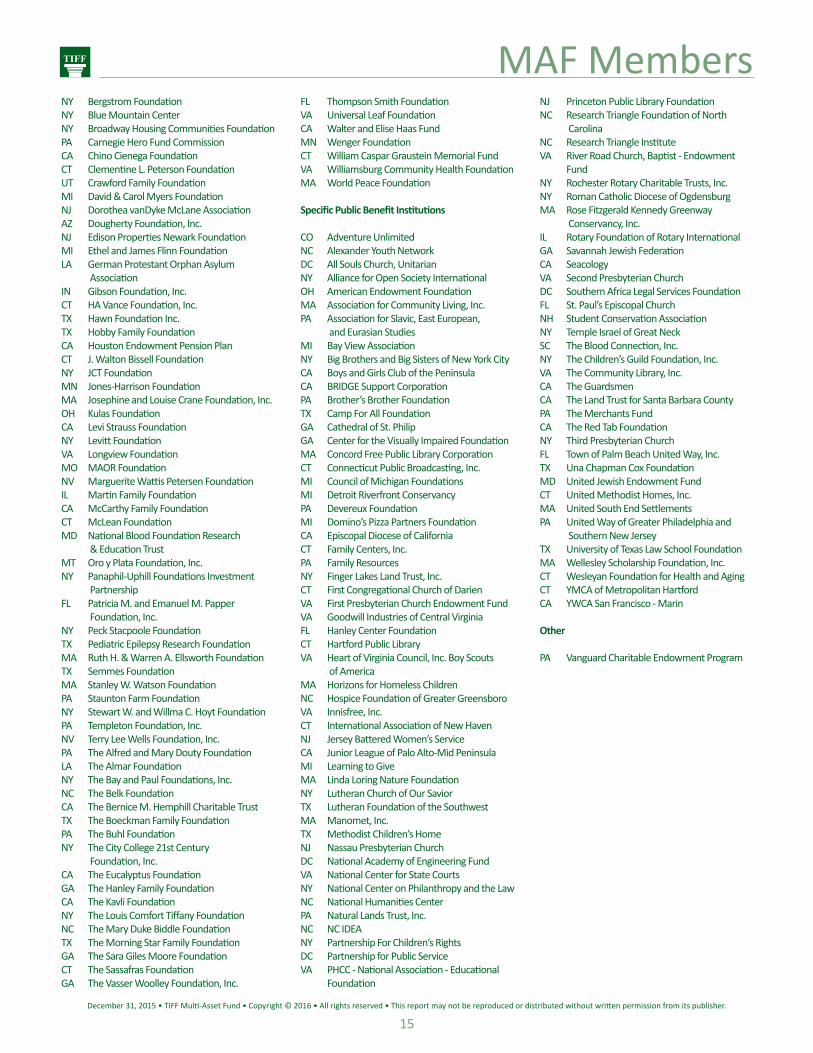
MAF MembersNY Bergstrom FoundationNY Blue Mountain CenterNY Broadway Housing Communities FoundationPA Carnegie Hero Fund CommissionCA Chino Cienega FoundationCT Clementine L. Peterson FoundationUT Crawford Family FoundationMI David & Carol Myers FoundationNJ Dorothea vanDyke McLane AssociationAZ Dougherty Foundation, Inc.NJ Edison Properties Newark FoundationMI Ethel and James Flinn FoundationLA German Protestant Orphan Asylum AssociationIN Gibson Foundation, Inc.CT HA Vance Foundation, Inc.TX Hawn Foundation Inc.TX Hobby Family FoundationCA Houston Endowment Pension PlanCT J. Walton Bissell FoundationNY JCT FoundationMN Jones-Harrison FoundationMA Josephine and Louise Crane Foundation, Inc.OH Kulas FoundationCA Levi Strauss FoundationNY Levitt FoundationVA Longview FoundationMO MAOR FoundationNV Marguerite Wattis Petersen FoundationIL Martin Family FoundationCA McCarthy Family FoundationCT McLean FoundationMD National Blood Foundation Research & Education TrustMT Oro y Plata Foundation, Inc.NY Panaphil-Uphill Foundations Investment PartnershipFL Patricia M. and Emanuel M. Papper Foundation, Inc.NY Peck Stacpoole FoundationTX Pediatric Epilepsy Research FoundationMA Ruth H. & Warren A. Ellsworth FoundationTX Semmes FoundationMA Stanley W. Watson FoundationPA Staunton Farm FoundationNY Stewart W. and Willma C. Hoyt FoundationPA Templeton Foundation, Inc.NV Terry Lee Wells Foundation, Inc.PA The Alfred and Mary Douty FoundationLA The Almar FoundationNY The Bay and Paul Foundations, Inc.NC The Belk FoundationCA The Bernice M. Hemphill Charitable TrustTX The Boeckman Family FoundationPA The Buhl FoundationNY The City College 21st Century Foundation, Inc.CA The Eucalyptus FoundationGA The Hanley Family FoundationCA The Kavli FoundationNY The Louis Comfort Tiffany FoundationNC The Mary Duke Biddle FoundationTX The Morning Star Family FoundationGA The Sara Giles Moore FoundationCT The Sassafras FoundationGA The Vasser Woolley Foundation, Inc.
FL Thompson Smith FoundationVA Universal Leaf FoundationCA Walter and Elise Haas FundMN Wenger FoundationCT William Caspar Graustein Memorial FundVA Williamsburg Community Health FoundationMA World Peace Foundation Specific Public Benefit Institutions
CO Adventure UnlimitedNC Alexander Youth NetworkDC All Souls Church, UnitarianNY Alliance for Open Society InternationalOH American Endowment FoundationMA Association for Community Living, Inc.PA Association for Slavic, East European, and Eurasian StudiesMI Bay View AssociationNY Big Brothers and Big Sisters of New York CityCA Boys and Girls Club of the PeninsulaCA BRIDGE Support CorporationPA Brother’s Brother FoundationTX Camp For All FoundationGA Cathedral of St. PhilipGA Center for the Visually Impaired FoundationMA Concord Free Public Library CorporationCT Connecticut Public Broadcasting, Inc.MI Council of Michigan FoundationsMI Detroit Riverfront ConservancyPA Devereux FoundationMI Domino’s Pizza Partners FoundationCA Episcopal Diocese of CaliforniaCT Family Centers, Inc.PA Family ResourcesNY Finger Lakes Land Trust, Inc.CT First Congregational Church of DarienVA First Presbyterian Church Endowment FundVA Goodwill Industries of Central VirginiaFL Hanley Center FoundationCT Hartford Public LibraryVA Heart of Virginia Council, Inc. Boy Scouts of AmericaMA Horizons for Homeless ChildrenNC Hospice Foundation of Greater GreensboroVA Innisfree, Inc.CT International Association of New HavenNJ Jersey Battered Women’s ServiceCA Junior League of Palo Alto-Mid PeninsulaMI Learning to GiveMA Linda Loring Nature FoundationNY Lutheran Church of Our SaviorTX Lutheran Foundation of the SouthwestMA Manomet, Inc.TX Methodist Children’s HomeNJ Nassau Presbyterian ChurchDC National Academy of Engineering FundVA National Center for State CourtsNY National Center on Philanthropy and the LawNC National Humanities CenterPA Natural Lands Trust, Inc.NC NC IDEANY Partnership For Children’s RightsDC Partnership for Public ServiceVA PHCC - National Association - Educational Foundation
NJ Princeton Public Library FoundationNC Research Triangle Foundation of North CarolinaNC Research Triangle InstituteVA River Road Church, Baptist - Endowment FundNY Rochester Rotary Charitable Trusts, Inc.NY Roman Catholic Diocese of OgdensburgMA Rose Fitzgerald Kennedy Greenway Conservancy, Inc.IL Rotary Foundation of Rotary InternationalGA Savannah Jewish FederationCA SeacologyVA Second Presbyterian ChurchDC Southern Africa Legal Services FoundationFL St. Paul’s Episcopal ChurchNH Student Conservation AssociationNY Temple Israel of Great NeckSC The Blood Connection, Inc.NY The Children’s Guild Foundation, Inc.VA The Community Library, Inc.CA The GuardsmenCA The Land Trust for Santa Barbara CountyPA The Merchants FundCA The Red Tab FoundationNY Third Presbyterian ChurchFL Town of Palm Beach United Way, Inc.TX Una Chapman Cox FoundationMD United Jewish Endowment FundCT United Methodist Homes, Inc.MA United South End SettlementsPA United Way of Greater Philadelphia and Southern New JerseyTX University of Texas Law School FoundationMA Wellesley Scholarship Foundation, Inc.CT Wesleyan Foundation for Health and AgingCT YMCA of Metropolitan HartfordCA YWCA San Francisco - Marin Other
PA Vanguard Charitable Endowment Program
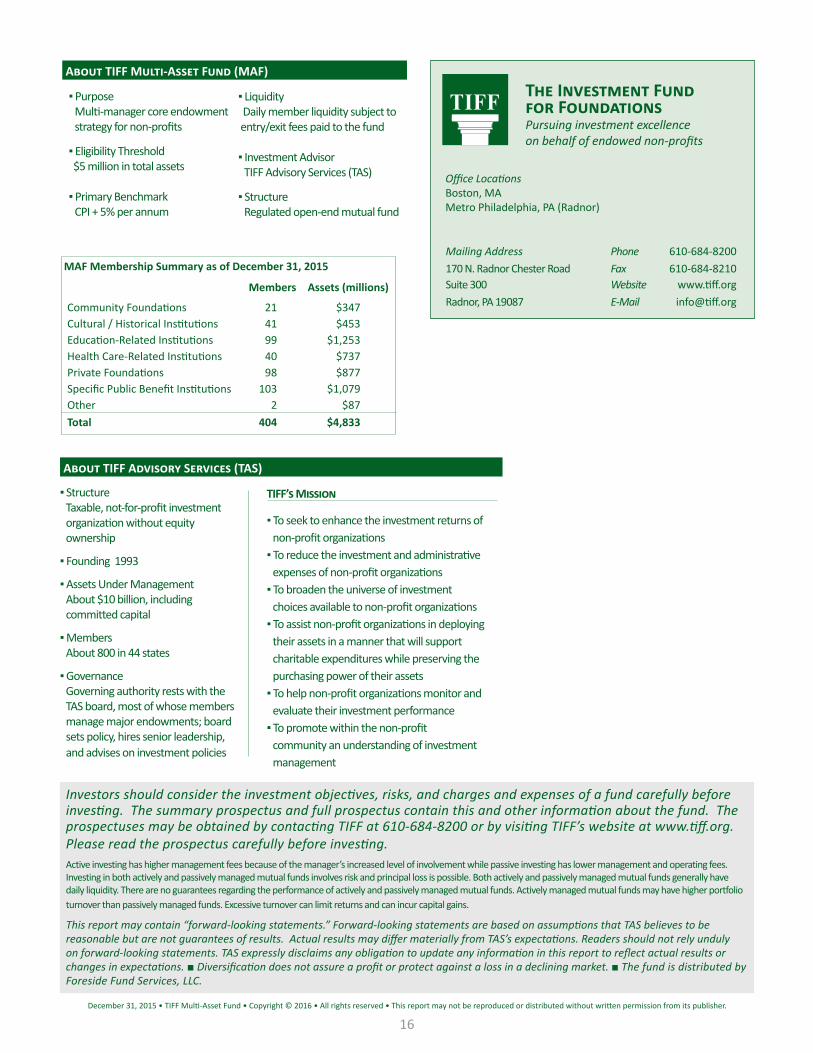
MAF Membership Summary as of December 31, 2015
Members Assets (millions)
Community Foundations 21 $347Cultural / Historical Institutions 41 $453Education-Related Institutions 99 $1,253Health Care-Related Institutions 40 $737Private Foundations 98 $877Specific Public Benefit Institutions 103 $1,079Other 2 $87Total 404 $4,833
December 31, 2015 • TIFF Multi-Asset Fund • Copyright © 2016 • All rights reserved • This report may not be reproduced or distributed without written permission from its publisher.
16
Office LocationsBoston, MAMetro Philadelphia, PA (Radnor)
The Investment Fund for FoundationsPursuing investment excellenceon behalf of endowed non-profits
Investors should consider the investment objectives, risks, and charges and expenses of a fund carefully before investing. The summary prospectus and full prospectus contain this and other information about the fund. The prospectuses may be obtained by contacting TIFF at 610-684-8200 or by visiting TIFF’s website at www.tiff.org. Please read the prospectus carefully before investing. Active investing has higher management fees because of the manager’s increased level of involvement while passive investing has lower management and operating fees. Investing in both actively and passively managed mutual funds involves risk and principal loss is possible. Both actively and passively managed mutual funds generally have daily liquidity. There are no guarantees regarding the performance of actively and passively managed mutual funds. Actively managed mutual funds may have higher portfolio turnover than passively managed funds. Excessive turnover can limit returns and can incur capital gains.
This report may contain “forward-looking statements.” Forward-looking statements are based on assumptions that TAS believes to be reasonable but are not guarantees of results. Actual results may differ materially from TAS’s expectations. Readers should not rely unduly on forward-looking statements. TAS expressly disclaims any obligation to update any information in this report to reflect actual results or changes in expectations. ■ Diversification does not assure a profit or protect against a loss in a declining market. ■ The fund is distributed by Foreside Fund Services, LLC.
Mailing Address Phone 610-684-8200170 N. Radnor Chester Road Fax 610-684-8210Suite 300 Website www.tiff.orgRadnor, PA 19087 E-Mail [email protected]
About TIFF Advisory Services (TAS)
▪ StructureTaxable, not-for-profit investment organization without equity ownership
▪ Founding 1993
▪ Assets Under ManagementAbout $10 billion, including committed capital
▪ Members About 800 in 44 states
▪ GovernanceGoverning authority rests with the TAS board, most of whose members manage major endowments; board sets policy, hires senior leadership, and advises on investment policies
TIFF’s Mission
▪ To seek to enhance the investment returns of non-profit organizations
▪ To reduce the investment and administrative expenses of non-profit organizations
▪ To broaden the universe of investment choices available to non-profit organizations
▪ To assist non-profit organizations in deploying their assets in a manner that will support charitable expenditures while preserving the purchasing power of their assets
▪ To help non-profit organizations monitor and evaluate their investment performance
▪ To promote within the non-profit community an understanding of investment management
▪ Purpose Multi-manager core endowment strategy for non-profits
▪ Eligibility Threshold $5 million in total assets
▪ Primary BenchmarkCPI + 5% per annum
About TIFF Multi-Asset Fund (MAF)
▪ Liquidity Daily member liquidity subject to entry/exit fees paid to the fund
▪ Investment Advisor TIFF Advisory Services (TAS)
▪ Structure Regulated open-end mutual fund