Embed Size (px)
Citation preview

The Whole Teacher: Growing Educator Resilience and Well-Being
CitationHester, Weston Tyler. 2020. The Whole Teacher: Growing Educator Resilience and Well-Being. Doctoral dissertation, Harvard Graduate School of Education.
Permanent linkhttps://nrs.harvard.edu/URN-3:HUL.INSTREPOS:37364846
Terms of UseThis article was downloaded from Harvard University’s DASH repository, and is made available under the terms and conditions applicable to Other Posted Material, as set forth at http://nrs.harvard.edu/urn-3:HUL.InstRepos:dash.current.terms-of-use#LAA
Share Your StoryThe Harvard community has made this article openly available.Please share how this access benefits you. Submit a story .
Accessibility

The Whole Teacher: Growing Educator Resilience and Well-being
Doctor of Education Leadership (Ed.L.D.)
Capstone
Submitted by
Weston Tyler Hester
To the Harvard Graduate School of Education
in partial fulfillment of the requirements for the degree of
Doctor of Education Leadership.
May 2020

1
© 2020
Weston Tyler Hester
All Rights Reserved

2
Dedicated to Mom
Thank you. I love you.

3
Acknowledgments
God
First and foremost, I thank God. Thank You for Your amazing grace. Thank You for this
opportunity to seek to be an instrument of Your peace.
Ed.L.D.
Marty West and Deb Helsing, thank you for your outstanding support and mentorship. An
Ed.L.D.er couldn’t ask for a more thoughtful or supportive committee.
Lisa Lahey, the first day you walked into PLIO, I felt like I was in the presence of a rockstar. I was.
And that feeling never went away. Thank you for doing what you do.
Irvin Scott, thank you for sparking this whole thing in Sector Change. Thank you for modeling for
me what it looks like to lead as a person of faith.
Andrés Alonso, thank you for your mentorship. And thanks for the heads up that a new
superintendent was taking over in Stockton.
C8, thank you for the way you love one another and for your inspiring commitment to the work.
So grateful to be in this work alongside you.
To all those who have made the Ed.L.D. program possible, from Liz City to Matt Rose to the
HGSE development team to those who clean Gutman Library, thank you for this remarkable
opportunity to learn and grow.
Stockton
John Deasy, thank you for your belief in me. Thank you for your determined, persistent
leadership. Thank you for your mentorship. And thank you for your example. You model the
urgency and groundedness that should characterize our efforts.
Nik Howard, thank you for dreaming with me about what could be possible here in Stockton.
And then helping to bring that vision to life. Thank you for applying your sharp mind to the
challenges facing the children and adults of this community. Thank you for your perseverance.
Lange Luntao, thank you for your encouragement, friendship, and leadership. Thank you for
making me feel at home here in Stockton.
Erich Myers and La Nita Dominique-Tate, thank you for seeing the potential in Educators
Thriving and going above and beyond to help the program come to life.

4
Chief, Christina Alejo, Josh Pollack, Lisa Grant-Dawson, Mary Jo Cowan, Shelley Spessard, and
Sonjhia Lowery, thank you for welcoming me onto your team. Thank you for your inspiring,
gritty commitment to ensuring SUSD becomes all that it has the potential to be. That you for
showing me what it looks like to pursue this serious work with joy.
Claudia Moreno, Detwarn Buntun, Diana Tavares, Joe Fiori, and Tina Franco, thank you for
welcoming me onto your team. Thank you for all you do to strengthen the heart of SUSD.
Diane Carnahan, Sylvia Turner, and Michele Badovinac, thank you for your willingness to think
big and for your outstanding partnership.
Mary Aguilar, we couldn’t have pulled this off without you. Thank you!
John Ericson, Juancho Forlanda, Tuan Ha, Samson Chua, and Robert Torres, thank you for your
invaluable support helping to assess the impact of Educators Thriving.
Last but not least, to the educators I had the privilege of working alongside, thank you for your
commitment to your students, your vulnerability with me and one another, and your
determination to thrive while doing the most important work there is.

5
Table of Contents
Abstract ............................................................................................................................................ 6
Introduction ..................................................................................................................................... 7
Review of Knowledge for Action .................................................................................................... 11
Theory of Action............................................................................................................................. 27
Strategic Project Description ......................................................................................................... 29
Strategic Project Evidence and Analysis ........................................................................................ 45
Implications for Self ....................................................................................................................... 72
Implications for Site ....................................................................................................................... 75
Implications for Sector ................................................................................................................... 79
Conclusion ...................................................................................................................................... 81
Bibliography ................................................................................................................................... 84
Appendices ..................................................................................................................................... 90
6
Abstract
Being a teacher is hard. Teachers must learn how to prepare engaging lessons, captivate
student attention, analyze data, manage behavior, work well with parents and colleagues, and
navigate school bureaucracy, among other responsibilities. The difficulty and attendant stress of
a teacher’s job are compounded by a wide variety of systemic challenges teachers face: low pay
relative to other workers with similar levels of education, low levels of autonomy, anemic
support, and harsh scrutiny from the public. These professional challenges can give rise to
personal stress, which contributes to an alarming percentage of early-career teachers leaving
the profession.
This capstone examines my work to design and launch a program within Stockton
Unified School District to provide educators with support that enables them to achieve a greater
degree of well-being, resist burnout, and stay in the profession longer than they might have
otherwise. The program consisted of twelve sessions that enabled teachers to learn about and
practice strategies empirically proven to increase well-being.
Throughout this capstone, I describe the design and execution of the program. I also
analyze its impact, examining changes in well-being for participating teachers and a comparison
group of educators using validated assessments of burnout, resilience, subjective well-being, job
satisfaction, and others. Feedback from participants suggests that educators who took part
derived significant benefits from their participation. I explore the implications of these results as
they apply to me as a leader, to Stockton Unified School District, and to the public education
sector more broadly.

7
Introduction
Context
Being a teacher is hard. Teachers must learn how to prepare engaging lessons, captivate
student attention, analyze data, manage behavior, work successfully with parents and
colleagues, and navigate school bureaucracy, among other responsibilities. On a daily basis,
teachers are called to perform tasks that might more typically be performed by a counselor, a
social worker, or a nurse. The role of a teacher comes with the deep fulfillment of connecting
with and guiding young people along their journey, and it’s also challenging—especially for
those in their first years in the profession.
The difficulty and attendant stress of a teacher’s job are compounded by a wide variety
of systemic challenges teachers face: low pay relative to other workers with similar levels of
education, low levels of autonomy, anemic support, and harsh scrutiny from the public
(Allegretto & Mishel, 2016; Goldstein, 2014). As a result of these challenges, rates of teacher
attrition are distressingly high (Darling-Hammond et al., 2018). Many school districts across the
country find themselves scrambling to address the attendant teacher shortages (García & Weiss,
2019).
Yet, in the face of these challenges, many districts fail to seek out or implement
innovative strategies that might address the problems of teacher burnout and attrition. The
solutions districts do attempt often look like more of the same: incremental improvements to
mentoring and professional development programs, marginal pay increases, or pay bonuses for
teaching in the hardest-to-staff schools. Too often, districts fail to consider new approaches that
might meaningfully ameliorate the personal challenges teachers face and, as a result, increase
their likelihood of persisting in the profession.

8
The work of my residency has been to support Stockton Unified School District (SUSD) to
confront these all too common challenges.
Residency site
Stockton is a city of more than 300,000 people situated in the Central Valley of
California. The city boasts a wide variety of strengths: deep waterways, rich agricultural assets,
and a diverse and resilient citizenry. However, Stockton has faced serious adversity over the
years. For instance, the city was at the epicenter of the foreclosure crisis in the United States
following the 2008 recession. In 2012, due in large part to financial mismanagement, the city
filed for bankruptcy (Christie, 2012). In 2009, Stockton was named the fifth most violent city in
the country (O’Malley Greenburg, 2009). The city continues to struggle with significant
challenges related to poverty, crime, and homelessness.
Despite these challenges, many across the country have begun to view Stockton as a
community at the vanguard of civic change. The election of Mayor Michael Tubbs in 2016
energized many and served to draw increased positive attention to the city. Mayor Tubbs’
innovative policy ideas and bold aspirations for change have attracted significant interest and
financial commitments from philanthropists and political leaders inside and outside of Stockton
(Garofoli, 2019). For instance, a universal basic income pilot program championed by the mayor
was widely touted as a promising innovation by then-Democratic presidential candidate Andrew
Yang and others (Ross, 2018).
In this context, Stockton Unified School District (SUSD) serves approximately 40,000
young people in 55 schools. In terms of its teacher force, SUSD has approximately 1,900
teachers. Data from the 2017–18 school year suggest that the district has a substantially higher
percentage of newly hired teachers with “substandard credentials” as compared to the State of
California: 53 percent in SUSD as compared to 34 percent statewide (Learning Policy Institute,

9
2019). During the 2017–18 school year, 12 percent of Stockton teachers either left the teaching
profession altogether or left to teach in another district (Learning Policy Institute, 2019).
SUSD’s student achievement results lag substantially behind those of California as a
whole: At the conclusion of the 2018–19 school year, just 30% of students in Stockton met or
exceeded proficiency in English Language Arts as compared to 51% of students throughout
California. Only 21% met or exceeded proficiency in math compared to 40% statewide
(California Department of Education, 2019). These outcomes are attributable in part to high
levels of turnover in district leadership. Between 2005 and 2018, the superintendency of SUSD
changed hands 10 times. In the spring of 2018, the district’s board of trustees appointed Dr.
John Deasy superintendent of the district. Dr. Deasy arrived in Stockton with a track record of
championing bold changes to districts he had led in the past, including Los Angeles Unified
School District.
Superintendent Deasy hit the ground running and has led the district to undertake a
significant set of change initiatives. The changes include the adoption of new curricula for both
English language arts and math, new and more rigorous graduation requirements that are
among the most demanding in California, 24/7 access to free public busing for all secondary
students, and free internet and computer access for thousands of students in an effort to close
the digital divide.
Among the changes Superintendent Deasy championed was a new mission for SUSD,
supported by a “Theory of Change” for the district as a whole. The first pillar of the district’s
Theory of Change is the following: “Choose the best and most talented individuals to work and
remain working in Stockton” (Deasy, 2019, p. 4). As the superintendent articulates in his plan for
the district, SUSD must “invest deeply in the support and conditions for our employees” (Deasy,

10
2019, p. 4). Superintendent Deasy grasps the importance of a healthy and engaged workforce in
changing the lives of students throughout SUSD.
Strategic project
It was in this context that the idea for my strategic project took root. In June of 2018, I
approached Superintendent Deasy with an idea to partner on a system-wide program to
improve educator well-being and to combat burnout and attrition. Recognizing the importance
of human capital to the achievement of the district’s mission, Dr. Deasy immediately expressed
interest. Shortly thereafter, I was approved as an Ed.L.D. resident for the 2019–20 school year.
Over the following months, I met with key district staff members at various school sites,
in the Human Resources (HR) and Educational Services departments, and in the teacher
induction program. Drawing on what I learned during those conversations, I crafted a vision for
a program that would enable teachers to overcome the pitfalls associated with burnout and
attrition: a sense of feeling overwhelmed, personal neglect, self-doubt about one’s teaching
abilities, isolation, etc. The program would build on a pilot effort I was executing in partnership
with Boston Public Schools during the 2018–19 school year.
This capstone examines my work designing and launching a district-wide effort to
provide educators with the support they need to achieve a greater degree of well-being, resist
burnout, and reach their potential as educators and as people.

11
Review of Knowledge for Action
The challenge facing me as I embarked on my strategic project was to create a program
that leveraged what we know about enabling adults to achieve well-being in such a way as to
ameliorate teacher stress and burnout and increase retention. Three lines of questioning were
particularly germane to my endeavor; this Review of Knowledge for Action (RKA) considers the
literature relevant to each of those essential questions.
First: What do we know about the state of the teaching profession when it comes to
stress, burnout, and retention? As I sought to improve teacher well-being, I needed to
understand the state of the teaching profession broadly as well as the forces affecting teachers
in California.
Second, it was important to understand what research and practice suggest about how
to ameliorate the challenges educators might be facing. As such, the second question I consider
in this RKA is the following: What do we know about the drivers of personal well-being and
retention for teachers?
Finally, it was important that the program I developed be informed by what we know
about the most effective means for designing learning environments that allow for the types of
personal reflection, relational support, and skill development that can increase well-being and
diminish burnout and attrition. As such, the third question I address is the following: What do
we know about how the design of a program can best enable people to achieve significant
personal growth?
What do we know about the state of the teaching profession when it comes to stress,
burnout, and retention?

12
We’ve known for decades that early-career teachers regularly experience levels of
personal misery so severe that they achieve less with students and, all too often, choose to walk
away from the profession altogether (Schwab et al., 1986). Ellen Moir famously codified the
distinct phases of a first-year teacher’s experience into periods that included “survival” and
“disillusionment” (1990, p. 1). Compared to other professions, teaching is among the most
challenging when it comes to physical health, psychological well-being, and job satisfaction (S.
Johnson et al., 2005). Scholars of burnout, which is defined as a state of “emotional exhaustion,
cynicism, and reduced personal accomplishment,” find a strong association between poor
worker health and high turnover (Linos et al., 2019, p. 3). The stressors associated with teaching
are among the reasons why nearly one in five teachers leaves the profession within five years
(Gray & Taie, 2015). We’ve known this intuitively for centuries: As Shakespeare wrote, “A merry
heart goes all the day, your sad tires in a mile-a” (Shakespeare, 2015, Act IV, sc. 3).
Moreover, the emotional state of teachers has an enormous impact on their efficacy
with students. Teachers experiencing high levels of stress and burnout coupled with low levels
of coping achieve weaker outcomes with their students (Herman et al., 2018). Additionally, a
teacher’s negative emotions may have detrimental long-term effects on students beyond the
student’s academic performance. Hamre and Pianta (2001) find that if a kindergarten teacher
held negative views towards one of his or her students, something that is presumably more
likely for a teacher who is experiencing stress, the presence of that negative view was correlated
with statistically significant decreases in social and emotional development for that student. It’s
easy to imagine that teachers who are stressed might be more easily angered or less likely to
positively affirm their students. Psychological research finds that the reverse may be true as
well: Lyubomirsky and colleagues observe that “positive affect ‒ the hallmark of well-being ‒
may be the cause of…successes” (2005, p. 803, emphasis added). In short, happy teachers are
13
more likely to be effective because they’re happy. Conversely, when a teacher is stressed out,
student learning suffers.
The stress and difficulty of teaching is one of the driving factors behind an alarming
shortage of teachers currently afflicting districts across the United States (e.g. García & Weiss,
2019). Since 2010, enrollment in teacher preparation programs nationally has declined by more
than one-third (Partelow, 2019). The decline in enrollment in California has been substantially
more severe: Enrollment in teacher-preparation programs has declined by over 70% (Darling-
Hammond et al., 2018). Teacher shortages are being experienced with special intensity among
school district leaders in California: Darling-Hammond et al. (2018, p. 1) report that “Fully 80%
of district respondents [in California] reported a shortage of qualified teachers for the 2017–18
school year. Of those districts registering shortages, 90% reported that they were as bad or
worse than in the previous year.”
One factor influencing the demand for teachers is the high rate of attrition. Teachers
cite many reasons for leaving the teaching profession including the pressures of testing and
accountability, lack of administrative support, scant opportunity for advancement and
professional learning, dissatisfaction with working conditions, and financial concerns (Darling-
Hammond et al., 2018). Teachers are paid substantially less than other workers with similar
levels of education and experience—a gap that has grown from 1.8 percent in 1994 to 17
percent in 2015 (Allegretto & Mishel, 2016). As if that list of challenges weren’t enough,
teachers consistently face harsh criticism about their work from social and political circles
(Goldstein, 2014). The consequence is that the increase in teacher attrition doesn’t show any
indication of letting up: Between 1988 and 2008, annual rates of teacher attrition rose by 41%
(Ingersoll & Merrill, 2013). This all adds up to a somewhat grim picture: More teachers are
leaving the profession and fewer are signing up to replace those heading for the exit.

14
Districts are feeling the pinch of these teacher shortages on multiple fronts. First,
teacher turnover negatively impacts students’ academic experiences—particularly for students
in low-income communities (Ronfeldt et al., 2013). Second, human resources departments are
being forced to allocate more of their time and attention to recruiting educators from a
shrinking pool of talent. Districts are feeling the pinch from a budgetary perspective as well:
each teacher who leaves costs their district $21,000 (Learning Policy Institute, 2017). For
example, Boston Public Schools found that the price tag for the turnover of 194 first- through
third-year teachers was $3.3 million (S. M. Johnson, 2019).
In sum, challenges abound: teaching is as hard as ever, prospective teachers are
avoiding the profession, and practicing teachers are leaving in alarming numbers. Many of these
dynamics are at play in SUSD. For instance, as I noted above, the district has resorted to hiring a
substantial number of teachers with substandard credentials merely to fill classrooms, an
indication that fully credentialed teachers are not available in adequate numbers (Learning
Policy Institute, 2019).
What do literature and practice say about the drivers of personal well-being and retention for
teachers?
Making wide-scale progress to decrease teacher stress, burnout, and attrition across the
country will require a diversity of strategies at every level of the educational system. The reason,
of course, is that every level of the educational system has the potential to contribute to both
the amelioration and the exacerbation of the factors that drive teacher stress and attrition.
Everything from policy decisions at the federal level to personal life-choices made by individual
teachers affect the prospect that any individual teacher will feel the effects of stress and make a
choice to leave the profession.

15
At the federal and state level, increased resources could be marshalled to improve
teacher pay across the board. Given that teachers consistently cite financial strain as one of
their reasons for leaving the profession, an infusion of additional dollars at either the federal or
state level could address this challenge (Barnum, 2016). Public support for such a plan is
increasing, and presidential candidates are rolling out initiatives to dramatically increase teacher
pay (Cheng et al., 2018; Harris, 2019). While advocating for increased teacher pay could have
been a way for me to use my time, such a strategy lay outside the scope of my work in SUSD.
On a local level, districts and schools could develop policies and practices that decrease
teacher stress and increase teacher retention. For instance, districts manage the administration
of mentoring programs, hiring practices, and curriculum changes—all factors that impact the
working conditions of teachers and, by extension, their likelihood of staying in the profession. In
her book Where Teachers Thrive, Susan Moore Johnson argues persuasively that, if we care
about teacher well-being, “the school is the place that warrants sustained attention and effort”
(2019, p. 247). Johnson argues that the education reform movement, by focusing on individual
teachers, “failed to address...the outdated, inefficient, compartmentalized school organization
that rarely provides teachers with the resources and support they need” (S. M. Johnson, 2019,
p. 3). Johnson’s research finds that a teacher’s “satisfaction with teaching was determined
almost entirely by what happened at their school” (2019, p. 8). Moreover, researchers studying
burnout in other fields have identified interventions for decreasing burnout by setting up
individuals from throughout an organization to provide support for one another (Linos et al.,
2019).
Unquestionably, the systemic conditions created by federal, state, district, and school-
based decisions have an outsized impact on teacher well-being. However, while systemic forces
play a significant role in shaping the experience of any individual teacher, we shouldn’t ignore

16
the impact an individual can have on shaping her or his own sense of well-being. Research and
my own experience leading teacher-support programs show that a teacher’s well-being can also
be substantially shaped by decisions made at the individual level.
Around the turn of the twenty-first century, Martin Seligman, a professor at the
University of Pennsylvania, coined the term “positive psychology.” For most of the field’s
history, psychology researchers had sought to understand what makes people miserable and
how they might eliminate negative emotions. Reacting against this emphasis on pathology,
Seligman coined the term “positive psychology” to give a name to a new field of psychology that
would focus on understanding and enabling well-being1 (Seligman, 2011). Seligman defined
positive psychology as an umbrella term for “the study of positive emotions, positive character
traits, and enabling institutions” (Seligman et al., 2005, p. 410). Since that time, the field has
exploded in terms of the level of interest among researchers.
Positive psychologists have demonstrated that, to a substantial degree, we possess the
ability to cultivate well-being within our own lives as a result of our choices and behavior. For
instance, Lyubomirsky and colleagues have demonstrated that a person’s happiness level is a
function of “a genetically-determined set point for happiness, happiness-relevant circumstantial
factors, and happiness-relevant activities and practices” (2005, p. 2). They find that the
combination of the genetically-determined set point and life circumstances account for
approximately 60% of the difference in happiness levels from one person to another.
Individuals’ behavior accounts for the remainder. In other words, 40% of the difference between
one person’s level of subjective well-being as compared to another’s “is in our power to change
through how we act and how we think” (Lyubomirsky, 2007, p. 5).
1 Seligman defines well-being as the presence of positive emotion, engagement, relationships, meaning,
and achievement (Seligman, 2011, p. 23).

17
Since the turn of the century, Lyubomirsky, Seligman, and others have identified a
significant number of behaviors and practices that reliably increase a person’s well-being. For
example, Seligman and his colleagues conducted a study that demonstrated statistically
significant gains in a person’s sense of happiness that endured for six months after a person had
identified their strengths and, over a one-week period, used one of those strengths in a new and
different way each day (Seligman et al., 2005). In her book The How of Happiness, Lyubomirsky
(2007) outlines twelve practices proven to increase a person’s sense of happiness including
expressing gratitude, nurturing social relationships, committing to goals, practicing meditation,
and engaging in physical activity. More than ever before, we know what we can do to increase
our sense of well-being.
In some instances, however, it can be difficult for people to incorporate strategies to
achieve well-being into their lives (Kegan, 2009). One study found that, among patients who had
recently suffered a heart attack or stroke, just 4.3% followed their doctor’s orders to stop
smoking, eat healthier, and exercise (Kulash, 2013). Presumably, many of those in the study
possessed an earnest desire to change; however, only a small percentage were able to make the
desired behavioral changes. One explanation for this difficulty relates to what Ronald Heifetz
terms “technical” versus “adaptive” challenges (2002, p. 13). According to Heifetz, technical
challenges are those in which “the necessary know-how and procedures” to solve that problem
are already known (2002, p. 13). Adaptive challenges, on the other hand, are those “that are not
amenable to authoritative expertise or standard operating procedures” (Heifetz, 2002, p. 13).
Adaptive changes, in other words, are those that require people not merely to understand and
act on a piece of information but to change the underlying beliefs, values, or behaviors that
would equip them to make that change (Heifetz, 2002). Among post-heart-attack patients, some
are able to quickly and easily make the required lifestyle changes. For the vast majority,

18
however, a complex “emotional ecology” exists that can make the development of new, healthy
lifestyle choices at once both intellectually desirable but also profoundly threatening because of
competing commitments (Kegan, 2009, p. 31).
The field of developmental psychology gives us a methodology for enabling individuals
to pursue adaptive change in just these types of scenarios: Immunity to Change (Kegan, 2009).
Immunity to Change is a process developed by Robert Kegan and Lisa Lahey that helps people to
achieve their adaptive change goals. Addressing adaptive changes necessitates a process of
personal growth, one that enables people to cultivate “a more sophisticated stage of mental
development” (Kegan, 2009, p. 29). The methodology goes beyond the “New Year’s resolution”
model of change, which merely requires commitment and willpower (Kegan, 2009, p. 39).
Immunity to Change, on the other hand, enables people to identify the worries, fears, and
assumptions that might be undermining their ability to change. In moving through the Immunity
to Change process, participants identify how and why they are “systematically working against
the very goal [they] want to achieve” (Kegan, 2009, p. 47). The methodology supports
participants to identify and, where appropriate, let go of their “hidden commitments” (Kegan,
2009, p. 35). In learning that they may not need to maintain their hidden commitments,
participants are then able to behave as they had hoped.
The combination of findings from the field of positive psychology, in concert with the
Immunity to Change methodology, represents a potent solution. Positive psychology offers us
important insights into what behaviors we would be well-served to adopt; the Immunity to
Change process grants us invaluable insight into how we might successfully incorporate changes
into our lives when change is hard. The combination of these two domains represents a
powerful means by which we might enable teachers to achieve a greater degree of well-being.

19
Applying our new knowledge with educators
Despite the explosion of research about how to cultivate human flourishing over the
past decades, there have been relatively few efforts to systematically incorporate these
research findings into the day-to-day practices of schools and school districts to combat the
prevalence of teacher stress and burnout. The most prominent examples of such efforts are
programs that teach mindfulness to educators. One of the most widely known and well studied
is the Cultivating Awareness and Resilience in Education (CARE) program for teachers, facilitated
by The Garrison Institute (CARE for Teachers, 2019). Another example is The Teaching Well, a
program founded specifically to “shift educators from burnout to sustainability” through
trainings that equip teachers to engage in conflict resolution, improve their emotional
regulation, and strengthen tools to increase their resilience to stress (The Teaching Well, 2019).
Such programs show promise, but their reach is limited. Moreover, many of the programs have
failed to incorporate the breadth of findings that positive psychology has demonstrated could
lead to improvements in well-being.
With all of this in mind, in the spring of 2018, I began developing an idea for a program
that would incorporate research findings from positive psychology to equip early-career
teachers with the knowledge, skills, and mindsets that could enable them to resist the ravages
of burnout and achieve a greater degree of well-being. That summer, I proposed the idea to the
Boston Teachers Union (BTU). Recognizing the challenges they were facing with teacher stress
and attrition, BTU staff were excited about the idea of piloting such a program. Shortly after our
initial meeting, they introduced me to central office administrators at Boston Public Schools
(BPS) to discuss the potential for a pilot program. BPS staff were enthusiastic about the idea.
Alongside staff members from BTU and BPS, I built out a plan for a program that we
called “New Teachers Thriving.” During the first months of the 2018–19 school year, we came up

20
with a high-level design for a pilot program that would include six two-hour sessions over the
course of the year. Shortly thereafter, I created a flyer for the program and emailed it to early-
career teachers throughout BPS. While the union anticipated only ten to fifteen participants, the
program attracted more than 75 applications. In monthly sessions from November through
April, I taught teachers techniques known to improve well-being, such as identifying and
reflecting on core values, cultivating a growth mindset, and developing nurturing relationships.
As part of the program design, I made sure that teachers worked with a consistent group of
fellow educators at each of the sessions, enabling them to build supportive relationships with
one another.
By the end of the year, teachers in the program expressed positive feedback about the
program. Fifty-seven percent of teachers agreed that “Having this course made me more likely
to stay in the teaching profession.” Seventy-five percent of teachers expressed agreement with
the statement, “Having a course like this has made teaching feel more sustainable.” As the pilot
program came to a close, it was clear we were onto something: We had successfully piloted a
district-wide effort to provide teachers with professional development grounded in rigorous
psychological research about how to equip individuals to achieve well-being. And it had made a
positive difference in the lives of the teachers who took part.
In closing, both literature and practice tell us that it’s possible to implement solutions
that result in meaningful improvements in the lives of teachers. The next question, then, is how
to design a program so that participants reap the most significant benefits possible.
What do we know about how the design of a program can best enable people to achieve
significant personal growth?
Armed with positive results from the pilot version of the program in BPS, I considered
how I could design the program to have an even greater impact in SUSD. At the outset,

21
however, I needed to confront a harsh reality, albeit one that many in the field of education
know to be true: A great deal of the professional development delivered to teachers doesn’t
stick. It is a bitter irony that what educators try teaching to other educators very rarely results in
enduring change. This challenge is described in stark and sobering detail in a comprehensive
2015 report produced by The New Teacher Project (TNTP) entitled The Mirage:
Districts are making a massive investment in teacher improvement—far larger
than most people realize. We estimate that the districts we studied spend an
average of nearly $18,000 per teacher, per year on development efforts…Despite
these efforts, most teachers do not appear to improve substantially from year to
year—even though many have not yet mastered critical skills…Even when
teachers do improve, we were unable to link their growth to any particular
development strategy. (TNTP, 2015, p. 2)
Based on TNTP’s findings, the authors make the following suggestion to districts:
While we found no set of specific development strategies that would result in
widespread teacher improvement on its own, there are still clear next steps
school systems can take to more effectively help their teachers. Much of this work
involves creating the conditions that foster growth, not finding quick-fix
professional development solutions. (2015, p. 3, emphasis added)
Those of us hoping to bring about significant change in the practice of educators
are then left to ponder that central question: What, in fact, are the conditions that foster
growth?

22
Robert Kegan and Lisa Lahey, the same scholars who pioneered the Immunity to
Change methodology outlined above, thought beyond an individual solution to change.
They extended their initial research and worked to understand the organizational
conditions that enable people to achieve significant personal growth, including both the
technical and adaptive learning that is necessary for success in making desired changes.
While their findings pertain to the structure and functioning of entire organizations, the
conclusions they’ve drawn are nonetheless helpful in explaining what must be true for
participants in a program to achieve personal breakthroughs.
Kegan and Lahey coined the term Deliberately Developmental Organizations
(DDOs) to describe the types of organizations that systematically foster dramatic personal
growth and development for those working within them (Kegan & Lahey, 2016). DDOs are
organizations that “share a common fundamental belief in the power of individual growth
for members of the organization” (Kegan et al., 2014, p. 3). They create “a pervasive
ecology—structures, practices, tools, and shared language” that enables the organization
to live out the belief that all people are capable of significant growth and development
(Kegan et al., 2014, p. 3; emphasis in original). According to the authors, DDOs are set
apart by three characteristics:
1. Edge: DDOs operate from the recognition that adults “can and need to keep
growing” (Kegan & Lahey, 2016, p. 87). As a result, DDOs systematically enable
people to discover the opportunities inherent in a clear-eyed recognition of and
grappling with their limitations and weaknesses. Rather than allowing a person’s
developmental edge to serve as a source of shame, these organizations celebrate
the identification of a person’s potential for development as an essential step in
the process of growth.

23
2. Groove: DDOs adopt a set of practices, from the ways meetings are run to the way
performance is evaluated, that enable people to continually engage their growth
edge. Unlike a typical organization, DDOs explicitly challenge the notion that “the
personal should never be a part of work” and instead view an employee’s
particular patterns of thinking and psychological states as “in-bounds” and
important fodder for examination and change (Kegan & Lahey, 2016, p. 106).
3. Home: Finally, DDOs create trusting, developmental communities that facilitate
employees being willing to share vulnerably with one another. Moreover,
everyone is involved. No one is exempt from the obligation to engage: “higher
rank gives you no free pass…or immunity from the requirement to keep growing”
(Kegan & Lahey, 2016, p. 110). Rather than an employee’s direct supervisor
bearing almost sole responsibility for an employee’s development, a range of
people throughout the organization end up contributing to any one employee’s
growth. In some sense, “everyone is HR” (Kegan et al., 2014, p. 11).
These three distinct qualities of a DDO are described in Figure 1 below.

24
Figure 1
The Three Dimensions of a DDO
Reproduced from Kegan, 2016, p. 86
Kegan and Lahey (2016) find that the constellation of conditions outlined above
consistently leads for-profit firms to achieve financial results that far exceed what is typical.
Pivot Learning, an educational non-profit, recently conducted the first ever systematic
assessment of the incorporation of DDO-like principles into a school district. The assessment
found that those schools that function most like DDOs saw the most significant growth in
academic achievement (Pivot Learning, 2019).
While this research describes the functioning of entire organizations, the lessons are
relevant to a program such as the one I was piloting in SUSD. To facilitate personal growth
among participants, the program would need to support people to take an unflinching look at
their edge, pushing them to honestly confront those limitations and weaknesses, however

25
personal, that might be holding them back. Moreover, the program would need to establish a
consistent groove, one in which participants consistently come together to confront their
opportunities for growth. Finally, the program would need to cultivate a sense of home, an
environment in which participants feel safe to share vulnerably with those who are in the
program alongside them.
DDOs that do this work effectively establish groups of people who get to know one
another intimately over time. As Kegan and colleagues put it, “everyone needs a crew” (2014, p.
12). Susan Moore Johnson reinforces the efficacy of teams in the education sector, writing that
“evidence is growing that if teacher teams are well implemented, they minimize teachers’
isolation, support their instruction, [and] improve their school as an organization” (2019, p. 98).
The importance of employees having a strong set of social supports is reinforced by research
from other industries: Employees in front-line professions, such as 911 dispatchers, experience
significantly less burnout when they have social support and a strong sense of belonging (Linos
et al., 2019).
In this third and final portion of the RKA, I set out to understand what design features of
a program would best enable participants to achieve personal growth. Research from DDOs
clarifies some of those key features: regular engagement with areas for growth alongside
colleagues in an environment that is conducive to the requisite levels of vulnerability. One final
finding from the research on DDOs is particularly germane to my strategic project in SUSD:
Development programs are most effective when they are integrated seamlessly into the day-to-
day fabric of the organization. The Decurion Corporation—one of the three organizations
profiled in the DDO research—uses the phrase “nothing extra” to drive this point home (Kegan
et al., 2014, p. 11). As Kegan and colleagues put it, “People-development is not a separate
26
activity, or an ‘additive’ to the business engine, it is an essential and integrated component”
(2014, pp. 11–12).
The implication for my strategic project is clear: The more it is possible to weave
concepts from positive psychology and developmental psychology into the ongoing rhythm and
routines of participants in the program, the better. In other words, to enable my strategic
project to be as effective as possible and for the lessons learned from the program to have the
greatest chance of enduring, the conditions at school sites and at the district more broadly
should reinforce (rather than undermine) what’s taking place as part of the program.

27
Theory of Action
Based on my review of the literature above, I developed the following Theory of Action
for my strategic project:
If I…
1. Design. Design a program grounded in research from positive psychology and adult
development that provides participants with training intended to build knowledge,
skills, and mindsets that enable them to overcome the typical stressors that affect
educators
2. Invest. Invest key stakeholders such as district leaders, school principals, school board
members, the Stockton Teachers Association, and others in the importance of a
program like Educators Thriving
3. Recruit. Recruit participants, both teachers and administrators, to take part in the
program
4. Execute. Execute effective sessions that achieve their intended outcomes
Then…
1. Educators who participate in the program will experience…
a. Increased well-being (defined as increases in subjective well-being, resilience,
job satisfaction and decreases in burnout, depression, and anxiety)
b. Decreased absenteeism as compared to non-participants
c. Decreased attrition as compared to non-participants*
d. Teachers: Increasing effectiveness with students*
e. Principals, APs, mentors, coaches: Increasing effectiveness with students and
adults*

28
2. Key decision-makers in SUSD will see the value of a program such as Educators Thriving
and will strive to keep the program going into the future*
3. Stockton will come to be regarded as a district that engages in innovative programming
to develop and retain staff members*
Which will in turn result in…
● Students learning more because they are being educated by teachers and
administrators with greater well-being and more experience in the profession*
● SUSD needing to hire fewer new teachers and school leaders than they might have
otherwise, which would free up the capacity of school leaders and Human Resources
department employees to pursue additional strategies to retain effective educators and
develop the capacity of employees throughout the district*
So that…SUSD can fulfill its mission to lift students out of the conditions of poverty and scarcity
and ensure that every child graduates from high school college-, career-, and community-ready.
* These are results we would expect to see eventually but not completely by March 2020. For
that reason, the evidence and analysis portions of this capstone will not address the achievement
(or non-achievement) of these results.

29
Strategic Project Description
The overarching objective of my strategic project was to design and execute a program
to systematically increase educator well-being, effectiveness, and retention. Table 1
demonstrates the three distinct phases of my residency project. In what follows, I describe in
more detail what occurred during each phase.
Table 1
Phases of the Strategic Project
Phase 1: Design and invest Phase 2: Recruit Phase 3: Execute, monitor
progress, adjust course
December 2018 - July 2019 July 2019 - August 2019 August 2019 - March 2020
Objectives
● Deepen my
understanding of
current practices for
teacher support in
SUSD
● Gather input from
key partners in the
potential for a
program like
Educators Thriving
● Invest key partners in
supporting a program
like Educators
Thriving
● Create a high-level
design for the
program that will
work logistically
Objectives
● Build awareness of
and enthusiasm for
the program with key
audiences
throughout the
district
● Encourage interested
educators to apply to
take part in the
program
Objectives
● Execute sessions that
achieve their
intended impact
● Gather feedback
about the program’s
efficacy and
participant well-being
● Strategically adjust
programming on the
basis of feedback
from participants
Activities
● Float the idea to and
Activities
Present and promote the
Activities
● Execute planned

30
seek input from key
partners (senior
district leaders,
principals, teacher
induction staff,
Stockton Teachers
Association, local
schools of education)
● Create a high-level
program design
based on 2018–19
pilot in Boston Public
Schools
● Refine logistics with
program partners
● Design recruitment
materials
program widely in the
following contexts:
● Summer
administrators’
retreat
● New teacher
professional
development
● School site
professional
development days
● Email blasts
● District website
● Social media
sessions
● Gather feedback
from program
participants
● Iterate and evolve
programming on the
basis of ongoing
feedback from
participants
Phase 1: Design and invest
A primary purpose of the first phase of my residency was to gain an awareness of the
conditions on the ground in SUSD. I sought to understand professional development practices
for teachers throughout the district and forge initial relationships with those leaders, both in the
district and throughout the broader community, who would have the ability to either facilitate
or hinder my ability to execute the program. During this phase, I met with Superintendent
Deasy, the president of the Stockton Teachers Association, the leadership of a local school of
teacher education, the president of the school board, various school leaders, and others. See
Appendix A for a full list of the people I met with during this phase.
Each person I met with attested to the challenge that district teachers were facing with
respect to stress and burnout. Each also underscored the importance of a program like
Educators Thriving to help Stockton teachers achieve well-being. As I gained insights and
encouragement from a wide swath of people from throughout the community, I grew confident

31
that a program like Educators Thriving would be a welcome addition to the suite of professional
development offerings already provided by the district.
One particularly consequential meeting during this period was with the leadership from
The Teachers College of San Joaquin (TCSJ). TCSJ is the largest teacher-training program in San
Joaquin County. I approached TCSJ to see if they might be interested in partnering together to
ensure participants in Educators Thriving would be able to earn graduate units for their
participation in the program, enabling those teachers to move up the salary schedule. TCSJ staff
agreed that a program like Educators Thriving would be a valuable addition to their repertoire
and would be a program for which participants could earn units.
During this initial phase, I also made an exhaustive effort to create a plan for the
program that would allow it to proceed without running into too many logistical barriers. I
checked and rechecked bell schedules at schools throughout the district to ensure the times for
the program’s meetings would work for as many educators as possible. I worked with the
Teacher Induction Program at SUSD and with leaders of local teacher training programs to
ensure that the sessions wouldn’t conflict with trainings teachers would be required to attend.
And I worked with employees across the district to identify school sites that might be able to
host the training sessions.
Another priority during this “design” phase was getting clear on exactly what success
would look like and how I would measure it. To that end, I worked in close consultation with
Akash Wasil, a PhD student in clinical psychology at the University of Pennsylvania. Akash and I
had met during his final year as an undergraduate at Harvard. At that time, Akash began to
serve as an advisor to me, helping to guide my understanding of research findings in psychology.
As part of our work together, Akash and I culled through dozens of potential survey instruments
to measure well-being: the Maslach Burnout Inventory, the Copenhagen Burnout Inventory, the

32
Patient Health Questionnaire (PHQ-9) depression scale, and the Connor-Davidson Resilience
Scale, among others. We eventually chose to use a set of seven different scales to use in a
survey that participants and members of a comparison group would take as part of baseline and
end-of-program surveys. For a complete list of the survey instruments we decided to use, see
Appendix B.
Based on my research as well as the various meetings I held during this phase of the
project, I solidified a high-level design for the program overall. What follows is a synthesis of
some of the major design decisions that guided the construction of the program:
Regular meetings. My research on DDOs confirmed for me that the program needed to
meet consistently over the course of the year to develop a “groove,” enabling the program
practices to become ongoing habits for participating teachers. Regular meetings would also help
to establish a sense of connection and trust among participants that would lay the foundation
for participating educators to challenge one another to make significant personal growth. In
consultation with others, I made the decision to have the program meet roughly every two to
four weeks between late August and March.
Consistent attendance & groups. I decided that, for participating educators to get credit
for the program, they would be required to attend at least 10 of the 12 meetings throughout the
year. Moreover, participating educators would be expected to sit with a consistent group of
between three and six other teachers. The purpose behind this design choice is rooted in the
recognition, also derived from the research on DDOs, that a sense of “home” among
participants—i.e. community and trust— matters enormously.
Application required. Recognizing that participating in the program would require deep
personal reflection, Superintendent Deasy and I decided the program would not be compulsory
for any participants. Instead, the program would be optional, and interested teachers would be

33
required to apply. We only wanted participants who would be enthusiastic about the
opportunity; we wanted to avoid involving anyone who would resist or feel resentful for having
to take part. Additionally, I made the assumption that requiring interested teachers to complete
an application would deepen their level of commitment should they be admitted. While this
design choice runs counter to the notion within DDOs that all employees are involved in the
development opportunity, Superintendent Deasy and I didn’t feel that it would be wise or
feasible to pursue full-scale implementation.
Teacher and “admin” tracks. I decided to host two different versions of the Educators
Thriving program. One version would be for classroom teachers throughout the district. The
second would be for those who oversee the work of teachers: principals, assistant principals,
instructional coaches, and teacher mentors. One reason for having separate tracks was to
maximize the likelihood that program participants would be vulnerable with one another; I
assumed that teachers might be less likely to share candidly about personal challenges if their
supervisor were at the table next to them, and I assumed that the same would be true for those
who oversee teachers.
There was another reason for creating a track of the program exclusively for
administrators: They are uniquely positioned to create school-wide change at their sites. As the
work of Susan Moore Johnson (2019) attests, one of the most consequential factors impacting
teachers’ experience relates to their relationship with their supervisor and the conditions that
supervisor establishes school-wide. Therefore, I wanted to ensure that administrators would
have access to the program so that they might systematically incorporate the practices and
principles they were learning throughout their schools. While the content of the “admin” track
would closely mirror the content of the teacher track, it would also provide supervisors with an
opportunity to consider how they might incorporate the practices in their schools. The

34
incorporation of this aspect of the program aligns with the research from Kegan, Lahey, and
colleagues about the power of DDOs to create environments in which personal development is
part and parcel of the everyday work of the organization. In making this design decision, I
sought to reject the false binary of working only at the level of the system or the individual
teacher. I knew we needed to create systemic change and provide tangible support for
individuals to cope with a broken system.
Catalytic content. I made decisions about the content for the program based on findings
from both positive psychology and developmental psychology. The question I asked myself
when making decisions about what to include in the program was the following: “What
practices, if adopted by program participants, would be most likely to lead to significant
increases in well-being?” For instance, building on research that knowing and consistently
reflecting on core values enables people to achieve higher rates of well-being, one of the
sessions focused on guiding participants to clarify their core values. Their homework assignment
following this session, also derived from relevant social-science research, was to complete a
journal in which they would reflect on the ways in which they had noticed their core values in
action over the ten days leading up to the following session. A different session, based on
Professor Martin Seligman’s research, helped participants to identify their signature strengths,
reflect on them, and take deliberate steps to use those strengths in new ways. To support
participants in addressing the adaptive dimensions of their learning and change efforts, I
included Immunity to Change exercises.
Another criterion that shaped decisions about what content to include or exclude from
the sessions was based on my experience facilitating a pilot version of the Educators Thriving
program in Boston Public Schools during the 2018–19 school year. For instance, one of the
highest-rated sessions during that iteration of the program revolved around teaching program
35
participants effective methods of prioritizing that which is important but not urgent. While I was
not able to discover research directly related to the deployment of such prioritization skills, I
nonetheless made the decision to include it based on the overwhelming positive feedback that
the session received in Boston.
For a high-level synthesis of the content of the sessions, see Appendix C.
Consistent session structure. Each of the two-hour sessions followed a relatively similar
structure. The particular structure was designed with the intention of maximizing an
atmosphere of trust, vulnerability, and a willingness to challenge one another among
participants. For an example of the high-level structure used for the sessions, see Appendix D.
Phase 2: Recruit
Having made the most important design decisions and devised a high-level architecture
for the program, I turned my attention to building awareness of and enthusiasm for the
program among key audiences throughout the district. The primary objective during this phase
was to encourage interested teachers and administrators to apply.
The first order of business was to finalize the recruitment materials for the program. To
that end, I created a flyer for the program (See Appendix E). I also worked with a film editor to
create a short promotional video about the program that included testimonial comments from
people who had participated in the program the previous year as part of the pilot in Boston
Public Schools (See Appendix F). I worked with the district’s communications team to promote
the video through the district’s website and Twitter account.
With the trunk of my car full of recruitment flyers for the program, I spent the following
two weeks making presentations about the Educators Thriving Program at 28 different locations
throughout the district. The first was a presentation to all principals and assistant principals
throughout SUSD at the annual administrators’ retreat. During that retreat, I had the

36
opportunity to give a short pitch about the program encouraging administrators to apply to the
program themselves, encourage their staff to apply, and invite me to present to their schools
during their beginning-of-year professional development sessions. Additionally, I cultivated a
relationship with leaders from the principals union, United Stockton Administrators (USA). USA
leadership saw the importance of a program such as Educators Thriving. As a result, Gina Hall,
the union’s president, invited me to give a presentation about the program to their members-
only meeting, granting me additional time to answer questions and explain the content of the
program.
Following the administrators’ retreat, I gave another presentation about the program at
the district’s orientation event for new teachers. Within an hour of having presented, 48
teachers had applied to take part in the program. I presented at a beginning-of-year meeting for
incoming Teach For America corps members who would be teaching in Stockton. I presented to
SUSD’s Instructional Coaches. And two days before the first day of school, I delivered a fifteen-
minute presentation at 10 different schools over the course of one day. Over three days,
seventeen principals invited me to make presentations during the professional development
time they had with their full faculties. Throughout these weeks, I hustled from event to event
and from school to school, handing out flyers and sharing information with teachers about the
program.
During my presentations, I had three primary objectives. First, I sought to communicate
logistical details about the program to prospective participants. For instance, I communicated
that the program would consist of twelve sessions and that those who successfully completed
the program would be able to earn graduate units that could move them up the salary schedule.
Second, I sought to communicate a sense of personal vulnerability. To that end, I began each
presentation with a story about the time when, in October of my first year of teaching, I ended

37
up crying into my pancakes over breakfast one morning. By sharing in this way, I sought to signal
that this program wouldn’t be like typical professional development sessions: There would be
space for participants to share vulnerably and investigate their inner life. Finally, I sought to
communicate that the program would address real and urgent needs. During my presentations, I
asked teachers to snap if they felt that they had experienced some of the common “pitfalls” that
the Educators Thriving program would seek to address, pictured in Figure 2. In school after
school, the room erupted in snaps as I listed out the various challenges.
Figure 2
The Five Pitfalls
Before long, I had the opportunity to reconnect with Stockton Teachers Association
(STA) President Erich Myers. Erich invited me to make a presentation to the union’s Executive
Council. Not only did the group agree to promote the program among its members, but STA also
decided to become an official co-sponsor of the training series, agreeing to provide funding that
would enable us to feed teachers at each of the program’s sessions.
The support from STA was particularly significant given that the launch of my
recruitment efforts for Educators Thriving coincided with a period of tension between the

38
teachers union and the district. In August, STA members voted down the tentative contract that
the union had negotiated with the district. In light of that, the fact that the union was willing to
vociferously support the program—and even to include their logo alongside that of the district
on the flyer (See Appendix E)—was meaningful. As Superintendent Deasy wrote to me in an
email at the time, “Congratulations. This is bigger than you know” (J. Deasy, personal
communication, September 6, 2019).
Support from school and system leaders enabled me to achieve significant success
recruiting teachers to take part in the program. By the application deadline in mid-August, we
had received 296 applications from educators throughout SUSD. The response exceeded my
expectations; nearly 15% of the teaching force in SUSD had applied to be a part of the program.
Table 2 lists the breakdown of applications by role.
Table 2
Number of Applications by Role
Track Role Number of applications
Teacher track Teacher 249
“Admin” track
Principal 6
Assistant principal 7
Instructional coach 20
Teacher mentor 14
After discarding incomplete applications, I ended up admitting approximately 200
teachers into the program.
As applications were coming in, however, I needed to decide about whether and how to

39
create a comparison group in the study. On the one hand, I knew that designing and carrying out
a randomized controlled trial would be the best way to make claims about the program’s
efficacy. On the other hand, I knew that the creation of a randomized controlled trial would
involve rejecting approximately half of the people who applied for the program in order to
assess the difference in outcomes between those who took part in the program as opposed to
those who applied but weren’t admitted. Knowing that I had the capacity and resources to
admit nearly all the people who applied for the program, I wrestled with the ethical implications
of turning people down who might benefit from the program.
Eventually, I decided that I would seek to conduct a randomized controlled trial in some
future version of the program. In lieu of a randomized controlled trial, I decided that I would
admit all applicants who had successfully submitted a completed application for the program. I
then decided that I would create a comparison group using a process approximating “coarsened
exact matching,” a method of creating a comparison group that seeks to match up the control
and treatment group using some of the most salient characteristics of the treatment group
(Iacus et al., 2012). For purposes of my project, that meant that the comparison group was
constructed by using the two observable characteristics for the treatment group for which I was
able to acquire data and that I assumed would be most predictive of well-being: tenure in SUSD
and school site. I would have liked to include tenure in the teaching profession as compared to
tenure in the district, but, unfortunately, the district does not collect that information. Instead, I
decided to use data about a teacher’s tenure in the district as a rough proxy for a teacher’s
tenure in the profession.
The rationale for using these two observable characteristics to create the comparison
group—tenure in SUSD and school site—is grounded in research. I decided to use tenure in the
district because early-career educators are exposed to a particular set of stressors that aren’t

40
always replicated among those educators with more seniority (Moir, 1990). I decided to use
school site as the second criterion because we know that the conditions established at a
particular school site by a particular administrative team have a significant effect on the
experience and retention of teachers at that site (S. M. Johnson, 2019).
Of course, the primary disadvantage of this method of constructing a comparison group
is that those people in the comparison group differed from the treatment group in one key
respect: They hadn’t applied for the program. That said, in an effort to admit as many people as
possible into the program, I was willing to accept reduced capacity for making causal claims
about the program’s efficacy.
Phase 3: Execute, monitor progress, adjust course
Between late August and the end of March, I facilitated a total of 36 two-hour sessions
for the Educators Thriving program. These sessions were divided into two teacher “tracks” and
one administrator “track.” Each track met on twelve separate occasions over the course of the
year for two hours at a time, typically after school between 3:30 and 5:30 p.m. I set the
expectation that participants commit to attending one track throughout the year so that they
could develop relationships with a consistent group of attendees. If there was an immovable
conflict with the date and time when their track was meeting, participants could visit the other
track up to two times. To see the flyer that participants received, see Appendix E.
Based on my experience facilitating the program in Boston, I expected that attendance
would peak during the first few sessions and that a substantial number of participants would
decide to opt out of the program. I assumed that people would drop for a variety of reasons,
from scheduling conflicts to life being busier than anticipated to people feeling that the program
wasn’t meeting their needs or expectations.
That is in fact what happened in Stockton. Table 3 outlines the people who were

41
admitted into each of the tracks followed by the number of people who signed in to each
session.
Table 3
Program Admission and Session Attendance
Track Educators admitted
Session 1 attendance
S2 S3 S4 S5 S6 S7 S8 S9 S
10 S
11 S
12
Edison 104 83 74 73 63 64 42 59 61 56 57 58 62
Chavez 104 88 80 57 55 56 55 54 53 51 52 51 52
Admin 47 29 32 25 20 14 14 22 17 11 15 11 11
During the first session of the program for each track, I administered the survey that
Akash and I constructed during the first phase of my residency. I would go on to administer that
same survey to program participants and members of the comparison group in January. The
analysis and implications sections of this capstone are based on the data gathered from the
August and January administrations of the survey.
In addition to facilitating the sessions for program participants, I sought to assess the
well-being of members of a comparison group periodically over the course of the year. To do
this, I first needed to identify a group of teachers from throughout the system who could
constitute the comparison group. To that end, I got information from the Information Services
Department about teachers throughout the district. Next, I sought to create a comparison group
that was similar to the treatment group based on the most salient characteristics of the people
in the program for which I could gather data: their tenure and their school site.
In early September, I sent out an email to 236 members of a comparison group—
matched as described above—requesting that they take the same baseline survey that
participants in the program had taken. Twenty-six people ended up taking the survey. I intended

42
to follow up with members of the comparison group to encourage more of them to fill out the
survey, but I wasn’t sufficiently vigilant in my follow-up, so we ended up only getting data from
those 26 teachers. In January, I followed up with the group of 26 teachers who had taken the
baseline survey at the beginning of the year. I knew that having baseline and midyear data from
such a small number of teachers would potentially limit our ability to draw conclusions about
their trajectory of well-being over the course of the year, but it nonetheless seemed worthwhile
to pursue the information. Seventeen of the 26 ended up taking the survey a second time.
In addition to this small comparison group, I wanted to get a sense of how teachers
similar to those in the program were doing at the midpoint of the year in January. Using the list
of participants who were still a part of the Educators Thriving program and who had taken both
the baseline and midpoint surveys, I re-engaged in the process of creating a comparison group
that would approximately match the composition of teachers who were now participating in the
program. Once again, I sought to create a comparison group that was proportionally similar to
the treatment group in terms of where they were teaching and their tenure in the district. For
instance, if there was a teacher in the program who had three years of experience and who
taught at Harrison Elementary School, I sought to include three to four other teachers at
Harrison Elementary with approximately three years of experience in the comparison group.
That process resulted in a list of 466 teachers who were not in the program but who were
proportionally similar. Given rates of survey responsiveness I had observed in the fall, I assumed
that a group of this size would be more likely to yield the number of responses that I was hoping
for in a comparison group.
Around the same time that program participants were taking the midyear survey, I
emailed a link to the same survey to the 466 teachers in the comparison group. After a few days,
I followed up to encourage more people to participate. Eventually I was able to gather survey

43
data from 130 teachers from that group.
* * *
Each session of the program concluded with those in attendance completing a five-
question feedback survey to share their thoughts about the session (see Appendix G for an
example of the survey). As I outline more thoroughly in the evidence section below, the sessions
of the Educators Thriving program received largely positive feedback from participants in the
program. After each session, I analyzed feedback from participants and identified adjustments I
could make for subsequent sessions. Teachers provided feedback about the content of the
sessions (“I liked hearing about others’ strengths and their visions and goals for themselves”),
the facilitation (“Tyler’s honesty and willingness to share with the group was inspiring”), the
logistics (“It was cold!”), the food (“Maybe a different food type like pizza”), and other aspects
of our time together. At the next session, I would begin by reading out a synthesis of the
feedback that participants had shared during the previous session, and I narrated the ways in
which I was making (or not making) changes based on the feedback I had received.
In between each session, program participants were expected to complete homework
assignments that were directly related to the content we had covered together. See Appendix H
for examples of two homework assignments that I assigned to program participants.
As the year progressed, the leaders throughout the district who had initially
championed the importance of Educators Thriving continued to provide sustained support. For
instance, Superintendent Deasy, encouraged by the significant interest in the program and
positive feedback from the first few sessions, invited me to give a presentation about the
program in front of the SUSD Board of Trustees. Members of the board offered their
congratulations and encouragement. Additionally, HR and school-site staff provided invaluable

44
logistical support necessary for executing each session of the program.

45
Strategic Project Evidence and Analysis
In what follows, I outline and analyze evidence for the effectiveness of the Educators
Thriving program that I had by mid-February 2020. In so doing, I assess the degree to which I
was able to bring my theory of action to life. In particular, I present evidence relevant to the
specific dimensions of my theory of action listed below:
If I…
● Execute effective sessions that achieve their intended outcomes
Then…
● Educators who participate in the program will experience…
○ Increased well-being (defined as increases in subjective well-being, resilience,
job satisfaction and decreases in burnout, depression, and anxiety)
○ Decreased absenteeism as compared to non-participants
○ Decreased attrition as compared to non-participants*
○ Teachers: Increasing effectiveness with students
○ Principals, APs, mentors, coaches: Increasing effectiveness with students and
adults
● Key decision-makers in SUSD will see the value of a program such as Educators
Thriving and will strive to keep the program going into the future*
● Stockton will come to be regarded as a district that engages in innovative
programming to develop and retain staff members*
* These are results we would expect to see eventually but not entirely by March 2020.

46
As I discuss above, I made a conscious decision not to conduct a randomized controlled
trial. Instead, I decided to create a comparison group using a process approximating “coarsened
exact matching,” a method of creating a comparison group that matches up the control and
treatment group using some of the most salient characteristics of the treatment group (Iacus et
al., 2012). For this reason, my ability to make causal claims about the program’s efficacy is
limited. My interpretation and analysis of the data below reflects this fact.
Evidence: Well-being
In what follows, I analyze the well-being of participants in the program at various points
in time and compared to the well-being of those who did not participate in the program.
One hundred fifteen participants in the Educators Thriving program took the baseline
survey in late August as well as the midpoint survey for the program in mid-January. These 115
educators serve as the group that I consider in Table 4 below. The average number of years of
work experience for this group was 6.2 years. Table 4 compares participants’ responses to the
well-being survey in late-August and mid-January. Rows highlighted in green are those in which
participants made statistically significant improvements at the 1% level in their perceived well-
being between the baseline and midpoint of the program. Results highlighted in yellow are not
statistically significant at the 95% confidence level but have p-values lower than .25, indicating
that there is a less than a 25% probability that a difference this large would have occurred as a
result of chance. The table shows the p-value for each difference (i.e., the probability of seeing a
difference that large as a result of chance) and Cohen’s D, a measure of the size of the
difference in standard deviation units.

47
Table 4
Participant Well-being at Beginning of Year and Midpoint
Measure Participants at beginning of
year
Participants at midpoint
P-value Cohen’s D
Maslach Burnout Inventory: S1 - Emotional Exhaustion [Lower is “better”]
26.7 21.9 <.01 -.46
Maslach Burnout Inventory: S2 - Personal accomplishment [Higher is “better”]
37.0 37.2 .698 .03
Maslach Burnout Inventory: S3 - Depersonalization [Lower is “better”]
7.6 5.6 <.01 -.35
Connor-Davidson Resilience Scale [Higher is “better”]
27.7 29.8 <.01 .37
PERMA [Higher is “better”]
151.5 153.8 .232 .10
Patient Health Questionnaire - 9 Depression Scale [Lower is “better”]
7.1 5.1 <.01 -.48
General Anxiety Disorder - 7 [Lower is “better”]
7.5 4.98 <.01 -.51
Subjective Well-being [Higher is “better”]
19.7 20.5 .051 .19
Job satisfaction [Higher is “better”]
5.2 5.6 <.01 .30
Retention: How long do you plan to remain in the position of a preK-12 educator? [Lower is longer]
1.62 1.55 .738 -.04
Retention: I plan to stay a preK-12 educator for at least five years [1 = Strongly disagree; 5 = strongly agree]
4.59 4.46 .448 -.08
Retention: I plan to stay at my 3.98 4.00 .917 -.01

48
school for at least five years [1 = Strongly disagree; 5 = strongly agree]
Retention: I plan to stay at Stockton Unified School District for at least five years [1 = Strongly disagree; 5 = strongly agree]
4.07 4.18 .552 -.08
Retention: If I could get a higher paying job, I’d leave education [1 = Strongly disagree; 5 = strongly agree]
2.7 2.7 .926 .01
Retention: I think about transferring to another school district [1 = Strongly disagree; 5 = strongly agree]
2.55 2.26 0.136 .20
Retention: In the last 12 months, to what extent have you considered applying for a job in an attempt to leave the position of a preK-12 educator? [Lower is “better”]
.93 .97 .826 -.03
As the Table 4 indicates, participants in the program reported experiencing significantly
less emotional exhaustion and depersonalization in January as compared to August.
Additionally, there was a statistically significant increase in resilience as measured by the CD-
RISC. Participants saw substantial and statistically significant declines in both depression and
anxiety, and there was a statistically significant increase in job satisfaction. It’s likely that the
improvement in subjective well-being was not due to chance. In terms of the intentions of
program participants with respect to retention, there was no significant change in participant
scores between August and January. However, while it did not surpass the threshold of
statistical significance at the 1% level, the evidence suggests that there is a distinct possibility
that participants in the program were thinking less about transferring to another school district

49
in January as compared to August.
To delve more deeply into the PHQ-9 Depression scale, the average score for
participants in late August was 7.1. Based on the scoring guide in Figure 3, this means that the
group was, on average, squarely in the middle of the “Mild depression” range (University of
Michigan Medicine, n.d.). In January, however, participants in the program scored an average of
5.1, putting the average for the group as a whole on the cusp between “mild” and “minimal”
depression.
Figure 3 Interpreting Patient Health Questionnaire - 9 Scores
Reproduced from University of Michigan Medicine, n.d.
In summary, participants in the program were on average more likely to be less burned
out, more resilient, less depressed, less anxious, happier, and more satisfied with their jobs
following approximately four months of their participation in the program. While we can’t be
certain given the lack of data on changes over the same time period for a control group, these
data suggest that Educators Thriving improved the psychological health of participating
teachers.
Well-being: Participants vs. comparison group
As I outline in the “description” section above, I was able to acquire data for a sizable

50
comparison group in mid-to-late January, around the same time that participants in the program
took the midpoint survey. The 130 educators who made up this comparison group were drawn
from a larger pool of teachers proportionally similar to program participants. The average
number of years of work experience for those who ultimately completed the midpoint survey
was 8.3 years as compared to 6.2 years for the participants in the treatment group. This
difference in years of experience is statistically significant at the 10% level. Table 5 presents a
comparison of the results on the survey for participants and the comparison group at midyear.
Rows in blue represent measures for which comparison group outcomes were statistically
significantly better than participants in Educators Thriving at the 5% level. Rows in green
represent rows in which the treatment group had more desirable outcomes relative to the
intended impact of the program as outlined in the Theory of Action. As above, rows highlighted
in yellow have p-values lower than .25, indicating that there is a less than 25% probability that a
difference at least this large would have occurred as a result of chance.
Table 5
Participant and Comparison Group Well-being at Midpoint
Measure Participants at
midpoint
Comparison group at midpoint
P-value Cohen’s D
Maslach Burnout Inventory: S1 - Emotional Exhaustion [Lower is “better”]
21.9 21.9 .968 .01
Maslach Burnout Inventory: S2 - Personal accomplishment [Higher is “better”]
37.2 40.5 <.01 -.50
Maslach Burnout Inventory: S3 - Depersonalization [Lower is “better”]
5.6 5.5 .883 .02

51
Connor-Davidson Resilience Scale [Higher is “better”]
29.8 31.7 <.01 -.37
PERMA [Higher is “better”]
153.8 155.9 .419 -.10
Patient Health Questionnaire - 9 Depression Scale [Lower is “better”]
5.1 5.3 .662 -.06
General Anxiety Disorder - 7 [Lower is “better”]
4.98 4.47 .369 .11
Subjective Well-being [Higher is “better”]
20.5 21.7 .05 -.25
Job satisfaction [Higher is “better”]
5.6 5.4 .233 .15
Retention: How long do you plan to remain in the position of a preK-12 educator? [Lower is longer]
1.55 1.8 .071 -.24
Retention: I plan to stay a preK-12 educator for at least five years [1 = Strongly disagree; 5 = strongly agree]
4.46 3.68 <.01 .82
Retention: I plan to stay at my school for at least five years [1 = Strongly disagree; 5 = strongly agree]
4.00 3.37 <.01 .55
Retention: I plan to stay at Stockton Unified School District for at least five years [1 = Strongly disagree; 5 = strongly agree]
4.18 3.42 <.01 .66
Retention: If I could get a higher paying job, I’d leave education [1 = Strongly disagree; 5 = strongly agree]
2.7 2.8 .652 -.06
Retention: I think about transferring to another school district
2.26 2.27 .953 -.01

52
[1 = Strongly disagree; 5 = strongly agree]
Retention: In the last 12 months, to what extent have you considered applying for a job in an attempt to leave the position of a preK-12 educator? [Lower is “better”]
.97 1.24 .22 .16
A number of interesting findings emerge from the comparison between the two groups.
First, we can observe that, at midyear, there were no statistically significant differences in
reported emotional exhaustion, depersonalization, depression, anxiety, and job satisfaction.
Based on other measures, however, we see that participants in the program reported lower
rates of well-being as compared to the comparison group. For instance, their sense of personal
accomplishment, resilience, and subjective well-being were significantly lower than those of the
comparison group. Finally, we see that participants in Educators Thriving, for the most part,
planned to stay on as educators at their respective school site and in SUSD for longer than those
in the comparison group. In short, by the midpoint of the year, the participants in Educators
Thriving were experiencing slightly lower well-being than the comparison group, yet they were
substantially more inclined to stay in the work.
Based on the Tables 4 and 5 above, a few of the headline results could be the following:
● Participants in the program got better. At the beginning of the year, participants in the
Educators Thriving program weren’t doing so well (for instance, the group was, on
average, mildly depressed). By mid-year, their level of well-being had increased
significantly on many indicators.
● People in Educators Thriving want to stay in teaching longer than those who aren’t in the
program. Between August and January, the evidence suggests that there was not a
significant increase in the intention of those in Educators Thriving to remain in the

53
teaching profession. However, those who chose to apply to and enroll in the Educators
Thriving program had a significantly higher intention to stay in the teaching profession
compared to the comparison group. It seems reasonable to assume that the people who
chose to take part in the Educators Thriving program were a group of educators who
knew they wanted to stay in teaching and were seeking a program opportunity that
would increase their ability to do that.
Well-being: Small comparison group
As I outline in the “Description” section above, I was able to administer the well-being
survey to a small comparison group at both the beginning of the year as well as the midpoint.
Seventeen teachers who were not in the Educators Thriving program ended up taking the survey
at both the beginning of the year and at midpoint. What is helpful about this information is that
it provides some insight into the trajectory of the change in well-being between the beginning of
the year and the midpoint of the year for teachers who were not in the Educators Thriving
program. The limitation, however, relates to the size and the highly selected nature of the
group.
The information we can glean from the data of the small comparison group is mixed. On
four of the indicators of well-being—the Maslach subscale of personal accomplishment, the
Connor-Davidson Resilience Scale, the PHQ-9, and the GAD-7—members of the small
comparison group made improvements in their well-being. However, on four other indicators—
the Maslach subscales for emotional exhaustion and depersonalization, subjective well-being,
and job satisfaction—the well-being of members of the comparison group deteriorated.
Whereas participants in the Educators Thriving program saw significant increases in their well-
being from the beginning of the year through to the midpoint on nearly every measure of well-
being, this was not the case for the comparison group. While hardly definitive, these data should

54
strengthen our confidence that the positive changes among Educators Thriving participants are
attributable to the program.
Analysis: Well-being
My data do not permit me to come to definitive conclusions regarding the causal impact
of the Educators Thriving program. That said, the evidence suggests meaningful differences
between those who took part in the program as compared to those who did not. For instance,
we can say with some confidence that participants in the program are teachers who have
expressed a stronger desire to remain a teacher in general, at their school, and in SUSD as
compared to teachers who are not participating in the program. Additionally, between the
beginning and the middle of the year, participants made significant and meaningful
improvements in their well-being that were not matched by non-participants.
Based on these observations, we are able to construct some sense of the typical teacher
in the Educators Thriving program. The profile of a teacher who applied to and subsequently
participated in the program seems to be a teacher who isn’t doing so well but who desires a
higher degree of well-being in order to persist in the profession for longer than they might
otherwise. This is supported by qualitative data from the application forms that teachers
submitted in hopes of becoming a part of the program. For instance:
I am in my 8th year of teaching. But, I have felt that I am in a complicated stage in
my profession because of so many duties that I have and that can lead to burning
out. I love my profession and want to continue to serve our students and
community. However, I need to learn strategies to be healthy in all ways to
continue serving students.

55
Another wrote:
I’ve been overwhelmed since day one of this profession. Although I know my job
as an educator is important, I’m worried I’ll be one of those teachers that burn
out before five years. The strategies that I will learn in this class will help me
survive this profession and continue to impact teenagers positively.
These comments—similar to dozens of others among those who applied—reinforce the
notion that many of the people who ultimately took part in the program were educators who
self-identified as being committed to the profession but in danger of burning out.
There are many reasons why participants in the program may have achieved nearly
across the board improvement in their well-being between August and January. One possible
explanation is that the improvements had nothing at all to do with the Educators Thriving
program; instead, it could be the case that the well-being of teachers in January is just generally
better than it is in August. While this is certainly plausible, the explanation is slightly less
credible given that teachers in the small comparison group did not see as much improvement in
well-being over the same time span. Another possible explanation is that the improvements in
well-being that teachers reported in January were exaggerated. This could be the case because
participating teachers wanted to justify their participation in the program and therefore erred
on the positive end when answering questions in the survey. While this is certainly possible, I
sought to minimize the likelihood of this outcome by stressing to participating teachers the
importance of sharing candidly and accurately.
Of course, another explanation is that the improvements in well-being among
participating teachers were due in part to legitimate progress brought about thanks to their
participation in the Educators Thriving program. On the chance that this is the case, one reason

56
for the growth could be because, in nearly every session of the program, participants were
learning and practicing strategies that have been empirically demonstrated to improve well-
being. Additionally, some of the improvement in well-being could have been because
participating educators had a regular space to congregate with peers that was explicitly geared
towards helping them feel better and receive support—factors that research suggests lead to
lower levels of burnout (S. M. Johnson, 2019; Linos et al., 2019).
Evidence: Absenteeism
During my time in Stockton, I worked with the HR and Information Services (IS)
Department to analyze whether there might be differences in the rates of absenteeism from
work between those who participated in the program and those who did not. The first step was
to identify the data that would enable me to conduct my analysis. The district codes a teacher’s
time away from work in several ways. For instance, a teacher’s day off is coded one way for sick
leave, another way for jury duty, another way for emergency leave, and yet another way in the
case of bereavement. Based on the list of all possible reasons for an employee to be away from
work, I created a list of the reasons for a work absence that, from the perspective of the
employee and the district, it would be preferable to avoid. I also included types of absences that
a program for increasing well-being (such as Educators Thriving) might reasonably be said to
influence. That list consisted of absences for absences for sickness, “personal reasons,”
“discretionary reasons,” and emergencies.
Once I identified the list of leave types, I worked with the IS Department to analyze rates
of absenteeism for teachers in the Educators Thriving program as compared to those in the 466-
person comparison group described above. The results are captured in Table 6 below.

57
Table 6
Rates of Work Attendance
Work attendance rate for Educators Thriving
participants
Work attendance rate for comparison group
Difference for participants vs. non-participants
97.8% 95.7% +2.1%
Those who took part in the Educators Thriving program were at school and with their
students at a higher rate than a similar group of educators (based on school site and tenure in
the district) who were not enrolled in the program. The difference between the two values is
statistically significant at the 1% level. Moreover, the effect size was large: a Cohen’s D value of
.92.
Analysis: Absenteeism
Here again, it is not possible to make claims about the causality underlying this
difference. For instance, it could be the case that teachers in the Educators Thriving program are
absent less often because the types of teachers who apply to and take part in Educators Thriving
are simply more conscientious employees. They might simply be the type of educator who is
more likely to show up to things—whether that is optional professional development sessions or
their typical workday. Alternatively, it could be the case that this increased rate of attendance is
due to the fact that the teachers who self-selected into the program have an especially high
commitment to the teaching profession. As we observed in the well-being evidence above,
teachers in Educators Thriving expressed a greater desire to stay in the teaching profession and
in the school district than teachers in the comparison group.
It could also be the case that the Educators Thriving program itself is responsible for
some of the improved rate of attendance. It’s not unreasonable to suspect that exposure to and

58
practice with strategies that have been empirically proven to increase well-being and decrease
illness might cause educators to attend work at a higher rate than they would have otherwise.
While it’s not possible to know the cause of the reduced rate of absences for illness,
emergencies, “personal reasons,” and “discretionary reasons,” it is possible to understand the
financial implications of educators attending work at a higher rate. Table 7 below provides an
estimate of the costs associated with a teacher taking a day off of work and requiring the district
to hire a substitute.
Table 7
Costs Due to Educator Absences from Work
Average daily rate paid to a teacher in SUSD with six
years of teaching experience Daily rate for a substitute Other costs
$489.932 $211.573
- Reduced student learning - Time and capacity from HR and school-sites to arrange for and support substitutes
Based on the information in Table 7, the increased attendance of employees in the
Educators Thriving program saved the district $95,546.07 in substitute costs over the course of
the 2019–20 school year (115 participants x 187 days x 2.1% increased attendance x $211.57 per
sub day). If we were to factor in the average daily rate for teachers as well, the total cost savings
would be as high as $316,800.91.
2 Based on a salary of $57,985 + statutory benefits of $33,632 = $91,617 divided by 187 workdays 3 Based on a daily rate of $173.57 + statutory benefits of $38.00 = $211.57

59
Evidence: Program feedback
I solicited explicit feedback about the program from participants in two distinct ways.
First, participants in the program completed a feedback form at the conclusion of each session.
As I outline in the “Description” section above, I used these survey results to make ongoing
adjustments to my facilitation of the sessions. The second type of feedback that I solicited from
participants was a short survey delivered to program participants in late February regarding
their thoughts about the impact of the program overall.
Session-by-session feedback
For an example of the survey that teachers completed at the conclusion of each session,
see Appendix G. As one part of that end-of-session survey, all participating educators answered
the question captured in Figure 4 below.
Figure 4
Feedback Survey Question 1
Figure 5 outlines the results received from teachers based on the answers they provided
in the end-of-session survey.

60
Figure 5
Average Session Ratings
In addition to the question captured in Figure 4, I asked program participants what they
liked best about the session and what they would change for the next session. In terms of things
that people liked best, the most common trends were…
1. The chance to learn about the particular strategy we were focusing on during that
session
2. The opportunity to connect and discuss with their table group
3. The vulnerability and openness I displayed in my facilitation
4. The food
Comments listing desired changes were primarily related to the logistics of the session
such as food, room temperature, amount of time provided to take a break, etc.

61
Overall program feedback
During the second-to-last session of the program, I asked teachers to complete a survey
to share their reflections about the impact of the program as a whole. Table 8 outlines the
results.
Table 8
Quantitative End-of-Program Participant Feedback
1. “Having a program like this has made teaching feel more sustainable.”
Strongly disagree
Disagree Somewhat disagree
Neutral Somewhat
agree Agree
Strongly agree
# 8 13 47 57
% 6% 10% 38% 46%
2. “The strategies I learned about in this program helped to improve my well-being.”
Strongly disagree
Disagree Somewhat disagree
Neutral Somewhat
agree Agree
Strongly agree
# 2 12 42 69
% 2% 10% 34% 55%
3. “Having this program made me more likely to stay in the teaching profession.”
Strongly disagree
Disagree Somewhat disagree
Neutral Somewhat
agree Agree
Strongly agree
# 1 16 24 40 44
% 1% 13% 19% 32% 35%
4. “This program has made me a more effective teacher with my students.”
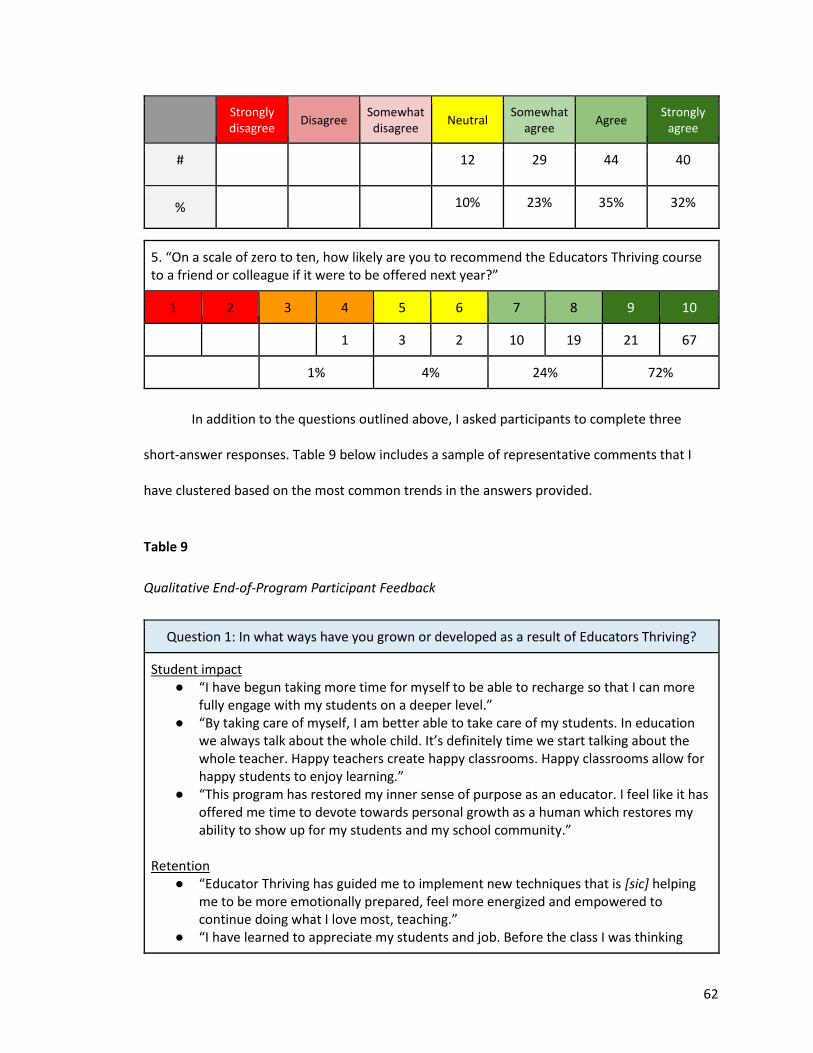
62
Strongly disagree
Disagree Somewhat disagree
Neutral Somewhat
agree Agree
Strongly agree
# 12 29 44 40
% 10% 23% 35% 32%
5. “On a scale of zero to ten, how likely are you to recommend the Educators Thriving course to a friend or colleague if it were to be offered next year?”
1 2 3 4 5 6 7 8 9 10
1 3 2 10 19 21 67
1% 4% 24% 72%
In addition to the questions outlined above, I asked participants to complete three
short-answer responses. Table 9 below includes a sample of representative comments that I
have clustered based on the most common trends in the answers provided.
Table 9
Qualitative End-of-Program Participant Feedback
Question 1: In what ways have you grown or developed as a result of Educators Thriving?
Student impact ● “I have begun taking more time for myself to be able to recharge so that I can more
fully engage with my students on a deeper level.” ● “By taking care of myself, I am better able to take care of my students. In education
we always talk about the whole child. It’s definitely time we start talking about the whole teacher. Happy teachers create happy classrooms. Happy classrooms allow for happy students to enjoy learning.”
● “This program has restored my inner sense of purpose as an educator. I feel like it has offered me time to devote towards personal growth as a human which restores my ability to show up for my students and my school community.”
Retention
● “Educator Thriving has guided me to implement new techniques that is [sic] helping me to be more emotionally prepared, feel more energized and empowered to continue doing what I love most, teaching.”
● “I have learned to appreciate my students and job. Before the class I was thinking

63
about leaving the teaching profession. I’m sure I’ll be staying for the long haul now.” Self-awareness
● “I have become clear on what I want my life to look like and how to get there. It has been interesting becoming aware of what’s holding me back.”
● “I have grown as a person by reflecting on my life goals, as well as the assumptions that were getting in the way. I learned that my assumptions were holding me back from reaching my goals.”
● “I am more in tune with myself: who I currently am, and who I am striving to be. I am more mindful of my way of life and how it affects the world and others around me. I am more at peace. My anxiety has greatly decreased as well!”
Ability to cope with stress
● “I am better able to understand my needs and how I can cope and develop healthier habits.”
● “I feel that I have developed coping mechanisms to deal with the high amount of stress.”
● “The most radical change I’ve noted was the knowledge and certainty that I am able to manage anything in my path. I feel like I have the personal tools to process stress and disappointment objectively—both notice it, name it for what it is and either directly deal with it or let it pass by as needed.”
More intentional
● “I now live my life more mindful and not mindless. I am intentional about what I need to do to be able to stay full and satisfied with my life.”
● “First, I have learned how to prioritize what is important and what is not important in how I’m spending my time. Second, I’ve learned that I need to confront myself with my fears and not make excuses if I am going to grow.”
Less isolated; more connected
● “Educators Thriving has helped me connect with other educators. I’ve connected with other educators in ways where I can share my current experiences, where I can gain insight from their experiences, and to have someone to rely on when times get challenging.”
● “I think I am more concious [sic] if [sic] my actions towards myself and my students. I don’t feel as trapped or left alone because this course has reaffirmed that we are all going through our own challenges.”
● “I have learned that i am not alone and that many new teachers are also going to similar issues and growth as me.”
Question 2: If a superintendent were considering whether or not to bring a program like Educators Thriving to their district, what would you say to them? Why?
Retention ● “I would say it would hugely impact teacher retention. Teachers deal with having too
much on our plates. This class will definitely give teachers ways to deal with being overwhelmed, which will in turn make them more successful. If we feel successful at

64
our jobs, we will stick around.” ● “I would say that there is a high turn-over rate in the teaching profession. If you want
to make sure your teachers are getting all the resources of support they need, then you need to give this as an option for your educators.”
● “Do it! The program will not only benefit your staff but also your students because it will allow teachers and support staff to find strategies and supports to better deal with the challenges of every day [sic] common issues in a classroom. It will stop teachers from hitting a maximum level of burn-out to where their classrooms become toxic or they leave the profession.”
Student impact
● “I would recommend this to a superintendent because it helps teachers improve their mental health and well being, thus helping them achieve more in the classroom.”
● “I would highly encourage this program to continue forming part of SUSD. As educators, we tend to put others before ourselves, goals and well-being included, and this program highly encourages teachers to take care of themselves, so in return, they can care for others.”
● “I would like to recommend this program for those who need help overcoming mental blocks and personal obstacles in order to become a better teacher.”
Not just early-career teachers
● “I would say that it is an excellent idea and that not just new teachers could benefit from this. It doesn’t matter how long you have been teaching, this class is vital to a teacher’s life.”
● “I would say YES! Especially but not limited to first year teachers. Sometimes teaching can be a lonely job where you do not always have he [sic] satisfaction of feeling ‘done.’ It is important for new (and old) teachers to feel like they are not alone and he [sic] district realizes this is a difficult task we attempt hat [sic] comes with a lot of stress.”
● “I would say this program is beneficial to not only your new teachers, but also your teachers in every stage of their career. Everyone is wanting to work on something in their lives, whether personal or professional. This is an excellent tool to offer to your staff that may have an impact on their positivity and performance levels over extended periods of time.”
Increased well-being; less stress
● “They should because it improved the well being of multiple of my colleagues including myself. Stress is down even with new curriculum and piloting science curriculum.”
● “Do it. Valuable tools for anyone to work on managing stress or shifting negative paradigms.”
Offer as a choice, not a requirement
● “Offer it as a choice. People, especially teachers, recoil at mandated trainings even if it’s beneficial. People who chose self improvement are more personally invested.”
● “I would say, if the superintendent offered the program as a choice and not as a mandatory requirement it would beneficial [sic]. I believe it was a positive experience

65
for me and all people could benefit from it, although some people may go in with a fixed mindset if forced and not see the benefit.”
Less isolated; more connected
● “I would most definitely think it is a good idea. It helps teachers to jot [sic] get burnt out and it helps them come together and be more collaborative. It allows new and seasoned teachers to know they are not alone.”
● “I would tell him it is really helpful. It allows teachers to connect, develop long lasting skills, and allows us to not feel so alone.”
Question 3: Anything else you’d like to share?
Student impact ● “This class begins with self-improvement and it will improve your classroom.
Eventually improve the school and the community.” ● “This has been a great experience and I know it will be great for me later on as a
school leader/administrator to take to a school. I think it’s important to develop people and students fully, not just academically.”
● “My students have really benefited from practicing mindfulness. They watch me use the techniques when I’m stressed and it’s easier for them utilize the mindfulness strategies when they need to.”
Retention
● “As a first year teacher if I didn’t have this class I would have felt overwhelmed to the point of questioning my career choice. I am grateful for this class.”
● “This program has helped me my first year of teaching. This is the profession for me. Thank you!”
● “I would of [sic] loved a program like this in my credential program because during that time i felt so alone that i sought out a therapist. This year i have a mentor for induction and i had new educators thriving and i felt like i had people who support me and told me i would be successful. This made me realize that i was capable of so much more. It reminded me why i had wanted to be a teacher.”
Less isolated; more connected
● “This program has allowed me to get connected to other SUSD teachers. I feel as though I am more suported [sic].”
● “This has been a great opportunity to meet teachers outside of our worksite.” ● “I loved making new friends and the support I received.”
Implicit program feedback
One important piece of evidence regarding participant feedback relates to how much
participants “voted with their feet” and made the decision to keep coming to the sessions.

66
Figure 6 clarifies the number of participants who were admitted to each track and who
subsequently signed into the various sessions over the course of the year.
Figure 6
Program Admission and Session Attendance
As both Figure 6 and Table 10 indicate, there was a sharper decline in the attendance
for participants in the “admin” track—principals, assistant principals, instructional coaches, and
teacher mentors—as compared to the decline in the teacher tracks.
Table 10
Rate of Program Persistence
Track Session 1
attendance
Average attendance at sessions 8 - 11
% of participants who persisted from session 1 until the final sessions
Edison 83 58 70%
Chavez 88 52 60%

67
Admin 29 14 48%
Analysis: Program feedback
The evidence demonstrates that, generally speaking, the participants who persisted in
the Educators Thriving program appreciated the opportunity to take part and report substantial
benefits from their participation. The sessions achieved relatively high overall ratings, and,
generally speaking, participants agree that the program achieved its aims: to enable educators
to achieve increased well-being, do better work with students, and stay in the profession for
longer than they might have otherwise.
There are a number of reasons why this was likely the case. For one, I sought to align my
methods of facilitation with the principles that we know drive employees in Deliberately
Developmental Organizations (DDOs) to reliably make growth. For instance, one of my top
priorities at the outset of the program was creating a sense of home for participants: I modeled
the level of vulnerability that I expected of others and ensured that participants in the program
established a consistent “crew” in whom they could confide and with whom they could
collaborate (Kegan et al., 2014, p. 86). Additionally, I sought to create an environment in which
participants could meaningfully engage with their edge, one in which it was possible to
celebrate weaknesses as assets and errors as opportunities. Finally, rather than having a series
of one-day trainings—a strategy that I could have adopted for my strategic project—I made sure
that participants were able to develop a groove, developing consistent opportunities to come
together and engage around opportunities for growth.
Another possible explanation for the successes evident above is that the content of the
sessions was selected in such a way as to maximize the likelihood of a positive impact. Nearly
every aspect of the program’s content was rooted in empirical research about the habits of
behavior and mind that reliably lead to increases in well-being. Coming into the program, many
68
participants were expressing significant concerns regarding the stress they were feeling as a
result of being expected to learn and implement new curricula that the district had recently
purchased. Moreover, as the well-being data reveals, the overall average score for program
participants on the PHQ-9 Depression Scale during the first session was mild depression. In
short, people weren’t doing so hot. The fact that the program was designed to provide
educators with ample access to empirically proven strategies to improve resilience and well-
being was likely one of the reasons for its success.
While it may seem mundane, the consistent logistical smoothness of the program may
have been another contributing factor in participants’ positive experience. Thanks to the HR
staff with whom I collaborated, participants were provided with hearty meals, a comfortable
learning environment, regular communications, and a program schedule that was clearly
published by the time they had signed up to take part in the program. The fact that the logistics
of the program were conducive to participant engagement meant that educators in the program
were able to engage deeply with the content of the program.
With respect to the evidence of program attendance, there are a number of reasons
that help explain the outcomes outlined above. In the teacher tracks, we saw that
approximately 65% of teachers who attended the first session persisted in the program through
to the end of the year. This is in line with the rate of attrition I observed during the 2018–19
school year in Boston Public Schools. Over the course of the year, various teachers let me know
that they needed to leave the program because their lives had gotten particularly busy or
because their schedules had changed. Other teachers simply stopped showing up. There are a
variety of understandable reasons why this might be the case: The program (and the homework
assignments that teachers were expected to complete in between sessions) represented a
substantial commitment for professionals who already had a lot on their plates. Additionally,

69
while no one reported this to me directly, it could be the case that some percentage of the
teachers who left the program were dissatisfied with the quality of my facilitation or found that
the program wasn’t meeting their expectations.
What I found particularly illuminating was the more substantial decline among
participants in the administrator track. Upon reflection, however, this made sense. For one,
there is not the same structural incentive for administrators to earn graduate units. Whereas
teachers are able to move into progressively higher pay ranges as they earn more units, the
same is not true for administrators. Second, based on my communication with principals
throughout the course of facilitating the program, it was clear that the program was more
difficult for certain administrators to attend because of after-school obligations that arose. One
principal, for instance, consistently needed to meet with her School Site Council during the time
when sessions were scheduled to meet. An assistant principal in the program found that
unexpected meetings with parents to discuss disciplinary issues regularly prevented him from
attending. Finally, a small number of principals expressed a disinclination to take part because
other people in their management line (assistant principals, instructional coaches at their school
sites) were also in the sessions, so they felt that they were not able to speak freely or engage
with the level of vulnerability that would have enabled them to maximize the value of the
program.
Evidence: Valuing Educators Thriving
In my Theory of Action, I make the assumption that, if I execute my plan effectively, a
program such as Educators Thriving would come to be valued by senior leaders within SUSD
because it adds significant value for educators throughout the system. Additionally, I assumed
that the program would give SUSD a reputation for being a district that engages in innovative
programming to develop and retain staff members.

70
At the time of this writing, both of these intended outcomes appear to have come
about. Superintendent Deasy and Nik Howard, the interim leader of the Human Resources
Department, have both expressed a desire for Educators Thriving to continue as a program
offering in the future. The same is true for many of the participants in the program as well as
leadership in the Stockton Teachers Association. Currently, the SUSD’s budget is being cut by
approximately twelve million dollars, so the district is putting a freeze on new programmatic
investments. In response, Mr. Howard has expressed the hope of securing philanthropic
resources that would allow the program to continue in SUSD into the 2020–21 school year and
possibly beyond.
Additionally, evidence suggests that the Educators Thriving program is increasing
positive perception of SUSD throughout the broader community. For instance, instructors in the
Teacher’s College of San Joaquin credentialing programs have told me and others in the district,
on several occasions, that they hear positive feedback about the program from their students.
Analysis: Valuing Educators Thriving
There are a variety of reasons why leaders throughout SUSD appear to value the
Educators Thriving program. One reason is simple: senior leadership’s genuine commitment to
providing innovative supports for educators to achieve well-being. In Superintendent Deasy’s
letter outlining his plan for creating change in the district, he articulates the need for the district
to “invest deeply in the support and conditions for our employees” (Deasy, 2019b, p. 4). This
commitment isn’t just lip service. Superintendent Deasy, Assistant Superintendent Sonjhia
Lowery, HR leader Nik Howard, and others have acted in alignment with the district’s imperative
to support employees and create the conditions in which they can succeed by connecting me
with union leadership, allowing me substantial airtime during all-district administrator events,
and furnishing the necessary financial resources.

71
Another reason why senior leaders in the district appear to value the program is that
evidence suggests it meets a significant need. The fact that nearly 300 educators applied to take
part shows that there is a hunger among educators in the district for the type of development
the program offers. Additionally, the positive feedback about the program and the
improvements in participant well-being were reasons for the belief among senior leaders that
such a program would be valuable going forward.
In terms of my own efforts, one of the key contributing factors was likely that I built the
program with others in the district. During the initial, design phase of the residency, I
consistently asked for feedback from leaders throughout the district, thanked them for their
input, and actively incorporated the changes they suggested into the plan being formulated.
Over the course of the year, I kept senior leaders in the district informed about the progress we
were making: I shared information about the number of applications, participant feedback, and
initial outcomes related to increases in the well-being of participants.
Finally, the participants themselves helped to raise the profile of the program in the
eyes of education leaders throughout the community. Participants shared openly and
enthusiastically about the benefits of the program, telling their friends, families, site
administrators, and teacher-education program leaders about their positive experience.

72
Implications for Self
The analysis above leads me to a number of reflections about my leadership moving
forward. First, I’m interested in more deeply analyzing the impact of Educators Thriving. The
primary goal this year was to design and execute an effective program. Based on the feedback
from participants, we achieved promising results. Early on in the residency, I deliberately
admitted as many people as possible into the program; one impact of this decision was that I
wouldn’t be executing a randomized controlled trial. Of course, this decision made it difficult if
not impossible to make causal claims about the efficacy of the program. In the future, I hope to
run a randomized controlled trial to assess the impact of the program. Or, short of that, it would
be helpful to have a robust set of data about the well-being of a comparison group of teachers
at baseline and at later points in the school year. Thanks to the work I’ve had the opportunity to
do this year, I’ve developed elements of a program that can be replicated in the year ahead: a
survey to assess participant well-being, recruitment materials, and session plans that I can
reuse. In the future, I can leverage these resources to spend less time on program design and
more time assessing and analyzing the impact of the program.
Second, I didn’t achieve the impact I had hoped for with school principals. Fewer
principals applied for the program than I had hoped, and more principals dropped out than I
would have liked. This is disappointing because school principals are among the employees who
are best positioned to improve the conditions for teachers and students at their school sites:
They can efficiently incorporate the strategies and practices of Educators Thriving into the daily
rhythm and operation of their schools. My experience this year showed me that it may not be
feasible for school leaders to take part in as time-intensive of an iteration of the program as the
one I executed this year due to their workload. Moreover, because the salary of school leaders
does not increase with the acquisition of graduate units, the incentive to earn units can’t be

73
relied upon as a reason for principals to persist in the program. In the future, I plan to create a
tailored and streamlined version of the program just for school and system-level leaders. Such a
program could cover the key content more efficiently and place a greater focus on incorporating
strategies for achieving well-being into the ongoing operation of schools, departments, or the
district as a whole.
On a personal level, as I move forward as a leader in the education sector, I will keep in
mind the factors that accounted for the successes of Educators Thriving in SUSD. For instance, I
entered SUSD with a clear vision for the program but then communicated with a wide range of
people both inside and outside the district to gather input. The fact that I was able to design the
program with and alongside employees throughout the district is likely one of the reasons for
the success of the program and illustrates the importance of leading with a bold vision while
simultaneously operating in respectful and humble partnership with those I’m working
alongside.
I take another lesson from the participant feedback: I must model the level of
vulnerability I hope to see in others. On numerous occasions, teachers thanked me for sharing
transparently during the sessions about my own efforts—successful and unsuccessful—to
incorporate the content of the Educators Thriving program into my own life. Their appreciation
underscores the importance of practicing what I preach. Effective leadership lies in recognizing
that positional power “gives you no…immunity from the requirement to keep growing and
changing” (Kegan & Lahey, 2016, p. 108). Moreover, leading in this way felt good. Knowing that
my own transparent sharing positioned others to persevere in their own processes of growth
brought me a sense of deep satisfaction, one that reminds me why I’m so motivated by this
work.
74
Finally, my work this year reinforced my commitment to creating environments that
lead adults to achieve robust personal development that redounds to the benefit of young
people. I aspire to lead schools and school systems. One of the lessons I take from this year is
that I am committed to doing so in a way that is consistent with the principles of Educators
Thriving. Namely, I aspire to lead in a way that recognizes the imperative that we construct
spaces within our workplaces that enable employees to achieve transformational personal
growth. Based on comments from dozens of participants in the program, a virtuous cycle exists
between a person’s personal development and their professional capacity: As people develop
new habits of mind and new meaning-making capabilities, their potential to positively impact
students and collaborate constructively with colleagues increases dramatically. As their personal
lives are enriched, so too is their capacity for professional contribution. My experiences this year
have deepened my conviction that achieving educational equity for the most marginalized
young people will require deep and sustained investment in the personal development of those
adults who are charged with educating our youth. To achieve what I view as my life’s purpose—
working to ensure that all young people have the opportunity to rise to the heights of their God-
given potential—I know that supporting adults to achieve personal growth will remain an
essential element of my theory of change.

75
Implications for Site
Participants in the Educators Thriving program reported significant increases in their
well-being, their likelihood of staying in the teaching profession, their resilience, and their
confidence that they were making a positive impact with students. In short, the program
appears to have had a beneficial impact along dimensions aligned with the district’s core
priorities. A number of implications follow from these observations.
The first is that SUSD would be well-advised to find a way to continue providing
employees with access to a program such as Educators Thriving. Investing in the personal
development of employees appears to pay dividends. Based on comments from Education
Thriving participants, it seems clear that developing the psychological capabilities of employees
has the potential to improve their ability to change limiting mindsets, educate students, and
sustain the energy and resilience to persist in and enjoy the challenging work we do as
educators. Moreover, programs like Educators Thriving appear to meet a significant need. Based
solely on the number of people who applied for the program, it is evident that a significant
demand exists for this type of professional development. Furthermore, one interpretation of the
baseline survey data is that there is a specific profile of teacher who is particularly attracted to
and poised to benefit from a program like Educators Thriving: someone who knows that they
want to continue to work as an educator but who is struggling to achieve the well-being they
feel would enable them to persist for the long-haul. By tending to this segment of the
workforce, it’s reasonable to assume that we will increase the likelihood they do in fact stay and
contribute at higher levels.
Additionally, a program like Educators Thriving could give the district a competitive
advantage in its effort to recruit teachers. We know that the opportunity to make psychological
growth is one of the primary drivers of motivation in the workplace (Herzberg, 2003).

76
Presumably, teachers who are considering their options about where to teach would be more
likely to choose a district that is making a meaningful and systematic investment in facilitating
the psychological growth of its employees.
It could be the case that a program such as Educators Thriving leads to meaningful cost
savings for the district. For instance, we found that teachers in the Educators Thriving program
take 2.1% fewer days off for sickness, “personal reasons,” “discretionary reasons,” and
emergencies as compared to teachers of a similar level of tenure at the same school sites. This
reduction in absences would lead to a savings of $95,546 in substitute pay. While we can’t know
for sure, it’s reasonable to assume that the Educators Thriving program played a role in securing
these savings. Given that the district is and will be seeking ways to conserve financial resources,
this evidence suggests that SUSD should continue providing employees with access to a program
such as Educators Thriving. Moreover, leaders in the district could use results such as these to
justify their investment should they encounter any resistance. The district could consider going
even further to incentivize participation by paying teachers to take part.
Moving forward, I would encourage SUSD to continue to monitor outcomes for this
initial cohort. Eighty-six percent of the teachers in the program reported at least some level of
agreement with the statement that taking part the program made them more likely to stay in
the profession. In August 2020, after the school year is underway, it would be worthwhile for
the district to investigate whether there was in fact an increase in the retention rates for
employees who were part of the program as compared to those who were not. Here again, it
would not be possible to determine causality. After all, it could be the case that the program
merely attracted people who were already planning to stay in the profession at a higher rate.
However, it would be interesting to understand whether there is a correlation between
participation in the program and retention in the district.
77
My third suggestion would be that the district strengthen its data systems to better
understand the impact of a program such as Educators Thriving. The cumbersome nature of the
district’s data systems was one of the most significant impediments I encountered in assessing
the efficacy and impact of Educators Thriving. For instance, there is not a data system in the
district that would enable someone to efficiently answer the question, “What is the retention
rate of teachers in SUSD as a whole?” or “What is the retention rate at Chavez High School as
compared to Edison High School?” By not having the ability to answer such basic questions,
SUSD is missing out on opportunities to elevate bright spots of excellence and address areas of
concern. Additionally, it took substantial time and effort to come to what is still an unclear
understanding of the impact Educators Thriving may have had on student achievement results.
Strengthening data systems would position the district to more easily assess which programs are
associated with positive student outcomes and which do not have a strong return on
investment.
On a related point, the district would benefit from more systematically capturing
information about employee engagement and well-being. Whereas the district currently
monitors the climate and culture at various school sites for students through the use of a variety
of surveys, it is not yet implementing methods to assess the employee experience. Utilizing an
assessment such as the Gallup Q12 would position the district to celebrate and learn from
managers who are creating an engaged workforce and to clearly identify and support those who
are not.
Of course, putting these suggestions into practice is easier said than done. One reason
SUSD and so many other districts may be reluctant to fully embrace this work is that it can be
slow. It requires the mindset of a farmer in a world that expects the production rate of a factory.
It asks us to be diligent in tilling the fields and preparing them for a future harvest. But Stockton

78
knows a thing or two about the farmer’s mindset. The fields surrounding SUSD’s schools grow
the cherries, almonds, and potatoes that sustain our state and our country. Stockton knows how
to sow the seeds for a harvest that is, at the outset, just an unseen aspiration. I commend SUSD
for making the choice to embark on this type of work this year, and I urge the district to
continue.

79
Implications for Sector
Across the United States, schools and districts continue to fall short of providing young
people with an equitable education and a fair shot at reaching their potential. At the same time,
school districts are contending with teacher shortages. And the teachers that are on the job are
going on strike at an increasing rate. Those teachers are demanding better pay, yes, but also the
support they need to do their jobs well. In light of these harsh realities for the education sector,
it is important for us to think expansively about the supports we can put in place to help
educators stay in the profession and improve their performance on the job.
Countless districts have sought to honor “the whole child” by moving beyond a myopic
focus on academic achievement and considering student success through a more holistic, long-
term lens. On the basis of my work this year in SUSD, I believe that school systems across the
country would benefit from investing in programs that focus on the development of “the
whole teacher.” Rather than treating teachers like curriculum delivery machines, development
structures could be put in place to enable educators to achieve rich socio-emotional growth
themselves. Based on feedback from participants in the Educators Thriving program this year,
this growth would “trickle down” to students in important ways.
Moreover, based on my experiences leading the program in Boston and Stockton,
educators are hungry for this type of development. In both cities, demand for the training
dramatically exceeded expectations. According to Kegan and Lahey, “[R]esearch shows that the
single biggest cause of work burnout is not work over-load, but working too long without
experiencing your own personal development” (2). Teachers are wise to want this type of
development. Anecdotal comments from participants in the program reinforce this point: By
giving people the opportunity to grapple with and overcome their most significant personal
challenges, we unlock new potential for both personal and professional contribution.

80
Other benefits could also accrue to districts who make this type of investment. For
instance, it may well be the case that a program such as Educators Thriving can more than pay
for itself in the form of a reduced need for substitutes. Additionally, a program such as
Educators Thriving could provide a competitive advantage for talent recruitment. Many districts
around the country are in the midst of a heated competition for talent. Very often, they aren’t
able to raise their salaries to compete with surrounding districts; however, a program such as
Educators Thriving could provide a relatively low-cost means of attracting teachers to their
district.
My analysis found that the typical profile of a teacher who took part in the Educators
Thriving program is a teacher who a) wasn’t experiencing a high degree of well-being and b)
wanted to learn strategies to achieve improved well-being so as to persist in the profession.
Presumably, teachers who fit this profile exist in school districts throughout the country. In fact,
it’s reasonable to assume that there are teachers in most or all school districts who want to stay
in the teaching profession and who are cognizant that they are struggling to achieve well-being.
Making a systematic investment in the development of these teachers could bring substantial
return on investment.
One final implication for the education sector more broadly: There is an opportunity to
design and implement interventions that build on what is best and most promising from other
disciplines. Educators Thriving illustrates the power of incorporating empirically-proven
strategies from fields such as positive and clinical psychology into the work of schools and
districts. As we seek out new ways to improve our schools, we would benefit from looking
beyond the confines of the education sector.
81
Conclusion
The young people of Stockton face steep obstacles to realizing their potential. Currently,
only 30 percent of young people throughout the district have achieved proficiency in English
language arts, and only 21 percent are on grade level in math (California Department of
Education, 2019). And this is to say nothing of the challenges posed by poverty, racism, and
other forms of institutional oppression. Of course, Stockton isn’t the only community whose
youth are struggling to achieve. Districts across California and the country are also finding
themselves stymied again and again in their efforts to improve outcomes for young people.
Accelerating progress towards educational equity at scale will require a wide and
diverse set of solutions. Some advocate for curricular reform. Others suggest that we must
radically increase our financial investment in schools. Still others suggest that improved
outcomes will require firing and replacing many of the people who constitute the current
system. And then there are those who argue that progress will not be possible without a longer
school day and an extended school year. The list of potential levers for change is seemingly
endless. Amidst the din of conflicting theories, my experience this year has illuminated one
strategy that I believe could dramatically accelerate our ability to achieve equitable outcomes:
Incorporating empirically-proven strategies to maximize the growth and potential of the adults
who are charged with educating our youth. In the past few years, the fields of positive
psychology and adult development offered compelling evidence that adults are capable of
dramatically heightened levels of contribution and that it is possible to incorporate such
interventions system-wide.
The type of development I advocate is fundamentally different from many of the
traditional strategies we rely on to improve educational outcomes. It’s not about working longer
and longer to get the same—only more of it. Nor is it about improving the texts we teach. Of

82
course, there’s a place for these strategies of improvement. Increasing learning time could help.
And countless students would certainly benefit from better curricula. But those strategies are
not enough. Many districts have implemented such solutions only to find that they continue to
come up short. In light of this, I believe it’s imperative that we add a new arrow to our quiver of
traditional strategies: personal development.
The arrow metaphor, however, comes up short. Personal development that grounds us
in our strengths, clarifies our vision, roots us in our values, and liberates us from our limiting
assumptions is a strategy of a different kind. It equips us to operate in a way driven less by fear
and more by a positive vision, less by unconscious compulsions and more by a deliberately
chosen sense of purpose. It’s a strategy for improvement that equips those who engage in it
with new and expanded capacities. And in expanding our capacities, this type of development
magnifies the impact of the other strategies we so often rely upon. We don’t just read a richer
text with students; we see—and support our students to see—deeper meaning. We don’t just
work a longer school day; we make more of every minute.
Unfortunately, however, our current workplaces do little to systematically enable
employees to develop new and more complex modes of operating and making meaning. Kegan
and Lahey observe in An Everyone Culture that most people in most organizations are “doing a
second job no one is paying them for…Most people are spending time and energy covering up
their weaknesses…hiding their inadequacies, hiding their uncertainties, hiding their limitations.
Hiding” (2016, p. 1). In some small and imperfect way, the Educators Thriving program offered a
group of educators in Stockton an opportunity to come out of hiding. These educators had the
chance to practice a core set of skills designed to improve well-being and unlock new capacities
for contribution.

83
Let’s face it: the likelihood of a massive influx of school funding isn’t high. And as I allude
to above, we’re unlikely to see radical change by doing the same thing over and over again, only
until five PM rather than three PM. But imagine what could come from a deep and sustained
commitment to expanding the capabilities of the adults who make up our system—largely the
same group of people who will be making up our school systems five and ten years hence.
Imagine us so thoroughly incorporating practices that facilitate adult development into
the design of our school districts that merely showing up to work leads people to continually
identify and expand their strengths while confronting and overcoming their limitations. This
vision would not require a dramatic influx of tax revenue. Nor would it require navigating
objections from labor unions. In fact, teachers unions have championed the Educators Thriving
program at every turn. No, the key ingredient this vision would require—and this is in fact a
significant departure from our prevailing reality—is a bedrock belief that the same adults who
constitute the current, low-performing system are capable of reaching substantially new heights
of contribution. We will need leaders who dare to believe so fervently in the potential of adults
to overcome their limitations that they commit to building systems that habitually and reliably
support adults to courageously confront their familiar, unproductive patterns of behavior and
instead forge new habits and psychological capabilities that enable those same educators to give
their students the education that they deserve.

84
Bibliography
Allegretto, S. A., & Mishel, L. (2016). The Teacher Pay Gap Is Wider than Ever: Teachers’ Pay
Continues to Fall Further behind Pay of Comparable Workers. Economic Policy Institute.
https://eric.ed.gov/?id=ED568892
Barnum, M. (2016, August 22). Why Teacher Pay Matters: Recruitment and Retention Can
Improve Results. https://www.the74million.org/article/why-teacher-pay-matters-
recruitment-and-retention-can-improve-results/
California Department of Education. (2019). 2019 View Smarter Balanced Test Results at a
Glance. https://caaspp-
elpac.cde.ca.gov/caaspp/DashViewReport?ps=true&lstTestYear=2019&lstTestType=B&l
stGroup=1&lstSubGroup=1&lstGrade=13&lstSchoolType=A&lstCounty=39&lstDistrict=6
8676-000&lstSchool=0000000&lstFocus=a
CARE for Teachers. (2019). Garrison Institute. https://www.garrisoninstitute.org/programs-
retreats/care-for-the-caregivers/care-for-teachers/
Cheng, A., Henderson, M., Peterson, P., & West, M. (2018, August 21). Public Support Climbs for
Teacher Pay, School Expenditures, Charter Schools, and Universal Vouchers: Results from
the 2018 EdNextPoll. Education Next. https://www.educationnext.org/public-support-
climbs-teacher-pay-school-expenditures-charter-schools-universal-vouchers-2018-
ednext-poll/
Christie, J. (2012, July 3). How Stockton went broke: A 15-year spending binge. Reuters.
https://www.reuters.com/article/us-stockton-bankruptcy-cause-
idUSBRE8621DL20120703
Darling-Hammond, L., Sutcher, L., & Carver-Thomas, D. (2018). Teacher Shortages in California:
Status, Sources, and Potential Solutions. Learning Policy Institute.

85
https://learningpolicyinstitute.org/product/teacher-shortages-ca-solutions-brief
Deasy, J. (2019). Where do we go from here?
https://www.stocktonusd.net/cms/lib/CA01902791/Centricity/Domain/142/Where%20
Do%20We%20Go%20From%20Here.pdf
Deasy, J. (2019, September 6). Re: Good news [Personal communication].
García, E., & Weiss, E. (2019). The teacher shortage is real, large and growing, and worse than
we thought. Economic Policy Institute. https://www.epi.org/publication/the-teacher-
shortage-is-real-large-and-growing-and-worse-than-we-thought-the-first-report-in-the-
perfect-storm-in-the-teacher-labor-market-series/
Garofoli, J. (2019, December 11). Mike Bloomberg, trying to win converts in California, gets an
event with Jerry Brown. SFChronicle.Com.
https://www.sfchronicle.com/politics/article/Mike-Bloomberg-wins-key-backing-in-
California-and-14897154.php
Goldstein, D. (2014). The teacher wars: A history of America’s most embattled profession (First
edition.). Doubleday.
Gray, L., & Taie, S. (2015). Public School Teacher Attrition and Mobility in the First Five Years:
Results from the First through Fifth Waves of the 2007-08 Beginning Teacher
Longitudinal Study. First Look. NCES 2015-337. National Center for Education Statistics.
https://eric.ed.gov/?id=ED556348
Hamre, B. K., & Pianta, R. C. (2001). Early Teacher-Child Relationships and the Trajectory of
Children’s School Outcomes Through Eighth Grade. Child Development, 72(2), 625–638.
JSTOR.
Harris, K. (2019, March 26). America’s Teachers Deserve a Raise | Full Policy. Kamala Harris For
The People. https://kamalaharris.org/policies/teachers/full-policy/

86
Heifetz, R. A. (2002). Leadership on the Line: Staying Alive Through the Dangers of Leading.
Harvard Business School Press.
Herman, K. C., Hickmon-Rosa, J., & Reinke, W. M. (2018). Empirically Derived Profiles of Teacher
Stress, Burnout, Self-Efficacy, and Coping and Associated Student Outcomes. Journal of
Positive Behavior Interventions, 20(2), 90–100.
https://doi.org/10.1177/1098300717732066
Herzberg, F. (2003). One More Time: How Do You Motivate Employees? Harvard Business
Review, 81(1), 87–96.
Iacus, S. M., King, G., & Porro, G. (2012). Causal Inference without Balance Checking: Coarsened
Exact Matching. Political Analysis, 20(1), 1–24. https://doi.org/10.1093/pan/mpr013
Ingersoll, R., & Merrill, L. (2013). Seven Trends: The Transformation of the Teaching Force [Data
set]. Consortium for Policy Research in Education. https://doi.org/10.1037/e579212012-
001
Johnson, S., Cooper, C., Cartwright, S., Donald, I., & al, et. (2005). The experience of work-
related stress across occupations. Journal of Managerial Psychology; Bradford, 20(1/2),
178–187.
Johnson, S. M. (2019). Where teachers thrive: Organizing schools for success. Harvard Education
Press.
Kegan, R. (2009). Immunity to change: How to overcome it and unlock potential in yourself and
your organization. Harvard Business Press.
Kegan, R., Lahey, L., Fleming, A., Miller, M., & Markus, I. (2014). The Deliberately Developmental
Organization (p. 15). Way To Grow Inc.
Kegan, R., & Lahey, L. L. (2016). An Everyone Culture: Becoming a Deliberately Developmental
Organization. Harvard Business Review Press.

87
Kulash, T. (2013, August 15). 25 percent do not change bad health habits after heart attack,
stroke. STLtoday.Com. https://www.stltoday.com/lifestyles/health-med-fit/percent-do-
not-change-bad-health-habits-after-heart-attack/article_f30164af-2368-5cf5-8bdc-
3f641a7607b8.html
Learning Policy Institute. (2017, September 13). What’s the Cost of Teacher Turnover? Learning
Policy Institute. https://learningpolicyinstitute.org/product/the-cost-of-teacher-
turnover
Learning Policy Institute. (2019, December 5). Interactive Map: Understanding Teacher
Shortages in California. https://learningpolicyinstitute.org/product/interactive-map-
understanding-teacher-shortages-california
Linos, E., Ruffini, K., & Wilcoxen, S. (2019). Belonging Affirmation Reduces Employee Burnout
and Resignations in Front Line Workers. ResearchGate.
http://dx.doi.org/10.13140/RG.2.2.21546.36801
Lyubomirsky, S., King, L., & Diener, E. (2005). The benefits of frequent positive affect: Does
happiness lead to success? 131(6), 803–855. https://doi.org/10.1037/0033-
2909.131.6.803
Lyubomirsky, Sonja. (2007). The how of happiness: A scientific approach to getting the life you
want. Penguin Press.
Lyubomirsky, Sonja, Sheldon, K. M., & Schkade, D. (2005). Pursuing Happiness: The Architecture
of Sustainable Change. Review of General Psychology, 9(2), 111–131.
https://doi.org/10.1037/1089-2680.9.2.111
Moir, E. (1990). Phases of first-year teaching. California New Teacher Project Newsletter.
O’Malley Greenburg, Z. (2009, April 23). In Pictures: America’s Most Dangerous Cities. Forbes.
https://www.forbes.com/2009/04/23/most-dangerous-cities-lifestyle-real-estate-

88
dangerous-american-cities_slide.html#65192e85667e
Partelow, L. (2019, December 3). What To Make of Declining Enrollment in Teacher Preparation
Programs. Center for American Progress.
https://www.americanprogress.org/issues/education-k-
12/reports/2019/12/03/477311/make-declining-enrollment-teacher-preparation-
programs/
Pivot Learning. (2019). Whitepaper: Growth Culture — A New Approach to School Improvement.
Pivot Learning. https://www.pivotlearning.org/2019/09/new-whitepaper-growth-
culture-a-new-approach-to-school-improvement/
Ronfeldt, M., Loeb, S., & Wyckoff, J. (2013). How Teacher Turnover Harms Student Achievement.
American Educational Research Journal, 50(1), 4–36.
https://doi.org/10.3102/0002831212463813
Ross, J. (2018, June 6). California city fights poverty with guaranteed income. Reuters.
https://www.reuters.com/article/us-california-income-idUSKCN1J015D
Schwab, R. L., Jackson, S. E., & Schuler, R. S. (1986). Educator burnout: Sources and
consequences. Educational Research Quarterly, 10(3), 14–30.
Seligman, M. E. P. (2011). Flourish: A visionary new understanding of happiness and well-being
(1st Free Press hardcover ed.). Free Press.
Seligman, M. E. P., Steen, T. A., Park, N., & Peterson, C. (2005). Positive Psychology Progress:
Empirical Validation of Interventions. American Psychologist, 60(5), 410–421.
https://doi.org/10.1037/0003-066X.60.5.410
Shakespeare, W. (2015). The Winter’s Tale. Nick Hern Books.
The Teaching Well. (2019). The Teaching Well. http://www.theteachingwell.org
TNTP. (2015). The Mirage. TNTP. https://tntp.org/publications/view/the-mirage-confronting-

89
the-truth-about-our-quest-for-teacher-development
University of Michigan Medicine. (n.d.). PHQ-9* Questionnaire for Depression Scoring and
Interpretation Guide. Retrieved February 26, 2020, from
https://www.med.umich.edu/1info/FHP/practiceguides/depress/score.pdf

90
Appendices
Appendix A
Table A1
People I Consulted During the “Design and Invest” Phase of my Residency
Person Role
John Deasy Superintendent, SUSD
Nik Howard Executive Director, Human Capital Development
Erich Myers President, Stockton Teachers Association
Brooke Shields Administrator of Special Projects, Curriculum Department
Diane Carnahan, Sylvia
Turner, Michele Badovinac
Leadership of Teachers College of San Joaquin, a significant
pipeline of teacher talent for SUSD
Lange Luntao SUSD School board member
Lori Goldstein, Cate Rockstad,
and Robyn Zohbon Leadership of the SUSD Teacher Induction Program
Mong Thi Nguyen Director of Research & Accountability, SUSD
Sonjhia Lowery Assistant Superintendent, Educational Services
Mary Pedraza Principal of Hamilton Elementary, a school that has
historically struggled to retain teachers
Arielle Ayala Former SUSD teacher and leader of a program to support
educators to achieve well-being

91
Appendix B
Surveys Used
Maslach Burnout Inventory
The scale for all MBI scales is as follows: Never (0) A few times a year or less (1) Once a month or less (2) A few times a month (3) Once a week (4) A few times a week (5) Every day (6) Educators were provided with the following instructions: “If you are a teacher: When you see the word "recipients", please think of your students. If you are an administrator: When you see the word "recipients", please think of the educators you support.”
1. I feel exhilarated after working closely with my recipients
2. I have accomplished many worthwhile things in this job
3. I feel I’m positively influencing other people’s lives through my work
4. I can easily create a relaxed atmosphere with my recipients
5. I feel very energetic
6. I deal very effectively with the problems of my recipients
7. In my work I deal with emotional problems very calmly
8. I can easily understand how my recipients feel about things
9. I feel emotionally drained from my work
10. I feel used up at the end of the workday
11. I feel burned out from my work
12. I feel I’m working too hard on my job
13. I feel fatigued when I get up in the morning and have to face another day on the job
14. I’ve become more callous toward people since I took this job
15. I worry that this job is hardening me emotionally
16. I feel I treat some recipients as if they were impersonal objects
17. I don’t really care what happens to some recipients
18. Working with people directly puts too much stress on me
19. I feel recipients blame me for some of their problems
20. I feel frustrated by my job
21. Working with people all day is really a strain on me
Connor-Davidson Resilience Scale - 10
The scale for the Connor-Davidson Resilience Scales is as follows: Not true at all (0) Rarely true (1) Sometimes true (2) Often true (3) True nearly all the time (4)

92
Educators were provided with the following instructions: “Please indicate how much you agree with the following statements as they apply to you over the last month. If a particular situation has not occurred recently, answer according to how you think you would have felt.”
1. I am able to adapt when changes occur.
2. I can deal with whatever comes my way.
3. I try to see the humorous side of things when I am faced with problems.
4. Having to cope with stress can make me stronger.
5. I tend to bounce back after illness, injury, or other hardships
6. I believe I can achieve my goals, even if there are obstacles
7. Under pressure, I stay focused and think clearly
8. I am not easily discouraged by failure
9. I think of myself as a strong person when dealing with life’s challenges and difficulties
10. I am able to handle unpleasant or painful feelings like sadness, fear, and anger
Positive Emotion, Engagement, Relationships, Meaning, Accomplishments (PERMA)
The scale for the PERMA questionnaire is as follows: 0: Never/terrible/not at all 10: Always/excellent/completely
1. How often do you feel you are making progress towards accomplishing your work-
related goals?
2. At work, how often do you become absorbed in what you are doing?
3. At work, how often do you feel joyful?
4. At work, how often do you feel anxious?
5. How often do you achieve the important work goals you have set for yourself?
6. How would you say your health is?
7. To what extent is your work purposeful and meaningful?
8. To what extent do you receive help and support from coworkers when you need it?
9. In general, to what extent do you feel that what you do at work is valuable and
worthwhile?
10. To what extent do you feel excited and interested in your work?
11. How lonely do you feel at work?
12. How satisfied are you with your current physical health?
13. At work, how often do you feel positive?
14. At work, how often do you feel angry?
15. How often are you able to handle your work-related responsibilities?
16. At work, how often do you feel sad?
17. At work, how often do you lose track of time while doing something you enjoy?

93
18. Compared to others of your same age and sex, how is your health?
19. To what extent do you feel appreciated by your coworkers?
20. To what extent do you generally feel that you have a sense of direction in your work?
21. How satisfied are you with your professional relationships?
22. At work, to what extent do you feel contented?
23. Taking all things together, how happy would you say you are with your work?
Patient Health Questionnaire - 9
The scale for the Patient Health Questionnaire is as follows: Not at all (0) Several days (1) More than half the days (2) Nearly every day (3) Instructions: Over the last 2 weeks, how often have you been bothered by any of the following problems?
1. Little interest or pleasure in doing things
2. Feeling sad, depressed, or hopeless
3. Trouble falling or staying asleep, or sleeping too much
4. Feeling tired or having little energy
5. Poor appetite or eating too much (overeating)
6. Feeling bad about yourself— or that you are a failure or have let yourself or your family
down
7. Trouble concentrating on things, such as reading the newspaper or watching television
8. Moving or speaking so slowly that other people could have noticed. Or the opposite —
being so fidgety, nervous or restless that you have been moving around a lot more than
usual
9. Thoughts that you would be better off dead, or of hurting yourself
Generalized Anxiety Disorder - 7
The scale for the Generalized Anxiety Disorder is as follows: Not at all (0) Several days (1) More than half the days (2) Nearly every day (3) Instructions: Over the last 2 weeks, how often have you been bothered by any of the following problems?
1. Feeling nervous, anxious, restless, or uneasy
2. Not being able to stop or control worrying about things
3. Worrying too much about different things
4. Trouble relaxing
5. Being so restless or uneasy that it’s hard to sit still
6. Becoming easily annoyed or irritable
7. Feeling afraid as if something bad might happen

94
Subjective happiness scale
Instructions: For each of the following statements and/or questions, please select the point on the scale that you feel is most appropriate in describing you.
1. In general, I consider myself:
Not a very happy person 1 2 3 4 5 6 7 A very happy person
2. Compared with most of my peers, I consider myself:
Less happy 1 2 3 4 5 6 7 More happy
3. Some people are generally very happy. They enjoy life regardless of what is going on, getting
the most out of everything. To what extent does this characterization describe you?
Not at all 1 2 3 4 5 6 7 A great deal
4. Some people are generally not very happy. Although they are not depressed, they never
seem as happy as they might be. To what extent does this characterization describe you?
Not at all 1 2 3 4 5 6 7 A great deal
Job satisfaction
Taking everything into consideration, how do you feel about your job as a whole?
Extremely dissatisfied 1 2 3 4 5 6 7 Extremely satisfied
Retention
How long do you plan to remain in the position of a preK-12 educator?
● As long as I am able
● Until I am eligible for retirement benefits from this job
● Until a specific life event occurs (e.g., parenthood, marriage)
● Until a more desirable job opportunity comes along
● Definitely plan to leave as soon as I can
● Undecided at this time
To what extent do you agree with the following statements?
The options for the items below was the following: Strongly disagree • Somewhat disagree • Neither agree nor disagree • Somewhat agree • Strongly agree
● I plan to stay a preK-12 educator for at least five years
● I plan to stay at my school for at least five years
● I plan to stay at Stockton Unified School District for at least five years
● If I could get a higher paying job, I’d leave education
● I think about transferring to another school district

95
In the last 12 months, have you applied for a job in an attempt to leave the position of a preK-12
educator?
● Yes
● No
In the last 12 months, to what extent have you considered applying for a job in an attempt to
leave the position of a preK-12 educator?
Not at all 1 2 3 4 5 Very much

96
Appendix C
Table C1
Educators Thriving Program Content
Session Focus
1: Late August
General introduction & the five pitfalls. Participants were given an overview of the program. We discussed five common pitfalls that make sustainability and well-being challenging for early-career educators: overwhelm, personal neglect, a fixed mindset, unexpected challenges, and isolation.
2. Early September
Effective prioritizing & leveraging implementation intentions. Participants learned about a framework they could utilize to ensure they are prioritizing not only what is urgent but also what is important for our long-term well-being. We also discussed research on effectively adopting new behaviors through a method known as implementation intentions.
3. Late September
Core values. Participants were guided to clarify the core values (e.g. family, achievement, faith) that matter most to them, and they were provided with a keychain that they could use to remember those values into the future.
4. Mid October
Purpose, goals, and vision for life and/or the classroom. Participants were guided to clarify a vision and set of goals for their life, for their classroom, or both.
5. Late October
Signature strengths. Participants were guided to understand their top strengths. A portion of this session was devoted to revisiting participants’ articulation of their purpose, goals, and/or vision from the previous session.
6. Mid November
Mindfulness meditation part 1. Participants were instructed on foundational tools of mindfulness meditation and provided an explanation of the reason for the outsized importance of mindfulness in achieving well-being. This session and the second session on mindfulness meditation were facilitated primarily by JG Larochette, founder of The Mindful Life Program.
7. Early December
Immunity to change part 1. Participants were introduced to the field of adult development and guided to identify an improvement goal that they wanted to pursue.
8. Mid January
Mindfulness meditation part 2. Participants had a second opportunity to practice and extend the skills of mindfulness meditation that they learned in session six.
9. Late January
Immunity to change part 2. Participants were guided to create a full Immunity to Change map and to design a test of their “big assumptions.”

97
10. Early February
Immunity to change part 3. Participants revised the tests that they drafted of their big assumptions and prepared to both run the tests and reflect on their results.
11. Late February
Program synthesis. Participants reviewed the strategies we covered over the course of the year and reflected on their personal changes over the course of the year.
12. Mid March
Positive relationships & celebration. Participants reviewed research literature about the interconnectedness of positive relationships to well-being and considered how they might want to act on this knowledge. Lastly, we celebrated and appreciated one another at the conclusion of our year together.

98
Appendix D
The content of each session varied in the ways outlined in Appendix C. However, each session
followed a relatively similar structure. A high-level version of that structure is outlined in Table
D1 below.
Table D1
Typical Session Structure
When What
5 minutes Mingling, grabbing a bite to each, and re-connecting
2 minutes Welcome + agenda-setting
7 minutes Checking in with table groups
5 minutes Program announcements + review of feedback from the previous session
10–20 minutes Homework review and reflection on the previous session
60 minutes Session content
5 minutes Survey feedback
10 minutes Clean up + closing gratitude circle

99
Appendix E
Figure E1
Educators Thriving Stockton Flyer—Front

100
Figure E2
Educators Thriving Stockton Flyer—Back

101
Appendix F
Educators Thriving Stockton Recruitment Video
To watch the full video, head to http://tinyurl.com/EdThriveVid
Figure F1
Recruitment Video Screenshot
Figure F2
Recruitment Video Closing Screen

102
Appendix G
Figure G1
End-of-Session Feedback Form Part 1

103
Figure G2
End-of-Session Feedback Form Part 2

104
Appendix H
Figure H1
Example Homework Assignment

105
Figure H2
Example Homework Assignment