Embed Size (px)
Citation preview
The Astrophysical Journal, 699:1229–1241, 2009 July 10 doi:10.1088/0004-637X/699/2/1229C© 2009. The American Astronomical Society. All rights reserved. Printed in the U.S.A.
THE WHITE DWARF IN EM CYGNI: BEYOND THE VEIL∗
Patrick Godon1,4
, Edward M. Sion1, Paul E. Barrett
2, and Albert P. Linnell
31 Department of Astronomy and Astrophysics, Villanova University, Villanova, PA 19085, USA; [email protected], [email protected]
2 United States Naval Observatory, Washington, DC 20392, USA; [email protected] Department of Astronomy, University of Washington, Seattle, WA 98195, USA; [email protected]
Received 2009 February 19; accepted 2009 May 5; published 2009 June 19
ABSTRACT
We present a spectral analysis of the Far Ultraviolet Spectroscopic Explorer (FUSE) spectra of the eclipsingdouble-line spectroscopic binary EM Cygni (EM Cyg), a Z Cam DN system. The FUSE spectrum, obtained inquiescence, consists of four individual exposures (orbits): two exposures, at orbital phases φ ∼ 0.65 and φ ∼ 0.90,have a lower flux; and two exposures, at orbital phases φ = 0.15 and 0.45, have a relatively higher flux. Thechange of flux level as a function of the orbital phase is consistent with the stream material (flowing over andbelow the disk from the hot spot region to smaller radii) partially masking the white dwarf. We carry out aspectral analysis of the FUSE data, obtained at phase 0.45 (when the flux is maximal), using synthetic spectragenerated with the codes TLUSTY and SYNSPEC. Using a single white dwarf spectral component, we obtaina white dwarf temperature of 40,000 K ± 1000 K, rotating at 100 km s−1. The white dwarf, or conceivably,the material overflowing the disk rim, shows suprasolar abundances of silicon, sulphur, and possibly nitrogen.Using a white dwarf+disk composite model, we obtain that the white dwarf temperature could be even as highas 50,000 K, contributing more than 90% of the FUV flux, and the disk contributing less than 10% must have amass accretion rate reaching 10−10 M� yr−1. The single white dwarf model fits the absorption lines better thanthe white dwarf+disk model, but the white dwarf+disk model fits better the continuum in the shorter wavelengths.In both cases, however, we obtain that the white dwarf temperature is much higher than previously estimated.We emphasize the importance of modeling the spectra of EM Cyg around phase φ < 0.5, when the whitedwarf and disk are facing the observer, and we suggest that the discrepancy between the present analysis andprevious spectral analysis might be due to the occulting effect of the stream veiling the white dwarf and disk.
Key words: accretion, accretion disks – novae, cataclysmic variables – stars: individual (EM Cyg) – ultraviolet:stars – white dwarfs
Online-only material: color figures
1. INTRODUCTION
1.1. Dwarf Novae
Dwarf novae (DNe) are a class of nonmagnetic cataclysmicvariables (CVs) in which a white dwarf (WD) accretes matterfrom a main-sequence star (the secondary) filling its Roche lobeby means of an accretion disk. DN systems are characterizedmainly by their brightness variations, due to a periodic change inthe accretion rate. Ongoing accretion at a low rate (quiescence)is interrupted every few weeks to months by intense accretion(outburst) of days to weeks which increases the luminosity of thesystem (Hack & La Dous 1993; Warner 1995). This outburst isbelieved to be due to an instability in the disk (the disk instabilitymodel (DIM; Cannizzo 1998)), and it is known as a dwarf novaaccretion event (or dwarf nova outburst).
Due to their long-term accretion, the WDs in DNe havetemperatures ∼15,000–50,000 K (higher than field WDs), andtherefore peak in the far-ultraviolet (FUV). The long periods ofquiescence allow for long exposure observations (∼hr) cover-ing all the orbital phases (this is especially important for sys-tems with a high inclination, as the WD can be eclipsed ormasked at given orbital phases). Because of that, DNe, unlike
∗ Based on observations made with the NASA-CNES-CSA Far UltravioletSpectroscopic Explorer (FUSE). FUSE is operated for NASA by the JohnsHopkins University under NASA contract NAS5-32985.4 Visiting at the Space Telescope Science Institute, Baltimore, MD 21218,USA; [email protected]
other CVs, are ideal candidates to study the accreting WD,as during quiescence the WD is exposed in the FUV for longperiods of time. FUV spectroscopic observations are used todetermine the WD parameters such as temperature, gravity, ro-tational velocity, and chemical abundances. The disk mass ac-cretion rate of many systems can also be deduced accuratelyat given epochs of outburst or near outburst using spectralfitting techniques. In addition, DNe offer a fairly reliable es-timate of their distances via the absolute magnitude at max-imum versus orbital period relation (Warner 1995; Harrisonet al. 2004). As a consequence, DNe are ideal candidates toobserve, as one can more easily derive their system param-eters, which in turn can be used to test the theories of CVevolution.
Dwarf nova systems are further divided into sub-types: UGem systems, SU UMa systems, and Z Cam systems. TheU Gem systems are the typical DNe, i.e., with normal DNoutbursts; the SU UMas exhibit both normal DN outbursts, andsuperoutbursts, which are both longer in duration and higher inluminosity than normal DN outbursts; and the Z Cam systemshave standstills where they remain in a semi-outburst state fora long time (Ritter & Kolb 2003). The binary orbital periodin CV systems ranges from a fraction of an hour to about aday; however, there is a gap in the orbital period between 2and 3 hr where almost no CV systems are found: the periodgap. U Gem and Z Cam DN systems are found above theperiod gap, while the SU UMa DN systems are found below theperiod gap.
1229
Report Documentation Page Form ApprovedOMB No. 0704-0188
Public reporting burden for the collection of information is estimated to average 1 hour per response, including the time for reviewing instructions, searching existing data sources, gathering andmaintaining the data needed, and completing and reviewing the collection of information. Send comments regarding this burden estimate or any other aspect of this collection of information,including suggestions for reducing this burden, to Washington Headquarters Services, Directorate for Information Operations and Reports, 1215 Jefferson Davis Highway, Suite 1204, ArlingtonVA 22202-4302. Respondents should be aware that notwithstanding any other provision of law, no person shall be subject to a penalty for failing to comply with a collection of information if itdoes not display a currently valid OMB control number.
1. REPORT DATE 10 JUL 2009 2. REPORT TYPE
3. DATES COVERED 00-00-2009 to 00-00-2009
4. TITLE AND SUBTITLE The White Dwarf in EM Cygni: Beyond the Veil
5a. CONTRACT NUMBER
5b. GRANT NUMBER
5c. PROGRAM ELEMENT NUMBER
6. AUTHOR(S) 5d. PROJECT NUMBER
5e. TASK NUMBER
5f. WORK UNIT NUMBER
7. PERFORMING ORGANIZATION NAME(S) AND ADDRESS(ES) Department of Astronomy and Astrophysics,Villanova University,Villanova,PA,19085
8. PERFORMING ORGANIZATIONREPORT NUMBER
9. SPONSORING/MONITORING AGENCY NAME(S) AND ADDRESS(ES) 10. SPONSOR/MONITOR’S ACRONYM(S)
11. SPONSOR/MONITOR’S REPORT NUMBER(S)
12. DISTRIBUTION/AVAILABILITY STATEMENT Approved for public release; distribution unlimited
13. SUPPLEMENTARY NOTES
14. ABSTRACT
15. SUBJECT TERMS
16. SECURITY CLASSIFICATION OF: 17. LIMITATION OF ABSTRACT Same as
Report (SAR)
18. NUMBEROF PAGES
13
19a. NAME OFRESPONSIBLE PERSON
a. REPORT unclassified
b. ABSTRACT unclassified
c. THIS PAGE unclassified
Standard Form 298 (Rev. 8-98) Prescribed by ANSI Std Z39-18
1230 GODON ET AL. Vol. 699
Table 1System Parameters for EM Cyg
Parameter Value References
Porb 7 hr/0.29090912 days Mumford & Krezminski (1969)i 67 ± 2 deg North et al. (2000)Mwd 1 M� Welsh et al. (2007); Robinson (1974); Stover et al. (1981)M2nd 0.77 M� Welsh et al. (2007); Robinson (1974); Stover et al. (1981)d 350–500 pc Bailey (1981); Jameson et al. (1981); Welsh et al. (2005)Vmin 14.4 Spogli et al. (2003, 2005)Vmax 12.5 Spogli et al. (2003, 2005)DNO 14.6–16.5 s Stiening et al. (1982)2nd Spec. Type K3V North et al. (2000)Arkadash Spec. Type K2V–K5V North et al. (2000)Gal. Lat. b 4.◦277 SIMBADE(B − V) 0.05 ± 0.03 Verbunt (1987); La Dous (1991); Bruch & Engel (1994)
In this paper, we present the FUV spectral analysis of theeclipsing Z Cam system EM Cygni observed during quiescencewith FUSE.
1.2. EM Cygni System Parameters
First suspected to be related to CVs by Burbidge & Burbidge(1953), EM Cyg is a bright, double-lined spectroscopic binaryvariable (Kraft 1964). Its eclipses were discovered by Mum-ford & Krezminski (1969) and the orbital period was found tobe almost 7 hr (0.29090912 day). Its period was expected todecrease (by ∼10−11–10−10 days/cycle; Pringle 1975; Mum-ford 1980), however it has been found to be constant (Beuer-mann & Pakull 1984; Csizmadia et al. 2008) with an upperlimit P /P < 2.3 × 10⁻¹² day−1. Its outburst cycle is of theorder of 25 days and rapid coherent oscillations are detectedduring the late stages of outbursts with periods of the or-der of 14.6–16.5 s (see Stiening et al. 1982, and referencestherein).
EM Cyg is so far the only known Z Cam subtype eclipsing DNsystem. The eclipses are important as they allow, in theory atleast, for a detailed study of the system. In addition, becauseEM Cyg is an eclipsing system as well as a double-linedspectroscopic binary, it has been extensively studied (e.g.,Robinson 1974; Nevo & Sadeh 1978; Bailey 1981; Jamesonet al. 1981; Patterson 1981; Stover et al. 1981; Szkody 1981;see also Stiening et al. 1982). However, the determination of thestellar masses of the system by Robinson (1974) and Stover et al.(1981) was effected by the presence of a third star, Arkadash,5
along the line of sight (North et al. 2000). This third star is notrelated to the system. The most recent study (Welsh et al. 2007)indicates a mass ratio q = 0.77 and a WD mass Mwd = 1 M�.The distance found by Bailey (1981); Jameson et al. (1981),d ∼ 320–350 pc, could also be affected by the contribution ofArkadash in the red light, and Welsh et al. (2005) pointed outthat d could be as large as ∼450–500 pc. However, using themaximum magnitude at outburst versus orbital period relation(Warner 1995; Harrison et al. 2004), one finds a distance of∼400 pc (Winter & Sion 2003).
A recent broadband photometric study of the system (Spogliet al. 2003, 2005) shows that the magnitude of EM Cyg variesbetween V = 13.3 at minimum and V = 12.5 at maximum, it
5 The third star was named Arkadas (“friend” in Turkish) by Welsh et al.(2005), in memory of Janet (Hannula) Akyuz Mattei (1943–2004). JanetMattei determined an outburst cycle of 25 days for EM Cyg, and providedAAVSO data and information on the state of EM Cyg many times (e.g., Stoveret al. 1981; Stiening et al. 1982; North et al. 2000), as she did for manyvariable stars on countless occasions.
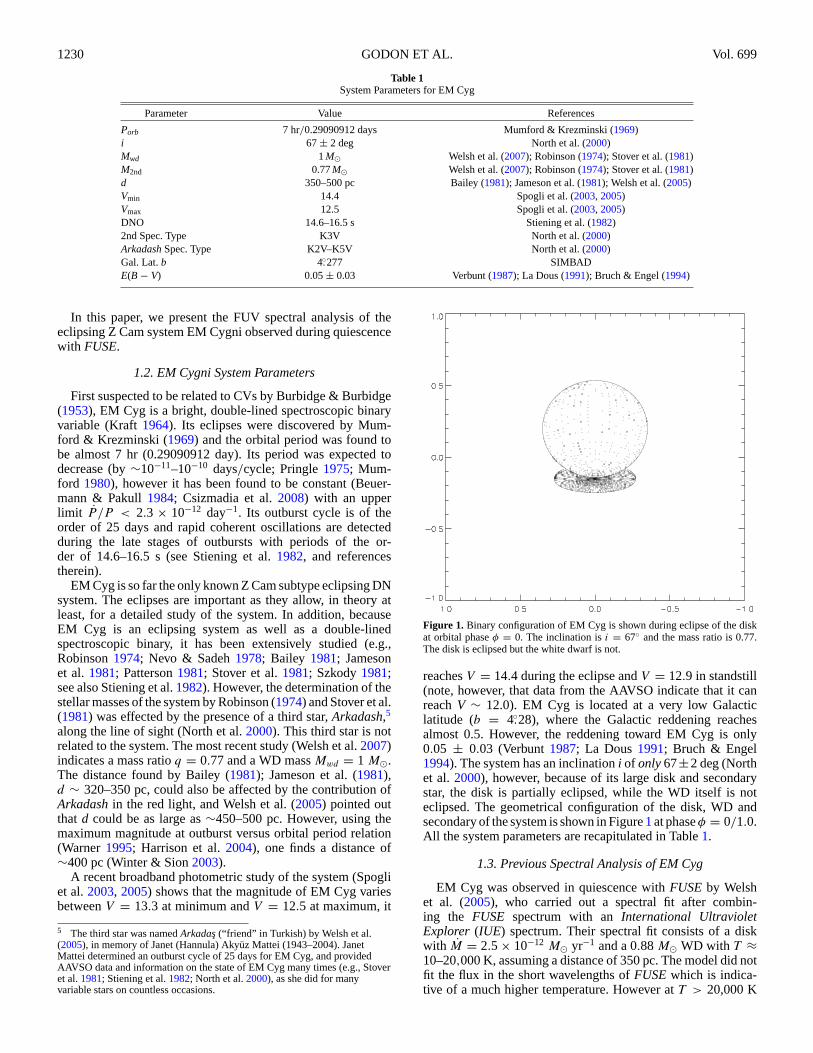
Figure 1. Binary configuration of EM Cyg is shown during eclipse of the diskat orbital phase φ = 0. The inclination is i = 67◦ and the mass ratio is 0.77.The disk is eclipsed but the white dwarf is not.
reaches V = 14.4 during the eclipse and V = 12.9 in standstill(note, however, that data from the AAVSO indicate that it canreach V ∼ 12.0). EM Cyg is located at a very low Galacticlatitude (b = 4.◦28), where the Galactic reddening reachesalmost 0.5. However, the reddening toward EM Cyg is only0.05 ± 0.03 (Verbunt 1987; La Dous 1991; Bruch & Engel1994). The system has an inclination i of only 67±2 deg (Northet al. 2000), however, because of its large disk and secondarystar, the disk is partially eclipsed, while the WD itself is noteclipsed. The geometrical configuration of the disk, WD andsecondary of the system is shown in Figure 1 at phase φ = 0/1.0.All the system parameters are recapitulated in Table 1.
1.3. Previous Spectral Analysis of EM Cyg
EM Cyg was observed in quiescence with FUSE by Welshet al. (2005), who carried out a spectral fit after combin-ing the FUSE spectrum with an International UltravioletExplorer (IUE) spectrum. Their spectral fit consists of a diskwith M = 2.5 × 10⁻¹² M� yr−1 and a 0.88 M� WD with T ≈10–20,000 K, assuming a distance of 350 pc. The model did notfit the flux in the short wavelengths of FUSE which is indica-tive of a much higher temperature. However at T > 20,000 K
No. 2, 2009 FUSE ANALYSIS OF EM Cyg 1231
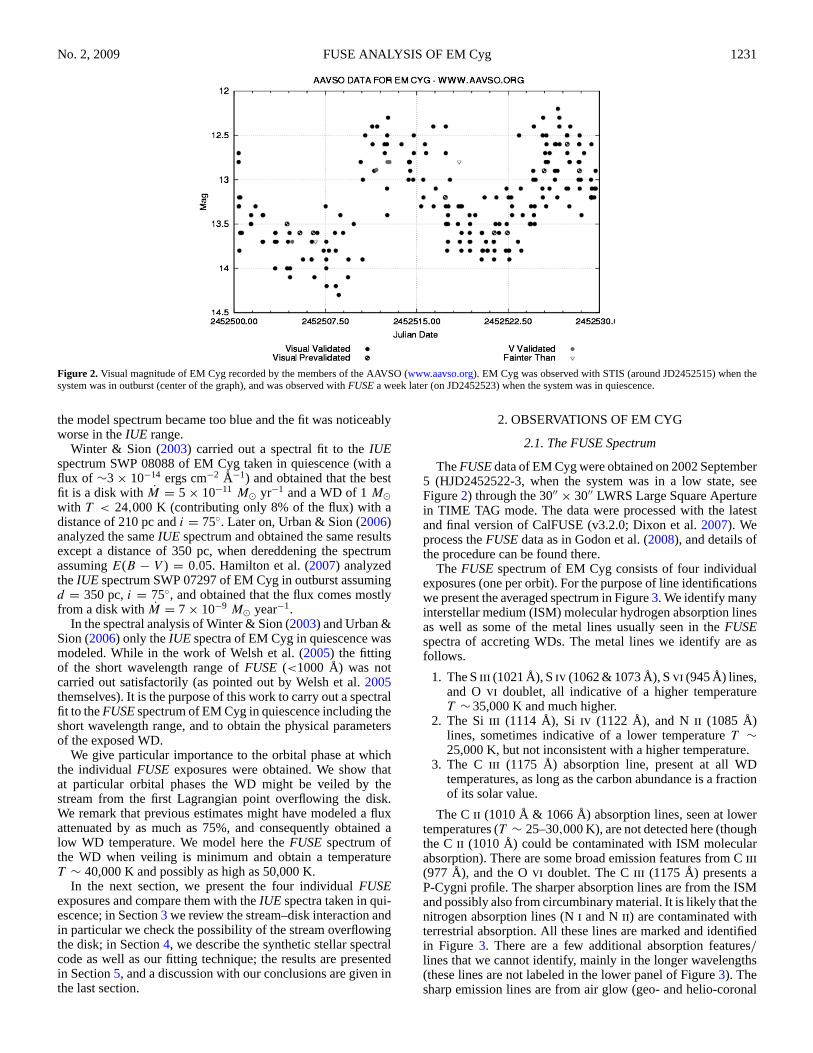
Figure 2. Visual magnitude of EM Cyg recorded by the members of the AAVSO (www.aavso.org). EM Cyg was observed with STIS (around JD2452515) when thesystem was in outburst (center of the graph), and was observed with FUSE a week later (on JD2452523) when the system was in quiescence.
the model spectrum became too blue and the fit was noticeablyworse in the IUE range.
Winter & Sion (2003) carried out a spectral fit to the IUEspectrum SWP 08088 of EM Cyg taken in quiescence (with aflux of ∼3 × 10⁻¹⁴ ergs cm−2 Å−1) and obtained that the bestfit is a disk with M = 5 × 10⁻¹¹ M� yr−1 and a WD of 1 M�with T < 24,000 K (contributing only 8% of the flux) with adistance of 210 pc and i = 75◦. Later on, Urban & Sion (2006)analyzed the same IUE spectrum and obtained the same resultsexcept a distance of 350 pc, when dereddening the spectrumassuming E(B − V ) = 0.05. Hamilton et al. (2007) analyzedthe IUE spectrum SWP 07297 of EM Cyg in outburst assumingd = 350 pc, i = 75◦, and obtained that the flux comes mostlyfrom a disk with M = 7 × 10⁻⁹ M� year−1.
In the spectral analysis of Winter & Sion (2003) and Urban &Sion (2006) only the IUE spectra of EM Cyg in quiescence wasmodeled. While in the work of Welsh et al. (2005) the fittingof the short wavelength range of FUSE (<1000 Å) was notcarried out satisfactorily (as pointed out by Welsh et al. 2005themselves). It is the purpose of this work to carry out a spectralfit to the FUSE spectrum of EM Cyg in quiescence including theshort wavelength range, and to obtain the physical parametersof the exposed WD.
We give particular importance to the orbital phase at whichthe individual FUSE exposures were obtained. We show thatat particular orbital phases the WD might be veiled by thestream from the first Lagrangian point overflowing the disk.We remark that previous estimates might have modeled a fluxattenuated by as much as 75%, and consequently obtained alow WD temperature. We model here the FUSE spectrum ofthe WD when veiling is minimum and obtain a temperatureT ∼ 40,000 K and possibly as high as 50,000 K.
In the next section, we present the four individual FUSEexposures and compare them with the IUE spectra taken in qui-escence; in Section 3 we review the stream–disk interaction andin particular we check the possibility of the stream overflowingthe disk; in Section 4, we describe the synthetic stellar spectralcode as well as our fitting technique; the results are presentedin Section 5, and a discussion with our conclusions are given inthe last section.
2. OBSERVATIONS OF EM CYG
2.1. The FUSE Spectrum
The FUSE data of EM Cyg were obtained on 2002 September5 (HJD2452522-3, when the system was in a low state, seeFigure 2) through the 30′′ × 30′′ LWRS Large Square Aperturein TIME TAG mode. The data were processed with the latestand final version of CalFUSE (v3.2.0; Dixon et al. 2007). Weprocess the FUSE data as in Godon et al. (2008), and details ofthe procedure can be found there.
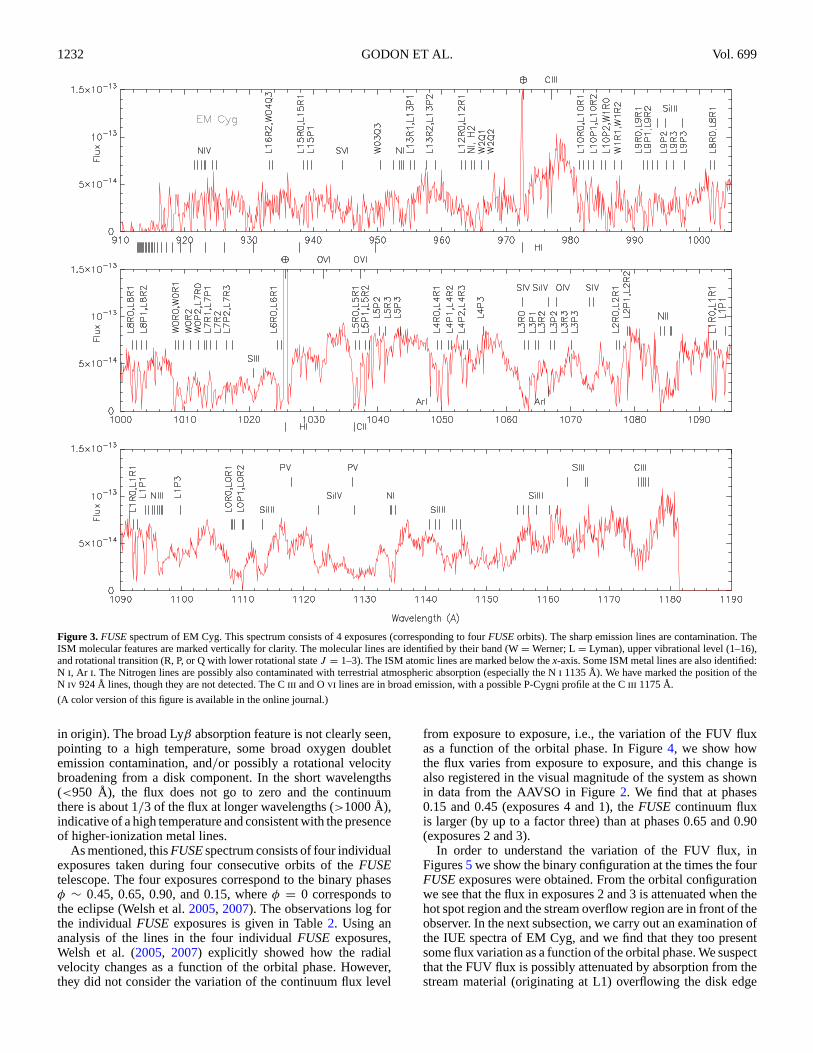
The FUSE spectrum of EM Cyg consists of four individualexposures (one per orbit). For the purpose of line identificationswe present the averaged spectrum in Figure 3. We identify manyinterstellar medium (ISM) molecular hydrogen absorption linesas well as some of the metal lines usually seen in the FUSEspectra of accreting WDs. The metal lines we identify are asfollows.
1. The S iii (1021 Å), S iv (1062 & 1073 Å), S vi (945 Å) lines,and O vi doublet, all indicative of a higher temperatureT ∼ 35,000 K and much higher.
2. The Si iii (1114 Å), Si iv (1122 Å), and N ii (1085 Å)lines, sometimes indicative of a lower temperature T ∼25,000 K, but not inconsistent with a higher temperature.
3. The C iii (1175 Å) absorption line, present at all WDtemperatures, as long as the carbon abundance is a fractionof its solar value.
The C ii (1010 Å & 1066 Å) absorption lines, seen at lowertemperatures (T ∼ 25–30,000 K), are not detected here (thoughthe C ii (1010 Å) could be contaminated with ISM molecularabsorption). There are some broad emission features from C iii
(977 Å), and the O vi doublet. The C iii (1175 Å) presents aP-Cygni profile. The sharper absorption lines are from the ISMand possibly also from circumbinary material. It is likely that thenitrogen absorption lines (N i and N ii) are contaminated withterrestrial absorption. All these lines are marked and identifiedin Figure 3. There are a few additional absorption features/lines that we cannot identify, mainly in the longer wavelengths(these lines are not labeled in the lower panel of Figure 3). Thesharp emission lines are from air glow (geo- and helio-coronal
1232 GODON ET AL. Vol. 699
Figure 3. FUSE spectrum of EM Cyg. This spectrum consists of 4 exposures (corresponding to four FUSE orbits). The sharp emission lines are contamination. TheISM molecular features are marked vertically for clarity. The molecular lines are identified by their band (W = Werner; L = Lyman), upper vibrational level (1–16),and rotational transition (R, P, or Q with lower rotational state J = 1–3). The ISM atomic lines are marked below the x-axis. Some ISM metal lines are also identified:N i, Ar i. The Nitrogen lines are possibly also contaminated with terrestrial atmospheric absorption (especially the N i 1135 Å). We have marked the position of theN iv 924 Å lines, though they are not detected. The C iii and O vi lines are in broad emission, with a possible P-Cygni profile at the C iii 1175 Å.
(A color version of this figure is available in the online journal.)
in origin). The broad Lyβ absorption feature is not clearly seen,pointing to a high temperature, some broad oxygen doubletemission contamination, and/or possibly a rotational velocitybroadening from a disk component. In the short wavelengths(<950 Å), the flux does not go to zero and the continuumthere is about 1/3 of the flux at longer wavelengths (>1000 Å),indicative of a high temperature and consistent with the presenceof higher-ionization metal lines.
As mentioned, this FUSE spectrum consists of four individualexposures taken during four consecutive orbits of the FUSEtelescope. The four exposures correspond to the binary phasesφ ∼ 0.45, 0.65, 0.90, and 0.15, where φ = 0 corresponds tothe eclipse (Welsh et al. 2005, 2007). The observations log forthe individual FUSE exposures is given in Table 2. Using ananalysis of the lines in the four individual FUSE exposures,Welsh et al. (2005, 2007) explicitly showed how the radialvelocity changes as a function of the orbital phase. However,they did not consider the variation of the continuum flux level
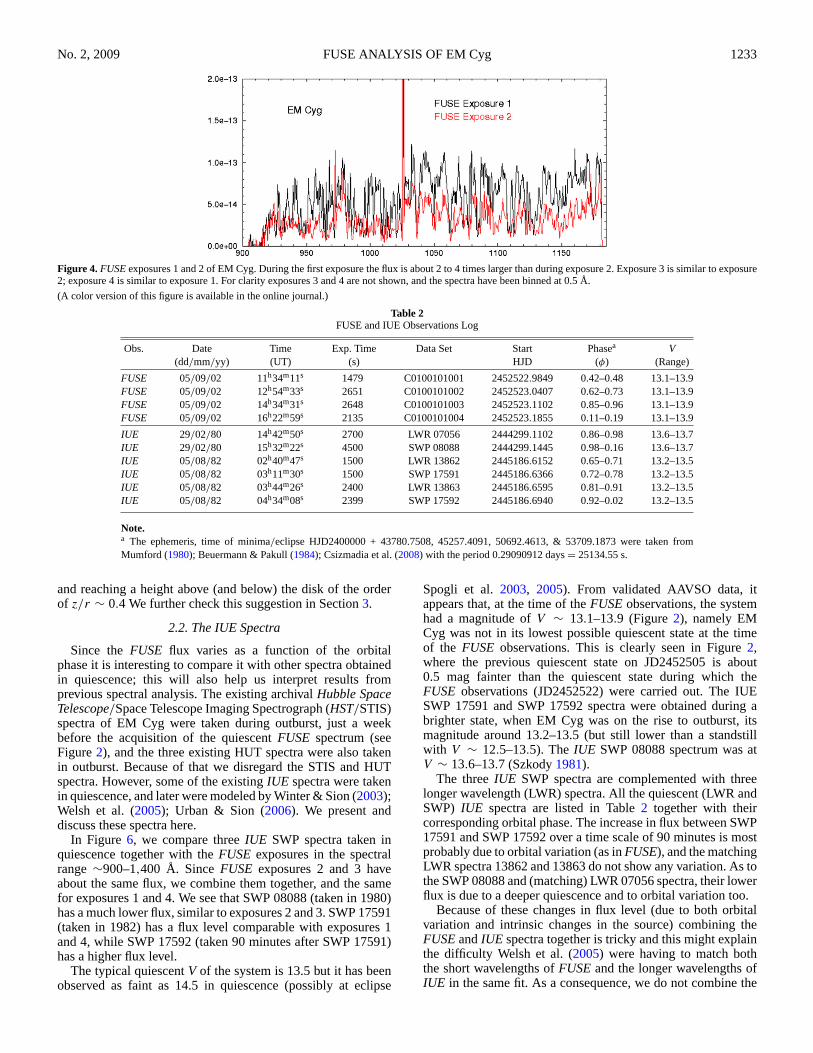
from exposure to exposure, i.e., the variation of the FUV fluxas a function of the orbital phase. In Figure 4, we show howthe flux varies from exposure to exposure, and this change isalso registered in the visual magnitude of the system as shownin data from the AAVSO in Figure 2. We find that at phases0.15 and 0.45 (exposures 4 and 1), the FUSE continuum fluxis larger (by up to a factor three) than at phases 0.65 and 0.90(exposures 2 and 3).
In order to understand the variation of the FUV flux, inFigures 5 we show the binary configuration at the times the fourFUSE exposures were obtained. From the orbital configurationwe see that the flux in exposures 2 and 3 is attenuated when thehot spot region and the stream overflow region are in front of theobserver. In the next subsection, we carry out an examination ofthe IUE spectra of EM Cyg, and we find that they too presentsome flux variation as a function of the orbital phase. We suspectthat the FUV flux is possibly attenuated by absorption from thestream material (originating at L1) overflowing the disk edge
No. 2, 2009 FUSE ANALYSIS OF EM Cyg 1233
Figure 4. FUSE exposures 1 and 2 of EM Cyg. During the first exposure the flux is about 2 to 4 times larger than during exposure 2. Exposure 3 is similar to exposure2; exposure 4 is similar to exposure 1. For clarity exposures 3 and 4 are not shown, and the spectra have been binned at 0.5 Å.
(A color version of this figure is available in the online journal.)
Table 2FUSE and IUE Observations Log
Obs. Date Time Exp. Time Data Set Start Phasea V(dd/mm/yy) (UT) (s) HJD (φ) (Range)
FUSE 05/09/02 11h34m11s 1479 C0100101001 2452522.9849 0.42–0.48 13.1–13.9FUSE 05/09/02 12h54m33s 2651 C0100101002 2452523.0407 0.62–0.73 13.1–13.9FUSE 05/09/02 14h34m31s 2648 C0100101003 2452523.1102 0.85–0.96 13.1–13.9FUSE 05/09/02 16h22m59s 2135 C0100101004 2452523.1855 0.11–0.19 13.1–13.9
IUE 29/02/80 14h42m50s 2700 LWR 07056 2444299.1102 0.86–0.98 13.6–13.7IUE 29/02/80 15h32m22s 4500 SWP 08088 2444299.1445 0.98–0.16 13.6–13.7IUE 05/08/82 02h40m47s 1500 LWR 13862 2445186.6152 0.65–0.71 13.2–13.5IUE 05/08/82 03h11m30s 1500 SWP 17591 2445186.6366 0.72–0.78 13.2–13.5IUE 05/08/82 03h44m26s 2400 LWR 13863 2445186.6595 0.81–0.91 13.2–13.5IUE 05/08/82 04h34m08s 2399 SWP 17592 2445186.6940 0.92–0.02 13.2–13.5
Note.a The ephemeris, time of minima/eclipse HJD2400000 + 43780.7508, 45257.4091, 50692.4613, & 53709.1873 were taken fromMumford (1980); Beuermann & Pakull (1984); Csizmadia et al. (2008) with the period 0.29090912 days = 25134.55 s.
and reaching a height above (and below) the disk of the orderof z/r ∼ 0.4 We further check this suggestion in Section 3.
2.2. The IUE Spectra
Since the FUSE flux varies as a function of the orbitalphase it is interesting to compare it with other spectra obtainedin quiescence; this will also help us interpret results fromprevious spectral analysis. The existing archival Hubble SpaceTelescope/Space Telescope Imaging Spectrograph (HST/STIS)spectra of EM Cyg were taken during outburst, just a weekbefore the acquisition of the quiescent FUSE spectrum (seeFigure 2), and the three existing HUT spectra were also takenin outburst. Because of that we disregard the STIS and HUTspectra. However, some of the existing IUE spectra were takenin quiescence, and later were modeled by Winter & Sion (2003);Welsh et al. (2005); Urban & Sion (2006). We present anddiscuss these spectra here.
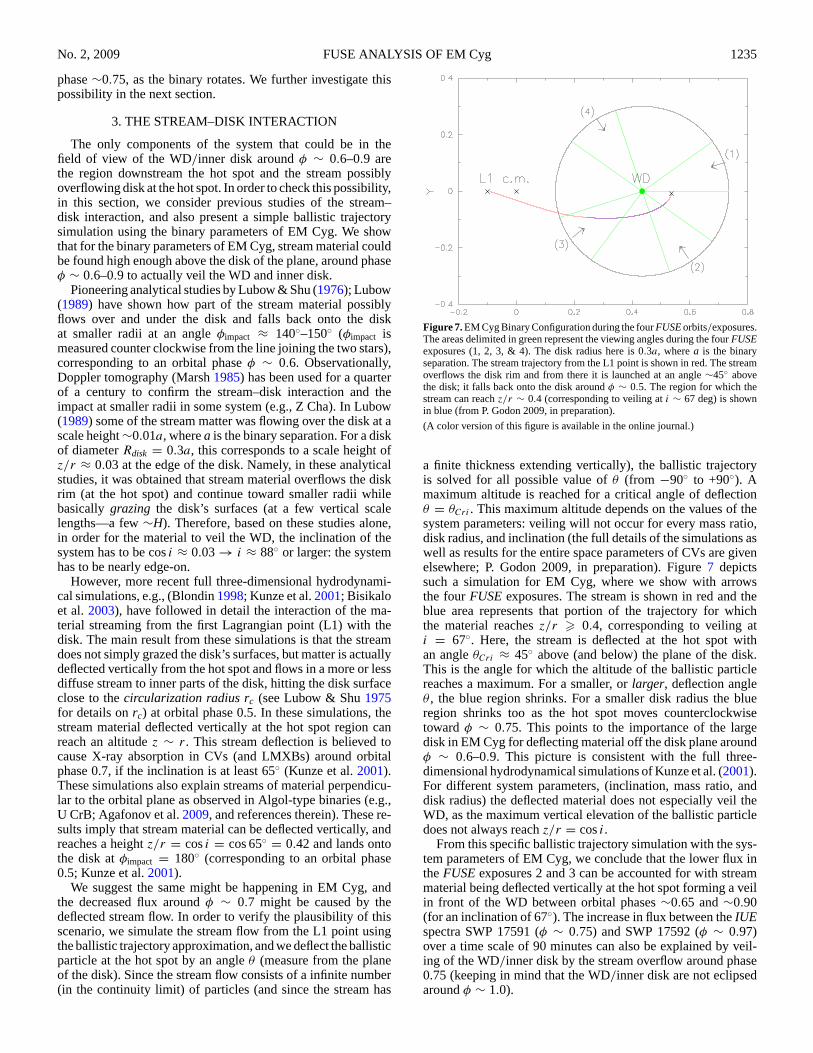
In Figure 6, we compare three IUE SWP spectra taken inquiescence together with the FUSE exposures in the spectralrange ∼900–1,400 Å. Since FUSE exposures 2 and 3 haveabout the same flux, we combine them together, and the samefor exposures 1 and 4. We see that SWP 08088 (taken in 1980)has a much lower flux, similar to exposures 2 and 3. SWP 17591(taken in 1982) has a flux level comparable with exposures 1and 4, while SWP 17592 (taken 90 minutes after SWP 17591)has a higher flux level.
The typical quiescent V of the system is 13.5 but it has beenobserved as faint as 14.5 in quiescence (possibly at eclipse
Spogli et al. 2003, 2005). From validated AAVSO data, itappears that, at the time of the FUSE observations, the systemhad a magnitude of V ∼ 13.1–13.9 (Figure 2), namely EMCyg was not in its lowest possible quiescent state at the timeof the FUSE observations. This is clearly seen in Figure 2,where the previous quiescent state on JD2452505 is about0.5 mag fainter than the quiescent state during which theFUSE observations (JD2452522) were carried out. The IUESWP 17591 and SWP 17592 spectra were obtained during abrighter state, when EM Cyg was on the rise to outburst, itsmagnitude around 13.2–13.5 (but still lower than a standstillwith V ∼ 12.5–13.5). The IUE SWP 08088 spectrum was atV ∼ 13.6–13.7 (Szkody 1981).
The three IUE SWP spectra are complemented with threelonger wavelength (LWR) spectra. All the quiescent (LWR andSWP) IUE spectra are listed in Table 2 together with theircorresponding orbital phase. The increase in flux between SWP17591 and SWP 17592 over a time scale of 90 minutes is mostprobably due to orbital variation (as in FUSE), and the matchingLWR spectra 13862 and 13863 do not show any variation. As tothe SWP 08088 and (matching) LWR 07056 spectra, their lowerflux is due to a deeper quiescence and to orbital variation too.
Because of these changes in flux level (due to both orbitalvariation and intrinsic changes in the source) combining theFUSE and IUE spectra together is tricky and this might explainthe difficulty Welsh et al. (2005) were having to match boththe short wavelengths of FUSE and the longer wavelengths ofIUE in the same fit. As a consequence, we do not combine the
1234 GODON ET AL. Vol. 699
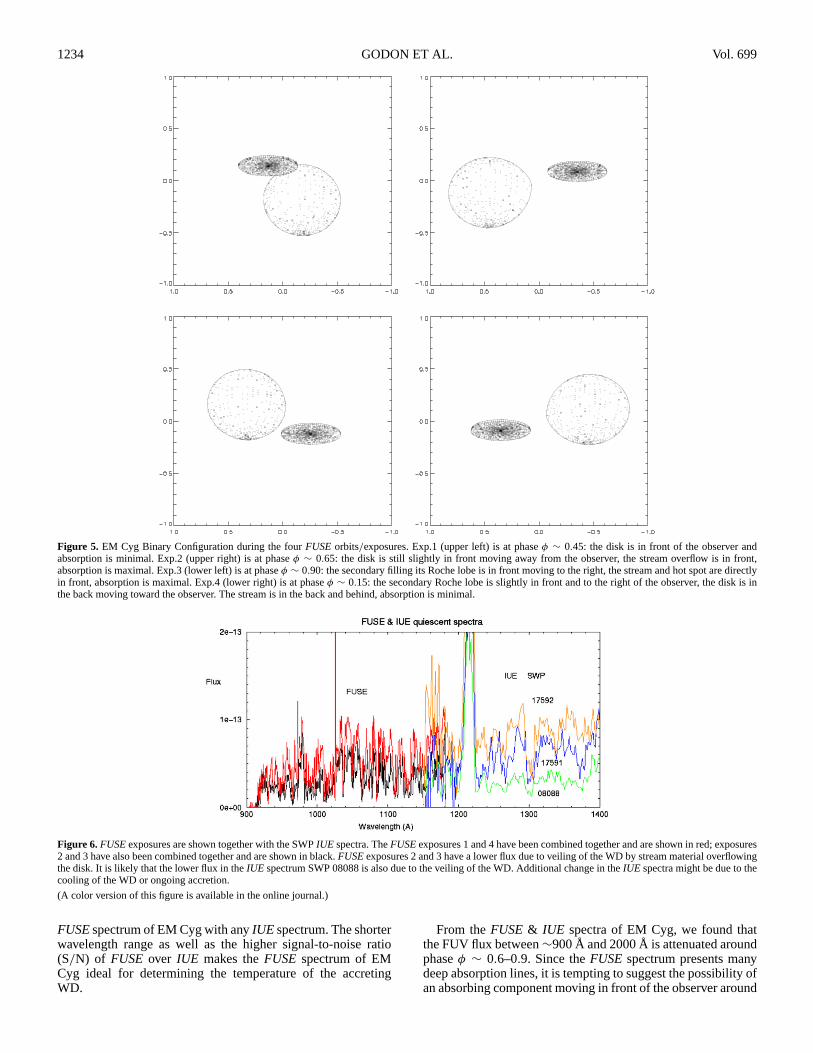
Figure 5. EM Cyg Binary Configuration during the four FUSE orbits/exposures. Exp.1 (upper left) is at phase φ ∼ 0.45: the disk is in front of the observer andabsorption is minimal. Exp.2 (upper right) is at phase φ ∼ 0.65: the disk is still slightly in front moving away from the observer, the stream overflow is in front,absorption is maximal. Exp.3 (lower left) is at phase φ ∼ 0.90: the secondary filling its Roche lobe is in front moving to the right, the stream and hot spot are directlyin front, absorption is maximal. Exp.4 (lower right) is at phase φ ∼ 0.15: the secondary Roche lobe is slightly in front and to the right of the observer, the disk is inthe back moving toward the observer. The stream is in the back and behind, absorption is minimal.
Figure 6. FUSE exposures are shown together with the SWP IUE spectra. The FUSE exposures 1 and 4 have been combined together and are shown in red; exposures2 and 3 have also been combined together and are shown in black. FUSE exposures 2 and 3 have a lower flux due to veiling of the WD by stream material overflowingthe disk. It is likely that the lower flux in the IUE spectrum SWP 08088 is also due to the veiling of the WD. Additional change in the IUE spectra might be due to thecooling of the WD or ongoing accretion.
(A color version of this figure is available in the online journal.)
FUSE spectrum of EM Cyg with any IUE spectrum. The shorterwavelength range as well as the higher signal-to-noise ratio(S/N) of FUSE over IUE makes the FUSE spectrum of EMCyg ideal for determining the temperature of the accretingWD.
From the FUSE & IUE spectra of EM Cyg, we found thatthe FUV flux between ∼900 Å and 2000 Å is attenuated aroundphase φ ∼ 0.6–0.9. Since the FUSE spectrum presents manydeep absorption lines, it is tempting to suggest the possibility ofan absorbing component moving in front of the observer around
No. 2, 2009 FUSE ANALYSIS OF EM Cyg 1235
phase ∼0.75, as the binary rotates. We further investigate thispossibility in the next section.
3. THE STREAM–DISK INTERACTION
The only components of the system that could be in thefield of view of the WD/inner disk around φ ∼ 0.6–0.9 arethe region downstream the hot spot and the stream possiblyoverflowing disk at the hot spot. In order to check this possibility,in this section, we consider previous studies of the stream–disk interaction, and also present a simple ballistic trajectorysimulation using the binary parameters of EM Cyg. We showthat for the binary parameters of EM Cyg, stream material couldbe found high enough above the disk of the plane, around phaseφ ∼ 0.6–0.9 to actually veil the WD and inner disk.
Pioneering analytical studies by Lubow & Shu (1976); Lubow(1989) have shown how part of the stream material possiblyflows over and under the disk and falls back onto the diskat smaller radii at an angle φimpact ≈ 140◦–150◦ (φimpact ismeasured counter clockwise from the line joining the two stars),corresponding to an orbital phase φ ∼ 0.6. Observationally,Doppler tomography (Marsh 1985) has been used for a quarterof a century to confirm the stream–disk interaction and theimpact at smaller radii in some system (e.g., Z Cha). In Lubow(1989) some of the stream matter was flowing over the disk at ascale height ∼0.01a, where a is the binary separation. For a diskof diameter Rdisk = 0.3a, this corresponds to a scale height ofz/r ≈ 0.03 at the edge of the disk. Namely, in these analyticalstudies, it was obtained that stream material overflows the diskrim (at the hot spot) and continue toward smaller radii whilebasically grazing the disk’s surfaces (at a few vertical scalelengths—a few ∼H). Therefore, based on these studies alone,in order for the material to veil the WD, the inclination of thesystem has to be cos i ≈ 0.03 → i ≈ 88◦ or larger: the systemhas to be nearly edge-on.
However, more recent full three-dimensional hydrodynami-cal simulations, e.g., (Blondin 1998; Kunze et al. 2001; Bisikaloet al. 2003), have followed in detail the interaction of the ma-terial streaming from the first Lagrangian point (L1) with thedisk. The main result from these simulations is that the streamdoes not simply grazed the disk’s surfaces, but matter is actuallydeflected vertically from the hot spot and flows in a more or lessdiffuse stream to inner parts of the disk, hitting the disk surfaceclose to the circularization radius rc (see Lubow & Shu 1975for details on rc) at orbital phase 0.5. In these simulations, thestream material deflected vertically at the hot spot region canreach an altitude z ∼ r . This stream deflection is believed tocause X-ray absorption in CVs (and LMXBs) around orbitalphase 0.7, if the inclination is at least 65◦ (Kunze et al. 2001).These simulations also explain streams of material perpendicu-lar to the orbital plane as observed in Algol-type binaries (e.g.,U CrB; Agafonov et al. 2009, and references therein). These re-sults imply that stream material can be deflected vertically, andreaches a height z/r = cos i = cos 65◦ = 0.42 and lands ontothe disk at φimpact = 180◦ (corresponding to an orbital phase0.5; Kunze et al. 2001).
We suggest the same might be happening in EM Cyg, andthe decreased flux around φ ∼ 0.7 might be caused by thedeflected stream flow. In order to verify the plausibility of thisscenario, we simulate the stream flow from the L1 point usingthe ballistic trajectory approximation, and we deflect the ballisticparticle at the hot spot by an angle θ (measure from the planeof the disk). Since the stream flow consists of a infinite number(in the continuity limit) of particles (and since the stream has
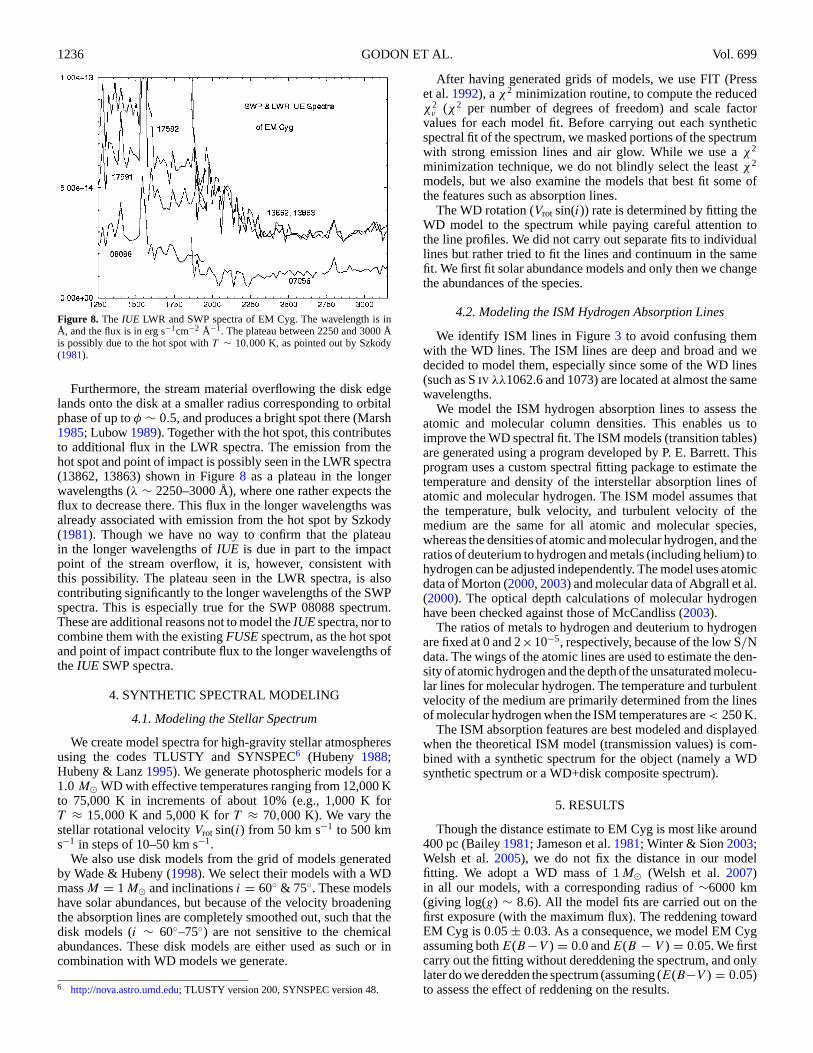
Figure 7. EM Cyg Binary Configuration during the four FUSE orbits/exposures.The areas delimited in green represent the viewing angles during the four FUSEexposures (1, 2, 3, & 4). The disk radius here is 0.3a, where a is the binaryseparation. The stream trajectory from the L1 point is shown in red. The streamoverflows the disk rim and from there it is launched at an angle ∼45◦ abovethe disk; it falls back onto the disk around φ ∼ 0.5. The region for which thestream can reach z/r ∼ 0.4 (corresponding to veiling at i ∼ 67 deg) is shownin blue (from P. Godon 2009, in preparation).
(A color version of this figure is available in the online journal.)
a finite thickness extending vertically), the ballistic trajectoryis solved for all possible value of θ (from −90◦ to +90◦). Amaximum altitude is reached for a critical angle of deflectionθ = θCri . This maximum altitude depends on the values of thesystem parameters: veiling will not occur for every mass ratio,disk radius, and inclination (the full details of the simulations aswell as results for the entire space parameters of CVs are givenelsewhere; P. Godon 2009, in preparation). Figure 7 depictssuch a simulation for EM Cyg, where we show with arrowsthe four FUSE exposures. The stream is shown in red and theblue area represents that portion of the trajectory for whichthe material reaches z/r � 0.4, corresponding to veiling ati = 67◦. Here, the stream is deflected at the hot spot withan angle θCri ≈ 45◦ above (and below) the plane of the disk.This is the angle for which the altitude of the ballistic particlereaches a maximum. For a smaller, or larger, deflection angleθ , the blue region shrinks. For a smaller disk radius the blueregion shrinks too as the hot spot moves counterclockwisetoward φ ∼ 0.75. This points to the importance of the largedisk in EM Cyg for deflecting material off the disk plane aroundφ ∼ 0.6–0.9. This picture is consistent with the full three-dimensional hydrodynamical simulations of Kunze et al. (2001).For different system parameters, (inclination, mass ratio, anddisk radius) the deflected material does not especially veil theWD, as the maximum vertical elevation of the ballistic particledoes not always reach z/r = cos i.
From this specific ballistic trajectory simulation with the sys-tem parameters of EM Cyg, we conclude that the lower flux inthe FUSE exposures 2 and 3 can be accounted for with streammaterial being deflected vertically at the hot spot forming a veilin front of the WD between orbital phases ∼0.65 and ∼0.90(for an inclination of 67◦). The increase in flux between the IUEspectra SWP 17591 (φ ∼ 0.75) and SWP 17592 (φ ∼ 0.97)over a time scale of 90 minutes can also be explained by veil-ing of the WD/inner disk by the stream overflow around phase0.75 (keeping in mind that the WD/inner disk are not eclipsedaround φ ∼ 1.0).
1236 GODON ET AL. Vol. 699
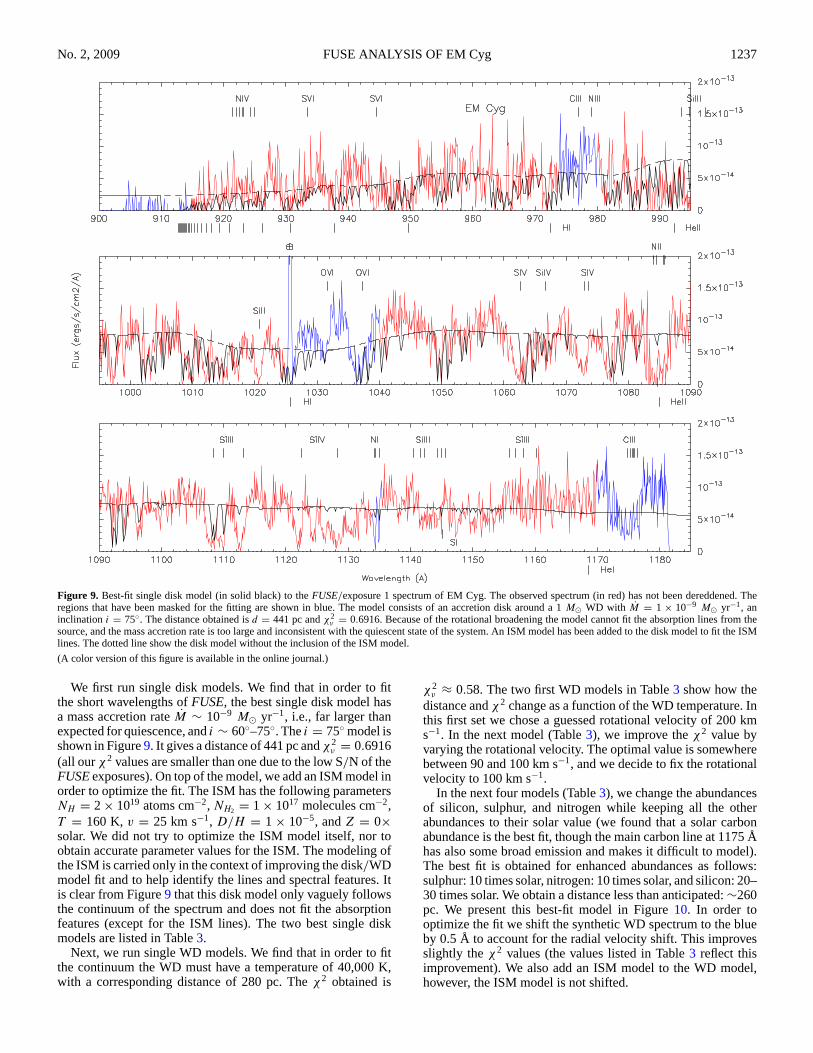
Figure 8. The IUE LWR and SWP spectra of EM Cyg. The wavelength is inÅ, and the flux is in erg s−1cm−2 Å−1. The plateau between 2250 and 3000 Åis possibly due to the hot spot with T ∼ 10,000 K, as pointed out by Szkody(1981).
Furthermore, the stream material overflowing the disk edgelands onto the disk at a smaller radius corresponding to orbitalphase of up to φ ∼ 0.5, and produces a bright spot there (Marsh1985; Lubow 1989). Together with the hot spot, this contributesto additional flux in the LWR spectra. The emission from thehot spot and point of impact is possibly seen in the LWR spectra(13862, 13863) shown in Figure 8 as a plateau in the longerwavelengths (λ ∼ 2250–3000 Å), where one rather expects theflux to decrease there. This flux in the longer wavelengths wasalready associated with emission from the hot spot by Szkody(1981). Though we have no way to confirm that the plateauin the longer wavelengths of IUE is due in part to the impactpoint of the stream overflow, it is, however, consistent withthis possibility. The plateau seen in the LWR spectra, is alsocontributing significantly to the longer wavelengths of the SWPspectra. This is especially true for the SWP 08088 spectrum.These are additional reasons not to model the IUE spectra, nor tocombine them with the existing FUSE spectrum, as the hot spotand point of impact contribute flux to the longer wavelengths ofthe IUE SWP spectra.
4. SYNTHETIC SPECTRAL MODELING
4.1. Modeling the Stellar Spectrum
We create model spectra for high-gravity stellar atmospheresusing the codes TLUSTY and SYNSPEC6 (Hubeny 1988;Hubeny & Lanz 1995). We generate photospheric models for a1.0 M� WD with effective temperatures ranging from 12,000 Kto 75,000 K in increments of about 10% (e.g., 1,000 K forT ≈ 15,000 K and 5,000 K for T ≈ 70,000 K). We vary thestellar rotational velocity Vrot sin(i) from 50 km s−1 to 500 kms−1 in steps of 10–50 km s−1.
We also use disk models from the grid of models generatedby Wade & Hubeny (1998). We select their models with a WDmass M = 1 M� and inclinations i = 60◦ & 75◦. These modelshave solar abundances, but because of the velocity broadeningthe absorption lines are completely smoothed out, such that thedisk models (i ∼ 60◦–75◦) are not sensitive to the chemicalabundances. These disk models are either used as such or incombination with WD models we generate.
6 http://nova.astro.umd.edu; TLUSTY version 200, SYNSPEC version 48.
After having generated grids of models, we use FIT (Presset al. 1992), a χ2 minimization routine, to compute the reducedχ2
ν (χ2 per number of degrees of freedom) and scale factorvalues for each model fit. Before carrying out each syntheticspectral fit of the spectrum, we masked portions of the spectrumwith strong emission lines and air glow. While we use a χ2
minimization technique, we do not blindly select the least χ2
models, but we also examine the models that best fit some ofthe features such as absorption lines.
The WD rotation (Vrot sin(i)) rate is determined by fitting theWD model to the spectrum while paying careful attention tothe line profiles. We did not carry out separate fits to individuallines but rather tried to fit the lines and continuum in the samefit. We first fit solar abundance models and only then we changethe abundances of the species.
4.2. Modeling the ISM Hydrogen Absorption Lines
We identify ISM lines in Figure 3 to avoid confusing themwith the WD lines. The ISM lines are deep and broad and wedecided to model them, especially since some of the WD lines(such as S iv λλ1062.6 and 1073) are located at almost the samewavelengths.
We model the ISM hydrogen absorption lines to assess theatomic and molecular column densities. This enables us toimprove the WD spectral fit. The ISM models (transition tables)are generated using a program developed by P. E. Barrett. Thisprogram uses a custom spectral fitting package to estimate thetemperature and density of the interstellar absorption lines ofatomic and molecular hydrogen. The ISM model assumes thatthe temperature, bulk velocity, and turbulent velocity of themedium are the same for all atomic and molecular species,whereas the densities of atomic and molecular hydrogen, and theratios of deuterium to hydrogen and metals (including helium) tohydrogen can be adjusted independently. The model uses atomicdata of Morton (2000, 2003) and molecular data of Abgrall et al.(2000). The optical depth calculations of molecular hydrogenhave been checked against those of McCandliss (2003).
The ratios of metals to hydrogen and deuterium to hydrogenare fixed at 0 and 2×10⁻⁵, respectively, because of the low S/Ndata. The wings of the atomic lines are used to estimate the den-sity of atomic hydrogen and the depth of the unsaturated molecu-lar lines for molecular hydrogen. The temperature and turbulentvelocity of the medium are primarily determined from the linesof molecular hydrogen when the ISM temperatures are < 250 K.
The ISM absorption features are best modeled and displayedwhen the theoretical ISM model (transmission values) is com-bined with a synthetic spectrum for the object (namely a WDsynthetic spectrum or a WD+disk composite spectrum).
5. RESULTS
Though the distance estimate to EM Cyg is most like around400 pc (Bailey 1981; Jameson et al. 1981; Winter & Sion 2003;Welsh et al. 2005), we do not fix the distance in our modelfitting. We adopt a WD mass of 1 M� (Welsh et al. 2007)in all our models, with a corresponding radius of ∼6000 km(giving log(g) ∼ 8.6). All the model fits are carried out on thefirst exposure (with the maximum flux). The reddening towardEM Cyg is 0.05 ± 0.03. As a consequence, we model EM Cygassuming both E(B−V ) = 0.0 and E(B − V ) = 0.05. We firstcarry out the fitting without dereddening the spectrum, and onlylater do we deredden the spectrum (assuming (E(B−V ) = 0.05)to assess the effect of reddening on the results.
No. 2, 2009 FUSE ANALYSIS OF EM Cyg 1237
Figure 9. Best-fit single disk model (in solid black) to the FUSE/exposure 1 spectrum of EM Cyg. The observed spectrum (in red) has not been dereddened. Theregions that have been masked for the fitting are shown in blue. The model consists of an accretion disk around a 1 M� WD with M = 1 × 10⁻⁹ M� yr−1, aninclination i = 75◦. The distance obtained is d = 441 pc and χ2
ν = 0.6916. Because of the rotational broadening the model cannot fit the absorption lines from thesource, and the mass accretion rate is too large and inconsistent with the quiescent state of the system. An ISM model has been added to the disk model to fit the ISMlines. The dotted line show the disk model without the inclusion of the ISM model.
(A color version of this figure is available in the online journal.)
We first run single disk models. We find that in order to fitthe short wavelengths of FUSE, the best single disk model hasa mass accretion rate M ∼ 10−9 M� yr−1, i.e., far larger thanexpected for quiescence, and i ∼ 60◦–75◦. The i = 75◦ model isshown in Figure 9. It gives a distance of 441 pc and χ2
ν = 0.6916(all our χ2 values are smaller than one due to the low S/N of theFUSE exposures). On top of the model, we add an ISM model inorder to optimize the fit. The ISM has the following parametersNH = 2 × 10¹⁹ atoms cm−2, NH2 = 1 × 10¹⁷ molecules cm−2,T = 160 K, v = 25 km s−1, D/H = 1 × 10⁻⁵, and Z = 0×solar. We did not try to optimize the ISM model itself, nor toobtain accurate parameter values for the ISM. The modeling ofthe ISM is carried only in the context of improving the disk/WDmodel fit and to help identify the lines and spectral features. Itis clear from Figure 9 that this disk model only vaguely followsthe continuum of the spectrum and does not fit the absorptionfeatures (except for the ISM lines). The two best single diskmodels are listed in Table 3.
Next, we run single WD models. We find that in order to fitthe continuum the WD must have a temperature of 40,000 K,with a corresponding distance of 280 pc. The χ2 obtained is
χ2ν ≈ 0.58. The two first WD models in Table 3 show how the
distance and χ2 change as a function of the WD temperature. Inthis first set we chose a guessed rotational velocity of 200 kms−1. In the next model (Table 3), we improve the χ2 value byvarying the rotational velocity. The optimal value is somewherebetween 90 and 100 km s−1, and we decide to fix the rotationalvelocity to 100 km s−1.
In the next four models (Table 3), we change the abundancesof silicon, sulphur, and nitrogen while keeping all the otherabundances to their solar value (we found that a solar carbonabundance is the best fit, though the main carbon line at 1175 Åhas also some broad emission and makes it difficult to model).The best fit is obtained for enhanced abundances as follows:sulphur: 10 times solar, nitrogen: 10 times solar, and silicon: 20–30 times solar. We obtain a distance less than anticipated: ∼260pc. We present this best-fit model in Figure 10. In order tooptimize the fit we shift the synthetic WD spectrum to the blueby 0.5 Å to account for the radial velocity shift. This improvesslightly the χ2 values (the values listed in Table 3 reflect thisimprovement). We also add an ISM model to the WD model,however, the ISM model is not shifted.
1238 GODON ET AL. Vol. 699
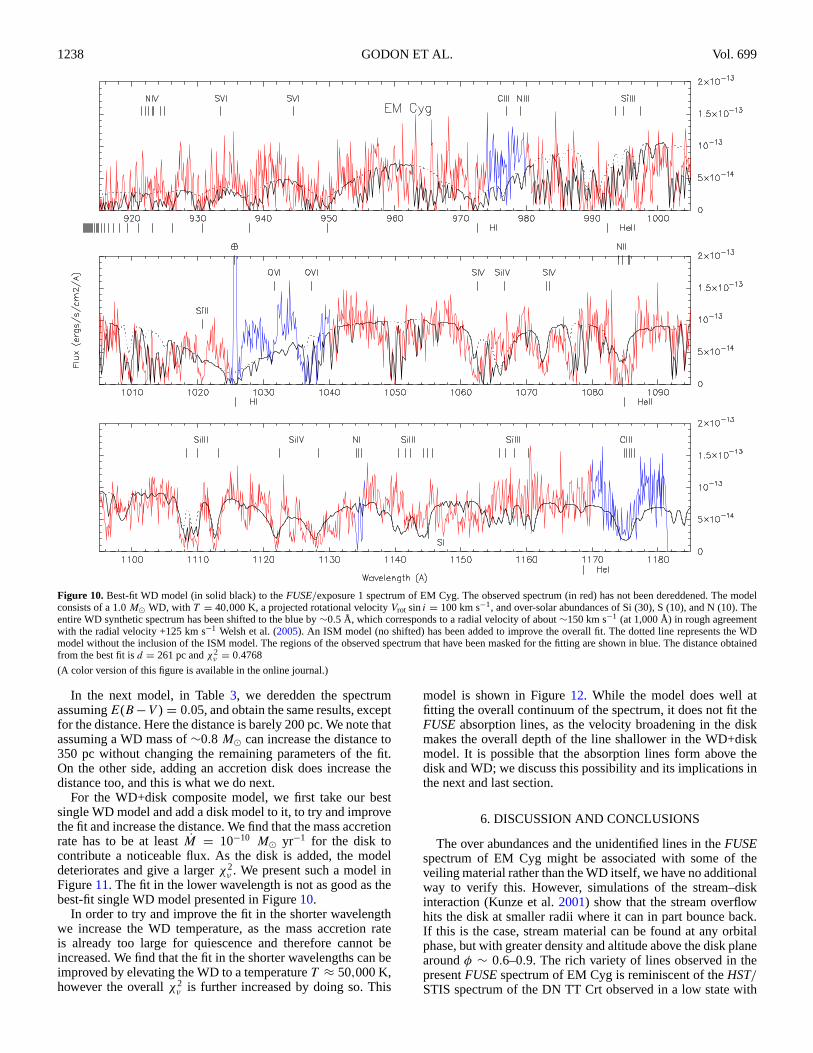
Figure 10. Best-fit WD model (in solid black) to the FUSE/exposure 1 spectrum of EM Cyg. The observed spectrum (in red) has not been dereddened. The modelconsists of a 1.0 M� WD, with T = 40,000 K, a projected rotational velocity Vrot sin i = 100 km s−1, and over-solar abundances of Si (30), S (10), and N (10). Theentire WD synthetic spectrum has been shifted to the blue by ∼0.5 Å, which corresponds to a radial velocity of about ∼150 km s−1 (at 1,000 Å) in rough agreementwith the radial velocity +125 km s−1 Welsh et al. (2005). An ISM model (no shifted) has been added to improve the overall fit. The dotted line represents the WDmodel without the inclusion of the ISM model. The regions of the observed spectrum that have been masked for the fitting are shown in blue. The distance obtainedfrom the best fit is d = 261 pc and χ2
ν = 0.4768
(A color version of this figure is available in the online journal.)
In the next model, in Table 3, we deredden the spectrumassuming E(B −V ) = 0.05, and obtain the same results, exceptfor the distance. Here the distance is barely 200 pc. We note thatassuming a WD mass of ∼0.8 M� can increase the distance to350 pc without changing the remaining parameters of the fit.On the other side, adding an accretion disk does increase thedistance too, and this is what we do next.
For the WD+disk composite model, we first take our bestsingle WD model and add a disk model to it, to try and improvethe fit and increase the distance. We find that the mass accretionrate has to be at least M = 10−10 M� yr−1 for the disk tocontribute a noticeable flux. As the disk is added, the modeldeteriorates and give a larger χ2
ν . We present such a model inFigure 11. The fit in the lower wavelength is not as good as thebest-fit single WD model presented in Figure 10.
In order to try and improve the fit in the shorter wavelengthwe increase the WD temperature, as the mass accretion rateis already too large for quiescence and therefore cannot beincreased. We find that the fit in the shorter wavelengths can beimproved by elevating the WD to a temperature T ≈ 50,000 K,however the overall χ2
ν is further increased by doing so. This
model is shown in Figure 12. While the model does well atfitting the overall continuum of the spectrum, it does not fit theFUSE absorption lines, as the velocity broadening in the diskmakes the overall depth of the line shallower in the WD+diskmodel. It is possible that the absorption lines form above thedisk and WD; we discuss this possibility and its implications inthe next and last section.
6. DISCUSSION AND CONCLUSIONS
The over abundances and the unidentified lines in the FUSEspectrum of EM Cyg might be associated with some of theveiling material rather than the WD itself, we have no additionalway to verify this. However, simulations of the stream–diskinteraction (Kunze et al. 2001) show that the stream overflowhits the disk at smaller radii where it can in part bounce back.If this is the case, stream material can be found at any orbitalphase, but with greater density and altitude above the disk planearound φ ∼ 0.6–0.9. The rich variety of lines observed in thepresent FUSE spectrum of EM Cyg is reminiscent of the HST/STIS spectrum of the DN TT Crt observed in a low state with
No. 2, 2009 FUSE ANALYSIS OF EM Cyg 1239
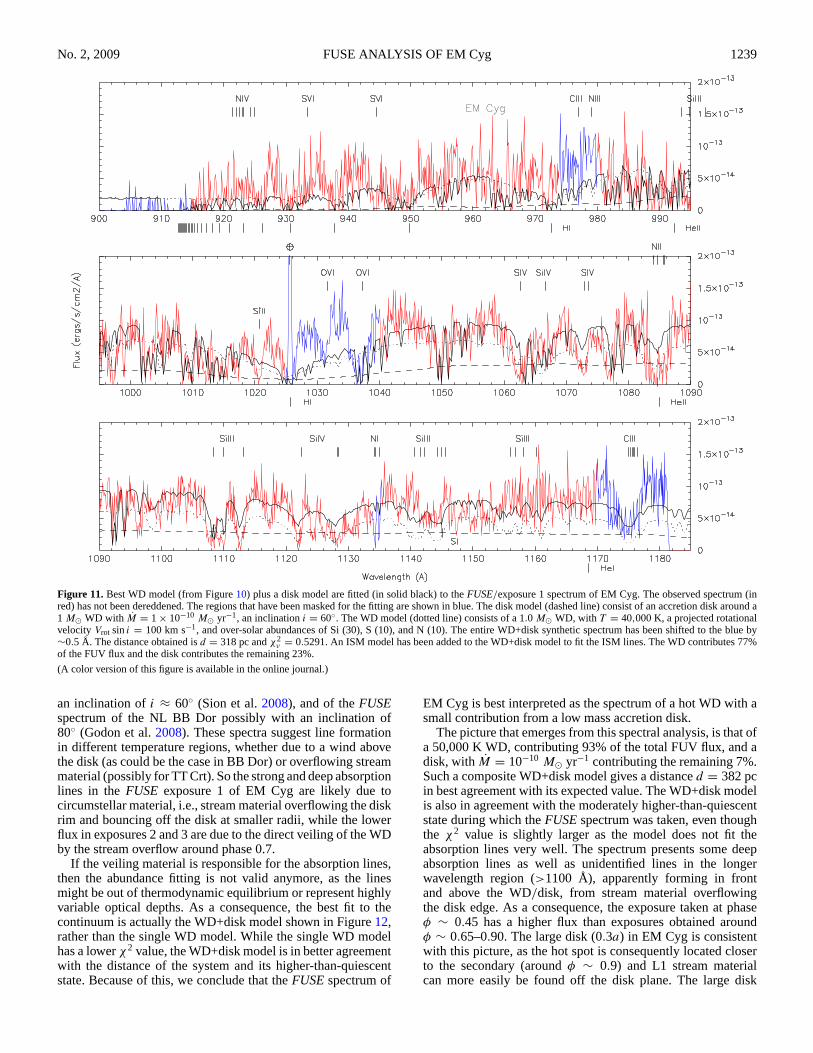
Figure 11. Best WD model (from Figure 10) plus a disk model are fitted (in solid black) to the FUSE/exposure 1 spectrum of EM Cyg. The observed spectrum (inred) has not been dereddened. The regions that have been masked for the fitting are shown in blue. The disk model (dashed line) consist of an accretion disk around a1 M� WD with M = 1 × 10⁻¹⁰ M� yr−1, an inclination i = 60◦. The WD model (dotted line) consists of a 1.0 M� WD, with T = 40,000 K, a projected rotationalvelocity Vrot sin i = 100 km s−1, and over-solar abundances of Si (30), S (10), and N (10). The entire WD+disk synthetic spectrum has been shifted to the blue by∼0.5 Å. The distance obtained is d = 318 pc and χ2
ν = 0.5291. An ISM model has been added to the WD+disk model to fit the ISM lines. The WD contributes 77%of the FUV flux and the disk contributes the remaining 23%.
(A color version of this figure is available in the online journal.)
an inclination of i ≈ 60◦ (Sion et al. 2008), and of the FUSEspectrum of the NL BB Dor possibly with an inclination of80◦ (Godon et al. 2008). These spectra suggest line formationin different temperature regions, whether due to a wind abovethe disk (as could be the case in BB Dor) or overflowing streammaterial (possibly for TT Crt). So the strong and deep absorptionlines in the FUSE exposure 1 of EM Cyg are likely due tocircumstellar material, i.e., stream material overflowing the diskrim and bouncing off the disk at smaller radii, while the lowerflux in exposures 2 and 3 are due to the direct veiling of the WDby the stream overflow around phase 0.7.
If the veiling material is responsible for the absorption lines,then the abundance fitting is not valid anymore, as the linesmight be out of thermodynamic equilibrium or represent highlyvariable optical depths. As a consequence, the best fit to thecontinuum is actually the WD+disk model shown in Figure 12,rather than the single WD model. While the single WD modelhas a lower χ2 value, the WD+disk model is in better agreementwith the distance of the system and its higher-than-quiescentstate. Because of this, we conclude that the FUSE spectrum of
EM Cyg is best interpreted as the spectrum of a hot WD with asmall contribution from a low mass accretion disk.
The picture that emerges from this spectral analysis, is that ofa 50,000 K WD, contributing 93% of the total FUV flux, and adisk, with M = 10−10 M� yr−1 contributing the remaining 7%.Such a composite WD+disk model gives a distance d = 382 pcin best agreement with its expected value. The WD+disk modelis also in agreement with the moderately higher-than-quiescentstate during which the FUSE spectrum was taken, even thoughthe χ2 value is slightly larger as the model does not fit theabsorption lines very well. The spectrum presents some deepabsorption lines as well as unidentified lines in the longerwavelength region (>1100 Å), apparently forming in frontand above the WD/disk, from stream material overflowingthe disk edge. As a consequence, the exposure taken at phaseφ ∼ 0.45 has a higher flux than exposures obtained aroundφ ∼ 0.65–0.90. The large disk (0.3a) in EM Cyg is consistentwith this picture, as the hot spot is consequently located closerto the secondary (around φ ∼ 0.9) and L1 stream materialcan more easily be found off the disk plane. The large disk
1240 GODON ET AL. Vol. 699
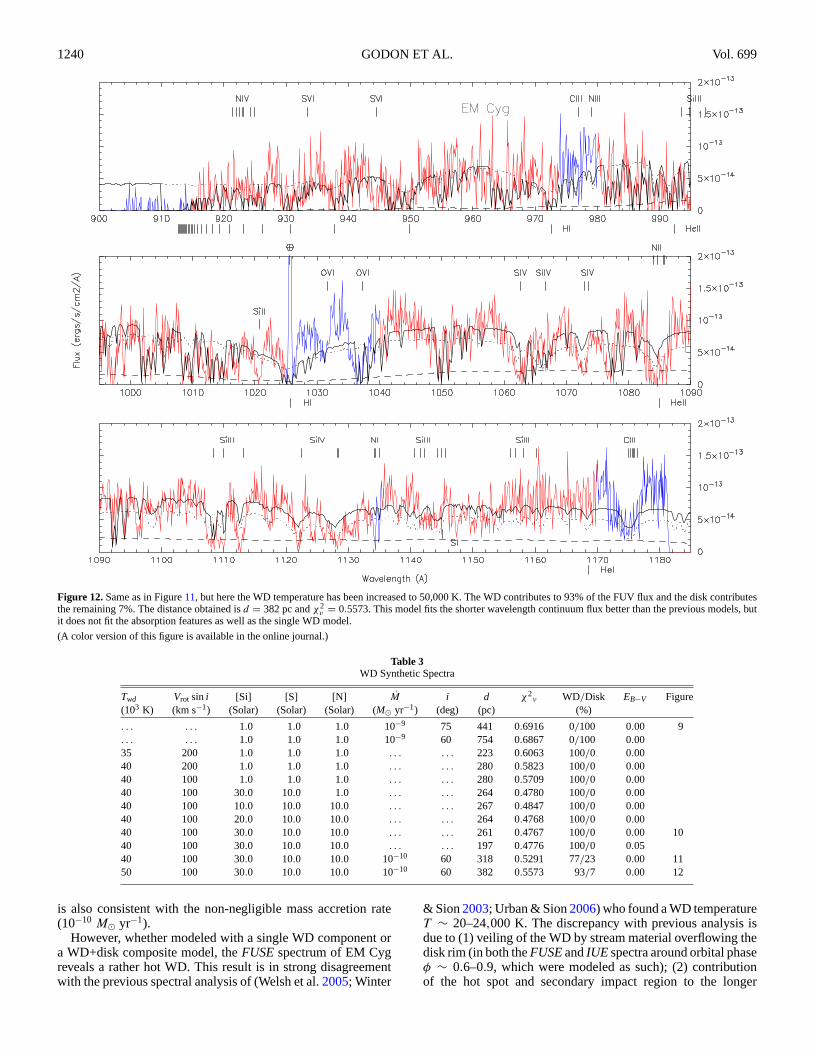
Figure 12. Same as in Figure 11, but here the WD temperature has been increased to 50,000 K. The WD contributes to 93% of the FUV flux and the disk contributesthe remaining 7%. The distance obtained is d = 382 pc and χ2
ν = 0.5573. This model fits the shorter wavelength continuum flux better than the previous models, butit does not fit the absorption features as well as the single WD model.
(A color version of this figure is available in the online journal.)
Table 3WD Synthetic Spectra
Twd Vrot sin i [Si] [S] [N] M i d χ2ν WD/Disk EB−V Figure
(103 K) (km s−1) (Solar) (Solar) (Solar) (M� yr−1) (deg) (pc) (%)
. . . . . . 1.0 1.0 1.0 10−9 75 441 0.6916 0/100 0.00 9
. . . . . . 1.0 1.0 1.0 10−9 60 754 0.6867 0/100 0.0035 200 1.0 1.0 1.0 . . . . . . 223 0.6063 100/0 0.0040 200 1.0 1.0 1.0 . . . . . . 280 0.5823 100/0 0.0040 100 1.0 1.0 1.0 . . . . . . 280 0.5709 100/0 0.0040 100 30.0 10.0 1.0 . . . . . . 264 0.4780 100/0 0.0040 100 10.0 10.0 10.0 . . . . . . 267 0.4847 100/0 0.0040 100 20.0 10.0 10.0 . . . . . . 264 0.4768 100/0 0.0040 100 30.0 10.0 10.0 . . . . . . 261 0.4767 100/0 0.00 1040 100 30.0 10.0 10.0 . . . . . . 197 0.4776 100/0 0.0540 100 30.0 10.0 10.0 10−10 60 318 0.5291 77/23 0.00 1150 100 30.0 10.0 10.0 10−10 60 382 0.5573 93/7 0.00 12
is also consistent with the non-negligible mass accretion rate(10−10 M� yr−1).
However, whether modeled with a single WD component ora WD+disk composite model, the FUSE spectrum of EM Cygreveals a rather hot WD. This result is in strong disagreementwith the previous spectral analysis of (Welsh et al. 2005; Winter
& Sion 2003; Urban & Sion 2006) who found a WD temperatureT ∼ 20–24,000 K. The discrepancy with previous analysis isdue to (1) veiling of the WD by stream material overflowing thedisk rim (in both the FUSE and IUE spectra around orbital phaseφ ∼ 0.6–0.9, which were modeled as such); (2) contributionof the hot spot and secondary impact region to the longer
No. 2, 2009 FUSE ANALYSIS OF EM Cyg 1241
wavelengths of the IUE SWP spectra; and (3) eclipse of thedisk in the SWP 08088 IUE spectrum (taken around orbitalphase φ ∼ 0.98–0.16). In addition, in these previous analysis,the flux was contributed mostly from an accretion disk, while inthe present work the main component is the WD.
Originally, the derivation of EM Cyg system parameters wereaffected by the presence of the third star, Arkadash, in thebackground of the system. In a similar way, we find that thepreviously derived mass accretion rate and WD temperaturemight have been affected by the veiling of the WD and disk bystream overflow around orbital phase φ ∼ 0.65–0.90.
PG thank Steve (Stephen) Lubow for some interesting dis-cussions on the stream–disk interaction, and Mario Livio forhis kind hospitality at the Space Telescope Science Institute,where part of this work was carried out. We wish to thank ananonymous referee for her/his very prompt report and construc-tive criticism. We are thankful to the members of the AmericanAssociation of Variable Star Observers (AAVSO) for providingpublic online optical archival data on EM Cyg. This researchwas based on observations made with the NASA-CNES-CSAFar Ultraviolet Spectroscopic Explorer. FUSE is operated forNASA by the Johns Hopkins University under NASA con-tract NAS5-32985. Support for this work was provided by theNational Aeronautics and Space Administration (NASA) un-der Grant number NNX08AJ39G issued through the Office ofAstrophysics Data Analysis Program (ADP) to Villanova Uni-versity (P. Godon).
REFERENCES
Abgrall, H., Roueff, E., & Drira, I. 2000, A&AS, 141, 297Agafonov, M., Sharova, O., & Richards, M. 2009, ApJ, 690, 1730Bailey, J. A. 1981, MNRAS, 197, 31Beuermann, K., & Pakull, M. W. 1984, A&A, 136, 250Bisikalo, D. V., Boyarchuk, A. A., Kaygorodov, P. V., & Kuznetsov, O. A. 2003,
Astron. Rep., 47, 809 (originally in Russian: 2003, Astro. Zhurnal 80, 879)Blondin, J. M. 1998, in AIP Conf. Proc. 431, Interacting Binary Stars: The
Stream–Disk Impact, ed. S.S. Holt & T. R. Kallman (Melville, NY: AIP),309
Bruch, A., & Engel, A. 1994, A&AS, 104, 79Burbidge, E. M., & Burbidge, G. R. 1953, ApJ, 118, 349Cannizzo, J. 1998, ApJ, 493, 426Csizmadia, Sz., Nagy, Zs., Borkovits, T., Hegedus, T., Biro, I. B., & Kiss, Z. T.
2008, Astron. Nachr., 329, 39Dixon, W. V., et al. 2007, PASP, 119, 527Godon, P., Sion, E. M., Barrett, P. E., Szkody, P., & Schlegel, E. M. 2008, ApJ,
687, 532
Hack, M., & La Dous, C. (eds.) 1993, Cataclysmic Variables and RelatedObjects (NASA SP-507; Washington, DC: NASA Scientific and TechnicalInformation)
Hamilton, T. R., Urban, J. A., Sion, E. M., Riedel, A. R., Voyer, E. N., Marcy,J. T., & Lakatos, S. L. 2007, ApJ, 667, 1139
Harrison, T. E., Johnson, J. J., McArthur, B. E., Benedict, G. F., Szkody, P.,Howell, S. B., & Gelino, D. M. 2004, AJ, 127, 460
Hubeny, I. 1988, Comput. Phys. Commun., 52, 103Hubeny, I., & Lanz, T. 1995, ApJ, 439, 875Jameson, R. F., King, A. R., & Sherrington, M. R. 1981, MNRAS, 195, 235Kraft, R. P. 1964, in 1st Conf. on Faint Blue Stars, ed. W. J. Luyten (Minneapolis,
MN: Univ. Minnesota Press), 77Kunze, S., Speith, R., & Hessman, F. V. 2001, MNRAS, 322, 499La Dous, C. 1991, A&A, 252, 100Lubow, S. H. 1989, ApJ, 340, 1064Lubow, S. H., & Shu, F. H. 1975, ApJ, 198, 383Lubow, S. H., & Shu, F. H. 1976, ApJ, 207, L53Marsh, T. 1985, PhD thesis, Cambridge Univ.McCandliss, S. R. 2003, PASP, 115, 651Morton, D. C. 2000, ApJS, 130, 403Morton, D. C. 2003, ApJS, 149, 205Mumford, G. S. 1980, AJ, 85, 748Mumford, G. S., & Krezminski, W. 1969, ApJS, 166, 429Nevo, I., & Sadeh, D. 1978, MNRAS, 182, 595North, R. C., Marsh, T. R., Moran, C. K. J., Kolb, U., Smith, R. C., & Stehle,
R. 2000, MNRAS, 313, 383Patterson, J. 1981, ApJS, 45, 517Press, W. H., Teukolsky, S. A., Vetterling, W. T., & Flannery, B. P. 1992,
Numerical Recipes in Fortran 77, The Art of Scientific Computing (2nd ed.;Cambridge: Cambridge Univ. Press)
Pringle, J. 1975, MNRAS, 170, 633Ritter, H., & Kolb, U. 2003, A&A, 404, 301 (http://physics.open.ac.uk/
RKcat/RKcat_AA.ps)Robinson, E. L. 1974, ApJ, 193, 191Sion, E. M., Gansicke, B. T., Long, K. S., Szkody, P., Knigged, C., Hubeny, I.,
deMartino, D., & Godon, P. 2008, ApJ, 681, 543Stiening, R. F., Dragovan, M., & Hildebrand, R. H. 1982, PASP, 94, 672Stover, R. J., Robinson, E. L., & Nather, R. E. 1981, ApJ, 248, 696Spogli, C., Fiorucci, M., & Raimondo, G. 2003, Inf. Bull. Var. Stars, 5365, 1Spogli, C., et al. 2005, Inf. Bull. Var. Stars, 5996, 1Szkody, P. 1981, ApJ, 247, 577Urban, J. A., & Sion, E. M. 2006, ApJ, 642, 1029Verbunt, F. 1987, A&AS, 71, 339Wade, R. A., & Hubeny, I. 1998, ApJ, 509, 350Warner, B. 1995, Cataclysmic Variable Stars (Cambridge: Cambridge Univ.
Press)Welsh, W. F., Froning, C. S., Marsh, T. R., Robinson, E. L., & Wood, J. H.
2005, in ASP Conf. Ser. 330, The Astrophysics of Cataclysmic Variablesand Related Objects, ed. J.-M. Hameury & J.-P. Lasota (San Francisco, CA:ASP), 351
Welsh, W. F., Froning, C. S., Marsh, T. R., Reimer, T. W., Robinson, E. L.,& Wood, J. P. R. 2007, in ASP Conf. Ser. 362, The Seventh Pacific RimConference on Stellar Astrophysics, ed. W. Kang et al. (San Francisco, CA:ASP), 241
Winter, L., & Sion, E. M. 2003, ApJ, 582, 352