Embed Size (px)
Citation preview
Mon. Not. R. Astron. Soc. 410, 705–716 (2011) doi:10.1111/j.1365-2966.2010.17469.x
Discovery of a T dwarf + white dwarf binary system
A. C. Day-Jones,1,2�† D. J. Pinfield,2 M. T. Ruiz,1 H. Beaumont,2 B. Burningham,2
J. Gallardo,1 A. Gianninas,3 P. Bergeron,3 R. Napiwotzki,2 J. S. Jenkins,1
Z. H. Zhang,2 D. N. Murray,2 S. Catalan2 and J. Gomes2
1Departamento de Astronomia, Universidad de Chile, Camino del Observatorio 1515, Santiago, Chile2Centre for Astrophysics Research, University of Hertfordshire, College Lane, Hatfield, Hertfordshire AL10 9AB3Departement de Physique, Universite de Montreal, CP 6128, Succursale Centre-Ville, Montreal, Canada
Accepted 2010 August 3. Received 2010 August 2; in original form 2010 March 16
ABSTRACTWe present the discovery of the first T dwarf + white dwarf binary systemLSPM 1459+0857 AB, confirmed through common proper motion and spectroscopy. Thewhite dwarf is a high proper motion object from the LSPM catalogue that we confirm spectro-scopically to be a relatively cool (Teff = 5535 ± 45 K) and magnetic (B ∼ 2 MG) hydrogen-richwhite dwarf, with an age of at least 4.8 Gyr. The T dwarf is a recent discovery from the UKIRTInfrared Deep Sky Survey (ULAS 1459+0857) and has a spectral type of T4.5 ± 0.5 anda distance in the range 43–69 pc. With an age constraint (inferred from the white dwarf)of >4.8 Gyr, we estimate Teff = 1200–1500 K and log g = 5.4–5.5 for ULAS 1459+0857,making it a benchmark T dwarf with well-constrained surface gravity. We also compare the Tdwarf spectra with the latest LYON group atmospheric model predictions, which, despite someshortcomings, are in general agreement with the observed properties of ULAS 1459+0857.The separation of the binary components (16 500–26 500 au or 365 arcsec on the sky) is con-sistent with an evolved version of the more common brown dwarf + main-sequence (MS)binary systems now known, and although the system has a wide separation, it is shown to bestatistically robust as a non-spurious association. The observed colours of the T dwarf showthat it is relatively bright in the z band compared to other T dwarfs of similar type, and furtherinvestigation is warranted to explore the possibility that this could be a more generic indica-tor of older T dwarfs. Future observations of this binary system will provide even strongerconstraints on the T dwarf properties, and additional systems will combine to give a morecomprehensively robust test of the model atmospheres in this temperature regime.
Key words: binaries: general – brown dwarfs – white dwarfs.
1 IN T RO D U C T I O N
Large-scale near-infrared (NIR) and optical surveys, such asthe Two-Micron All-Sky Survey (2MASS), the Sloan DigitalSky Survey (SDSS) and the UKIRT Infrared Deep Sky Survey(UKIDSS), are aiding the identification of a rapidly increasingnumber of ‘field’ brown dwarfs (BDs) (e.g. Lodieu et al. 2007;Pinfield et al. 2008; Burningham et al. 2009), as well as probingdown into new cooler temperature regimes (Warren et al. 2007;Burningham et al. 2008; Delorme et al. 2008; Burningham et al.
�E-mail: [email protected]†Based on observations made with ESO telescopes at the La Silla ParanalObservatory under programme 282.C-5069(A).
2009; Leggett et al. 2009). In general, the estimation of propertiesof these BDs (e.g. age, mass, metallicity) currently relies on modelfitting. However, the models are very sensitive to a variety of poorlyunderstood processes in BD atmospheres, such as the formation ofdust condensates (Allard et al. 2001) and non-equilibrium chemistry(Saumon et al. 2007) and the spectroscopic fitting of atmosphericproperties (Teff , log g, [M/H]) is a major challenge. Crucially, thenature of BD evolution means that the mass–luminosity relationdepends strongly on the age, and in the absence of well-constrainedatmospheric properties, there is no way to accurately determine themass and age.
Identifying objects, where one can pin down these propertiesindependently, can help aid the calibration of models. BDs thatare members of binaries, where the primary member has age con-straints, are good sources of benchmark BDs (e.g. Day-Jones et al.
C© 2010 The Authors. Journal compilation C© 2010 RAS

706 A. C. Day-Jones et al.
2008; Burningham et al. 2009; Faherty et al. 2009; Zhang et al.2010). In particular, white dwarf (WD) primaries can provide ahard lower limit on the age of the system (from the WD coolingage) and in the case of high-mass WDs (where the MS progenitorstar will have a short lifetime and the age will thus be essentially thesame as the cooling age of the WD), they could provide ages con-strained at the 10 per cent level (Pinfield et al. 2006 and referencetherein).
Binary systems containing a WD and a BD however areobservationally rare (Farihi, Becklin & Zuckerman 2005), andonly a handful of such binaries have been identified. Todate, there are only five L dwarf + WD systems that havebeen spectroscopically confirmed: GD 165B (L4; Zuckerman& Becklin 1992), GD 1400 (L6/7; Farihi & Christopher 2004;Dobbie et al. 2005), WD 0137−349 (L8; Maxted et al. 2006;Burleigh et al. 2006), PG 1234+482 (L0; Steele et al. 2007; Mul-lally et al. 2007) and PHL 5038B (L8; Steele et al. 2009), previouslythe latest type BD companion to a WD. There have also been severalBD companions to WDs found as cataclysmic variables (CVs, e.g.Littlefair et al. 2008), although the nature of such objects meansthat they may be less useful in the context of studies of typical BDatmospheres.
We present here results from our ongoing search to identifywidely separated BD companions to WDs, expanding on our ear-lier searches of the 2MASS and SuperCOSMOS (Day-Jones et al.2008), to include the first results from our combined search of theUKIDSS and SuperCOSMOS. We present here the discovery ofthe first T dwarf + WD binary system, which we confirm throughcommon proper motion and spectroscopy.
In Section 2, we describe the ongoing search to identify andspectroscopically confirm late T dwarfs in the UKIDSS Large AreaSurvey (LAS). In Section 3, we describe our proper motion mea-surements of these confirmed T dwarfs and our techniques to searchfor binary companions to these objects. In Section 4, we describethe spectroscopy of a WD candidate companion and the resultingconstraints on its properties. In Section 5, we statistically assessthe likelihood that our new T dwarf + WD binary system is spuri-ous. Section 6 determines constraints for the atmospheric propertiesof the T dwarf, taking advantage of its benchmark age constraints(from the WD primary). We also perform some basic spectral modelfits to the T dwarf spectrum and compare the resulting predictions.Finally, in Section 7, we conclude with further discussion of thesystem as a useful benchmark and comment on the direction offuture work.
2 FI N D I N G T DWA R F S IN TH E U K I D S SL A R G E A R E A SU RV E Y
The UKIDSS LAS has been searched for T dwarfs using selec-tion techniques based on the observed UKIDSS+SDSS colours ofpreviously identified T dwarfs, as well as theoretical predictionsfor the cooler Teff = 400–700 K regime. The selection techniquesused to identify these T dwarfs are described in detail in Pinfieldet al. (2008). In this paper, we consider T dwarfs that were spec-troscopically confirmed (Burningham, private communication) bythe Summer of 2008 (see Pinfield et al. 2008 and a subsample ofBurningham et al. 2010) and the sky coverage appropriate to thissample includes the full LAS second data release, 72 per cent ofthe new sky in the third data release and 66 per cent of the newsky in the fourth data release. In total, this sample was identified in890 deg2 of the LAS sky.
2.1 Follow-up photometry and spectroscopy
Candidates are followed up in general with additional imaging inthe NIR and/or optical. This allows confirmation of the expected T-like colours and rules out various forms of contamination (e.g. faintM dwarfs with low signal-to-noise ratio (S/N) and blueward scat-tered NIR colours due to large photometric uncertainty, as wellas Solar system objects that can appear as non-detections due totheir motion). This follow-up has been performed using a variety oftelescope/instruments, including the Wide Field Camera (WFCAM)and Fast Track Imager (UFTI) on the UKIRT and the Long-slit Inter-mediate Resolution Infrared Spectrograph (LIRIS) on the WilliamHerschel Telescope (WHT) (all NIR), as well as the ESO Multi-Mode Instrument (EMMI) and the ESO Faint Object Spectrographand Camera (EFOSC2) on the New Technology Telescope (opti-cal). Spectroscopic confirmation of the LAS candidates was alsoachieved using a number of facilities, including the Near InfraredCamera and Spectrograph (NIRI) and the Gemini NearInfrared Spectrograph (GNIRS) on the Gemini telescopes, and theInfrared Camera Spectrograph (IRCS) on Subaru. The Near InfraredCamera Spectrograph (NICS) on the Telescopio Nazionale Galileo(TNG) and the UKIRT imager Spectrograph (UIST) were also usedfor the brighter T dwarfs. Details of the follow-up imaging and spec-troscopic strategies, as well as the relevant reduction and calibra-tion techniques used, are further discussed in Lodieu et al. (2007),Pinfield et al. (2008) and Burningham et al. (2010). Correspondingspectral types were derived using the unified T dwarf classificationscheme of Burgasser et al. (2006) with an extension from Burning-ham et al. (2008) for the latest types.
2.2 T dwarf distances
T dwarf distances have been estimated using the absolutemagnitude–spectral type relations from Liu et al. (2006), assum-ing that the T dwarfs are single objects. We calculated absolutemagnitude (MJ), choosing the J-band magnitude over the H andK bands, as models have suggested that the J band may be lesssensitive to variations in metallicity and gravity than the H and Kbands (e.g. Marley et al. 2002). The uncertainties in the distancewere obtained by taking into account the error in the spectral type(typically ±0.5) and the residuals of the polynomial fits from Liuet al. (2006). Fig. 1 shows the spectral type distance distributionfor the spectroscopically confirmed sample of 49 T dwarfs that we
Figure 1. T dwarf distance versus spectral type for our spectroscopicallyconfirmed T dwarfs with second epoch imaging.
C© 2010 The Authors. Journal compilation C© 2010 RAS, MNRAS 410, 705–716

Discovery of a T dwarf + white dwarf binary 707
Figure 2. A vector point diagram showing the proper motions of ourspectroscopically confirmed T dwarfs with good proper motion estimates(see Section 3). Shown are the different spectral types T4–6, T7–8 andT8+ as squares, triangles and circles, respectively. ULAS J1459+0857 andWolf 940B are also highlighted.
consider in this work. It can be seen that the sample spans the spec-tral type and distance range of T2–9 and 12–80 pc, respectively.This is comprised of two T2–3 dwarfs, 29 in the T4–6 range, 16T6–8 dwarfs and two T8+ dwarfs. Due to the cooler temperaturesand thus fainter nature of later T dwarfs, it can be seen that we aremore sensitive to earlier T dwarfs out to farther distances.
3 T DWARF PROPER MOTIONS
The photometric follow-up programme provided second epochimaging for the LAS T dwarfs, which we combined with the LASimages to give two epochs to calculate proper motion. We used theIRAF routines GEOMAP and GEOXYTRAN to derive a geometric transfor-mation between the two epoch images and to apply these transformsto the T dwarf positions, respectively. Centroiding uncertaintieswere calculated based on simulated data with appropriate Poissonnoise injected. The availability and quality of the measured propermotions of the T dwarfs are dependent on several factors, includingthe baseline between the epochs, the number of stars that can be usedfor positional reference in each of the images, the S/N of both the Tdwarf and the reference stars, and the proximity of the T dwarfs tothe edge of the WFCAM detector array (in the first epoch images).We were only able to measure the proper motions of 19 T dwarfsfrom the 49 strong sample of spectroscopic confirmations that weconsider, using an average of 12 reference stars across a baseline of0.5–1.5 Gyr. A vector-point diagram of the T dwarf proper motionsis shown in Fig. 2, where two T dwarfs found to have commonproper motion companions (see Section 3.1) are highlighted.
3.1 A search for common proper motion companions
We searched for candidate common proper motion companions toour sample of T dwarfs with reliable proper motions, by selecting amagnitude-limited sample of SuperCOSMOS sources, where R <
21 (the magnitude limit at which proper motions are measured) andhave accurately measured proper motions, such that PM/σ PM ≥3. We searched around each of the 19 T dwarfs out to an angularseparation corresponding to 20 000 au, at the estimated minimumdistance of each T dwarf. We choose a separation limit of 20 000 auin order to be sensitive to the detection of both widely separated
MS and WD companions. It is fairly common to find BD + MS starbinaries with separations of ∼5000 au (Gizis et al. 2001; Pinfieldet al. 2006). However, a WD companion could have even widerseparations, when one considers any outward migration that wouldhave occurred during the post-MS mass-loss phase. We suggest thatthe outward migration would likely be a factor of ∼4, as the initialand final separation of a low-mass binary companion is directlyrelated to the change in mass of the host star, that is, MMS/MWD
(Jeans 1924; Zuckerman & Becklin 1987). To illustrate this, weconsider a WD of mass ∼0.65 M� (roughly the mean of the WDmass distribution). The progenitor mass would be ∼2.7 M� (fromthe initial–final mass relations of Dobbie et al. 2006; Catalan et al.2008; Kalirai et al. 2008), such that MMS/MWD ∼ 4. Thus, for BD+ MS binaries separated by 5000 au, we could expect their finalseparation to be up to ∼20 000 au.
For each common proper motion companion candidate, we as-sumed a distance that was the same as the estimated distance ofthe relevant T dwarf, and thus placed companion candidates on anabsolute B magnitude (MB) versus B − R colour–magnitude dia-gram. Their positions were compared with those expected for MSstars and WDs, following the approaches described in Clarke et al.(2009) and Day-Jones et al. (2008), respectively. We then comparedtheir SDSS colours with respect to stellar populations, includingMS stars (Hipparcos; Perryman et al. 1997), M dwarfs (West et al.2004), K subdwarfs (Yong & Lambert 2003) and WDs (McCook& Sion 1999; Eisenstein et al. 2006). We found that only one MScompanion candidate was identified, Wolf 940, which had previ-ously been identified serendipitously by Burningham et al. (2009)and will not be discussed further. We also identified five candidateWD companions to the T dwarfs in our sample that are commonproper motion (to within the uncertainties) and are consistent withthe WD sequence (see Figs 3 and 4), if assumed to be at the samedistance as their T dwarf companions.
The brightest of our WD candidates appears in the LSPM cat-alogue (LSPM J1459+0851, Lepine & Shara 2005) as a highproper motion object, although it has not been previously stud-ied spectroscopically. The T dwarf associated with this object isULAS J1459+0857, which has been spectroscopically typed as aT4.5 ± 0.5 dwarf (Burningham et al. 2010). This pair is highlightedin Figs 3 and 4.
3.2 Possible contamination
To assess the possibility that our candidate WD companions maybe dominated by high-velocity background objects, such as metal-poor, halo K subdwarfs (which could populate the same colour andproper motion space that we search in this work), we have derivedspace motion estimates, assuming that our candidates are K subd-warfs. We used the relations of Ivezic et al. (2008) to estimate anabsolute r′ magnitude (Mr ′ ) from g′ − i′ colour, for a metallicityrange (for subdwarfs) of −0.5 and −2.5, and thus obtained distanceconstraints applicable, if these objects are subdwarfs. Assuming, forsimplicity, that they have a zero radial velocity, we then estimatedspace motions to assess potential halo membership. All except onecandidate would have space motions of 2000–12 000 km s−1, whichare thus not consistent with a Galactic halo population. The ex-ception is close enough, such that its kinematics are consistentwith a background subdwarf member. Indeed, this is one of thewidest separated candidates (400 arcsec), and the level of back-ground contamination for such separation (and volume) approaches1, even for the low-density halo luminosity function (Gould 2003).
C© 2010 The Authors. Journal compilation C© 2010 RAS, MNRAS 410, 705–716
708 A. C. Day-Jones et al.
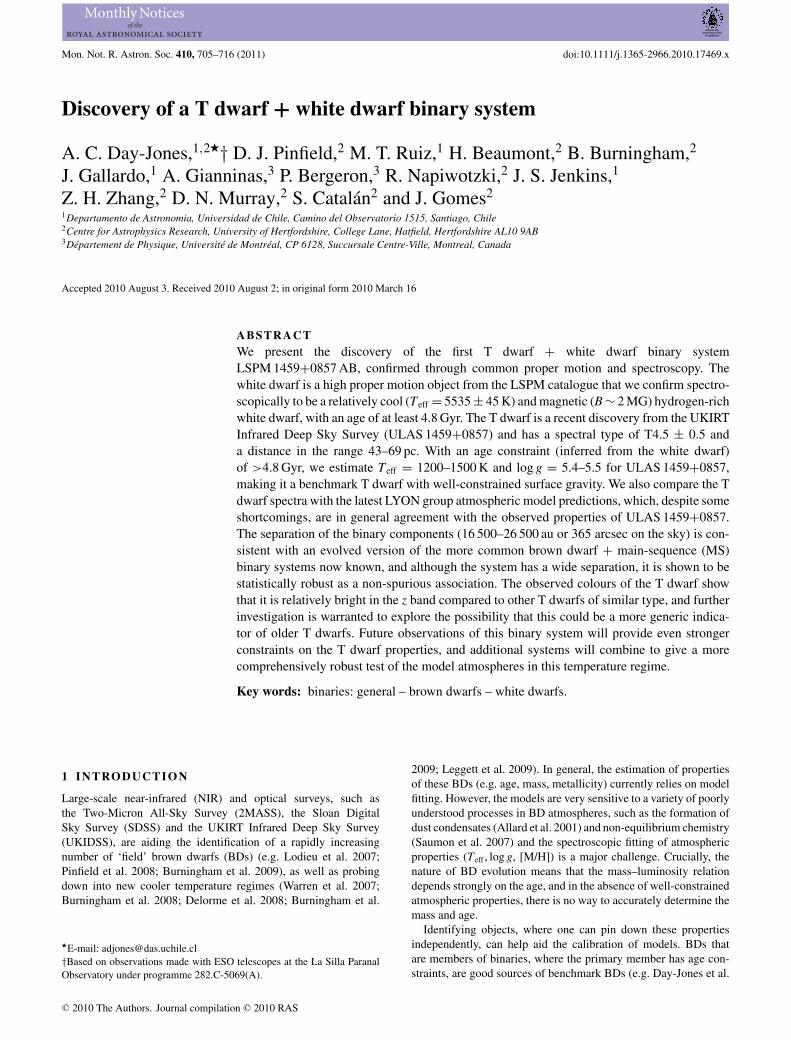
Figure 3. A colour–magnitude diagram of WDs from McCook & Sion (1999) with known parallax (crosses). Photometry is on the SuperCOSMOS system.Overplotted are model cooling tracks (see main text) for WD masses of 0.5, 0.7 and 1.2 M� (dotted, dashed and dot–dashed lines, respectively). Alsooverplotted is our WD selection region (two solid lines), along with our candidate WD companions (large stars). LSPM J1459+0851 is circled for reference.
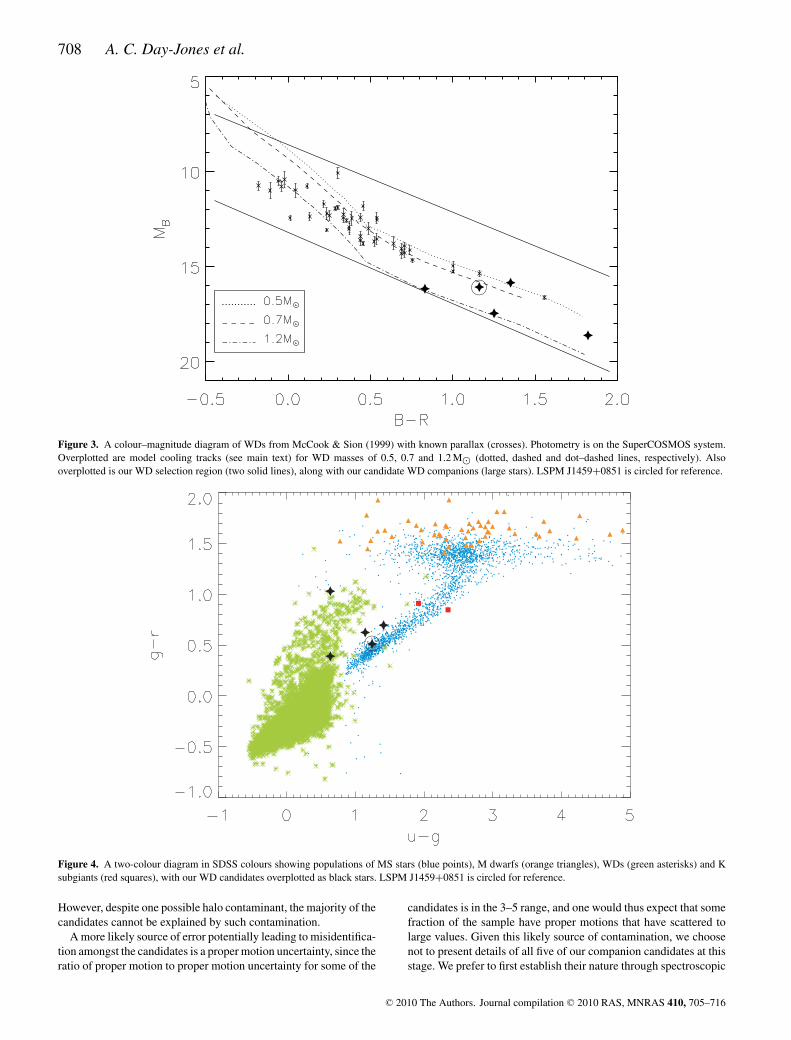
Figure 4. A two-colour diagram in SDSS colours showing populations of MS stars (blue points), M dwarfs (orange triangles), WDs (green asterisks) and Ksubgiants (red squares), with our WD candidates overplotted as black stars. LSPM J1459+0851 is circled for reference.
However, despite one possible halo contaminant, the majority of thecandidates cannot be explained by such contamination.
A more likely source of error potentially leading to misidentifica-tion amongst the candidates is a proper motion uncertainty, since theratio of proper motion to proper motion uncertainty for some of the
candidates is in the 3–5 range, and one would thus expect that somefraction of the sample have proper motions that have scattered tolarge values. Given this likely source of contamination, we choosenot to present details of all five of our companion candidates at thisstage. We prefer to first establish their nature through spectroscopic
C© 2010 The Authors. Journal compilation C© 2010 RAS, MNRAS 410, 705–716

Discovery of a T dwarf + white dwarf binary 709
study, and in that way, confirm them (or otherwise) as genuine WDcompanions. We have so far only obtained good spectroscopy forboth components of the binary containing LSPM J1459+0851 andthus focus the remainder of the paper on this system.
4 SPECTRO SCOPIC OBSERVATIONS OF LSPMJ 1 4 5 9+0 8 5 1
Spectroscopic observations of LSPM J1459+0851 were obtainedwith FORS2 on the Very Large Telescope on 2009 May 15 and21, with Directors Discretionary Time in program 282.C-5069(A).We used the long-slit mode in the optical wavelength range 3300–8000 Å with a dispersion of 50 and 55 Å mm−1, respectively, forthe ranges 3300–6210 Å (corresponding to the B grism) and 5120–8450 Å (corresponding to the RI grism), giving a resolution of R ∼1200. Three integrations of 600 s were taken, giving a total exposuretime of 30 min for the B grism and two integrations of 360s, totalingto 12 min in the RI grism. Sky flats, arc frames and the spectra ofa featureless (DC) WD as well as a standard F-type star and ahydrogen-rich (DA) WD were taken during the same night at asimilar airmass to the target so as to provide wavelength, flux andtelluric calibrations.
Standard IRAF routines were used to reduce the spectra, includingflat-fielding and cosmic-ray removal. The spectra were extractedwith APALL, using a Chebyshev function to fit the background and athird-order Legendre function to trace the fit to the spectrum. Thewavelength calibration was done using the spectrum from HgCd-HeAr and HgCdHeNeAr arc lamps for the B and RI grisms, re-spectively, and using IDENTIFY to reference the arc lines, along withthe DISPCOR routine to correct the dispersion of the spectrum. Theresulting spectra of both LSPM J1459+0851 and the standard weredivided by the smooth spectrum of the DC WD, which has no in-trinsic spectral features, enabling correction for the instrumentalresponse. The standard stars (one for each grism) were then usedto flux calibrate the spectrum. The two spectra were then stitchedtogether in the overlapping sections and normalized at 6000 Å. Thefinal spectrum of LSPM J1459+0851 is shown in Fig. 5.
It can be seen that some residual tellurics remain and are high-lighted for reference. They do not, however, affect the subsequentanalysis in any way, since they do not overlap with features useddirectly to assess WD properties. The general spectral shape is quiteblackbody-like, consistent with a WD or perhaps a very metal poor
Figure 5. The optical spectra of LSPM J1459+0851, normalized at 6000 Å.
Figure 6. Optical spectrum in the region of Hα for the WD LSPMJ1459+0851. For comparison, the spectra of three similar cool, hydrogen-rich, magnetic WDs, WD 0011−134 (B ∼ 16.7 MG), WD 1330+015 (B ∼7.4 MG) and WD 0503−174 (B ∼ 7.3 MG) are also shown, with magneticfield strength decreasing from top to bottom.
subdwarf (e.g. Jao et al. 2008). However, the overall strength ofthe Hα line and the peak of the blackbody-like continuum are onlyconsistent with a relatively cool example of a WD (Kilic et al.2006). We also compare LSPM J1459+0851 to the spectra of threeother very cool, DA WDs, WD 0011−134, WD 1330+015 andWD 0503−174, taken from Bergeron, Ruiz & Leggett (1992) andBergeron, Ruiz & Leggett (1993). They have corresponding valuesof Teff of 6000 ± 150, 7450 ± 200 and 5230 ± 140 K, respectively,and are shown in Fig. 6. Although the spectra of LSPM J1459+0851are noisier, it can be seen that the extent of the Hα feature is consis-tent with a cool, DA WD. We further assess its properties in moredetail in the following sections.
4.1 Synthetic photometry and fitting procedure
As previously noted, the spectrum shows a lack of strong H lines,which would be expected for a hotter more typical WD. Photo-metric fitting of the full optical–NIR spectral energy distribution(SED) is thus optimal for determining the effective temperatureof the WD, using model fits to the SDSS+UKIDSS photometryand assuming a distance equal to that of the T dwarf companion.The spectra are consistent with a cool WD, showing no strong fea-tures in the spectrum blueward of 6000 Å and just a hint of Hα.We performed a fit to the available photometry of the WD (fromSDSS, USNO and UKIDSS) using the atmospheric model codes ofBergeron et al., which are described at length in Bergeron, Wese-mael & Beauchamp (1995, with updates given in Bergeron, Leggett& Ruiz 2001; Bergeron et al. 2005). These models are in local
C© 2010 The Authors. Journal compilation C© 2010 RAS, MNRAS 410, 705–716
710 A. C. Day-Jones et al.
thermodynamic equilibrium and allow energy transport by convec-tion and can be calculated with arbitrary amounts of hydrogen andhelium. Synthetic colours1 were obtained using the procedure out-lined in Holberg & Bergeron (2006) based on the Vega fluxes takenfrom Bohlin & Gilliland (2004).
The method used to fit the photometric data is similar to that de-scribed in Bergeron et al. (2001), which we briefly summarize here.We first transform the magnitudes in each bandpass into observedaverage fluxes f m
λ using the following equation:
m = −2.5 log f mλ + cm, (1)
where
f mλ =
∫ ∞0 fλSm(λ)dλ∫ ∞
0 Sm(λ)dλ. (2)
The transmission functions Sm(λ) along with the constants cm foreach bandpass are described in Holberg & Bergeron (2006) andreferences therein. To make use of all the photometric measure-ments simultaneously, we convert the magnitudes into observedfluxes using equation (1) and compare the resulting energy distribu-tions with those predicted from our model atmosphere calculations.Thus, we obtain a set of average fluxes f m
λ , which can now be com-pared with the model fluxes. These model fluxes are also averagedover the filter bandpasses by substituting f λ in equation (2) for themonochromatic Eddington flux Hλ. The average observed fluxes f m
λ
and model fluxes Hmλ , which depend on Teff , log g and N(He)/N(H),
are related by the equation
f mλ = 4π
(R
D
)2
Hmλ , (3)
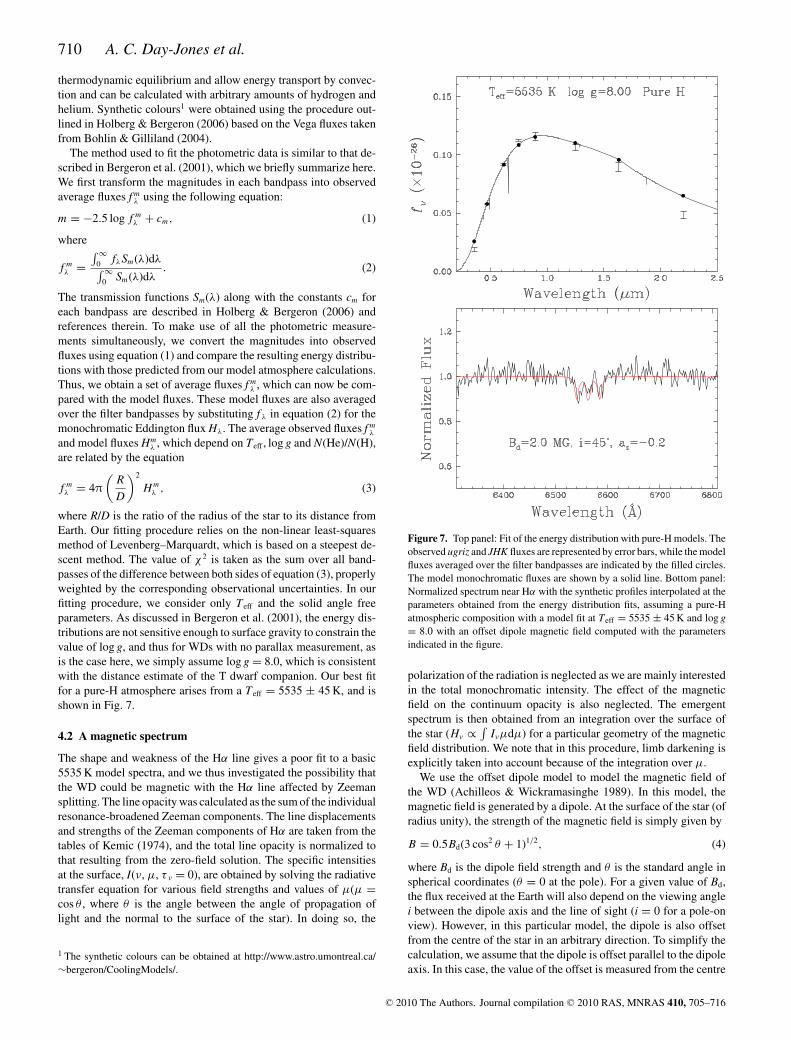
where R/D is the ratio of the radius of the star to its distance fromEarth. Our fitting procedure relies on the non-linear least-squaresmethod of Levenberg–Marquardt, which is based on a steepest de-scent method. The value of χ 2 is taken as the sum over all band-passes of the difference between both sides of equation (3), properlyweighted by the corresponding observational uncertainties. In ourfitting procedure, we consider only Teff and the solid angle freeparameters. As discussed in Bergeron et al. (2001), the energy dis-tributions are not sensitive enough to surface gravity to constrain thevalue of log g, and thus for WDs with no parallax measurement, asis the case here, we simply assume log g = 8.0, which is consistentwith the distance estimate of the T dwarf companion. Our best fitfor a pure-H atmosphere arises from a Teff = 5535 ± 45 K, and isshown in Fig. 7.
4.2 A magnetic spectrum
The shape and weakness of the Hα line gives a poor fit to a basic5535 K model spectra, and we thus investigated the possibility thatthe WD could be magnetic with the Hα line affected by Zeemansplitting. The line opacity was calculated as the sum of the individualresonance-broadened Zeeman components. The line displacementsand strengths of the Zeeman components of Hα are taken from thetables of Kemic (1974), and the total line opacity is normalized tothat resulting from the zero-field solution. The specific intensitiesat the surface, I(ν, μ, τ ν = 0), are obtained by solving the radiativetransfer equation for various field strengths and values of μ(μ =cos θ , where θ is the angle between the angle of propagation oflight and the normal to the surface of the star). In doing so, the
1 The synthetic colours can be obtained at http://www.astro.umontreal.ca/∼bergeron/CoolingModels/.
Figure 7. Top panel: Fit of the energy distribution with pure-H models. Theobserved ugriz and JHK fluxes are represented by error bars, while the modelfluxes averaged over the filter bandpasses are indicated by the filled circles.The model monochromatic fluxes are shown by a solid line. Bottom panel:Normalized spectrum near Hα with the synthetic profiles interpolated at theparameters obtained from the energy distribution fits, assuming a pure-Hatmospheric composition with a model fit at Teff = 5535 ± 45 K and log g= 8.0 with an offset dipole magnetic field computed with the parametersindicated in the figure.
polarization of the radiation is neglected as we are mainly interestedin the total monochromatic intensity. The effect of the magneticfield on the continuum opacity is also neglected. The emergentspectrum is then obtained from an integration over the surface ofthe star (Hν ∝ ∫
Iνμdμ) for a particular geometry of the magneticfield distribution. We note that in this procedure, limb darkening isexplicitly taken into account because of the integration over μ.
We use the offset dipole model to model the magnetic field ofthe WD (Achilleos & Wickramasinghe 1989). In this model, themagnetic field is generated by a dipole. At the surface of the star (ofradius unity), the strength of the magnetic field is simply given by
B = 0.5Bd(3 cos2 θ + 1)1/2, (4)
where Bd is the dipole field strength and θ is the standard angle inspherical coordinates (θ = 0 at the pole). For a given value of Bd,the flux received at the Earth will also depend on the viewing anglei between the dipole axis and the line of sight (i = 0 for a pole-onview). However, in this particular model, the dipole is also offsetfrom the centre of the star in an arbitrary direction. To simplify thecalculation, we assume that the dipole is offset parallel to the dipoleaxis. In this case, the value of the offset is measured from the centre
C© 2010 The Authors. Journal compilation C© 2010 RAS, MNRAS 410, 705–716

Discovery of a T dwarf + white dwarf binary 711
of the star and is denoted by az (in units of stellar radius). Note thatwith the offset dipole models, the value of the dipole field strength,Bd, is no longer equal to the value of the polar field strength.
We computed a series of synthetic spectra based on a modelatmosphere of pure hydrogen with Teff = 5535 K and log g = 8.0,while varying Bd, i and az. We display in Fig. 7 the model whichbest reproduced the observed line profile with Bd = 2.0 MG, i =45◦ and az = −0.20. It should be noted that varying the inclinationangle i produced only slight variations in the line profiles and asstated in Bergeron et al. (1992), it is not possible to constrain i fromobserved line profiles alone. The Zeeman-split Hα line in LSPMJ1459+0851 can be compared to the same feature in other coolWDs of higher magnetic field strengths in Fig. 6.
4.3 White dwarf age and progenitor lifetime
We start by considering the simple case of a non-magnetic WDfor a Teff and log g of 5535 K and 8.0, respectively, for whichwe calculate a mass of 0.585 M� (Fontaine, Brassard & Bergeron2001). The corresponding cooling age of a 0.585-M� WD, with aTeff = 5535 K, was then calculated as 3 Gyr, using the isochronesof Fontaine et al. (2001). The total age of the WD comprisesboth the cooling time and its progenitor lifetime on the MS. Inorder to constrain the MS lifetime, we accessed the initial–finalmass relations of Ferrario et al. (2005), Catalan et al. (2008) andKalirai et al. (2008) to estimate a likely, initial-mass constraint forthe MS progenitor star of 1.50–1.75 M�. We then used the tracks ofLachaume et al. (1999) to estimate the MS lifetime for stars of suchmass as 1.8–3.0 Gyr. It should be noted, however, that the modeltracks converge for masses <2 M�, and as a result the ages of theseobjects can be largely uncertain (up to 10 Gyr).
The strong magnetic field present also provides an additionalfactor to consider when assessing age. The origin of such strongWD magnetic fields is not fully understood but is thought to havearisen in one of the following two favoured scenarios:
(i) From a single star. The magnetic field is thought to derivefrom a massive, magnetic progenitor of ∼1.5–8 M�, typically anAp or Bp star. The magnetic field is then maintained through the MSevolution to the WD phase by flux conservation (Wickramasinghe& Ferrario 2000).
(ii) From the merger of two stellar cores in a common envelope(CE) event or the merger of two degenerate objects. During the CEphase the orbits of the two cores spiral in closer together throughfrictional forces causing differential rotation, which coupled withconvection in the cores, creates a stellar-magnetic dynamo (Tout& Pingle 1992). Close, but separated, cores form CVs, but somecores coalesce and cool to form a magnetic WD. It may also bepossible that two very close WDs emerge from the CE phase, suchas G62–46 (Bergeron et al. 1993), where one component is highlymagnetic.
In general, it is observed that magnetic WDs have larger massesthan the more typical non-magnetic WDs (Liebert 1988). Thereare two possible hypotheses to explain this. First, in accordancewith the favoured scenario for the formation of isolated magneticWDs (Wickramasinghe & Ferrario 2005), the progenitor was moremassive, leading to a massive WD. In this case, the magnetic fieldhas no effect during the progenitor evolution. Secondly, the effectof the magnetic field has an impact on the stellar evolution, suchthat it could inhibit mass loss (Wickramasinghe & Ferrario 2000),leading to a more massive core and a longer progenitor lifetime. Ifwe consider the possibility that our WD could be of higher mass, for
Table 1. Parameters of the WD LSPM J1459+0851.
Parameter Value
RA . . .. . .. . .. . . 14h59m32.s05Dec. . . .. . .. . .. . . +08◦51′28.′′1SDSS ′u . . .. . .. . .. . . 20.74 ± 0.08SDSS ′g . . .. . .. . .. . . 19.50 ± 0.01SDSS ′r . . .. . .. . .. . . 18.99 ± 0.01SDSS ′i . . .. . .. . .. . . 18.76 ± 0.05SDSS ′z . . .. . .. . .. . . 18.71 ± 0.03SuperCOSMOS B . . .. . .. . .. . . ∼19.48SuperCOSMOS R . . .. . .. . .. . . ∼18.33SuperCOSMOS I . . .. . .. . .. . . ∼18.29USNO B . . .. . .. . .. . . ∼19.8USNO R . . .. . .. . .. . . ∼18.8USNO I . . .. . .. . .. . . ∼18.2UKIDSS Y . . .. . .. . .. . . 18.14 ± 0.02UKIDSS J . . .. . .. . .. . . 17.90 ± 0.02UKIDSS H . . .. . .. . .. . . 17.65 ± 0.04UKIDSS K . . .. . .. . .. . . 17.79 ± 0.06μ RA . . .. . .. . .. . . −170 ± 3 mas yr−1a
μ Dec. . . .. . .. . .. . . −42 ± 6 mas yr−1a
Teff . . .. . .. . .. . . 5535 ± 45 Klog g . . .. . .. . .. . . 8.0 dexMass . . .. . .. . .. . . 0.585 M�WD age . . .. . .. . .. . . >4.8 Gyr
aUSNO-B1.
example, 0.8 M� (the mean mass of a highly magnetic WD; Kawkaet al. 2007), then the cooling time would be longer, around 6 Gyr(Fontaine et al. 2001). In this case, the progenitor (if a single star)would be around 3.5 M� (Catalan et al. 2008) and the progenitorMS lifetime would be 0.3 Gyr (assuming normal models). However,there is also evidence that many magnetic WDs have masses closerto the peak of the non-magnetic mass distribution (Tout et al. 2008).
As we cannot know which scenario is responsible for the observedmagnetic field, nor can we measure more accurately the mass ofthe WD, we do not know the effects this may have had on theMS evolution. In any case, both scenarios for a magnetic and anon-magnetic WD result in ages greater than 4.8 Gyr (the coolingage plus the minimum progenitor lifetime of a non-magnetic WD)and we thus choose to adopt this as the minimum age for LSPMJ1459+0851. Properties of the new WD are given in Table 1.
5 LS P M J 1 4 5 9+0 8 5 1 – U L A S J 1 4 5 9+0 8 5 7 :A BOUND SYSTEM?
In order to determine if this new system is a bona fide binary system,we have statistically assessed the likelihood that two such objectscould be a line-of-sight association with photometry and proper mo-tion consistent with binarity by random chance. We first calculatedthe total region of sky around our T dwarf corresponding to the cov-erage encompassed by the projected line-of-sight separation of theWD. We then combined this with the T dwarf distance constraint(43–69 pc), allowing for the possibility that the T dwarf might it-self be an unresolved binary (at a greater distance), to estimate avolume of sky in which WDs might be line-of-sight contamination.We then used the number density of WDs (e.g. Schroder, Pauli &Napiwotzki 2004) to estimate that we would expect only 0.003 68WDs in this volume of space.
To factor in the probability that two objects might have a commonproper motion at the level of our measurements, we downloaded amagnitude-limited sample (R < 21, the same as our initial selection;
C© 2010 The Authors. Journal compilation C© 2010 RAS, MNRAS 410, 705–716
712 A. C. Day-Jones et al.
Table 2. Parameters of the binary system.
Parameter Value
Separation on sky . . .. . .. . .. . . 385 arcsecEstimated distance . . .. . .. . .. . . 43–69 pca
Estimated line of sight separation . . .. . .. . .. . . 16 500–26 500 aua
aAssuming that the T dwarf is a singular or unresolved binary.
see Section 3.1) of objects from the SuperCOSMOS ScienceArchive. We applied a limit to the proper motion uncertainty of<50 mas yr−1 and required objects to lie in the colour range 1 <
B − R < 3 (where we expect contaminant, MS stars to populate).This sample of 10 360 sources was selected from within one degreeof the T dwarf as to provide a representative sample of objects inthe area of sky in which we find our binary system. We then placedthese objects on a colour–magnitude diagram and selected only ob-jects that occupied a region populated by MS stars, when placed atthe distance range estimated for the T dwarf. Of the 140 objects thatwere selected in this way, 13 had proper motion consistent (at the1σ level) with the T dwarf, leading to a probability of 0.092 thata contaminant star could have proper motion common with the Tdwarf.
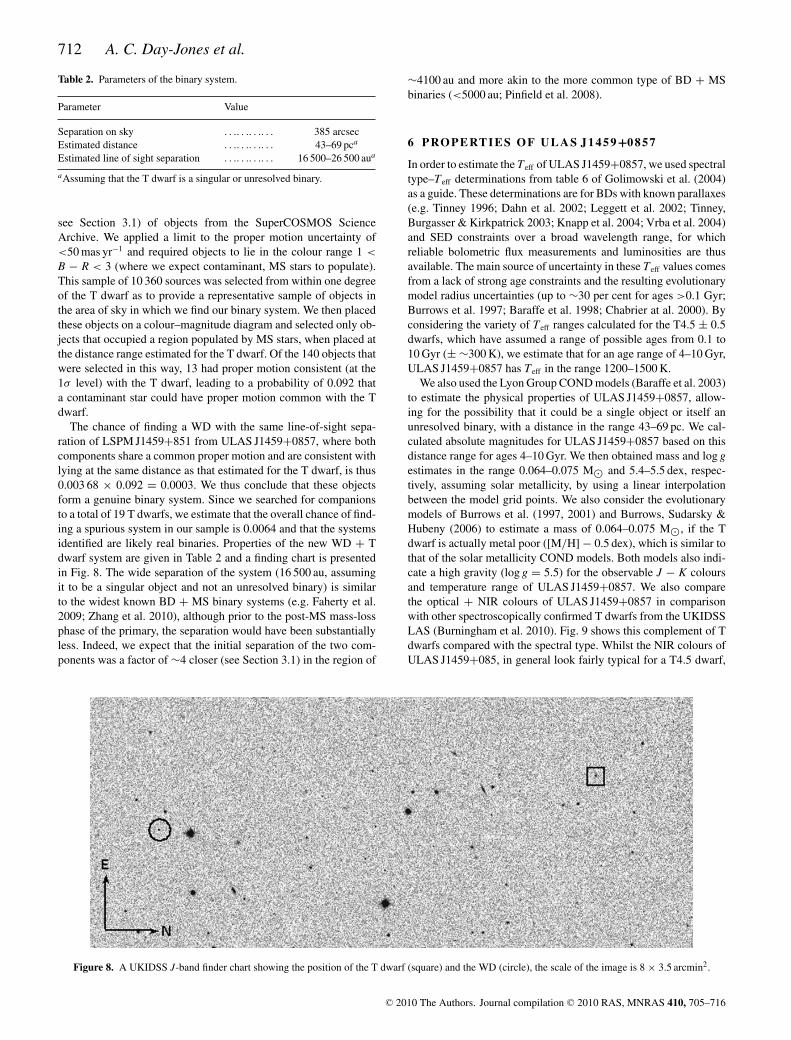
The chance of finding a WD with the same line-of-sight sepa-ration of LSPM J1459+851 from ULAS J1459+0857, where bothcomponents share a common proper motion and are consistent withlying at the same distance as that estimated for the T dwarf, is thus0.003 68 × 0.092 = 0.0003. We thus conclude that these objectsform a genuine binary system. Since we searched for companionsto a total of 19 T dwarfs, we estimate that the overall chance of find-ing a spurious system in our sample is 0.0064 and that the systemsidentified are likely real binaries. Properties of the new WD + Tdwarf system are given in Table 2 and a finding chart is presentedin Fig. 8. The wide separation of the system (16 500 au, assumingit to be a singular object and not an unresolved binary) is similarto the widest known BD + MS binary systems (e.g. Faherty et al.2009; Zhang et al. 2010), although prior to the post-MS mass-lossphase of the primary, the separation would have been substantiallyless. Indeed, we expect that the initial separation of the two com-ponents was a factor of ∼4 closer (see Section 3.1) in the region of
∼4100 au and more akin to the more common type of BD + MSbinaries (<5000 au; Pinfield et al. 2008).
6 PRO P E RT I E S O F U L A S J 1 4 5 9+0 8 5 7
In order to estimate the Teff of ULAS J1459+0857, we used spectraltype–Teff determinations from table 6 of Golimowski et al. (2004)as a guide. These determinations are for BDs with known parallaxes(e.g. Tinney 1996; Dahn et al. 2002; Leggett et al. 2002; Tinney,Burgasser & Kirkpatrick 2003; Knapp et al. 2004; Vrba et al. 2004)and SED constraints over a broad wavelength range, for whichreliable bolometric flux measurements and luminosities are thusavailable. The main source of uncertainty in these Teff values comesfrom a lack of strong age constraints and the resulting evolutionarymodel radius uncertainties (up to ∼30 per cent for ages >0.1 Gyr;Burrows et al. 1997; Baraffe et al. 1998; Chabrier at al. 2000). Byconsidering the variety of Teff ranges calculated for the T4.5 ± 0.5dwarfs, which have assumed a range of possible ages from 0.1 to10 Gyr (± ∼300 K), we estimate that for an age range of 4–10 Gyr,ULAS J1459+0857 has Teff in the range 1200–1500 K.
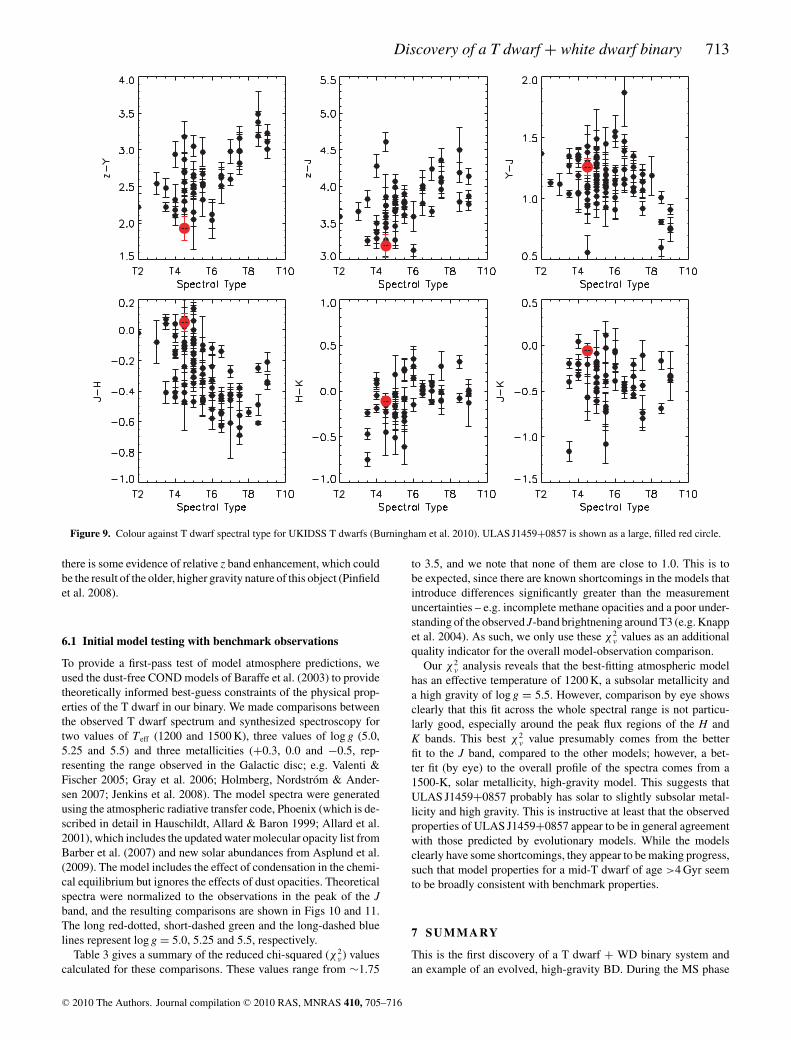
We also used the Lyon Group COND models (Baraffe et al. 2003)to estimate the physical properties of ULAS J1459+0857, allow-ing for the possibility that it could be a single object or itself anunresolved binary, with a distance in the range 43–69 pc. We cal-culated absolute magnitudes for ULAS J1459+0857 based on thisdistance range for ages 4–10 Gyr. We then obtained mass and log gestimates in the range 0.064–0.075 M� and 5.4–5.5 dex, respec-tively, assuming solar metallicity, by using a linear interpolationbetween the model grid points. We also consider the evolutionarymodels of Burrows et al. (1997, 2001) and Burrows, Sudarsky &Hubeny (2006) to estimate a mass of 0.064–0.075 M�, if the Tdwarf is actually metal poor ([M/H] − 0.5 dex), which is similar tothat of the solar metallicity COND models. Both models also indi-cate a high gravity (log g = 5.5) for the observable J − K coloursand temperature range of ULAS J1459+0857. We also comparethe optical + NIR colours of ULAS J1459+0857 in comparisonwith other spectroscopically confirmed T dwarfs from the UKIDSSLAS (Burningham et al. 2010). Fig. 9 shows this complement of Tdwarfs compared with the spectral type. Whilst the NIR colours ofULAS J1459+085, in general look fairly typical for a T4.5 dwarf,
Figure 8. A UKIDSS J-band finder chart showing the position of the T dwarf (square) and the WD (circle), the scale of the image is 8 × 3.5 arcmin2.
C© 2010 The Authors. Journal compilation C© 2010 RAS, MNRAS 410, 705–716
Discovery of a T dwarf + white dwarf binary 713
Figure 9. Colour against T dwarf spectral type for UKIDSS T dwarfs (Burningham et al. 2010). ULAS J1459+0857 is shown as a large, filled red circle.
there is some evidence of relative z band enhancement, which couldbe the result of the older, higher gravity nature of this object (Pinfieldet al. 2008).
6.1 Initial model testing with benchmark observations
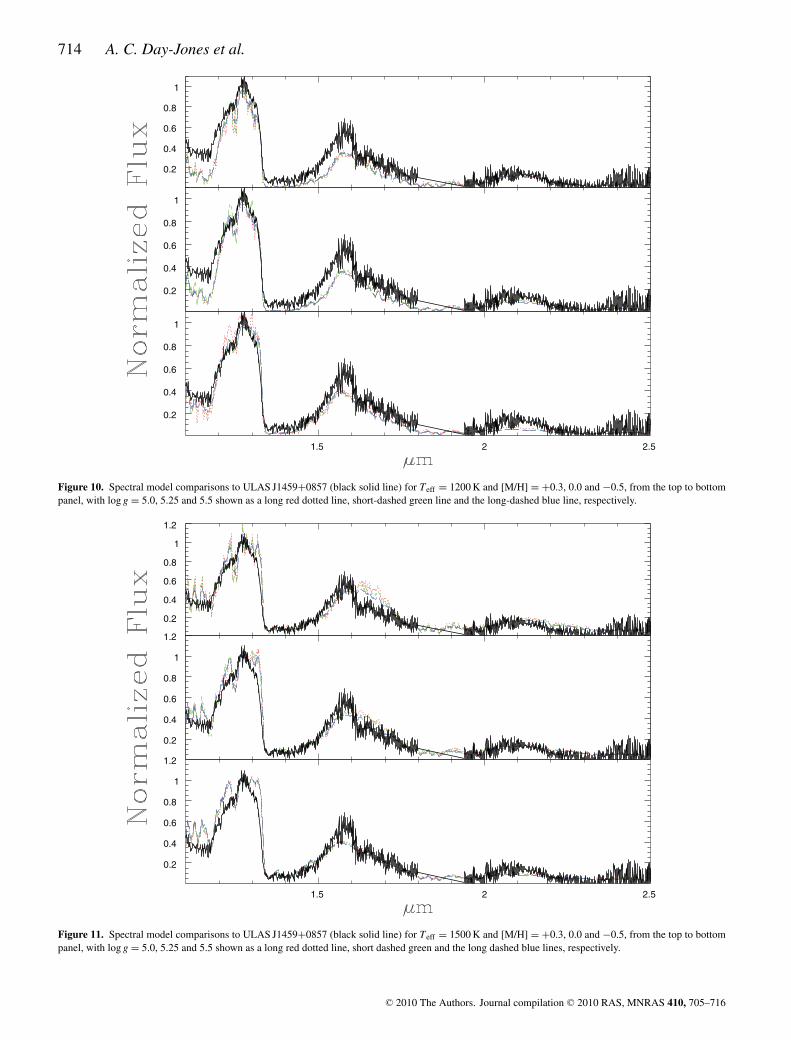
To provide a first-pass test of model atmosphere predictions, weused the dust-free COND models of Baraffe et al. (2003) to providetheoretically informed best-guess constraints of the physical prop-erties of the T dwarf in our binary. We made comparisons betweenthe observed T dwarf spectrum and synthesized spectroscopy fortwo values of Teff (1200 and 1500 K), three values of log g (5.0,5.25 and 5.5) and three metallicities (+0.3, 0.0 and −0.5, rep-resenting the range observed in the Galactic disc; e.g. Valenti &Fischer 2005; Gray et al. 2006; Holmberg, Nordstrom & Ander-sen 2007; Jenkins et al. 2008). The model spectra were generatedusing the atmospheric radiative transfer code, Phoenix (which is de-scribed in detail in Hauschildt, Allard & Baron 1999; Allard et al.2001), which includes the updated water molecular opacity list fromBarber et al. (2007) and new solar abundances from Asplund et al.(2009). The model includes the effect of condensation in the chemi-cal equilibrium but ignores the effects of dust opacities. Theoreticalspectra were normalized to the observations in the peak of the Jband, and the resulting comparisons are shown in Figs 10 and 11.The long red-dotted, short-dashed green and the long-dashed bluelines represent log g = 5.0, 5.25 and 5.5, respectively.
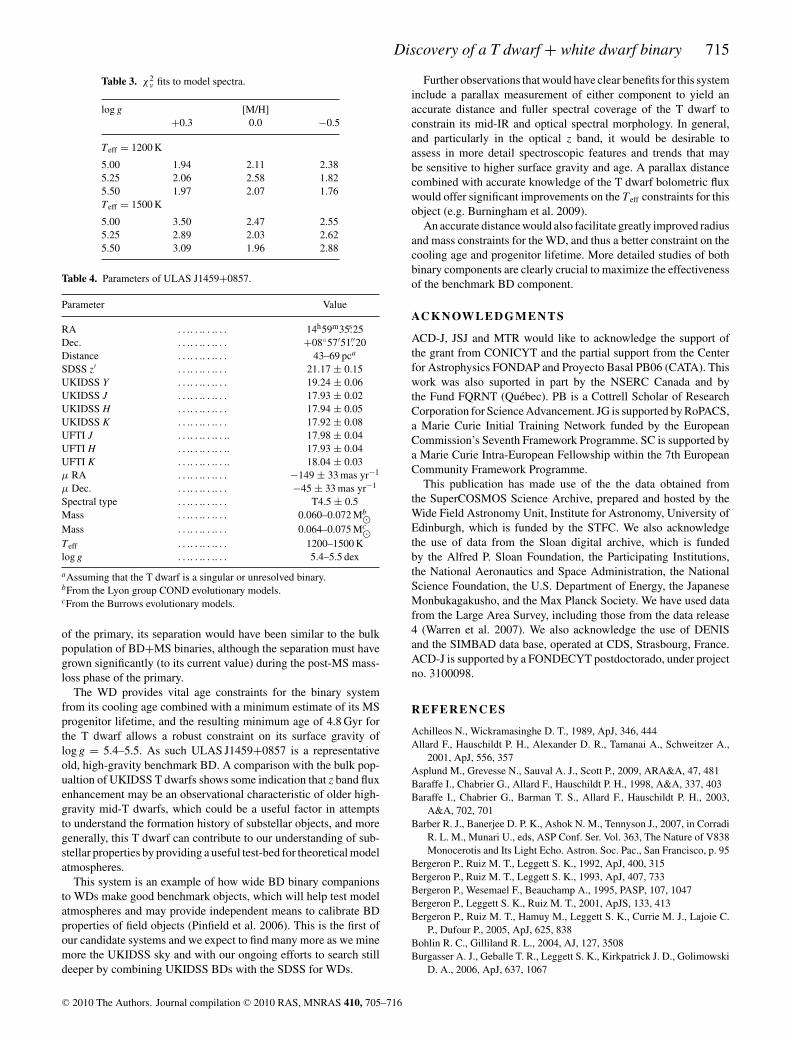
Table 3 gives a summary of the reduced chi-squared (χ 2ν) values
calculated for these comparisons. These values range from ∼1.75
to 3.5, and we note that none of them are close to 1.0. This is tobe expected, since there are known shortcomings in the models thatintroduce differences significantly greater than the measurementuncertainties – e.g. incomplete methane opacities and a poor under-standing of the observed J-band brightnening around T3 (e.g. Knappet al. 2004). As such, we only use these χ 2
ν values as an additionalquality indicator for the overall model-observation comparison.
Our χ 2ν analysis reveals that the best-fitting atmospheric model
has an effective temperature of 1200 K, a subsolar metallicity anda high gravity of log g = 5.5. However, comparison by eye showsclearly that this fit across the whole spectral range is not particu-larly good, especially around the peak flux regions of the H andK bands. This best χ 2
ν value presumably comes from the betterfit to the J band, compared to the other models; however, a bet-ter fit (by eye) to the overall profile of the spectra comes from a1500-K, solar metallicity, high-gravity model. This suggests thatULAS J1459+0857 probably has solar to slightly subsolar metal-licity and high gravity. This is instructive at least that the observedproperties of ULAS J1459+0857 appear to be in general agreementwith those predicted by evolutionary models. While the modelsclearly have some shortcomings, they appear to be making progress,such that model properties for a mid-T dwarf of age >4 Gyr seemto be broadly consistent with benchmark properties.
7 SU M M A RY
This is the first discovery of a T dwarf + WD binary system andan example of an evolved, high-gravity BD. During the MS phase
C© 2010 The Authors. Journal compilation C© 2010 RAS, MNRAS 410, 705–716
714 A. C. Day-Jones et al.
Figure 10. Spectral model comparisons to ULAS J1459+0857 (black solid line) for Teff = 1200 K and [M/H] = +0.3, 0.0 and −0.5, from the top to bottompanel, with log g = 5.0, 5.25 and 5.5 shown as a long red dotted line, short-dashed green line and the long-dashed blue line, respectively.
Figure 11. Spectral model comparisons to ULAS J1459+0857 (black solid line) for Teff = 1500 K and [M/H] = +0.3, 0.0 and −0.5, from the top to bottompanel, with log g = 5.0, 5.25 and 5.5 shown as a long red dotted line, short dashed green and the long dashed blue lines, respectively.
C© 2010 The Authors. Journal compilation C© 2010 RAS, MNRAS 410, 705–716
Discovery of a T dwarf + white dwarf binary 715
Table 3. χ2ν fits to model spectra.
log g [M/H]+0.3 0.0 −0.5
Teff = 1200 K
5.00 1.94 2.11 2.385.25 2.06 2.58 1.825.50 1.97 2.07 1.76Teff = 1500 K
5.00 3.50 2.47 2.555.25 2.89 2.03 2.625.50 3.09 1.96 2.88
Table 4. Parameters of ULAS J1459+0857.
Parameter Value
RA . . .. . .. . .. . . 14h59m35.s25Dec. . . .. . .. . .. . . +08◦57′51.′′20Distance . . .. . .. . .. . . 43–69 pca
SDSS z′ . . .. . .. . .. . . 21.17 ± 0.15UKIDSS Y . . .. . .. . .. . . 19.24 ± 0.06UKIDSS J . . .. . .. . .. . . 17.93 ± 0.02UKIDSS H . . .. . .. . .. . . 17.94 ± 0.05UKIDSS K . . .. . .. . .. . . 17.92 ± 0.08UFTI J . . .. . .. . .. . .. 17.98 ± 0.04UFTI H . . .. . .. . .. . .. 17.93 ± 0.04UFTI K . . .. . .. . .. . .. 18.04 ± 0.03μ RA . . .. . .. . .. . . −149 ± 33 mas yr−1
μ Dec. . . .. . .. . .. . . −45 ± 33 mas yr−1
Spectral type . . .. . .. . .. . . T4.5 ± 0.5Mass . . .. . .. . .. . . 0.060–0.072 Mb�Mass . . .. . .. . .. . . 0.064–0.075 Mc�Teff . . .. . .. . .. . . 1200–1500 Klog g . . .. . .. . .. . . 5.4–5.5 dex
aAssuming that the T dwarf is a singular or unresolved binary.bFrom the Lyon group COND evolutionary models.cFrom the Burrows evolutionary models.
of the primary, its separation would have been similar to the bulkpopulation of BD+MS binaries, although the separation must havegrown significantly (to its current value) during the post-MS mass-loss phase of the primary.
The WD provides vital age constraints for the binary systemfrom its cooling age combined with a minimum estimate of its MSprogenitor lifetime, and the resulting minimum age of 4.8 Gyr forthe T dwarf allows a robust constraint on its surface gravity oflog g = 5.4–5.5. As such ULAS J1459+0857 is a representativeold, high-gravity benchmark BD. A comparison with the bulk pop-ualtion of UKIDSS T dwarfs shows some indication that z band fluxenhancement may be an observational characteristic of older high-gravity mid-T dwarfs, which could be a useful factor in attemptsto understand the formation history of substellar objects, and moregenerally, this T dwarf can contribute to our understanding of sub-stellar properties by providing a useful test-bed for theoretical modelatmospheres.
This system is an example of how wide BD binary companionsto WDs make good benchmark objects, which will help test modelatmospheres and may provide independent means to calibrate BDproperties of field objects (Pinfield et al. 2006). This is the first ofour candidate systems and we expect to find many more as we minemore the UKIDSS sky and with our ongoing efforts to search stilldeeper by combining UKIDSS BDs with the SDSS for WDs.
Further observations that would have clear benefits for this systeminclude a parallax measurement of either component to yield anaccurate distance and fuller spectral coverage of the T dwarf toconstrain its mid-IR and optical spectral morphology. In general,and particularly in the optical z band, it would be desirable toassess in more detail spectroscopic features and trends that maybe sensitive to higher surface gravity and age. A parallax distancecombined with accurate knowledge of the T dwarf bolometric fluxwould offer significant improvements on the Teff constraints for thisobject (e.g. Burningham et al. 2009).
An accurate distance would also facilitate greatly improved radiusand mass constraints for the WD, and thus a better constraint on thecooling age and progenitor lifetime. More detailed studies of bothbinary components are clearly crucial to maximize the effectivenessof the benchmark BD component.
AC K N OW L E D G M E N T S
ACD-J, JSJ and MTR would like to acknowledge the support ofthe grant from CONICYT and the partial support from the Centerfor Astrophysics FONDAP and Proyecto Basal PB06 (CATA). Thiswork was also suported in part by the NSERC Canada and bythe Fund FQRNT (Quebec). PB is a Cottrell Scholar of ResearchCorporation for Science Advancement. JG is supported by RoPACS,a Marie Curie Initial Training Network funded by the EuropeanCommission’s Seventh Framework Programme. SC is supported bya Marie Curie Intra-European Fellowship within the 7th EuropeanCommunity Framework Programme.
This publication has made use of the the data obtained fromthe SuperCOSMOS Science Archive, prepared and hosted by theWide Field Astronomy Unit, Institute for Astronomy, University ofEdinburgh, which is funded by the STFC. We also acknowledgethe use of data from the Sloan digital archive, which is fundedby the Alfred P. Sloan Foundation, the Participating Institutions,the National Aeronautics and Space Administration, the NationalScience Foundation, the U.S. Department of Energy, the JapaneseMonbukagakusho, and the Max Planck Society. We have used datafrom the Large Area Survey, including those from the data release4 (Warren et al. 2007). We also acknowledge the use of DENISand the SIMBAD data base, operated at CDS, Strasbourg, France.ACD-J is supported by a FONDECYT postdoctorado, under projectno. 3100098.
REFERENCES
Achilleos N., Wickramasinghe D. T., 1989, ApJ, 346, 444Allard F., Hauschildt P. H., Alexander D. R., Tamanai A., Schweitzer A.,
2001, ApJ, 556, 357Asplund M., Grevesse N., Sauval A. J., Scott P., 2009, ARA&A, 47, 481Baraffe I., Chabrier G., Allard F., Hauschildt P. H., 1998, A&A, 337, 403Baraffe I., Chabrier G., Barman T. S., Allard F., Hauschildt P. H., 2003,
A&A, 702, 701Barber R. J., Banerjee D. P. K., Ashok N. M., Tennyson J., 2007, in Corradi
R. L. M., Munari U., eds, ASP Conf. Ser. Vol. 363, The Nature of V838Monocerotis and Its Light Echo. Astron. Soc. Pac., San Francisco, p. 95
Bergeron P., Ruiz M. T., Leggett S. K., 1992, ApJ, 400, 315Bergeron P., Ruiz M. T., Leggett S. K., 1993, ApJ, 407, 733Bergeron P., Wesemael F., Beauchamp A., 1995, PASP, 107, 1047Bergeron P., Leggett S. K., Ruiz M. T., 2001, ApJS, 133, 413Bergeron P., Ruiz M. T., Hamuy M., Leggett S. K., Currie M. J., Lajoie C.
P., Dufour P., 2005, ApJ, 625, 838Bohlin R. C., Gilliland R. L., 2004, AJ, 127, 3508Burgasser A. J., Geballe T. R., Leggett S. K., Kirkpatrick J. D., Golimowski
D. A., 2006, ApJ, 637, 1067
C© 2010 The Authors. Journal compilation C© 2010 RAS, MNRAS 410, 705–716
716 A. C. Day-Jones et al.
Burleigh M. R., Hogan E., Dobbie P. D., Napiwotzki R., Maxted P. F. L.,2006, MNRAS, 373, L55
Burningham B. et al., 2008, MNRAS, 391, 320Burningham B. et al., 2009, MNRAS, 395, 1237Burningham B. et al., 2010, MNRAS, in pressBurrows A. et al., 1997, ApJ, 491, 856Burrows A., Hubbard W. B., Lunine J. I., Liebert J., 2001, Rev. Mod. Phys.,
73, 719Burrows A., Sudarsky D., Hubeny I., 2006, ApJ, 640, 1063Catalan S., Isern J., Garcıa-Berro E., Ribas I., 2008, MNRAS, 387, 1693Chabrier G., Baraffe I., Allard F., Hauschildt P., 2000, ApJ, 542, 464Clarke J. R. A. et al., 2010, MNRAS, 402, 575Dahn C. C. et al., 2002, AJ, 124, 1170Day-Jones A. C. et al., 2008, MNRAS, 388, 838Delorme P. et al., 2008, A&A, 482, 961Dobbie P. D., Burleigh M. R., Levan A. J., Barstow M. A., Napiwotzki R.,
Holberg J. B., Hubeny I., Howell S. B., 2005, MNRAS, 357, 1049Dobbie P. D. et al., 2006, MNRAS, 369, 383Eisenstein D. J. et al., 2006, ApJS, 167, 40Faherty J. K., Burgasser A. J., West A. A., Bochanski J. J., Cruz K. L., Shara
M. M., Walter F. M., 2009, AJ, 137, 1Farihi J., Christopher M., 2004, AJ, 128, 1868Farihi J., Becklin E. E., Zuckerman B., 2005, ApJS, 161, 394Ferrario L., Wickramasinghe D., Liebert J., Williams K. A., 2005, MNRAS,
361, 1131Fontaine G., Brassard P., Bergeron P., 2001, PASP, 113, 409Gizis J. E., Kirkpatrick J. D., Burgasser A., Reid I. N., Monet D. G., Liebert
J., Wilson J. C., 2001, ApJ, 551, 163Golimowski D. A. et al., 2004, AJ, 127, 3516Gould A., 2003, ApJ, 583, 765Gray R. O. et al., 2006, AJ, 132, 161Hauschildt P. H., Allard F., Baron E., 1999, ApJ, 512, 377Holberg J., Bergeron P., 2006, AJ, 132, 1221Holmberg J., Nordstrom B., Andersen J., 2007, A&A, 475, 519Ivezic Z., Sesar B., Juric M., Bond N., Dalcanton J., Rockosi C. M., Yanny
B., 2008, ApJ, 684 287Jao W. C., Henry T. J., Beaulieu T. D., Subasavage J. P., 2008, AJ, 136, 840Jeans J. H., 1924, MNRAS, 85, 2Jenkins J. S., Jones H. R. A., Pavlenko Y., Pinfield D. J., Barnes J. R.,
Lyubchik Y., 2008, A&A, 485, 571Kalirai J. S., Hansen B. M. S., Kelson D. D., Reitzel D. B., Rich R. M.,
Richer H. B., 2008, ApJ, 676, 594Kawka A., Vennes S., Schmidt G. D., Wickramasinghe D. T., Koch R., 2007,
ApJ, 654, 499Kemic S. B., 1974, ApJ, 193, 213Kendall T. R. et al., 2007, A&A, 466, 1059Kilic M. et al., 2006, AJ, 131, 582
Knapp G. R. et al., 2004, AJ, 127, 3553Lachaume R., Dominik C., Lanz T., Habing H. J., 1999, A&A, 348, 897Leggett S. K. et al., 2002, ApJ, 564, 452Leggett S. K. et al., 2009, ApJ, 695, 1517Lepine S., Shara M. M., 2005, AJ, 129, 1483Liebert J., 1988, PASP, 100, 1302Littlefair S. P., Dhillon V. S., Marsh T. R., Gansicke B. T., Southworth J.,
Baraffe I., Watson C. A., Copperwheat C., 2008, MNRAS, 388, 1582Liu M. C., Leggett S. K., Golimowski D. A., Chiu K., Fan X., Geballe T.
R., Schneider D. P., Brinkmann J., 2006, ApJ, 647, 1393Lodieu N. et al., 2007, MNRAS, 379, 1423McCook G. P., Sion E. M., 1999, ApJS, 121Marley M. S., Seager S., Saumon D., Lodders K., Ackerman A. S., Freedman
R. S., Fan X., 2002, ApJ, 568, 335Maxted P. F. L., Napiwotzki R., Dobbie P. D., Burleigh M. R., 2006, Nat,
442, 543Mullally F., Kilic M., Reach W. T., Kuchner M. J., von Hippel T., Burrows
A., Winget D. E., 2007, ApJS, 171, 206Perryman M. A. C. et al., 1997, A&A, 323, 49Pinfield D. J., Jones H. R. A., Lucas P. W., Kendall T. R., Folkes S. L.,
Day-Jones A. C., Chappelle R. J., Steele I. A., 2006, MNRAS, 368,1281
Pinfield D. J. et al., 2008, MNRAS, 390, 304Saumon D. et al., 2007, ApJ, 656, 1136Schroder K. P., Pauli E. M., Napiwotzki R., 2004, MNRAS, 354, 727Steele P. R., Burleigh M. R., Dobbie P. D., Barstow M. A., 2007, MNRAS,
382, 1804Steele P. R., Burleigh M. R., Farihi J., Gansicke B. T., Jameson R. F., Dobbie
P. D., Barstow M. A., 2009, A&A, 500, 1207Tinney C. G., 1996, MNRAS, 281, 644Tinney C. G., Burgasser A. J., Kirkpatrick J. D., 2003, AJ, 126, 975Tout C. A., Pringle J. E., 1992, MNRAS, 259, 604Tout C. A., Wickramasinghe D. T., Liebert J., Ferrario L., Pringle J. E.,
2008, MNRAS, 387, 897Valenti J. A., Fischer D. A., 2005, ApJS, 159, 141Vrba F. J. et al., AJ, 127, 2948Warren S. J. et al., 2007, MNRAS, 381, 1400West A. A. et al., 2004, AJ, 128, 426Wickramasinghe D. T., Ferrario L., 2000, PASP, 112, 873Wickramasinghe D. T., Ferrario L., 2005, MNRAS, 356, 1576Yong D., Lambert D. L., 2003, PASP, 115, 22Zhang Z. H. et al., 2010, MNRAS, 404, 1817Zuckerman B., Becklin E. E., 1987, ApJ, 319, 66Zuckerman B., Becklin E. E., 1992, ApJ, 386, 260
This paper has been typeset from a TEX/LATEX file prepared by the author.
C© 2010 The Authors. Journal compilation C© 2010 RAS, MNRAS 410, 705–716


![Magnetism in Isolated and Binary White Dwarfs · Since the discovery of the —rst isolated magnetic white dwarf (MWD) Grw ]70¡8047 nearly 60 years ago, the number of stars belonging](https://img.pdfslide.us/doc/110x75/5e3680d3daf4ec2d6405b686/magnetism-in-isolated-and-binary-white-dwarfs-since-the-discovery-of-the-arst.jpg)