Embed Size (px)
Citation preview

March 2013 13-1
The Weight Scale System 13

Scaling Manual MFLNRORD
13-2 March 2013
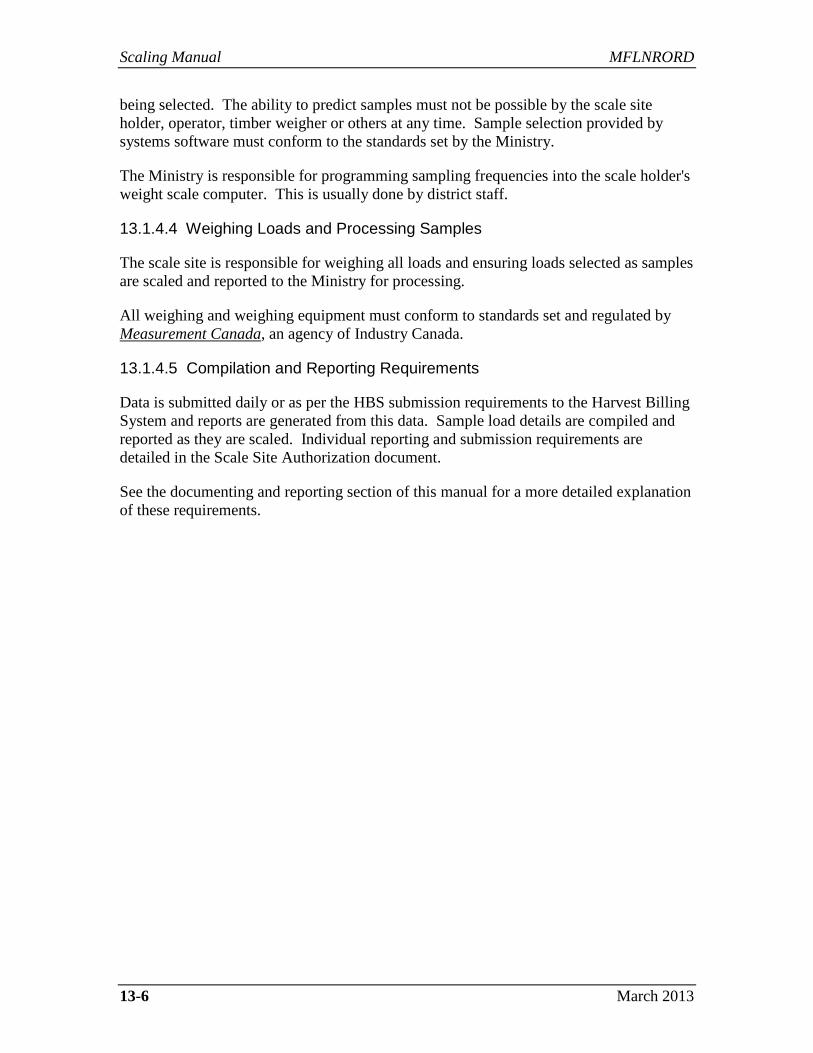
Weight scaling is a sampling method where only a portion of the total production is measured or sampled, unlike piece scaling where all logs are measured for volume and grade. Based on the sample results, an estimate can be made about the total production. This chapter provides an overview of the Weight Scale System and an introduction to the statistical concepts that underlie this system. A more detailed look at how these concepts are applied to satisfy the data needs of industry and government follows in the Weight Scale Sampling chapter.
Figure 13.1 A Loaded Logging Truck on the Platform of a Weight Scale.
Timber Pricing Branch Weight Scale System
March 2013 13-3
13.1 Weight Scaling - Overview of the System
13.1.1 Background
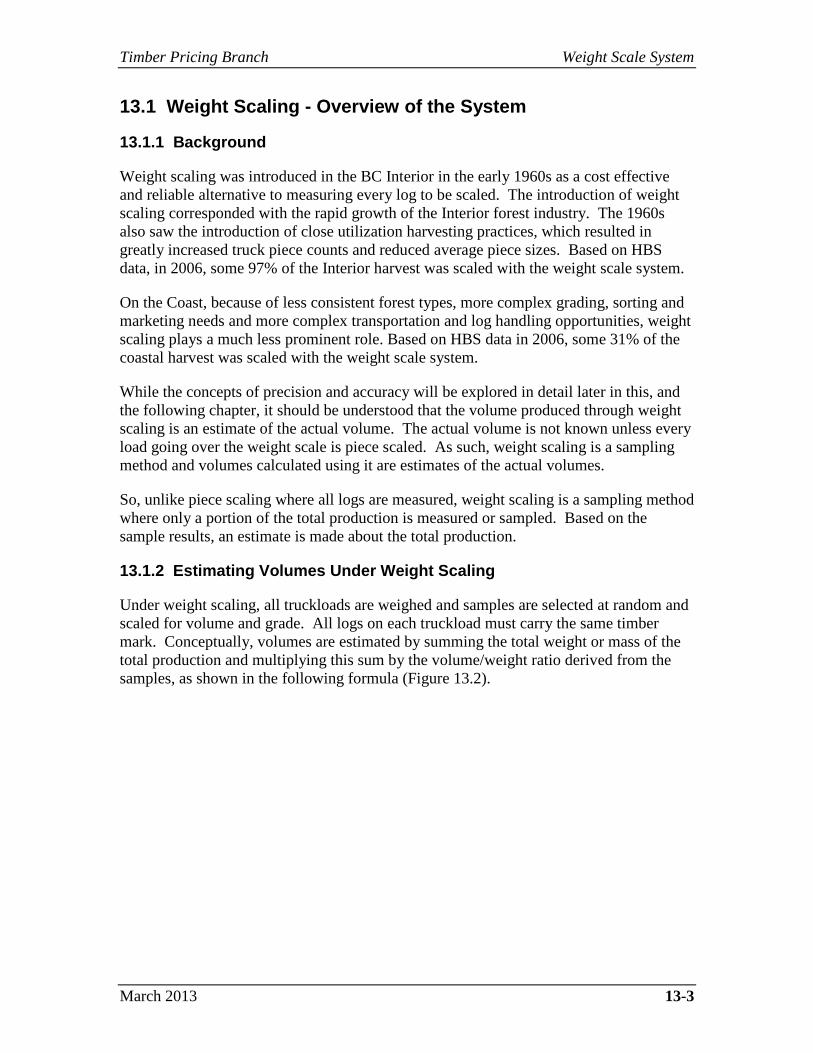
Weight scaling was introduced in the BC Interior in the early 1960s as a cost effective and reliable alternative to measuring every log to be scaled. The introduction of weight scaling corresponded with the rapid growth of the Interior forest industry. The 1960s also saw the introduction of close utilization harvesting practices, which resulted in greatly increased truck piece counts and reduced average piece sizes. Based on HBS data, in 2006, some 97% of the Interior harvest was scaled with the weight scale system.
On the Coast, because of less consistent forest types, more complex grading, sorting and marketing needs and more complex transportation and log handling opportunities, weight scaling plays a much less prominent role. Based on HBS data in 2006, some 31% of the coastal harvest was scaled with the weight scale system.
While the concepts of precision and accuracy will be explored in detail later in this, and the following chapter, it should be understood that the volume produced through weight scaling is an estimate of the actual volume. The actual volume is not known unless every load going over the weight scale is piece scaled. As such, weight scaling is a sampling method and volumes calculated using it are estimates of the actual volumes.
So, unlike piece scaling where all logs are measured, weight scaling is a sampling method where only a portion of the total production is measured or sampled. Based on the sample results, an estimate is made about the total production.
13.1.2 Estimating Volumes Under Weight Scaling
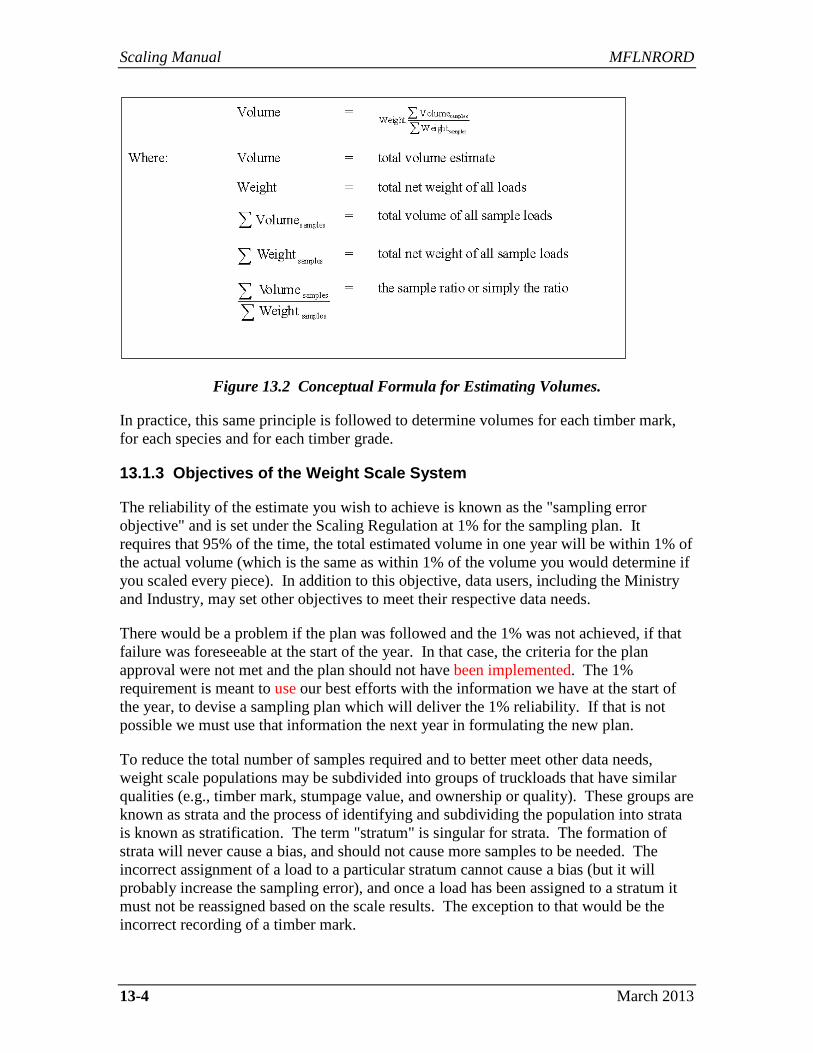
Under weight scaling, all truckloads are weighed and samples are selected at random and scaled for volume and grade. All logs on each truckload must carry the same timber mark. Conceptually, volumes are estimated by summing the total weight or mass of the total production and multiplying this sum by the volume/weight ratio derived from the samples, as shown in the following formula (Figure 13.2).
Scaling Manual MFLNRORD
13-4 March 2013
Figure 13.2 Conceptual Formula for Estimating Volumes.
In practice, this same principle is followed to determine volumes for each timber mark, for each species and for each timber grade.
13.1.3 Objectives of the Weight Scale System
The reliability of the estimate you wish to achieve is known as the "sampling error objective" and is set under the Scaling Regulation at 1% for the sampling plan. It requires that 95% of the time, the total estimated volume in one year will be within 1% of the actual volume (which is the same as within 1% of the volume you would determine if you scaled every piece). In addition to this objective, data users, including the Ministry and Industry, may set other objectives to meet their respective data needs.
There would be a problem if the plan was followed and the 1% was not achieved, if that failure was foreseeable at the start of the year. In that case, the criteria for the plan approval were not met and the plan should not have been implemented. The 1% requirement is meant to use our best efforts with the information we have at the start of the year, to devise a sampling plan which will deliver the 1% reliability. If that is not possible we must use that information the next year in formulating the new plan.
To reduce the total number of samples required and to better meet other data needs, weight scale populations may be subdivided into groups of truckloads that have similar qualities (e.g., timber mark, stumpage value, and ownership or quality). These groups are known as strata and the process of identifying and subdividing the population into strata is known as stratification. The term "stratum" is singular for strata. The formation of strata will never cause a bias, and should not cause more samples to be needed. The incorrect assignment of a load to a particular stratum cannot cause a bias (but it will probably increase the sampling error), and once a load has been assigned to a stratum it must not be reassigned based on the scale results. The exception to that would be the incorrect recording of a timber mark.
Timber Pricing Branch Weight Scale System
March 2013 13-5
13.1.4 Elements of Weight Scaling
13.1.4.1 Scale Site Authorization
Prior to beginning weight scaling, the weight scale operator (usually a licensee), must have a valid scale site authorization and sampling plan to use weight scaling for a given population. The population typically includes the company's own production as well as any purchase or trade volumes delivered to the scale over a 12-month period. This 12-month period is known as the cyclic billing period.
The definition of a population is:
The aggregate of all loads of timber scaled at a scale site or a group of scale sites owned by the same holder within a forest area to be sampled in a 12-month period for which you wish to estimate volumes for timber marks, grades and species.
Included under the scale site authorization is provision for the physical weight scale site, the weighing of loads, the selection of samples, spreading and scaling sample loads, staffing, as well as documentation and reporting requirements.
In all cases, the scale and weighing equipment is owned and operated by the scale site holder. The population holder is responsible for preparing the sampling plan and the Ministry is responsible for approving the sampling plan.
The user and the Ministry are responsible for:
● monitoring the sampling plan,
● ensuring satisfactory data and processing controls are in place, and
● ensuring scaling and processing standards are maintained.
13.1.4.2 The Weight Scale Sampling Plan
Central to weight scaling is the sampling plan which contains the strategy to sample enough loads to meet the population and other sampling objectives. This plan is prepared largely from the scale holder's production forecast that is comprised of an estimate of the timber to be scaled for the cyclic billing period. Stratum Advisor in HBS has many tools for individual sampling plans and must be used to complete this annual plan. Population holders must propose and monitor their sampling plans in HBS.
13.1.4.3 Sampling Frequency
The sampling frequency sets the rate of sampling in each stratum required to meet the sampling objectives. Under weight scaling, only those loads selected as samples are physically scaled. Sample selection is a computerized process that is a program function of the scale site weight scale hardware and the scale site holder is responsible for ensuring that all sampling is fully random. All loads must have an equal opportunity of
Scaling Manual MFLNRORD
13-6 March 2013
being selected. The ability to predict samples must not be possible by the scale site holder, operator, timber weigher or others at any time. Sample selection provided by systems software must conform to the standards set by the Ministry.
The Ministry is responsible for programming sampling frequencies into the scale holder's weight scale computer. This is usually done by district staff.
13.1.4.4 Weighing Loads and Processing Samples
The scale site is responsible for weighing all loads and ensuring loads selected as samples are scaled and reported to the Ministry for processing.
All weighing and weighing equipment must conform to standards set and regulated by Measurement Canada, an agency of Industry Canada.
13.1.4.5 Compilation and Reporting Requirements
Data is submitted daily or as per the HBS submission requirements to the Harvest Billing System and reports are generated from this data. Sample load details are compiled and reported as they are scaled. Individual reporting and submission requirements are detailed in the Scale Site Authorization document.
See the documenting and reporting section of this manual for a more detailed explanation of these requirements.
Timber Pricing Branch Weight Scale System
March 2013 13-7
13.2 Statistics Underlying the Weight Scale System
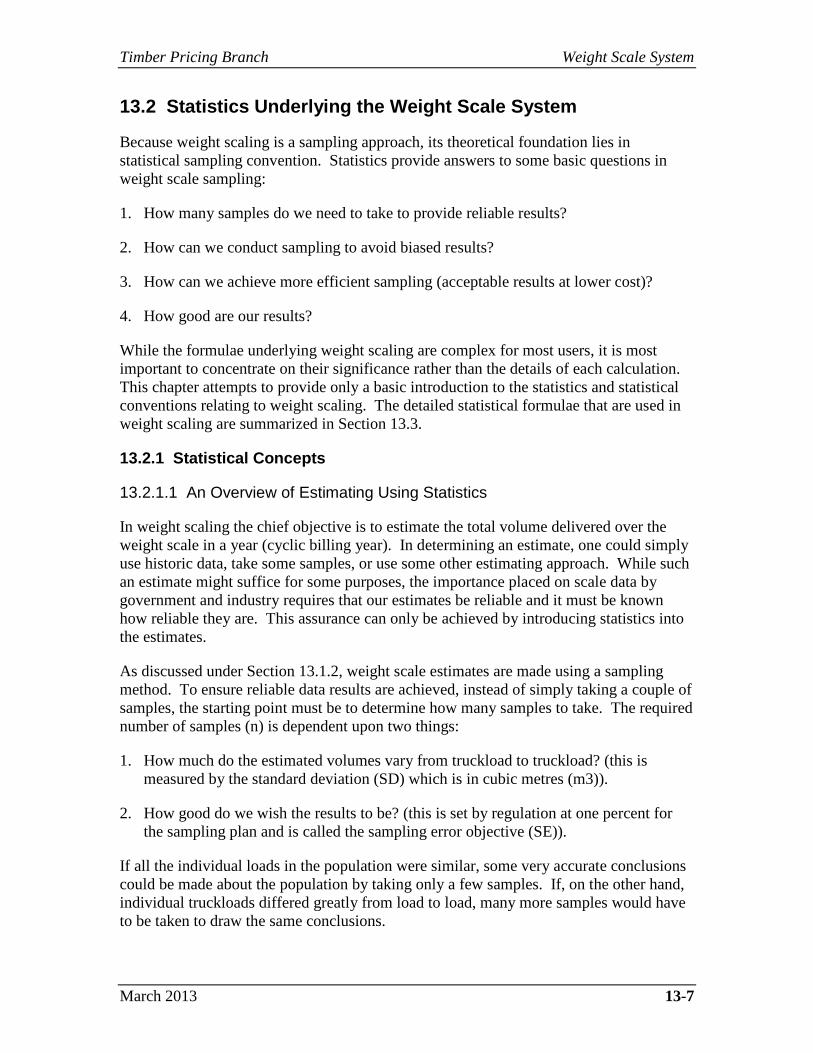
Because weight scaling is a sampling approach, its theoretical foundation lies in statistical sampling convention. Statistics provide answers to some basic questions in weight scale sampling:
1. How many samples do we need to take to provide reliable results?
2. How can we conduct sampling to avoid biased results?
3. How can we achieve more efficient sampling (acceptable results at lower cost)?
4. How good are our results?
While the formulae underlying weight scaling are complex for most users, it is most important to concentrate on their significance rather than the details of each calculation. This chapter attempts to provide only a basic introduction to the statistics and statistical conventions relating to weight scaling. The detailed statistical formulae that are used in weight scaling are summarized in Section 13.3.
13.2.1 Statistical Concepts
13.2.1.1 An Overview of Estimating Using Statistics
In weight scaling the chief objective is to estimate the total volume delivered over the weight scale in a year (cyclic billing year). In determining an estimate, one could simply use historic data, take some samples, or use some other estimating approach. While such an estimate might suffice for some purposes, the importance placed on scale data by government and industry requires that our estimates be reliable and it must be known how reliable they are. This assurance can only be achieved by introducing statistics into the estimates.
As discussed under Section 13.1.2, weight scale estimates are made using a sampling method. To ensure reliable data results are achieved, instead of simply taking a couple of samples, the starting point must be to determine how many samples to take. The required number of samples (n) is dependent upon two things:
1. How much do the estimated volumes vary from truckload to truckload? (this is measured by the standard deviation (SD) which is in cubic metres (m3)).
2. How good do we wish the results to be? (this is set by regulation at one percent for the sampling plan and is called the sampling error objective (SE)).
If all the individual loads in the population were similar, some very accurate conclusions could be made about the population by taking only a few samples. If, on the other hand, individual truckloads differed greatly from load to load, many more samples would have to be taken to draw the same conclusions.
Scaling Manual MFLNRORD
13-8 March 2013
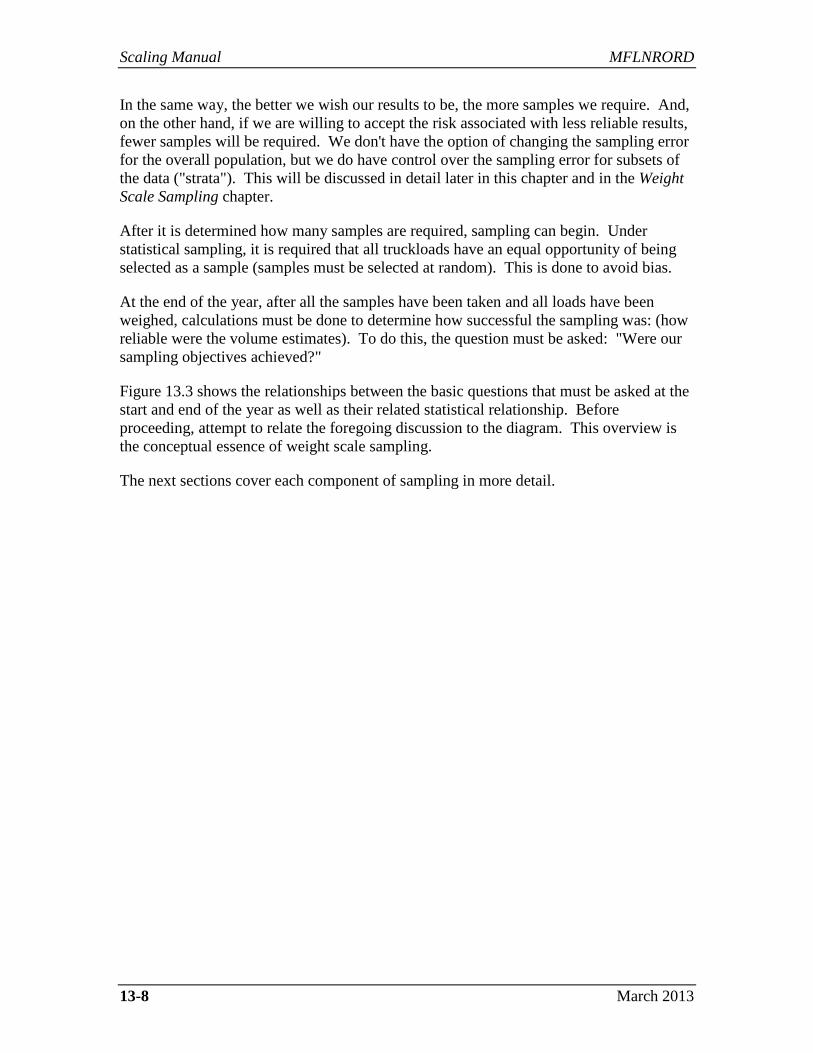
In the same way, the better we wish our results to be, the more samples we require. And, on the other hand, if we are willing to accept the risk associated with less reliable results, fewer samples will be required. We don't have the option of changing the sampling error for the overall population, but we do have control over the sampling error for subsets of the data ("strata"). This will be discussed in detail later in this chapter and in the Weight Scale Sampling chapter.
After it is determined how many samples are required, sampling can begin. Under statistical sampling, it is required that all truckloads have an equal opportunity of being selected as a sample (samples must be selected at random). This is done to avoid bias.
At the end of the year, after all the samples have been taken and all loads have been weighed, calculations must be done to determine how successful the sampling was: (how reliable were the volume estimates). To do this, the question must be asked: "Were our sampling objectives achieved?"
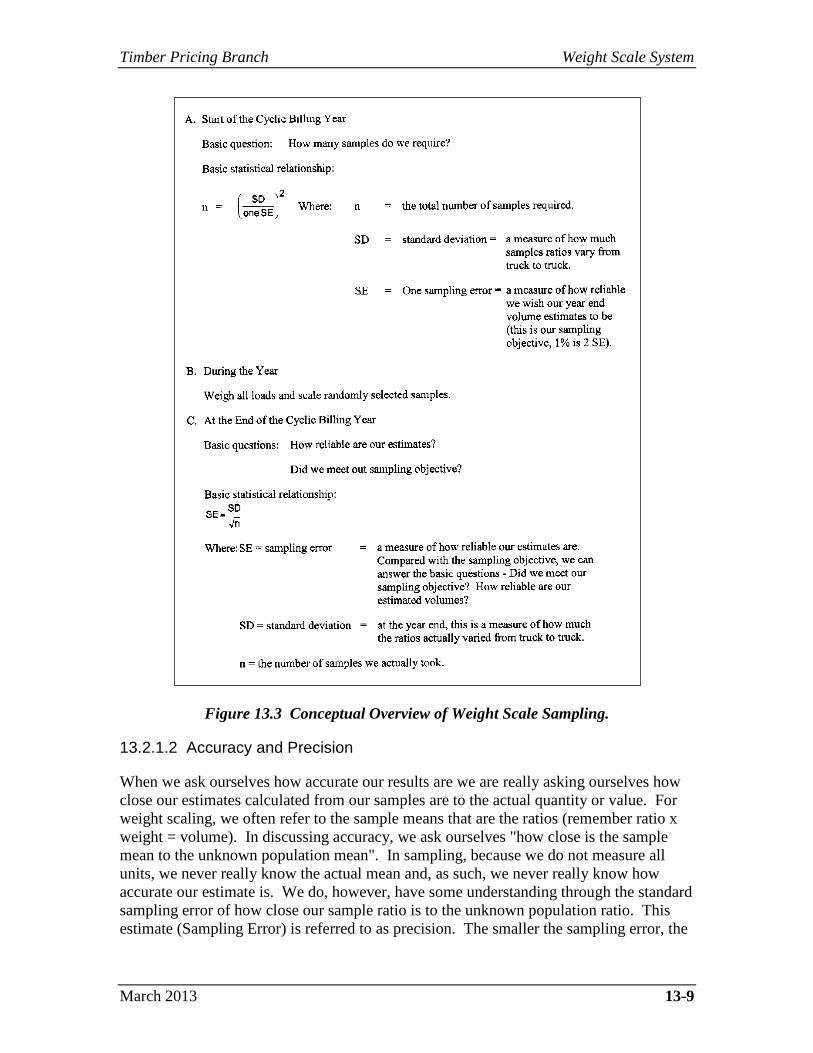
Figure 13.3 shows the relationships between the basic questions that must be asked at the start and end of the year as well as their related statistical relationship. Before proceeding, attempt to relate the foregoing discussion to the diagram. This overview is the conceptual essence of weight scale sampling.
The next sections cover each component of sampling in more detail.
Timber Pricing Branch Weight Scale System
March 2013 13-9
Figure 13.3 Conceptual Overview of Weight Scale Sampling.
13.2.1.2 Accuracy and Precision
When we ask ourselves how accurate our results are we are really asking ourselves how close our estimates calculated from our samples are to the actual quantity or value. For weight scaling, we often refer to the sample means that are the ratios (remember ratio x weight = volume). In discussing accuracy, we ask ourselves "how close is the sample mean to the unknown population mean". In sampling, because we do not measure all units, we never really know the actual mean and, as such, we never really know how accurate our estimate is. We do, however, have some understanding through the standard sampling error of how close our sample ratio is to the unknown population ratio. This estimate (Sampling Error) is referred to as precision. The smaller the sampling error, the
Scaling Manual MFLNRORD
13-10 March 2013
better the precision. The sampling error is 0 when all units in the population are measured.
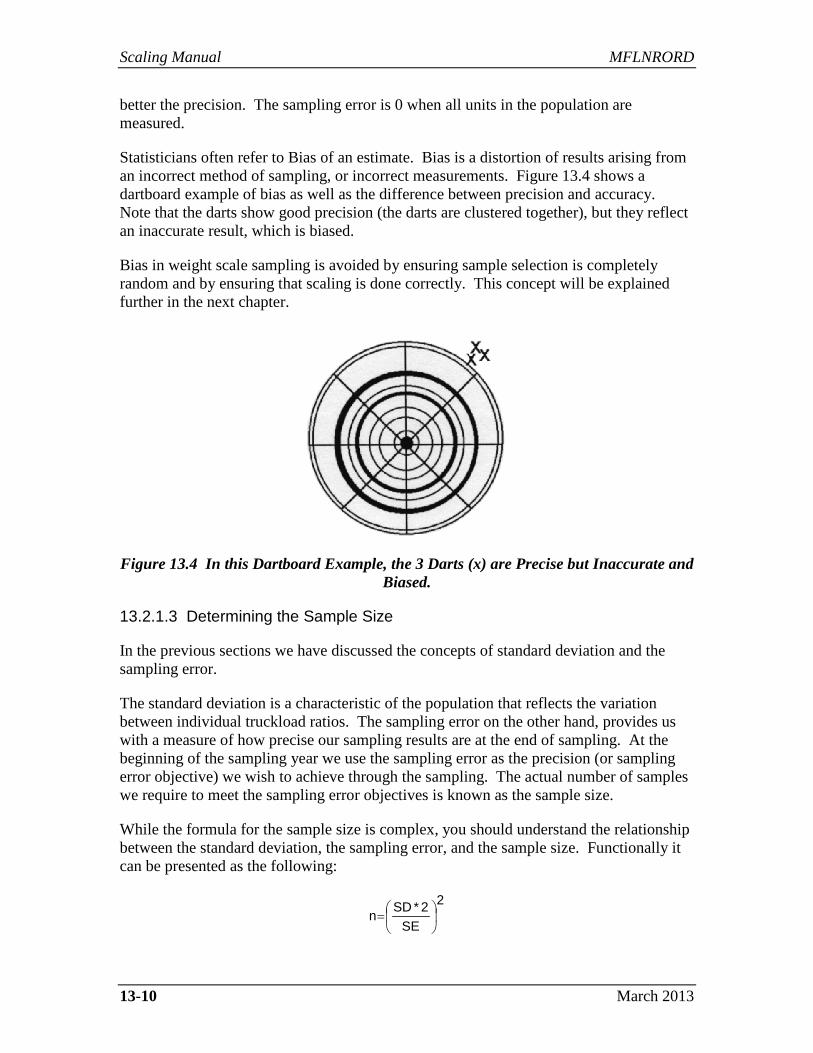
Statisticians often refer to Bias of an estimate. Bias is a distortion of results arising from an incorrect method of sampling, or incorrect measurements. Figure 13.4 shows a dartboard example of bias as well as the difference between precision and accuracy. Note that the darts show good precision (the darts are clustered together), but they reflect an inaccurate result, which is biased.
Bias in weight scale sampling is avoided by ensuring sample selection is completely random and by ensuring that scaling is done correctly. This concept will be explained further in the next chapter.
Figure 13.4 In this Dartboard Example, the 3 Darts (x) are Precise but Inaccurate and Biased.
13.2.1.3 Determining the Sample Size
In the previous sections we have discussed the concepts of standard deviation and the sampling error.
The standard deviation is a characteristic of the population that reflects the variation between individual truckload ratios. The sampling error on the other hand, provides us with a measure of how precise our sampling results are at the end of sampling. At the beginning of the sampling year we use the sampling error as the precision (or sampling error objective) we wish to achieve through the sampling. The actual number of samples we require to meet the sampling error objectives is known as the sample size.
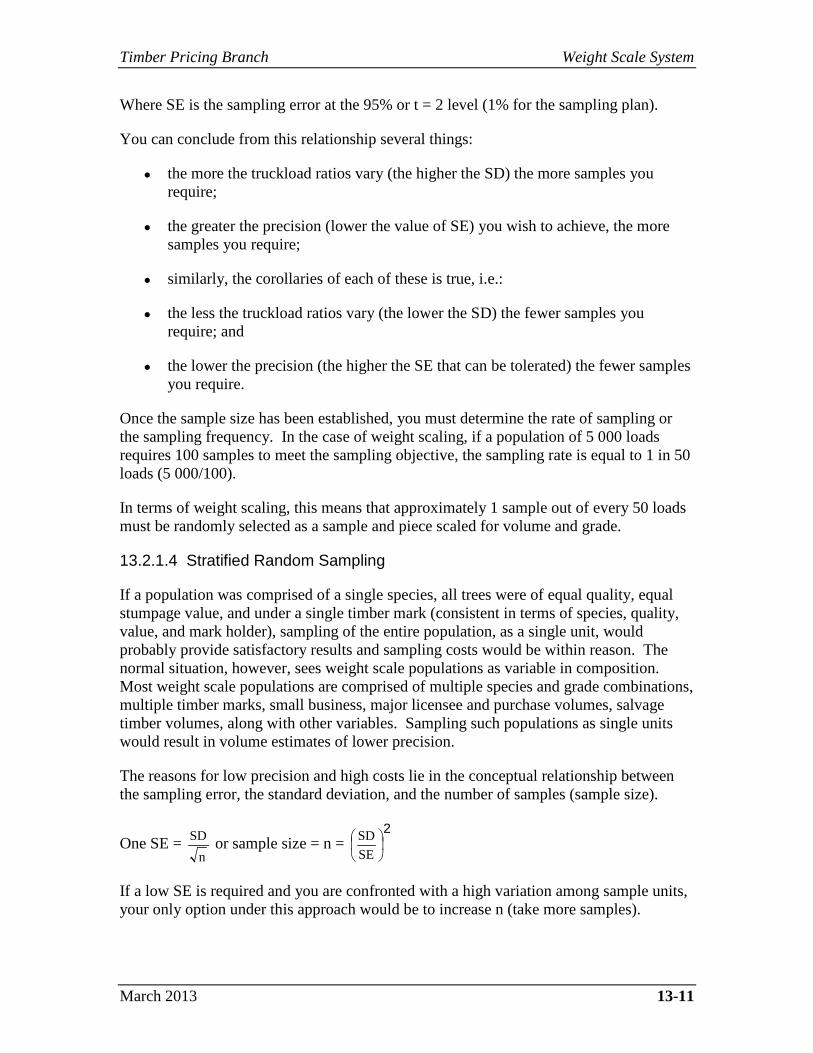
While the formula for the sample size is complex, you should understand the relationship between the standard deviation, the sampling error, and the sample size. Functionally it can be presented as the following:
2
SE2*SDn
=
Timber Pricing Branch Weight Scale System
March 2013 13-11
Where SE is the sampling error at the 95% or t = 2 level (1% for the sampling plan).
You can conclude from this relationship several things:
● the more the truckload ratios vary (the higher the SD) the more samples you require;
● the greater the precision (lower the value of SE) you wish to achieve, the more samples you require;
● similarly, the corollaries of each of these is true, i.e.:
● the less the truckload ratios vary (the lower the SD) the fewer samples you require; and
● the lower the precision (the higher the SE that can be tolerated) the fewer samples you require.
Once the sample size has been established, you must determine the rate of sampling or the sampling frequency. In the case of weight scaling, if a population of 5 000 loads requires 100 samples to meet the sampling objective, the sampling rate is equal to 1 in 50 loads (5 000/100).
In terms of weight scaling, this means that approximately 1 sample out of every 50 loads must be randomly selected as a sample and piece scaled for volume and grade.
13.2.1.4 Stratified Random Sampling
If a population was comprised of a single species, all trees were of equal quality, equal stumpage value, and under a single timber mark (consistent in terms of species, quality, value, and mark holder), sampling of the entire population, as a single unit, would probably provide satisfactory results and sampling costs would be within reason. The normal situation, however, sees weight scale populations as variable in composition. Most weight scale populations are comprised of multiple species and grade combinations, multiple timber marks, small business, major licensee and purchase volumes, salvage timber volumes, along with other variables. Sampling such populations as single units would result in volume estimates of lower precision.
The reasons for low precision and high costs lie in the conceptual relationship between the sampling error, the standard deviation, and the number of samples (sample size).
One SE = n
SD or sample size = n = 2
SESD
If a low SE is required and you are confronted with a high variation among sample units, your only option under this approach would be to increase n (take more samples).
Scaling Manual MFLNRORD
13-12 March 2013
To overcome these deficiencies, Stratified Random Sampling is employed for sampling most forest populations. Under stratified sampling, units of the population can be grouped together on the basis of similarity - usually, the similarity in the ratio caused by the timber having the same weight volume relationship. These groupings are referred to as strata (stratum for singular) or subpopulations. Each stratum is then sampled and stratum estimates (volume/stratum) are combined to give a population estimate (volume for the population).
Stratified random sampling provides several advantages over simple random sampling.
● it provides an estimate of precision and a separate ratio for each stratum,
● population estimates may be more precise with the same number of samples, and
● the required number of samples is often reduced.
Separate answers could be computed from the data without stratification (for instance by timber mark) from the Harvest Billing System data, if better precision was the only objective. Stratification is especially useful when the user wants to shift the sampling into strata with greater value, lower scaling cost, or greater scaling capacity due to physical site characteristics. This reassignment might actually increase the total number of sample loads, but could have other important advantages.
Going back to the basic relationship, it can deduced that if through stratification we can reduce the variation (SD) among sample units within strata to less than that which occurred if we did not stratify, then our estimates will be more precise (a lower SE). One can also expect an increased precision at the stratum level if we, in fact, did reduce the SD within each stratum.
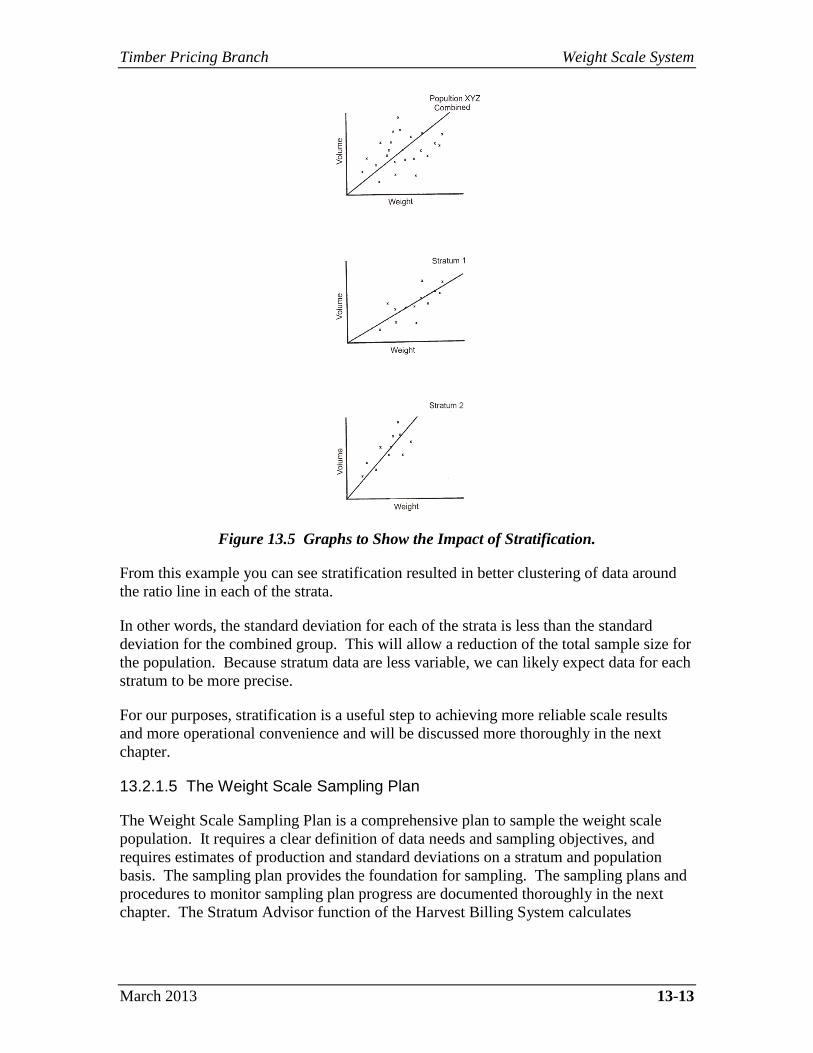
Stratification can be demonstrated through a graph of sample ratios. Figure 13.5 shows a graph of ratios for Population XYZ. This population was stratified into two strata (1 and 2).
Timber Pricing Branch Weight Scale System
March 2013 13-13
Figure 13.5 Graphs to Show the Impact of Stratification.
From this example you can see stratification resulted in better clustering of data around the ratio line in each of the strata.
In other words, the standard deviation for each of the strata is less than the standard deviation for the combined group. This will allow a reduction of the total sample size for the population. Because stratum data are less variable, we can likely expect data for each stratum to be more precise.
For our purposes, stratification is a useful step to achieving more reliable scale results and more operational convenience and will be discussed more thoroughly in the next chapter.
13.2.1.5 The Weight Scale Sampling Plan
The Weight Scale Sampling Plan is a comprehensive plan to sample the weight scale population. It requires a clear definition of data needs and sampling objectives, and requires estimates of production and standard deviations on a stratum and population basis. The sampling plan provides the foundation for sampling. The sampling plans and procedures to monitor sampling plan progress are documented thoroughly in the next chapter. The Stratum Advisor function of the Harvest Billing System calculates
Scaling Manual MFLNRORD
13-14 March 2013
necessary values and equations and information on its use can be obtained from the HBS Reference Guide for Industry available at:
HBS Industry Guide
13.2.1.6 Chapter Summary
This chapter has discussed in very general terms the statistics and related relationships behind the weight scale system. To use weight scaling as detailed in the next chapter, all calculations are heavily systematized eliminating the need for long calculations.
While some of this material was covered quite sparingly, it is important to understand some basic relationships and the concepts discussed in this chapter.
You should be equipped to answer some basic questions:
● What is random sampling, and why is it important to weight scale sample selection?
● Given a standard deviation - what does it really mean?
● Given a sampling error - what does it mean in terms of the population and stratum volume estimates?
● What is the relationship between the standard deviation, the sampling error, and the sample size?
● Why do we stratify populations? What are the benefits of stratification?
● How do we allocate the sample size to individual strata?
● What is the relationship between precision, accuracy, and bias?
The next chapter on weight scale sampling assumes a basic understanding of these concepts.
Timber Pricing Branch Weight Scale System
March 2013 13-15
13.3 Summary of Statistical Formulae in Weight Scaling
This section summarizes the statistical formulae that underlie weight scaling. The terminology assumes that readers are familiar with basic statistics.
This section is for documentation purposes, and scalers are not expected to comprehend this material. The equations from earlier documentation have not been improved for readability, since it is important that the documentation in this appendix relates to former computer programs and past documentation for the weight scaling method in B.C. Minor changes from earlier manuals have been made for typographical errors and to improve statistical clarity for the benefit of specialists. For those wishing to compare this material to standard statistical textbooks, the estimation of averages and standard deviations use formulae for the common "ratio-of-means" estimator. Once any strata totals and their total variance are computed, they are combined using the usual stratified sampling formulae found in most textbooks.
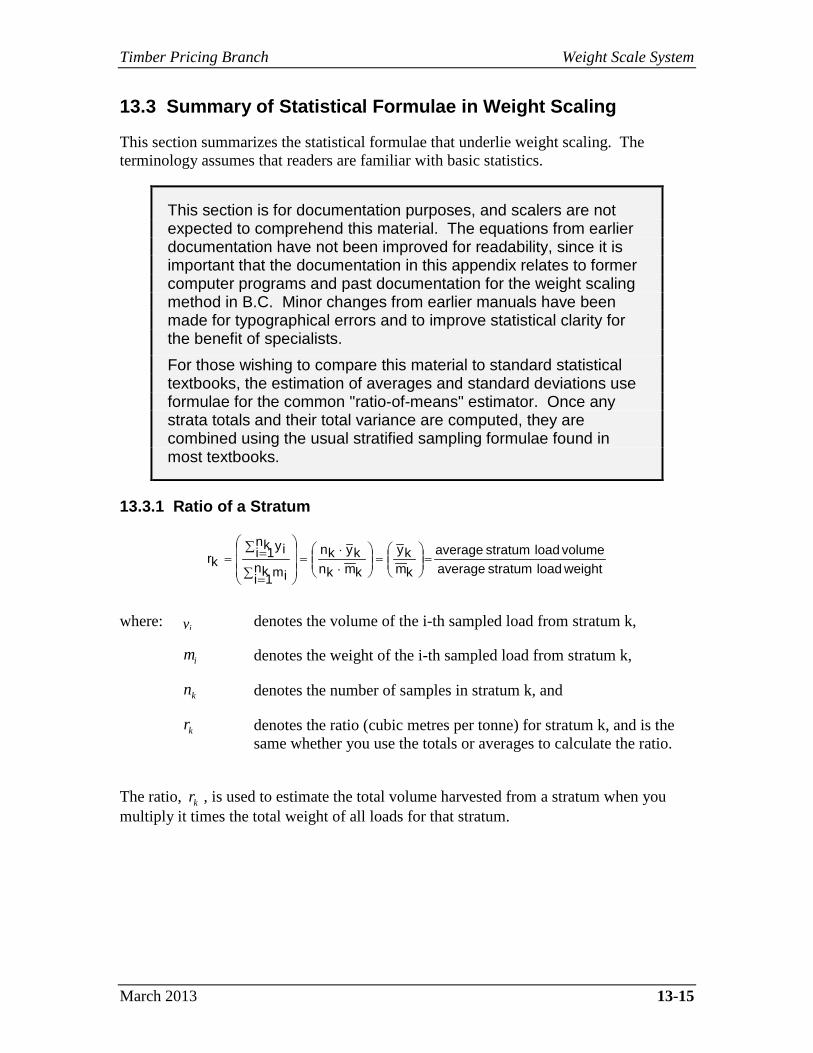
13.3.1 Ratio of a Stratum
weightloadstratumaveragevolumeloadstratumaverage
kmky
kmknkykn
kn1i im
kn1i iy
kr =
=
⋅⋅
=
∑ =
∑ ==
where: yi denotes the volume of the i-th sampled load from stratum k,
denotes the weight of the i-th sampled load from stratum k,
denotes the number of samples in stratum k, and
denotes the ratio (cubic metres per tonne) for stratum k, and is the same whether you use the totals or averages to calculate the ratio.
The ratio, , is used to estimate the total volume harvested from a stratum when you multiply it times the total weight of all loads for that stratum.
mi
nk
rk
rk
Scaling Manual MFLNRORD
13-16 March 2013
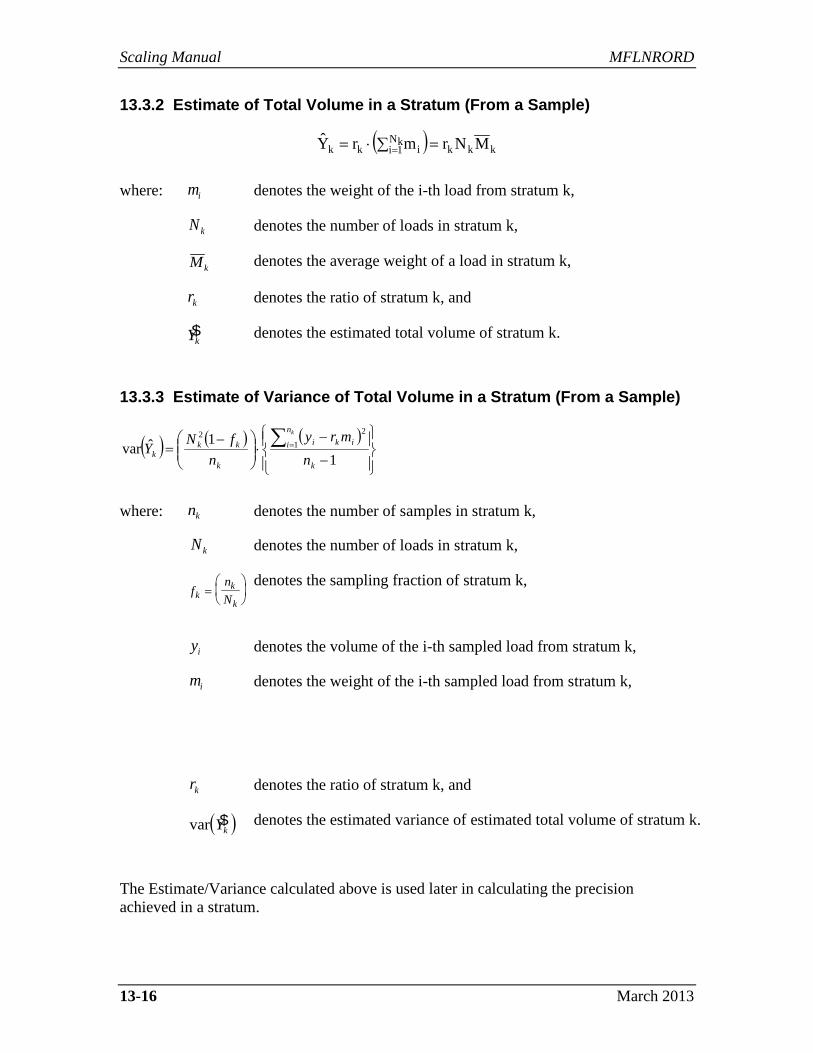
13.3.2 Estimate of Total Volume in a Stratum (From a Sample)
( ) kkkkN1i ikk MNrmrY =∑⋅= =
where: mi denotes the weight of the i-th load from stratum k,
Nk denotes the number of loads in stratum k,
Mk denotes the average weight of a load in stratum k,
rk denotes the ratio of stratum k, and
$Yk denotes the estimated total volume of stratum k.
13.3.3 Estimate of Variance of Total Volume in a Stratum (From a Sample)
( ) ( ) ( )
−
−⋅
−= ∑ =
11ˆvar 1
22
k
n
i iki
k
kkk n
mryn
fNYk
where: nk denotes the number of samples in stratum k,
denotes the number of loads in stratum k,
f
nNk
k
k=
denotes the sampling fraction of stratum k,
denotes the volume of the i-th sampled load from stratum k,
denotes the weight of the i-th sampled load from stratum k,
denotes the ratio of stratum k, and
( )var $Yk denotes the estimated variance of estimated total volume of stratum k.
The Estimate/Variance calculated above is used later in calculating the precision achieved in a stratum.
Nk
yi
mi
rk
Timber Pricing Branch Weight Scale System
March 2013 13-17
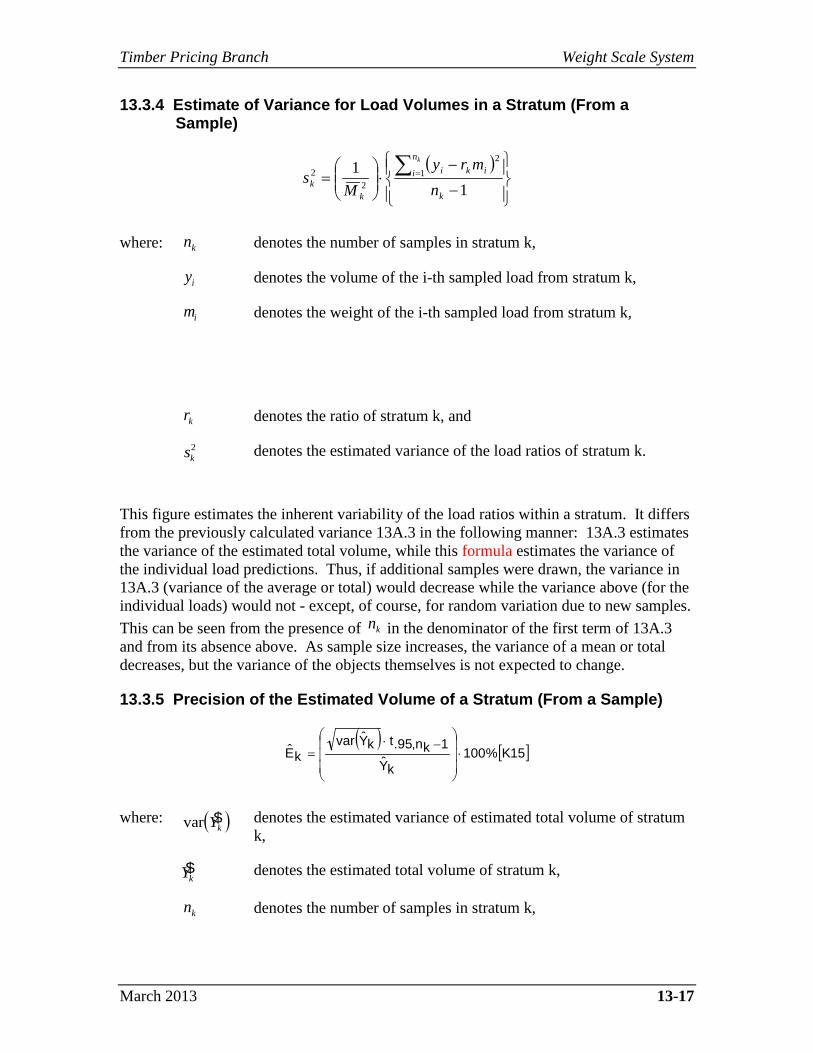
13.3.4 Estimate of Variance for Load Volumes in a Stratum (From a Sample)
( )
−
−⋅
= ∑ =
11 1
2
22
k
n
i iki
kk n
mryM
sk
where: denotes the number of samples in stratum k,
denotes the volume of the i-th sampled load from stratum k,
denotes the weight of the i-th sampled load from stratum k,
denotes the ratio of stratum k, and
denotes the estimated variance of the load ratios of stratum k.
This figure estimates the inherent variability of the load ratios within a stratum. It differs from the previously calculated variance 13A.3 in the following manner: 13A.3 estimates the variance of the estimated total volume, while this formula estimates the variance of the individual load predictions. Thus, if additional samples were drawn, the variance in 13A.3 (variance of the average or total) would decrease while the variance above (for the individual loads) would not - except, of course, for random variation due to new samples. This can be seen from the presence of in the denominator of the first term of 13A.3 and from its absence above. As sample size increases, the variance of a mean or total decreases, but the variance of the objects themselves is not expected to change.
13.3.5 Precision of the Estimated Volume of a Stratum (From a Sample)
( )[ ]15K%100
kY1kn,95.tkYvar
kE ⋅
−⋅
=
where: ( )var $Yk denotes the estimated variance of estimated total volume of stratum k,
$Yk denotes the estimated total volume of stratum k,
denotes the number of samples in stratum k,
nk
yi
mi
rk
sk2
nk
nk
Scaling Manual MFLNRORD
13-18 March 2013
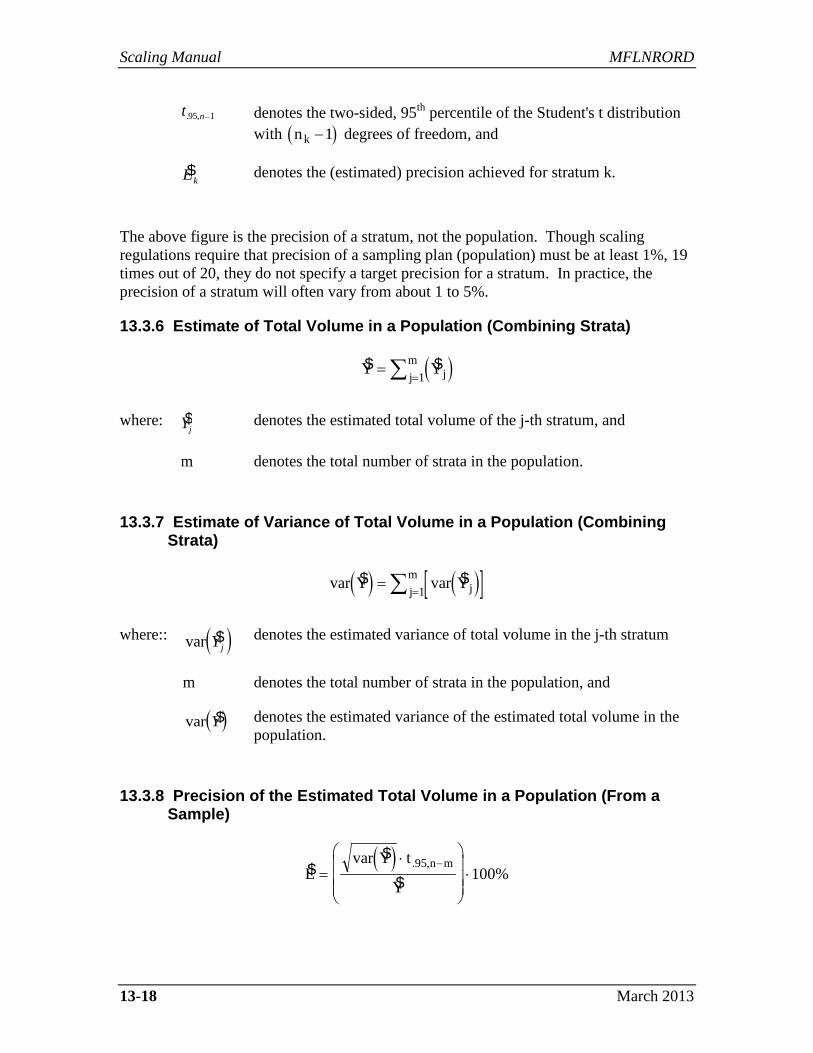
t n. ,95 1− denotes the two-sided, 95th percentile of the Student's t distribution with ( )nk −1 degrees of freedom, and
$Ek denotes the (estimated) precision achieved for stratum k.
The above figure is the precision of a stratum, not the population. Though scaling regulations require that precision of a sampling plan (population) must be at least 1%, 19 times out of 20, they do not specify a target precision for a stratum. In practice, the precision of a stratum will often vary from about 1 to 5%.
13.3.6 Estimate of Total Volume in a Population (Combining Strata)
( )$ $Y Yjjm==∑ 1
where: $Yj denotes the estimated total volume of the j-th stratum, and
m denotes the total number of strata in the population.
13.3.7 Estimate of Variance of Total Volume in a Population (Combining Strata)
( ) ( )[ ]var $ var $Y Yjjm==∑ 1
where:: ( )var $Yj denotes the estimated variance of total volume in the j-th stratum
m denotes the total number of strata in the population, and
( )var $Y denotes the estimated variance of the estimated total volume in the population.
13.3.8 Precision of the Estimated Total Volume in a Population (From a Sample)
( )$var $
$. ,
EY t
Yn m
=⋅
⋅
−95100%
Timber Pricing Branch Weight Scale System
March 2013 13-19
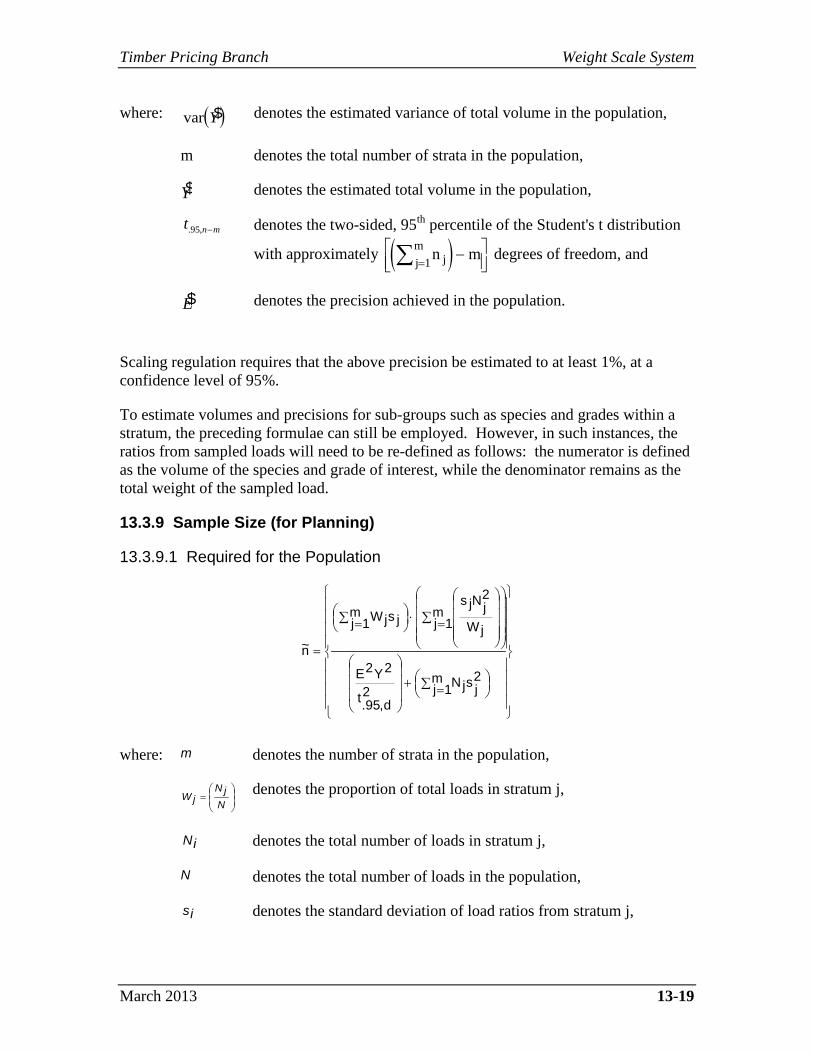
where: ( )var $Y denotes the estimated variance of total volume in the population,
m denotes the total number of strata in the population,
$Y denotes the estimated total volume in the population,
denotes the two-sided, 95th percentile of the Student's t distribution
with approximately ( )n mjjm=∑ −
1 degrees of freedom, and
$E denotes the precision achieved in the population.
Scaling regulation requires that the above precision be estimated to at least 1%, at a confidence level of 95%.
To estimate volumes and precisions for sub-groups such as species and grades within a stratum, the preceding formulae can still be employed. However, in such instances, the ratios from sampled loads will need to be re-defined as follows: the numerator is defined as the volume of the species and grade of interest, while the denominator remains as the total weight of the sampled load.
13.3.9 Sample Size (for Planning)
13.3.9.1 Required for the Population
∑ =+
∑ =
⋅
∑ =
=
m1j
2jsjN
2d,95.t
2Y2E
m1j jW
2jNjs
m1j jsjW
n~
where: m denotes the number of strata in the population,
=
NjN
jW denotes the proportion of total loads in stratum j,
iN denotes the total number of loads in stratum j,
N denotes the total number of loads in the population,
is denotes the standard deviation of load ratios from stratum j,
t n m. ,95 −
Scaling Manual MFLNRORD
13-20 March 2013
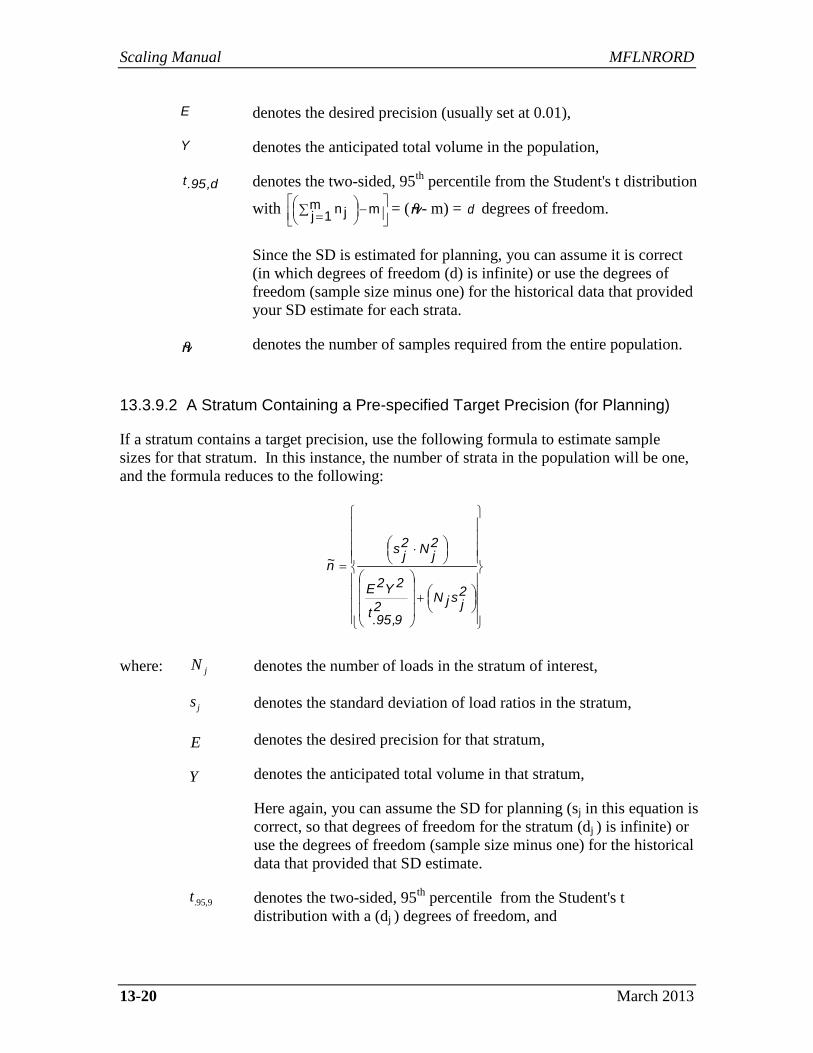
E denotes the desired precision (usually set at 0.01),
Y denotes the anticipated total volume in the population,
d,95.t denotes the two-sided, 95th percentile from the Student's t distribution
with
−
∑ = mm
1j jn = ( %n - m) = d degrees of freedom.
Since the SD is estimated for planning, you can assume it is correct (in which degrees of freedom (d) is infinite) or use the degrees of freedom (sample size minus one) for the historical data that provided your SD estimate for each strata.
%n denotes the number of samples required from the entire population.
13.3.9.2 A Stratum Containing a Pre-specified Target Precision (for Planning)
If a stratum contains a target precision, use the following formula to estimate sample sizes for that stratum. In this instance, the number of strata in the population will be one, and the formula reduces to the following:
+
⋅
=
2jsjN
29,95.t
2Y2E
2jN2
jsn~
where: denotes the number of loads in the stratum of interest,
denotes the standard deviation of load ratios in the stratum,
denotes the desired precision for that stratum,
denotes the anticipated total volume in that stratum,
Here again, you can assume the SD for planning (sj in this equation is correct, so that degrees of freedom for the stratum (dj ) is infinite) or use the degrees of freedom (sample size minus one) for the historical data that provided that SD estimate.
denotes the two-sided, 95th percentile from the Student's t distribution with a (dj ) degrees of freedom, and
N j
sj
E
Y
t. ,95 9
Timber Pricing Branch Weight Scale System
March 2013 13-21
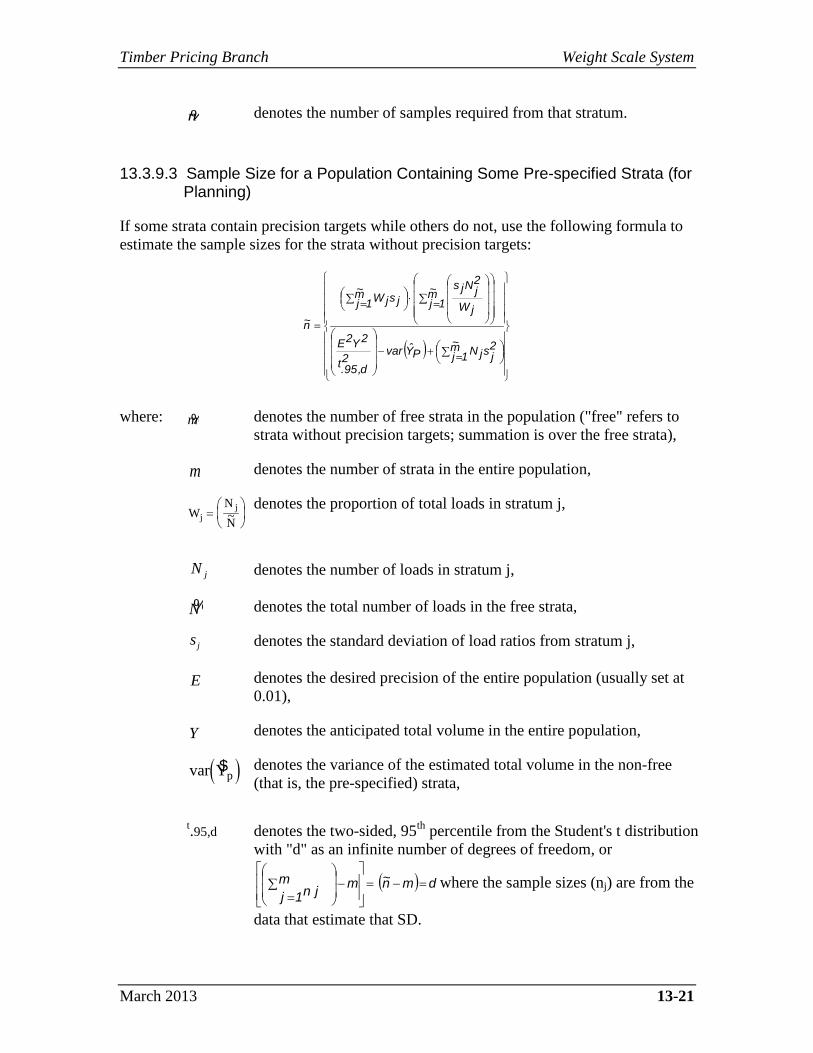
%n denotes the number of samples required from that stratum.
13.3.9.3 Sample Size for a Population Containing Some Pre-specified Strata (for Planning)
If some strata contain precision targets while others do not, use the following formula to estimate the sample sizes for the strata without precision targets:
( )
∑ =+−
∑ =
⋅
∑ =
=
m~1j
2jsjNPYvar2
d,95.t
2Y2E
m~1j jW
2jNjs
m~1j jsjW
n~
where: %m denotes the number of free strata in the population ("free" refers to strata without precision targets; summation is over the free strata),
denotes the number of strata in the entire population,
W
NNj
j=
~
denotes the proportion of total loads in stratum j,
denotes the number of loads in stratum j,
%N denotes the total number of loads in the free strata,
denotes the standard deviation of load ratios from stratum j,
denotes the desired precision of the entire population (usually set at 0.01),
denotes the anticipated total volume in the entire population,
( )var $Yp
denotes the variance of the estimated total volume in the non-free (that is, the pre-specified) strata,
t.95,d denotes the two-sided, 95th percentile from the Student's t distribution with "d" as an infinite number of degrees of freedom, or
( ) dmn~mmjn1j
=−=
−
∑
=where the sample sizes (nj) are from the
data that estimate that SD.
m
N j
sj
E
Y
Scaling Manual MFLNRORD
13-22 March 2013
%n denotes the number of samples required from the free strata.
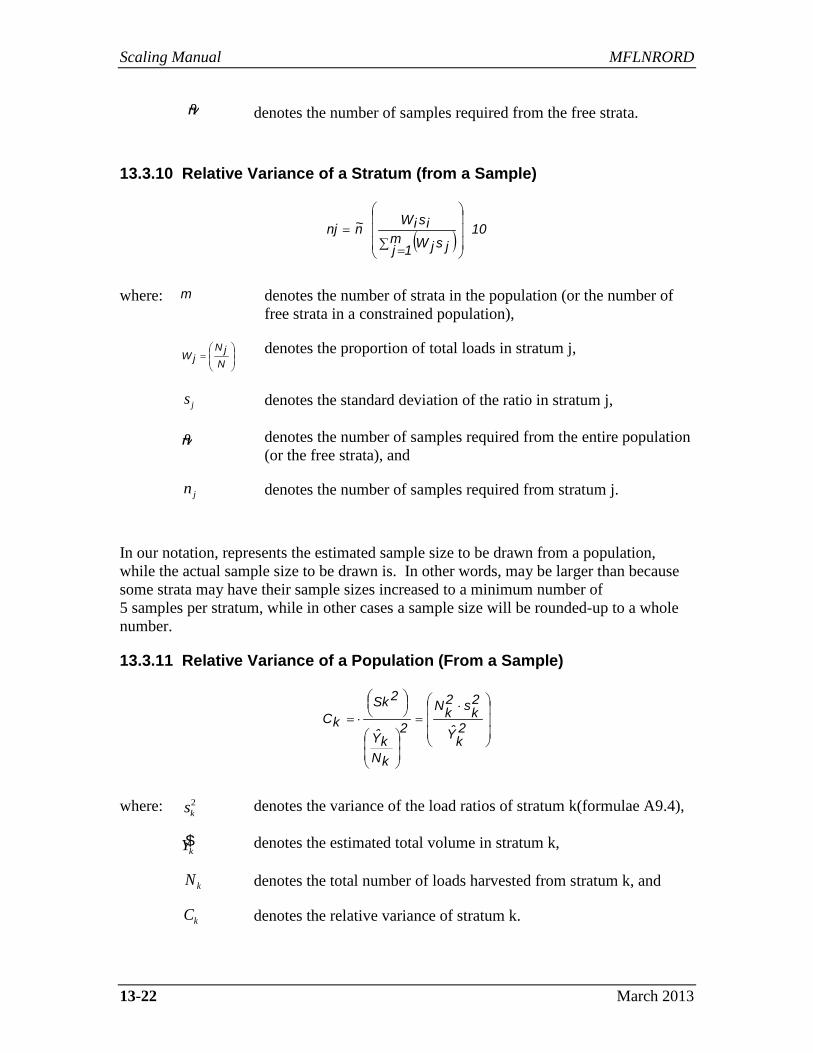
13.3.10 Relative Variance of a Stratum (from a Sample)
( ) 10m
1j jsjWisiW
n~nj
∑ =
=
where: m denotes the number of strata in the population (or the number of free strata in a constrained population),
=
NjN
jW denotes the proportion of total loads in stratum j,
denotes the standard deviation of the ratio in stratum j,
%n denotes the number of samples required from the entire population (or the free strata), and
denotes the number of samples required from stratum j.
In our notation, represents the estimated sample size to be drawn from a population, while the actual sample size to be drawn is. In other words, may be larger than because some strata may have their sample sizes increased to a minimum number of 5 samples per stratum, while in other cases a sample size will be rounded-up to a whole number.
13.3.11 Relative Variance of a Population (From a Sample)
⋅=
⋅=2kY
2ks2
kN
2
kNkY
2SkkC
where: denotes the variance of the load ratios of stratum k(formulae A9.4),
$Yk denotes the estimated total volume in stratum k,
denotes the total number of loads harvested from stratum k, and
denotes the relative variance of stratum k.
sj
n j
sk2
Nk
Ck
Timber Pricing Branch Weight Scale System
March 2013 13-23
The relative variance relates the inherent dispersion of a stratum to its average volume, so it is not affected by the number of samples.
One could argue that the relative variance should be based on ratios and not, as is the case here, on volumes. However, differences between the two are likely to be negligible.
13.3.12 Combining Strata
It might be decided to combine strata when it is observed that they had the same ratio in the past. They might also combine them if they have similar definitions and there were operational reasons to do so. In general, it will not reduce the total number of samples needed, or the sampling ratio by combining strata. Therefore, combining data would usually be done for operational simplicity.
If the strata are combined part way through a billing cycle, the strata must have had the same sampling rate and have a similar definition and ratio. If it is decided that strata with different rates should be combined then they should both be closed off and a new combined strata should be created with a new required sample size and sampling rate to be used from that point forward.
13.3.13 Dividing Strata (Splitting of Strata)
It might be decided to split strata for operational purposes or for other reasons, such as using a larger sample ratio in some of the delivered loads to satisfy a contractor, even when they have exactly the same ratio.
It might also be found that a stratum seems to have two distinct ratios, and therefore it is more efficient (requires a smaller total sample size) when they are divided into two different strata. Whether to do this is a question of examining the data with the Harvest Billing System information.
Midway in the billing cycle, dividing old un-sampled loads into several different strata would usually be difficult, and while not necessarily biased it would at least be time cumbersome. In general, the best procedure would be to close the strata at that point and begin several new ones, with different descriptions and quite possibly different sampling rates.
Scaling Manual MFLNRORD
13-24 March 2013
13.4 Automated Scale Sites (not operated by a Timber Weigher)
● All truck weighing and weighing equipment must comply with both the automated and the non-automated scale site authorization requirements.
● All samples selected must have an audio-visual method of informing industry/ministry staff that a load has been selected as a sample.
● Cameras must be placed strategically to capture the truck and entire load on the scale, drivers entering load information, required sample information being captured and the sample unloaded to ensure load integrity.
● If timber is not automatically stratified by timbermark when the load information is entered in the scale site software, the person responsible for stratification must be tested and appointed as an acting scaler and the person responsible to enter the data in the computer must be trained to properly operate the scale site.
13.5 Scanner Scaling
Measurements Canada has approved the use of log scanners as a method to scale timber for trade purposes. Scanner specifications can be found at:
Measurement Canada Scanning Device
For more information on the process to authorize the use of scanners in BC please contact the Director of Timber Pricing Branch.

Timber Pricing Branch Weight Scale System
March 2013 13-25
This page is intentionally left blank.
![a100.gov.bc.caa100.gov.bc.ca/appsdata/acat/documents/r35888/Huntersmap_1372… · Map production enlarged from 1 scale to 1:] 25,000 scale Reference Map: Mapsheet #821- Vernon, British](https://img.pdfslide.us/doc/110x75/5f06b9287e708231d419698e/a100govbc-map-production-enlarged-from-1-scale-to-1-25000-scale-reference.jpg)