Embed Size (px)
Citation preview

The Way Forward on Global Warming
Reducing Carbon Pollution Today and Restoring Momentum for Tomorrow by Promoting Clean Energy
Volume 1: Envisioning a Clean Energy Path to Address Global Warming

The Way Forward on Global Warming
Reducing Carbon Pollution Today and Restoring Momentum for Tomorrow by Promoting Clean Energy
Volume 1: Envisioning a Clean Energy Path to Address Global Warming
Environment America Research & Policy Center
Tony Dutzik, Elizabeth Ridlington, Rob Kerth and Travis Madsen,
Frontier Group
Rob Sargent, Environment America
Research & Policy Center
Spring 2011

Environment America Research & Policy Center thanks the following individuals who pro-vided information, perspective or review for this document: David Hawkins, Dale Bryk, David Goldstein and Nathanael Greene of the Natural Resources Defense Council; Katrina Pielli of the U.S. Department of Energy; Peter Iwanowicz; Christina Simeone of the Alliance for Climate Protection; Steven Nadel of the American Council for an Energy-Efficient Econo-my; Alan Nogee and Jim Kliesch of the Union of Concerned Scientists; Kathryn Zyla of the Georgetown Climate Center; and Tom Peterson of the Center for Climate Strategies. The views expressed in this report are those of the authors and not necessarily the views of those who provided information or review.
The authors wish to thank Margie Alt, executive director of Environment America Research & Policy Center, for her vision in conceptualizing this project, as well as Nathan Willcox, Dan Gatti and Sean Garren for their contributions. Susan Rakov, Benjamin Davis and Jordan Schneider of Frontier Group and Rich Hannigan of Public Interest GRFX provided valuable editorial support.
The authors bear responsibility for any factual errors. The recommendations are those of En-vironment America Research & Policy Center.
© 2011 Environment America Research & Policy Center
Environment America Research & Policy Center is a 501(c)(3) organization. We are dedicated to protecting America’s air, water and open spaces. We investigate problems, craft solutions, educate the public and decision makers, and help Americans make their voices heard in local, state and national debates over the quality of our environment and our lives. For more information about Environment America Research & Policy Center, please visit www.environmentamerica.org.
Frontier Group conducts independent research and policy analysis to support a cleaner, health-ier and more democratic society. Our mission is to inject accurate information and compelling ideas into public policy debates at the local, state and federal levels. For more information about Frontier Group, please visit www.frontiergroup.org.
Cover photo: Mlenny Photography, istockphoto.comDesign and layout: Harriet Eckstein Graphic Design
Acknowledgments
Table of Contents
Executive Summary 1
Introduction 6
The Challenge: Preventing Dangerous Global Warming 8The Climate Challenge 8The Political Challenge 10
What Will it Take to Succeed? 12
A Precedent for Success: Climate and Energy Victories in the Last Decade 17A Time of Change 17Clean Energy Policies Have Reduced Global Warming Pollution 18 Clean Energy Campaigns Have Changed the Political Playing Field 21
The Way Forward on Global Warming: America’s Potential for Emission Reductions Through Clean Energy Policies 22Emission Reduction Policies 22Clean Energy Policies Can Achieve Significant Emission Reductions 28Identifying the Biggest Opportunities 30Additional Benefits of Clean Energy Policies 31
Conclusion: The Time to Begin Is Now 33
Appendix: State and Scenario-Specific Estimates of Carbon Dioxide Pollution Reductions 34
Notes 38


Executive Summary
Humanity is running out of time to stop the most dangerous impacts of global warming. Signs of glob-
al warming are appearing around the world—including in the United States—and the latest science suggests that future impacts are likely to occur sooner and be more severe than previously thought.
The failure of the international com-munity to take strong action to limit global warming pollution and the death of com-prehensive energy and climate legislation in the U.S. Congress in 2010 have been major setbacks in the battle to prevent the worst impacts of global warming. But there is still hope—there are plenty of op-portunities to reduce emissions of global warming pollution in the United States, while restoring momentum in the fight against global warming.
By adopting a suite of clean energy policies at the local, state and federal levels, the United States could curb emissions of carbon dioxide from en-ergy use by as much as 20 percent by 2020 and 34 percent by 2030 (compared with 2005 levels). These savings represent a significant down payment on the emis-sion reductions America must achieve to prevent the worst impacts of global warming, and put the nation on a path to achieve further emission reductions in the years ahead.
Over the past decade, clean energy policies at the local, state and federal levels have yielded large reductions in global warming pollution and put the nation on a path to a cleaner energy future.
Table ES-1. Estimated Energy-Related Carbon Dioxide Emission Reductions Under the “Way Forward” Policy Scenario
Emission reductions 2015 2020 2025 2030
vs. business as usual 10% 18% 27% 36%
vs. 2008 emissions 11% 17% 25% 32%
estimated reductions vs. 2005 emissions 13% 20% 27% 34%
Executive Summary 1
• Thanks in large part to clean energy policies, America now produces five times as much wind power and eight times as much solar power as we did just seven years ago. Light-duty cars and trucks sold in 2009 were the most fuel efficient and least polluting in history, while the amount of new energy savings delivered by utility energy efficiency programs has nearly tripled since 2004.
• These efforts have helped change the trajectory of carbon dioxide emis-sions in the United States—generat-ing emission reductions well beyond those triggered by the recent eco-nomic downturn. In 2004, the U.S. Department of Energy forecast that, by 2009, America would be emitting 6,453 million metric tons of carbon dioxide from energy use. In actuality, the United States emitted only 5,405 metric tons, 16 percent less than projected.
• State and federal clean energy poli-cies will yield even more emission reductions in the years to come. By 2020, those policies are projected to cut carbon dioxide emissions by 535.9 million metric tons—an amount equivalent to 7 percent of U.S. global warming pollution in 2007.
America can build on the success of current clean energy policies in curb-ing global warming pollution. If done right, a focused strategy to adopt clean energy policies can also restore political momentum in the fight against global warming. Such a strategy should:
• Seek out opportunities to cut emis-sions wherever they may be found—including at the local, state and federal levels—with a special focus on pollution-reduction strategies that
deliver tangible benefits to the en-vironment, the economy and public health.
• Focus on efforts that unite the envi-ronmental community and bring in new partners.
• Unite disparate local and state cam-paigns into a cohesive national effort.
• Erode the power of the fossil fuel industry over public policy.
• Engage the public with efforts to reduce global warming pollution at a variety of levels.
• Use clean energy campaigns to edu-cate the public about global warming.
• Push the envelope with bold, innova-tive policy ideas wherever possible.
There are many opportunities for the United States to reduce global warming pollution at the local, state and federal level through clean energy policies. State and local action is not a “second-best” solution to the climate crisis—indeed, state and local efforts have often set the stage for the adoption of ambitious policies at the federal level.
Through the adoption of 30 clean en-ergy policies or measures nationwide (see “The Way Forward,” page 4), the United States could reduce its emissions of carbon dioxide from energy use by as much as 20 percent below 2005 levels by 2020 and 34 percent below 2005 levels by 2030, while paving the way for further emission reduc-tions in the years to come.
Among those policies are many that si-multaneously address America’s most press-ing challenges, including:
• Fossil fuel dependence – Stronger fuel economy standards for cars and
2 The Way Forward on Global Warming
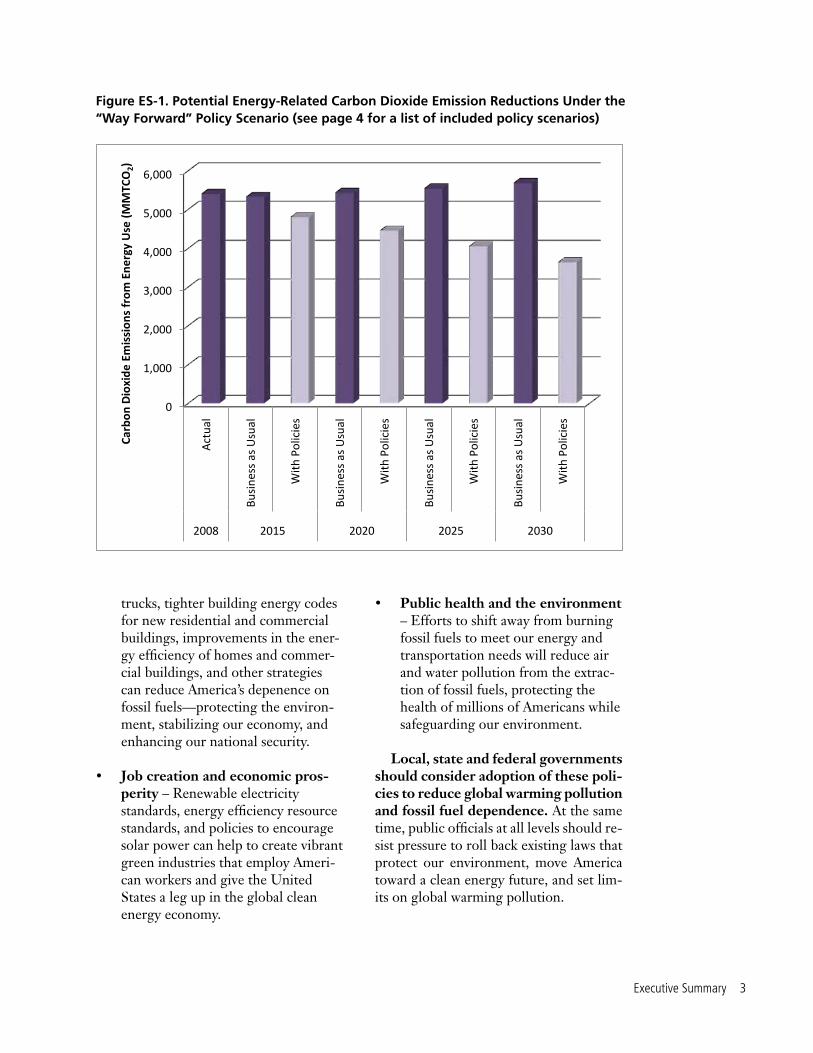
trucks, tighter building energy codes for new residential and commercial buildings, improvements in the ener-gy efficiency of homes and commer-cial buildings, and other strategies can reduce America’s depenence on fossil fuels—protecting the environ-ment, stabilizing our economy, and enhancing our national security.
• Job creation and economic pros-perity – Renewable electricity standards, energy efficiency resource standards, and policies to encourage solar power can help to create vibrant green industries that employ Ameri-can workers and give the United States a leg up in the global clean energy economy.
• Public health and the environment – Efforts to shift away from burning fossil fuels to meet our energy and transportation needs will reduce air and water pollution from the extrac-tion of fossil fuels, protecting the health of millions of Americans while safeguarding our environment.
Local, state and federal governments should consider adoption of these poli-cies to reduce global warming pollution and fossil fuel dependence. At the same time, public officials at all levels should re-sist pressure to roll back existing laws that protect our environment, move America toward a clean energy future, and set lim-its on global warming pollution.
0
1,000
2,000
3,000
4,000
5,000
6,000
Act
ual
Busi
ness
as
Usu
al
With
Pol
icie
s
Busi
ness
as
Usu
al
With
Pol
icie
s
Busi
ness
as
Usu
al
With
Pol
icie
s
Busi
ness
as
Usu
al
With
Pol
icie
s
2008 2015 2020 2025 2030
Carb
on D
ioxi
de E
mis
sion
s fr
om E
nerg
y U
se (M
MTC
O2)
Figure ES-1. Potential Energy-Related Carbon Dioxide Emission Reductions Under the “Way Forward” Policy Scenario (see page 4 for a list of included policy scenarios)
Executive Summary 3

The Way Forward: A Clean Energy Strategy to Address Global Warming• Retrofit three-quarters of America’s homes and businesses for improved
energy efficiency.
• Implement strong building energy codes to dramatically reduce fossil fuel consumption in new homes and businesses.
• Set strong energy efficiency standards for household appliances and commercial equipment.
• Promote the use of energy-efficient boilers and process heat systems in industrial facilities.
• Encourage the use of energy-saving combined heat-and-power systems in industry.
• Install more than 200 gigawatts of solar panels and other forms of distributed renewable energy at residential, commercial and industrial buildings over the next two decades.
• Adopt strong energy efficiency resource standards that require utilities to deliver energy efficiency improvements in homes, business and industry.
• Require new light-duty vehicles to achieve improved fuel economy consistent with a 62 miles per gallon standard by 2025.
• Facilitate the deployment of millions of plug-in vehicles that operate partly or solely on electricity.
• Require the sale of energy-efficient replacement tires.
• Ensure that the majority of new residential and commercial development in metropolitan areas takes place in compact, walkable communities with access to a range of transportation options.
• Transition to pay-as-you-drive automobile insurance, which reduces vehicle travel and accident risk.
4 The Way Forward on Global Warming

The Way Forward (cont’d)
• Adopt clean fuel standards that require a reduction in the carbon intensity of transportation fuels.
• Expand public transportation service to double ridership by 2030, encourage further ridership increases through better transit service, and reduce per-mile global warming pollution from transit vehicles.
• Encourage bicycle travel through efforts to improve the safety and convenience of bicycling.
• Build high-speed rail lines in 11 high-priority corridors by 2030.
• Adopt strong fuel economy standards for heavy-duty trucks.
• Encourage energy efficiency improvements in airplanes and trains.
• Bar the construction of new conventional coal-fired power plants—either through moratoria or the adoption of carbon dioxide performance standards for new power plants.
• Adopt renewable electricity standards that call for 25 percent of America’s electricity to come from clean, renewable sources by 2025 and 33 percent by 2030.
• Enforce proposed federal standards on emissions of smog-forming pollutants, soot and mercury from coal-fired power plants.
• Adopt strong federal standards for global warming pollution from power plants and industrial facilities.
• Strengthen the Regional Greenhouse Gas Initiative, which limits global warming pollution from power plants in 10 northeastern states.
• Carry out President Obama’s Executive Order 13514, which requires large reductions in global warming pollution from federal agencies.
• Enforce existing state limits on global warming pollution.
Executive Summary �

Traveler, there is no path.The path is made by walking.By walking you make a path.And turning, you look back.At a way you will never tread again.
– Antonio Machado, Spanish poet1
Decades after scientists issued the first urgent warnings that human activi-ties threatened irreversible changes
to the Earth’s climate, there remains no clear path to preventing the worst impacts of global warming.
The leaders of the United States and the world—along with the political in-stitutions we have created—have thus far proven unwilling to take the actions needed to address the threat, despite clear evidence of the urgent need for action and an outpouring of public concern spanning the globe.
At the same time, global warming pol-lution has continued to increase, while continued scientific study has revealed that global warming will result in more severe impacts to ecosystems and human civilization—and will do so sooner and at
lower levels of emissions—than previously believed.
The situation is clear. The scientific im-perative to reduce global warming emis-sions dramatically and immediately is un-yielding. So, too, it seems, is the political resistance to a comprehensive solution to the climate crisis.
There may be no clear path to prevent-ing the worst impacts of global warming, but we know the direction in which we need to head—toward an economy that operates largely on clean sources of ener-gy and away from old habits and practices that waste fossil fuels.
We know that there are many steps that can move us toward that goal—thou-sands of potential actions that can be taken through public policy (and countless more through individual and collective action) that can move America and the world toward a clean energy future with dimin-ished impact on the climate.
And we know that there are millions of people in America and around the world who are hungry for a new energy system that protects our environment, reduces our crippling dependence on fossil fuels,
Introduction
6 The Way Forward on Global Warming

and provides a sustainable platform for fu-ture economic prosperity.
We also have the benefit of experience following a decade of unprecedented pub-lic policy progress—largely at the state level—toward a cleaner energy future. We can now turn and look back at the results of those efforts: a dramatic increase in re-newable energy production, significant increases in the energy efficiency of our buildings, appliances and vehicles, and the unleashing of creative energy and inno-vation in the pursuit of new clean energy technologies.
There may be no clear roadmap to pre-venting the worst impacts of global warm-ing. But there is a way forward.
In this report, we propose a strategy for rebuilding momentum for solutions to the climate crisis that begins with the adoption of strong—and often broadly popular—clean energy policies at the lo-cal, state and federal levels. Winning these policies can make an immediate dent in global warming pollution, and lay the groundwork for the emergence of a clean energy economy in the years ahead, while the act of campaigning for them can help build the strength of the broader move-ment to address global warming.
But the work cannot stop there, for there is no ultimate solution to global warming that does not involve comprehen-sive action—specifically, the adoption of enforceable limits on global warming pol-lution and a price on carbon. Today’s work for clean energy must not only be an end in and of itself, but it must also be used as a means of changing the political calculus to make bolder action on global warming possible in the years to come.
This report comes in two volumes. In this document—Volume 1—we survey the scientific and political landscape, describe how a clean energy strategy can curb global warming pollution and change the politi-cal landscape, and provide an estimate of the emission reductions that could result from the adoption of a package of 30 spe-cific clean energy policies, measures and initiatives, many of which can be imple-mented at the local or state level, not just in Washington, D.C.
In Volume 2 (available at www.environ-mentamerica.org), we provide an in-depth review of the 30 policy strategies that de-scribes the changes they will bring about in America’s energy system and the impact they will have on global warming pollu-tion over the next two decades.
Introduction 7

Global warming poses a dual chal-lenge to the United States and the world. The first and overriding
challenge is reducing emissions of global warming pollutants quickly enough to prevent catastrophic changes to the global climate. The second challenge is a chal-lenge to our political institutions: How can the nations of the world—including the United States—build the political will to address global warming?
A successful strategy to address global warming must address both challenges.
The Climate ChallengeHumanity is running out of time to pre-vent the worst impacts of global warming.
In 2007, the Intergovernmental Panel on Climate Change (IPCC)—the world’s foremost scientific authority on the sub-ject—concluded that “warming of the climate system is unequivocal” and that “[m]ost of the observed increase in global average temperatures since the mid-20th century is very likely due to the observed
increase in anthropogenic [greenhouse gas] concentrations.”2
Since then, the evidence that humans are warming the globe has only gotten stronger. In the words of a recent report published by the U.S. National Academy of Sciences: “Some scientific conclusions or theories have been so thoroughly exam-ined and tested, and supported by so many independent observations and results, that their likelihood of subsequently being found to be wrong is vanishingly small. … This is the case for the conclusion that the Earth system is warming and that much of this warming is very likely due to human ac-tivities.3 (emphasis added)
Clear signs of global warming have al-ready begun to emerge:
• Global average sea and air tem-peratures in 2010 were tied for the hottest on record, according to the National Oceanic and Atmospheric Administration (NOAA).4 The decade of 2001 to 2010 was the hot-test 10-year period on record, with average temperatures estimated to be 0.83˚F hotter than the 1961-1990 normal.5 2010 was also the wettest
The Challenge: Preventing Dangerous Global Warming
8 The Way Forward on Global Warming

year on record based on global aver-age precipitation.6
• Scientists have tracked the progres-sion of global warming across a range of indicators, including increases in sea surface temperatures, increased humidity, rising sea level, and shrink-ing of Arctic sea ice, glaciers, and snow cover in the Northern Hemi-sphere.7
• The extent of Arctic sea ice in Sep-tember 2010 was the third-lowest on record, trailing only 2007 and 2008.8 Ice loss has accelerated in Greenland, with 2010 posting the largest area of glacier ice loss ever recorded. 9
Several events in 2010 provided a foreshadowing of the types of disruption
global warming may cause in the years ahead. Rising sea temperatures led to widespread damage to the world’s coral reefs.10 The Amazon experienced its third major drought in the last 12 years,11 a dev-astating and unprecedented heat wave saw temperatures in Moscow exceed 100˚F for the first time in recorded history,12 and massive floods in Pakistan affected millions of people, caused by the worst monsoon rains in 80 years.13 The United States experienced the “Snowmageddon” series of moisture-driven, record-breaking snowstorms in the Mid-Atlantic states, a “500-year” flood in southern New Eng-land in March, and a “1,000-year” flood in Tennessee in May.14
Meanwhile, science now suggests that the impacts of global warming are likely to be more severe—and to inflict greater damage at smaller temperature changes—
The impacts of global warming are beginning to be felt in the United States and around the world. The United States has experienced an increase in extreme precipitation events, triggering massive floods such as this flood in Davenport, Iowa, in 2008. Photo: Kurt Ockelmann
The Challenge: Preventing Dangerous Global Warming �

than previously thought. Recent research, for example, suggests that sea-level rise re-sulting from global warming will be greater than estimated by the IPCC in 2007, with estimated rise of 30 to 75 inches (75 to 190 centimeters) between 1990 and 2100.15
A study by Stanford University re-searchers found that, even under a sce-nario under which the increase in global average temperatures is limited to 2˚C above pre-industrial levels (the target set by world leaders at the Copenhagen sum-mit in 2009 to prevent “dangerous climate change”), the United States will still be subject to increasingly intense and fre-quent heat waves in the coming decades.16
In addition, new research suggests that the IPCC’s projections of global warm-ing—rather than being “alarmist,” as some opponents of action on global warming claim—have been overly optimistic. In-deed, some scientists suggest that global warming resulting from emissions already produced may generate dangerous climate change by the end of this century and that the global climate is less resilient than pre-viously believed.17
What the World Must DoThe most important priority for the world is to reduce emissions of global warm-ing pollutants quickly and dramatically. For the world, emissions will need to peak roughly five years from now and de-cline by more than half by 2050 to have a chance at preventing the worst impacts of climate change.18 For the United States and other developed countries, emission reductions must occur more quickly and more steeply, with reductions of at least 25 to 40 percent below 1990 levels by 2020 and 80 to 95 percent by 2050.19
Achieving the large emission reduc-tions needed to prevent the worst impacts of global warming will be a challenge, re-quiring broad-scale transformations in the way we produce and use energy. While the
United States and the world should take all actions necessary to achieve these emis-sion reduction targets, any emission re-ductions—regardless of whether they are sufficient to achieve a particular numerical target—are likely to reduce the impact of global warming now and for generations to come.
The Political ChallengePreventing the worst impacts of global warming would be difficult enough even with a society and political system ful-ly dedicated to the task. Yet, as the slow progress of international negotiations on climate and demise of comprehensive en-ergy and climate legislation in the 111th Congress demonstrate, there are signifi-cant political roadblocks that are keeping America and the world from rising to the challenge posed by global warming.
Those roadblocks include, but are not limited to:
• The vulnerability of comprehen-sive agreements or policies to address global warming to the ef-fective “veto” of nations, regions or states that benefit economical-ly from the fossil fuel status quo. Two nations—the United States and China—produced 43 percent of the world’s energy-related carbon diox-ide emissions in 2009.20 As a result, no international agreement that fails to include both of those countries can expect to achieve the emis-sion reductions needed to prevent the worst impacts of global warm-ing. Similarly, in the United States Congress, large coal-producing and coal-consuming states hold sufficient sway to influence the outcome of any comprehensive energy or global warming bill.
10 The Way Forward on Global Warming
• The entrenched economic and political power of incumbent fossil fuel interests. In the 2010 U.S. federal election campaigns, for example, oil and gas interests spent more than $27 million on campaign contributions.21 That is in addition to the more than $320 million spent on lobbying by oil and gas interests during 2009 and 2010 as Congress considered comprehensive energy and climate legislation.22 It is also in addition to the countless millions more spent by fossil fuel industries to endow think tanks and bankroll global warming “skeptics” in an ef-fort to create uncertainty about the broad scientific consensus on the issue.23
• The polarization of political dis-course in the United States—es-pecially at the national level—which politicizes even basic scientific facts and prevents the emergence of coali-tions that span ideological fault lines in pursuit of policies that benefit the
public good. In 1998, for example, equal percentages of Democrats and Republicans believed that the effects of global warming had already begun to appear. By 2008, however, 76 percent of Democrats believed that the effects of global warming had begun, compared to only 41 percent of Republicans.24
The scientific challenge posed by global warming—the desperate need to begin re-ducing emissions as quickly and dramati-cally as possible—cannot by addressed without simultaneously acknowledging, and working either to surmount or to cir-cumvent, the political obstacles to change. A strategy that purports to address the scientific challenge of global warming but does not simultaneously address the po-litical challenges is not a strategy—it is a vain hope. And a strategy that seeks to work within existing political constructs that does not acknowledge the reality of the science and the scale of the actions re-quired to protect the planet is also not a strategy—it is a delusion.
The Challenge: Preventing Dangerous Global Warming 11

The tension between the limits of the climate system and the limits of the political system is the great tension at
the heart of the environmental movement at the dawn of the 21st century.
Some interpret the current—and very real—political limitations as an inevitable and unyielding constraint on the scope of climate action. The imperative to do something—anything—to forestall plan-etary catastrophe opens the door to “com-promises” that would be unacceptable in any other context: giveaways to incum-bent fossil fuel interests, or the embrace of technologies or fuels with significant environmental and public health impacts. To some, the political limitations on cli-mate action are so strict that they believe little can be done in the near term except to place bets on the hope that a techno-logical “breakthrough” will come along to save the day.
On the other hand, there are some for whom the scientific imperative of achieving massive emission reductions in a very short period of time trumps even the acknowledgment of real politi-cal limitations. A climate policy that fails to deliver all of what is needed to put
the United States and the world on track for dramatic reductions in emissions is deemed not worth taking seriously, even if winning such a policy would defy all notions of political gravity, and compro-mise is seen as an unacceptable sell-out of principle.
The tragedy of this situation is that both camps are correct—we face both a stern and unyielding challenge from the climate system and major institutional and political barriers to change.
But the situation is not hopeless. The way forward out of America’s cur-
rent dilemma lies with building support for a policy agenda that can address both challenges at once—producing real, mean-ingful reductions in global warming pol-lution, while at the same time expanding the realm of what is possible within the political system.
As with all other strategies to address global warming, there is no guarantee of success. But there is reason to believe, based on the recent experience with clean energy policies in the United States, that such a strategy can work. And there are plenty of opportunities to put it to the test.
What Will it Take to Succeed?
12 The Way Forward on Global Warming

What might such a strategy look like? To follow are seven principles that could guide it.
1. Seek Out Opportunities to Reduce Emissions Wherever They Can Be Found
Over the past several years, vast resources have been devoted to winning compre-hensive energy and climate legislation at the federal level, and for good reason—comprehensive federal legislation will be necessary to produce the emission reduc-tions needed to put America and the world on track to prevent the worst impacts of global warming.
There are, however, countless addi-tional opportunities to reduce emissions using existing federal statutes as well as the opportunities presented by action at state and local levels of government.
In this report, we estimate the poten-tial impacts of 30 public policies, mea-sures and initiatives to reduce global warming pollution, most of which can be adopted at the state level. With 50 states, that makes more than 1,000 potential opportunities to reduce global warming pollution.
State and local action on global warm-ing is not a “second-best” solution to the climate crisis. Indeed, time and again, ambitious public policy action at the lo-cal or state level has created a precedent for strong action at the federal level. Moreover, as described below, state and local campaigns can involve and engage citizens in ways that federal legislative campaigns cannot. Under the right con-ditions, these policies can not only deliv-er concrete emission reductions, but they can also spur changes in infrastructure and transform economic conditions in ways that will make the goals of an even-tual national program easier to meet.
2. Unite the Environmental Community and Bring in New Partners
A successful strategy to address global warming will emphasize policies with the greatest potential to unite the environmen-tal community and build coalitions with people who may not describe themselves as environmentalists and whose primary concern may not be global warming.
In practice, that means focusing on campaigns for clean energy and the de-velopment of sustainable communities and economies for the long run. There is little room in this strategy for policies that cause or acquiesce to severe environ-mental harm—whether it is in the form of mountaintop removal coal mining, poorly regulated hydraulic fracturing for natural gas, or dangerous nuclear power, the waste from which remains hazardous for thou-sands of years. Renewable energy, energy efficiency and sustainable communities are visions that have the potential to unite, rather than divide, the environmental base. And a united base is critical for the even-more-difficult efforts ahead as the nation makes deeper reductions in global warming pollution.
Many of these same strategies have the potential to bring new constituencies to the fight against global warming, from farmers to “cleantech” entrepreneurs to labor interests to the low-income commu-nity—even to thoughtful conservatives.
3. Make One Campaign Out of Many
A strategy that relies on dozens of campaigns at the local, state and federal levels could easily devolve into incoherence—with each separate campaign seen as having little con-nection to the overarching goal of address-ing global warming pollution. A successful
What Will it Take to Succeed? 13

strategy will require coordination among groups working on clean energy policies, as well as “scorekeeping” to keep track of how local and state-level victories are likely to contribute to the achievement of America’s emission reduction goals.
Even campaigns that win significant re-ductions in global warming emissions in a particular state will represent just a drop in the bucket of the emission reductions needed to put the world on a sustainable path. Advocates for these policies need the analytical and communications tools to ex-plain how actions at the state and local level can—when combined with actions in other jurisdictions and in other areas of public pol-icy—lead to meaningful change.
In addition, there must be effective “drive trains” for ideas to ensure that campaigns for clean energy reforms and global warming emission reductions in one jurisdiction can benefit from the wisdom of previous efforts in other states.
4. Curb the Power of Incumbent Polluting Interests
The entrenched power of fossil fuel pro-ducers and fossil fuel consuming indus-tries is among the leading impediments to effective action on global warming at the federal level. There are many ways, how-ever, in which advocacy for clean energy policies at the local, state and federal levels can begin to change the political playing field in ways that make the achievement of comprehensive reforms more likely. There are several ways to do this:
• First, incumbent interests can be con-verted from opposition to support of clean energy policies. This has already occurred with some electric utilities.
• Second, clean energy victories can erect competing economic interests to counterbalance the influence of
Clean energy policies create new economic opportunities for the United States, such as at this wind turbine blade factory in North Dakota. Workers and employers in these industries can be vested partners in creating a cleaner energy system with less impact on the global climate. Photo: Flickr user Tuey
14 The Way Forward on Global Warming

polluting industries—for example, by spurring the creation of renewable energy or “cleantech” businesses in a particular city or state.
• Third, the successful implementation of clean energy policies can undercut the argument of incumbent interests that reducing global warming pollu-tion will harm the economy, eroding the credibility of those interests in the halls of power.
An effective strategy for addressing global warming will emphasize campaigns that provide the chance to create alliances of convenience with existing industries and the opportunity to build vibrant new industries.
5. Engage the Public on Multiple Levels
A successful strategy against global warm-ing will engage the public on many levels. Asking citizens to “write their congress-man” in support of strong global warming legislation is important—but it also fails to take advantage of the intense desire of millions of citizens to engage in meaning-ful action for a better world.
By engaging in policy work at the local, state and federal levels, citizens will have the opportunity to participate in a variety of campaigns in a variety of ways.
Efforts to improve the energy effi-ciency of buildings are prime examples. Citizens can work together in voluntary programs to identify opportunities to reduce energy waste in their homes. In the process, those citizens may become more aware of the market barriers and other obstacles to improving energy ef-ficiency, and thereby connect with local or statewide campaigns to enact energy efficiency policies.
A focus on well-designed, well-imple-mented clean energy policies can also en-sure that the public has a positive experi-ence with policies to address global warm-ing. If the majority of citizens experience the effects of climate policy as solely an increase in their energy bills, their support will be more difficult to obtain and sus-tain than if they experience those policies as providing a more comfortable home, more transportation options, cleaner air, lower bills for heating and gasoline, and the dissemination of new green technolo-gies in the neighborhoods in which they live. The public must see change happen in order to fully understand it and embrace it—a sound global warming strategy will ensure that they do.
6. Educate the Public About Global Warming
The politically polarized atmosphere surrounding the debate around global warming leads many advocates to avoid highlighting climate change in their pub-lic messaging as they advocate for clean energy policies, focusing instead on other benefits of those policies such as reduced dependence on fossil fuels, the creation of local jobs, and cleaner air.
In the short run, this approach often makes sense—expanding the potential to build bipartisan coalitions and enabling advocates to communicate with the public about the issues that truly concern them.
In the long run, however, the public must come to understand the dire and ur-gent threat posed by global warming if the nation is to be prepared to take the neces-sary steps to address the problem.
In many places, “green jobs,” “clean air” or “getting off foreign oil” may be the most persuasive messages, but these efforts will do little to build a long-term movement to address global warming un-
What Will it Take to Succeed? 1�

less advocates take advantage of the op-portunities presented by these campaigns to raise awareness among the public about the dangers posed by global warming and the need for immediate action.
7. Push the Envelope
The strategy described in this report re-lies mainly on specific, tangible policies to reduce global warming pollution in the near term. But advocates should also seek out opportunities to push the envelope of what is politically possible. California’s landmark global warming emission stan-dards for light-duty vehicles, for example, were considered a longshot for passage when proposed by a then-obscure, first-term state legislator (current state Senator Fran Pavley) in 2002. Yet, those standards came to redefine the debate around global
warming pollution from vehicles and will yield dramatic reductions in global warm-ing pollution in the years to come.
Indeed, in the leading states, clean en-ergy advocacy has followed a predictable pattern, with initial victories on policies such as renewable electricity standards laying the groundwork for the ratcheting-up of renewable energy goals over time and, in some cases, the adoption of state-wide carbon caps. In each of these states, advocates did not rest on their laurels, but constantly challenged the limits of what is politically possible—thereby setting an example for other states to follow.
Can such a strategy achieve meaning-ful reductions in global warming pollution quickly—and, in so doing, build the political consensus for further, more ambitious ac-tion? The next section describes the histori-cal rationale for believing that it can work by looking at the recent history of clean energy advocacy in the United States.
16 The Way Forward on Global Warming

A climate action strategy that builds momentum by winning clean en-ergy victories at the local and state
level is not a new idea. In fact, it is the strategy that is most responsible for the dramatic leap forward in America’s clean energy economy over the past decade—a leap forward that has achieved measurable reductions in global warming pollution and begun to build new constituencies for stronger action.
A Time of ChangeOver the past decade—even as compre-hensive action on energy and climate has been stymied on Capitol Hill—America has made tremendous progress toward shifting to cleaner sources of energy with less impact on the climate.
Since 2004, for example:
• The number of states with renew-able electricity standards (RESs) has increased from 13 to 28, and many states that had originally adopted
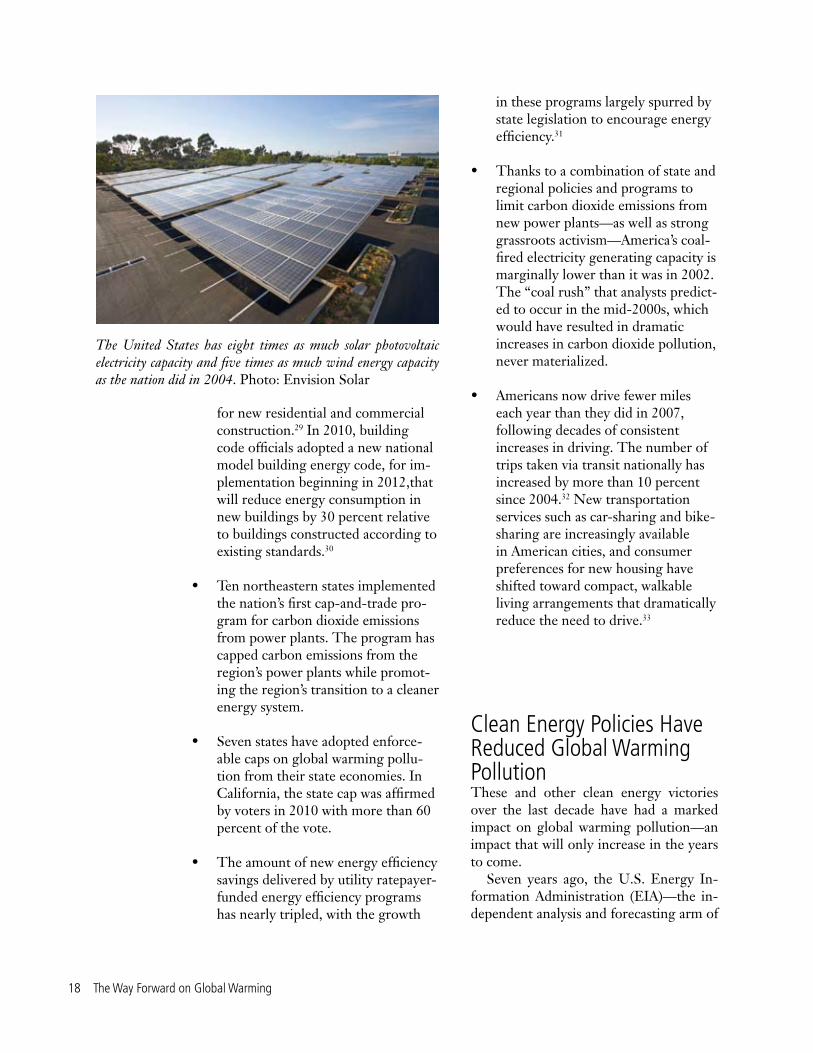
RESs have increased their targets for renewable electricity generation.25 America now has five times as much wind power and eight times as much solar photovoltaic power as we did in 2004.26 New technologies have also gotten a crucial jump-start: new solar thermal plants are under construc-tion that will provide enough elec-tricity to power 3 million homes, and America’s first offshore wind farm is now nearing construction.27
• California and 13 other states adopt-ed standards for tailpipe emissions of global warming pollution from cars, which led to the adoption of similar federal standards in 2010. The new standards call for light-duty vehicles to achieve average fuel economy of 34 mpg by 2016. After more than two decades of stagnation in vehicle fuel economy, light-duty vehicles sold in 2009 were the most energy-efficient and least polluting of any model year in U.S. history.28
• More than half of all states have ad-opted updated building energy codes
A Precedent for Success: Climate and Energy Victories in the Last Decade
A Precedent for Success 17
for new residential and commercial construction.29 In 2010, building code officials adopted a new national model building energy code, for im-plementation beginning in 2012,that will reduce energy consumption in new buildings by 30 percent relative to buildings constructed according to existing standards.30
• Ten northeastern states implemented the nation’s first cap-and-trade pro-gram for carbon dioxide emissions from power plants. The program has capped carbon emissions from the region’s power plants while promot-ing the region’s transition to a cleaner energy system.
• Seven states have adopted enforce-able caps on global warming pollu-tion from their state economies. In California, the state cap was affirmed by voters in 2010 with more than 60 percent of the vote.
• The amount of new energy efficiency savings delivered by utility ratepayer-funded energy efficiency programs has nearly tripled, with the growth
in these programs largely spurred by state legislation to encourage energy efficiency.31
• Thanks to a combination of state and regional policies and programs to limit carbon dioxide emissions from new power plants—as well as strong grassroots activism—America’s coal-fired electricity generating capacity is marginally lower than it was in 2002. The “coal rush” that analysts predict-ed to occur in the mid-2000s, which would have resulted in dramatic increases in carbon dioxide pollution, never materialized.
• Americans now drive fewer miles each year than they did in 2007, following decades of consistent increases in driving. The number of trips taken via transit nationally has increased by more than 10 percent since 2004.32 New transportation services such as car-sharing and bike-sharing are increasingly available in American cities, and consumer preferences for new housing have shifted toward compact, walkable living arrangements that dramatically reduce the need to drive.33
Clean Energy Policies Have Reduced Global Warming PollutionThese and other clean energy victories over the last decade have had a marked impact on global warming pollution—an impact that will only increase in the years to come.
Seven years ago, the U.S. Energy In-formation Administration (EIA)—the in-dependent analysis and forecasting arm of
The United States has eight times as much solar photovoltaic electricity capacity and five times as much wind energy capacity as the nation did in 2004. Photo: Envision Solar
18 The Way Forward on Global Warming

the Department of Energy—issued a bleak forecast for America’s future emissions of global warming pollution. In its Annual Energy Outlook, the EIA forecast that, by 2010—last year—energy-related emissions of carbon dioxide would top 6,500 mil-lion metric tons, a 14 percent increase over 2001 levels. By 2025, emissions were projected to exceed 8,100 million metric tons—a level of emissions that, if real-ized, would unquestionably have doomed efforts to reverse the trajectory of global warming pollution.34 (See Figure 1.)
There was every reason to believe in 2004 that these dire predictions would come to pass. Since 1950, U.S. emissions of carbon dioxide had increased by an annual average of 1.8 percent per year.36
Carbon dioxide emissions had increased in 40 of the previous 54 years, and in all but one year since 1992. America’s economy was growing. Energy experts predicted a “coal rush” that would result in a massive expansion of America’s coal-fired generat-ing capacity.
But beneath the radar, a clean energy revolution was brewing. States were start-ing to take aggressive actions to bolster production of renewable energy, curb global warming pollution from transporta-tion, and improve the energy efficiency of their economies. Over time, similar clean energy policies began to be implemented at the federal level—including improve-ments in vehicle fuel economy standards, energy efficiency standards for appliances,
5,000
5,500
6,000
6,500
7,000
7,500
8,000
8,500
Ener
gy-R
elat
ed C
arbo
n D
ioxi
de E
mis
sion
s (m
illio
n m
etri
c to
ns)
2004 projection
2005 projection
2006 projection
2007 projection
2008 projection
2009 (April) projection
2010 projection
2011 (early) projection
Actual
Figure 1. U.S. Department of Energy Projected Emissions of Carbon Dioxide by Year in Which Projection Was Made35
A Precedent for Success 1�

and tax incentives for renewable energy development—both through legislation and through the use of the president’s ex-ecutive powers.
Today, America stands at a much dif-ferent place than we did seven years ago. In 2009, the United States emitted 5,405 million metric tons of carbon dioxide pol-lution from energy use—16 percent less than the EIA had forecast we would emit just five years prior.37
To be sure, America’s economic down-turn had a great deal to do with the drop, as have changes in the energy marketplace, most notably the fall in natural gas prices. But clean energy policies have also played an important role in moving America to-ward a cleaner future.
The EIA, in analyzing the record drop in U.S. carbon dioxide emissions in 2009, found that only about one-third of the decline could be directly attributed to the faltering economy. A decline in the carbon
intensity of energy use (driven by a large-scale shift from coal to natural gas and renewables) and a decline in the energy intensity of the economy (led by a shift to more fuel-efficient vehicles and a reduc-tion in driving) were each responsible for an additional one-third of the decline.38
Environment America Research & Policy Center’s 2009 report, America on the Move, projected that a series of state and federal clean energy policies adopted over the past decade will cut global warm-ing pollution by 535.9 million metric tons by 2020, an amount equivalent to 7 per-cent of U.S. global warming pollution in 2007.39 (See Figure 2.) In part because of these measures, the EIA now projects that U.S. carbon dioxide emissions in 2020 will total 5,774 million metric tons—4 per-cent less than emissions in the peak year of 2007 and 23 percent below the emis-sions level the EIA projected as recently as 2004.40
0
100
200
300
400
500
600
Esti
mat
ed G
loba
l War
min
g Em
issi
on
Redu
ctio
ns v
s. B
usin
ess
as U
sual
(M
MTC
O2E
), 20
20
Regional Greenhouse Gas Initiative
National Lighting Efficiency Standard
Recovery Act Efficiency Programs (a)
Updated Building Energy Codes
State & Federal Clean Cars Program
State & Federal Appliance Standards
Energy Efficiency Resource Standards
Renewable Electricity Standards
State Emission Caps
Figure 2. Projected Emission Reductions in 2020 from State and Federal Clean Energy Policies41
(a) Includes only those programs in which funding had been allocated as of December 2009. Chart excludes emission reductions from overlapping policies.
20 The Way Forward on Global Warming

Clean Energy Campaigns Have Changed the Political Playing FieldClean energy victories have also changed the playing field on which public policy is set in the United States.
First, clean energy victories have creat-ed new industries with a stake in continued progress. In California, for example, the campaign to defend California’s landmark global warming emission cap drew strong support from “cleantech” companies and investors, who saw direct economic self-interest in the state’s continued pursuit of clean energy.42 Just as importantly, the in-volvement of these companies also legiti-mized the argument that clean technology can be a sound foundation for the state’s economic future.
In other states, the seeds of a clean energy economy—once planted—have proven difficult to uproot. In Ohio, newly elected Republican Governor John Kasich has signaled that he does not oppose the state’s renewable electricity standard and will not seek to repeal it, likely because of the recent boom in clean energy industries in the state.43 In the Northeast, Republi-can governors such as New Jersey’s Chris Christie have yet (as of this writing) to determine their position on the Region-al Greenhouse Gas Initiative, which is bringing important revenue to those states during trying economic times. In Texas, Gov. Rick Perry has expressed support for the boom in wind power in that state—a boom initially triggered by a renewable electricity standard signed by former Gov. George W. Bush.
At the same time, clean energy victories have forged new coalitions and brought new supporters to the table. In Colorado and other states, agricultural interests have
played a key role in supporting the expan-sion of renewable energy policies. Also in Colorado, the state’s major utility—Xcel Energy—shifted from opposing the state’s renewable electricity standard when it was adopted by ballot in 2004 to support-ing legislation in 2010 that increased the state’s renewable electricity target to 30 percent. Utilities were also key players in the drive to preserve California’s global warming law, and some were strong advo-cates of comprehensive energy and climate legislation at the federal level.
These changes in the political playing field have not created enough momen-tum—yet—to bring about comprehensive energy and climate legislation in Con-gress. Even there, however, there have been signs of movement. In 2009, the U.S. House of Representatives—for the first time ever—voted in favor of legislation to cap global warming emissions and put a price on carbon. That bill, while far from perfect, contained emission reduction targets far more ambitious than anything under consideration earlier in the decade, along with a group of ambitious clean en-ergy policies, some of them modeled after pioneering efforts in the states.
None of this is intended to minimize the challenges standing in the way of glob-al warming and clean energy policy in the United States, or to ignore countervailing forces—such as the politicization of the debate around climate science—that make the playing field more challenging in some ways than it was in the past decade.
However, there is clearly recent histori-cal precedent for the idea that a strategy of pursuing opportunistic campaigns to forward clean energy solutions across the economy can make a dent in global warm-ing pollution and change the political cal-culus for the better.
A Precedent for Success 21

America has tremendous opportuni-ties to cut emissions of global warm-ing pollution, using clean energy
policies pursued at a variety of levels and across many sectors of the economy.
To illustrate the potential for emis-sion reductions, we conducted an analysis of the potential emission reductions that could result from adoption of a suite of 30 of local, state and federal clean energy policies. (See “About the ‘Way Forward’ Project,” opposite page.)
Emission Reduction PoliciesIn this report, we review 30 scenarios of policies, measures or initiatives that are capable of reducing global warming pol-lution. We sought out policies that have been adopted or seriously proposed in one or more jurisdictions. We also sought out opportunities to “push the envelope” through the adoption of stronger, yet still realistic, targets for clean energy de-velopment than have yet been adopted. Details on the policies and our rationale
for including them in this analysis can be found in the accompanying Volume 2 of this report.
The following sections describe both the specific policy scenarios evaluated in each sector of the economy, as well as an overall vision for where the adoption of such policies might lead us in the decades to come.
Transportation Under this scenario, by 2030, the cars and trucks Americans drive will incorporate a full range of existing technologies—from turbo-charging to hybrid-electric drive—to maxi-mize fuel economy. Plug-in vehicles—both fully electric cars and plug-in hybrids—will command a significant and growing share of the automobile marketplace. An increasing share of the nation’s transportation fuels will come from low-carbon options such as clean electricity and advanced biofuels. Heavy-duty trucks, airplanes, buses and trains will also experience improved fuel economy and in-creasingly use cleaner alternative fuels. New American urban neighborhoods will be built so that driving is an option, not a require-ment, with compact, mixed-use neighborhoods
The Way Forward on Global Warming: America’s Potential for Emission Reductions Through Clean Energy Policies
22 The Way Forward on Global Warming

About the “Way Forward” Project
Over the past decade, a great deal of energy and resources have been devoted to analyzing the potential impact of clean energy policies at the federal and
state levels, with work conducted by non-profit, academic and government ana-lysts. There have been fewer efforts, however, to examine the cumulative emis-sion reduction impact of state or local clean energy policies adopted by multiple jurisdictions.
It is impossible for policy-makers, advocates or the general public to understand how local and state policies can contribute to national emission reduction goals if there is no one “keeping score.” Important work to fill this gap in knowledge has been done by the Center for Climate Strategies, the World Resources Institute and others.44 These analyses have typically used the results of state greenhouse gas reduction plans and/or state-adopted emission reduction targets to estimate the contribution state policies can make toward achieving the nation’s emission reduction needs. However, these efforts (along with our 2009 report, America on the Move), while illuminating, have often relied on data produced from various analyses conducted by various entities at various points in time, or on non-bind-ing pledges of action by state officials.
To obtain a clearer picture of the role that local, state and non-legislative fed-eral policies can play in curbing global warming pollution, this report presents an analysis of the emission reduction potential of clean energy policies across all 50 U.S. states. We used a uniform approach, estimating the emission reductions that could result under 30 individual policy scenarios and one combined policy scenario in all 50 states against a consistent emissions baseline.
It is important for readers to understand that this analysis is not a projection of what will happen if these policies are adopted, but rather a presentation of scenarios of what might happen if anticipated trends in energy availability and prices become reality, if the policies discussed here are implemented properly and on the designated timeline, and if potential barriers to the implementation of these policies (e.g., a lack of transmission capacity to access renewable energy resources) are surmounted. In short, this analysis is intended to help readers grasp the potential impact of the various policies and develop priorities among them, and is not a “crystal ball.”
Volume 2 of this report (available on-line at www.environmentamerica.org) describes our methodology for this analysis in detail. As with all such efforts, the estimates in this report are subject to limitations and are only as accurate as the assumptions on which they are based. We invite others to build on our efforts in order to create a greater understanding of the role that state and local efforts can play in addressing global warming.
The Way Forward on Global Warming 23

and a variety of transportation options. Resi-dents of existing American communities will have more transportation choices, including improved transit systems and improved infra-structure for bicycling. Energy-efficient pas-senger rail will play an important role in the nation’s intercity transportation system, with increasingly frequent and fast service curbing air and highway travel on an increasing num-ber of corridors nationwide.
Specific policies to advance this vision include:
• Federal adoption of standards for vehicle fuel economy and global
warming emissions that achieve light-duty average fleet fuel economy of 62 miles per gallon by 2025.
• Adoption of policies to encourage the deployment of millions of electric vehicles in the next two decades.
• Adoption of strong federal fuel economy standards for heavy-duty trucks.
• Implementation of policies to im-prove the fuel efficiency of trains and airplanes.
Building walkable communities with better public transportation choices can simultaneously curb global warming pollution while helping the United States to break its dependence on oil. Photo: istockphoto.com, Cosmonaut Creative Media
24 The Way Forward on Global Warming

• Adoption of clean fuel standards that require a reduction in the carbon intensity of transportation fuels.
• Implementation of local and state policies that direct the majority of new residential development in met-ropolitan areas into compact, transit-oriented neighborhoods.
• Doubling of transit ridership gener-ated by increases in transit service, coupled with increased ridership due to service improvements, and increased energy efficiency in transit vehicles.
• Shifting of automobile insurance payments from flat annual fees to charges based in part on the number of miles driven.
• Launching of commute-trip reduc-tion programs and strategies that
reduce single-passenger commuting to worksites.
• Investment and policy changes to double bicycle commuting in U.S. cities.
• Construction of a high-speed rail network consistent with the national high-speed rail vision by 2030.
Homes and BusinessesUnder this scenario, by 2030 all new build-ings will be constructed to high levels of energy efficiency. Most new homes will be “zero net energy”—generating as much energy from re-newable sources as they use over the course of a year. The nation’s pre-existing building stock will have been overhauled to prevent energy waste. New appliances and commercial equip-ment will take full advantage of technologies to improve efficiency. Electric utilities in each state will be partners—not road blocks—in helping
Retrofitting existing homes and businesses for greater energy efficiency is one of the fastest and most cost-effective ways to reduce global warming pollution in the United States. Photo: istock-photo.com, cjp
The Way Forward on Global Warming 2�

residents and businesses to make their build-ings more energy efficient. Renewable energy technologies will become inexpensive enough, and barriers to their implementation lowered enough, so that solar panels, small-scale wind turbines and other renewable energy technolo-gies become common sights on residential and commercial buildings. Meanwhile, intense re-search and development efforts will yield new technologies—such as solar thermal space heat-ing and extremely energy-efficient homes—that can poise the nation for greater emission reduc-tions in the years to come.
Specific policies to advance this vision include:
• An aggressive program of energy ef-ficiency retrofits sufficient to reduce energy consumption by 30 percent in households and 50 percent in com-mercial facilities by 2030.
• Adoption of strong building energy codes targeting reductions in energy
use versus today’s average homes and commercial buildings of 50 percent by 2020 and 75 percent by 2030.
• Adoption of strong energy efficiency standards for household appliances and commercial equipment.
• Adoption of strategies to drive the expansion of distributed renewable energy production in homes, busi-nesses and industry.
IndustryAmerican industry will become more competi-tive through improvements in the efficiency with which manufacturers use energy. Older, inefficient motor systems and boilers will be in-creasingly replaced with dramatically more ef-ficient models, while commercial and industrial facilities will increasingly produce renewable energy through solar electric and water heating systems. Through energy analysis, the installation
Global Warming Pollutants Other than Carbon Dioxide
This analysis only includes strategies to reduce carbon dioxide emissions from energy use, which account for 81 percent of America’s total emissions of global
warming pollution.45 The omission of non-carbon dioxide gases from this analysis is not intended to suggest that they are unimportant. Rather, the fragmented na-ture of the data on state-by-state emissions of non-carbon dioxide global warming pollutants made their inclusion in this report impractical.
Some policies reviewed in this analysis—such as global warming emission stan-dards for vehicles and clean fuel standards—directly address emissions of gases other than carbon dioxide and will yield reductions in these emissions as well. In other cases, reductions in fossil fuel consumption from strategies discussed above could be expected to lead to reductions in emissions of pollutants other than car-bon dioxide—for example, methane emissions from coal mines, petroleum refin-eries and natural gas systems.
We encourage states and the federal government to investigate and adopt strat-egies to reduce emissions of non-carbon dioxide global warming pollutants.
26 The Way Forward on Global Warming

of automated controls, and building retrofits, industrial facilities will identify sources of en-ergy waste and address them. Combined heat-and-power—which uses the fossil fuels burned to provide heat for industrial processes to gen-erate electricity as well—will become common on a broad scale. Finally, the nature of Ameri-can industry will change, with traditional fos-sil fuel-based industries such as oil refining re-placed with renewable energy manufacturing plants and high-tech facilities to produce energy efficient vehicles and products.
Specific policies to advance this vision include:
• Stronger energy efficiency standards for industrial boilers.
• Implementation of policies to encourage the use of combined heat-and-power in industrial facilities.
• Adoption of policies designed to reduce energy consumption in the production of industrial process heat.
• Reductions in emissions from refin-eries stemming from federal limits on pollution and reduced demand for oil.
Electricity GenerationThe nation’s current generation of coal-fired power plants will be well along in the pro-cess toward being cleaned up or phased out by 2030 and no new conventional coal plants will have been built. Solar, wind and other forms of renewable energy will become indispensible parts of America’s energy mix—as important as nuclear power or natural gas power plants are today—with large-scale offshore wind farms and solar thermal plants complement-ing the widespread deployment of existing so-lar and wind power technology. Improvements to the grid will enable renewable energy to be smoothly integrated into the electricity system, while advances in energy storage (including increased deployment of plug-in vehicles) will
allow for the potential integration of even more renewable energy in the future.
Specific policies to advance this vision include:
• Enforcement of strong emission control standards for mercury and conventional air pollutants at new and existing power plants.
• Adoption of limits on carbon dioxide pollution from power plants.
• Adoption of state generation performance standards that limit emissions from new power plants.
• Adoption of state (or federal) renewable electricity standards that set a target of 20 percent renewable energy by 2020 and 33 percent by 2030.
• Implementation of a moratorium on the construction of new conventional coal-fired power plants.
Cross-Sector StrategiesPublic policies will be used to encourage energy efficiency, deployment of clean energy, and re-ductions in global warming pollution through-out the economy. Specific policies to advance this vision include:
• Implementation of President Obama’s executive order requiring federal agencies to reduce their emis-sions of global warming pollution.
• Adoption of energy efficiency resource standards that require electric and natural gas utilities to meet specific benchmarks for energy efficiency improvements in homes, businesses and industry.
• Enforcement of existing state carbon caps and the Northeast’s Regional Greenhouse Gas Initiative.
The Way Forward on Global Warming 27

Clean Energy Policies Can Achieve Significant Emission ReductionsThe “Way Forward” package of policy ini-tiatives—if fully realized—would produce significant reductions in carbon dioxide emissions from energy use in the United States, keeping the nation within striking distance of achieving its emission reduc-tion goals. (For a discussion of emissions of global warming pollutants other than carbon dioxide, see text box on page 26.)
Implementation of the 30 policies, measures and initiatives listed above—if achieved nationwide—would reduce U.S. energy-related carbon dioxide emissions by approximately 13 percent below 2005 levels by 2015, by 20 percent below 2005 levels by 2020, by 27 percent below 2005 levels by 2025, and by 34 percent below 2005 lev-els by 2030. (See Table 1 and Figure 3.)
By 2030, U.S. energy-related carbon dioxide emissions would be more than one-third below emissions expected un-der business-as-usual conditions. Signifi-cant reductions would occur across the economy, with the greatest reductions in the commercial sector—driven largely by improvements in the energy efficiency of buildings and a roughly 50 percent reduc-tion in emissions from electricity genera-tion. (See Table 2.)
These emission reductions are not—in
and of themselves—sufficient to achieve the 25 to 40 percent reductions in emis-sions needed by 2020 to put the United States on a course to preventing the worst impacts of global warming. However, they do achieve a sizable share of those reduc-tions and do so using existing policy tools and technologies.
Closing the remaining gap can occur in a number of ways:
1) Through the adoption of compre-hensive climate and energy legisla-tion—at either the state or federal level—that caps emissions of global warming pollution and/or puts a price on emissions.
2) Through the development of new technologies or new public policy tools not envisioned here.
3) Through the adoption of stronger policies or clean energy targets than envisioned here.
4) Through unforeseen changes result-ing from the policies proposed here, including the crossing of “tipping points” in consumer acceptance or price of clean energy technologies and the potential for combinations of policies to produce greater emission reductions than the policies would deliver on their own.
Table 1. Energy-Related Carbon Dioxide Emissions Under the “Way Forward” Policy Scenario
Emission reductions 2015 2020 2025 2030
vs. business as usual 10% 18% 27% 36%
vs. 2008 emissions 11% 17% 25% 32%
estimated reductions vs. 2005 emissions 13% 20% 27% 34%
28 The Way Forward on Global Warming
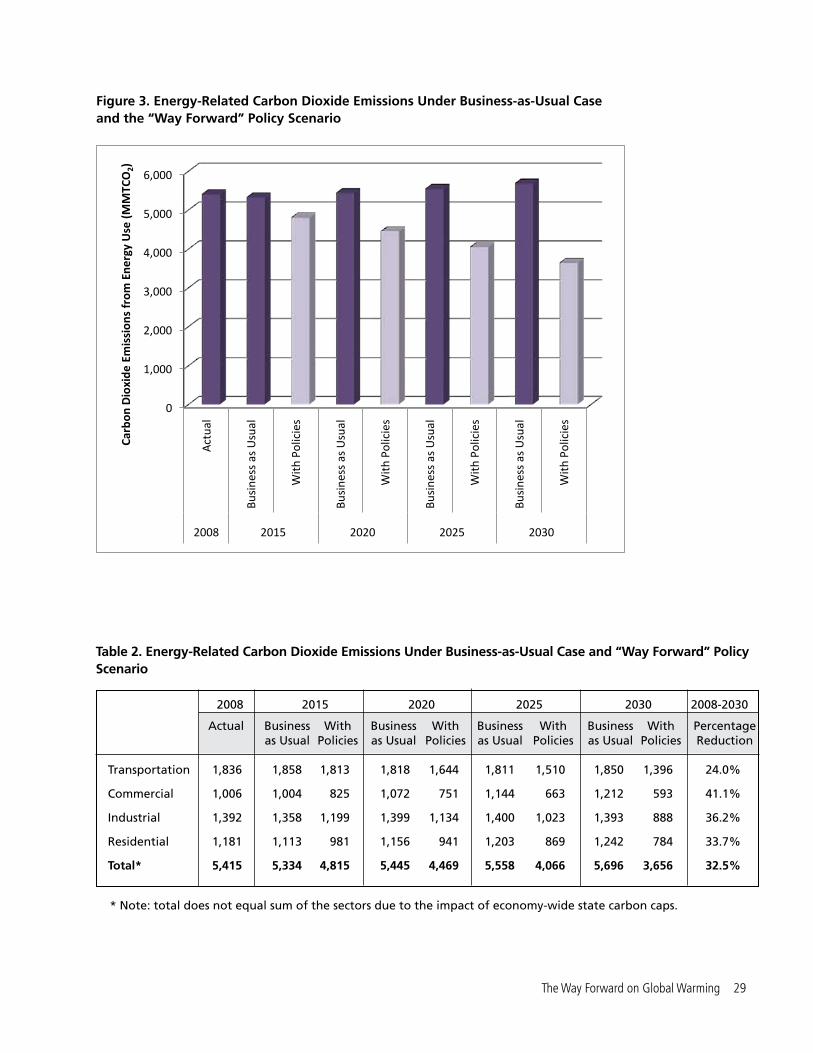
Table 2. Energy-Related Carbon Dioxide Emissions Under Business-as-Usual Case and “Way Forward” Policy Scenario
2008 2015 2020 2025 2030 2008-2030
Actual Business With Business With Business With Business With Percentage as Usual Policies as Usual Policies as Usual Policies as Usual Policies Reduction
Transportation 1,836 1,858 1,813 1,818 1,644 1,811 1,510 1,850 1,396 24.0%
Commercial 1,006 1,004 825 1,072 751 1,144 663 1,212 593 41.1%
Industrial 1,392 1,358 1,199 1,399 1,134 1,400 1,023 1,393 888 36.2%
Residential 1,181 1,113 981 1,156 941 1,203 869 1,242 784 33.7%
Total* 5,415 5,334 4,815 5,445 4,469 5,558 4,066 5,696 3,656 32.5%
* Note: total does not equal sum of the sectors due to the impact of economy-wide state carbon caps.
0
1,000
2,000
3,000
4,000
5,000
6,000
Act
ual
Busi
ness
as
Usu
al
With
Pol
icie
s
Busi
ness
as
Usu
al
With
Pol
icie
s
Busi
ness
as
Usu
al
With
Pol
icie
s
Busi
ness
as
Usu
al
With
Pol
icie
s
2008 2015 2020 2025 2030
Carb
on D
ioxi
de E
mis
sion
s fr
om E
nerg
y U
se (M
MTC
O2)
Figure 3. Energy-Related Carbon Dioxide Emissions Under Business-as-Usual Case and the “Way Forward” Policy Scenario
The Way Forward on Global Warming 2�
2008 2020 2030 2008-2030
New England 172 159 132 17.1% 155 95 39.0% 44.9%
Mid Atlantic 538 524 438 16.4% 514 332 35.5% 38.3%
E North Central 948 925 762 17.6% 938 613 34.7% 35.3%
W North Central 478 489 409 16.4% 521 351 32.5% 26.4%
South Atlantic 956 976 773 20.8% 1038 618 40.4% 35.3%
E South Central 425 420 325 22.5% 432 262 39.5% 38.4%
W South Central 905 980 813 17.1% 1037 680 34.4% 24.8%
Mountain 371 410 340 16.9% 461 306 33.7% 17.5%
Pacific 624 564 477 15.4% 600 399 33.4% 36.0%
Actual Business With Pct. Reduction Business With Pct. Reduction Percentage as Usual Policies v. BAU as Usual Policies v. BAU Reduction
Table 3. Emission Reductions by Region Under the “Way Forward” Policy Scenario
Identifying the Biggest OpportunitiesThe state-by-state analysis suggests that there are sufficient battlefields nationwide to achieve meaningful reductions in global warming pollution in the near term—in every sector of the economy and in every state.
The policies proposed in this report deliver different levels of emission reduc-tions in different regions of the country—in part because of varying projected levels of population growth, and in part because of the differing emission profiles of each region. (See Table 3.)
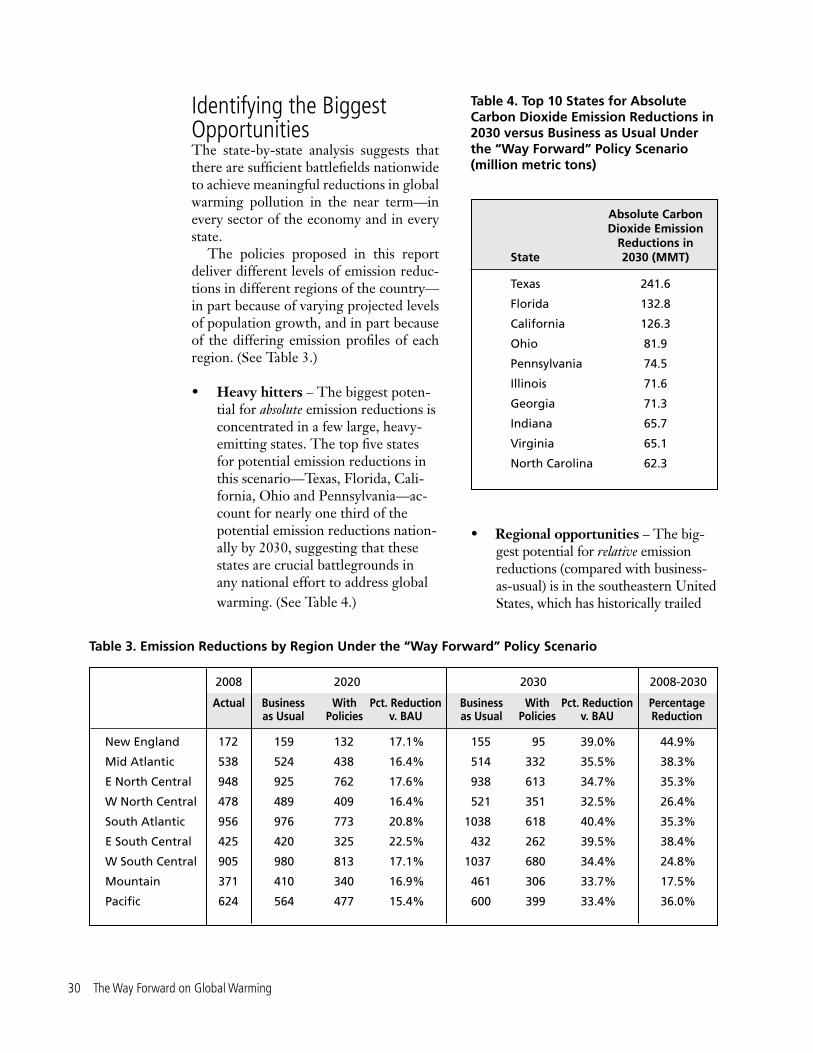
• Heavy hitters – The biggest poten-tial for absolute emission reductions is concentrated in a few large, heavy-emitting states. The top five states for potential emission reductions in this scenario—Texas, Florida, Cali-fornia, Ohio and Pennsylvania—ac-count for nearly one third of the potential emission reductions nation-ally by 2030, suggesting that these states are crucial battlegrounds in any national effort to address global warming. (See Table 4.)
• Regional opportunities – The big-gest potential for relative emission reductions (compared with business-as-usual) is in the southeastern United States, which has historically trailed
Table 4. Top 10 States for Absolute Carbon Dioxide Emission Reductions in 2030 versus Business as Usual Under the “Way Forward” Policy Scenario (million metric tons)
Absolute Carbon Dioxide Emission Reductions in State 2030 (MMT)
Texas 241.6
Florida 132.8
California 126.3
Ohio 81.9
Pennsylvania 74.5
Illinois 71.6
Georgia 71.3
Indiana 65.7
Virginia 65.1
North Carolina 62.3
30 The Way Forward on Global Warming

the estimated state-by-state emission reductions from the policies analyzed here can be found in the Appendix.
Clean energy policies at the local, state and federal levels have the potential to achieve significant reductions in global warming pollution—helping America to do its part to prevent the worst impacts of global warming. At the same time, the ef-fort to win those policies can restore mo-mentum to the movement to address global warming and shift the balance of political power—making the achievement of com-prehensive change that much more likely.
Additional Benefits of Clean Energy PoliciesAddressing global warming is not the only reason to pursue the policies in the “Way Forward” scenario. Clean energy policies are smart policies for America’s future that can address many of the nation’s biggest challenges.
• Fossil fuel depencence – Stronger fuel economy standards for cars and trucks, tighter building energy codes for new residential and commercial buildings, improvements in the ener-gy efficiency of homes and commer-cial buildings, and other strategies can reduce America’s depenence on fossil fuels—protecting the environ-ment, stabilizing our economy, and enhancing our national security.
• Job creation and economic pros-perity – Renewable electricity standards, energy efficiency resource standards, and policies to encourage solar power can help to create vibrant green industries that employ American
in energy efficiency and renewable energy efforts and is heavily reliant on coal, followed by New England, a region with great opportunities to re-duce emissions from its aging, often oil-heated building stock. There is, however, great potential for emis-sion reductions in every region of the United States. (See Table 5.)
Table 5. Top 10 States for Percentage Reductions in Energy-Related Emis-sions of Carbon Dioxide in 2030 versus Business as Usual Under the “Way Forward” Policy Scenario (excluding District of Columbia)
Percentage reduction vs. business-as-usual
State 2030
Vermont 45.0%
Wisconsin 43.7%
South Carolina 42.8%
Georgia 42.0%
Florida 41.3%
Idaho 41.3%
Tennessee 41.2%
Virginia 41.0%
Massachusetts 39.4%
Kentucky 39.4%
• Different emission reduction op-portunities predominate in dif-ferent states – The most effective policies for reducing global warming pollution vary from state to state based on several factors: the existence of effective policies in those states included in our business-as-usual case, the state’s specific mix of eco-nomic activity and energy sources, climate, the energy efficiency of existing buildings, and renewable energy potential. A detailed listing of
The Way Forward on Global Warming 31

workers and give the United States a leg up in the global clean energy economy.
• Public health and the environment – Efforts to clean up our nation’s dirtiest power plants and curb our dependence on oil through smart transportation and land-use policies will reduce air and water pollution,
protecting the health of millions of Americans while safeguarding the health of our environment.
Regardless of whether the overriding concern is preventing dangerous global warming or restoring America’s environ-mental and economic health, clean energy strategies can help move the nation toward a better future.
32 The Way Forward on Global Warming
Making progress on global warming over the next several years requires a clear vision of the potential op-
portunities and a willingness to fight for emission reductions wherever they can be won—whether at the local, state or federal level. By doing so, we can not only begin to achieve the short-term emission reduc-tions that science tells us are necessary to avert catastrophic impacts from climate change, but also begin building a politi-cal force that is capable of achieving even greater victories in the future.
Realizing this promise, however, will require major shifts in how environmen-talists and others concerned about the cli-mate fight for the planet’s future.
It will require a shift of organizing and advocacy resources from “inside the Belt-way” to the cities and states across the country where the key battles over global warming will be fought—not just for the next two years, but over the long term.
It will require clean energy advocates to tell the stories of our victories in order to inspire hope for change—even as we ac-knowledge the difficulty of the path ahead and the perilous consequences of failure.
It will require a shift away from the search for “silver bullet” policies that can solve the entire climate crisis at once, and instead involve a search for smaller “silver buckshot” solutions that can cumulatively achieve meaningful reductions in global warming pollution. It will require a shift away from negotiating around political limitations and toward envisioning the po-litical opportunities a clean energy strate-gy presents to tap into new constituencies and build a strong environmental base.
And it will require constant reevaluation and revision to ensure that no opportunity to reduce global warming pollution is lost.
There are countless opportunities—re-gardless of the political climate—to take concrete actions that can reduce global warming pollution, build the environmen-tal base, bring in new coalition partners, engage the public, demonstrate the real benefits of clean energy to our communi-ties and economy, and curb the power of entrenched polluting special interests.
The ultimate path to solving global warming may not be clear, but there are plenty of opportunities to move forward. The time to begin is now.
Conclusion: The Time to Begin Is Now
Conclusion: The Time to Begin Is Now 33

Transportation PoliciesTotal emission savings may not equal the sum of the individual policies due to rounding and overlaps among policies.
AK 0.3 0.3 0.0 1.9 0.0 0.0 0.0 0.0 0.7 0.0 3.2
AL 2.5 2.2 0.3 0.3 0.0 0.2 0.0 0.1 2.0 0.1 7.5
AR 1.5 1.4 0.2 0.2 0.0 0.1 0.0 0.1 1.7 0.0 5.1
AZ 4.2 3.7 0.5 0.9 0.2 0.3 0.1 1.0 2.8 0.1 13.1
CA 16.4 15.2 2.1 8.5 0.6 1.0 0.3 2.2 8.4 0.7 53.7
CO 2.4 2.3 0.3 1.1 0.1 0.1 0.0 0.2 1.5 0.0 7.8
CT 1.3 1.3 0.2 0.2 0.1 0.1 0.0 0.0 0.7 0.0 3.8
DC 0.1 0.1 0.0 0.0 0.0 0.0 0.0 0.0 0.0 0.0 0.3
DE 0.4 0.4 0.1 0.0 0.0 0.0 0.0 0.0 0.2 0.0 1.1
FL 11.2 10.1 1.4 3.8 0.3 0.7 0.2 2.8 5.6 0.4 34.9
GA 5.2 4.8 0.7 0.7 0.1 0.3 0.1 0.6 3.6 0.2 15.7
HI 0.4 0.4 0.1 0.8 0.0 0.0 0.0 0.0 0.3 0.0 1.9
IA 1.2 1.1 0.2 0.1 0.0 0.1 0.0 0.0 1.4 0.0 4.0
ID 0.8 0.7 0.1 0.1 0.0 0.0 0.0 0.1 0.7 0.0 2.5
IL 3.7 3.6 0.5 2.4 0.2 0.2 0.1 0.1 3.4 0.2 14.1
IN 2.4 2.1 0.3 0.7 0.0 0.1 0.0 0.1 3.0 0.1 8.8
Stat
e
Fuel
Eco
nom
y
Elec
tric
Veh
icle
s
Trai
n an
d A
irpla
ne
Ef
ficie
ncy
Pay-
as-Y
ou-D
rive
In
sura
nce
Com
pact
Urb
an
G
row
th
Tran
sit E
xpan
sion
/
Im
prov
emen
tCo
mm
ute
Trip
Re
duct
ion
Hig
h-Sp
eed
Rail
Ener
gy E
ffici
ent
Ti
res
Hea
vy-D
uty
Fu
el E
cono
my
All
Tra
nspo
rtat
ion
Appendix: State and Scenario-Specific Estimates of Carbon Dioxide Pollution Reductions
34 The Way Forward on Global Warming

KS 1.0 0.9 0.1 0.2 0.0 0.1 0.0 0.0 1.2 0.0 3.5
KY 1.8 1.6 0.2 0.7 0.0 0.1 0.0 0.0 2.2 0.1 6.7
LA 2.2 2.0 0.3 1.3 0.1 0.1 0.0 0.0 2.0 0.1 7.9
MA 2.5 2.5 0.3 1.0 0.2 0.2 0.0 0.1 1.1 0.1 7.8
MD 2.9 3.0 0.4 0.4 0.1 0.2 0.0 0.3 1.5 0.1 8.6
ME 0.6 0.5 0.1 0.2 0.0 0.0 0.0 0.0 0.4 0.0 1.8
MI 3.7 3.3 0.5 0.5 0.1 0.2 0.1 0.1 2.0 0.1 10.4
MN 2.3 2.1 0.3 0.8 0.1 0.1 0.0 0.2 3.1 0.1 8.8
MO 2.6 2.4 0.3 0.5 0.1 0.2 0.0 0.1 2.3 0.1 8.5
MS 1.5 1.3 0.2 0.3 0.0 0.1 0.0 0.0 1.5 0.0 4.9
MT 0.5 0.4 0.1 0.1 0.0 0.0 0.0 0.0 0.6 0.0 1.7
NC 5.5 4.9 0.7 0.6 0.1 0.3 0.1 0.8 2.8 0.7 16.0
ND 0.2 0.2 0.0 0.1 -0.1 0.0 0.0 0.0 0.5 0.0 1.1
NE 0.7 0.6 0.1 0.1 0.0 0.0 0.0 0.0 0.9 0.0 2.4
NH 0.8 0.7 0.1 0.0 0.0 0.0 0.0 0.1 0.3 0.0 2.0
NJ 4.0 3.7 0.5 2.7 0.3 0.2 0.1 0.3 2.3 0.1 13.8
NM 1.0 0.9 0.1 0.2 0.0 0.1 0.0 0.0 1.0 0.0 3.2
NV 1.8 1.6 0.2 0.9 0.1 0.1 0.0 0.5 1.2 0.1 6.1
NY 4.7 4.9 0.6 1.6 0.4 0.3 0.1 0.0 2.6 0.3 15.0
OH 3.8 3.4 0.5 1.6 0.1 0.2 0.1 0.0 3.5 0.1 13.0
OK 1.7 1.5 0.2 0.5 0.0 0.1 0.0 0.1 2.9 0.1 7.1
OR 1.6 1.5 0.2 0.6 0.1 0.1 0.0 0.2 1.6 0.1 5.7
PA 4.2 4.0 0.5 1.2 0.2 0.3 0.1 0.0 3.2 0.2 13.6
RI 0.3 0.3 0.0 0.0 0.0 0.0 0.0 0.0 0.2 0.0 1.0
SC 2.6 2.3 0.3 0.2 0.0 0.2 0.0 0.2 1.7 0.1 7.4
SD 0.3 0.3 0.0 0.1 0.0 0.0 0.0 0.0 0.4 0.0 1.1
TN 2.8 2.5 0.4 1.2 0.0 0.2 0.0 0.2 2.8 0.0 10.1
TX 14.8 13.4 1.9 6.3 0.2 0.9 0.2 2.5 13.9 0.6 53.1
UT 1.3 1.2 0.2 0.6 0.0 0.1 0.0 0.2 1.2 0.0 4.8
VA 4.4 4.0 0.6 1.4 0.2 0.3 0.1 0.5 2.9 0.1 13.9
VT 0.3 0.3 0.0 0.0 0.0 0.0 0.0 0.0 0.2 0.0 0.9
WA 2.9 2.6 0.4 1.8 0.1 0.2 0.0 0.5 2.5 0.1 10.7
WI 2.0 1.8 0.3 0.4 0.0 0.1 0.0 0.1 1.8 0.1 6.4
WV 0.6 0.6 0.1 0.1 0.0 0.0 0.0 0.0 0.6 0.0 2.0
WY 0.3 0.3 0.0 0.1 0.0 0.0 0.0 0.0 0.9 0.0 1.6
Stat
e
Fuel
Eco
nom
y
Elec
tric
Veh
icle
s
Trai
n an
d A
irpla
ne
Ef
ficie
ncy
Pay-
as-Y
ou-D
rive
In
sura
nce
Com
pact
Urb
an
G
row
th
Tran
sit E
xpan
sion
/
Im
prov
emen
tCo
mm
ute
Trip
Re
duct
ion
Hig
h-Sp
eed
Rail
Ener
gy E
ffici
ent
Ti
res
Hea
vy-D
uty
Fu
el E
cono
my
All
Tra
nspo
rtat
ion
Appendix 3�
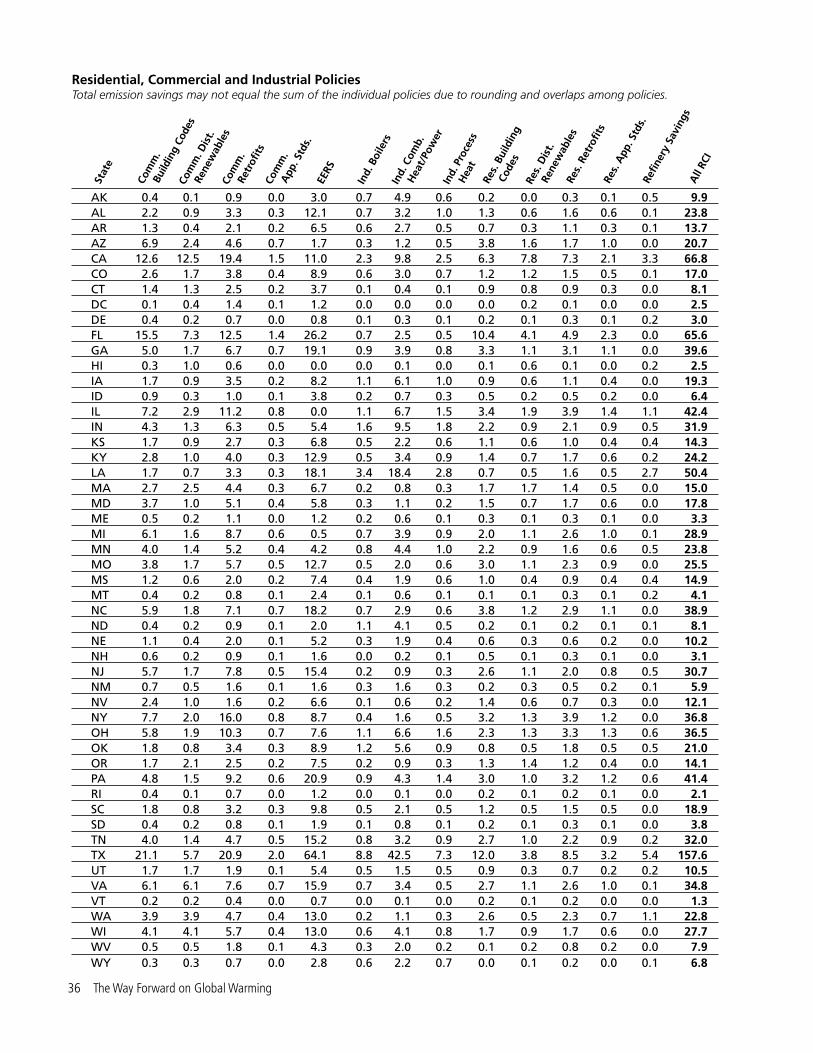
AK 0.4 0.1 0.9 0.0 3.0 0.7 4.9 0.6 0.2 0.0 0.3 0.1 0.5 9.9AL 2.2 0.9 3.3 0.3 12.1 0.7 3.2 1.0 1.3 0.6 1.6 0.6 0.1 23.8AR 1.3 0.4 2.1 0.2 6.5 0.6 2.7 0.5 0.7 0.3 1.1 0.3 0.1 13.7AZ 6.9 2.4 4.6 0.7 1.7 0.3 1.2 0.5 3.8 1.6 1.7 1.0 0.0 20.7CA 12.6 12.5 19.4 1.5 11.0 2.3 9.8 2.5 6.3 7.8 7.3 2.1 3.3 66.8CO 2.6 1.7 3.8 0.4 8.9 0.6 3.0 0.7 1.2 1.2 1.5 0.5 0.1 17.0CT 1.4 1.3 2.5 0.2 3.7 0.1 0.4 0.1 0.9 0.8 0.9 0.3 0.0 8.1DC 0.1 0.4 1.4 0.1 1.2 0.0 0.0 0.0 0.0 0.2 0.1 0.0 0.0 2.5DE 0.4 0.2 0.7 0.0 0.8 0.1 0.3 0.1 0.2 0.1 0.3 0.1 0.2 3.0FL 15.5 7.3 12.5 1.4 26.2 0.7 2.5 0.5 10.4 4.1 4.9 2.3 0.0 65.6GA 5.0 1.7 6.7 0.7 19.1 0.9 3.9 0.8 3.3 1.1 3.1 1.1 0.0 39.6HI 0.3 1.0 0.6 0.0 0.0 0.0 0.1 0.0 0.1 0.6 0.1 0.0 0.2 2.5IA 1.7 0.9 3.5 0.2 8.2 1.1 6.1 1.0 0.9 0.6 1.1 0.4 0.0 19.3ID 0.9 0.3 1.0 0.1 3.8 0.2 0.7 0.3 0.5 0.2 0.5 0.2 0.0 6.4IL 7.2 2.9 11.2 0.8 0.0 1.1 6.7 1.5 3.4 1.9 3.9 1.4 1.1 42.4IN 4.3 1.3 6.3 0.5 5.4 1.6 9.5 1.8 2.2 0.9 2.1 0.9 0.5 31.9KS 1.7 0.9 2.7 0.3 6.8 0.5 2.2 0.6 1.1 0.6 1.0 0.4 0.4 14.3KY 2.8 1.0 4.0 0.3 12.9 0.5 3.4 0.9 1.4 0.7 1.7 0.6 0.2 24.2LA 1.7 0.7 3.3 0.3 18.1 3.4 18.4 2.8 0.7 0.5 1.6 0.5 2.7 50.4MA 2.7 2.5 4.4 0.3 6.7 0.2 0.8 0.3 1.7 1.7 1.4 0.5 0.0 15.0MD 3.7 1.0 5.1 0.4 5.8 0.3 1.1 0.2 1.5 0.7 1.7 0.6 0.0 17.8ME 0.5 0.2 1.1 0.0 1.2 0.2 0.6 0.1 0.3 0.1 0.3 0.1 0.0 3.3MI 6.1 1.6 8.7 0.6 0.5 0.7 3.9 0.9 2.0 1.1 2.6 1.0 0.1 28.9MN 4.0 1.4 5.2 0.4 4.2 0.8 4.4 1.0 2.2 0.9 1.6 0.6 0.5 23.8MO 3.8 1.7 5.7 0.5 12.7 0.5 2.0 0.6 3.0 1.1 2.3 0.9 0.0 25.5MS 1.2 0.6 2.0 0.2 7.4 0.4 1.9 0.6 1.0 0.4 0.9 0.4 0.4 14.9MT 0.4 0.2 0.8 0.1 2.4 0.1 0.6 0.1 0.1 0.1 0.3 0.1 0.2 4.1NC 5.9 1.8 7.1 0.7 18.2 0.7 2.9 0.6 3.8 1.2 2.9 1.1 0.0 38.9ND 0.4 0.2 0.9 0.1 2.0 1.1 4.1 0.5 0.2 0.1 0.2 0.1 0.1 8.1NE 1.1 0.4 2.0 0.1 5.2 0.3 1.9 0.4 0.6 0.3 0.6 0.2 0.0 10.2NH 0.6 0.2 0.9 0.1 1.6 0.0 0.2 0.1 0.5 0.1 0.3 0.1 0.0 3.1NJ 5.7 1.7 7.8 0.5 15.4 0.2 0.9 0.3 2.6 1.1 2.0 0.8 0.5 30.7NM 0.7 0.5 1.6 0.1 1.6 0.3 1.6 0.3 0.2 0.3 0.5 0.2 0.1 5.9NV 2.4 1.0 1.6 0.2 6.6 0.1 0.6 0.2 1.4 0.6 0.7 0.3 0.0 12.1NY 7.7 2.0 16.0 0.8 8.7 0.4 1.6 0.5 3.2 1.3 3.9 1.2 0.0 36.8OH 5.8 1.9 10.3 0.7 7.6 1.1 6.6 1.6 2.3 1.3 3.3 1.3 0.6 36.5OK 1.8 0.8 3.4 0.3 8.9 1.2 5.6 0.9 0.8 0.5 1.8 0.5 0.5 21.0OR 1.7 2.1 2.5 0.2 7.5 0.2 0.9 0.3 1.3 1.4 1.2 0.4 0.0 14.1PA 4.8 1.5 9.2 0.6 20.9 0.9 4.3 1.4 3.0 1.0 3.2 1.2 0.6 41.4RI 0.4 0.1 0.7 0.0 1.2 0.0 0.1 0.0 0.2 0.1 0.2 0.1 0.0 2.1SC 1.8 0.8 3.2 0.3 9.8 0.5 2.1 0.5 1.2 0.5 1.5 0.5 0.0 18.9SD 0.4 0.2 0.8 0.1 1.9 0.1 0.8 0.1 0.2 0.1 0.3 0.1 0.0 3.8TN 4.0 1.4 4.7 0.5 15.2 0.8 3.2 0.9 2.7 1.0 2.2 0.9 0.2 32.0TX 21.1 5.7 20.9 2.0 64.1 8.8 42.5 7.3 12.0 3.8 8.5 3.2 5.4 157.6UT 1.7 1.7 1.9 0.1 5.4 0.5 1.5 0.5 0.9 0.3 0.7 0.2 0.2 10.5VA 6.1 6.1 7.6 0.7 15.9 0.7 3.4 0.5 2.7 1.1 2.6 1.0 0.1 34.8VT 0.2 0.2 0.4 0.0 0.7 0.0 0.1 0.0 0.2 0.1 0.2 0.0 0.0 1.3WA 3.9 3.9 4.7 0.4 13.0 0.2 1.1 0.3 2.6 0.5 2.3 0.7 1.1 22.8WI 4.1 4.1 5.7 0.4 13.0 0.6 4.1 0.8 1.7 0.9 1.7 0.6 0.0 27.7WV 0.5 0.5 1.8 0.1 4.3 0.3 2.0 0.2 0.1 0.2 0.8 0.2 0.0 7.9WY 0.3 0.3 0.7 0.0 2.8 0.6 2.2 0.7 0.0 0.1 0.2 0.0 0.1 6.8
Residential, Commercial and Industrial Policies Total emission savings may not equal the sum of the individual policies due to rounding and overlaps among policies.
Stat
e
Com
m.
Bu
ildin
g Co
des
Com
m. D
ist.
Re
new
able
s
Com
m.
A
pp. S
tds.
Com
m.
Re
trofi
ts
Ind.
Pro
cess
H
eat
EERS
Ind.
Boi
lers
Res.
Dis
t.
Re
new
able
s
Ind.
Com
b.
H
eat/
Pow
er
Res.
Bui
ldin
g
Co
des
Refin
ery
Savi
ngs
Res.
App
. Std
s.
Res.
Ret
rofit
s
All
RCI
36 The Way Forward on Global Warming

AK 1.1 0.0 0.0 0.0 1.1 2.2 0.1 13.4 34.1% 31.9%AL 17.8 0.1 0.1 1.2 8.2 22.4 0.3 41.3 39.2% 41.7%AR 8.4 0.1 0.1 0.6 4.4 11.5 0.1 23.8 36.4% 35.0%AZ 10.0 0.3 0.3 0.8 13.3 24.3 0.5 50.2 33.6% -5.6%CA 3.5 0.0 0.0 1.2 3.4 7.8 1.1 126.3 32.4% 37.4%CO 3.1 0.2 0.2 0.4 6.4 10.0 0.4 31.9 33.3% 27.3%CT 1.7 0.0 0.0 0.2 1.2 3.0 0.1 14.1 38.7% 46.1%DC 1.6 0.0 0.0 0.1 0.7 2.2 0.5 3.6 62.9% 74.8%DE 0.5 0.0 0.0 0.1 1.0 1.3 0.0 4.3 33.8% 40.5%FL 42.1 0.2 0.0 1.1 13.8 53.0 0.8 132.8 41.3% 24.0%GA 29.0 0.1 0.1 2.0 13.3 36.5 0.6 71.3 42.0% 40.6%HI 0.0 0.0 0.0 0.0 1.5 1.7 0.1 5.2 31.9% 43.6%IA 10.0 0.2 0.2 1.3 7.2 16.2 0.1 30.7 38.8% 38.5%ID 5.2 0.0 0.0 0.1 2.0 6.6 0.1 11.4 41.3% 31.3%IL 12.7 1.7 1.6 4.7 27.2 37.6 0.4 71.6 33.5% 36.1%IN 23.0 0.3 0.2 3.0 21.3 40.8 0.3 65.7 34.6% 32.7%KS 4.1 0.4 0.4 0.4 5.2 9.1 0.1 20.5 26.8% 17.3%KY 18.2 0.2 0.1 2.1 14.7 29.9 0.2 48.1 39.4% 39.8%LA 14.0 0.2 0.2 1.0 7.2 18.8 0.2 57.0 35.4% 38.2%MA 2.6 0.1 0.0 0.4 2.3 5.0 0.2 26.9 39.4% 45.2%MD 5.4 0.0 0.0 0.8 6.6 11.0 0.8 29.0 36.5% 34.2%ME 1.4 0.0 0.0 0.1 0.5 1.9 0.1 6.5 36.8% 44.7%MI 17.9 0.4 0.3 3.1 21.5 35.9 0.3 60.6 33.3% 33.7%MN 3.2 0.1 0.1 2.2 12.5 13.8 0.2 36.4 24.9% 10.7%MO 12.6 0.8 0.8 2.0 13.5 24.6 0.3 46.2 38.7% 35.8%MS 10.5 0.0 0.0 0.7 4.8 13.2 0.2 25.5 36.8% 33.6%MT 2.1 0.0 0.0 0.0 1.2 2.9 0.1 6.5 33.1% 35.2%NC 19.1 0.1 0.1 2.1 13.8 26.8 0.4 62.3 38.2% 33.2%ND 2.7 0.0 0.0 0.3 1.8 4.1 0.1 10.5 32.6% 25.7%NE 6.7 0.0 0.0 0.8 4.4 10.4 0.1 17.9 36.9% 34.1%NH 0.7 0.0 0.0 0.1 0.5 1.2 0.0 6.0 37.5% 38.2%NJ 6.0 0.0 0.0 0.9 7.6 12.4 0.2 49.4 35.2% 34.2%NM 1.8 0.1 0.1 0.2 2.4 4.3 0.2 11.7 28.6% 27.8%NV 2.9 0.0 0.0 0.1 3.7 5.6 0.1 17.7 33.9% 6.3%NY 4.1 0.1 0.0 1.0 5.4 9.9 0.5 58.4 34.1% 39.2%OH 23.7 0.4 0.3 4.2 30.2 48.9 0.4 81.9 32.9% 34.7%OK 8.7 0.5 0.4 0.5 6.3 14.7 0.3 34.5 32.4% 29.3%OR 3.5 0.0 0.0 0.1 4.1 6.4 0.1 19.2 36.6% 34.1%PA 23.0 0.1 0.1 2.1 16.6 36.9 0.5 74.5 36.7% 40.1%RI 0.7 0.0 0.0 0.1 0.3 1.1 0.0 3.9 39.2% 44.2%SC 15.4 0.1 0.1 1.1 7.1 19.4 0.2 35.6 42.8% 47.3%SD 2.4 0.0 0.0 0.3 1.6 3.8 0.1 6.9 37.3% 37.3%TN 23.9 0.1 0.1 1.7 11.2 30.3 0.3 55.8 41.2% 36.7%TX 60.4 6.0 5.5 1.9 44.0 97.4 1.2 241.6 34.3% 19.0%UT 6.3 0.0 0.0 0.1 2.4 8.0 0.2 17.9 37.3% 25.0%VA 24.5 0.1 0.1 2.0 13.6 33.4 1.1 65.1 41.0% 37.3%VT 1.1 0.0 0.0 0.0 0.2 1.3 0.0 3.3 45.0% 49.7%WA 10.7 0.0 0.0 0.2 7.5 16.0 0.4 36.2 35.6% 30.4%WI 12.1 0.8 0.7 2.3 13.4 24.2 0.2 45.1 43.7% 43.0%WV 5.2 0.1 0.0 0.7 4.8 9.3 0.1 15.5 35.5% 46.2%WY 2.7 0.0 0.0 0.0 1.1 3.5 0.0 8.4 30.3% 29.1%
Stat
e
Rene
wab
le
Ele
c. S
td.
Gen
. Per
f. St
d.
Pow
er P
lant
Ozo
ne/ M
ercu
ry
R
egs.
No
New
Coa
l
Com
bine
d Em
issio
n
Red
uctio
ns
EPA
CO 2
Reg
s.
All
Elec
tric
ity
% R
educ
tion
from
20
08 E
mis
sion
s
Fede
ral A
genc
ies
% R
educ
tion
vs.
B
usin
ess-
as-U
sual
2030
Electricity Policies (based on regional adoption) and Combined Policy Scenario Total emission savings may not equal the sum of the individual policies due to rounding and overlaps among policies.
Appendix 37

1 Translation from Goodreads at www.goodreads.com/quotes/show/289625.2 Intergovernmental Panel on Climate Change, Climate Change 2007: Synthesis Report: Contribution of Working Groups I, II and III to the Fourth Assessment Report of the Intergovernmental Panel on Climate Change, 2007.3 National Research Council, Advancing the Science of Climate Change (prepublication copy), National Academies Press, 2010, 17. 4 National Oceanic and Atmospheric Ad-ministration, NOAA: 2010 Tied for Warmest Year on Record, 12 January 2011.5 World Meteorological Organization, 2010 in Top Three Warmest Years, 2001-2010 Warmest 10-Year Period (press release), 2 December 2010. 6 See note 4. 7 Met Office (UK), Scientific Evidence Is Met Office Focus at Cancun (press release), 26 November 2010. 8 National Snow and Ice Data Center, Arctic Sea Ice Falls to Third-Lowest Extent; Downward Trend Persists (press release), 4 October 2010. 9 National Oceanic and Atmospheric Ad-ministration, Arctic Report Card 2010, 19 October 2010. 10 Lauren Morello and Climatewire, “
Major, Worldwide Damage to Corals Seen this Year,” Scientific American, 10 November 2010. 11 Nick Sundt, WWF, “Another Extreme Drought Hits the Amazon and Raises Cli-mate Change Concerns,” WWF Climate Blog, 23 November 2010. 12 National Oceanic and Atmospheric Ad-ministration, National Climatic Data Cen-ter, State of the Climate: Global Hazards: July 2010, updated 6 August 2010. 13 BBC News, “Pakistan’s Flooding Sweeps South,” 6 August 2010. 14 For additional details on these and other recent extreme weather events, see Tony Dutzik, Frontier Group, and Nathan Willcox, Environment America Research & Policy Center, Global Warming and Extreme Weather: The Science, the Forecast, and the Impacts on America, September 2010.15 Martin Vermeer and Stefan Rahm-storf, “Global Sea Level Linked to Global Temperature,” Proceedings of the National Academy of Sciences (online), doi: 10.1073/pnas.0907765106, 7 December 2009. 16 N.S. Diffenbaugh and M. Ashfaq, “Intensification of Hot Extremes in the United States,” Geophysical Research Letters, 37:L15701, doi:10.1029/2010GL043888, 2010.17 Charles H. Greene, D. James Baker
Notes
38 The Way Forward on Global Warming

and Daniel H. Miller, “A Very Inconve-nient Truth,” Oceanography, 23(1): 214-218, March 2010.
18 See, for example, Eric Roeckner, et al., “Historical and Future Anthropogenic Emission Pathways Derived from Coupled Climate-Carbon Cycle Simulations,” Climatic Change (online), DOI: 10.1007/s10584-010-9886-6, 21 July 2010. There is great uncertainty about the level of emis-sion reductions required to prevent dan-gerous climate change, based both on the uncertain future pathway of emissions in developing countries as well as uncertain-ties regarding the sensitivity of the climate to global warming emissions. For example, a recent study published by Great Britain’s Royal Society estimates that developed countries may need to make more dramatic emission reductions to prevent a 2°C rise in global average temperatures, if it is even possible at all. See: Kevin Anderson and Alice Bows, “Beyond ‘Dangerous’ Climate Change: Emission Scenarios for a New World,” Philosophical Transactions of the Royal Society A, 369: 20-44, doi:10.1098/rsta.2010.0290, 2011. 19 Sujata Gupta, Dennis A. Tirpak, et al., “Policies, Instruments and Co-operative Ar-rangements” in Climate Change 2007: Miti-gation, Contribution of Working Group III to the Fourth Assessment Report of the Intergov-ernmental Panel on Climate Change, 2007.20 U.S. Department of Energy, Energy Information Administration, International Energy Statistics: Total Carbon Dioxide Emis-sions from the Consumption of Energy, down-loaded from www.eia.gov/cfapps/ipdbproj-ect/IEDIndex3.cfm?tid=90&pid=44&aid=8, 30 March 2011.21 Center for Responsive Politics, Oil & Gas: Long-Term Contribution Trends, down-loaded from www.opensecrets.org/indus-tries/totals.php?cycle=2010&ind=E01, 30 March 2011.22 Center for Responsive Politics, Lobbying Spending Database, Oil & Gas 2009, down-loaded from www.opensecrets.org/lobby/in-dusclient.php?year=2009&lname=E01&id=, 30 March 2011.23 “Think tanks”: see, for example, Ian Sample, “Scientists Offered Cash to
Dispute Climate Study,” The Guardian, 2 February 2007; “global warming ‘skeptics’”: Suzanne Goldenburg, “Climate Change Skeptic ‘Misled Congress Over Funding from Oil Industry,’” The Guardian, 25 Janu-ary 2011.24 Riley E. Dunlap, Gallup, Climate Change Views: Republican-Democratic Gaps Expand, 29 May 2008. 25 Ryan Wiser and Galen Barbose, Law-rence Berkeley National Laboratory, Re-newables Portfolio Standards in the United States: A Status Report With Data Through 2007, April 200826 Wind: U.S. Department of Energy, Energy Information Administration, Electric Power Annual with Data for 2009, 23 No-vember 2010; Solar: Solar Energy Indus-tries Association, U.S. Solar Industry Year in Review 2009, 15 April 2010. 27 Todd Woody, “Solar Power Projects Face Potential Hurdles,” New York Times, 28 October 2010. 28 U.S. Environmental Protection Agency, Light-Duty Automotive Technology, Carbon Dioxide Emissions and Fuel Economy Trends: 1975 through 2010, November 2010.29 Online Code Enforcement and Advoca-cy Network, Code Status, downloaded from bcap-ocean.org/code-status, 14 December 2010. 30 New Buildings Institute, Historic Chang-es to Commercial Building Energy Codes Will Drive Energy Efficiency, 2 November 2010. 31 U.S. Department of Energy, Energy Information Administration, Electric Power Annual with Data for 2009, 23 November 2010.32 Federal Transit Administration, Nation-al Transit Database, 2009 National Transit Summaries and Trends, November 2010. 33 Christopher Leinberger and Patrick C. Doherty, “The Next Real Estate Boom,” Washington Monthly, November/December 2010. 34 U.S. Department of Energy, Energy Information Administration, Annual Energy Outlook 2004 with Projections to 2025, Janu-ary 2004.35 U.S. Department of Energy, Energy Information Administration, Annual Energy
Notes 3�

Outlook series of reports, 2004 through 2010.36 U.S. Department of Energy, Energy Information Administration, Annual Energy Review 2009, 19 August 2010.37 2009 emissions: Ibid.; previous projec-tions: see note 35.38 U.S. Department of Energy, Energy Information Administration, U.S. Carbon Dioxide Emissions in 2009: A Retrospective Re-view, 5 May 2010. 39 Tony Dutzik, et al., America on the Move: State Leadership in the Fight Against Global Warming, and What it Means for the World, Environment America Research & Policy Center, December 2009. 40 U.S. Department of Energy, Energy Information Administration, Short-Term Energy Outlook, 7 December 2010, based on applying the EIA’s projected 3.9 percent in-crease for 2010 to carbon dioxide emissions in 2009 from U.S. Department of Energy, Energy Information Administration, Annual Energy Review 2009, 19 August 2010.41 See note 39.
42 Darren Samuelsohn, “Silicon Valley Fights California’s Prop. 23,” Politico, 21 October 2010.43 Keith Schneider, “Midwest Is Becoming a Center for Solar Power Plants,” New York Times, 30 November 2010.44 See, for example, Nicholas Lutsey and Daniel Sperling, “America’s Bottom-Up Climate Change Mitigation Strategy,” En-ergy Policy, 36:673-685, 2008; Thomas D. Peterson, Robert S. McKistry, Jr., and John C. Dernbach, “Developing a Comprehen-sive Approach to Climate Change Policy in the United States that Fully Integrates Lev-els of Government and Economic Sectors,” Virginia Environmental Law Journal, 26:227-261, 2008; Nicholas M. Bianco and Franz T. Litz, World Resources Institute, Reducing Greenhouse Gas Emissions in the United States Using Existing Federal Authorities and State Action, 2010.45 U.S. Department of Energy, Energy Information Administration, Emissions of Greenhouse Gases in the United States 2008, December 2009.
40 The Way Forward on Global Warming