Embed Size (px)
Citation preview
2020
COMPARATIVE CARBON FOOTPRINT
soy, corn and cotton
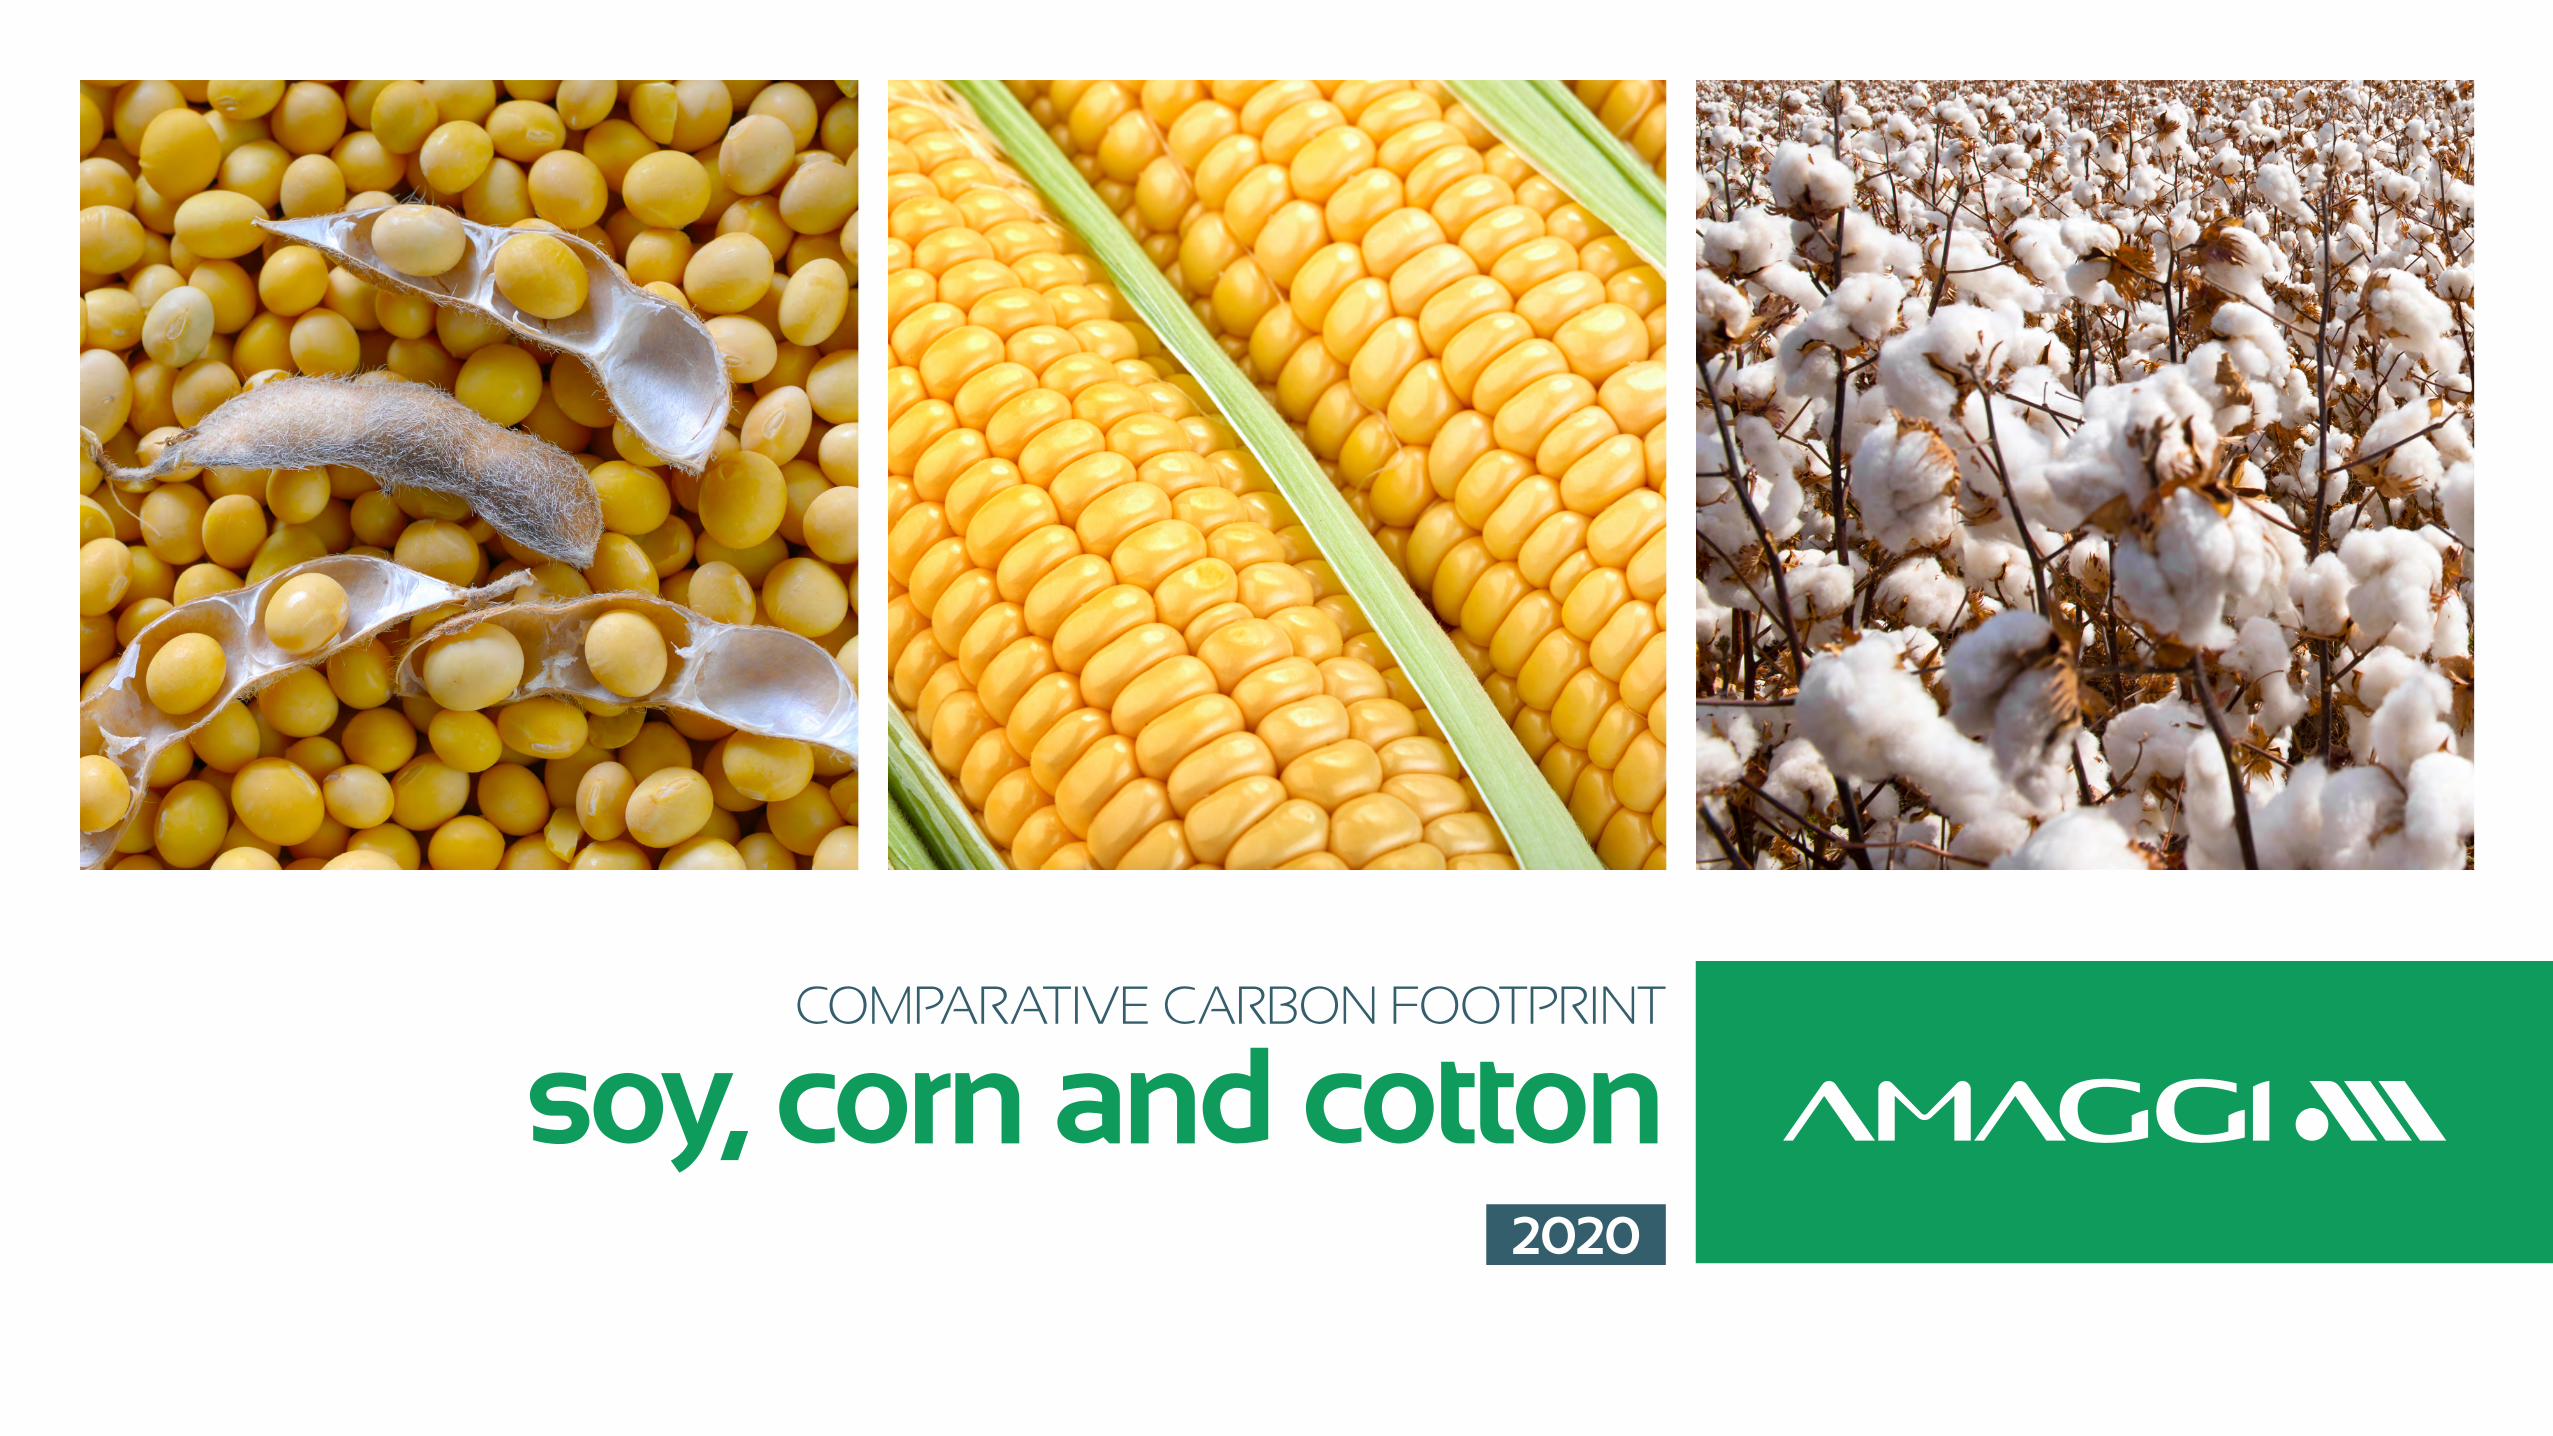
Presence in Brazil AND IN THE WORLD
AMAGGI
For over four decades AMAGGI has made sustainable
progress in each stage of the grain and fiber
production chain, identifying opportunities and
incorporating challenges that promote, not only the
company’s growth, but the development of the entire
local and global food market.
Through four major business areas - Agro,
Commodities, Logistics and Operations, and Energy
- the company operates in the agricultural production
of soybeans, corn, cotton and fertilizers, in the sale of
grains and agricultural inputs, in large-scale national
and international logistics for grain outlets, and in the
generation and sale of electric energy.
Its mission of contributing to the development
of agribusiness is permeated by respect for the
environment and constant improvement in the lives of
people and communities where it is present.
In practice, the commitments made in the Global
Sustainability Positioning, with a vision until 2025,
cover operations, the surrounding communities
and the respective value chain. AMAGGI also has a
structure that encourages rural producers’ and local
suppliers’ development, reflecting on several socio-
environmental and quality certifications.
And, guided by the United Nations Global Compact
Global Sustainability Positioning principles (UN),
AMAGGI invests in actions and partnerships with the
civil society, non-governmental organizations (NGOs),
suppliers, customers and the government.
Trading Office
Farm
Warehouse
Port Terminal
Plant
Headquarters
Shipyard
Joint Venture
Waterway
Joint Venture Waterway
ISO 14001 Certification
Small Hydroelectric Plant - SHPs
Highway
Railroad
Paraguay
Norway
China
HollandSwitzerland
Brazil
Argentina
Boa Vista
Rio Verde
Barcarena
Distrito deMirituba
Querência
Paranaguá
São Francisco do Sul
Maringá
Passo Fundo
Rio Grande
Lucasdo Rio Verde
Cuiabá
Porto Velho
Ariquemes
VilhenaSinop
Cerejeiras
Sapezal
Manaus
Madeira River
Itiquira
Comodoro
Rondonópolis
Tapajós River
Amazonas River
Itacoatiara
Paragominas
Colinas
Santos
AMAGGI
Carbon Footprint
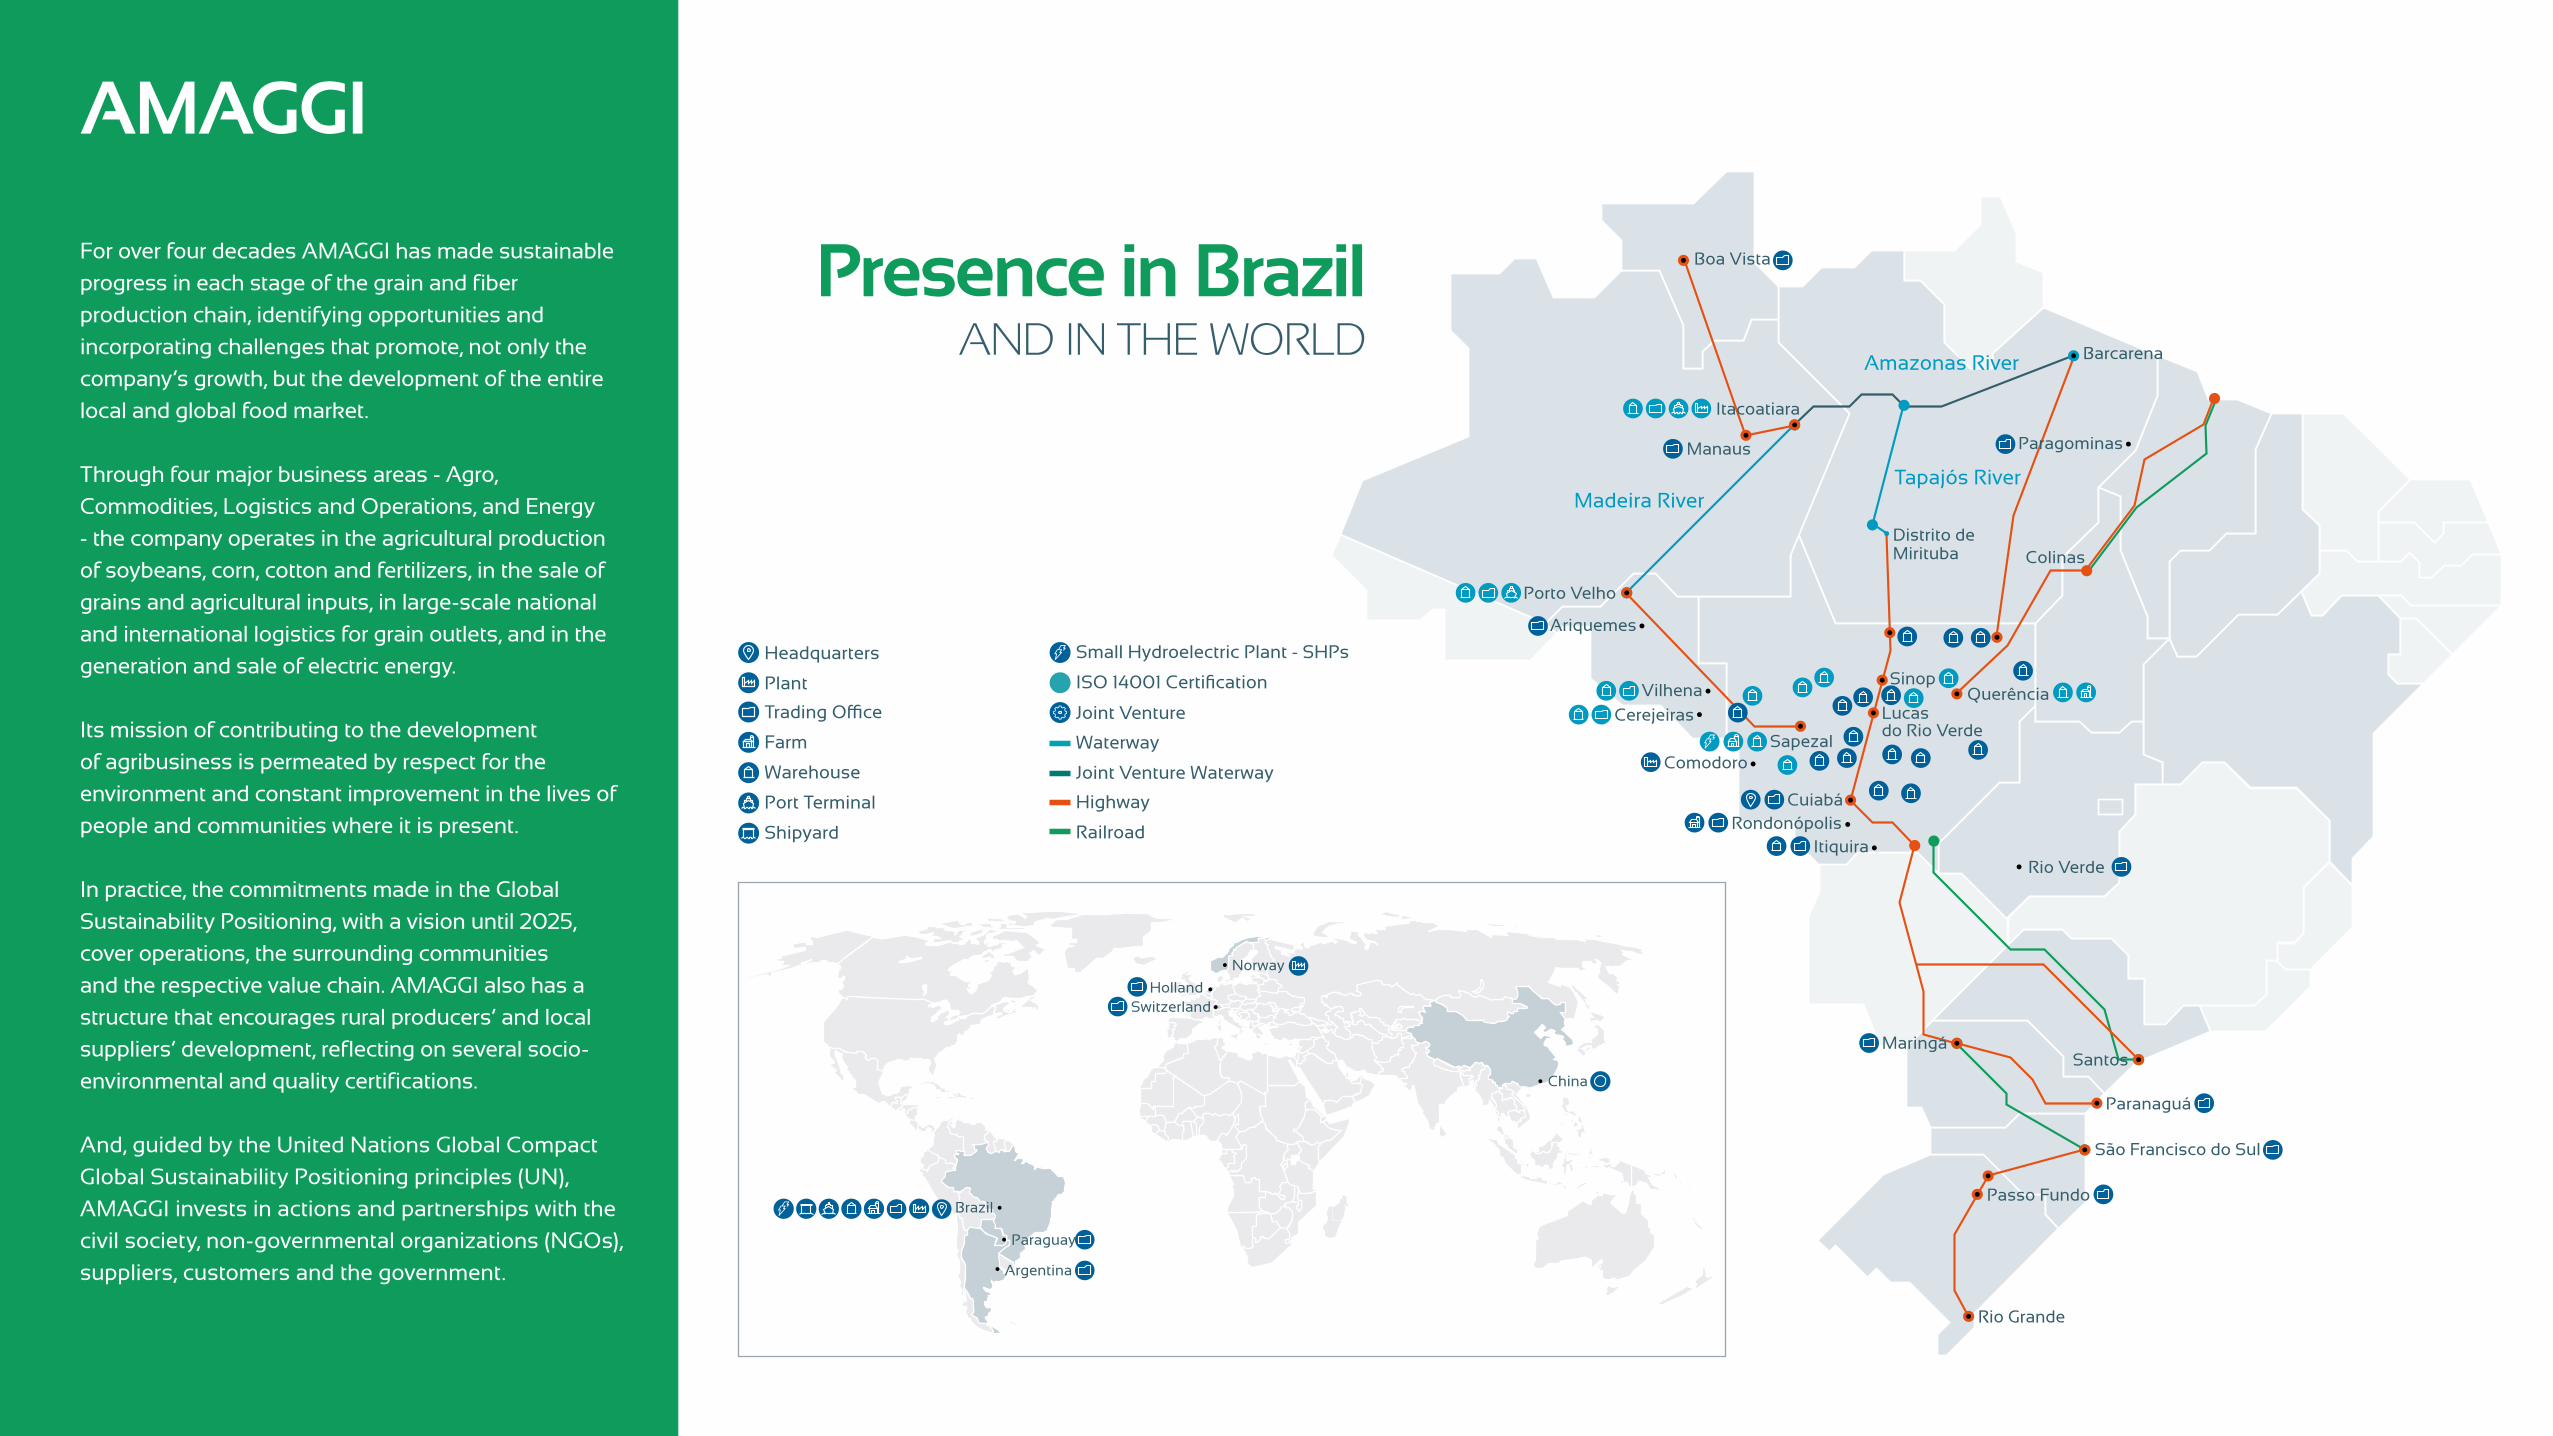
PROJECT OBJECTIVE AND CONTEXT:
The ‘AMAGGI Soy Carbon Footprint project’ aims to determine the carbon footprint of all soy, corn and cotton fiber produced and exported by AMAGGI. The results demonstrate significant advances achieved by the company towards developing a more sustainable agricultural production, supported by AMAGGI’s Global Sustainability Positioning and “Towards a deforestation and conversion free grain chain” commitment.
Thus, an assessment was carried out on AMAGGI products’ carbon footprint impacts, to then render transparency to the obtained result. Additionally, the project compares AMAGGI’s carbon footprint performance with other production scenarios: average soybean production scenarios in Brazil, Argentina, Canada, United States (USA) and Ukraine; average corn production scenarios in Brazil, France, Hungary, USA and Ukraine; and an average scenario of cotton fiber production in USA.
To carry out this project, AMAGGI relied on the expertise of the EnCiclo Soluções Sustentáveis, a sustainability consulting company which core business focuses on life cycle assessment (LCA) projects, circular economy and support for sustainable decision-making.
The study Carbon Footprint also had a critical review from the ACV Brasil company, based on the ISO 14044: 2006 - Environmental management - Life cycle assessment - Requirements and guidelines.
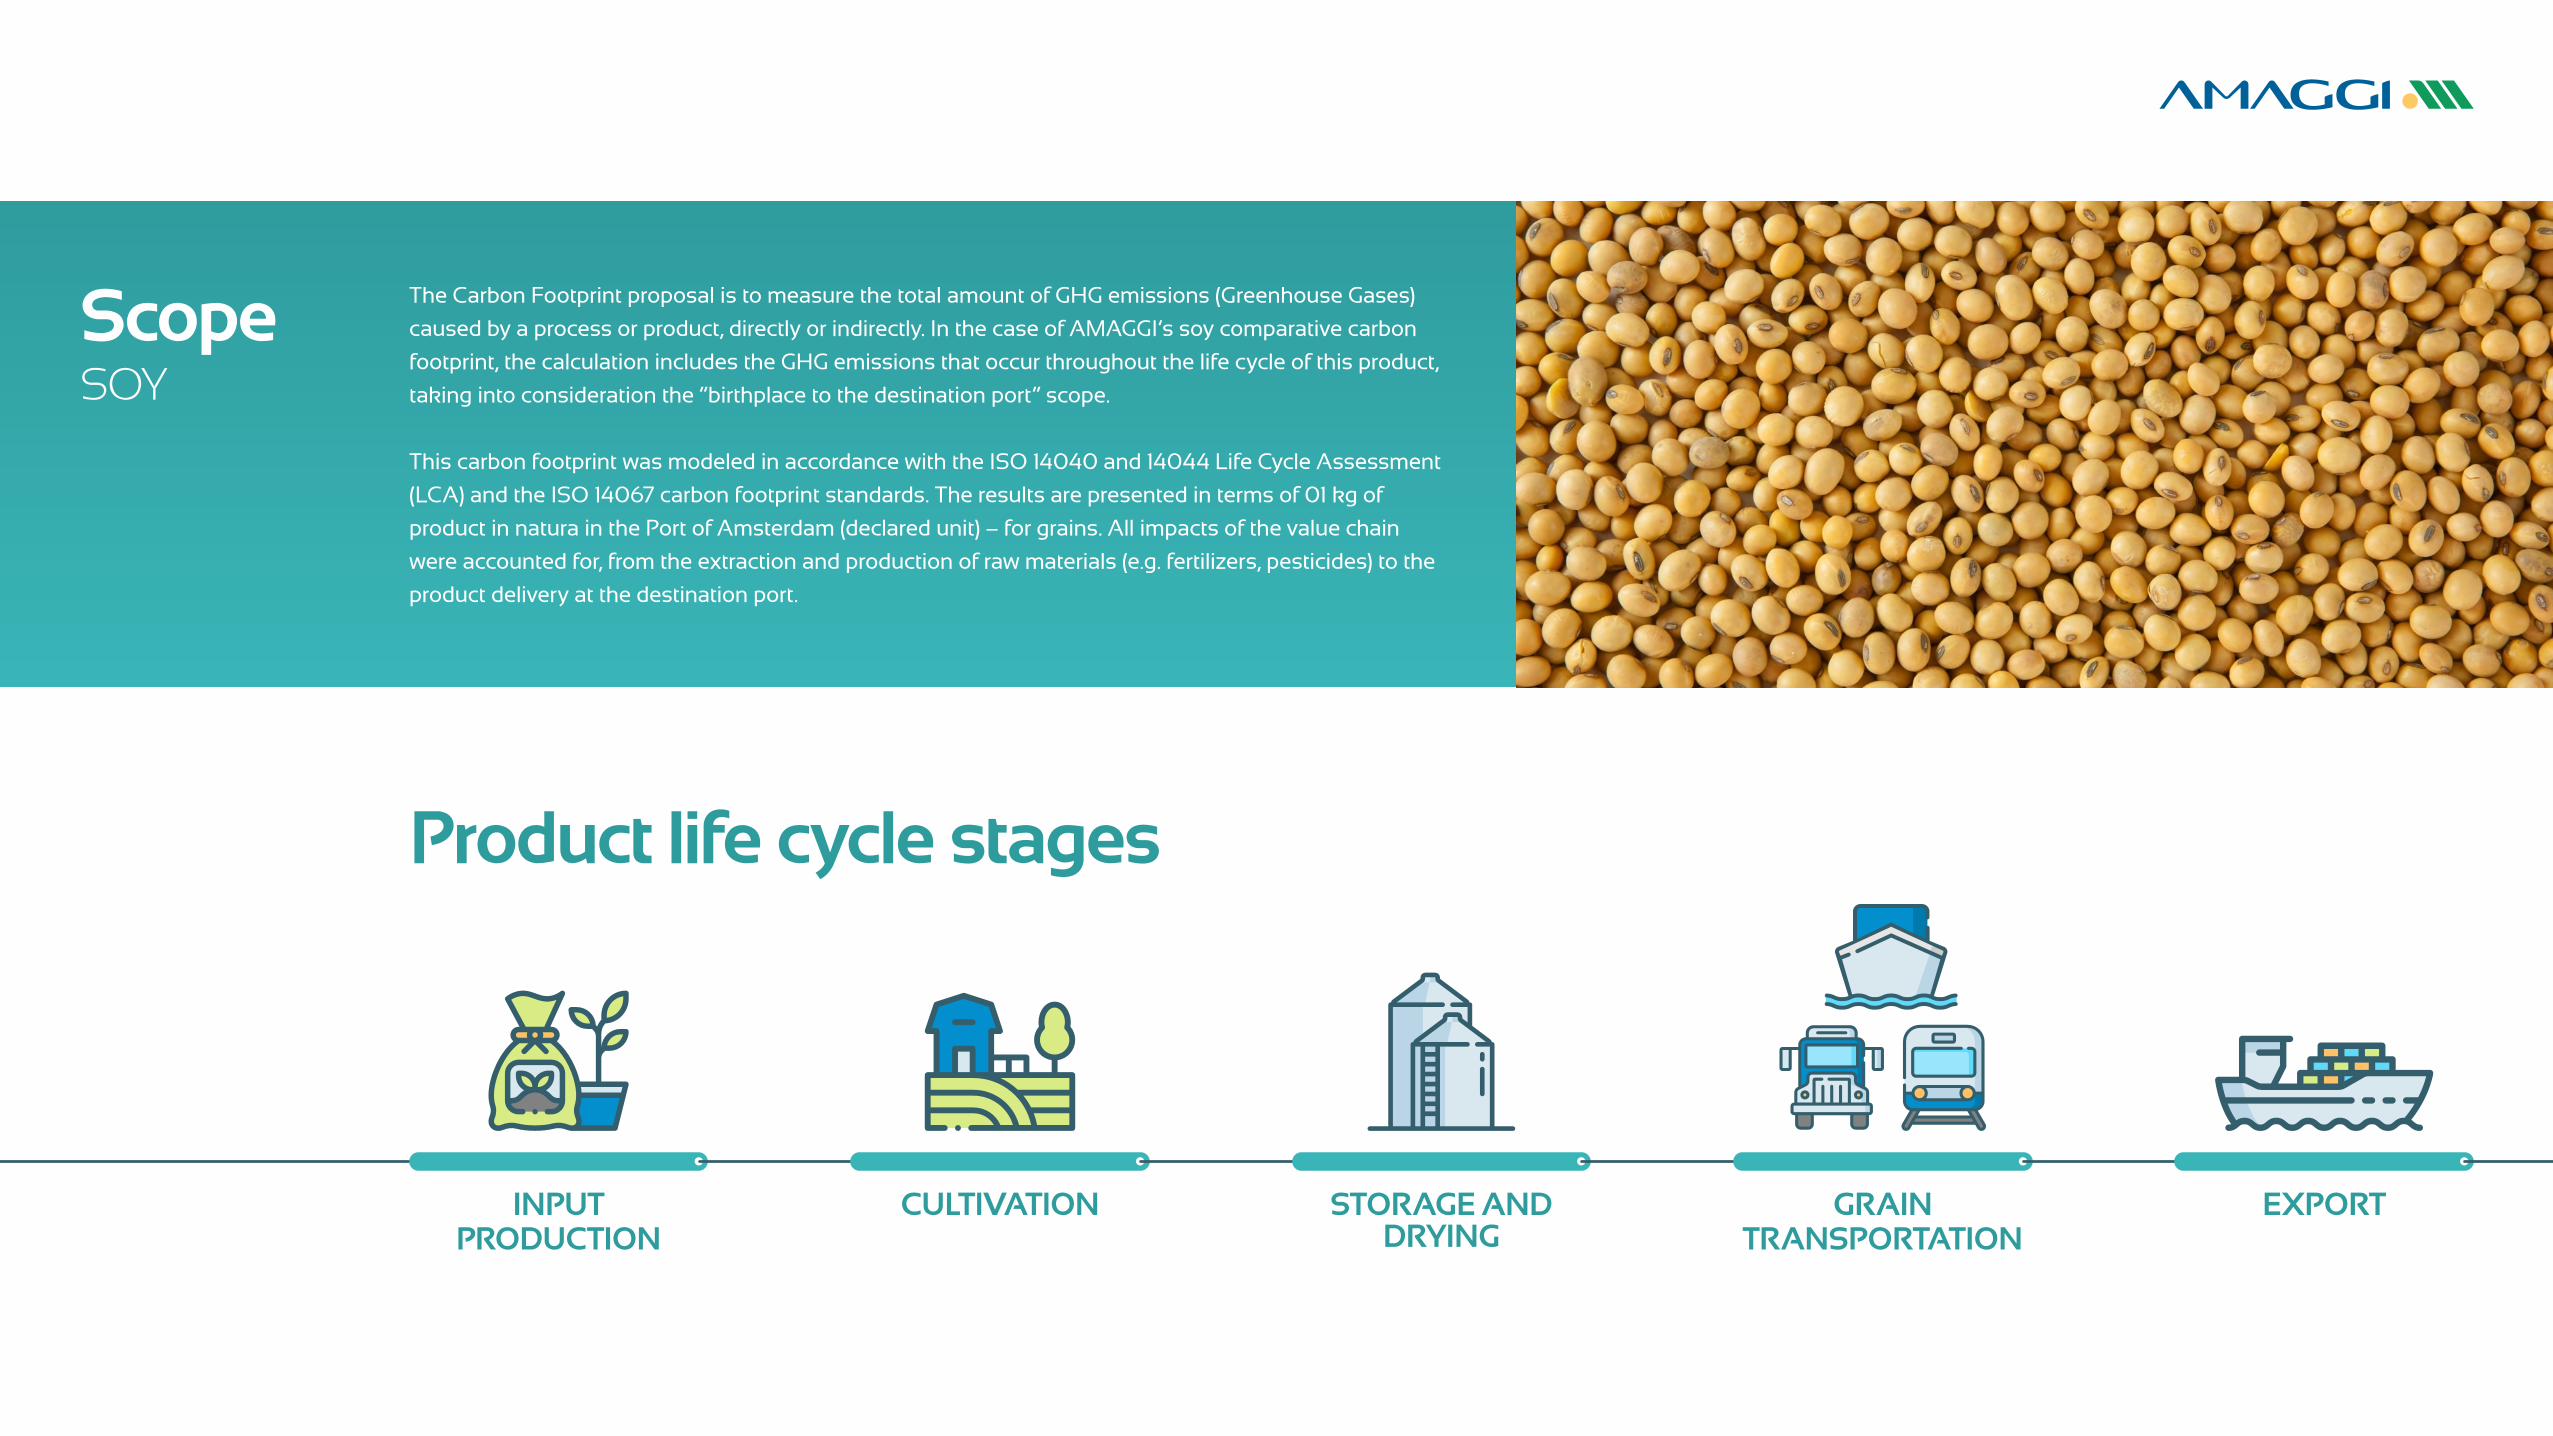
Product life cycle stages
INPUT PRODUCTION
CULTIVATION STORAGE AND DRYING
GRAIN TRANSPORTATION
EXPORT
ScopeSOY
The Carbon Footprint proposal is to measure the total amount of GHG emissions (Greenhouse Gases)
caused by a process or product, directly or indirectly. In the case of AMAGGI’s soy comparative carbon
footprint, the calculation includes the GHG emissions that occur throughout the life cycle of this product,
taking into consideration the “birthplace to the destination port” scope.
This carbon footprint was modeled in accordance with the ISO 14040 and 14044 Life Cycle Assessment
(LCA) and the ISO 14067 carbon footprint standards. The results are presented in terms of 01 kg of
product in natura in the Port of Amsterdam (declared unit) – for grains. All impacts of the value chain
were accounted for, from the extraction and production of raw materials (e.g. fertilizers, pesticides) to the
product delivery at the destination port.
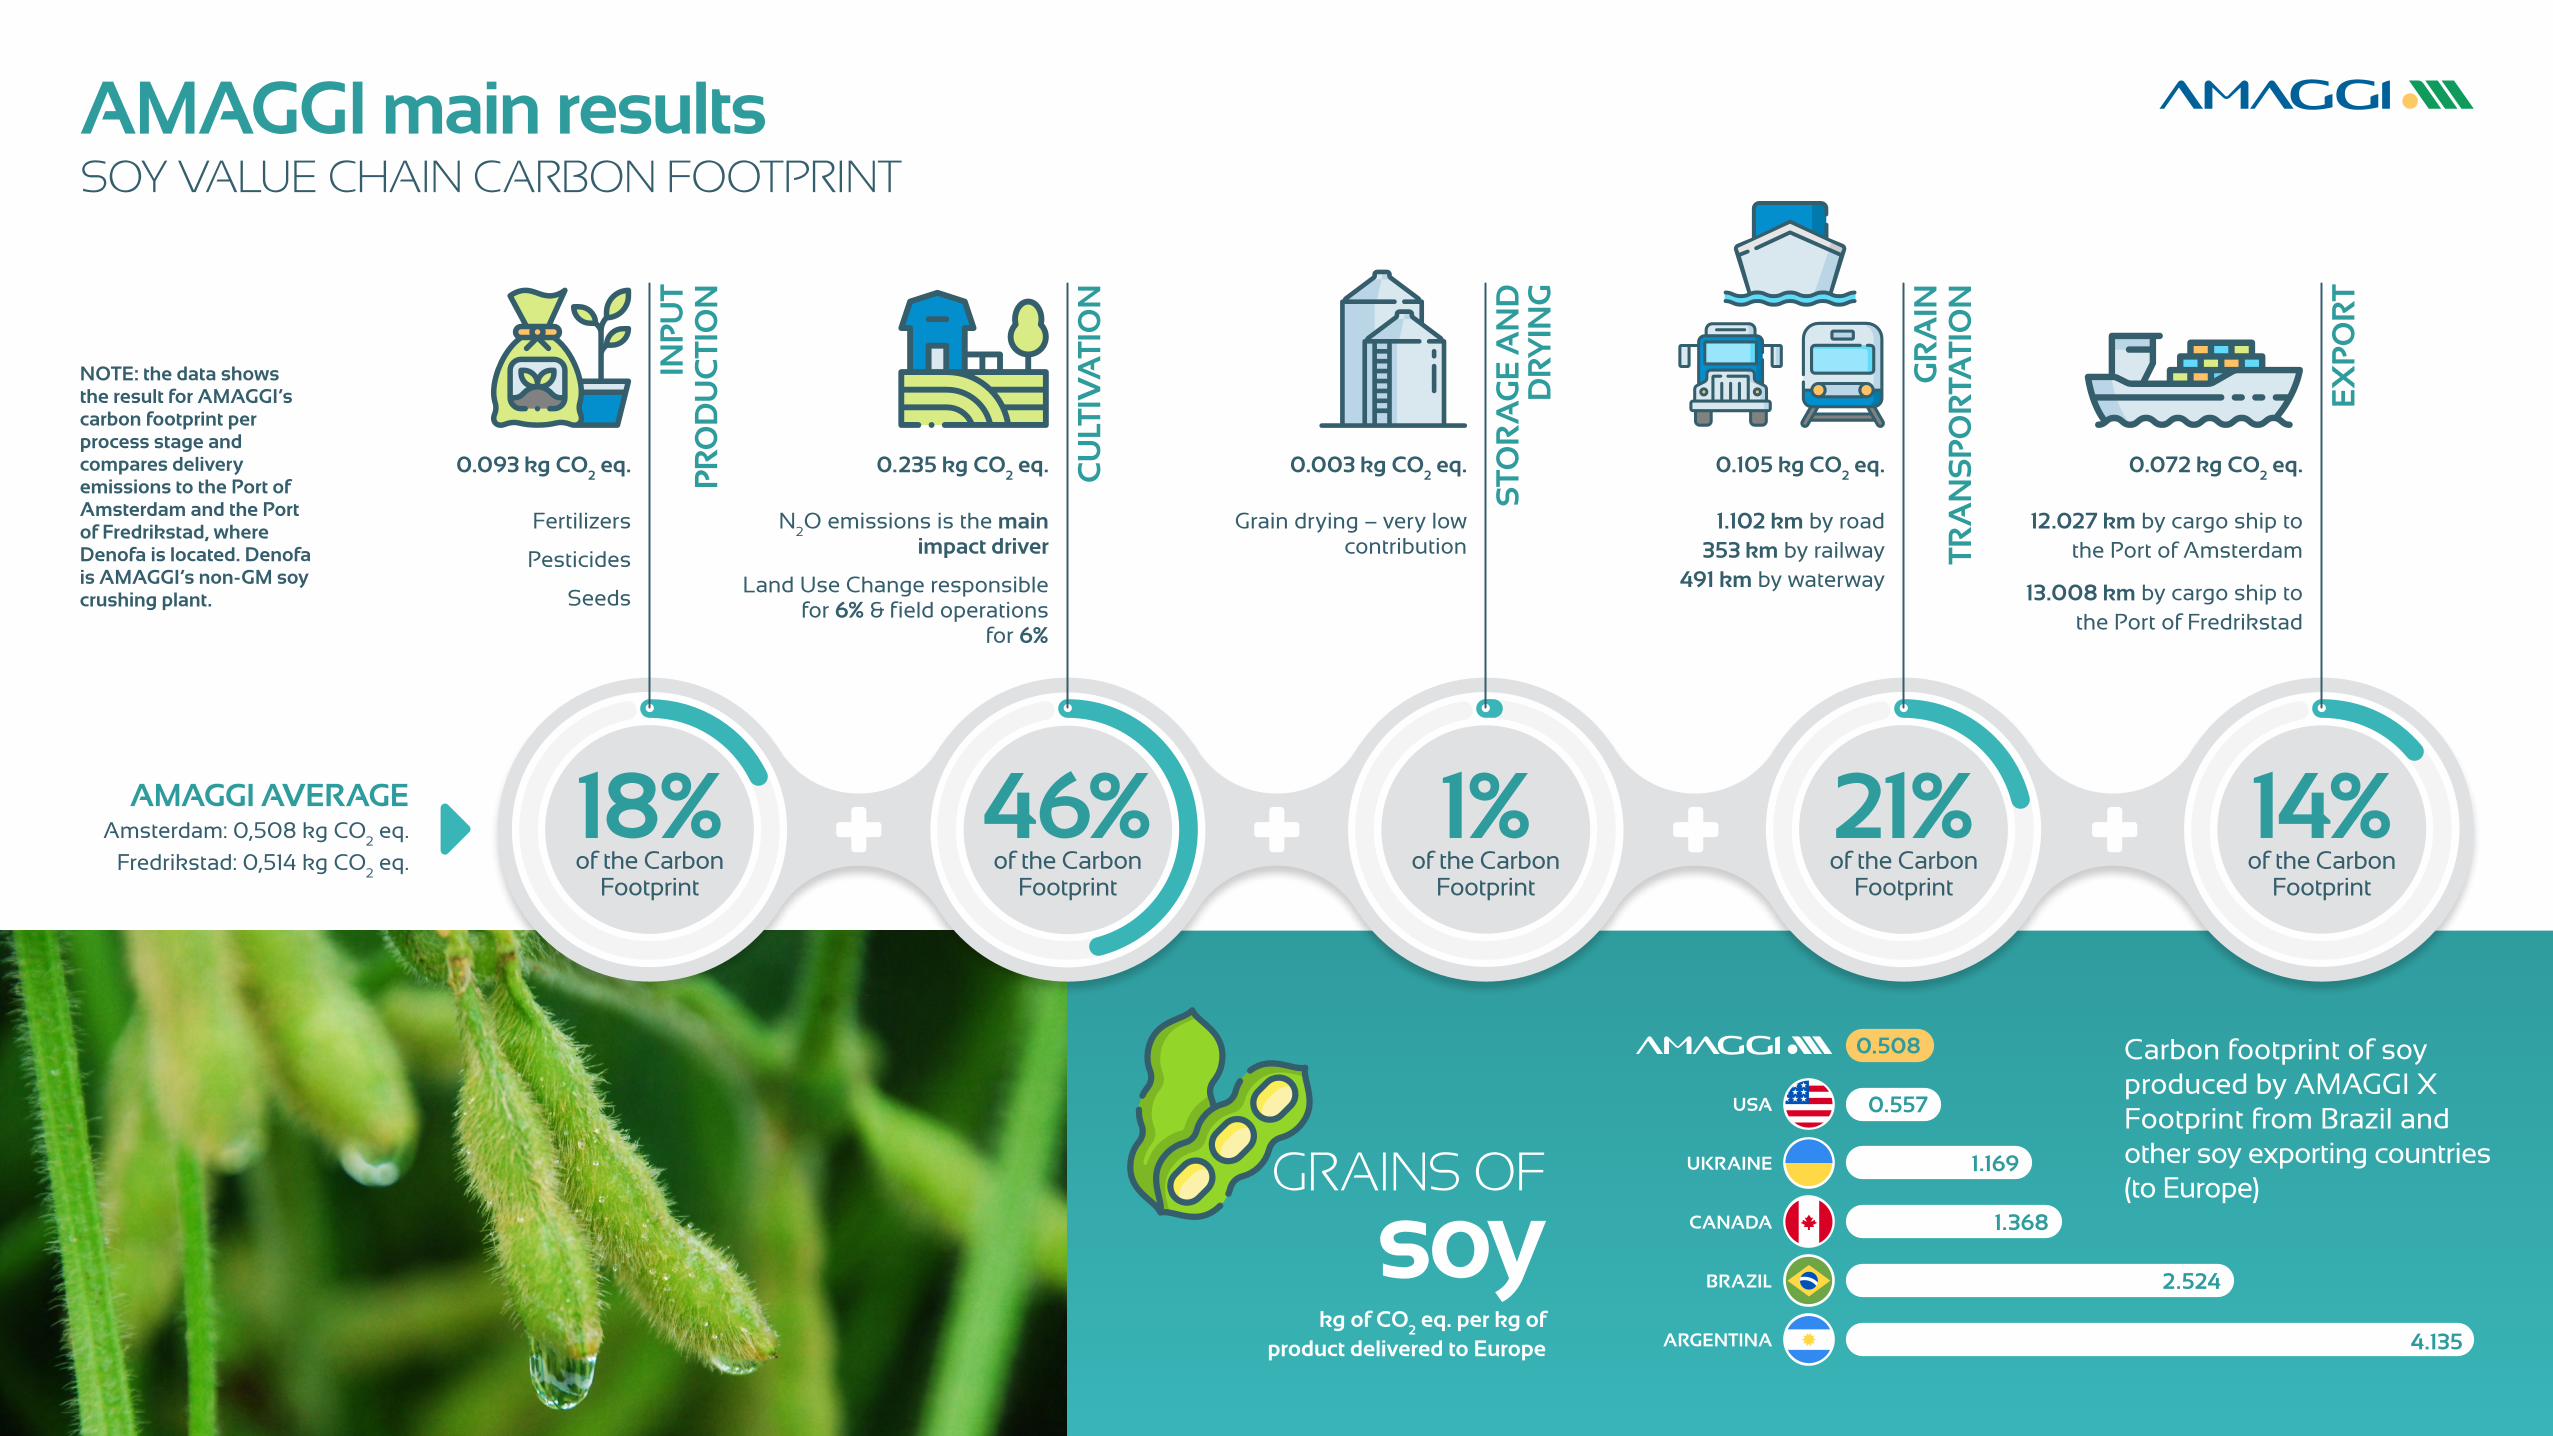
18%
INP
UT
PR
OD
UC
TIO
N
CU
LTIV
ATI
ON
STO
RA
GE
AN
D
DR
YIN
G
GR
AIN
TR
AN
SP
OR
TATI
ON
EX
PO
RT
of the Carbon Footprint
of the Carbon Footprint
of the Carbon Footprint
of the Carbon Footprint
of the Carbon Footprint
46% 1% 21% 14%
Fertilizers
Pesticides
Seeds
AMAGGI AVERAGEAmsterdam: 0,508 kg CO
2 eq.
Fredrikstad: 0,514 kg CO2 eq.
NOTE: the data shows the result for AMAGGI’s carbon footprint per process stage and compares delivery emissions to the Port of Amsterdam and the Port of Fredrikstad, where Denofa is located. Denofa is AMAGGI’s non-GM soy crushing plant.
N2O emissions is the main
impact driver
Land Use Change responsible for 6% & field operations
for 6%
1.102 km by road353 km by railway
491 km by waterway
12.027 km by cargo ship to the Port of Amsterdam
13.008 km by cargo ship to the Port of Fredrikstad
0.093 kg CO2 eq. 0.235 kg CO
2 eq. 0.003 kg CO
2 eq. 0.105 kg CO
2 eq. 0.072 kg CO
2 eq.
AMAGGI main results SOY VALUE CHAIN CARBON FOOTPRINT
Carbon footprint of soy produced by AMAGGI X Footprint from Brazil and other soy exporting countries (to Europe)GRAINS OF
soyARGENTINA 4.135
BRAZIL 2.524
CANADA 1.368
USA 0.557
UKRAINE 1.169
0.508
kg of CO2 eq. per kg of
product delivered to Europe
Grain drying – very low contribution
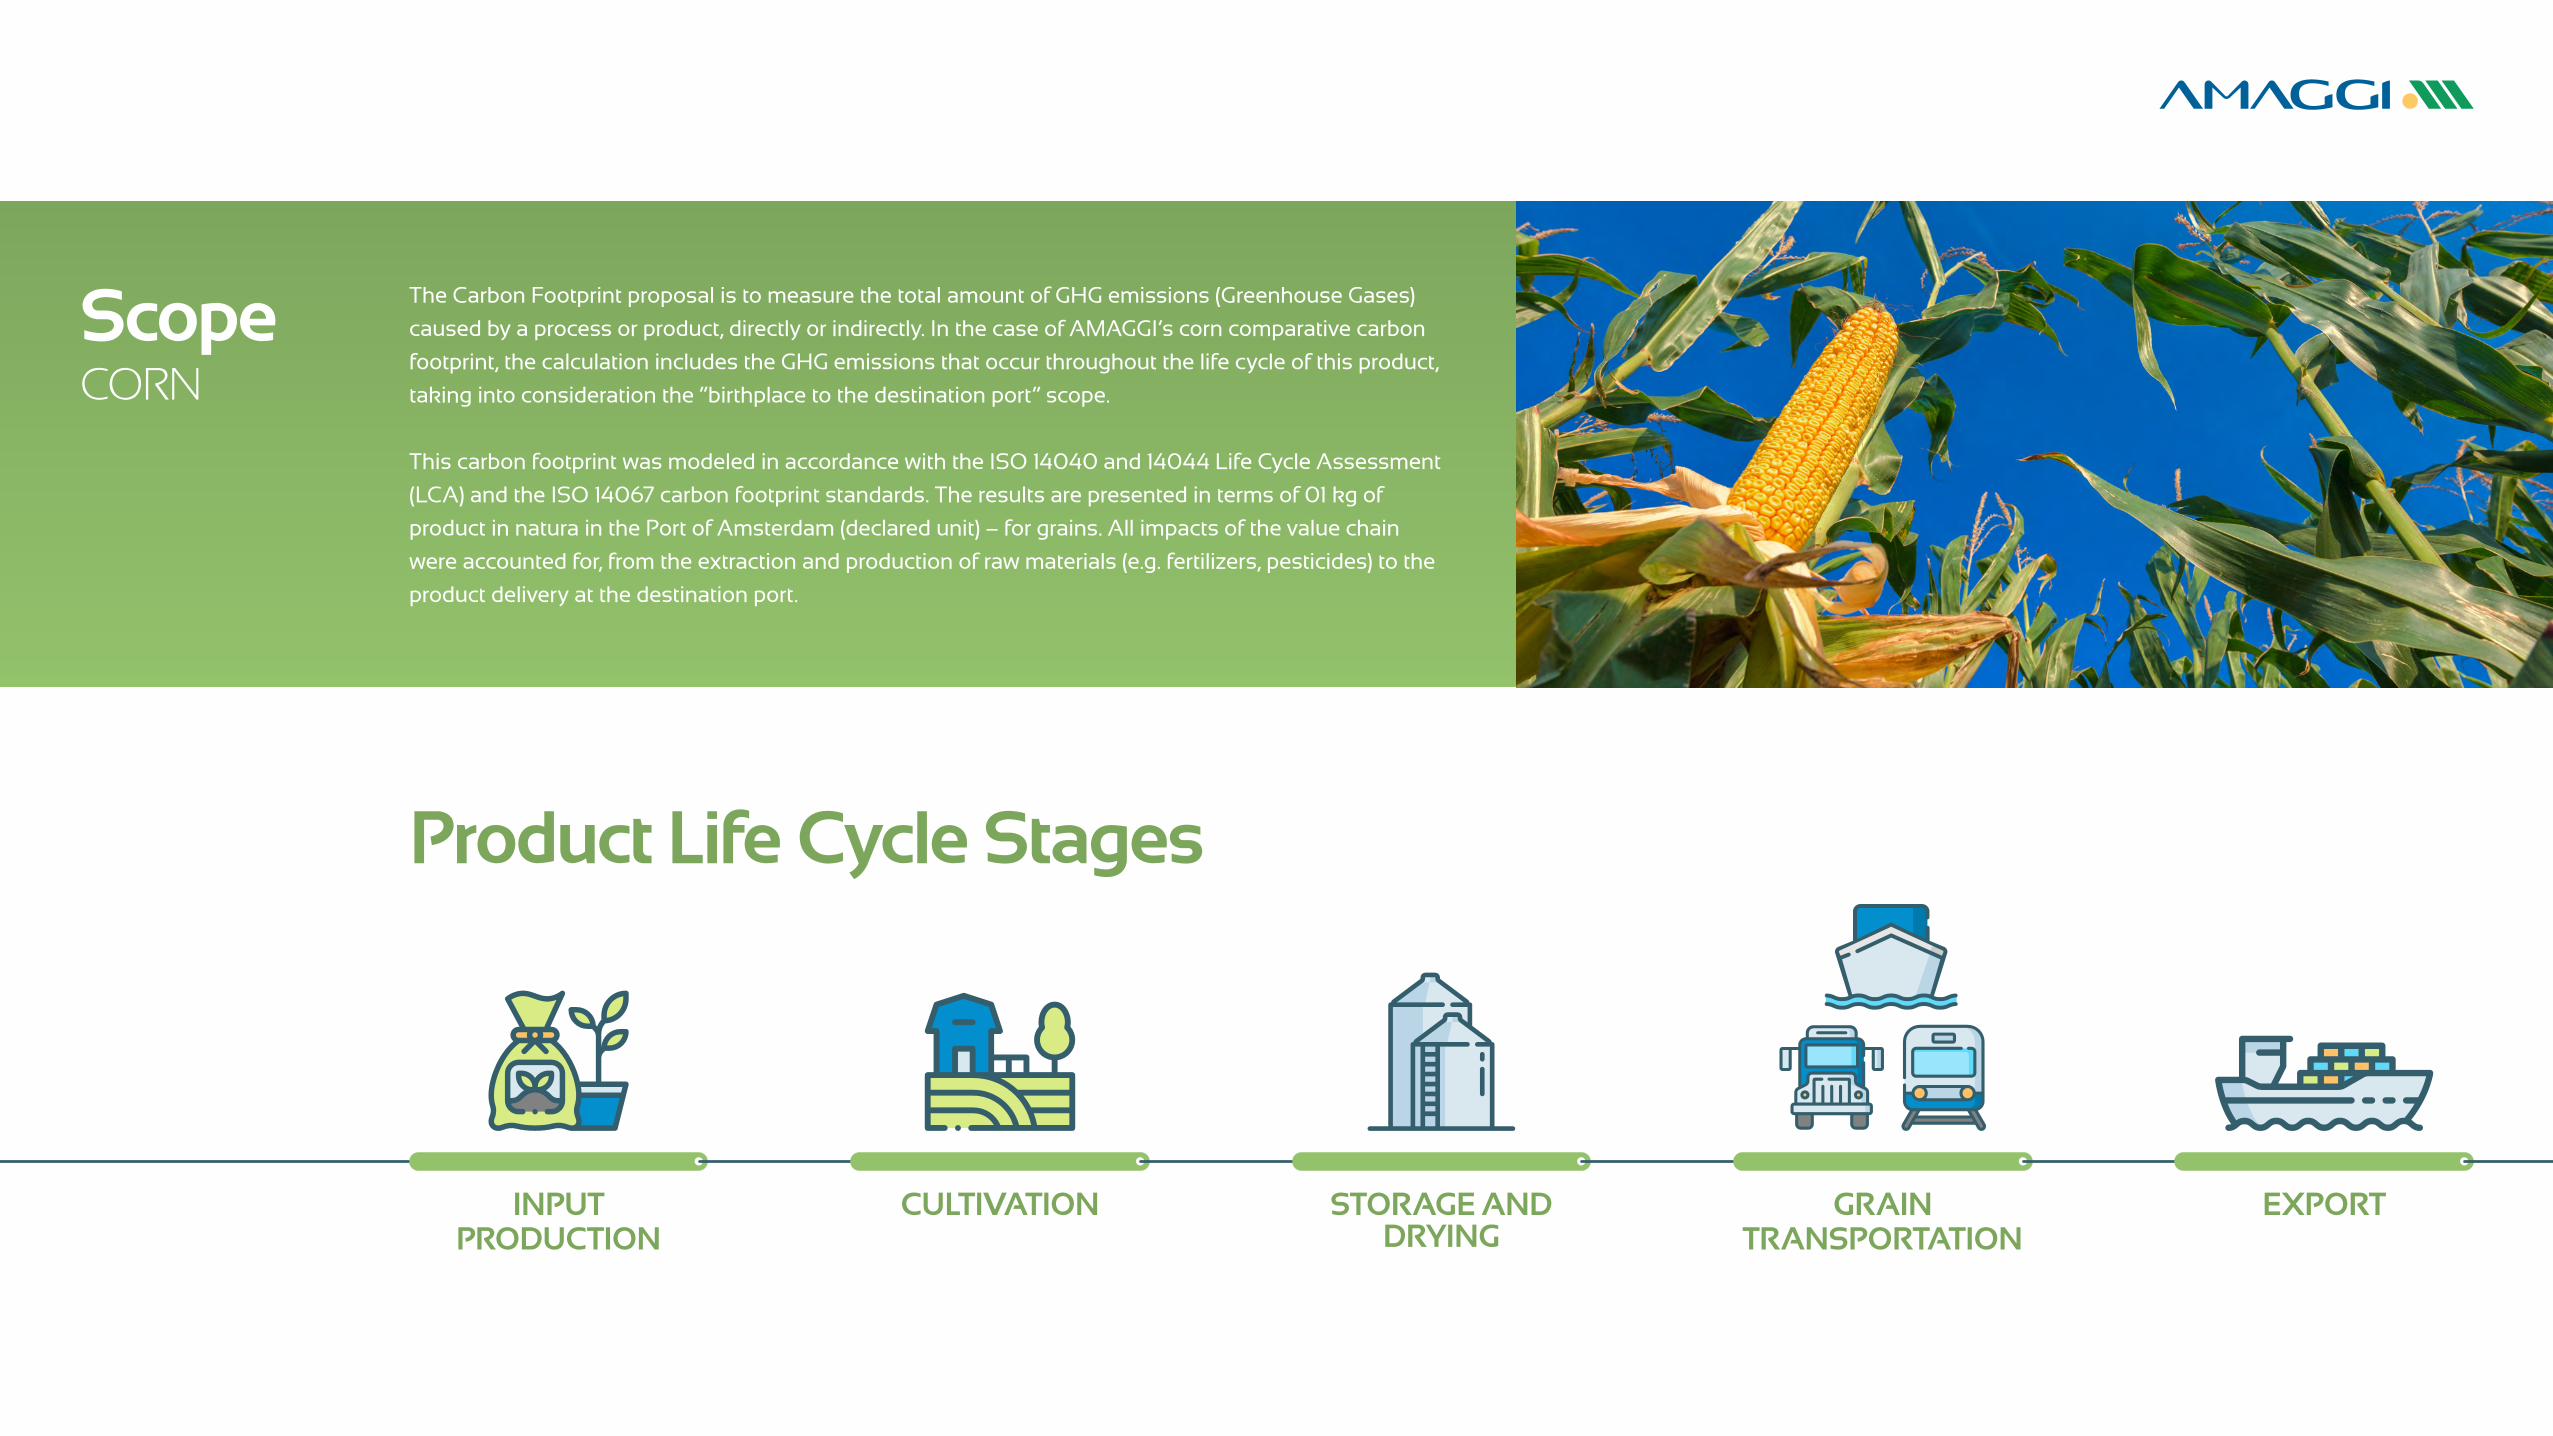
INPUT PRODUCTION
CULTIVATION STORAGE AND DRYING
GRAIN TRANSPORTATION
EXPORT
ScopeCORN
The Carbon Footprint proposal is to measure the total amount of GHG emissions (Greenhouse Gases)
caused by a process or product, directly or indirectly. In the case of AMAGGI’s corn comparative carbon
footprint, the calculation includes the GHG emissions that occur throughout the life cycle of this product,
taking into consideration the “birthplace to the destination port” scope.
This carbon footprint was modeled in accordance with the ISO 14040 and 14044 Life Cycle Assessment
(LCA) and the ISO 14067 carbon footprint standards. The results are presented in terms of 01 kg of
product in natura in the Port of Amsterdam (declared unit) – for grains. All impacts of the value chain
were accounted for, from the extraction and production of raw materials (e.g. fertilizers, pesticides) to the
product delivery at the destination port.
Product Life Cycle Stages
INP
UT
PR
OD
UC
TIO
N
CU
LTIV
ATI
ON
STO
RA
GE
AN
D
DR
YIN
G
GR
AIN
TR
AN
SP
OR
TATI
ON
EX
PO
RT
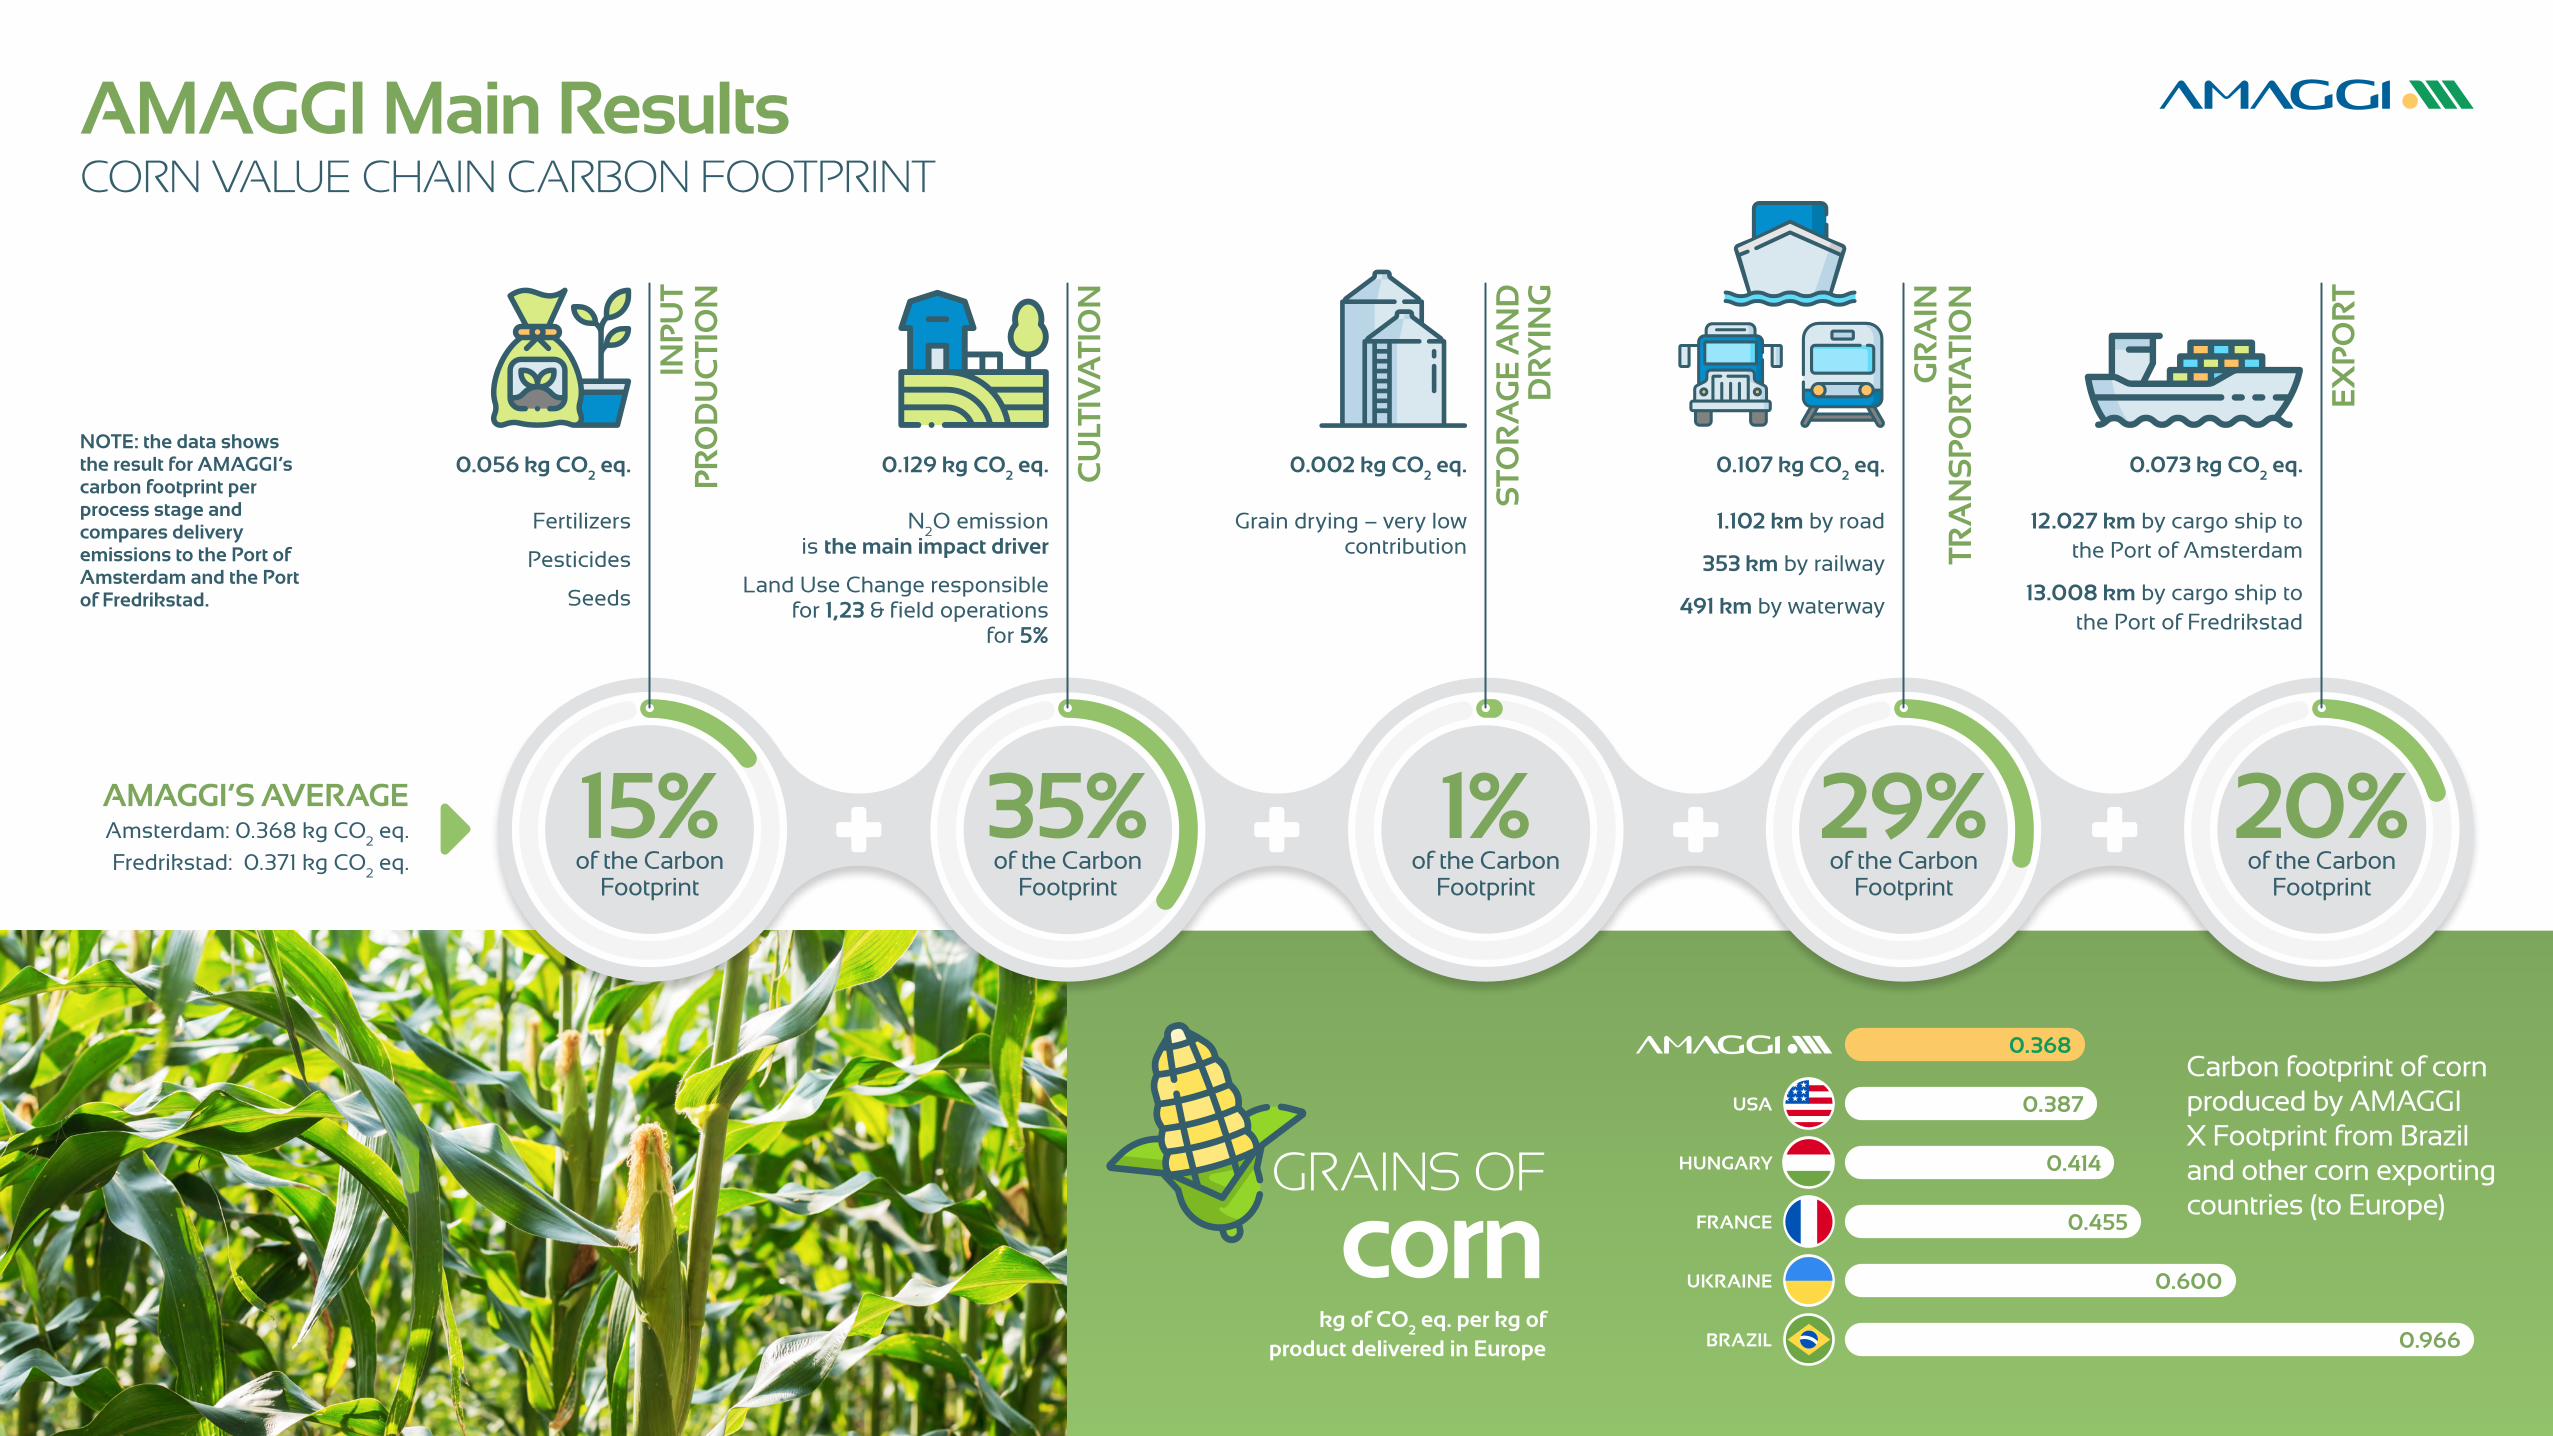
Fertilizers
Pesticides
Seeds
AMAGGI’S AVERAGEAmsterdam: 0.368 kg CO
2 eq.
Fredrikstad: 0.371 kg CO2 eq.
NOTE: the data shows the result for AMAGGI’s carbon footprint per process stage and compares delivery emissions to the Port of Amsterdam and the Port of Fredrikstad.
Grain drying – very low contribution
1.102 km by road
353 km by railway
491 km by waterway
12.027 km by cargo ship to the Port of Amsterdam
13.008 km by cargo ship to the Port of Fredrikstad
0.056 kg CO2 eq. 0.129 kg CO
2 eq. 0.002 kg CO
2 eq. 0.107 kg CO
2 eq. 0.073 kg CO
2 eq.
AMAGGI Main ResultsCORN VALUE CHAIN CARBON FOOTPRINT
BRAZIL 0.966
USA 0.387
UKRAINE 0.600
0.368
GRAINS OF
corn
15%of the Carbon
Footprintof the Carbon
Footprintof the Carbon
Footprintof the Carbon
Footprintof the Carbon
Footprint
35% 1% 29% 20%
FRANCE 0.455
HUNGARY 0.414
Carbon footprint of corn produced by AMAGGI X Footprint from Brazil and other corn exporting countries (to Europe)
kg of CO2 eq. per kg of
product delivered in Europe
N2O emission
is the main impact driver
Land Use Change responsible for 1,23 & field operations
for 5%
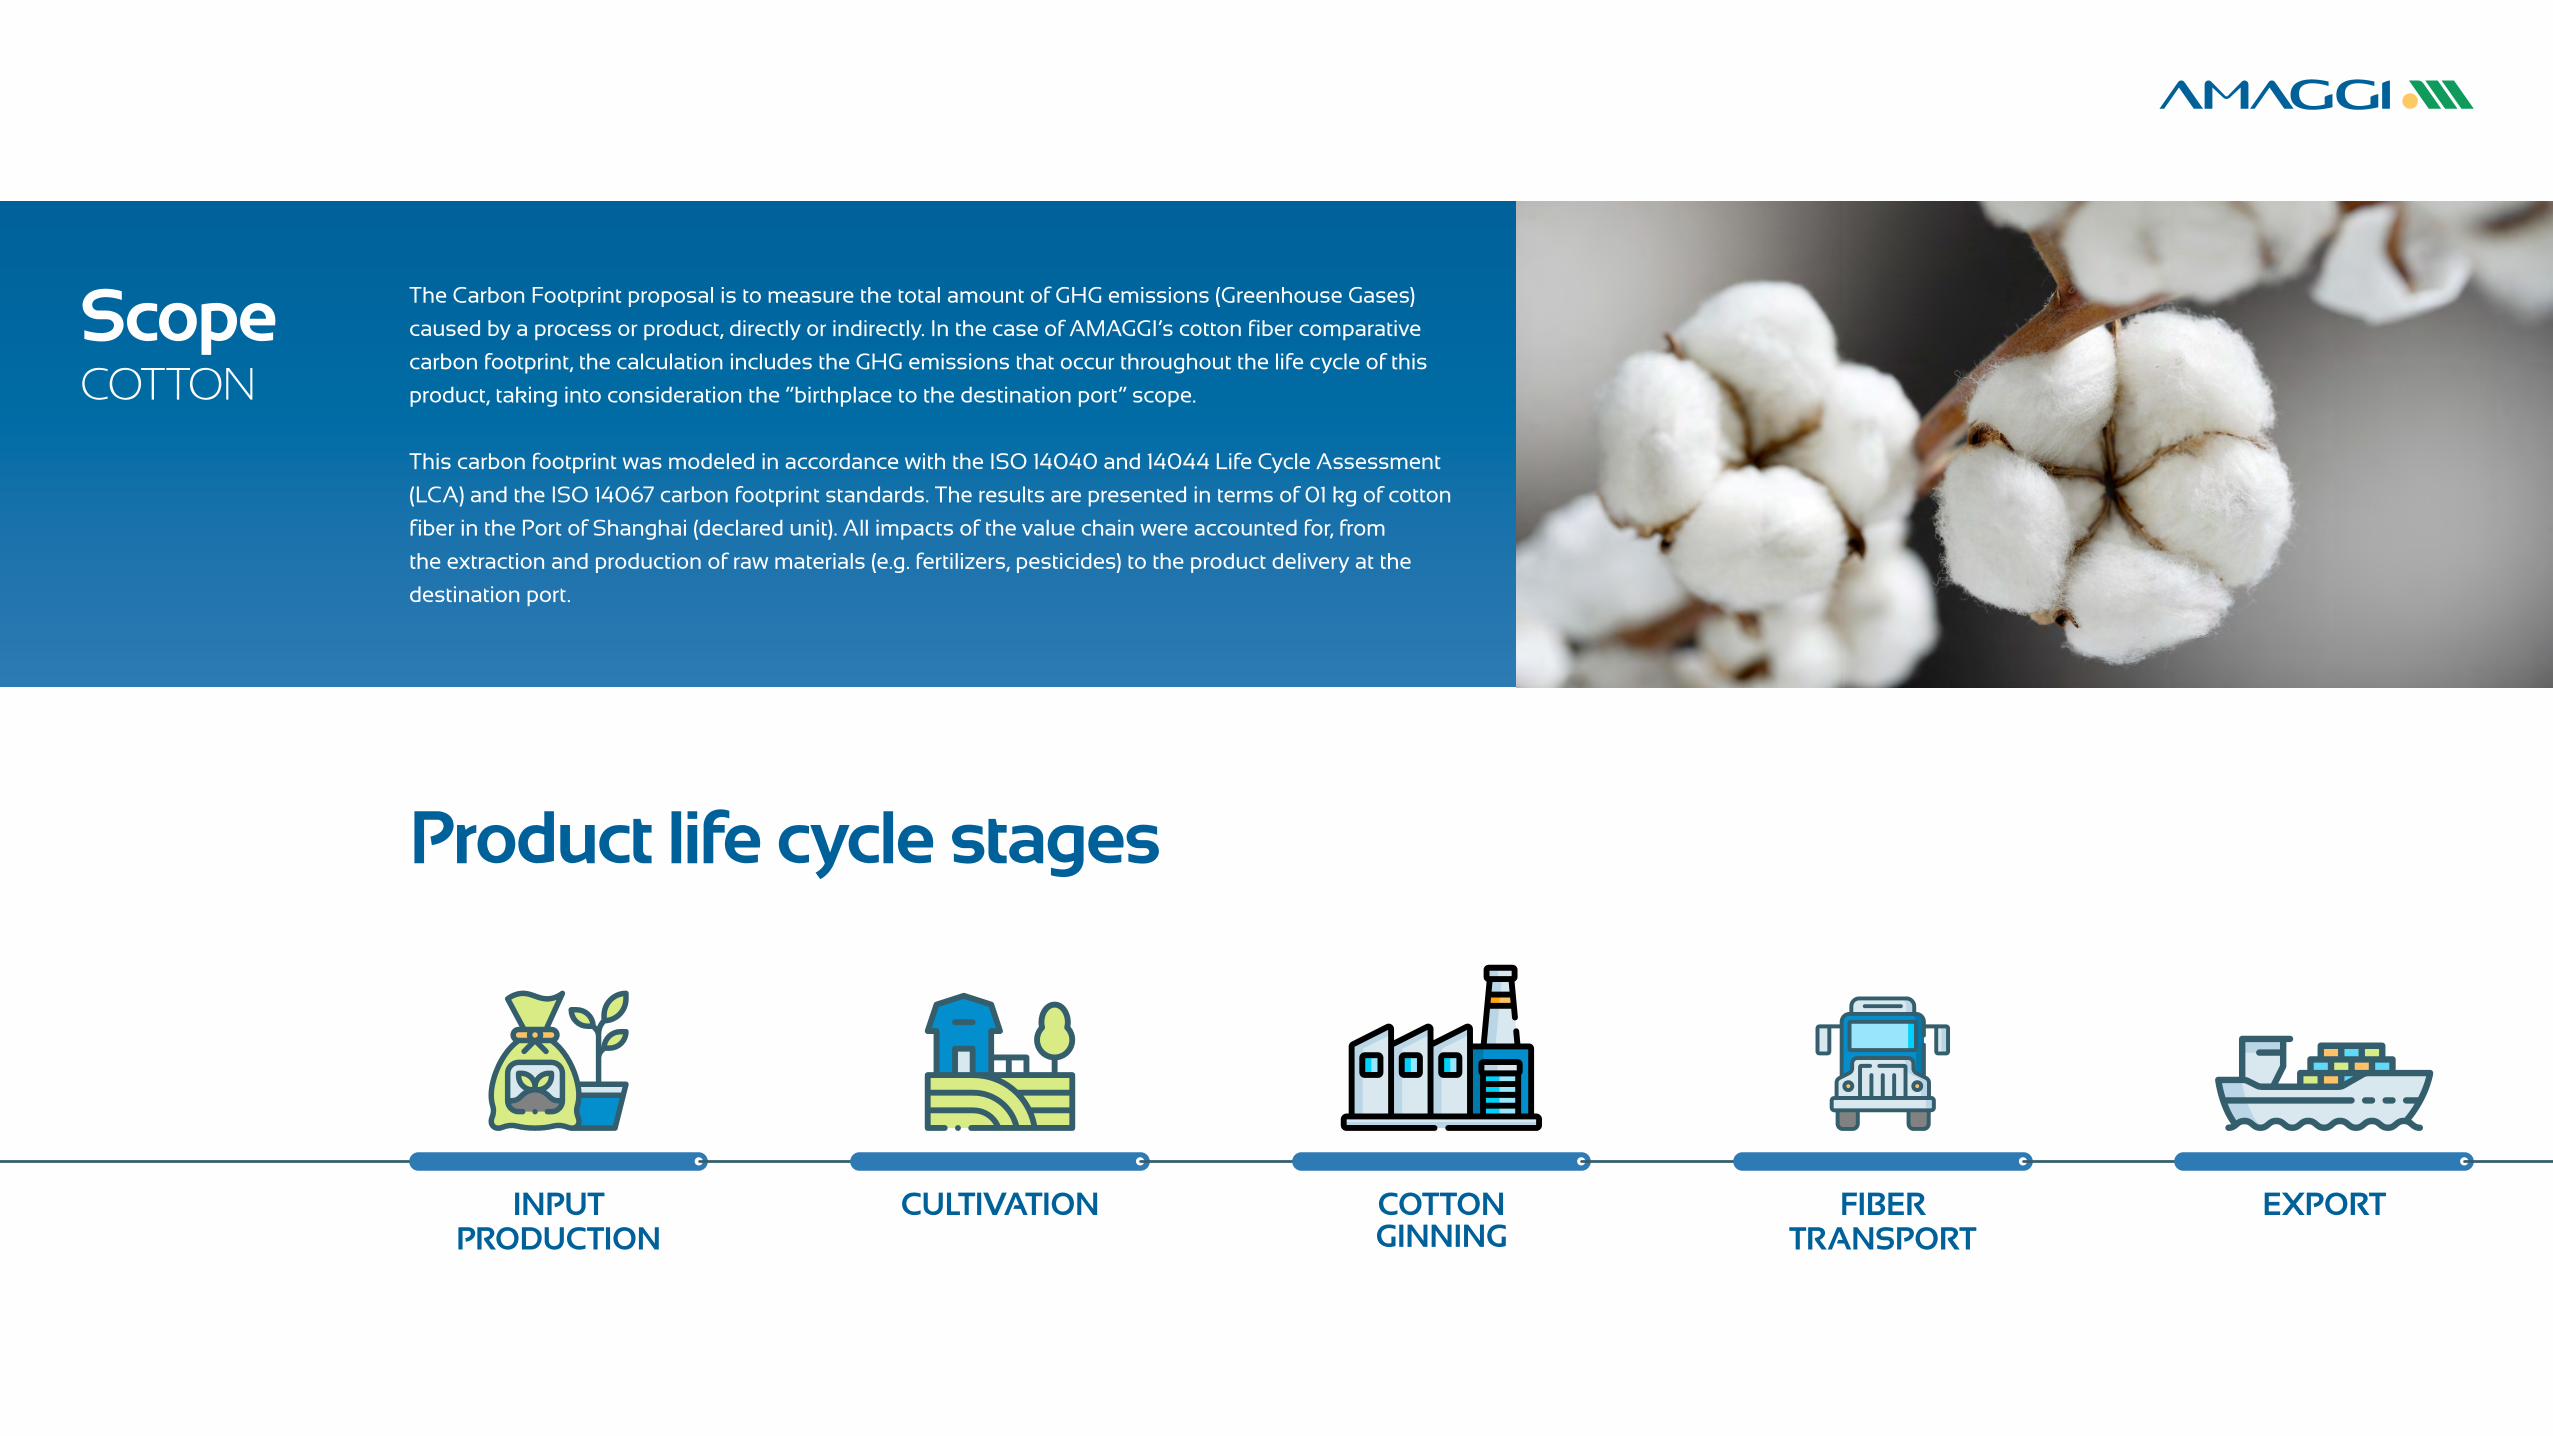
ScopeCOTTON
The Carbon Footprint proposal is to measure the total amount of GHG emissions (Greenhouse Gases)
caused by a process or product, directly or indirectly. In the case of AMAGGI’s cotton fiber comparative
carbon footprint, the calculation includes the GHG emissions that occur throughout the life cycle of this
product, taking into consideration the “birthplace to the destination port” scope.
This carbon footprint was modeled in accordance with the ISO 14040 and 14044 Life Cycle Assessment
(LCA) and the ISO 14067 carbon footprint standards. The results are presented in terms of 01 kg of cotton
fiber in the Port of Shanghai (declared unit). All impacts of the value chain were accounted for, from
the extraction and production of raw materials (e.g. fertilizers, pesticides) to the product delivery at the
destination port.
INPUTPRODUCTION
CULTIVATION COTTON GINNING
FIBER TRANSPORT
EXPORT
Product life cycle stages
INP
UT
PR
OD
UC
TIO
N
CU
LTIV
ATI
ON
CO
TTO
N
GIN
NIN
G
FIB
ER
TR
AN
SP
OR
T
EX
PO
RT
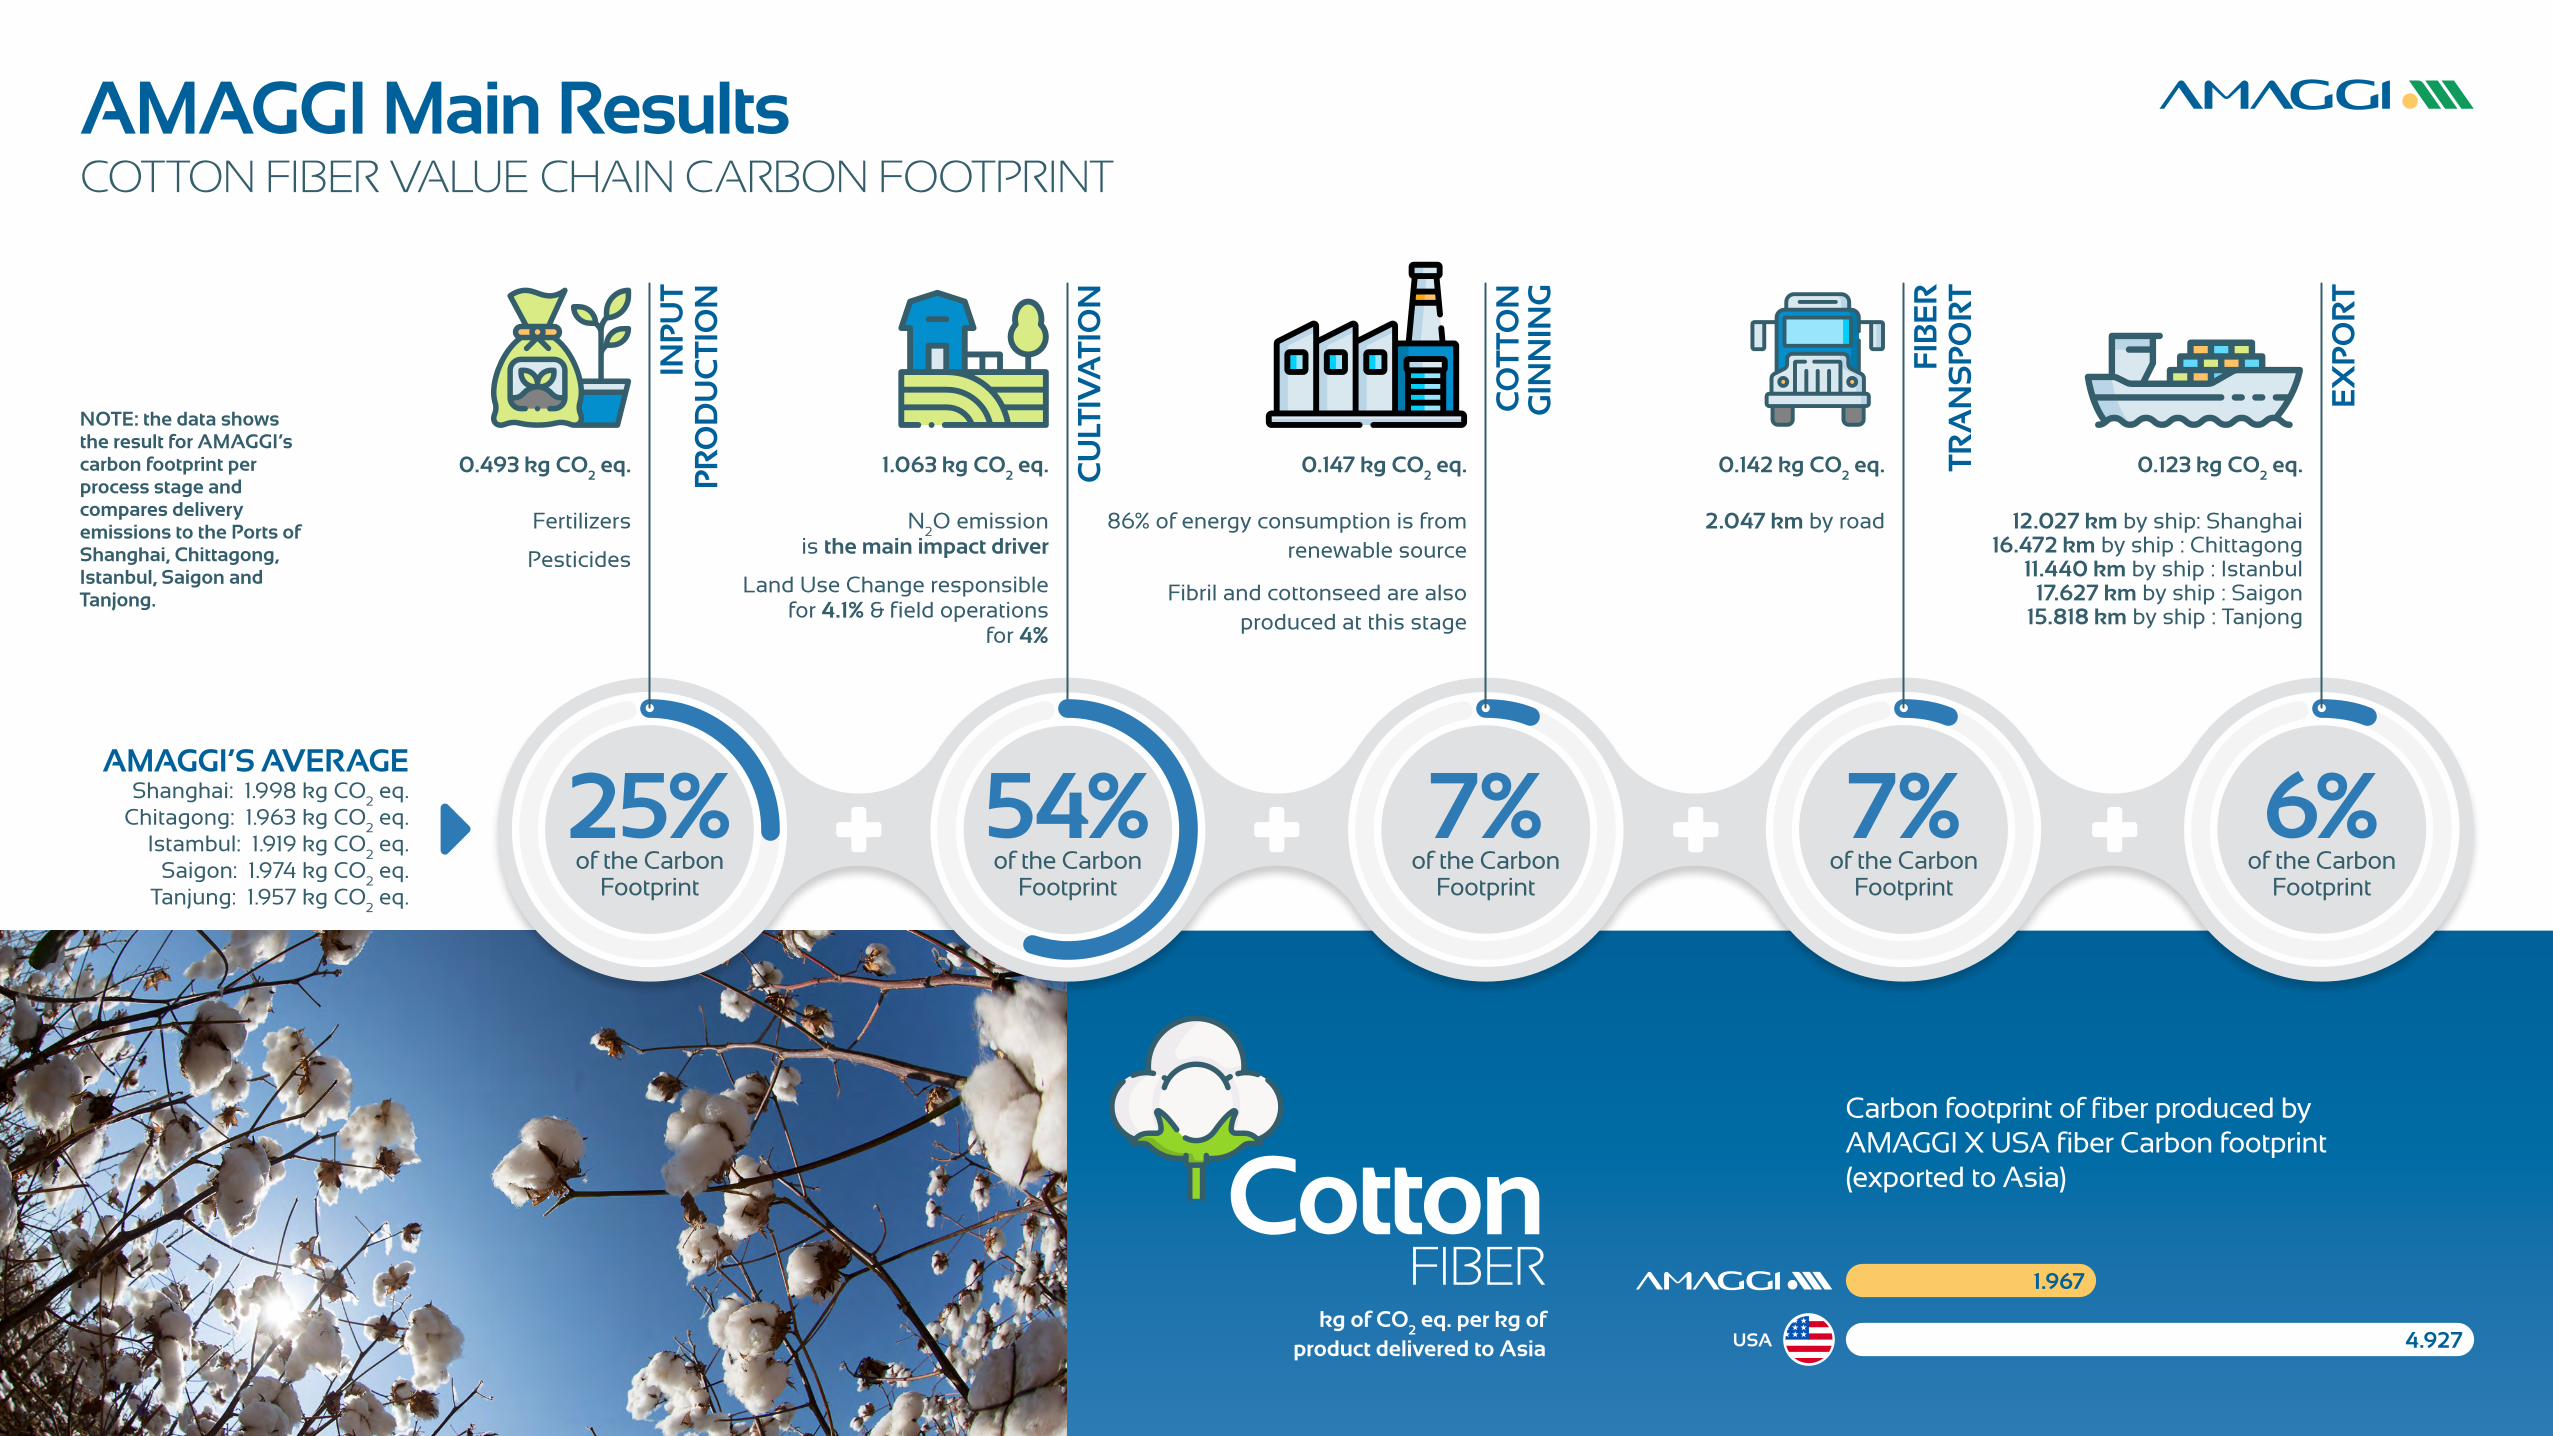
Fertilizers
Pesticides
AMAGGI’S AVERAGEShanghai: 1.998 kg CO
2 eq.
Chitagong: 1.963 kg CO2 eq.
Istambul: 1.919 kg CO2 eq.
Saigon: 1.974 kg CO2 eq.
Tanjung: 1.957 kg CO2 eq.
NOTE: the data shows the result for AMAGGI’s carbon footprint per process stage and compares delivery emissions to the Ports of Shanghai, Chittagong, Istanbul, Saigon and Tanjong.
N2O emission
is the main impact driver
Land Use Change responsible for 4.1% & field operations
for 4%
86% of energy consumption is from renewable source
Fibril and cottonseed are also produced at this stage
2.047 km by road 12.027 km by ship: Shanghai16.472 km by ship : Chittagong
11.440 km by ship : Istanbul 17.627 km by ship : Saigon
15.818 km by ship : Tanjong
0.493 kg CO2 eq. 1.063 kg CO
2 eq. 0.147 kg CO
2 eq.
kg of CO2 eq. per kg of
product delivered to Asia
0.142 kg CO2 eq. 0.123 kg CO
2 eq.
AMAGGI Main ResultsCOTTON FIBER VALUE CHAIN CARBON FOOTPRINT
Cotton FIBER
USA 4.927
1.967
25%of the Carbon
Footprintof the Carbon
Footprintof the Carbon
Footprintof the Carbon
Footprintof the Carbon
Footprint
54% 7% 7% 6%
Carbon footprint of fiber produced by AMAGGI X USA fiber Carbon footprint (exported to Asia)
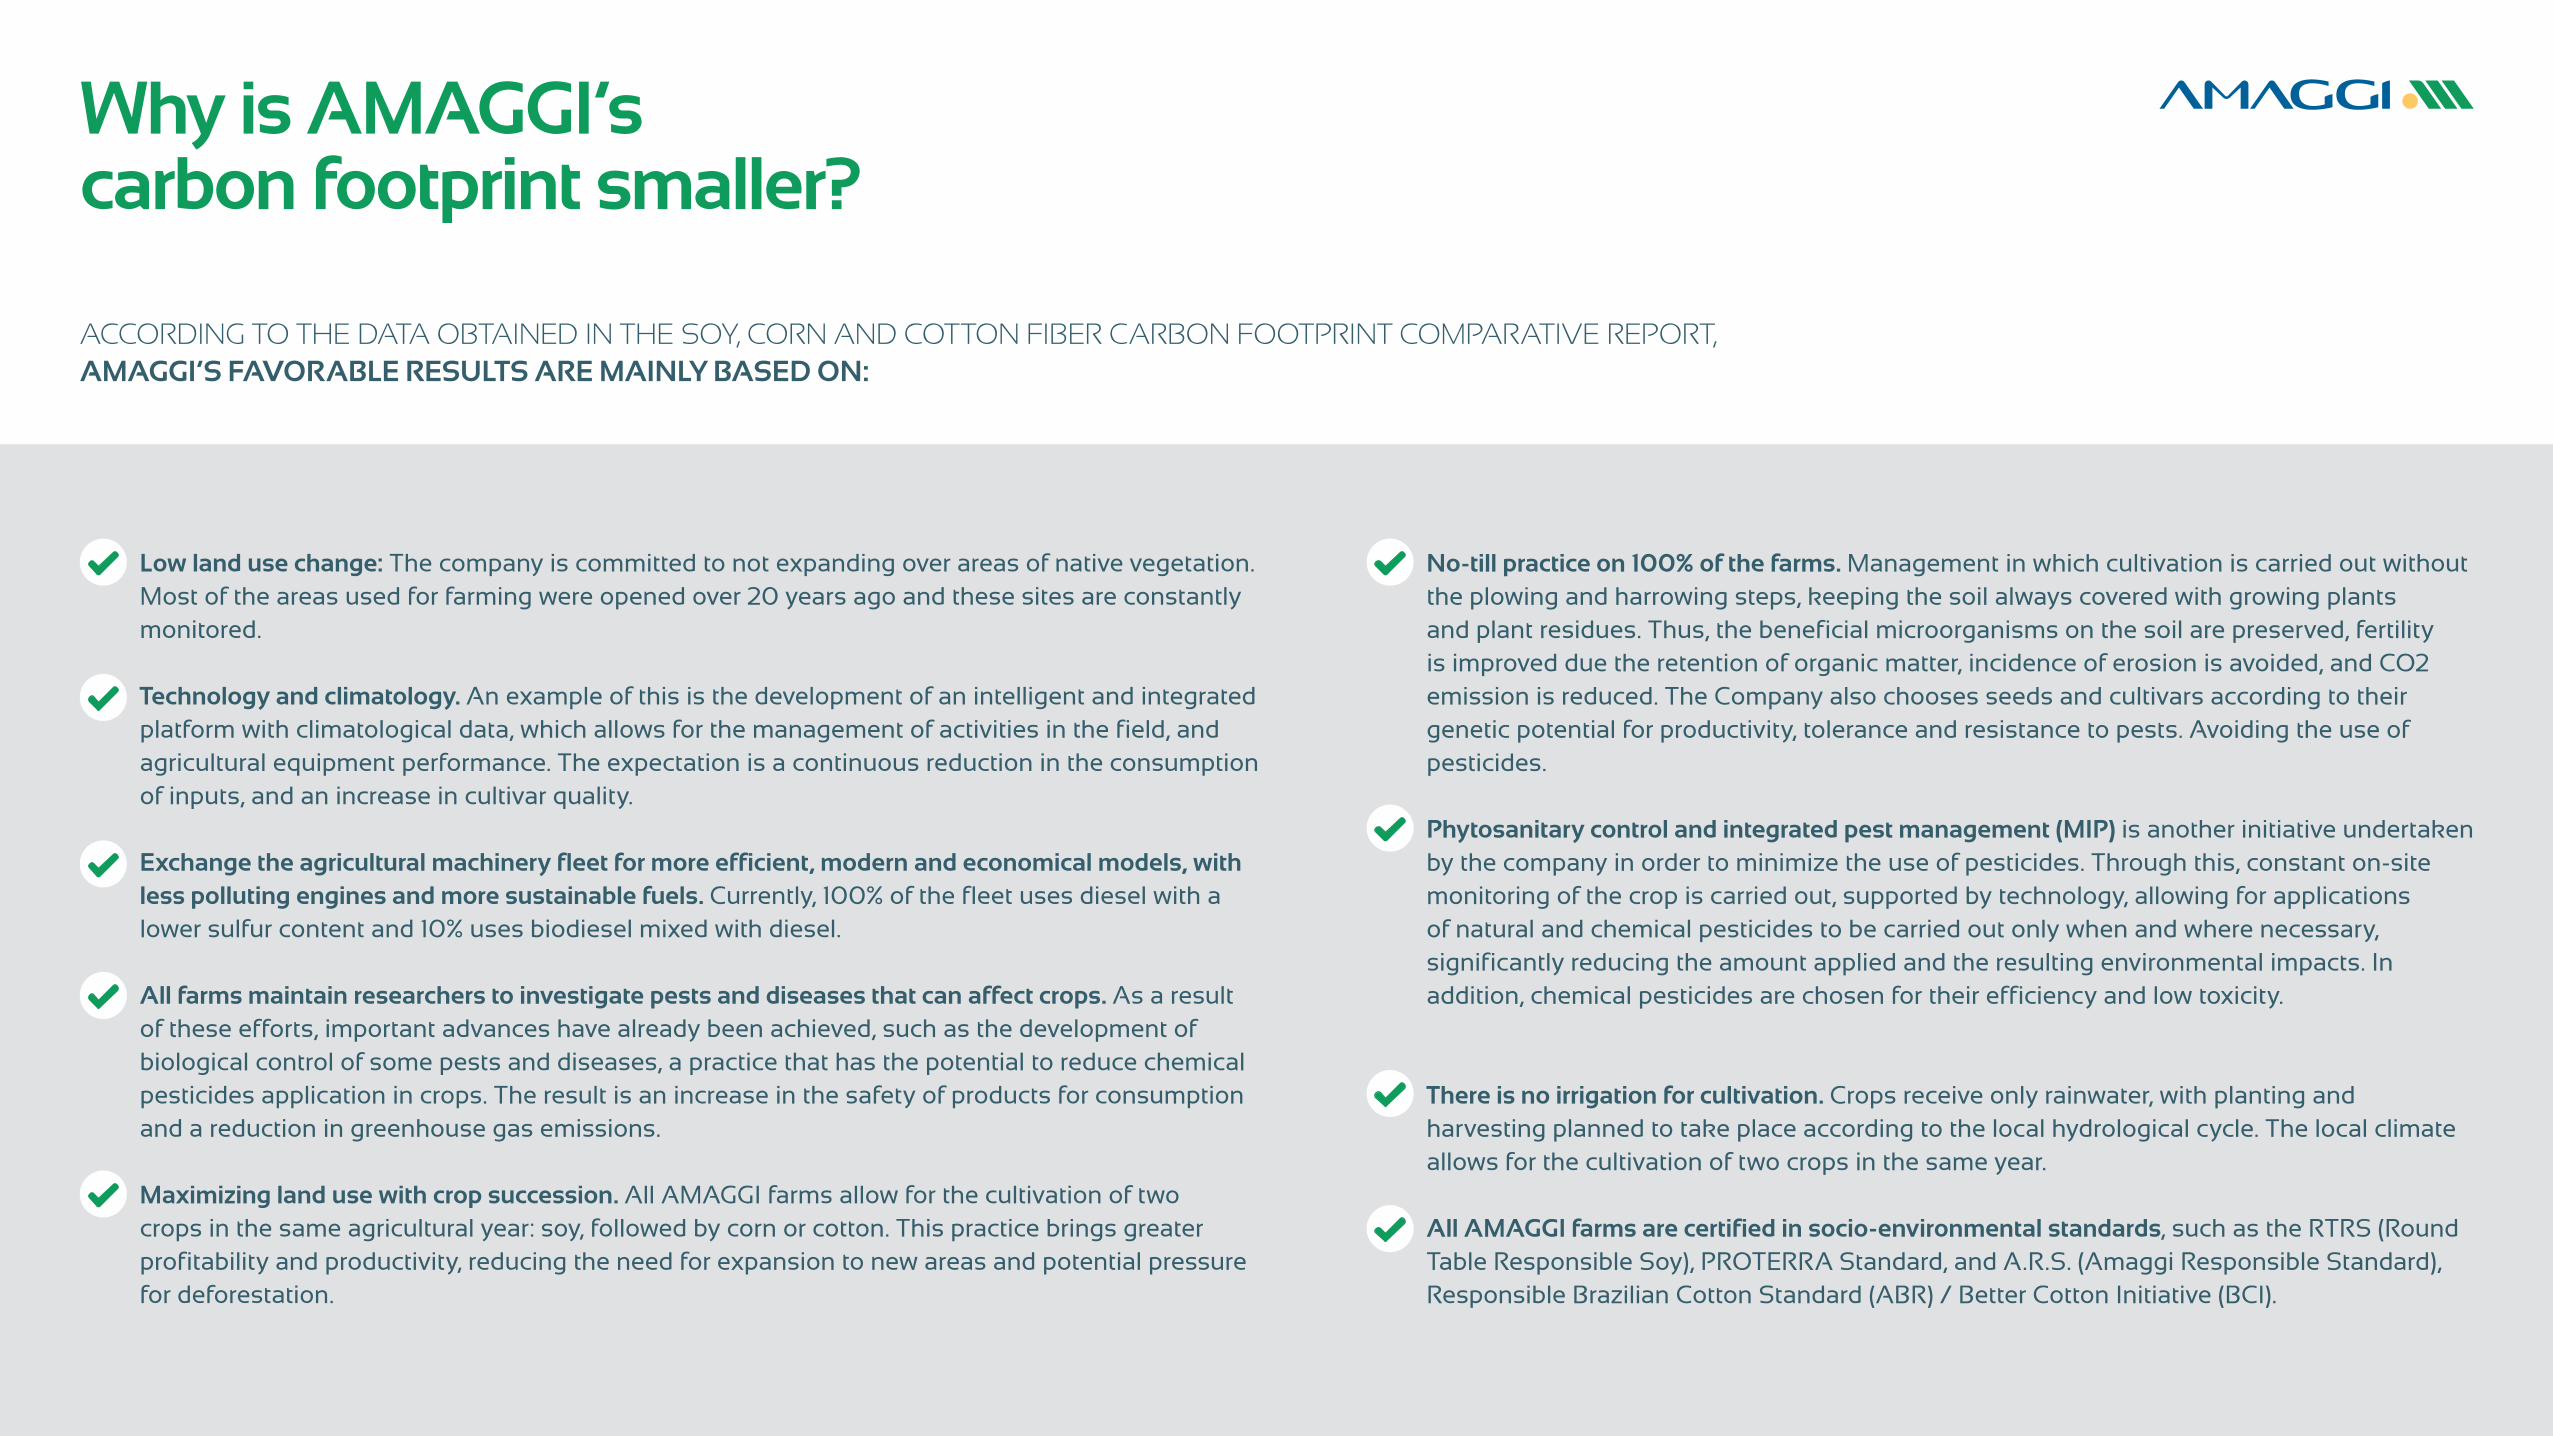
Why is AMAGGI’s carbon footprint smaller?
ACCORDING TO THE DATA OBTAINED IN THE SOY, CORN AND COTTON FIBER CARBON FOOTPRINT COMPARATIVE REPORT, AMAGGI’S FAVORABLE RESULTS ARE MAINLY BASED ON:
Low land use change: The company is committed to not expanding over areas of native vegetation. Most of the areas used for farming were opened over 20 years ago and these sites are constantly monitored.
Technology and climatology. An example of this is the development of an intelligent and integrated platform with climatological data, which allows for the management of activities in the field, and agricultural equipment performance. The expectation is a continuous reduction in the consumption of inputs, and an increase in cultivar quality.
Exchange the agricultural machinery fleet for more efficient, modern and economical models, with less polluting engines and more sustainable fuels. Currently, 100% of the fleet uses diesel with a lower sulfur content and 10% uses biodiesel mixed with diesel.
All farms maintain researchers to investigate pests and diseases that can affect crops. As a result of these efforts, important advances have already been achieved, such as the development of biological control of some pests and diseases, a practice that has the potential to reduce chemical pesticides application in crops. The result is an increase in the safety of products for consumption and a reduction in greenhouse gas emissions.
Maximizing land use with crop succession. All AMAGGI farms allow for the cultivation of two crops in the same agricultural year: soy, followed by corn or cotton. This practice brings greater profitability and productivity, reducing the need for expansion to new areas and potential pressure for deforestation.
No-till practice on 100% of the farms. Management in which cultivation is carried out without the plowing and harrowing steps, keeping the soil always covered with growing plants and plant residues. Thus, the beneficial microorganisms on the soil are preserved, fertility is improved due the retention of organic matter, incidence of erosion is avoided, and CO2 emission is reduced. The Company also chooses seeds and cultivars according to their genetic potential for productivity, tolerance and resistance to pests. Avoiding the use of pesticides.
Phytosanitary control and integrated pest management (MIP) is another initiative undertaken by the company in order to minimize the use of pesticides. Through this, constant on-site monitoring of the crop is carried out, supported by technology, allowing for applications of natural and chemical pesticides to be carried out only when and where necessary, significantly reducing the amount applied and the resulting environmental impacts. In addition, chemical pesticides are chosen for their efficiency and low toxicity.
There is no irrigation for cultivation. Crops receive only rainwater, with planting and harvesting planned to take place according to the local hydrological cycle. The local climate allows for the cultivation of two crops in the same year.
All AMAGGI farms are certified in socio-environmental standards, such as the RTRS (Round Table Responsible Soy), PROTERRA Standard, and A.R.S. (Amaggi Responsible Standard), Responsible Brazilian Cotton Standard (ABR) / Better Cotton Initiative (BCI).

/grupoandremaggi
/Amaggi.Brasil
/amaggi
www.amaggi.com.br