Embed Size (px)
Citation preview
THE WATER BALANCE AND CHEMICAL MASS LOADS AT THE ZORTMAN AND LANDUSKY MINES, MONTANA1
Thomas. J. Osborne2
Abstract. How well have generalized hydrologic models predicted infiltration and water quality impacts at hardrock mine sites? The mine water balances developed with site-specific data in this study gave greatly different results than ones based on regional data and general methods. The lined leach pads and seepage capture systems at the Zortman and Landusky mines allowed entire rock dumps and small drainage basins to be evaluated as huge lysimeters, enabling direct estimates of groundwater recharge and evapotranspiration. The average steady-state water balances, based on data from years 1997-1999, were calculated for 22 facilities/ basins on the 210-hectares Zortman Mine, and 36 facilities/ basins on the 580-hectares Landusky mine. Infiltration rates (as % of precipitation) calculated for, a) unreclaimed leach pads, b) pits, and c) reclaimed pads and rock dumps were 70.5 %, 56 %, and 45 %, respectively for the Zortman mine, and were 69%, 62% and 48.6%, respectively for the Landusky mine. The annual water budget for the two mines averaged: evapotranspiration 51.4%, infiltration 43.8 %, and surface runoff 4.8 %. The results of previous water budget estimates using more general methods gave results of approximately 81%, 5.0% and 14%, respectively. Based on the facility-specific water budgets, chemical mass loading models of both mines were developed to estimate the total loads of contaminants generated by all mine facilities, and evaluate the ultimate fate of the contaminants. Average annual loads of total dissolved solids, acidity, sulfate, nitrate, arsenic, selenium and seven cationic metals were calculated. Site-specific water balances are valuable tools for analysis of hydraulic and contaminant loading rates from various mine facilities and cover types. A check of the models with independent data showed that they should not be applied outside the period of record or hydrologic conditions for which they were developed, without further verification and calibration. Additional Key Words: Mine Hydrology, Infiltration, Water quality
__________________________
1Paper was presented at the 2003 National Meeting of the American Society of Mining and Reclamation, Billings MT, June 3-6, 2003. Published by ASMR, 3134 Montavesta Rd, Lexington, KY 40502.
2Thomas J. Osborne, Principal Hydrologist, HydroSolutions, Inc, Billings, MT 59102.
918
Background and Purpose
The Zortman and Landusky Mines are located two miles apart, in the Little Rocky Mountains
of north-central Montana (Figure 1). Both mines are near the southern boundary of the Fort
Belknap Indian Reservation in the southwest corner of Phillips County on a mixture of private
land and public land managed by the BLM. The Little Rocky Mountains are within the Northern
Great Plains geographic region, and are one of the "Island Mountain Ranges", so named because
they rise up out of the relatively flat plains like islands in an ocean. Emplacement of these
intrusive rocks mobilized and deposited elements such as gold in sufficient concentrations as to
make mining economically viable. The gold is hosted in the Cenozoic era igneous intrusive
syenite porphyry rock that lies in the core of the mountains (AMI, 1996). Sulfide mineralization
is associated with the gold deposits, and is the source of much of the water quality problems at
the mines.
The mines lie at the headwaters of a number of drainages that are tributaries to the Milk and
Missouri Rivers. Some drainage, such as Ruby Gulch and Montana Gulch are fed by perennial
or intermittent discharges from mine water treatment plants. Groundwater systems at the mines
occur in the syenite porphyry, with the flow system highly controlled by northeast trending shear
zones and associated fracture systems, and abandoned underground mine workings.
Groundwater also occurs in alluvial aquifers along drainages, and in Paleozoic era rocks flanking
the uplift, including limestones and sandstones.
From 1979 through 1998, Pegasus Gold Corporation and its wholly owned subsidiary,
Zortman Mining, Inc. (ZMI), operated the Zortman and Landusky Mines. While historic mining
activity has occurred in the area since the mid-1860s, the advent of cyanide heap leach
technology, combined with the sharp rise in gold prices, prompted the development of these
large-scale, open pit mining operations beginning in the late 1970s. Following preparation of an
Environmental Impact Statement (EIS), the Zortman and Landusky Mines were approved in
1979.
919
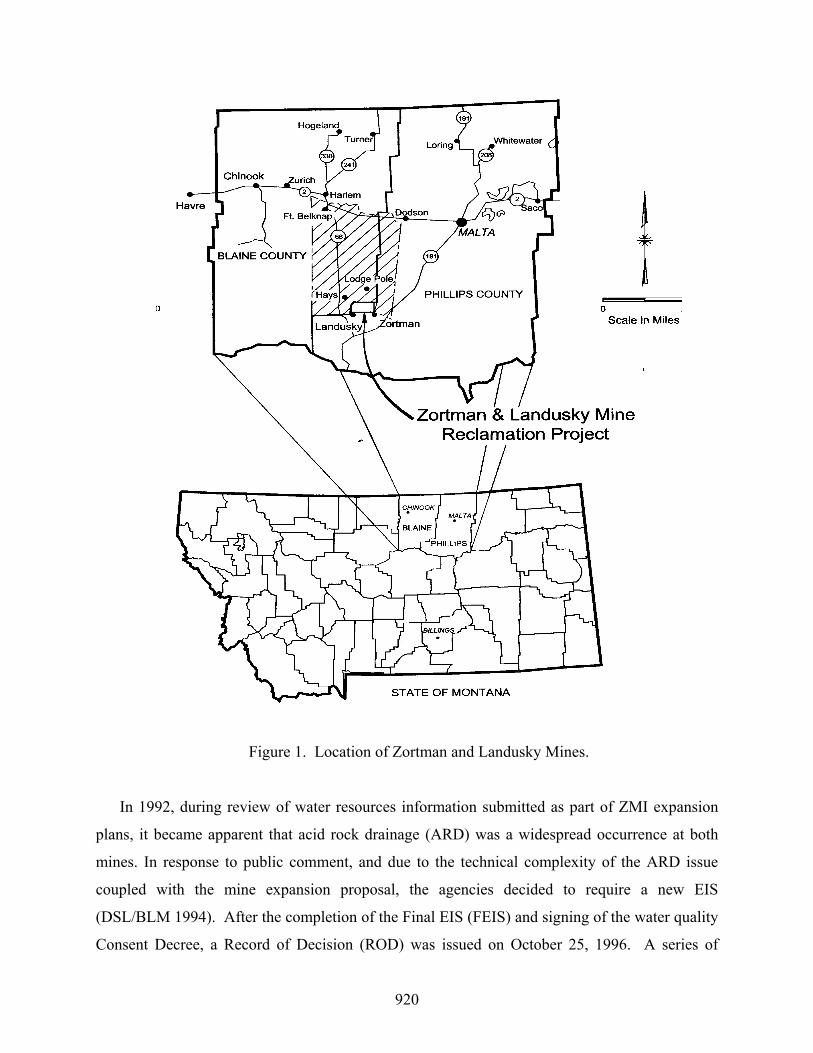
Figure 1. Location of Zortman and Landusky Mines.
In 1992, during review of water resources information submitted as part of ZMI expansion
plans, it became apparent that acid rock drainage (ARD) was a widespread occurrence at both
mines. In response to public comment, and due to the technical complexity of the ARD issue
coupled with the mine expansion proposal, the agencies decided to require a new EIS
(DSL/BLM 1994). After the completion of the Final EIS (FEIS) and signing of the water quality
Consent Decree, a Record of Decision (ROD) was issued on October 25, 1996. A series of
920

administrative orders, appeals, and lawsuits by the EPA and environmental groups over alleged
Clean Water Act violations ensued. In January 1998, Pegasus Gold Corporation and ZMI filed
for bankruptcy protection, and shortly thereafter announced they were going to reclaim and close
the mines. At the conclusion of the bankruptcy proceedings in January 1999, there were seven
surety bonds covering the Zortman and Landusky Mines totaling more than $67 million. A
Supplemental EIS completed in 2001 (BLM and MDEQ, 2001) examined six reclamation
alternatives for each of the mines, which ranged in cost from the existing bond amount up to
$170 million. The cost of the selected alternatives greatly exceed the available bonds, placing
great importance on evaluating the hydrologic and water quality implications of the reclamation
strategies.
A water balance is a quantitative accounting of all of the principal components of the water
cycle for a defined volume of earth materials or water body. A water balance accounts for
precipitation (P), evapotranspiration (ET), surface runoff (RO), infiltration to groundwater (IT),
and changes in storage. A chemical mass-loading model was developed that uses the results of
the water balance, along with water quality data, to produce estimates of the quantity of
chemicals or contaminants being transported or stored in various components of the water
balance. The water balances and chemical mass loading models for the Zortman (Spectrum et
al., 2000a) and Landusky (Spectrum et al., 2000b) mines were an important component of the
reclamation decision-making process, and produced some surprising results that contrasted
sharply with previous hydrology studies.
The water balances and contaminant loads at the Zortman and Landusky mines have been
evaluated in several previous studies. The FEIS (BLM, 1996) used HELP modeling to estimate
then current water and contaminant loads from mine facilities, and predict future loads under
various reclamation scenarios. Another hydrologic consultant (WMC, 1998) made estimates of
ET, RO and IT for mine facilities using generalized methods or the results of the FEIS. They
provided a water balance of the area on a drainage-by-drainage basis for existing conditions.
Most of these previous studies used precipitation data collected at the mines; however, estimates
of ET and IT were obtained from regional meteorological and hydrologic statistics, published
sources and the HELP modeling.
Since active mining ceased in 1996, and water capture systems were installed at seven
locations, an opportunity to collect and evaluate site-specific hydrologic information arose. The
921

Water Balance and Chemical Mass Loading Worksheets developed for the mines were used to
evaluate and prioritize reclamation plans designed to optimize hydrologic controls and water
quality outcomes. Simulations of changes in the water balance and chemical mass loading were
performed by adjustment of water balance components as predicted by specific reclamation
proposals. This paper summarizes the results of the mine water balance evaluations, and
compares these results to earlier studies that could only rely on regional data or generalized
hydrologic models.
Limitations
There are many limitations to the water balance and mass loading estimates presented here.
All the data available at the time were used to develop these estimates, and the models are
strictly applicable only to the period of record utilized. Calibration to independent data was not
performed, thus limiting the predictive value of the models. As more monitoring data from the
capture systems and leach pads become available, it may be feasible to test and calibrate more
general versions of the models.
Surface water runoff was indirectly calculated using the Curve Number Method. This
method was developed for undisturbed land and not directly applicable to mining disturbed land.
However, the calculated values were checked against actual runoff estimated from mine capture
systems, and were checked against measured stream runoff records from the mine.
The water balance was based on observations from the calendar years 1997, 1998, and 1999.
The average precipitation for these years was 56.8 cm, while the average precipitation over the
past thirty years was about 48.2 cm. Maximum and minimum annual precipitation for the past
thirty years was 74.5 cm and 27.3 cm, respectively. Thus, the period modeled is somewhat
wetter than average, but is within a standard deviation. In addition, the terrain is rugged and
precipitation could vary significantly within the mine sites. The water balance was designed so
that any value for annual precipitation can be input and the outputs would all be scaled
accordingly. As with any model, the validity can be stretched beyond its usefulness if the inputs
far exceed the development criteria.
The chemical loads were developed from monitoring locations that best represented each of
the sub-basins or mining facilities; however, ideal locations were not always available. Average
concentrations at each monitoring station were converted to contaminant loads by application of
922

the water balance results; however, average concentrations may not adequately represent actual
loading processes. The chemical mass-loading model includes the total input of contaminants.
The portion of the total loads from precipitation and the “natural background” are not isolated.
The loading model assumes that, once in the groundwater, sulfate and metals behave
conservatively within each modeled mine facility. Other assumptions are discussed below.
Methodology
Basic Water Balance Equation
The basic water balance equation for the mines is:
P = RO+ET+IT (1)
where, P = Precipitation, RO = Surface Water Runoff, ET = Actual Evapotranspiration, and IT =
Infiltration beyond the root zone, all expressed on an annual basis. It was assumed that the
annual change in groundwater and soil water storage was negligible, that all infiltration becomes
groundwater (except for lined leach pads), and that other groundwater or surface water inflows
are negligible. Additional study subsequent to this work demonstrated that groundwater storage
was accruing in the syenite aquifer during the period of the water balance. This suggests that
infiltration to groundwater was greater than indicated by the steady state water balance.
Based on the facilities at the mine, surface water runoff was allocated as follows:
923

* LAD- Land Application and Dis Infiltration was allocated as foll
Surface Water Runoff
Infiltration
Methods Surface Water Runoff
Total annual runoff was
precipitation records from the m
runoff values. The Curve Num
(SCS), now Natural Resource
precipitation, antecedent moist
equation is presented in many t
solved analytically. Runoff as
cover and slope descriptions.
(USDA, 1972). For each of t
Complete tables showing the
Runoff collected and routed to Water Treatment Plant or LAD*
Runoff diverted around or through the mine area.
Runoff that becomes groundwater recharge (e.g. Pit areas).
posal Area
ows:
Infiltration to Groundwater
to E
esti
ine
ber
Co
ure
exts
a pe
In a
hese
dail
Infiltration collected and routed to the water treatment plant (mine drainage, leach pads)
Infiltration collected and routed to the LAD (leach pads)
m
n
c
a
r
y
Infiltration collected and diverted around or through the mine area.
stimate Water Balance Components
ated by first computing daily runoff using the daily
stations and Curve Number Method, and summing the daily
Method was developed by the Soil Conservation Service
servation Service (NRCS), and uses the three variables:
ondition, and hydrologic soil-cover complex. The runoff
long with graphical solutions. In this case, the equation was
centage of the total precipitation was computed for six basic
ll situations, antecedent moisture condition II was assumed
six situations, a representative curve number was chosen.
precipitation and runoff (from January 1, 1997 through
924
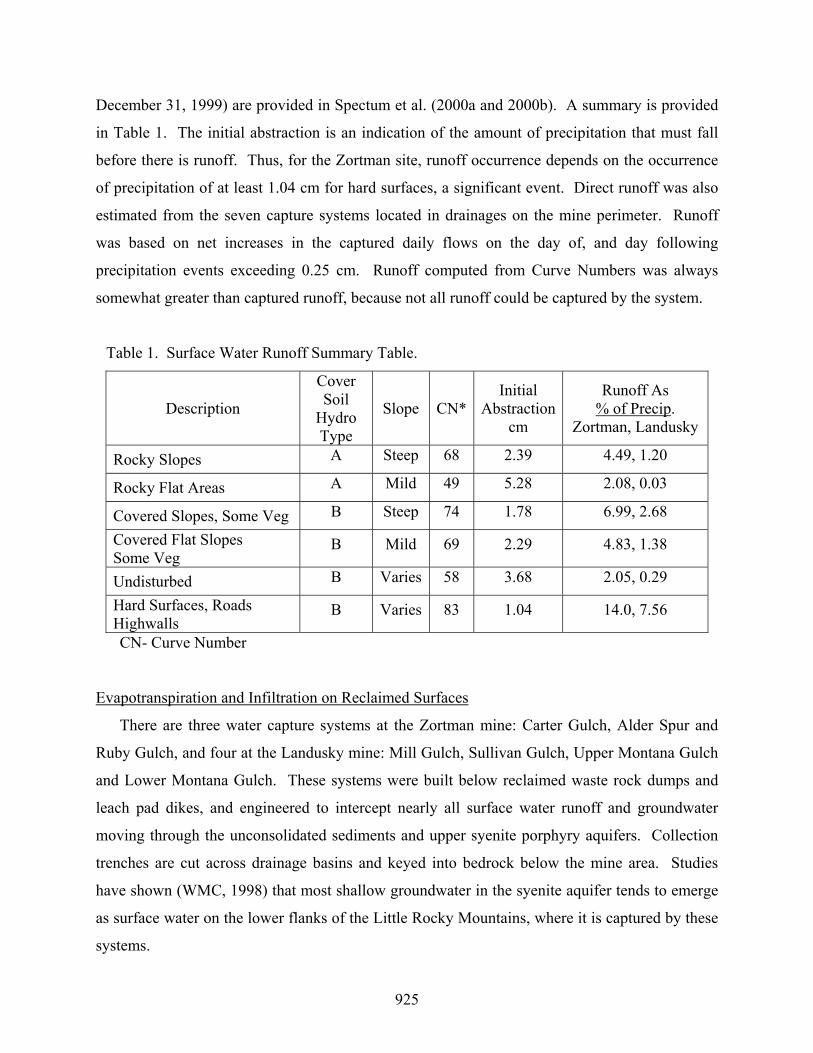
December 31, 1999) are provided in Spectum et al. (2000a and 2000b). A summary is provided
in Table 1. The initial abstraction is an indication of the amount of precipitation that must fall
before there is runoff. Thus, for the Zortman site, runoff occurrence depends on the occurrence
of precipitation of at least 1.04 cm for hard surfaces, a significant event. Direct runoff was also
estimated from the seven capture systems located in drainages on the mine perimeter. Runoff
was based on net increases in the captured daily flows on the day of, and day following
precipitation events exceeding 0.25 cm. Runoff computed from Curve Numbers was always
somewhat greater than captured runoff, because not all runoff could be captured by the system.
Table 1. Surface Water Runoff Summary Table.
Description
Cover Soil
Hydro Type
Slope CN*Initial
Abstractioncm
Runoff As % of Precip.
Zortman, Landusky
Rocky Slopes A Steep 68 2.39 4.49, 1.20
Rocky Flat Areas A Mild 49 5.28 2.08, 0.03
Covered Slopes, Some Veg B Steep 74 1.78 6.99, 2.68
Covered Flat Slopes Some Veg
B Mild 69 2.29 4.83, 1.38
Undisturbed B Varies 58 3.68 2.05, 0.29
Hard Surfaces, Roads Highwalls
B Varies 83 1.04 14.0, 7.56
CN- Curve Number
Evapotranspiration and Infiltration on Reclaimed Surfaces
There are three water capture systems at the Zortman mine: Carter Gulch, Alder Spur and
Ruby Gulch, and four at the Landusky mine: Mill Gulch, Sullivan Gulch, Upper Montana Gulch
and Lower Montana Gulch. These systems were built below reclaimed waste rock dumps and
leach pad dikes, and engineered to intercept nearly all surface water runoff and groundwater
moving through the unconsolidated sediments and upper syenite porphyry aquifers. Collection
trenches are cut across drainage basins and keyed into bedrock below the mine area. Studies
have shown (WMC, 1998) that most shallow groundwater in the syenite aquifer tends to emerge
as surface water on the lower flanks of the Little Rocky Mountains, where it is captured by these
systems.
925

Daily records of precipitation were available for each mine site. Daily records were also
available for the volume of water pumped from each of the capture systems. This enabled
estimates of infiltration, and that portion of direct runoff collected by the capture system, to be
made directly. The evapotranspiration rate was calculated by difference. One system, Alder
Spur, had indications that there is an "irreducible baseflow" component to the annual
hydrographs of the capture system pumpage. The source of this baseflow could not be
determined, but may have been related to flow from old underground mine workings or the shear
zone and associated fracture system. The baseflow was subtracted from the IT component prior
to estimating the evapotranspiration.
Evapotranspiration and Infiltration on Unreclaimed Surfaces Gold was extracted from the ore through the cyanide heap leach process. The leach pads are
large piles of coarse rock, enveloped in a PVC liner. At the time of this study, most leach pads
were unreclaimed and devoid of vegetation. Essentially all infiltration is trapped and moves
downward to the saturated zone. Large diameter wells (sumps) are fitted with pumps for
extracting leach pad solution, which (in the absence of gold recovery) is pumped to the water
treatment plant or the land application area. A running inventory of leach pad solution levels and
volumes is kept. The difference in volume from time to time, in the absence of pumping, can be
taken as the amount of infiltration reaching the saturated zone in the pad. Given the precipitation
and infiltration, an estimate can be made of the evapotranspiration plus runoff, or:
P-IT = ET+RO (2).
Total runoff was estimated by the Curve Number Method discussed above, after which
evapotranspiration was determined by difference.
Evapotranspiration and Infiltration on Undisturbed Areas
Actual evapotranspiration as a percentage of the total precipitation for undisturbed areas was
estimated based on data from the reclaimed areas discussed above, particularly from capture
systems with a greater proportion of undisturbed area. It was reasoned that since the slopes were
similar, but the undisturbed areas have more mature vegetation and ground cover, that ET would
926

be somewhat greater for undisturbed areas than for reclaimed areas. Runoff was calculated via
the Curve Number method, as above, with IT being estimated by difference.
Evapotranspiration and Infiltration on Roads, Shop and Other Hard Surfaces
Actual evapotranspiration as a percentage of the total precipitation for these areas was
estimated based on likely differences between these hard areas and the other areas already
estimated. Runoff was estimated as above, with IT being determined by difference.
The water balance components were computed as percentages of the average precipitation for
the period of study, and aggregated into a "Water Allocation Criteria" table for each mine.
These criteria were spatially varied over the mine, consistent with the status of land cover at that
time. The criteria were assumed to be time-invariate, and thus steady state. The Water
Allocation Criteria for the two mines is provided in Table 2.
Mine Surface Drainage and Basin Areas
Building on previous mine studies (Harvey and Gallagher, 1996), 22 facilities/sub-basin
areas were mapped on the 210-hectares (ha) Zortman Mine, and 36 facilities/ sub-basins on the
580-ha Landusky mine. Drainage divides, surface water runoff channels, and other drainage and
erosion structures were field checked in detail. Principal mine facilities, such as leach pad liners,
pits, dikes, topsoil piles, and waste rock dumps were also meticulously defined in order to
partition the drainage basins into relatively homogeneous sub-areas. Maps of drainage basins
and principal facilities for the Zortman and Landusky Mines are provided in Figures 2 and 3,
respectively.
Surface water drainage basins and mine facility boundaries were used to subdivide the
Zortman mine. Groundwater basins were believed to be reasonably congruent with surface water
basins. The basin areas were delineated and named based on the facility or dominant land cover
type, and lowest order, named receiving stream. The pit areas, which have no external surface
water runoff, are internal basins. Nearly all surface water captured within the pit areas infiltrates
to groundwater. All leach pads are also internally drained, and designated as: L- (year
constructed).
927

Table 2. Water Allocation Criteria for the Zortman and Landusky Mines.
Percentages of Annual Precipitation
Zortman, Landusky Mine Facility or
Land Cover Type Liner
Leakage Runoff Evapo-
Transpiration Infiltration Unreclaimed Leach Pads 2.5, 1.0 27, 30 Runoff Conducive Areas 4.5, 1.2 25, 29.8 Runoff Prohibitive Areas
0, 0
0.8, 0.1 28.7, 30.9
70.5, 69
Reclaimed Leach Pads 6.3, 2.4 49, 49 Runoff Conducive Areas 7, 2.7 48.3, 48.7 Runoff Prohibitive Areas
0, 0
4.8, 1.4 50.5, 50
44.7, 48.6
Reclaimed Rock Dumps/ Other Areas 6.3, 2.4 49, 49 Runoff Conducive Areas 7, 2.7 48.3, 48.7 Runoff Prohibitive Areas 4.8, 1.4 50.5, 50
44.7, 48.6
Mill Gulch Reclamation Cover (Landusky only) 2.4 66.5 31.3 Undisturbed Areas 2.1, 0.5 65, 75 32.9, 24.5 Regraded/Topsoiled - Little Veg 9, 4.5 46.3, 46.9 Runoff Conducive Areas 10.5, 5.3 44.8, 46.1 Runoff Prohibitive Areas 7.2, 3.6 48.1, 47.8
44.7, 48.6
Pits 14, 8 30, 30 56, 62 Roads, Shop, Other Hard Surfaces 14, 8 56, 55 30, 37
A more complicated groundwater flow system exists at the Landusky Mine site. Unlike at the
Zortman Mine, surface water basins could not be used as the basic watershed unit. Groundwater
basins were defined for each capture system, based on factors including site geology, pre-mining
topography, the potentiometric surface map, and annual volume of water reporting to each
discharge point. A requirement was that the sum of the discharges from the groundwater basins
928

Figure 2. Zortman Mine Facilities and Drainage Basins.
had to equal the net recharge predicted over all the mine facilities. Landusky water treatment
plant flow records were used to estimate the amount of captured and uncaptured water leaving
the mine site (HSI and Gallagher, 2001).
Water Origination and Disposition Estimate Once the sub-basins were mapped and water allocation criteria evaluated for the principal mine
facilities and cover types, a detailed accounting of the origins and final dispositions of water on
the mine was performed utilizing a large spreadsheet (Spectrum 2000a and 2000b, and HSI and
929

Figure 3. Landusky Mine Facilities and Drainage Basins.
Gallagher, 2001). Each sub-basin of the mine was partitioned into the appropriate facilities and
land cover types. These components were then distributed into the following four EPA mine
classification zones: Unclassified Zones, Storm Water Zones, Mine Drainage Zones and Process
Water Zones. Finally, the appropriate water allocation criteria were multiplied by each sub-basin
930

component to give the distribution of average annual precipitation for ET, RO and IT, by sub-
basin facility or land cover type. Where several sub-basins contained multiple facilities or cover
types, an area- weighted average was computed for the entire sub-basin.
Depending on the facility design or water controls, IT was allocated either to the
groundwater (GW), to the water treatment plant (WTP), or to the land application disposal area
(LAD). RO was allocated either to GW, the WTP, or to the surface water flow off the mine area.
The various allocations of RO were estimated for each basin by observation and in consultation
with mine personnel and other knowledgeable persons.
Results of Water Balance Study
A summary of the principal water balance components for each mine are provided in Figure
4. A chart depicting a more detailed disposition of the infiltration and runoff components as
recruited by the mine facilities, or uncaptured, is shown in Figure 5.
Zortman Mine Water Balance
The water balance model of the Zortman Mine indicated that, of the total precipitation input
(56.8 cm):
ET = 47.9% •
•
•
•
•
•
•
•
RO = 8.1%, and
IT = 44.0%.
Of the infiltration component:
10.0% was recharge to leach pads, which was routed to the Goslin Flats LAD,
27.2% was recruited by the capture systems and sent to the Zortman water treatment
plant,
3.8% was off-site groundwater flow, and
3.3% was increased groundwater in storage and/or residual error of the method.
Of the surface runoff:
5.2% was recruited by the capture systems,
931

2.6% runs off-site, and •
• 0.3% is a residual of the method.
The capture systems and leach pads combined, collected 84% of the total groundwater
discharge and about 67% of the total surface runoff from the mine site. Groundwater monitoring
from the early-1990's through the present has shown a net increase in the groundwater level
within the Zortman Mine shear zone of about eight feet per year, leveling off in 2000. This
suggests that with unreclaimed conditions, average precipitation and recharge rates may be
greater, and/or evapotranspiration rates lower than estimated in the steady state water balance.
0.0
5.0
10.0
15.0
20.0
25.0
30.0
35.0
ET TotalIT
TotalRO
cm
0%
10%
20%
30%
40%
50%
60%
70%
80%
90%
100%
Zortman
ZortmanLandusky
Landusky
Columns- Water Depth, cm Lines & Points- Percentage of Total Annual Precipitation
Figure 4. Annual Water Balance for Zortman and Landusky Mines.
Infiltration rates (as % of precipitation) calculated for unreclaimed leach pads, pits, and
reclaimed leach pads and rock dumps were 70.5 %, 56 % and 45 %, respectively. These rates are
932
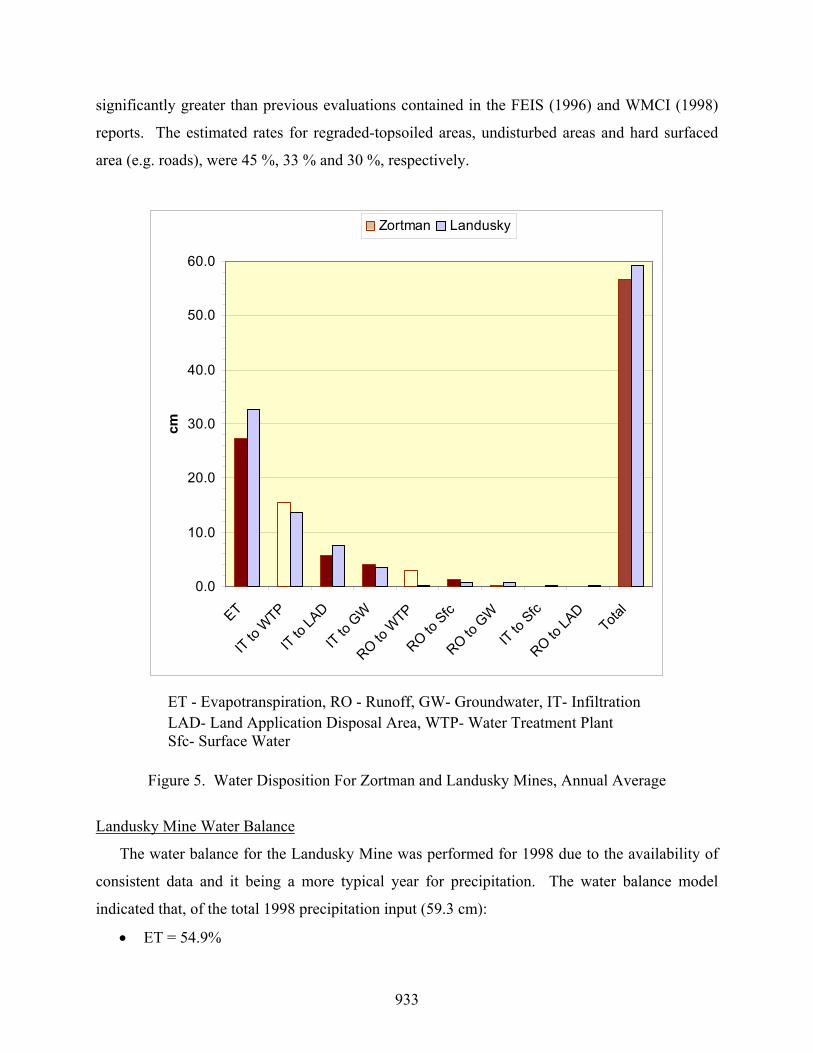
significantly greater than previous evaluations contained in the FEIS (1996) and WMCI (1998)
reports. The estimated rates for regraded-topsoiled areas, undisturbed areas and hard surfaced
area (e.g. roads), were 45 %, 33 % and 30 %, respectively.
0.0
10.0
20.0
30.0
40.0
50.0
60.0
ET
IT to W
TP
IT to LA
D
IT to G
W
RO to W
TP
RO to Sfc
RO to G
W
IT to Sfc
RO to LA
DTota
l
cm
Zortman Landusky
ET - Evapotranspiration, RO - Runoff, GW- Groundwater, IT- Infiltration LAD- Land Application Disposal Area, WTP- Water Treatment Plant Sfc- Surface Water Figure 5. Water Disposition For Zortman and Landusky Mines, Annual Average
Landusky Mine Water Balance
The water balance for the Landusky Mine was performed for 1998 due to the availability of
consistent data and it being a more typical year for precipitation. The water balance model
indicated that, of the total 1998 precipitation input (59.3 cm):
• ET = 54.9%
933
• RO = 2.1%, and
• IT = 43.0%.
Of the infiltration component:
• 12.6% was recharge to leach pads, which was routed to the Goslin Flats LAD,
• 23.1 % was recruited by the capture systems and sent to the Landusky water treatment
plant, and
• 7.3 % was off-site groundwater discharge.
Of the surface runoff:
• 0.5 % was recruited by the capture systems or leach pads, and
• 1.6 % runs off-site.
The capture systems and leach pads combined, collected 84% of the total groundwater
discharge and about 15.7% of the total surface runoff from the mine site. Infiltration rates (as %
of precipitation) calculated for unreclaimed leach pads, pits, and reclaimed leach pads and rock
dumps were 69%, 62% and 48.6%, respectively. These rates are significantly greater than
previous evaluations contained in the previous water balance studies of these mines. A lower
rate of 31.1% was obtained for the Mill Gulch Waste Rock Dump due to the use of a
geosynthetic liner and thicker soil cover employed at this site. The estimated rates for regraded-
topsoiled areas, undisturbed areas and hard surfaced areas, were 48.6%, 24.5% and 37%,
respectively.
Water Balance Checks
Some components of the computed water balance were checked against the known outflows
from the Zortman and Landusky water treatment plants for the period of the water balances.
Although not an entirely independent check, it indicates how well the models reproduced one
major output component. The check of the Zortman average water treatment plant flow
produced a residual of 44,300 m3, representing 11.4% of the actual WTP flow, and 3.7% of the
average mine-wide precipitation volume. A similar check of the Landusky water balance gave a
residual of –13,600 m3, representing about 1.7% of the WTP flow, and 0.4% of average mine-
wide precipitation volume.
934

An independent check of the water balance models using the flow in capture systems from
2000 was also performed. The total flow at each of the three capture systems at the Zortman
mine for 2000 were compared to the respective flows predicted by the Zortman mine water
balance model in Table 3.
Table 3. Actual and predicted capture system flows for the Zortman Mine, 2000.
Alder Spur
(m3 x 1000)
Carter Spur
(m3 x 1000)
Ruby Gulch
(m3 x 1000)
Actual 2000 18.2 25.0 136.7
Predicted by Water Balance (m3 x 1000) 15.1 27.6 261.2
Difference (m3 x 1000) -3.1 2.6 124.5
% Difference -17% 10% 91%
The precipitation in 2000 was over 5 cm below normal. The predicted flows were too high
for Carter and Ruby Gulches, and too low for Alder Spur. The flow was greatly over-predicted
in Ruby Gulch for reasons not understood. Water balance data collected over a series of years
would assist in the evaluation of the factors involved. However, it is likely that the flow to the
capture systems is not a linear function of precipitation. As annual precipitation declines,
evapotranspiration amounts to an ever-greater percentage of the total water balance. The pattern
of precipitation has a significant influence as well. If a greater percentage of total precipitation
falls during mid-summer months, more will be evapotranspired due to higher ambient
temperatures and more mature vegetative development.
The total flow at two of the four capture systems at the Landusky mine for 2000 were
compared to the respective flows predicted by the Landusky mine water balance model in Table
4. Water management at the other two capture systems changed greatly in 2000, and data were
not comparable to pervious years.
935

Table 4. Actual and predicted capture system flows for the Landusky Mine, 2000.
Mill Gulch
(m3 x 1000)
Sullivan Gulch
(m3 x 1000)
Actual 2000 69.3 10.6
Predicted by Water Balance (m3 x 1000) 52.6 25.7
Difference (m3 x 1000) -16.7 14.7
% Difference -24% 138%
The Landusky mine precipitation in 2000 was nearly 13 cm below the short-term average
available for the site, and 17.3 cm less than that in 1998, the year used to develop the Landusky
Water Balance Model. The predicted flow was low in Mill Gulch and much too great in Sullivan
Gulch. Reasons for the discrepancies probably include those described above for the Zortman
Mine. Sullivan Gulch is one of the smallest drainages at either mine, and model parameters are
likely more sensitive
Based on the above application of the mine water balances to year 2000 data, it is apparent
that the model criteria would have to be adjusted, and possibly additional criteria developed, to
obtain an acceptable fit to observed data for generalized use. The models were developed using
years of average to above-average precipitation, and are not likely to produce reliable results for
drier than average years, as demonstrated by year 2000 data. Since, however, infiltration is
disproportionately greater in wet years, and reclamation is designed for such periods, use of the
existing model was appropriate for the reclamation cover assessment.
Comparison of Water Balance Methods
The results of the on-site water balance can be compared to that developed in a previous
comprehensive hydrologic study of the Zortman and Landusky mines (WMC, 1998), before the
capture system and leach pad monitoring data were available. The WMC report used
precipitation data from the mines, and ET results from HELP modeling done for the FEIS
(1996). These studies produced ET estimates for unreclaimed land, reclaimed land and native
surfaces as, 42.1%, 65.4% and 84.2%, respectively. RO was estimated using area-discharge
936

relationships developed from regional USGS stream gauging station data. IT was estimated by
difference, based on the above parameters, and with distinctions among liner seepage, process
water capture and net groundwater recharge. The study provided a water balance of the area on a
drainage-by-drainage basis for average conditions. Since there were differences in basin areas
and other details, the results from the WMC report were interpreted to obtain the best alignment
with the framework of this study. The comparison of this study and the WMC report are
summarized in Table 5.
Table 5. Comparison of Zortman and Landusky Mines Water Balance Using Site Data
Versus Generalized Methods.
Site Data Approach General Methods
Approach ** Zortman Mine Landusky Mine Average Average Precipitation 100.0% 100.0% 100.0% 100.0% ET 47.9% 54.9% 51.4% 81.3% Runoff 7.8% 1.9% 4.8% 13.6% Infiltration- Recharge 44.3% 43.3% 43.8% 5.1% Totals 100.0% 100.1% 100.0% 100.0%
Net GW Recharge* 34.3% 30.7% 32.5% 2.9% * Excludes Leach Pads ** WMC, 1998
A very significant difference is apparent between the methods. In fact, the generalized
method produced net groundwater recharge rates an order of magnitude lower than this study.
Correspondingly, the generalized method gave significantly higher estimates of
evapotranspiration and surface water runoff. Although there are limitations to the comparison
due to use of differing basin areas and time periods, the use of generalized methods and regional
data do not provide a sufficiently accurate hydrologic model for making costly mine reclamation
decisions.
937

Chemical Mass Loading Evaluation
The usefulness of a site-specific water balance model is demonstrated through its application
to chemical mass loading calculations. Chemical mass loading models of both mines were
developed to estimate the total loads of contaminants generated by all mine facilities, and
evaluate the fate of the contaminants. Average concentration of chemical constituents monitored
during a period similar to that of the water balance, along with the water balance flux rates, were
used to compute loads. Based on the Zortman and Landusky mines sub-basins and the water
balance, contaminant fate was allocated among that going to the water treatment plant, to the
LAD, and to groundwater. Average annual loads of total dissolved solids, acidity, sulfate, nitrite
plus nitrate, arsenic, selenium and seven cationic metals were calculated. The total metals load is
the sum of aluminum, cadmium, chromium, copper, iron, lead, manganese, nickel and zinc. The
loading rates are gross values that incorporate mining impacts, precipitation mass loading, and
the "natural background contributions" for this site. The results are best interpreted by
comparison of relative loading rates among the mine facilities. The procedures and limitations of
the chemical mass loading evaluations are provided in Spectrum et al. (2000a and 2000b), and
HSI and Gallagher (2001).
Zortman Mine Chemical Mass Loading
Sulfate loads in rank order, and corresponding total metal loads, by sub-basin are presented
in Table 6. About 32 % of the total sulfate load was generated by the Z85/86 leach pad. The
Alder Gulch waste rock dump (CG-02), OK waste rock dump (IN-01), plant process area (RG-
03), and Ruby pit each generated from 5-10 % of the total sulfate load. As with sulfate, the total
metal load was greatest from the Z85/86 leach pad, comprising nearly 22 % of the total metal
load from the mine. The Alder Gulch waste rock dump and Ruby pit contributed about 11 % and
10 %, respectively, of the mine’s total metal load. Most of the facilities high in sulfate load were
also high in metals load, not unexpected in a geochemical environment dominated by pyrite
oxidation.
The distribution and fate of the Zortman Mine sulfate and metal loads are shown in Figure 6.
It indicates that 78 % of the total metal load and 66 % of the sulfate load was captured and routed
938

to the Zortman water treatment plant. The Goslin Flats LAD received 18 % and 31 % of the
metals and sulfate loads, respectively. The total metal and sulfate loads to groundwater not
captured, was estimated at 4 % and 3 %, respectively.
Table 6. Zortman Mine Sulfate and Total Metals Loads.
Sulfate Load Rank Order
Total Metals Load
Rank Order kg/yr % kg/yr % 1985-1986 Leach Pad 940,532 31.9% 73,360 21.8% Carter Gulch Pump Back (Dump) 287,937 9.8% 35,833 10.6% OK Rock Dump and Topsoil Pile 259,954 8.8% 32,674 9.7% WTP, 85/86 and 89 Dikes 186,586 6.3% 30,297 9.0% Ruby Pit 182,039 6.2% 34,754 10.3% Ross Pit 138,951 4.7% 26,528 7.9% 1989 Leach Pad 119,580 4.1% 639 0.2% 1984 Leach Pad 119,449 4.1% 2,410 0.7% South Alabama Pit 109,156 3.7% 20,840 6.2% 1982 Leach Pad 106,157 3.6% 21,840 6.5% North Alabama Pit 99,528 3.4% 19,001 5.6% 1983 Leach Pad 92,941 3.2% 857 0.3% 79-81 Leach Pad 83,924 2.8% 4,851 1.4% O.K. Pit 83,361 2.8% 15,915 4.7% Mint Pit and S. Ruby Waste Dump 53,225 1.8% 7,313 2.2% Area Around Alabama Pits 34,765 1.2% 8,320 2.5% 83 and 84 Dikes 33,584 1.1% 357 0.1% Area Near SW Corner OK Pit 6,113 0.2% 1,463 0.4% Upper Shell Butte Undisturbed 4,013 0.1% 9 0.0% Alder Spur Non-Contributing Area 3,085 0.1% 3 0.0% Generator Hill 2,148 0.1% 2 0.0% East of 83 & 89 Leach Pads 556 0.0% 3 0.0% Total 2,947,585 100% 337,271 100%
939

Distribution of Zortman Mine Sub-Surface Sulfate Load
3%
31%
66%
RO + ITto GWIT toLADIT toWTP
Distribution of Zortman Mine Sub-Surface Metals Load
18%
78%
4%
RO + ITto GWIT to LAD
IT toWTP
Figure 6. Distribution and Fate of Zortman Mine Sulfate and Total Metals Loads.
940

Landusky Mine Chemical Mass Loading
As done in the water balance, the 36 surface water basins at the Landusky Mine were
replaced with 17 groundwater basins, which much improved the correspondence of the selected
water quality stations and the accuracy of the contaminant load calculations.
Sulfate loads in rank order, and corresponding total metals loads, by sub-basin are presented
in Table 7. The results indicate that the L-87 and L-91 leach pads produced the greatest loading
rate of sulfate. The next largest total sulfate loads, in order, were derived from the Upper
Montana Gulch capture system, Lower Montana Gulch capture system, the Gold Bug adit and
the Sullivan Gulch capture system.
Table 7. Landusky Mine Sulfate and Total Metals Loads.
Sulfate Load Rank Order
Total
Metals Load Rank Order
kg/yr % kg/yr %
L-91 735,018 37.9% 545 1.1%L-87 710,752 36.6% 519 1.0%UPPER MONTANA GULCH 222,826 11.5% 5,234 10.2%LOWER MONTANA GULCH 206,405 10.6% 1,215 2.4%GOLD BUG DISCHARGE 186,908 9.6% 25,018 48.5%SULLIVAN GULCH 115,024 5.9% 8,179 15.9%L-83 109,537 5.6% 3,891 7.6%MILL GULCH 105,309 5.4% 2,717 5.3%L-85-86 79,248 4.1% 41 0.1%L-84 77,267 4.0% 3,752 7.3%L-79,80,81,82 74,238 3.8% 823 1.6%SWIFT GULCH (mine area only) 17,231 0.9% 62 0.1%KING CREEK (mine area only) 16,411 0.8% 21 0.0%X-03 15,238 0.8% 56 0.1%X-02 1,753 0.1% 3 0.0%MT-09 + MT-11 1,453 0.1% 1 0.0%X-01 469 0.0% 0 0.0%TOTALS 1,940,069 100.0% 51,532 100.0%
The sources and fate of the Landusky Mine sulfate and metal loads are shown in Figure 7.
The Gold Bug adit discharge had the greatest overall loading rate of total metals, at 25,018 kg/yr.
941

Distribution of Landusky Mine Sub-Surface Sulfate Load
1%
66%
24%
9% IT to GW
IT to LAD
IT to WTP
IT to Sfc
Distribution of Landusky Mine Sub-Surface Metals Load
18%
80%
2% 0% IT to GW
IT to LAD
IT to WTP
IT to Sfc
Figure 7. Distribution and Fate of Landusky Mine Sulfate and Total Metals Loads.
942
Sullivan Gulch and Upper Montana Gulch ranked second and third overall. The sulfate
distribution indicates that 66% was collected from the leach pads and is routed to the LAD. 24%
was recruited by the capture systems and went to the water treatment plant, 9% to surface water
discharge (primarily Lower Montana Gulch), and 1% to uncaptured groundwater. Of the total
sub-surface metals load, all but 2-3 % was recruited by the capture systems or leach pad drains.
Conclusions
This study demonstrates that site-specific steady state water balances can be developed for
mines having “lysimeter-like” facilities and on-site precipitation data. Water balances developed
with site-specific data can give greatly different results than ones based on regional data and
general methods. Site-specific water balances are valuable tools for analysis of hydraulic and
contaminant loading rates from various facilities and surface cover types, and for providing
useful models in reclamation decision-making. Water balance models of this type should not be
applied outside the period of record or hydrologic conditions for which they were developed,
without further verification and calibration.
Acknowledgements
This study was supported by funds from the Bureau of Land Management, Montana Department
of Environmental Quality and Environmental Protection Agency. Runoff calculations, leach pad
analysis, and map preparation were performed by Spectrum Engineering Inc. Individuals
instrumental in contributing to, or providing support to this study include Bill Maehl, Gary
Rome, Francis Kolczak (Spectrum Engineering), Kathy Gallagher (Consulting hydrogeologist),
Shannon Shaw (Robertson GeoConsultants), and Wayne Jepson (Montana DEQ).
References Cited
Bureau of Land Management/Department of Environmental Quality, 1996. Final Environmental
Impact Statement (FEIS) - Zortman and Landusky Mines Reclamation Plan Modifications
and Mine Life Extensions.
943

944
Bureau of Land Management and Department of Environmental Quality. 2001. Final
Supplemental Environmental Impact Statement for Reclamation of the Zortman and
Landuksy Mines, Montana, BLM, Lewistown, MT.
Harvey, K.C. and K.L. Gallagher, 1996. Estimation of Seepage and Runoff Volumes for Water
Quality Management at the Zortman and Landusky Mines. Draft Report to ZMI, February.
HydroSolutions Inc and K.L. Gallagher, 2001. Hydrology Support Document for the
Supplemental Environmental Impact Statement - Reclamation of the Zortman and Landusky
Mines, Phillips County, Montana. HydroSolutions Inc., Billings, MT.
Montana Department of State Lands/ USDI, Bureau of Land Management, 1994, Decision
Record. Operating and Reclamation Plan Modifications for Acid Rock Drainage Control
and Remediation, Landusky Mine. Signed by BLM District Manager February 25. Signed
by DSL Commissioner March 4.
Robertson GeoConsultants, Inc. and Spectrum Engineering, Inc., 2000a. Results of Drilling
Program and Laboratory Testing for the Zortman/Landusky Reclamation Project: Draft
Progress Report II. Report 075001/2. Presented to the Technical Working Group, March 23,
2000, 12 pp and appendices.
Spectrum Engineering, 2000a. Zortman Mine Water Balance and Chemical Mass Loading.
Report to the MDEQ and BLM. April 13, 2000.
Spectrum Engineering, 2000b. Landusky Mine Water Balance and Chemical Mass Loading.
Report to the MDEQ and BLM. July 21, 2000.
U.S. Department of Agriculture, Soil Conservation Service, 1972. SCS National Engineering
Handbook, Section 4 Hydrology. U.S. Government Printing Office, Washington, D.C.
Water Management Consultants, 1998. Zortman/Landusky Project Draft Summary Report for
the Groundwater Investigation. Report to Parsons Behle & Latimer, 3 volumes.
Zortman Mining, Inc., 1996. Geologic Evaluation of the Zortman and Landusky Mine Sites and
Surrounding Little Rocky Mountains.