Embed Size (px)
Citation preview

The water and land footprint of bioplastics
0
The water and land footprint of
bioplastics
Ratri Endah Putri
M.Sc. Thesis
January 2018
Supervisors:
Prof. dr. ir. Arjen Y. Hoekstra
MSc. Bunyod Holmatov
Water Management Group
Faculty of Engineering Technology
Water Engineering & Management
University of Twente
P.O. Box 217
7500 AE Enschede
Faculty of Engineering Technology
Department of Water Engineering & Management
i
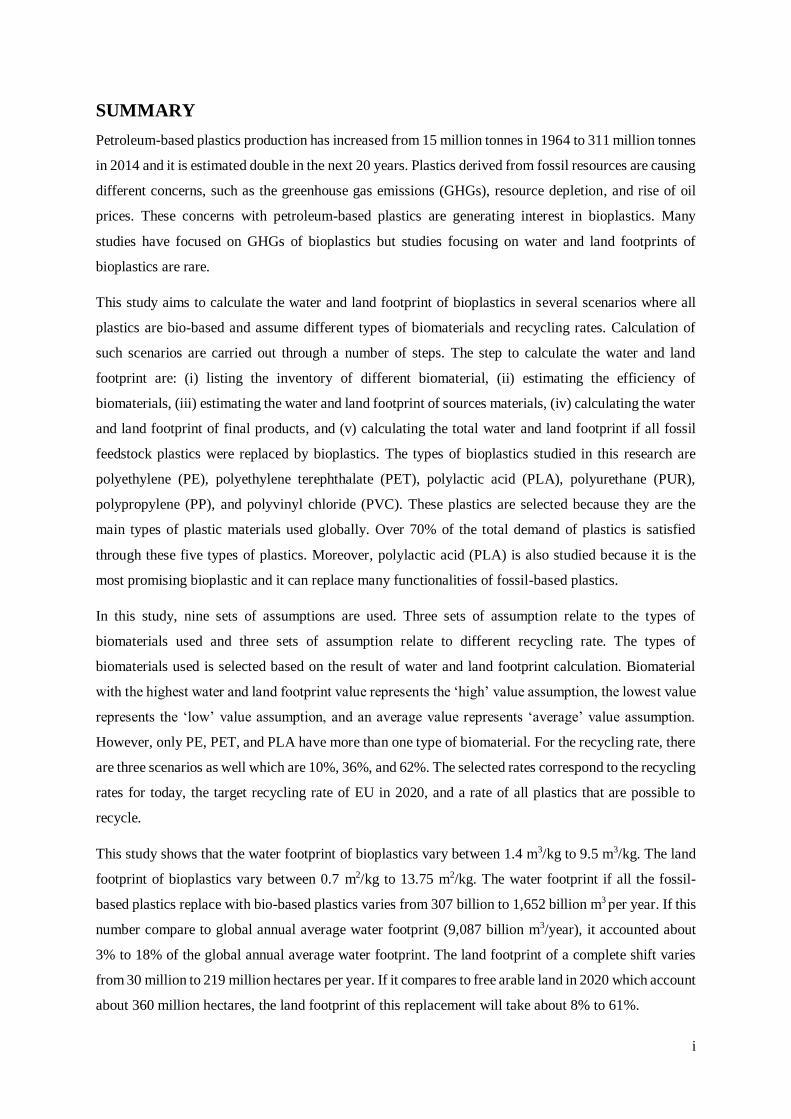
SUMMARY
Petroleum-based plastics production has increased from 15 million tonnes in 1964 to 311 million tonnes
in 2014 and it is estimated double in the next 20 years. Plastics derived from fossil resources are causing
different concerns, such as the greenhouse gas emissions (GHGs), resource depletion, and rise of oil
prices. These concerns with petroleum-based plastics are generating interest in bioplastics. Many
studies have focused on GHGs of bioplastics but studies focusing on water and land footprints of
bioplastics are rare.
This study aims to calculate the water and land footprint of bioplastics in several scenarios where all
plastics are bio-based and assume different types of biomaterials and recycling rates. Calculation of
such scenarios are carried out through a number of steps. The step to calculate the water and land
footprint are: (i) listing the inventory of different biomaterial, (ii) estimating the efficiency of
biomaterials, (iii) estimating the water and land footprint of sources materials, (iv) calculating the water
and land footprint of final products, and (v) calculating the total water and land footprint if all fossil
feedstock plastics were replaced by bioplastics. The types of bioplastics studied in this research are
polyethylene (PE), polyethylene terephthalate (PET), polylactic acid (PLA), polyurethane (PUR),
polypropylene (PP), and polyvinyl chloride (PVC). These plastics are selected because they are the
main types of plastic materials used globally. Over 70% of the total demand of plastics is satisfied
through these five types of plastics. Moreover, polylactic acid (PLA) is also studied because it is the
most promising bioplastic and it can replace many functionalities of fossil-based plastics.
In this study, nine sets of assumptions are used. Three sets of assumption relate to the types of
biomaterials used and three sets of assumption relate to different recycling rate. The types of
biomaterials used is selected based on the result of water and land footprint calculation. Biomaterial
with the highest water and land footprint value represents the ‘high’ value assumption, the lowest value
represents the ‘low’ value assumption, and an average value represents ‘average’ value assumption.
However, only PE, PET, and PLA have more than one type of biomaterial. For the recycling rate, there
are three scenarios as well which are 10%, 36%, and 62%. The selected rates correspond to the recycling
rates for today, the target recycling rate of EU in 2020, and a rate of all plastics that are possible to
recycle.
This study shows that the water footprint of bioplastics vary between 1.4 m3/kg to 9.5 m3/kg. The land
footprint of bioplastics vary between 0.7 m2/kg to 13.75 m2/kg. The water footprint if all the fossil-
based plastics replace with bio-based plastics varies from 307 billion to 1,652 billion m3 per year. If this
number compare to global annual average water footprint (9,087 billion m3/year), it accounted about
3% to 18% of the global annual average water footprint. The land footprint of a complete shift varies
from 30 million to 219 million hectares per year. If it compares to free arable land in 2020 which account
about 360 million hectares, the land footprint of this replacement will take about 8% to 61%.
ii
ACKNOWLEDGEMENTS
I acknowledge the support received from Lembaga Pengelola Dana Pendidikan (LPDP) who made it
financially possible for me to study in the University of Twente. I would like to express my gratitude
to Prof. dr. ir. Arjen Y. Hoekstra and MSc. Bunyod Holmatov for their understanding, detailed
feedbacks, patient guidance, and useful critiques of this research works. I would also like to thank my
husband, my parents, my daughter, my sisters, and all my friend who supported me during this study.
iii
Contents
SUMMARY ....................................................................................................................................... i
ACKNOWLEDGEMENTS ............................................................................................................... ii
1 INTRODUCTION ..................................................................................................................... 1
1.1 Background ........................................................................................................................ 1
1.2 Research Objective ............................................................................................................ 2
2 SYSTEM DESCRIPTION OF BIOPLASTICS .......................................................................... 4
2.1 Polyethylene (PE) .............................................................................................................. 5
2.2 Polyethylene terephthalate (PET) ....................................................................................... 6
2.3 Polylactic acid (PLA) ......................................................................................................... 7
2.4 Polyurethane (PUR) ........................................................................................................... 7
2.5 Polypropylene (PP) ............................................................................................................ 8
2.6 Polyvinyl chloride (PVC) ................................................................................................... 9
3 METHOD AND DATA ........................................................................................................... 10
3.1 Method ............................................................................................................................ 10
3.2 Data ................................................................................................................................. 15
4 RESULTS ............................................................................................................................... 16
4.1 Water footprint of bioplastics ........................................................................................... 16
4.2 Land footprint of bioplastics ............................................................................................. 18
4.3 Calculation of water and land footprint of bioplastics in 2016 ........................................... 18
4.4 Complete change from fossil-based stock to bio-based plastics ......................................... 19
5 DISCUSSION ......................................................................................................................... 22
6 CONCLUSION ....................................................................................................................... 26
REFERENCES................................................................................................................................ 27
Appendix I. Calculation of water and land footprint of Brazilian sugar cane based PE...................... 32
Appendix II. Calculation of water and land footprint of Belgian sugar beet-based PE ....................... 37
Appendix III. Calculation of water and land footprint of Belgian wheat based PE ............................ 41
Appendix IV. Calculation of water and land footprint of India molasses cane based PET ................. 44
iv
Appendix V. Calculation of water and land footprint of Brazilian sugar cane based PET .................. 48
Appendix VI. Calculation of water and land footprint of Thailand cassava-based PLA ..................... 51
Appendix VII. Calculation of water and land footprint of USA corn-based PLA .............................. 55
Appendix VIII. Calculation of water and land footprint of 100% bio-based PET .............................. 58
Appendix IX. Calculation of water and land footprint of palm oil-corn starch PUR .......................... 61
Appendix X. Calculation of water and land footprint of sugar cane based PP ................................... 67
Appendix XI. Calculation of water and land footprint of sugar cane based PVC .............................. 69
Appendix XII. Result of calculation water and land footprint if complete change from fossil-based
plastics to bio-based plastics using different scenarios ..................................................................... 72
The water and land footprint of bioplastics
1
1 INTRODUCTION
1.1 Background
Plastics are used in all aspect of life from the pharmaceutical industry to household use (DiGregorio,
2009). Petroleum-based plastics production has increased from 15 million tonnes in 1964 to 311 million
tonnes in 2014 and it is expected to double in the next 20 years because of their combination of low
cost, versatility, durability and high strength-to-weight ratio (WEF, 2017). This enormous production
of petroleum-based plastics which are derived from limited resources urges people to seek out more
sustainable alternatives from renewable sources (Emadian et al., 2017). Besides the increasing demand
for plastics, the concern for climate change, and the security of industrial feedstock supply contributes
to the growth of bioplastics (Weiss et al., 2012).
Bioplastics consist of biodegradable plastics (plastics produced from fossil materials or bio-based
material) or bio-based plastics (plastics synthesized from biomass or renewable resources) (Yutaka et
al., 2009). Not all bio-based plastics are degradable and not all biodegradable plastics are bio-based
plastic. It is necessary to avoid the confusion about the terms of bioplastics (Yutaka et al., 2009). Shen
et al. (2010) define bio-based plastics as “man-made or man-processed organic macromolecules derived
from biological resources and used for plastic and fiber applications”.
Bio-based plastics are mostly made from carbohydrate-rich plants such as corn, sugar cane, cereal, and
sugar beets (EuropeanBioplastics, 2017). Bio-based polymers include polylactide (PLA), polyhydroxy
butyrate (PHB) and starch derivatives as well as, for example, bio-polyethylene (PE) (Yutaka et al.,
2009). The most common bio-based plastics are polyurethanes (PUR) and bio-based polyethylene
terephthalate (PET), accounting respectively about 40% and 20% of total production of 4.16 million
tonnes per year (EuropeanBioplastics, 2017; Mostafa et al., 2015). By 2019, the production capacity is
expected to increase to 7.8 million tonnes (EuropeanBioplastics, 2017).
The bio-based plastics are beneficial in terms of fossil resources reduction and GHG emission reduction
but they may come with an environmental problem related to cultivation and processing of feedstock
(Grabowski et al., 2015). The associated problems are land use change, eutrophication of ground and
surface waters, or fragmentation of habitats (Piemonte & Gironi, 2011). Despite many studies that
assess the impacts of bioplastics in energy use, GHG levels, economic effects, there are limited studies
on the assessment of water and land footprint of bioplastics.
The water footprint concept is introduced by Hoekstra (2003). It indicates the total of grey, green, and
blue freshwater use both direct and indirect water use of a consumer or producer, and it differs from the
classical measure of water withdrawal (Hoekstra et al., 2012). The water footprint includes three
components: the green water footprint (evapotranspiration of rainwater from the field to produce for
The water and land footprint of bioplastics
2
example a crop); the blue water footprint (net withdrawal of water from surface water or groundwater);
and the grey water footprint (the volume of freshwater required to assimilate pollutants).
The water footprint of bioplastics can be calculated as water footprint of a product. The water footprint
of product is the total of all water footprints of input products and process water footprints (Hoekstra,
2011). The input products of bioplastics mostly come from food crops such as corn, sugar cane, cereal,
and sugar beets. The global water footprint of crop products (corn, sugar cane, cereal, and sugar beets)
varies from 60 m3/ton to 1800 m3/ton (Mekonnen & Hoekstra, 2011). By knowing all the water footprint
of all the input products of bioplastic and all water footprint of the processes, the water footprint of
bioplastic can be obtained. The water footprint of bioplastics can vary between crops and countries that
are linked to differences in crop yields, climate and agricultural technologies across countries
(Mekonnen & Hoekstra, 2011).
The land footprint is defined as the real amount of land that is needed to produce a product or a service
and expressed in area per unit of a product (Ibidhi et al., 2017; Weinzettel et al., 2013). Based on FAO
(2013), 38% of total land is used for agriculture. The land footprint of a crop product is the land
requirements for growing the crop (Bosire et al., 2016). According to Giljum et al. (2013), the total land
requirements of crop product (ha) can be calculated by total harvested amount of the product (ton)
divided by the yield of the product (ton/ha) using data from FAO (2016).
European Bioplastics has calculated that the land needed to grow the feedstock for bio-based plastics
amounted to 0.01% of the global agricultural area in 2013 and it may grow to 0.02% by 2018. In 2014,
the global production capacities for bioplastics amounted to around 1.7 million tonnes and translates
into approximately 680,000 hectares of land (EuropeanBioplastics, 2017). Although in the near future,
the bioplastics industry will not be a threat to the agricultural land, the impact must still be taken into
account.
Based on previous research, replacing the petroleum-based plastics with bioplastics can reduce the
GHGs emissions (Harding et al., 2007; Piemonte & Gironi, 2011; Shen et al., 2012; Weiss et al., 2012;
Yates & Barlow, 2013). Although these studies focused on the effects of GHG reduction of bioplastics,
studies focusing on water and land footprints are rare. In this research, the water and land footprint of
bioplastics will be determined with a focus on the bio-based plastics.
1.2 Research Objective
Research question
The research aims to assess the global land and water footprint of a total shift from fossil-based to bio-
based plastic consumption.
The main research question is defined as:
The water and land footprint of bioplastics
3
What are the implications of a total shift from fossil-based to bio-based plastics on global land and
water requirements?
To answer the main research question the following sub-research questions will be addressed:
1. What is the inventory of types of biomaterials that can be used for producing different sorts of
bioplastics and of alternative production pathways?
2. What are the land and water footprints for a selected number of biomaterials and pathways, in
terms of m2 and m3 per kg of bioplastic?
3. What are the total land and water footprints if worldwide fossil-feedstock based plastics were
replaced by bioplastics, accounting for different sets of assumptions on types of biomaterials
used and different recycling rates?
Research scope
Bioplastics may refer to biodegradable plastic or bio-based plastics. This study will focus on bio-based
plastics which are the plastics produced from biomass or renewable sources (European standard EN
16575). The types of bioplastics studied in this research are polyethylene (PE), polyethylene
terephthalate (PET), polyurethane (PUR), polypropylene (PP), and polyvinyl chloride (PVC). These
plastics are selected because they are the main plastic material demands globally. Total demand of all
these plastics is over 70% globally (Nova Institute, 2016). Moreover, polylactic acid (PLA) is also
studied because it is the most promising bioplastic and can replace many functionalities of fossil-based
plastics today (Mekonnen et al., 2013).
The water and land footprint of bioplastics
4
2 SYSTEM DESCRIPTION OF BIOPLASTICS
Bioplastics are broadly classified as bio-based and/or biodegradable (Ashter, 2016). Bio-based plastics
are derived from biological resources (Shen et al., 2010), meanwhile, biodegradable plastics can be
plant or oil-based plastics and can be broken down by microorganisms (bacteria or fungi) into the water,
carbon dioxide (CO2) and some bio-material (Futurenergia, 2017). Not all the bio-based plastics are
biodegradable and vice versa.
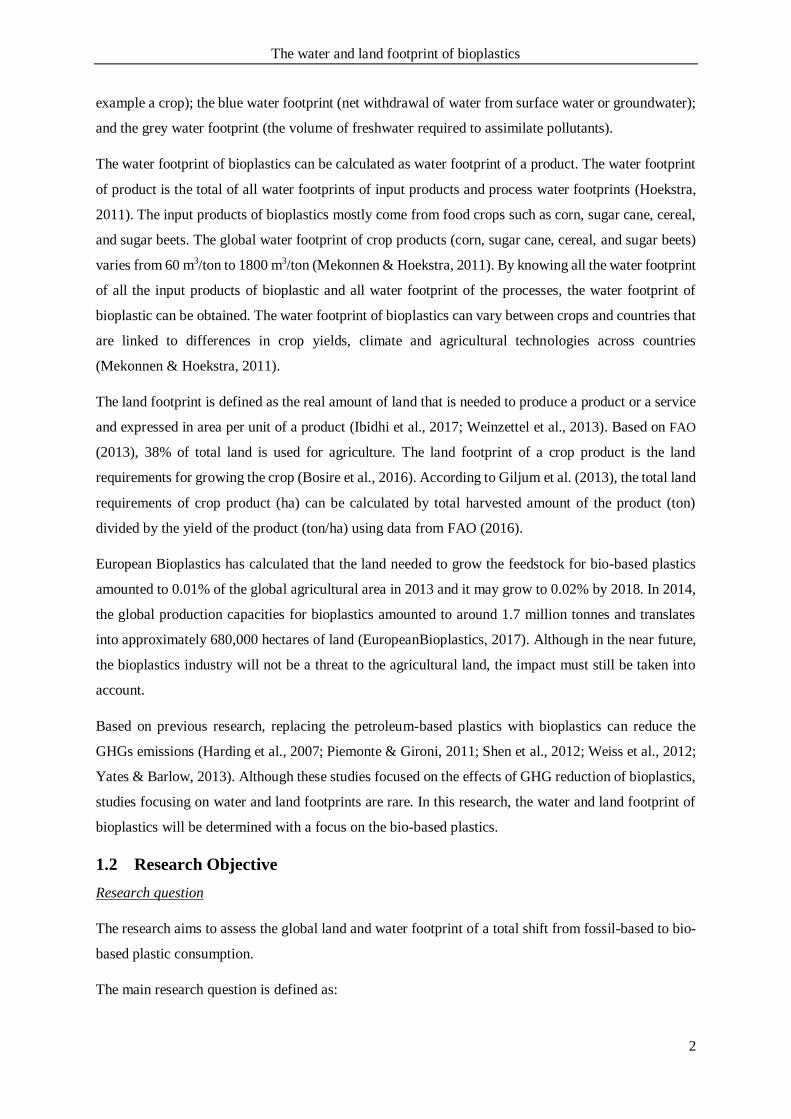
Figure 1 shows the classification of plastics based on their bio-based content and biodegradability. It is
divided by bio-based, biodegradable, fossil-based, and non-biodegradable. The plastics are classified as
follows:
Group 1 – Bioplastics that are bio-based and non-biodegradable such as bio-based PE, PET,
PA, and PTT.
Group 2 – Bioplastics that are bio-based and biodegradable such as PLA, PHA, PBS, and Starch
blends.
Group 3 – Conventional plastics that are non-biodegradable and fossil-based such as
conventional PE, PP, and PET.
Group 4 – Bioplastics that are fossil-based and biodegradable such as PBAT and PCL.
Figure 1. Classification of biodegradable and bio-based plastics (EuropeanBioplastics, 2017)
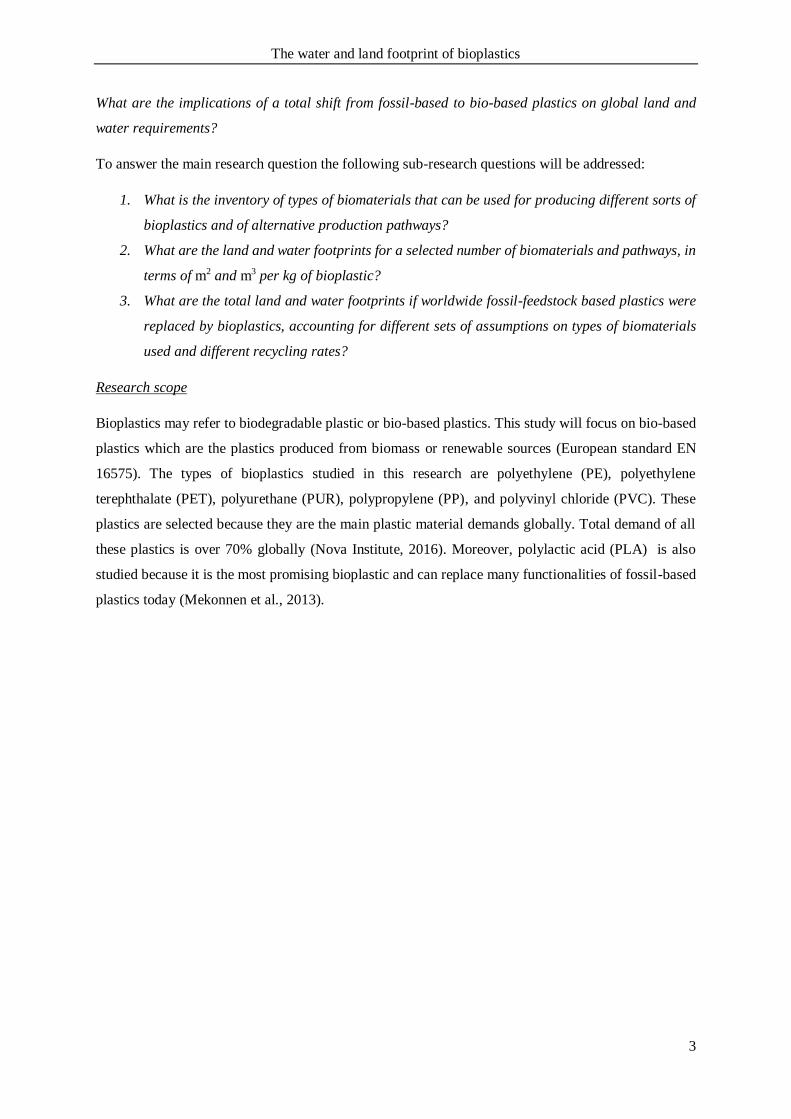
In 2016, global production capacity of bioplastics was 4.16 million tones (Figure 2). According to the
latest market data compiled by EuropeanBioplastics (2017) in cooperation with the research institute
nova-Institute, the global production capacity of bioplastics is predicted to grow by 50 percent in the
medium term, from around 4.2 million tonnes in 2016 to approximately 6.1 million tonnes in 2021. Bio-
The water and land footprint of bioplastics
5
based, such as polyurethanes (PUR) and bio-based PET, are the main product of bioplastics, with 40%
and 20% of global production capacities, respectively. Most of the bioplastics are used for packaging
and consumer goods (39% and 22% of total global production, respectively) (Nova Institute, 2016).
Figure 2. Global production capacity of bioplastics by material types in 2016 (Nova Institute, 2016)
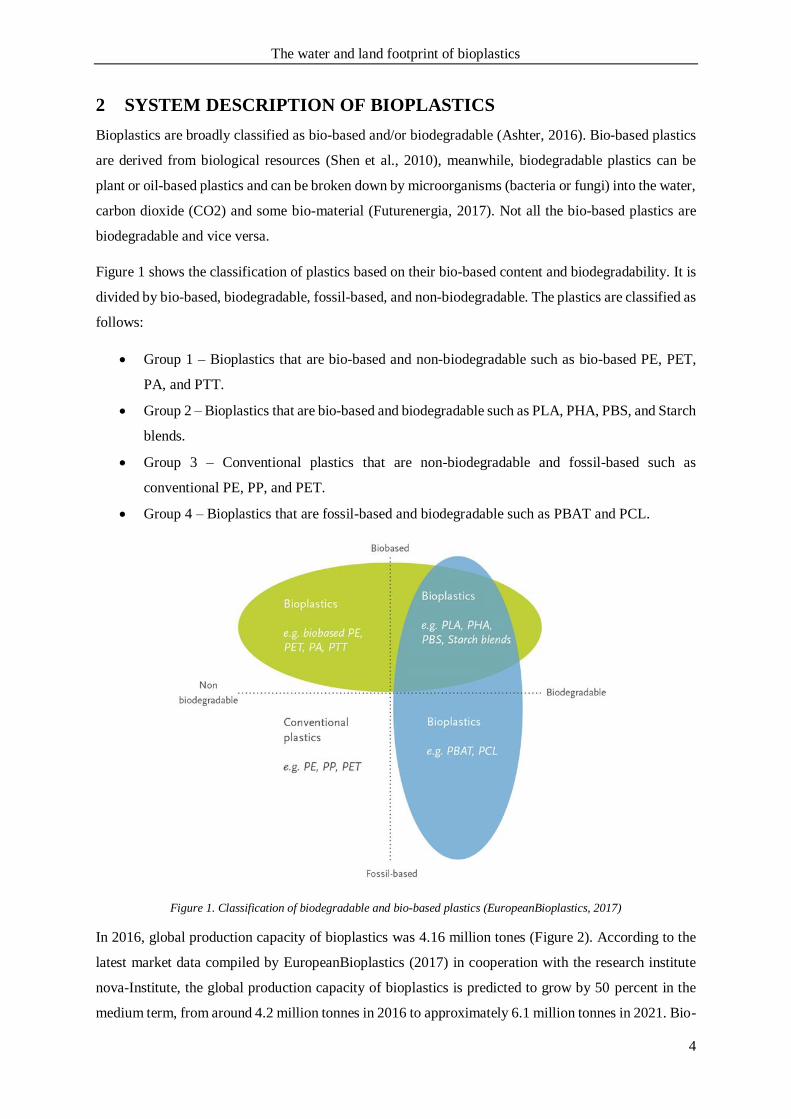
2.1 Polyethylene (PE)
Polyethylene (PE), which is obtained by the polymerization of ethylene, is one of the most important
commercially available polymers (Reddy et al., 2013). Bio-based PE was produced massively by two
large Brazilian companies, Braskem and Dow Crystalsev. According to Coutinho et al. (2013), bio-
based PE has the same functionality as petrochemical PE, it can be used for different application. The
process of production of bio-based PE starts by processing biomass (sugar cane, sugar beet, or wheat)
to bioethanol by anaerobically fermented process. Ethanol is distilled to remove water and to yield an
azeotropic mixture of hydrous ethanol. Ethanol is then dehydrated at high temperature to produce
ethylene. The final process is polymerization ethylene to polyethylene. The production process scheme
of PE can be seen in Figure 3 below.
The water and land footprint of bioplastics
6
Sugar cane or sugar beat or
wheat
Bioethanol
Ethylene
PE
Fermentation
Dehydration
Polymerization
Figure 3. Production of bio-based PE
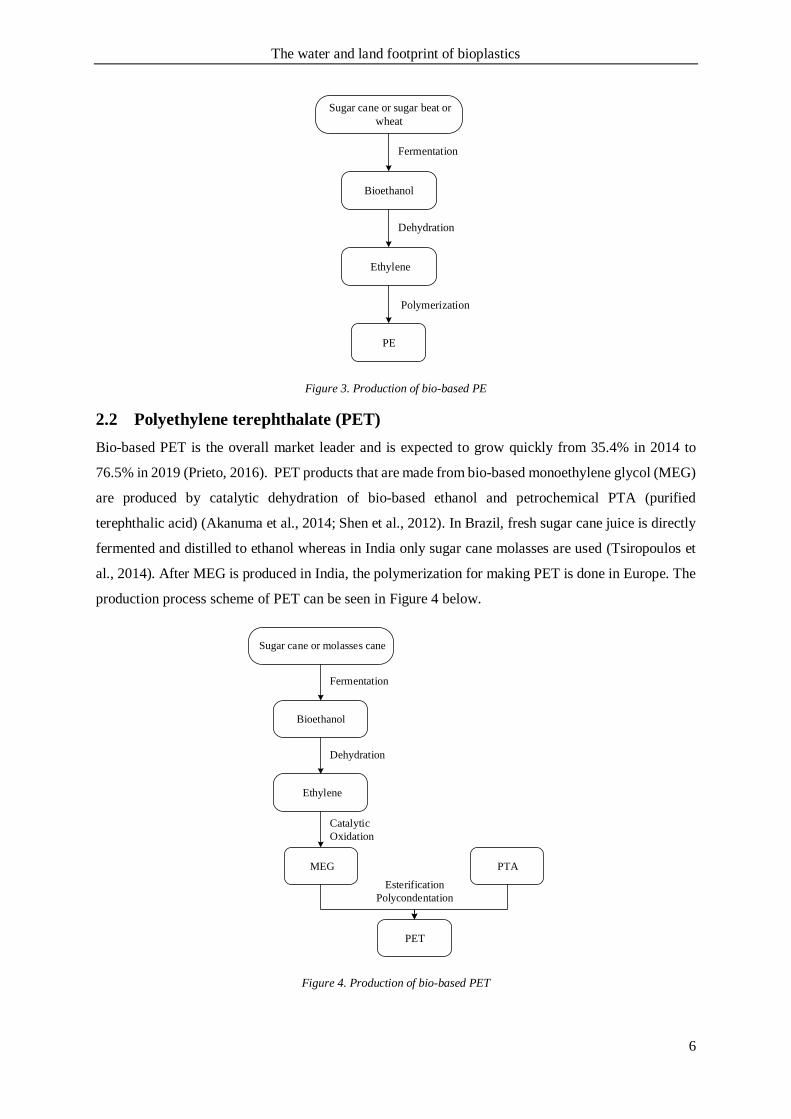
2.2 Polyethylene terephthalate (PET)
Bio-based PET is the overall market leader and is expected to grow quickly from 35.4% in 2014 to
76.5% in 2019 (Prieto, 2016). PET products that are made from bio-based monoethylene glycol (MEG)
are produced by catalytic dehydration of bio-based ethanol and petrochemical PTA (purified
terephthalic acid) (Akanuma et al., 2014; Shen et al., 2012). In Brazil, fresh sugar cane juice is directly
fermented and distilled to ethanol whereas in India only sugar cane molasses are used (Tsiropoulos et
al., 2014). After MEG is produced in India, the polymerization for making PET is done in Europe. The
production process scheme of PET can be seen in Figure 4 below.
PTA
Sugar cane or molasses cane
Bioethanol
Ethylene
MEG
Fermentation
Dehydration
Catalytic
Oxidation
PET
Esterification
Polycondentation
Figure 4. Production of bio-based PET
The water and land footprint of bioplastics
7
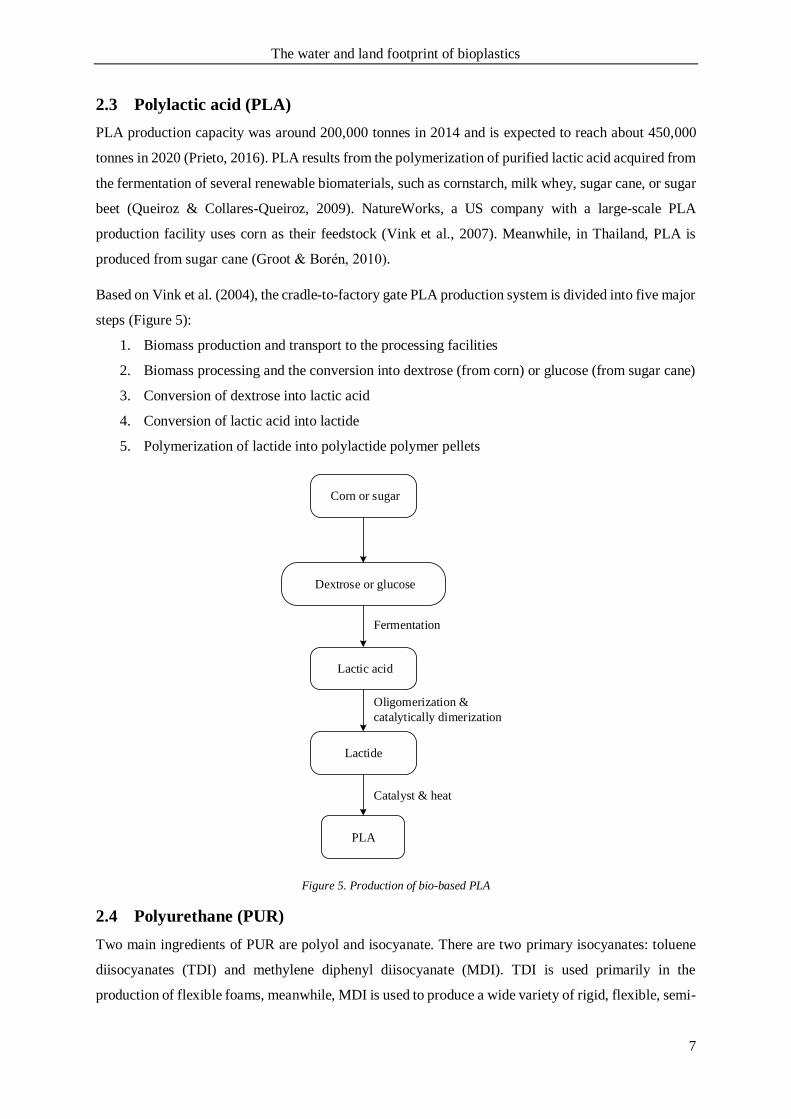
2.3 Polylactic acid (PLA)
PLA production capacity was around 200,000 tonnes in 2014 and is expected to reach about 450,000
tonnes in 2020 (Prieto, 2016). PLA results from the polymerization of purified lactic acid acquired from
the fermentation of several renewable biomaterials, such as cornstarch, milk whey, sugar cane, or sugar
beet (Queiroz & Collares-Queiroz, 2009). NatureWorks, a US company with a large-scale PLA
production facility uses corn as their feedstock (Vink et al., 2007). Meanwhile, in Thailand, PLA is
produced from sugar cane (Groot & Boren, 2010).
Based on Vink et al. (2004), the cradle-to-factory gate PLA production system is divided into five major
steps (Figure 5):
1. Biomass production and transport to the processing facilities
2. Biomass processing and the conversion into dextrose (from corn) or glucose (from sugar cane)
3. Conversion of dextrose into lactic acid
4. Conversion of lactic acid into lactide
5. Polymerization of lactide into polylactide polymer pellets
Dextrose or glucose
Lactic acid
Lactide
PLA
Fermentation
Oligomerization &
catalytically dimerization
Catalyst & heat
Corn or sugar
Figure 5. Production of bio-based PLA
2.4 Polyurethane (PUR)
Two main ingredients of PUR are polyol and isocyanate. There are two primary isocyanates: toluene
diisocyanates (TDI) and methylene diphenyl diisocyanate (MDI). TDI is used primarily in the
production of flexible foams, meanwhile, MDI is used to produce a wide variety of rigid, flexible, semi-
The water and land footprint of bioplastics
8
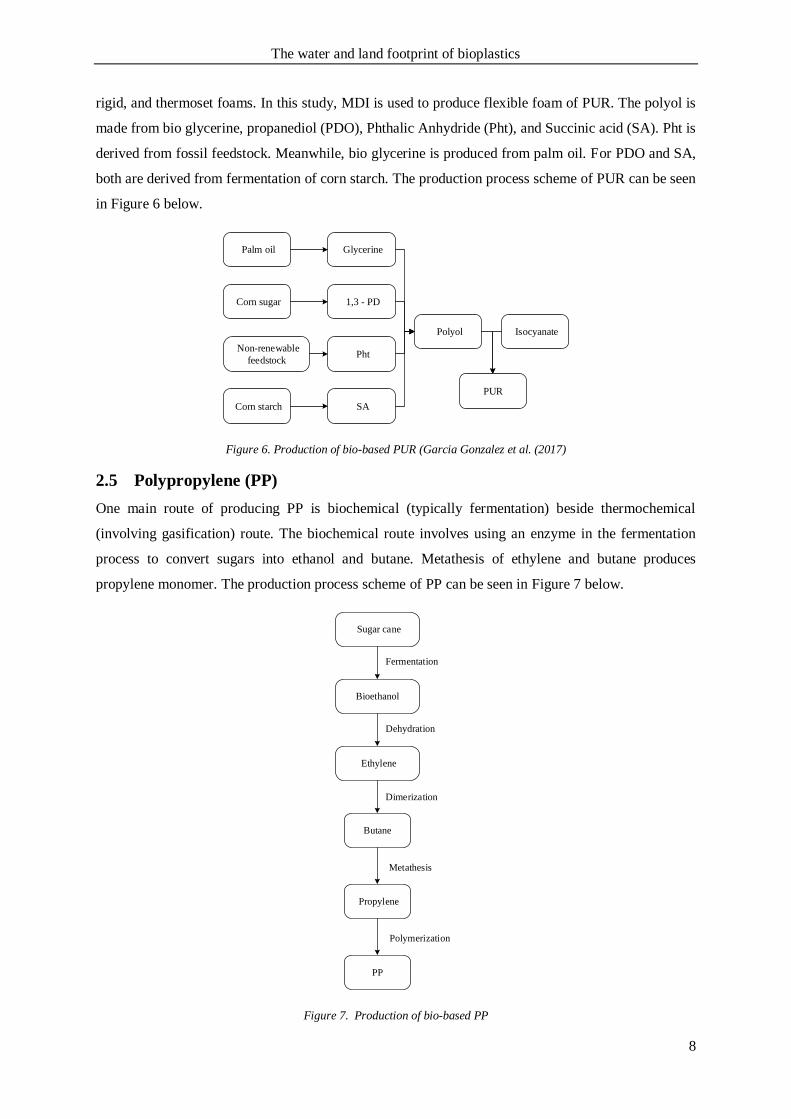
rigid, and thermoset foams. In this study, MDI is used to produce flexible foam of PUR. The polyol is
made from bio glycerine, propanediol (PDO), Phthalic Anhydride (Pht), and Succinic acid (SA). Pht is
derived from fossil feedstock. Meanwhile, bio glycerine is produced from palm oil. For PDO and SA,
both are derived from fermentation of corn starch. The production process scheme of PUR can be seen
in Figure 6 below.
Palm oil
Corn sugar
Non-renewable
feedstock
Corn starch
Glycerine
1,3 - PD
Pht
SA
Polyol Isocyanate
PUR
Figure 6. Production of bio-based PUR (Garcia Gonzalez et al. (2017)
2.5 Polypropylene (PP)
One main route of producing PP is biochemical (typically fermentation) beside thermochemical
(involving gasification) route. The biochemical route involves using an enzyme in the fermentation
process to convert sugars into ethanol and butane. Metathesis of ethylene and butane produces
propylene monomer. The production process scheme of PP can be seen in Figure 7 below.
Sugar cane
Bioethanol
Ethylene
Butane
Fermentation
Dehydration
Dimerization
Propylene
PP
Metathesis
Polymerization
Figure 7. Production of bio-based PP
The water and land footprint of bioplastics
9
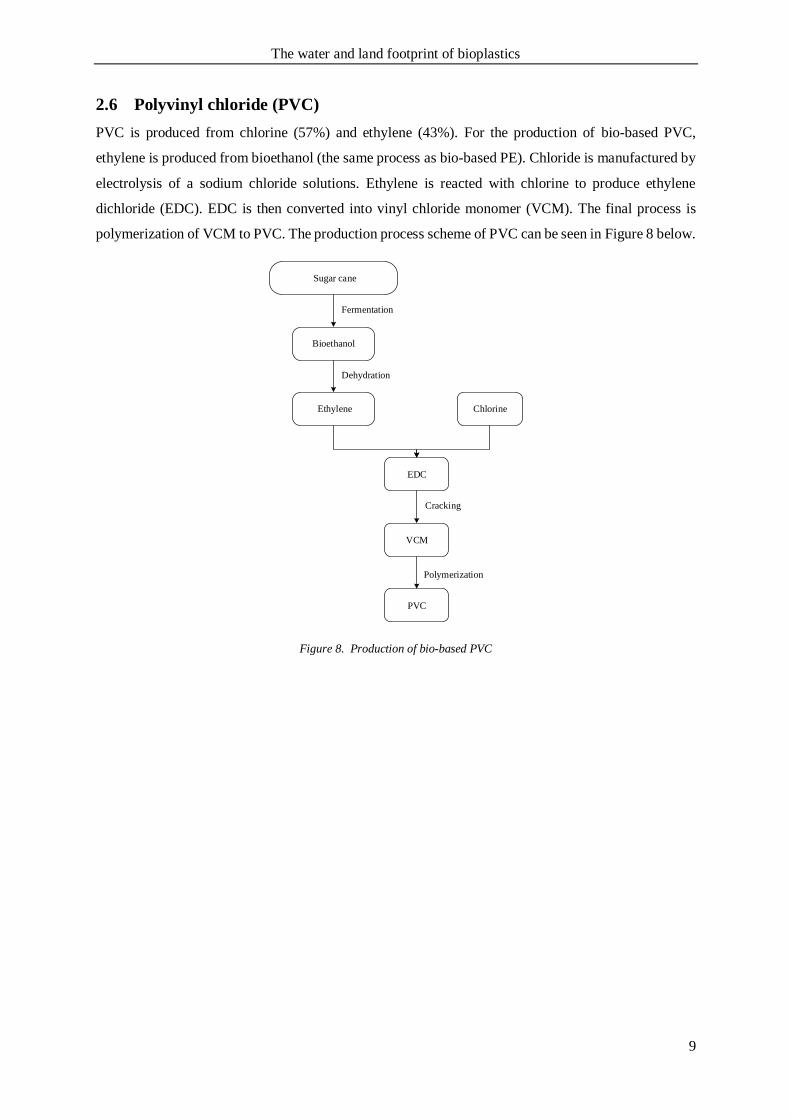
2.6 Polyvinyl chloride (PVC)
PVC is produced from chlorine (57%) and ethylene (43%). For the production of bio-based PVC,
ethylene is produced from bioethanol (the same process as bio-based PE). Chloride is manufactured by
electrolysis of a sodium chloride solutions. Ethylene is reacted with chlorine to produce ethylene
dichloride (EDC). EDC is then converted into vinyl chloride monomer (VCM). The final process is
polymerization of VCM to PVC. The production process scheme of PVC can be seen in Figure 8 below.
Sugar cane
Bioethanol
Ethylene
EDC
Fermentation
Dehydration
Chlorine
VCM
PVC
Cracking
Polymerization
Figure 8. Production of bio-based PVC
The water and land footprint of bioplastics
10
3 METHOD AND DATA
3.1 Method
The sub-research question as mentioned in the first chapter will be answered by following these
consecutive steps.
1. Making inventory of different biomaterials
2. Estimating the efficiency of biomaterials
3. Estimating the water and land footprint of source materials
4. Calculating the water and land footprint of final products
5. Calculating the total land and water footprint if all the fossil-feedstock plastic were replaced
by bioplastics
Inventory of different biomaterials
The first step is to make the inventory of biomaterials as a raw source of bioplastics and also an
alternative to production pathways. Bioplastic feedstocks are divided into first generation (traditional
agricultural crops), second generation (cellulosic crops as well as residue and agricultural waste
products), and third generation (non-traditional organism like some forms of algae and non-agricultural
wastes)(BFA, 2015). Most of the feedstock bioplastics come from food crops, so-called 1st generation
feedstock (EuropeanBioplastics, 2017).
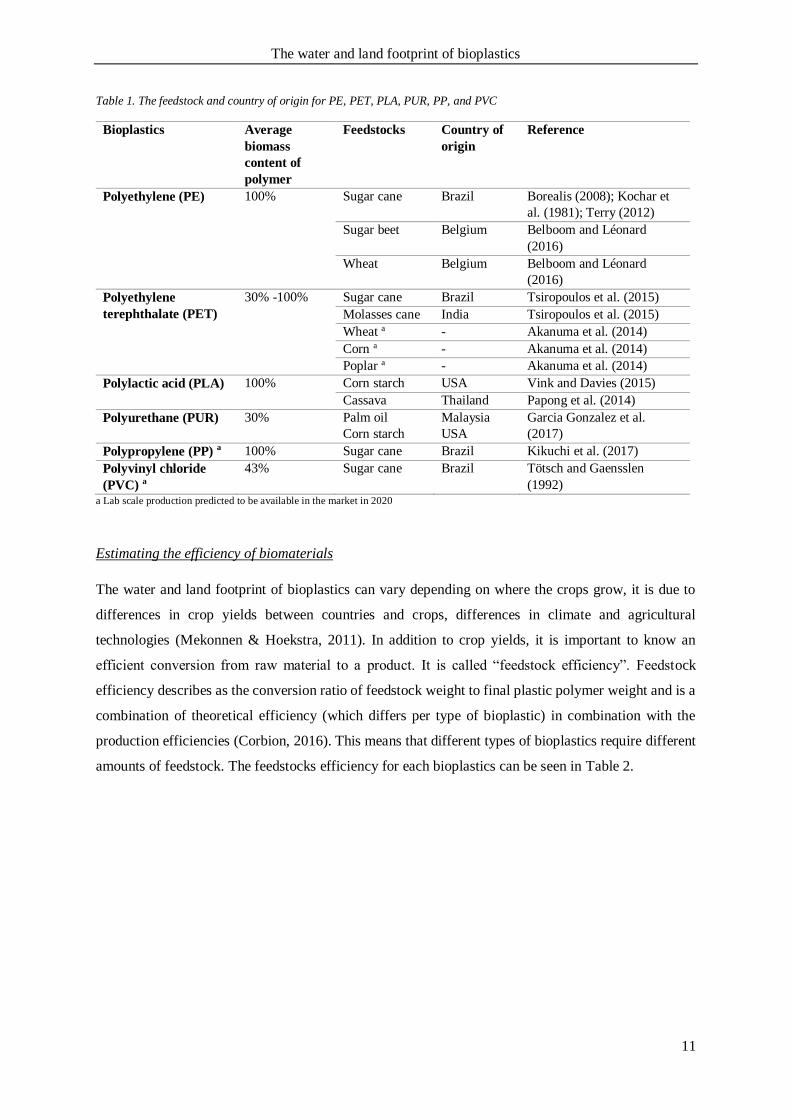
Table 1 shows the feedstocks, biomass content, and country of origin for PE, PET, PLA, PUR, PP, and
PVC. The inventory of feedstock for bioplastics is derived from Life Cycle Assessment (LCA) studies
and research related to bioplastics. Bio-based PE, partially bio-based PET, bio-based PUR, and bio-
based PLA has been mass produced. Meanwhile, for 100% PET, bio-based PP, and bio-based PVC,
they have not been commercially produced. Fully bio-based PET, bio-based PP, and bio-based PVC are
currently in development and predicted to be available in mass production scale in 2020.
The water and land footprint of bioplastics
11
Table 1. The feedstock and country of origin for PE, PET, PLA, PUR, PP, and PVC
Bioplastics Average
biomass
content of
polymer
Feedstocks Country of
origin
Reference
Polyethylene (PE) 100% Sugar cane Brazil Borealis (2008); Kochar et
al. (1981); Terry (2012)
Sugar beet Belgium Belboom and Léonard
(2016)
Wheat Belgium Belboom and Léonard
(2016)
Polyethylene
terephthalate (PET)
30% -100% Sugar cane Brazil Tsiropoulos et al. (2015)
Molasses cane India Tsiropoulos et al. (2015)
Wheat a - Akanuma et al. (2014)
Corn a - Akanuma et al. (2014)
Poplar a - Akanuma et al. (2014)
Polylactic acid (PLA) 100% Corn starch USA Vink and Davies (2015)
Cassava Thailand Papong et al. (2014)
Polyurethane (PUR) 30% Palm oil
Corn starch
Malaysia
USA
Garcia Gonzalez et al.
(2017)
Polypropylene (PP) a 100% Sugar cane Brazil Kikuchi et al. (2017)
Polyvinyl chloride
(PVC) a
43% Sugar cane Brazil Tötsch and Gaensslen
(1992) a Lab scale production predicted to be available in the market in 2020
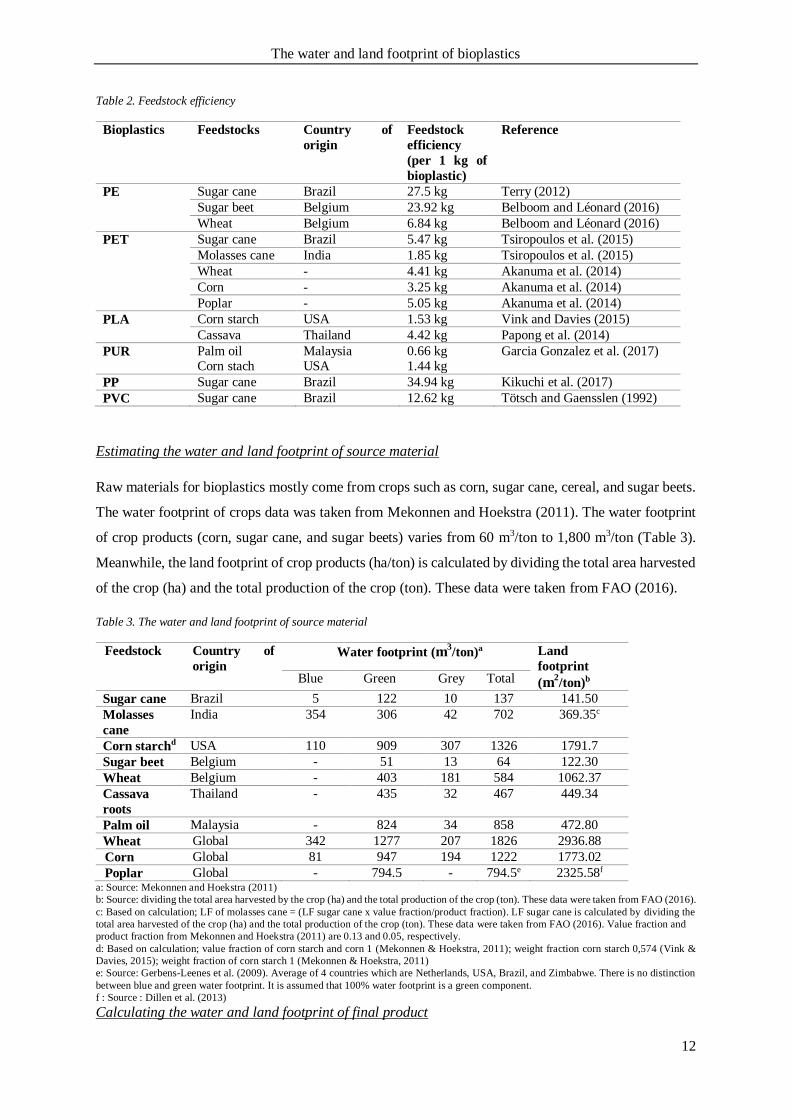
Estimating the efficiency of biomaterials
The water and land footprint of bioplastics can vary depending on where the crops grow, it is due to
differences in crop yields between countries and crops, differences in climate and agricultural
technologies (Mekonnen & Hoekstra, 2011). In addition to crop yields, it is important to know an
efficient conversion from raw material to a product. It is called “feedstock efficiency”. Feedstock
efficiency describes as the conversion ratio of feedstock weight to final plastic polymer weight and is a
combination of theoretical efficiency (which differs per type of bioplastic) in combination with the
production efficiencies (Corbion, 2016). This means that different types of bioplastics require different
amounts of feedstock. The feedstocks efficiency for each bioplastics can be seen in Table 2.
The water and land footprint of bioplastics
12
Table 2. Feedstock efficiency
Bioplastics Feedstocks Country of
origin
Feedstock
efficiency
(per 1 kg of
bioplastic)
Reference
PE Sugar cane Brazil 27.5 kg Terry (2012)
Sugar beet Belgium 23.92 kg Belboom and Léonard (2016)
Wheat Belgium 6.84 kg Belboom and Léonard (2016)
PET Sugar cane Brazil 5.47 kg Tsiropoulos et al. (2015)
Molasses cane India 1.85 kg Tsiropoulos et al. (2015)
Wheat - 4.41 kg Akanuma et al. (2014)
Corn - 3.25 kg Akanuma et al. (2014)
Poplar - 5.05 kg Akanuma et al. (2014)
PLA Corn starch USA 1.53 kg Vink and Davies (2015)
Cassava Thailand 4.42 kg Papong et al. (2014)
PUR Palm oil Corn stach
Malaysia USA
0.66 kg 1.44 kg
Garcia Gonzalez et al. (2017)
PP Sugar cane Brazil 34.94 kg Kikuchi et al. (2017)
PVC Sugar cane Brazil 12.62 kg Tötsch and Gaensslen (1992)
Estimating the water and land footprint of source material
Raw materials for bioplastics mostly come from crops such as corn, sugar cane, cereal, and sugar beets.
The water footprint of crops data was taken from Mekonnen and Hoekstra (2011). The water footprint
of crop products (corn, sugar cane, and sugar beets) varies from 60 m3/ton to 1,800 m3/ton (Table 3).
Meanwhile, the land footprint of crop products (ha/ton) is calculated by dividing the total area harvested
of the crop (ha) and the total production of the crop (ton). These data were taken from FAO (2016).
Table 3. The water and land footprint of source material
Feedstock Country of
origin Water footprint (m
3/ton)a Land
footprint
(m2/ton)b Blue Green Grey Total
Sugar cane Brazil 5 122 10 137 141.50
Molasses
cane
India 354 306 42 702 369.35c
Corn starchd USA 110 909 307 1326 1791.7
Sugar beet Belgium - 51 13 64 122.30
Wheat Belgium - 403 181 584 1062.37
Cassava
roots
Thailand - 435 32 467 449.34
Palm oil Malaysia - 824 34 858 472.80
Wheat Global 342 1277 207 1826 2936.88
Corn Global 81 947 194 1222 1773.02
Poplar Global - 794.5 - 794.5e 2325.58f a: Source: Mekonnen and Hoekstra (2011)
b: Source: dividing the total area harvested by the crop (ha) and the total production of the crop (ton). These data were taken from FAO (2016).
c: Based on calculation; LF of molasses cane = (LF sugar cane x value fraction/product fraction). LF sugar cane is calculated by dividing the
total area harvested of the crop (ha) and the total production of the crop (ton). These data were taken from FAO (2016). Value fraction and
product fraction from Mekonnen and Hoekstra (2011) are 0.13 and 0.05, respectively.
d: Based on calculation; value fraction of corn starch and corn 1 (Mekonnen & Hoekstra, 2011); weight fraction corn starch 0,574 (Vink &
Davies, 2015); weight fraction of corn starch 1 (Mekonnen & Hoekstra, 2011)
e: Source: Gerbens-Leenes et al. (2009). Average of 4 countries which are Netherlands, USA, Brazil, and Zimbabwe. There is no distinction
between blue and green water footprint. It is assumed that 100% water footprint is a green component.
f : Source : Dillen et al. (2013)
Calculating the water and land footprint of final product
The water and land footprint of bioplastics
13
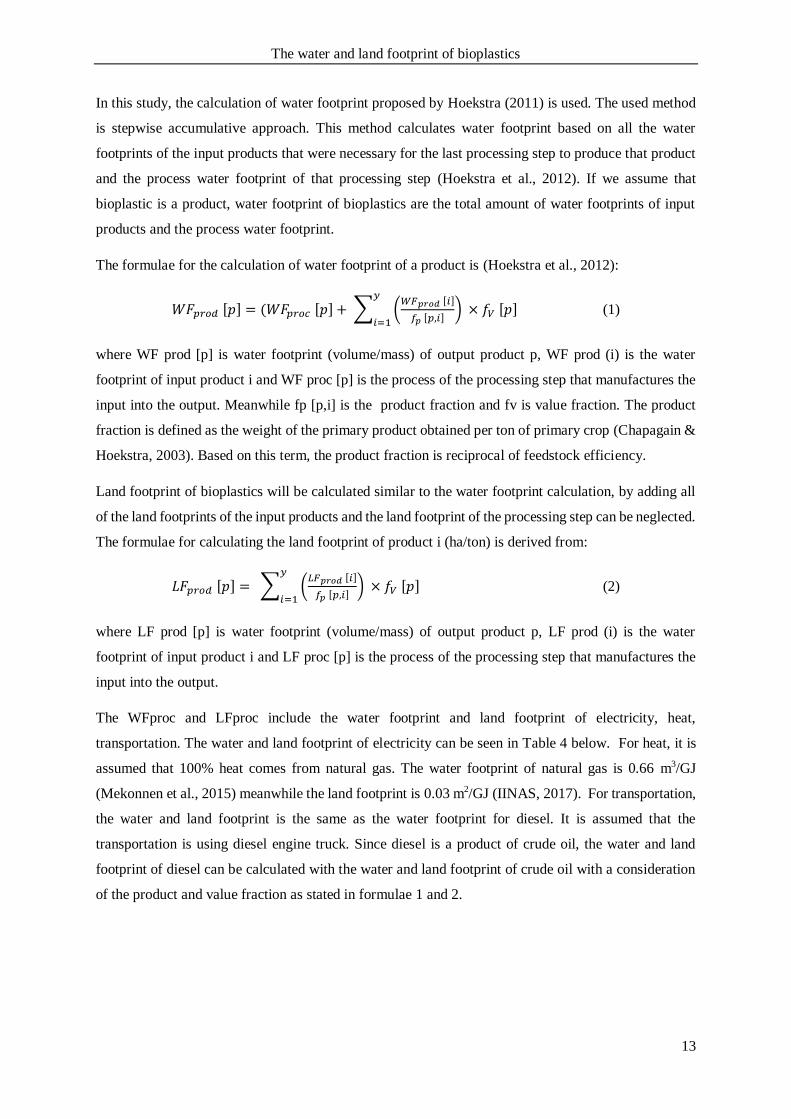
In this study, the calculation of water footprint proposed by Hoekstra (2011) is used. The used method
is stepwise accumulative approach. This method calculates water footprint based on all the water
footprints of the input products that were necessary for the last processing step to produce that product
and the process water footprint of that processing step (Hoekstra et al., 2012). If we assume that
bioplastic is a product, water footprint of bioplastics are the total amount of water footprints of input
products and the process water footprint.
The formulae for the calculation of water footprint of a product is (Hoekstra et al., 2012):
𝑊𝐹𝑝𝑟𝑜𝑑 [𝑝] = (𝑊𝐹𝑝𝑟𝑜𝑐 [𝑝] + ∑ (𝑊𝐹𝑝𝑟𝑜𝑑 [𝑖]
𝑓𝑝 [𝑝,𝑖]) × 𝑓𝑉 [𝑝]
𝑦
𝑖=1 (1)
where WF prod [p] is water footprint (volume/mass) of output product p, WF prod (i) is the water
footprint of input product i and WF proc [p] is the process of the processing step that manufactures the
input into the output. Meanwhile fp [p,i] is the product fraction and fv is value fraction. The product
fraction is defined as the weight of the primary product obtained per ton of primary crop (Chapagain &
Hoekstra, 2003). Based on this term, the product fraction is reciprocal of feedstock efficiency.
Land footprint of bioplastics will be calculated similar to the water footprint calculation, by adding all
of the land footprints of the input products and the land footprint of the processing step can be neglected.
The formulae for calculating the land footprint of product i (ha/ton) is derived from:
𝐿𝐹𝑝𝑟𝑜𝑑 [𝑝] = ∑ (𝐿𝐹𝑝𝑟𝑜𝑑 [𝑖]
𝑓𝑝 [𝑝,𝑖]) × 𝑓𝑉 [𝑝]
𝑦
𝑖=1 (2)
where LF prod [p] is water footprint (volume/mass) of output product p, LF prod (i) is the water
footprint of input product i and LF proc [p] is the process of the processing step that manufactures the
input into the output.
The WFproc and LFproc include the water footprint and land footprint of electricity, heat,
transportation. The water and land footprint of electricity can be seen in Table 4 below. For heat, it is
assumed that 100% heat comes from natural gas. The water footprint of natural gas is 0.66 m3/GJ
(Mekonnen et al., 2015) meanwhile the land footprint is 0.03 m2/GJ (IINAS, 2017). For transportation,
the water and land footprint is the same as the water footprint for diesel. It is assumed that the
transportation is using diesel engine truck. Since diesel is a product of crude oil, the water and land
footprint of diesel can be calculated with the water and land footprint of crude oil with a consideration
of the product and value fraction as stated in formulae 1 and 2.
The water and land footprint of bioplastics
14
Table 4. The water and land footprint of energy sources for electricity generation
Electricity
sources
Water
footprint(m3/GJ)a
Land footprint (m2/GJ)
Typicalb EUc USAd
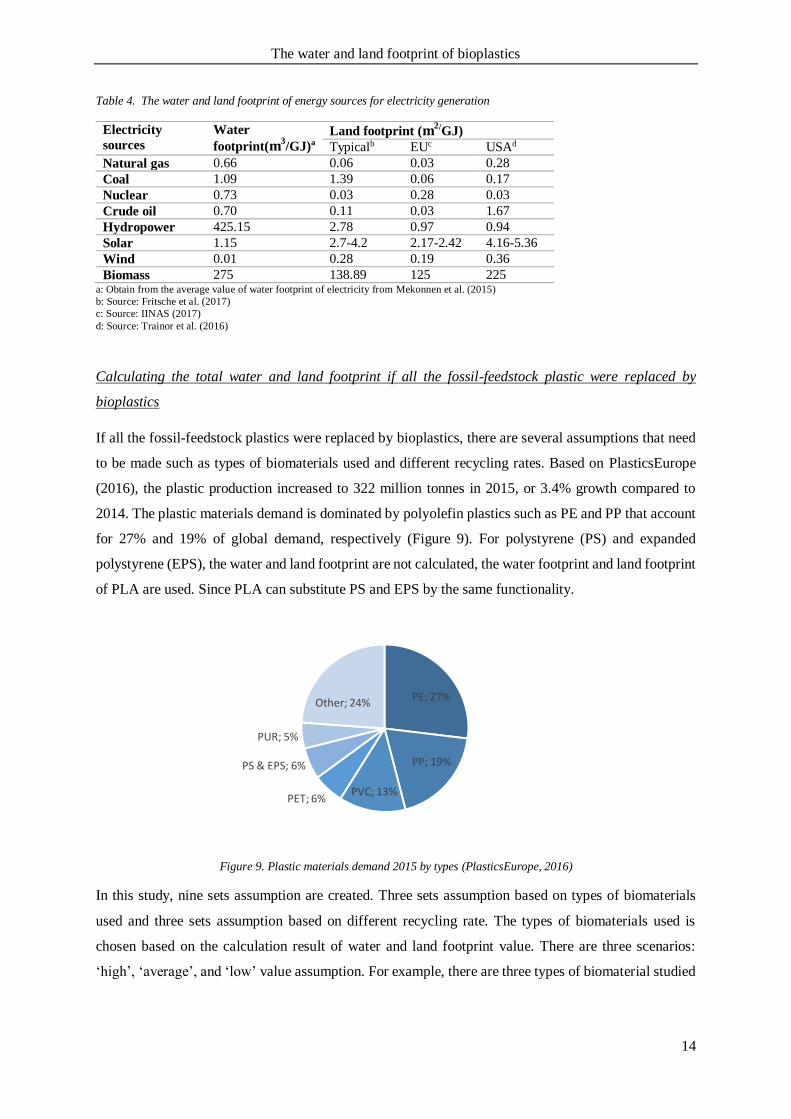
Natural gas 0.66 0.06 0.03 0.28
Coal 1.09 1.39 0.06 0.17
Nuclear 0.73 0.03 0.28 0.03
Crude oil 0.70 0.11 0.03 1.67
Hydropower 425.15 2.78 0.97 0.94
Solar 1.15 2.7-4.2 2.17-2.42 4.16-5.36
Wind 0.01 0.28 0.19 0.36
Biomass 275 138.89 125 225 a: Obtain from the average value of water footprint of electricity from Mekonnen et al. (2015)
b: Source: Fritsche et al. (2017)
c: Source: IINAS (2017)
d: Source: Trainor et al. (2016)
Calculating the total water and land footprint if all the fossil-feedstock plastic were replaced by
bioplastics
If all the fossil-feedstock plastics were replaced by bioplastics, there are several assumptions that need
to be made such as types of biomaterials used and different recycling rates. Based on PlasticsEurope
(2016), the plastic production increased to 322 million tonnes in 2015, or 3.4% growth compared to
2014. The plastic materials demand is dominated by polyolefin plastics such as PE and PP that account
for 27% and 19% of global demand, respectively (Figure 9). For polystyrene (PS) and expanded
polystyrene (EPS), the water and land footprint are not calculated, the water footprint and land footprint
of PLA are used. Since PLA can substitute PS and EPS by the same functionality.
Figure 9. Plastic materials demand 2015 by types (PlasticsEurope, 2016)
In this study, nine sets assumption are created. Three sets assumption based on types of biomaterials
used and three sets assumption based on different recycling rate. The types of biomaterials used is
chosen based on the calculation result of water and land footprint value. There are three scenarios:
‘high’, ‘average’, and ‘low’ value assumption. For example, there are three types of biomaterial studied
PE; 27%
PP; 19%
PVC; 13%PET; 6%
PS & EPS; 6%
PUR; 5%
Other; 24%
The water and land footprint of bioplastics
15
for PE, for the high assumption, the highest water, and the land footprint is used, etc. For PP, PUR, and
PVC, since only one biomaterial is calculated, the same value is applied to three scenarios.
For the recycling rate, there are three scenarios as well. Scenario 1 assumes recycling 10%, scenario 2
assumes 36% recycling, and scenario 3 62%. Scenario 1 is selected because it is the recycling rate for
today (WEF, 2017). Scenario 2 corresponds to the target recycling rate of EU for 2020 (Mudgal et al.,
2013). Scenario 3 corresponds to the possible recycling of all plastics (Mudgal et al., 2013).
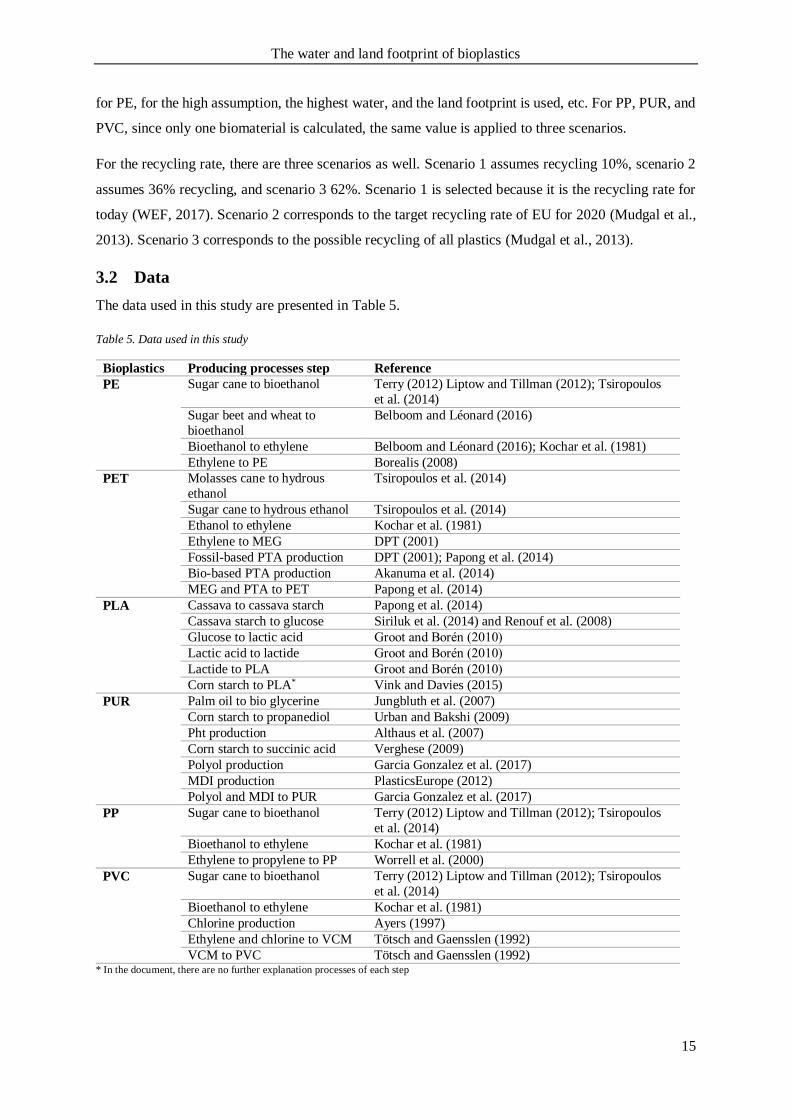
3.2 Data
The data used in this study are presented in Table 5.
Table 5. Data used in this study
Bioplastics Producing processes step Reference
PE Sugar cane to bioethanol Terry (2012) Liptow and Tillman (2012); Tsiropoulos
et al. (2014)
Sugar beet and wheat to
bioethanol
Belboom and Léonard (2016)
Bioethanol to ethylene Belboom and Léonard (2016); Kochar et al. (1981)
Ethylene to PE Borealis (2008)
PET Molasses cane to hydrous
ethanol
Tsiropoulos et al. (2014)
Sugar cane to hydrous ethanol Tsiropoulos et al. (2014)
Ethanol to ethylene Kochar et al. (1981)
Ethylene to MEG DPT (2001)
Fossil-based PTA production DPT (2001); Papong et al. (2014)
Bio-based PTA production Akanuma et al. (2014)
MEG and PTA to PET Papong et al. (2014)
PLA Cassava to cassava starch Papong et al. (2014)
Cassava starch to glucose Siriluk et al. (2014) and Renouf et al. (2008)
Glucose to lactic acid Groot and Boren (2010)
Lactic acid to lactide Groot and Boren (2010)
Lactide to PLA Groot and Boren (2010)
Corn starch to PLA* Vink and Davies (2015)
PUR Palm oil to bio glycerine Jungbluth et al. (2007)
Corn starch to propanediol Urban and Bakshi (2009)
Pht production Althaus et al. (2007)
Corn starch to succinic acid Verghese (2009)
Polyol production Garcia Gonzalez et al. (2017)
MDI production PlasticsEurope (2012)
Polyol and MDI to PUR Garcia Gonzalez et al. (2017)
PP Sugar cane to bioethanol Terry (2012) Liptow and Tillman (2012); Tsiropoulos
et al. (2014)
Bioethanol to ethylene Kochar et al. (1981)
Ethylene to propylene to PP Worrell et al. (2000)
PVC Sugar cane to bioethanol Terry (2012) Liptow and Tillman (2012); Tsiropoulos
et al. (2014)
Bioethanol to ethylene Kochar et al. (1981)
Chlorine production Ayers (1997)
Ethylene and chlorine to VCM Tötsch and Gaensslen (1992)
VCM to PVC Tötsch and Gaensslen (1992) * In the document, there are no further explanation processes of each step
The water and land footprint of bioplastics
16
4 RESULTS
4.1 Water footprint of bioplastics
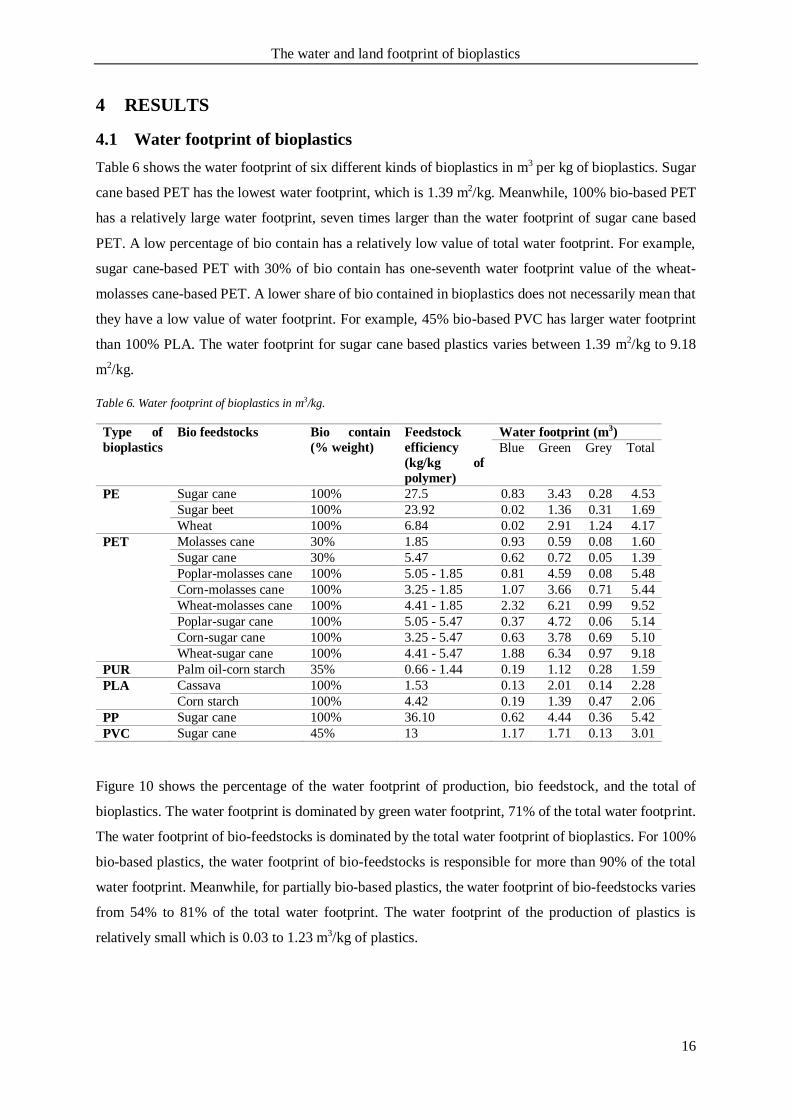
Table 6 shows the water footprint of six different kinds of bioplastics in m3 per kg of bioplastics. Sugar
cane based PET has the lowest water footprint, which is 1.39 m2/kg. Meanwhile, 100% bio-based PET
has a relatively large water footprint, seven times larger than the water footprint of sugar cane based
PET. A low percentage of bio contain has a relatively low value of total water footprint. For example,
sugar cane-based PET with 30% of bio contain has one-seventh water footprint value of the wheat-
molasses cane-based PET. A lower share of bio contained in bioplastics does not necessarily mean that
they have a low value of water footprint. For example, 45% bio-based PVC has larger water footprint
than 100% PLA. The water footprint for sugar cane based plastics varies between 1.39 m2/kg to 9.18
m2/kg.
Table 6. Water footprint of bioplastics in m3/kg.
Type of
bioplastics
Bio feedstocks Bio contain
(% weight)
Feedstock
efficiency
(kg/kg of
polymer)
Water footprint (m3)
Blue Green Grey Total
PE Sugar cane 100% 27.5 0.83 3.43 0.28 4.53
Sugar beet 100% 23.92 0.02 1.36 0.31 1.69
Wheat 100% 6.84 0.02 2.91 1.24 4.17
PET Molasses cane 30% 1.85 0.93 0.59 0.08 1.60
Sugar cane 30% 5.47 0.62 0.72 0.05 1.39
Poplar-molasses cane 100% 5.05 - 1.85 0.81 4.59 0.08 5.48
Corn-molasses cane 100% 3.25 - 1.85 1.07 3.66 0.71 5.44
Wheat-molasses cane 100% 4.41 - 1.85 2.32 6.21 0.99 9.52
Poplar-sugar cane 100% 5.05 - 5.47 0.37 4.72 0.06 5.14
Corn-sugar cane 100% 3.25 - 5.47 0.63 3.78 0.69 5.10
Wheat-sugar cane 100% 4.41 - 5.47 1.88 6.34 0.97 9.18
PUR Palm oil-corn starch 35% 0.66 - 1.44 0.19 1.12 0.28 1.59
PLA Cassava 100% 1.53 0.13 2.01 0.14 2.28
Corn starch 100% 4.42 0.19 1.39 0.47 2.06
PP Sugar cane 100% 36.10 0.62 4.44 0.36 5.42
PVC Sugar cane 45% 13 1.17 1.71 0.13 3.01
Figure 10 shows the percentage of the water footprint of production, bio feedstock, and the total of
bioplastics. The water footprint is dominated by green water footprint, 71% of the total water footprint.
The water footprint of bio-feedstocks is dominated by the total water footprint of bioplastics. For 100%
bio-based plastics, the water footprint of bio-feedstocks is responsible for more than 90% of the total
water footprint. Meanwhile, for partially bio-based plastics, the water footprint of bio-feedstocks varies
from 54% to 81% of the total water footprint. The water footprint of the production of plastics is
relatively small which is 0.03 to 1.23 m3/kg of plastics.
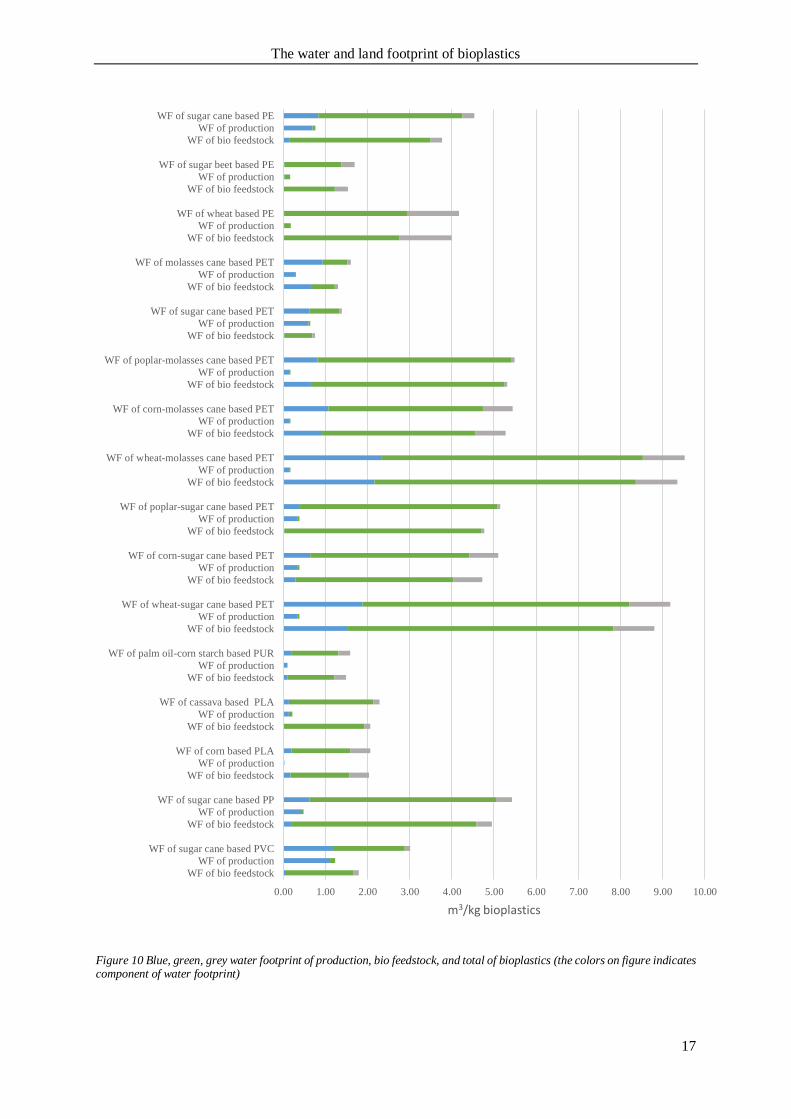
The water and land footprint of bioplastics
17
Figure 10 Blue, green, grey water footprint of production, bio feedstock, and total of bioplastics (the colors on figure indicates component of water footprint)
0.00 1.00 2.00 3.00 4.00 5.00 6.00 7.00 8.00 9.00 10.00
WF of bio feedstock
WF of production
WF of sugar cane based PVC
WF of bio feedstock
WF of production
WF of sugar cane based PP
WF of bio feedstock
WF of production
WF of corn based PLA
WF of bio feedstock
WF of production
WF of cassava based PLA
WF of bio feedstock
WF of production
WF of palm oil-corn starch based PUR
WF of bio feedstock
WF of production
WF of wheat-sugar cane based PET
WF of bio feedstock
WF of production
WF of corn-sugar cane based PET
WF of bio feedstock
WF of production
WF of poplar-sugar cane based PET
WF of bio feedstock
WF of production
WF of wheat-molasses cane based PET
WF of bio feedstock
WF of production
WF of corn-molasses cane based PET
WF of bio feedstock
WF of production
WF of poplar-molasses cane based PET
WF of bio feedstock
WF of production
WF of sugar cane based PET
WF of bio feedstock
WF of production
WF of molasses cane based PET
WF of bio feedstock
WF of production
WF of wheat based PE
WF of bio feedstock
WF of production
WF of sugar beet based PE
WF of bio feedstock
WF of production
WF of sugar cane based PE
m3/kg bioplastics
The water and land footprint of bioplastics
18
4.2 Land footprint of bioplastics
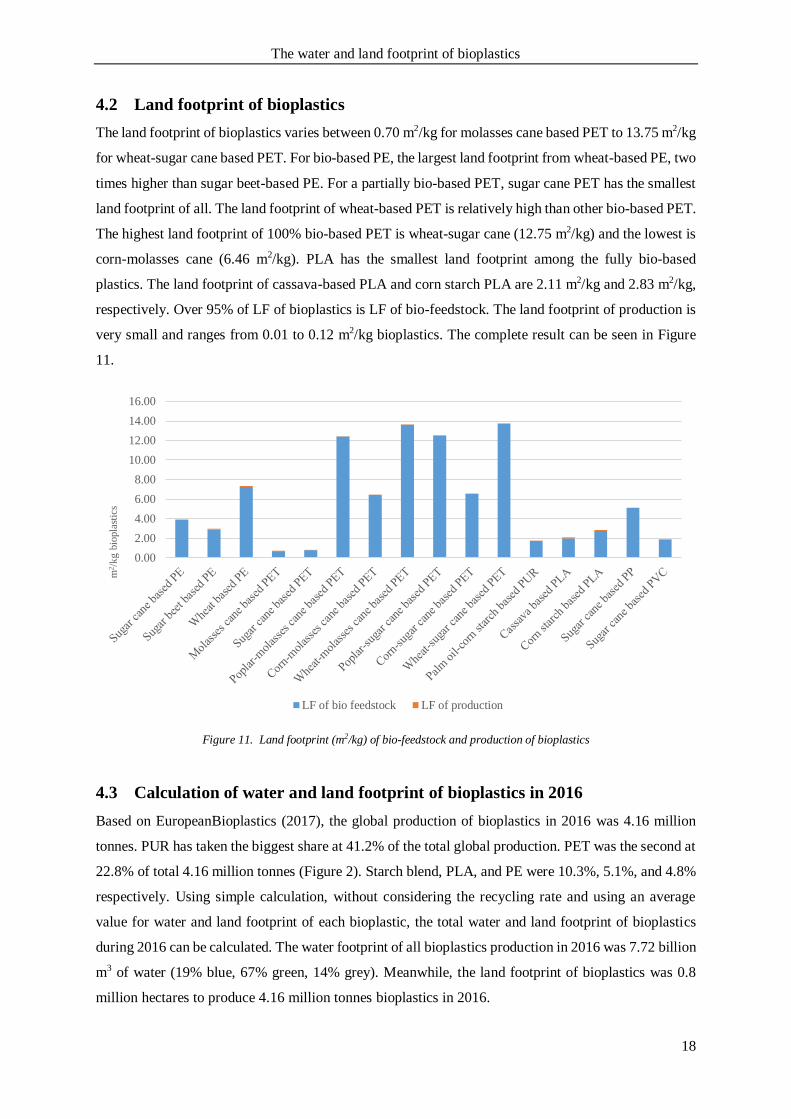
The land footprint of bioplastics varies between 0.70 m2/kg for molasses cane based PET to 13.75 m2/kg
for wheat-sugar cane based PET. For bio-based PE, the largest land footprint from wheat-based PE, two
times higher than sugar beet-based PE. For a partially bio-based PET, sugar cane PET has the smallest
land footprint of all. The land footprint of wheat-based PET is relatively high than other bio-based PET.
The highest land footprint of 100% bio-based PET is wheat-sugar cane (12.75 m2/kg) and the lowest is
corn-molasses cane (6.46 m2/kg). PLA has the smallest land footprint among the fully bio-based
plastics. The land footprint of cassava-based PLA and corn starch PLA are 2.11 m2/kg and 2.83 m2/kg,
respectively. Over 95% of LF of bioplastics is LF of bio-feedstock. The land footprint of production is
very small and ranges from 0.01 to 0.12 m2/kg bioplastics. The complete result can be seen in Figure
11.
Figure 11. Land footprint (m2/kg) of bio-feedstock and production of bioplastics
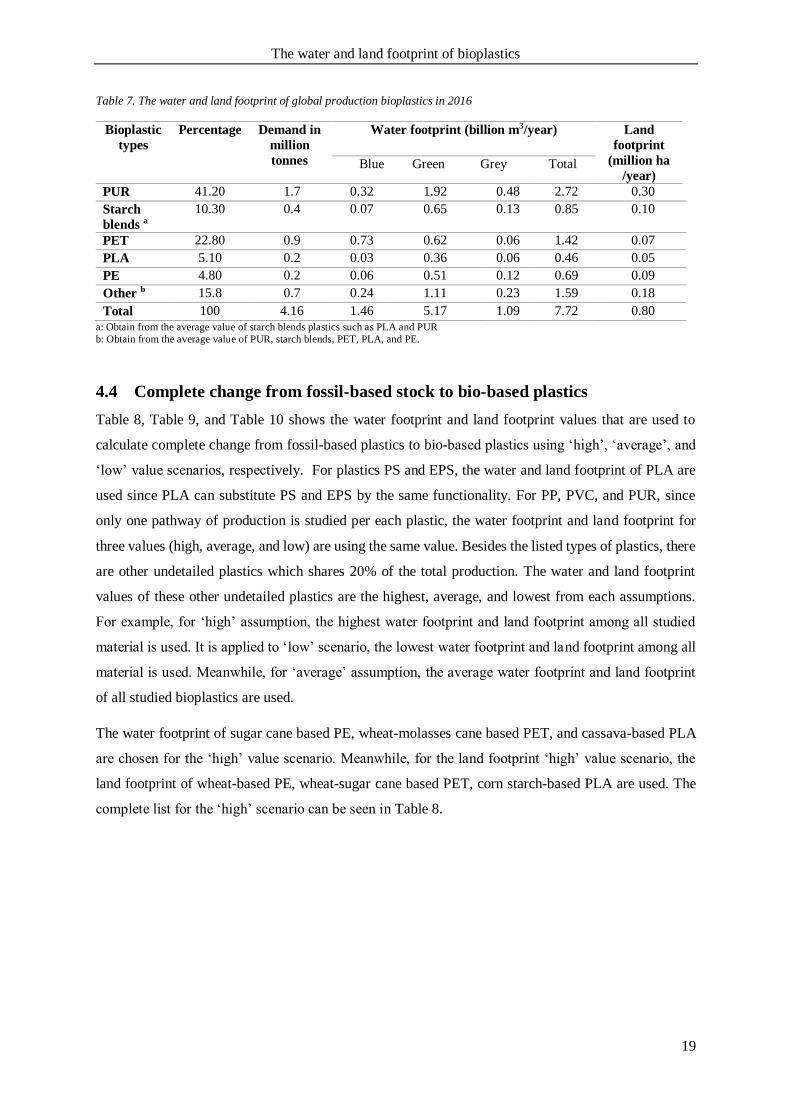
4.3 Calculation of water and land footprint of bioplastics in 2016
Based on EuropeanBioplastics (2017), the global production of bioplastics in 2016 was 4.16 million
tonnes. PUR has taken the biggest share at 41.2% of the total global production. PET was the second at
22.8% of total 4.16 million tonnes (Figure 2). Starch blend, PLA, and PE were 10.3%, 5.1%, and 4.8%
respectively. Using simple calculation, without considering the recycling rate and using an average
value for water and land footprint of each bioplastic, the total water and land footprint of bioplastics
during 2016 can be calculated. The water footprint of all bioplastics production in 2016 was 7.72 billion
m3 of water (19% blue, 67% green, 14% grey). Meanwhile, the land footprint of bioplastics was 0.8
million hectares to produce 4.16 million tonnes bioplastics in 2016.
0.00
2.00
4.00
6.00
8.00
10.00
12.00
14.00
16.00
m2/k
g b
iopla
stic
s
LF of bio feedstock LF of production
The water and land footprint of bioplastics
19
Table 7. The water and land footprint of global production bioplastics in 2016
Bioplastic
types
Percentage
Demand in
million
tonnes
Water footprint (billion m3/year) Land
footprint
(million ha
/year) Blue Green Grey Total
PUR 41.20 1.7 0.32 1.92 0.48 2.72 0.30
Starch
blends a
10.30 0.4 0.07 0.65 0.13 0.85 0.10
PET 22.80 0.9 0.73 0.62 0.06 1.42 0.07
PLA 5.10 0.2 0.03 0.36 0.06 0.46 0.05
PE 4.80 0.2 0.06 0.51 0.12 0.69 0.09
Other b 15.8 0.7 0.24 1.11 0.23 1.59 0.18
Total 100 4.16 1.46 5.17 1.09 7.72 0.80
a: Obtain from the average value of starch blends plastics such as PLA and PUR
b: Obtain from the average value of PUR, starch blends, PET, PLA, and PE.
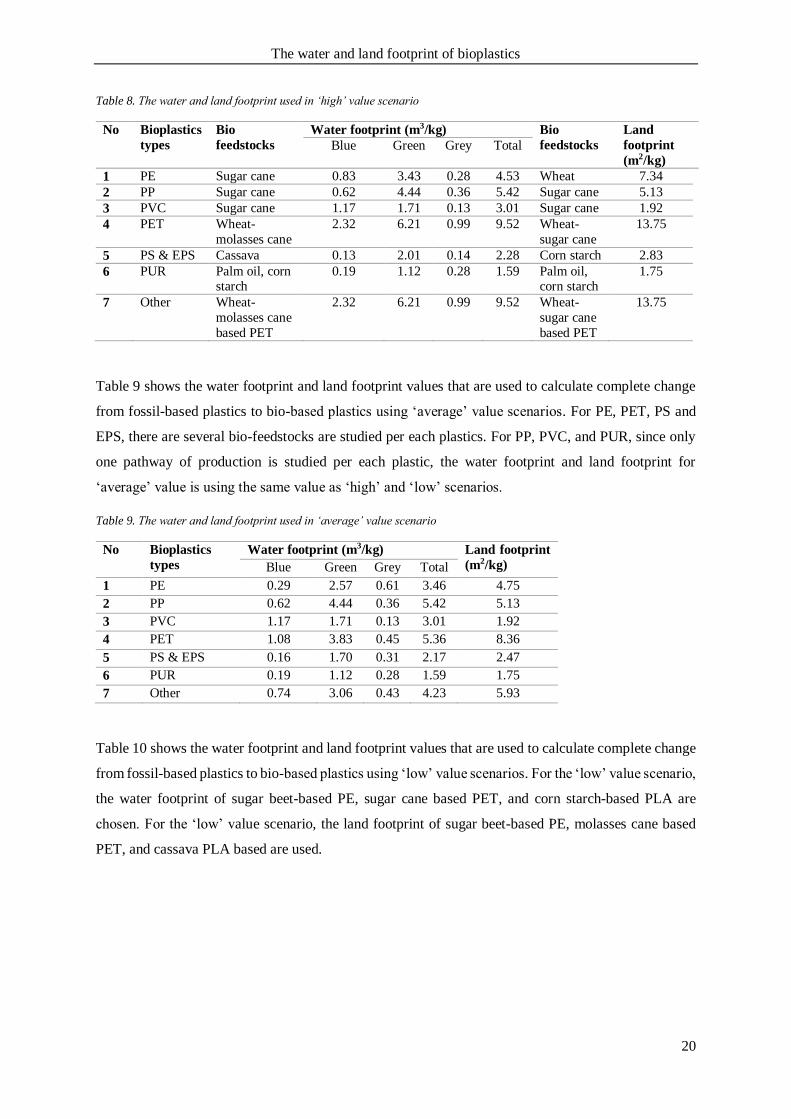
4.4 Complete change from fossil-based stock to bio-based plastics
Table 8, Table 9, and Table 10 shows the water footprint and land footprint values that are used to
calculate complete change from fossil-based plastics to bio-based plastics using ‘high’, ‘average’, and
‘low’ value scenarios, respectively. For plastics PS and EPS, the water and land footprint of PLA are
used since PLA can substitute PS and EPS by the same functionality. For PP, PVC, and PUR, since
only one pathway of production is studied per each plastic, the water footprint and land footprint for
three values (high, average, and low) are using the same value. Besides the listed types of plastics, there
are other undetailed plastics which shares 20% of the total production. The water and land footprint
values of these other undetailed plastics are the highest, average, and lowest from each assumptions.
For example, for ‘high’ assumption, the highest water footprint and land footprint among all studied
material is used. It is applied to ‘low’ scenario, the lowest water footprint and land footprint among all
material is used. Meanwhile, for ‘average’ assumption, the average water footprint and land footprint
of all studied bioplastics are used.
The water footprint of sugar cane based PE, wheat-molasses cane based PET, and cassava-based PLA
are chosen for the ‘high’ value scenario. Meanwhile, for the land footprint ‘high’ value scenario, the
land footprint of wheat-based PE, wheat-sugar cane based PET, corn starch-based PLA are used. The
complete list for the ‘high’ scenario can be seen in Table 8.
The water and land footprint of bioplastics
20
Table 8. The water and land footprint used in ‘high’ value scenario
No Bioplastics
types
Bio
feedstocks
Water footprint (m3/kg) Bio
feedstocks
Land
footprint
(m2/kg)
Blue Green Grey Total
1 PE Sugar cane 0.83 3.43 0.28 4.53 Wheat 7.34
2 PP Sugar cane 0.62 4.44 0.36 5.42 Sugar cane 5.13
3 PVC Sugar cane 1.17 1.71 0.13 3.01 Sugar cane 1.92
4 PET Wheat-
molasses cane
2.32 6.21 0.99 9.52 Wheat-
sugar cane
13.75
5 PS & EPS Cassava 0.13 2.01 0.14 2.28 Corn starch 2.83
6 PUR Palm oil, corn starch
0.19 1.12 0.28 1.59 Palm oil, corn starch
1.75
7 Other Wheat-
molasses cane
based PET
2.32 6.21 0.99 9.52 Wheat-
sugar cane
based PET
13.75
Table 9 shows the water footprint and land footprint values that are used to calculate complete change
from fossil-based plastics to bio-based plastics using ‘average’ value scenarios. For PE, PET, PS and
EPS, there are several bio-feedstocks are studied per each plastics. For PP, PVC, and PUR, since only
one pathway of production is studied per each plastic, the water footprint and land footprint for
‘average’ value is using the same value as ‘high’ and ‘low’ scenarios.
Table 9. The water and land footprint used in ‘average’ value scenario
No Bioplastics
types
Water footprint (m3/kg) Land footprint
(m2/kg) Blue Green Grey Total
1 PE 0.29 2.57 0.61 3.46 4.75
2 PP 0.62 4.44 0.36 5.42 5.13
3 PVC 1.17 1.71 0.13 3.01 1.92
4 PET 1.08 3.83 0.45 5.36 8.36
5 PS & EPS 0.16 1.70 0.31 2.17 2.47
6 PUR 0.19 1.12 0.28 1.59 1.75
7 Other 0.74 3.06 0.43 4.23 5.93
Table 10 shows the water footprint and land footprint values that are used to calculate complete change
from fossil-based plastics to bio-based plastics using ‘low’ value scenarios. For the ‘low’ value scenario,
the water footprint of sugar beet-based PE, sugar cane based PET, and corn starch-based PLA are
chosen. For the ‘low’ value scenario, the land footprint of sugar beet-based PE, molasses cane based
PET, and cassava PLA based are used.
The water and land footprint of bioplastics
21
Table 10. The water and land footprint used in ‘low’ value scenario
No Bioplastics
types
Bio
feedstocks
Water footprint (m3/kg) Bio feedstocks Land
footprint
(m2/kg) Blue Green Grey Total
1 PE Sugar beet 0.02 1.36 0.31 1.69 Sugar beet 2.99
2 PP Sugar cane 0.62 4.44 0.36 5.42 Sugar cane 5.13
3 PVC Sugar cane 1.17 1.71 0.13 3.01 Sugar cane 1.92
4 PET Sugar cane 0.62 0.72 0.05 1.39 Molasses cane 0.70
5 PS & EPS Corn starch 0.19 1.39 0.47 2.06 Cassava 2.11
6 PUR Palm oil,
corn starch
0.19 1.12 0.28 1.59 Palm oil, corn
starch
1.75
7 Other Sugar cane
based PET
0.62 0.72 0.05 1.39 Molasses cane
based PET
0.70
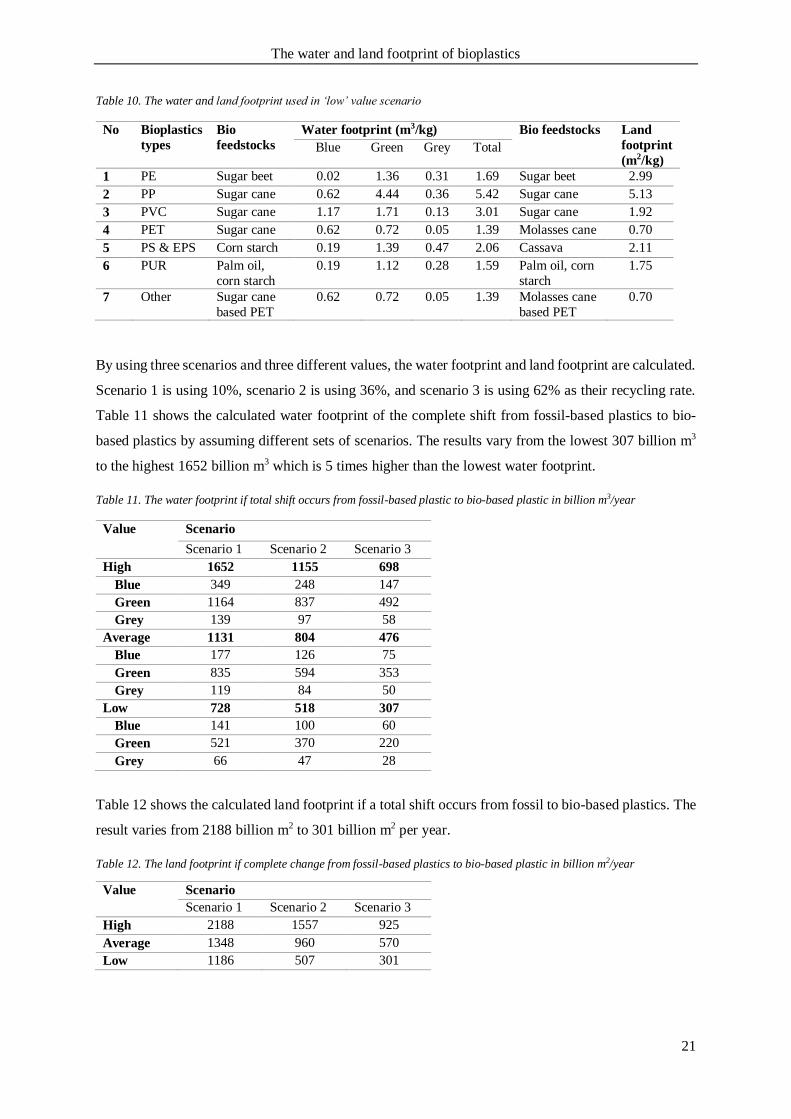
By using three scenarios and three different values, the water footprint and land footprint are calculated.
Scenario 1 is using 10%, scenario 2 is using 36%, and scenario 3 is using 62% as their recycling rate.
Table 11 shows the calculated water footprint of the complete shift from fossil-based plastics to bio-
based plastics by assuming different sets of scenarios. The results vary from the lowest 307 billion m3
to the highest 1652 billion m3 which is 5 times higher than the lowest water footprint.
Table 11. The water footprint if total shift occurs from fossil-based plastic to bio-based plastic in billion m3/year
Value Scenario
Scenario 1 Scenario 2 Scenario 3
High 1652 1155 698
Blue 349 248 147
Green 1164 837 492
Grey 139 97 58
Average 1131 804 476
Blue 177 126 75
Green 835 594 353
Grey 119 84 50
Low 728 518 307
Blue 141 100 60
Green 521 370 220
Grey 66 47 28
Table 12 shows the calculated land footprint if a total shift occurs from fossil to bio-based plastics. The
result varies from 2188 billion m2 to 301 billion m2 per year.
Table 12. The land footprint if complete change from fossil-based plastics to bio-based plastic in billion m2/year
Value Scenario
Scenario 1 Scenario 2 Scenario 3
High 2188 1557 925
Average 1348 960 570
Low 1186 507 301
The water and land footprint of bioplastics
22
5 DISCUSSION
The water footprint of bioplastic varies between 1.39 m3/kg to 9.52 m3/kg. The water footprint of
bioplastics is dominated by green water footprint, 52% to 92% of the total water footprint. The water
footprint of bio-feedstocks is dominated by the total water footprint of bioplastics. The land footprint
of bioplastic varies between 0.70 m2/kg to 13.75 m2/kg. Over 95% of the land footprint of bioplastics
is the land footprint of bio-feedstocks. The land footprint of production is very small and ranges from
0.01 to 0.12 m2/kg bioplastics.
Based on Hoekstra and Mekonnen (2012), the global water footprint related to agricultural and
industrial production and domestic water supply was 9,087 billion m3/year (74% green, 11% blue, and
15% grey). Agricultural production takes the largest share about 92% of the global water footprint. The
water footprint of all bioplastics production in 2016 is 7.72 billion m3 of water (66% green, 18%
blue,14% grey). The water footprint of bioplastics is really small if it is compared to the global annual
average water footprint.
Meanwhile, the land footprint of bioplastics is 0.8 million hectares to produce 4.16 million tonnes
bioplastics in 2016. Compared to the total global agricultural area which is 5 billion ha
EuropeanBioplastics (2017) and Carus (2011), it accounted about 0.016% of this land.
EuropeanBioplastics (2017) has calculated the land use for bioplastic in 2014 and 2019. In 2014, the
global production capacities of bioplastics amounted to 1.7 million tonnes, which required
approximately 680,000 hectares of land (0.01% of global agricultural area). In 2019, it may account
about 0.02% which would be 1.4 million hectares. Today, bioplastics are not a significant user of land
and they are not predicted to become a competitor in near future (BFA, 2015).
The water footprint of a total shift to bio-based plastics varies from 307 billion to 1,652 billion m3 water
per year. To place this number in a perspective, the global annual average water footprint is 9,087 billion
m3/year. The complete change to bio-based plastics are accounted about 3% to 18% of the global annual
water footprint.
The land footprint of a complete change to bio-based plastic varies from 30 million to 219 million
hectares per year. According EuropeanBioplastics (2017) and Carus (2011), the available global
agricultural area is about 5 billion hectares. The complete change to bio-based plastics would need 0.6%
for the lowest scenario and 4.4% for the highest scenario of this land. In 2008, 5 billion ha of land was
used as pasture ground (71%) and the rest of cropland (29%). The cropland was used to produce food
(5.2%), feed (20.6%), and bioenergy (1.1%). Based on Carus (2011), 570 million hectares of the free
agricultural area were still available in 2006. To substitute 322 million tonnes of plastic in the world
with bio-based plastics would need 38% of this land at the extreme case and 5% at the lowest case.
However, the global additional demand for land use by 2020 for food, residential area, and biofuels was
The water and land footprint of bioplastics
23
estimated at 210 million hectares, leaving 360 million hectares free (Vink & Davies, 2015). The
complete change will take about 8% to 61% of the free arable land.
Carus (2011) stated that in principle there are sufficient and sustainable biomass resources available for
food, feed, bioenergy, and industrial material use including bio-based plastics. To achieve that, the
crucial steps must be taken into action which is optimized biomass allocation by improving the
technology and infrastructure, invest in agricultural, political reforms, optimizing human food habits to
sustainability. For the bioplastics, it is important to choose the feedstocks wisely with the high yield
and the maximum feedstocks efficiency.
The variation of the water and land footprint of bioplastics are highly influenced by water and land
footprint of crops because the crop production dominates the water and land footprint of bioplastics.
The water and land footprint of crops can vary depending on where the crops grow, it is due to
differences in crop yields between countries and crops, differences in climate and agricultural
technologies (Mekonnen & Hoekstra, 2011). Besides that, the water and land footprint of bioplastics
are affected by the conversion ratio of feedstock weight to final plastic polymer weight or the feedstock
efficiency. In terms of feedstock efficiency, PLA is the most efficient. For 1 kg of PLA, it needs 1.6 kg
of cassava roots as feedstock. Corbion (2016) stated that other bioplastics can require 2.5 to 3 times
more starch feedstocks to produce the same amount of plastics. The production pathway of bioplastics
does not seems too important to most of the cases. For partially bio-based bioplastics that still highly
depend on fossil-based feedstocks, the fossil-based production pathways can affect the magnitude of
water and land footprint of bioplastics.
The water footprint of bioplastics comes mostly from growing crops. For all studied bioplastics, the
water footprint of bio-feedstocks shares 90% of the total water footprint. The outliers are sugar cane
based PE, sugar cane based PET, and sugar cane based PVC. The water footprint of bio-feedstocks for
these three bioplastics are 83%, 54%, and 59%, respectively. The water footprint of bio-feedstocks for
sugar cane based PET (30% bio-based contain) and sugar cane based PVC (45% bio-based contain) has
almost the same water footprint of its production. For sugar cane based PET, the water footprint of
Brazilian sugar cane is 137 m3/ton, relatively small compared to India molasses cane which is 702
m3/ton. For the production itself, the water footprint for producing sugar cane based PET is twice the
amount of molasses cane based PET. The water footprint of production goes mostly to electricity (94%).
The water footprint of electricity in Brazil is relatively high, almost double the water footprint electricity
of India. The oddity of sugar cane based PET because of the small water footprint of bio-feedstocks and
the high water footprint of electricity. For sugar cane based PVC, the water footprint of bio-feedstock
share is small. It is because, chlorine which is the main input product of PVC, is the energy-intensive
product. To produce 1 kg chlorine, 10 MJ of electricity is needed, it is about ten times higher than the
The water and land footprint of bioplastics
24
electricity needed for the polymerization of plastics. It makes the water footprint of production PVC
much higher than other bioplastics.
Several recycling rates are set to calculate complete change from fossil-based plastics to bio-based
plastics which are 10%, 36%, and 62%. The calculation of water and land footprint of recycling process
itself are not taken into account. WEF (2017) stated that from 14% recycling rate of plastic, about 4%
is losses in the process itself. This 4% equals to around 28.6% of the total recycling rate. It means that
this portion of the material is lost during the recycling rate process which is not considered in the
calculation. If the energy for recycling rate and material losses during recycling process are taken into
account, the water and land footprint will be higher.
The water footprint of bioplastics based on all the water footprint of the input product that was necessary
for the last processing step to produce that product and the process water footprint of that processing
step. For water as input product, the net water consumption is directly added to the blue water footprint.
The water emission during the process is simply neglected. It overestimates the blue water footprint,
meanwhile, estimation of the grey water footprint is probably under-estimated.
The calculation of water and land footprint of bioplastics do not consider the surplus electricity during
the production of bioplastics. For example, electricity production during the production stage of the
hydrous ethanol from sugar cane through producing biogas. The surplus electricity is about 0.6 MJ/kg
hydrous ethanol. The surplus electricity can be sold to the grid or used for the production itself. If it
considers use for the production of bioplastic, the electricity needed for producing bioplastic will
decrease. It will decrease the small amount of water footprint of bioplastic (accounted about 3%) but it
will not change the land footprint of bioplastics because most of the land footprint of bioplastic (98%)
is used for growing crop.
For 100% bio-based PET, the water and land footprint of PTA only consider water and land footprint
of the feedstocks which are wheat, corn, and poplar. This leads to under-estimation of the water and
land footprint of a fully bio-based PET. If we assume, the energy of bio-based PTA is the same as the
energy of fossil-based PTA, the water footprint will increase about 2-5%. For the land footprint, only
the small amount will increase, about 0.1 to 0.2% of the calculated result. It is because land footprint of
production is small if it compares to the total land footprint of PET.
The result of water and land footprint of bioplastics considers water and land footprint of transportation
from crop plantation to the production facilities. Meanwhile, the transportation using ship is not
included in the calculation. For example, it is an important pathway of producing PET. After MEG is
produced in India or Brazil, it is shipped to Europe to be polymerized with PTA. A simple calculation
of water and land footprint of ship transportation uses the energy consumption of ship which is 0.017
kWh/t-km from MacKay (2008), the capacity of 40,000 ton and the distance of 10,000 km. If this
transportation is taken into account, the maximum water footprint will increase 2% of the accounted
The water and land footprint of bioplastics
25
water footprint. Meanwhile, for the land footprint, it will increase about 0.3% of the accounted land
footprint.
The water and land footprint of bioplastics
26
6 CONCLUSION
The water footprint of bioplastics varies between 1.4 m3/kg to 9.5 m3/kg. The land footprint of bioplastic
varies between 0.7 m2/kg to 13.75 m2/kg. The water footprint of a complete change to bio-based plastics
varies from 307 billion to 1,652 billion m3 per year. To understand this number, the global annual
average water footprint is 9,087 billion m3/year. The complete change from fossil-based plastics to bio-
based plastics will take about 3% to 18% of the global annual average water footprint. The land footprint
of a complete change to bio-based plastic varies from 30 million to 219 million hectares. In 2020, the
free arable land accounts about 360 million hectares. The complete change from fossil-based plastics
to bio-based plastics will take about 8% to 61% of the free arable land.
This study provides important information on the water and land footprint of bioplastics. The study
shows how different feedstocks and pathway are contributed to water and land footprint of bioplastics.
The study analyzed the implication of a complete move from fossil-based to bio-based plastics on global
land and water requirement by using a different set of biomaterials and different recycling rates. The
study contributes to understanding useful information to predict the water and land requirements for
bioplastics. The drawbacks of this study are the study focuses on first generation bioplastics. It is
important to know the water and land footprint of bioplastics from second (cellulosic crops as well as
residue and agricultural waste products) and third generation (non-traditional organism like some forms
of algae and non-agricultural wastes). It is important to know the water and land footprint of bioplastics
from second and third generation feedstock to understand the implication of bio-based plastics on global
land and water requirements in the future.
The water and land footprint of bioplastics
27
REFERENCES
Akanuma, Y., Selke, S. E. M., & Auras, R. (2014). A preliminary LCA case study: comparison of different pathways to produce purified terephthalic acid suitable for synthesis of 100 % bio-
based PET. The International Journal of Life Cycle Assessment, 19(6), 1238-1246.
Althaus, H.-J., Hischier, R., EMPA, M. O., Primas, A., Jungbluth, N., & Chudacoff, M. (2007). Life Cycle Inventories of Chemical. Ecoinvent Report, 8.
Ashter, S. A. (2016). Introduction to bioplastics engineering Plastics design library; PDL handbook
series., Retrieved from ScienceDirect
http://www.sciencedirect.com/science/book/9780323393966
Ayers, R. (1997). The Life‐Cycle of Chlorine, Part I: Chlorine Production and the Chlorine‐Mercury
Connection. Journal of Industrial Ecology, 1(1), 81-94.
Belboom, S., & Léonard, A. (2016). Does biobased polymer achieve better environmental impacts than fossil polymer? Comparison of fossil HDPE and biobased HDPE produced from sugar beet and
wheat. Biomass and Bioenergy, 85(7), 159-167.
BFA. (2015). Responsible Bioplastic : Sustainable Sourcing and the Circular Economy.
Borealis. (2008). Miljörapport 2008 [Environmental report 2008]. Retrieved from Sweden:
Bosire, C. K., Krol, M. S., Mekonnen, M. M., Ogutu, J. O., de Leeuw, J., Lannerstad, M., & Hoekstra,
A. Y. (2016). Meat and milk production scenarios and the associated land footprint in Kenya.
Agricultural Systems, 145, 64-75.
Carus, M. (2011). Agricultural resources for bioplastics. Bioplastics Magazine, 6, 44-46.
CEA. (2017). GROWTH OF ELECTRICITY SECTOR IN INDIA FROM 1947-2017. New Delphi
Retrieved from http://www.cea.nic.in/reports/others/planning/pdm/growth_2017.pdf.
Chapagain, A. K., & Hoekstra, A. Y. (2003). Virtual water flows between nations in relation to trade
in livestock and livestock products. Delft :: UNESCO-IHE.
Coltro, L., Garcia, E. E. C., & Queiroz, G. d. C. (2003). Life cycle inventory for electric energy system
in Brazil. The International Journal of Life Cycle Assessment, 8(5), 290-296. doi:10.1007/bf02978921
Corbion. (2016). Sustainable Sourcing of Feedstocks for Bioplastics Clasrifying sustainability aspects
around feedstock use for the production of bioplastics.
Coutinho, P. L. d. A., Morita, A. T., Cassinelli, L. F., Morschbacker, A., & Carmo, R. W. D. (2013).
Braskem's Ethanol to Polyethylene Process Development Catalytic Process Development for
Renewable Materials (pp. 149-165): Wiley-VCH Verlag GmbH & Co. KGaA : Weinheim, Germany.
DiGregorio, B. E. (2009). Biobased performance bioplastic: Mirel. Chemistry & biology, 16(1), 1-2.
Dillen, S. Y., Djomo, S. N., Al Afas, N., Vanbeveren, S., & Ceulemans, R. (2013). Biomass yield and
energy balance of a short-rotation poplar coppice with multiple clones on degraded land during 16 years. Biomass and Bioenergy, 56, 157-165.
doi:https://doi.org/10.1016/j.biombioe.2013.04.019
DPT. (2001). Petrokimya Sanayi Özel İhtisas Komisyonu Raporu Sentetik Elyaf ve İplik Sanayii Alt Komisyonu Raporu. Ankara :: Devlet Planlama Teşkilatı.
eia. (2016). Energy Policies of IEA Countries Belgium 2016 Review. Retrieved from France:
https://www.iea.org/publications/freepublications/publication/Energy_Policies_of_IEA_Countries_Belgium_2016_Review.pdf
eia. (2017a). Frequently Asked Questions : How many gallons of gasoline and diesel fuel are made
from one barrel of oil? Retrieved from https://www.eia.gov/
The water and land footprint of bioplastics
28
eia. (2017b). FREQUENTLY ASKED QUESTIONS : What is U.S. electricity generation by energy
source. Retrieved from https://www.eia.gov/tools/faqs/faq.php?id=427&t=3
Emadian, S. M., Onay, T. T., & Demirel, B. (2017). Biodegradation of bioplastics in natural
environments. Waste Management, 59, 526-536.
EuropeanBioplastics. (2017). European Bioplastic Facts and Figures. Retrieved from
http://docs.european-bioplastics.org/publications/EUBP_Facts_and_figures.pdf
FAO. (2013). FAO statistical yearbook 2013 : World food and agriculture FAO statistical yearbook,
2225-7373, Retrieved from ebrary http://site.ebrary.com/id/10815970 http://0-
site.ebrary.com.webpac.lvlspa.org/lib/moravianlibrary/Doc?id=10815970 http://site.ebrary.com/lib/interpuertorico/Doc?id=10815970
FAO. (2016). FAOSTAT Database. Retrieved from http://www.fao.org
Fritsche, U. R., Berndes, G., Cowie, A. L., Dale, V. H., Kline, K. L., Johnson, F. X., . . . Woods, J. (2017). GLOBAL LAND OUTLOOK WORKING PAPER : ENERGY AND LAND USE.
UNCCD and IRENA. Retrieved from http://knowledge.unccd.int/publications/energy-and-
land-use
Futurenergia. (2017). Biodegradable plastics: are they better for the environment? Retrieved from http://www.futurenergia.org/ww/en/pub/futurenergia/chats/bio_plastics.htm
Garcia Gonzalez, M. N., Levi, M., & Turri, S. (2017). Development of polyester binders for the
production of sustainable polyurethane coatings: Technological characterization and life cycle assessment. Journal of Cleaner Production, 164, 171-178.
Gerbens-Leenes, P. W., Hoekstra, A. Y., & Bosman, R. (2018). The blue and grey water footprint of
construction materials: Steel, cement and glass. Water Resources and Industry, 19, 1-12.
Gerbens-Leenes, P. W., Hoekstra, A. Y., & Van der Meer, T. H. (2009). The Water Footprint of bio-
energy and other primary energy carriers. Ecological Economics, 68(4), 1052-1060.
Giljum, S., Wieland, H., Bruckner, M., Schutter, L. d., & Giesecke, K. (2013). LAND FOOTPRINT
SCENARIOS. A discussion paper including a literature review and scenario analysis on the land use related to changes in Europe’s consumption patterns. Report for Friends of the Earth
Europe. Retrieved from Vienna:
Gonzales, E., Miller, L., & Cohn, A. (2010). A logistics model for production and distribution of sugarcane ethanol in Brazil Presented at 2th WCTR (pp. 1-20).
Grabowski, A., Selke, S. E. M., Auras, R., Patel, M. K., & Narayan, R. (2015). Life cycle inventory
data quality issues for bioplastics feedstocks. The International Journal of Life Cycle
Assessment, 20(5), 584-596.
Groot, W. J., & Boren, T. (2010). Life cycle assessment of the manufacture of lactide and PLA
biopolymers from sugarcane in Thailand. The International Journal of Life Cycle Assessment,
15(9), 970-984.
Harding, K. G., Dennis, J. S., von Blottnitz, H., & Harrison, S. T. L. (2007). Environmental analysis of
plastic production processes: Comparing petroleum-based polypropylene and polyethylene
with biologically-based poly-β-hydroxybutyric acid using life cycle analysis. Journal of Biotechnology, 130(1), 57-66.
Hoekstra, A. Y. (2003). Virtual water trade. Proceedings of the International Expert Meeting on Virtual
Water Trade, Delft, The Netherlands, December 12-13 2002.
Hoekstra, A. Y. (2011). The water footprint assessment manual : setting the global standard Retrieved from ebrary http://site.ebrary.com/id/10598534 EBSCOhost
http://search.ebscohost.com/login.aspx?direct=true&scope=site&db=nlebk&db=nlabk&AN=
480113 MyiLibrary http://www.myilibrary.com?id=390305 Taylor & Francis
The water and land footprint of bioplastics
29
http://www.tandfebooks.com/isbn/9781849775526 http://0-
site.ebrary.com.webpac.lvlspa.org/lib/moravianlibrary/Doc?id=10598534
Hoekstra, A. Y. (2013). The water footprint of modern consumer society. London ;: Earthscan, from
Routledge.
Hoekstra, A. Y., Chapagain, A. K., Aldaya, M. M., & Mekonnen, M. M. (2012). The Water Footprint
Assessment Manual Retrieved from Item Resolution URL http://purl.utwente.nl/publications/81264
Hoekstra, A. Y., & Mekonnen, M. M. (2012). The water footprint of humanity. Proceedings of the
national academy of sciences, 109(9), 3232-3237.
Hofstrand, D. (2008). Liquid Fuel Measurements and Conversions. Retrieved from
https://www.extension.iastate.edu/agdm/wholefarm/html/c6-87.html
Ibidhi, R., Hoekstra, A. Y., Gerbens-Leenes, P. W., & Chouchane, H. (2017). Water, land and carbon footprints of sheep and chicken meat produced in Tunisia under different farming systems.
Ecological Indicators, 77, 304-313.
IINAS. (2017). Selected results from GEMIS 4.95: Electricity generation. International Institute for
Sustainability Analysis and Strategy.
Jungbluth, N., Chudacoff, M., Dauriat, A., Dinkel, F., Doka, G., Faist Emmenegger, M., . . . Spielmann,
M. (2007). Life cycle inventories of bioenergy. Final report ecoinvent data v2. 0, 17.
Kikuchi, Y., Oshita, Y., Mayumi, K., & Hirao, M. (2017). Greenhouse gas emissions and socioeconomic effects of biomass-derived products based on structural path and life cycle
analyses: A case study of polyethylene and polypropylene in Japan. Journal of Cleaner
Production, 167(Supplement C), 289-305. doi:https://doi.org/10.1016/j.jclepro.2017.08.179
Kochar, N., Merims, R., & A.Padia. (1981). Ethylene from ethanol. Chem. Eng. Prog., 6, 66-70.
Liptow, C., & Tillman, A.-M. (2012). A Comparative Life Cycle Assessment Study of Polyethylene
Based on Sugarcane and Crude Oil. Journal of Industrial Ecology, 16(3), 420-435.
MacKay, D. (2008). Sustainable Energy-without the hot air: UIT Cambridge.
Mårtensson, L. (2006). Emissions from Volvo’s trucks. Gothenburg, Sweden: Volvo Truck
Corporation.
Mekonnen, M. M., Gerbens-Leenes, P. W., & Hoekstra, A. Y. (2015). The consumptive water footprint of electricity and heat: a global assessment. Retrieved from Item Resolution URL
http://purl.utwente.nl/publications/99233
Mekonnen, M. M., & Hoekstra, A. Y. (2011). The green, blue and grey water footprint of crops and
derived crop products. Retrieved from Item Resolution URL http://purl.utwente.nl/publications/77177
Mekonnen, T., Mussone, P., Khalil, H., & Bressler, D. (2013). Progress in bio-based plastics and
plasticizing modifications. Journal of Materials Chemistry A, 1(43), 13379-13398.
Mostafa, N. A., Farag, A. A., Abo-dief, H. M., & Tayeb, A. M. (2015). Production of biodegradable
plastic from agricultural wastes. Arabian Journal of Chemistry(9–10).
Mudgal, S., Lyons, L., & Kong, M. (2013). Study on an Increased Mechanical Recycling Target for Plastics–Final Report Prepared for Plastic Recyclers Europe: Bio-Intelligence Service.
Nova Institute. (2016). European Bioplastics, Institute for Bioplastics and Biocomposites. Retrieved
from www.bio-based.eu/market
Nylund, N.-O., & Erkkila, K. (2005). Heavy-Duty Truck Emissions and Fuel Consumption Simulating Real-World Driving in Laboratory Condition. Paper presented at the DEER Conference,
Chicago.
The water and land footprint of bioplastics
30
OECD/IEA. (2016). Thailand Electricity Security Assessment 2016. Retrieved from
https://www.iea.org/publications/freepublications/publication/Partner_Country_Series_Thailand_Electricity_Security_2016_.pdf
Pacetti, T., Lombardi, L., & Federici, G. (2015). Water–energy Nexus: a case of biogas production from
energy crops evaluated by Water Footprint and Life Cycle Assessment (LCA) methods. Journal
of Cleaner Production, 101(Supplement C), 278-291. doi:https://doi.org/10.1016/j.jclepro.2015.03.084
Papong, S., Malakul, P., Trungkavashirakun, R., Wenunun, P., Chom-in, T., Nithitanakul, M., &
Sarobol, E. (2014). Comparative assessment of the environmental profile of PLA and PET drinking water bottles from a life cycle perspective. Journal of Cleaner Production, 65(4), 539-
550.
Piemonte, V., & Gironi, F. (2011). Land-use change emissions: How green are the bioplastics? Environmental Progress & Sustainable Energy, 30(4), 685-691.
PlasticsEurope. (2012). Toluene Diisocyanate (TDI) & Methylenediphenyl Diisocyanate (MDI)
Retrieved from
PlasticsEurope. (2016). Plastics - the fact 2015: An analysis of European plastics production, demand and waste data.
Prieto, A. (2016). To be, or not to be biodegradable… that is the question for the bio-based plastics.
Microbial biotechnology, 9(5), 652-657.
Queiroz, A. U. B., & Collares-Queiroz, F. P. (2009). Innovation and Industrial Trends in Bioplastics.
Polymer Reviews, 49(2), 65-78.
Reddy, M. M., Vivekanandhan, S., Misra, M., Bhatia, S. K., & Mohanty, A. K. (2013). Biobased plastics and bionanocomposites: Current status and future opportunities. Progress in Polymer
Science, 38(10-11), 1653-1689.
Renouf, M. A., Wegener, M. K., & Nielsen, L. K. (2008). An environmental life cycle assessment
comparing Australian sugarcane with US corn and UK sugar beet as producers of sugars for fermentation. Biomass and Bioenergy, 32(12), 1144-1155.
Rohstoffe eV, F. N. (2008). Biogasbasisdaten Deutschland. Stand Oktober.
Selke, S. E. M. (1994). Packaging options Food Industry and the Environment. Boston: Springer.
Shen, L., Worrell, E., & Patel, M. (2010). Present and future development in plastics from biomass.
Biofuels, Bioproducts and Biorefining, 4(1), 25-40.
Shen, L., Worrell, E., & Patel, M. K. (2012). Comparing life cycle energy and GHG emissions of bio-
based PET, recycled PET, PLA, and man-made cellulosics. Biofuels, Bioproducts and Biorefining, 6(6), 625-639.
Siriluk, C., Chompoonuh, K. P., Papondhanai, N., Economy, & Environment Program for Southeast,
A. (2014). Financial and economic viability of bioplastic production in Thailand. Laguna, Philippines :: WorldFish (ICLARM) - Economy and Environment Program for Southeast Asia
(EEPSEA).
Smil, V. (1983). Biomass energies : resources, links, constraints. New York :: Plenum Press.
Soam, S., Kumar, R., Gupta, R. P., Sharma, P. K., Tuli, D. K., & Das, B. (2015). Life cycle assessment
of fuel ethanol from sugarcane molasses in northern and western India and its impact on Indian
biofuel programme. Energy, 83(Supplement C), 307-315.
doi:https://doi.org/10.1016/j.energy.2015.02.025
Spang, E. S., Moomaw, W. R., Gallagher, K. S., Kirshen, P. H., & Marks, D. H. (2014). The water
consumption of energy production: an international comparison. Environmental Research
Letters, 9(10).
The water and land footprint of bioplastics
31
Tan, C., Maragatham, K., & Leong, Y. (2013). Electricity energy outlook in Malaysia. Paper presented
at the IOP Conference Series: Earth and Environmental Science.
Terry, G. (2012). Environmental Benefits of Sugar Cane Based Polyethylene & Polypropylene.
Retrieved from
Tötsch, W., & Gaensslen, H. (1992). Manufacture of polyvinyl chloride. In W. Tötsch & H. Gaensslen
(Eds.), Polyvinylchloride: Environmental Aspects of a Common Plastic (pp. 5-31). Dordrecht: Springer Netherlands.
Trainor, A. M., McDonald, R. I., Fargione, J., & Baldwin, R. F. (2016). Energy Sprawl Is the Largest
Driver of Land Use Change in United States. PLOS ONE, 11(9), e0162269.
Tsiropoulos, I., Faaij, A. P. C., Seabra, J. E. A., Lundquist, L., Schenker, U., Briois, J. F., & Patel, M.
K. (2014). Life cycle assessment of sugarcane ethanol production in India in comparison to
Brazil. International Journal of Life Cycle Assessment, 19(5), 1049-1067.
Tuohy, J. (2014). Sustainable Dairy Production (2013), edited by P. de Jong, Wiley-Blackwell,
Chichester, UK. ISBN 978-0-470-65584-9. Price £130.00. International Journal of Dairy
Technology, 67(1), 148-149.
Urban, R. A., & Bakshi, B. R. (2009). 1, 3-Propanediol from fossils versus biomass: a life cycle evaluation of emissions and ecological resources. Industrial & Engineering Chemistry
Research, 48(17), 8068-8082.
Verghese, K. L. (2009). Life cycle assessment and waste management. Life Cycle Assessment: Principles, Practice and Prospects, 51.
Vink, E. T. H., & Davies, S. (2015). Life Cycle Inventory and Impact Assessment Data for 2014
Ingeo<sup>®</sup> Polylactide Production. Industrial Biotechnology, 11(3), 167-180.
Vink, E. T. H., Glassner, D. A., Kolstad, J. J., Wooley, R. J., & O’Connor, R. P. (2007). ORIGINAL
RESEARCH: The eco-profiles for current and near-future NatureWorks® polylactide (PLA)
production. Industrial Biotechnology, 3(1), 58-81. doi:10.1089/ind.2007.3.058
Vink, E. T. H., Rabago, K. R., Glassner, D. A., & Gruber, P. R. (2003). Applications of life cycle assessment to NatureWorks™ polylactide (PLA) production. Polymer Degradation and
Stability, 80(3), 403-419.
Vink, E. T. H., Rabago, K. R., Glassner, D. A., Springs, B., O'Connor, R. P., Kolstad, J., & Gruber, P. R. (2004). The Sustainability of NatureWorks™ Polylactide Polymers and Ingeo™ Polylactide
Fibers: an Update of the Future. Macromolecular Bioscience, 4(6), 551-564.
WEF. (2017). The New Plastics Economy -- Rethinking the future of plastics. Retrieved from
WorldCat.org database. Ellen MacArthur Foundation.
Weinzettel, J., Hertwich, E. G., Peters, G. P., Steen-Olsen, K., & Galli, A. (2013). Affluence drives the
global displacement of land use. Global Environmental Change, 23(2), 433-438.
Weiss, M., Haufe, J., Carus, M., Brandão, M., Bringezu, S., Hermann, B., & Patel, M. K. (2012). A Review of the Environmental Impacts of Biobased Materials. Journal of Industrial Ecology,
16, S169-S181. doi:10.1111/j.1530-9290.2012.00468.x
world-nuclear. (2017). Heat Values of Various Fuels. Retrieved from http://www.world-nuclear.org/information-library/facts-and-figures/heat-values-of-various-fuels.aspx
Worrell, E., Phylipsen, D., Einstein, D., & Martin, N. (2000). Energy use and energy intensity of the
US chemical industry. Lawrence Berkeley National Laboratory.
Yates, M. R., & Barlow, C. Y. (2013). Life cycle assessments of biodegradable, commercial biopolymers???A critical review. Resources, Conservation and Recycling, 78(1), 54-66.
Yutaka, T., Buenaventurada, P. C., Charles, U. U., & Seiichi, A. (2009). Biodegradability of Plastics.
International Journal of Molecular Sciences, 10(9), 3722-3742. Retrieved from
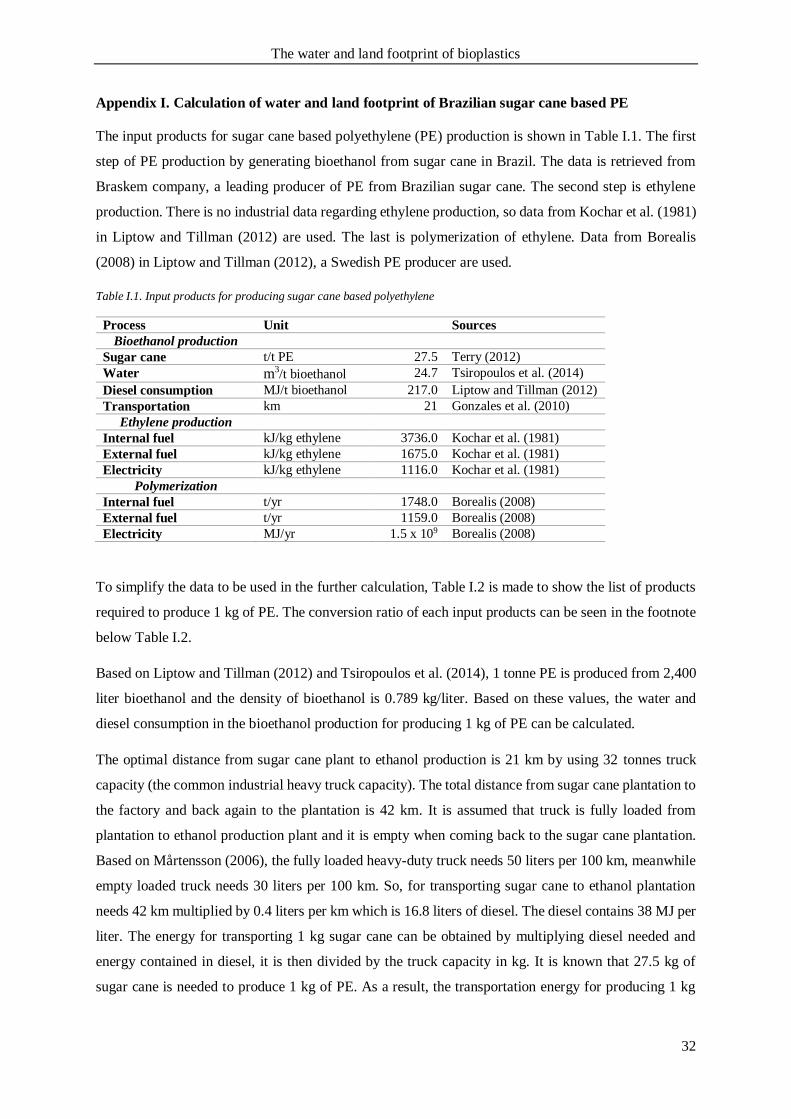
The water and land footprint of bioplastics
32
Appendix I. Calculation of water and land footprint of Brazilian sugar cane based PE
The input products for sugar cane based polyethylene (PE) production is shown in Table I.1. The first
step of PE production by generating bioethanol from sugar cane in Brazil. The data is retrieved from
Braskem company, a leading producer of PE from Brazilian sugar cane. The second step is ethylene
production. There is no industrial data regarding ethylene production, so data from Kochar et al. (1981)
in Liptow and Tillman (2012) are used. The last is polymerization of ethylene. Data from Borealis
(2008) in Liptow and Tillman (2012), a Swedish PE producer are used.
Table I.1. Input products for producing sugar cane based polyethylene
Process Unit Sources
Bioethanol production
Sugar cane t/t PE 27.5 Terry (2012)
Water m3/t bioethanol 24.7 Tsiropoulos et al. (2014)
Diesel consumption MJ/t bioethanol 217.0 Liptow and Tillman (2012)
Transportation km 21 Gonzales et al. (2010)
Ethylene production
Internal fuel kJ/kg ethylene 3736.0 Kochar et al. (1981)
External fuel kJ/kg ethylene 1675.0 Kochar et al. (1981)
Electricity kJ/kg ethylene 1116.0 Kochar et al. (1981)
Polymerization
Internal fuel t/yr 1748.0 Borealis (2008)
External fuel t/yr 1159.0 Borealis (2008)
Electricity MJ/yr 1.5 x 10⁹ Borealis (2008)
To simplify the data to be used in the further calculation, Table I.2 is made to show the list of products
required to produce 1 kg of PE. The conversion ratio of each input products can be seen in the footnote
below Table I.2.
Based on Liptow and Tillman (2012) and Tsiropoulos et al. (2014), 1 tonne PE is produced from 2,400
liter bioethanol and the density of bioethanol is 0.789 kg/liter. Based on these values, the water and
diesel consumption in the bioethanol production for producing 1 kg of PE can be calculated.
The optimal distance from sugar cane plant to ethanol production is 21 km by using 32 tonnes truck
capacity (the common industrial heavy truck capacity). The total distance from sugar cane plantation to
the factory and back again to the plantation is 42 km. It is assumed that truck is fully loaded from
plantation to ethanol production plant and it is empty when coming back to the sugar cane plantation.
Based on Mårtensson (2006), the fully loaded heavy-duty truck needs 50 liters per 100 km, meanwhile
empty loaded truck needs 30 liters per 100 km. So, for transporting sugar cane to ethanol plantation
needs 42 km multiplied by 0.4 liters per km which is 16.8 liters of diesel. The diesel contains 38 MJ per
liter. The energy for transporting 1 kg sugar cane can be obtained by multiplying diesel needed and
energy contained in diesel, it is then divided by the truck capacity in kg. It is known that 27.5 kg of
sugar cane is needed to produce 1 kg of PE. As a result, the transportation energy for producing 1 kg
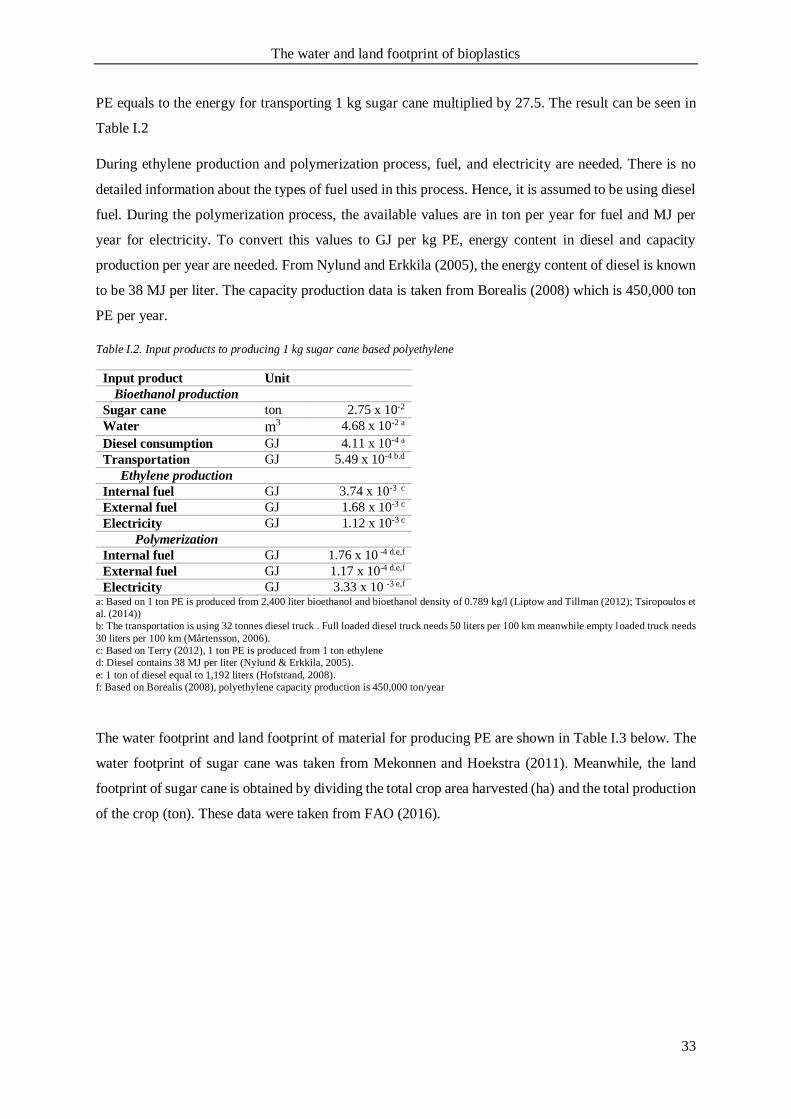
The water and land footprint of bioplastics
33
PE equals to the energy for transporting 1 kg sugar cane multiplied by 27.5. The result can be seen in
Table I.2
During ethylene production and polymerization process, fuel, and electricity are needed. There is no
detailed information about the types of fuel used in this process. Hence, it is assumed to be using diesel
fuel. During the polymerization process, the available values are in ton per year for fuel and MJ per
year for electricity. To convert this values to GJ per kg PE, energy content in diesel and capacity
production per year are needed. From Nylund and Erkkila (2005), the energy content of diesel is known
to be 38 MJ per liter. The capacity production data is taken from Borealis (2008) which is 450,000 ton
PE per year.
Table I.2. Input products to producing 1 kg sugar cane based polyethylene
Input product Unit
Bioethanol production
Sugar cane ton 2.75 x 10⁻²
Water m3 4.68 x 10⁻² a
Diesel consumption GJ 4.11 x 10⁻⁴ a
Transportation GJ 5.49 x 10⁻⁴ b.d
Ethylene production
Internal fuel GJ 3.74 x 10⁻³ c
External fuel GJ 1.68 x 10⁻³ c
Electricity GJ 1.12 x 10⁻³ c
Polymerization
Internal fuel GJ 1.76 x 10 -4 d.e,f
External fuel GJ 1.17 x 10⁻⁴ d.e,f
Electricity GJ 3.33 x 10 -3 e,f a: Based on 1 ton PE is produced from 2,400 liter bioethanol and bioethanol density of 0.789 kg/l (Liptow and Tillman (2012); Tsiropoulos et
al. (2014))
b: The transportation is using 32 tonnes diesel truck . Full loaded diesel truck needs 50 liters per 100 km meanwhile empty loaded truck needs
30 liters per 100 km (Mårtensson, 2006).
c: Based on Terry (2012), 1 ton PE is produced from 1 ton ethylene
d: Diesel contains 38 MJ per liter (Nylund & Erkkila, 2005).
e: 1 ton of diesel equal to 1,192 liters (Hofstrand, 2008).
f: Based on Borealis (2008), polyethylene capacity production is 450,000 ton/year
The water footprint and land footprint of material for producing PE are shown in Table I.3 below. The
water footprint of sugar cane was taken from Mekonnen and Hoekstra (2011). Meanwhile, the land
footprint of sugar cane is obtained by dividing the total crop area harvested (ha) and the total production
of the crop (ton). These data were taken from FAO (2016).
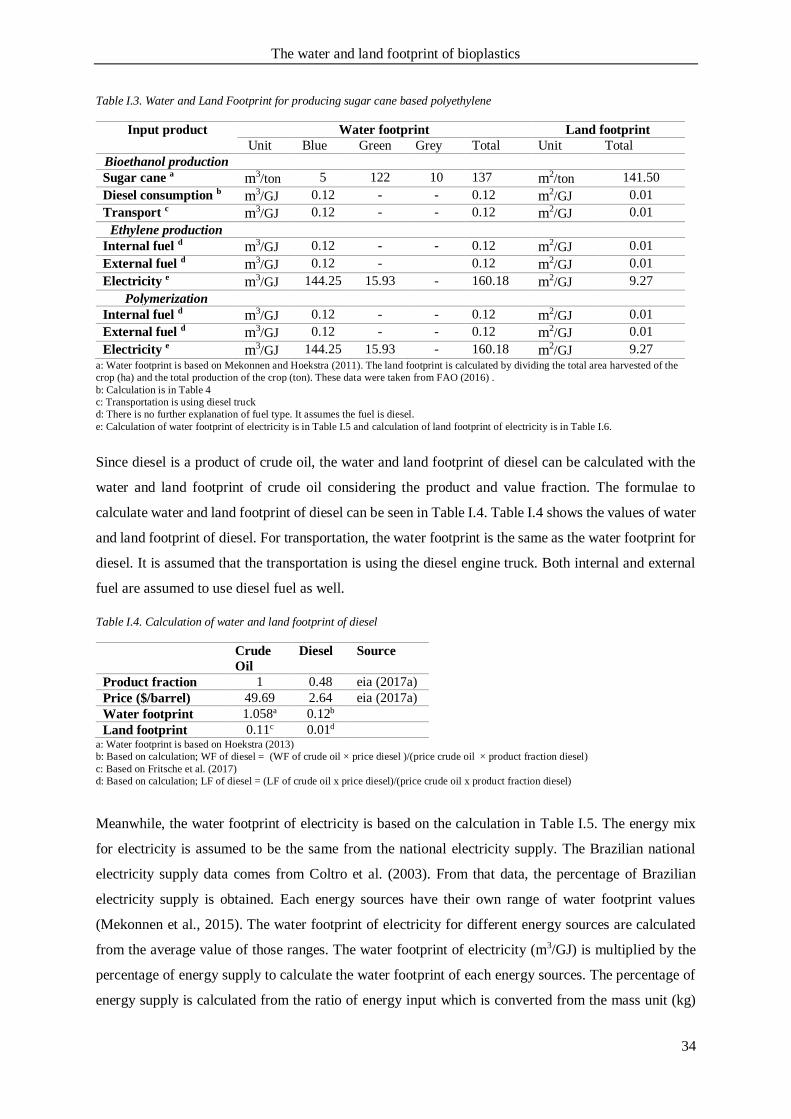
The water and land footprint of bioplastics
34
Table I.3. Water and Land Footprint for producing sugar cane based polyethylene
Input product Water footprint Land footprint
Unit Blue Green Grey Total Unit Total
Bioethanol production
Sugar cane a m3/ton 5 122 10 137 m2/ton 141.50
Diesel consumption b m3/GJ 0.12 - - 0.12 m2/GJ 0.01
Transport c m3/GJ 0.12 - - 0.12 m2/GJ 0.01
Ethylene production
Internal fuel d m3/GJ 0.12 - - 0.12 m2/GJ 0.01
External fuel d m3/GJ 0.12 - 0.12 m2/GJ 0.01
Electricity e m3/GJ 144.25 15.93 - 160.18 m2/GJ 9.27
Polymerization
Internal fuel d m3/GJ 0.12 - - 0.12 m2/GJ 0.01
External fuel d m3/GJ 0.12 - - 0.12 m2/GJ 0.01
Electricity e m3/GJ 144.25 15.93 - 160.18 m2/GJ 9.27
a: Water footprint is based on Mekonnen and Hoekstra (2011). The land footprint is calculated by dividing the total area harvested of the
crop (ha) and the total production of the crop (ton). These data were taken from FAO (2016) .
b: Calculation is in Table 4
c: Transportation is using diesel truck
d: There is no further explanation of fuel type. It assumes the fuel is diesel.
e: Calculation of water footprint of electricity is in Table I.5 and calculation of land footprint of electricity is in Table I.6.
Since diesel is a product of crude oil, the water and land footprint of diesel can be calculated with the
water and land footprint of crude oil considering the product and value fraction. The formulae to
calculate water and land footprint of diesel can be seen in Table I.4. Table I.4 shows the values of water
and land footprint of diesel. For transportation, the water footprint is the same as the water footprint for
diesel. It is assumed that the transportation is using the diesel engine truck. Both internal and external
fuel are assumed to use diesel fuel as well.
Table I.4. Calculation of water and land footprint of diesel
Crude
Oil
Diesel Source
Product fraction 1 0.48 eia (2017a)
Price ($/barrel) 49.69 2.64 eia (2017a)
Water footprint 1.058a 0.12b
Land footprint 0.11c 0.01d a: Water footprint is based on Hoekstra (2013)
b: Based on calculation; WF of diesel = (WF of crude oil × price diesel )/(price crude oil × product fraction diesel)
c: Based on Fritsche et al. (2017)
d: Based on calculation; LF of diesel = (LF of crude oil x price diesel)/(price crude oil x product fraction diesel)
Meanwhile, the water footprint of electricity is based on the calculation in Table I.5. The energy mix
for electricity is assumed to be the same from the national electricity supply. The Brazilian national
electricity supply data comes from Coltro et al. (2003). From that data, the percentage of Brazilian
electricity supply is obtained. Each energy sources have their own range of water footprint values
(Mekonnen et al., 2015). The water footprint of electricity for different energy sources are calculated
from the average value of those ranges. The water footprint of electricity (m3/GJ) is multiplied by the
percentage of energy supply to calculate the water footprint of each energy sources. The percentage of
energy supply is calculated from the ratio of energy input which is converted from the mass unit (kg)
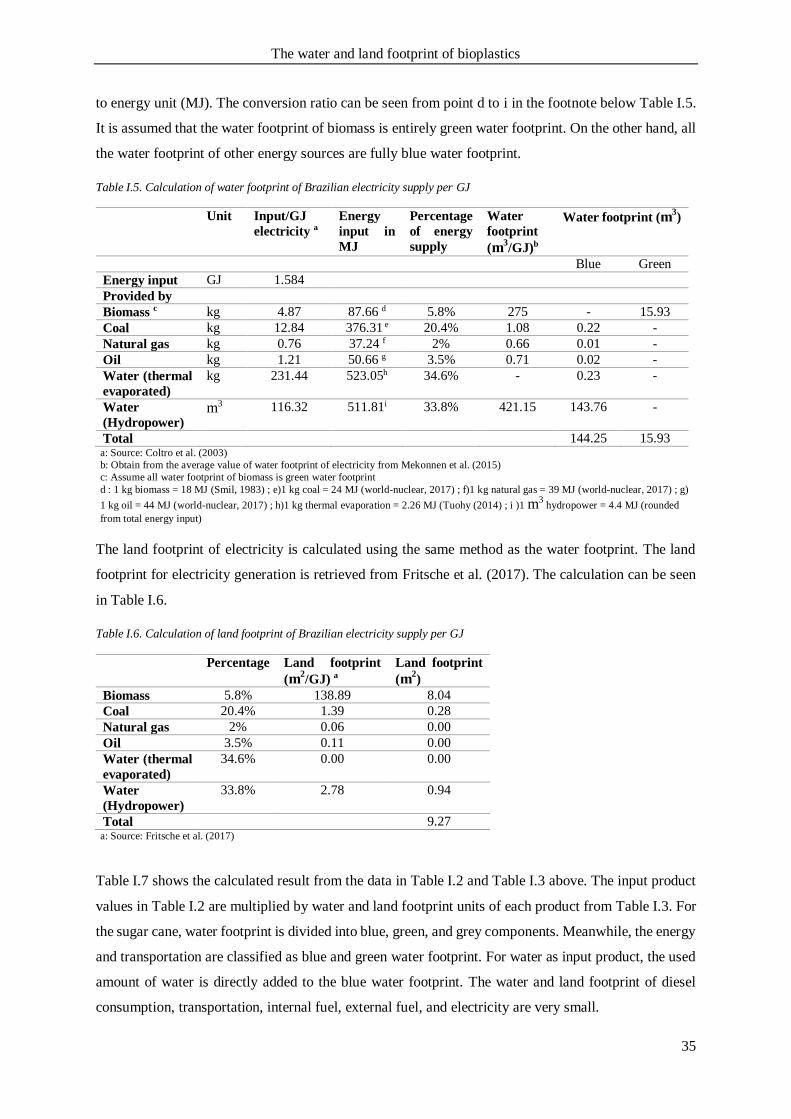
The water and land footprint of bioplastics
35
to energy unit (MJ). The conversion ratio can be seen from point d to i in the footnote below Table I.5.
It is assumed that the water footprint of biomass is entirely green water footprint. On the other hand, all
the water footprint of other energy sources are fully blue water footprint.
Table I.5. Calculation of water footprint of Brazilian electricity supply per GJ
Unit Input/GJ
electricity a
Energy
input in
MJ
Percentage
of energy
supply
Water
footprint
(m3/GJ)b
Water footprint (m3)
Blue Green
Energy input GJ 1.584
Provided by
Biomass c kg 4.87 87.66 d 5.8% 275 - 15.93
Coal kg 12.84 376.31 e 20.4% 1.08 0.22 -
Natural gas kg 0.76 37.24 f 2% 0.66 0.01 -
Oil kg 1.21 50.66 g 3.5% 0.71 0.02 -
Water (thermal
evaporated)
kg 231.44 523.05h 34.6% - 0.23 -
Water
(Hydropower) m3 116.32 511.81i 33.8% 421.15 143.76 -
Total 144.25 15.93 a: Source: Coltro et al. (2003)
b: Obtain from the average value of water footprint of electricity from Mekonnen et al. (2015)
c: Assume all water footprint of biomass is green water footprint
d : 1 kg biomass = 18 MJ (Smil, 1983) ; e)1 kg coal = 24 MJ (world-nuclear, 2017) ; f)1 kg natural gas = 39 MJ (world-nuclear, 2017) ; g)
1 kg oil = 44 MJ (world-nuclear, 2017) ; h)1 kg thermal evaporation = 2.26 MJ (Tuohy (2014) ; i )1 m3 hydropower = 4.4 MJ (rounded
from total energy input)
The land footprint of electricity is calculated using the same method as the water footprint. The land
footprint for electricity generation is retrieved from Fritsche et al. (2017). The calculation can be seen
in Table I.6.
Table I.6. Calculation of land footprint of Brazilian electricity supply per GJ
Percentage Land footprint
(m2/GJ) a
Land footprint
(m2)
Biomass 5.8% 138.89 8.04
Coal 20.4% 1.39 0.28
Natural gas 2% 0.06 0.00
Oil 3.5% 0.11 0.00
Water (thermal
evaporated)
34.6% 0.00 0.00
Water
(Hydropower)
33.8% 2.78 0.94
Total 9.27 a: Source: Fritsche et al. (2017)
Table I.7 shows the calculated result from the data in Table I.2 and Table I.3 above. The input product
values in Table I.2 are multiplied by water and land footprint units of each product from Table I.3. For
the sugar cane, water footprint is divided into blue, green, and grey components. Meanwhile, the energy
and transportation are classified as blue and green water footprint. For water as input product, the used
amount of water is directly added to the blue water footprint. The water and land footprint of diesel
consumption, transportation, internal fuel, external fuel, and electricity are very small.
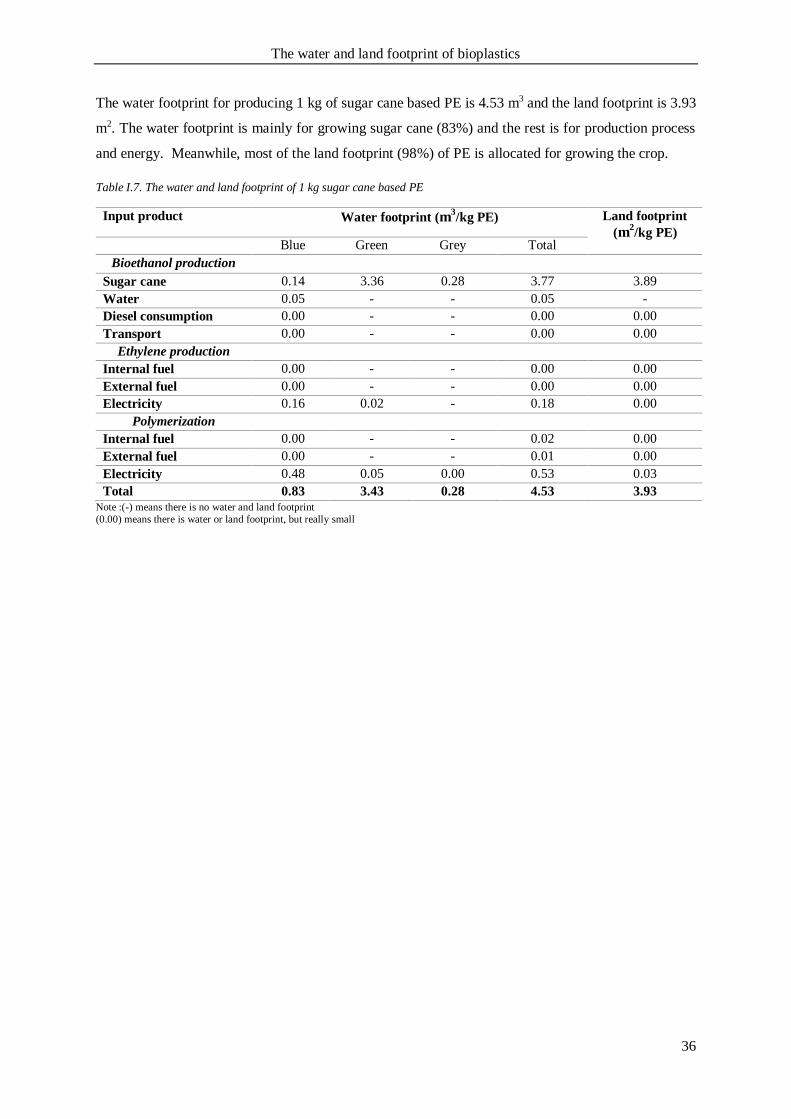
The water and land footprint of bioplastics
36
The water footprint for producing 1 kg of sugar cane based PE is 4.53 m3 and the land footprint is 3.93
m2. The water footprint is mainly for growing sugar cane (83%) and the rest is for production process
and energy. Meanwhile, most of the land footprint (98%) of PE is allocated for growing the crop.
Table I.7. The water and land footprint of 1 kg sugar cane based PE
Input product Water footprint (m3/kg PE) Land footprint
(m2/kg PE)
Blue Green Grey Total
Bioethanol production Sugar cane 0.14 3.36 0.28 3.77 3.89
Water 0.05 - - 0.05 -
Diesel consumption 0.00 - - 0.00 0.00
Transport 0.00 - - 0.00 0.00
Ethylene production
Internal fuel 0.00 - - 0.00 0.00
External fuel 0.00 - - 0.00 0.00
Electricity 0.16 0.02 - 0.18 0.00
Polymerization
Internal fuel 0.00 - - 0.02 0.00
External fuel 0.00 - - 0.01 0.00
Electricity 0.48 0.05 0.00 0.53 0.03
Total 0.83 3.43 0.28 4.53 3.93
Note :(-) means there is no water and land footprint
(0.00) means there is water or land footprint, but really small
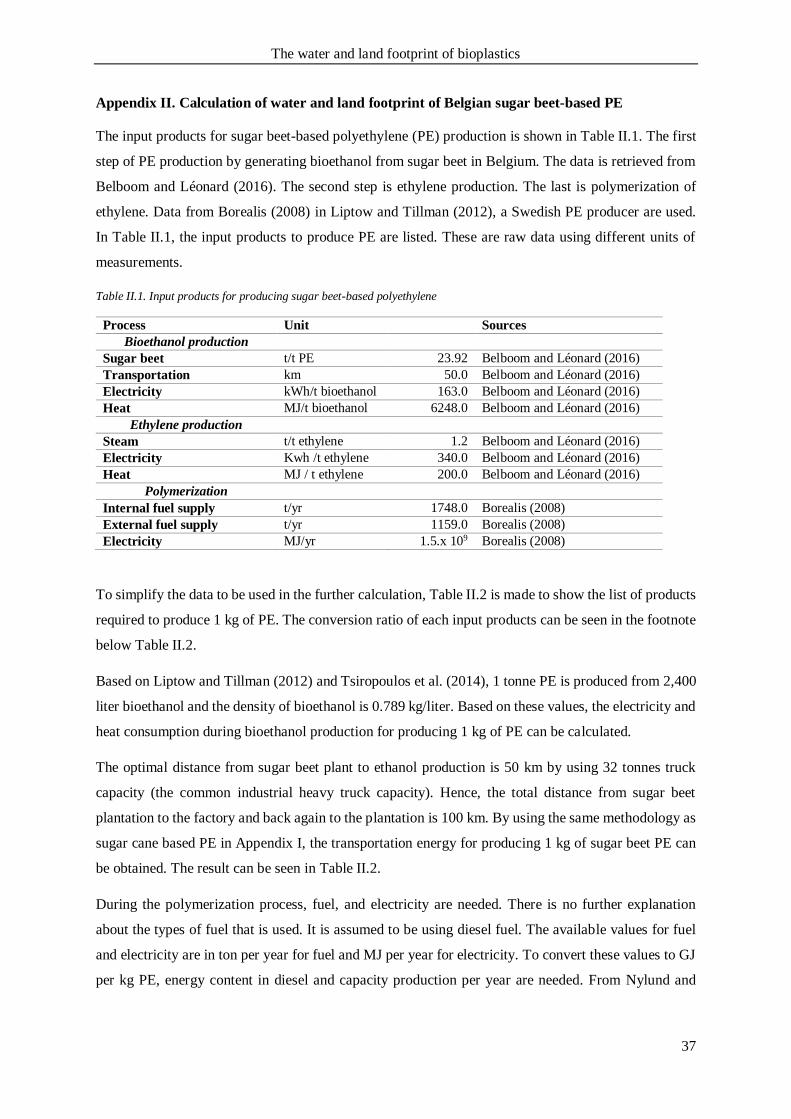
The water and land footprint of bioplastics
37
Appendix II. Calculation of water and land footprint of Belgian sugar beet-based PE
The input products for sugar beet-based polyethylene (PE) production is shown in Table II.1. The first
step of PE production by generating bioethanol from sugar beet in Belgium. The data is retrieved from
Belboom and Léonard (2016). The second step is ethylene production. The last is polymerization of
ethylene. Data from Borealis (2008) in Liptow and Tillman (2012), a Swedish PE producer are used.
In Table II.1, the input products to produce PE are listed. These are raw data using different units of
measurements.
Table II.1. Input products for producing sugar beet-based polyethylene
Process Unit Sources
Bioethanol production
Sugar beet t/t PE 23.92 Belboom and Léonard (2016)
Transportation km 50.0 Belboom and Léonard (2016)
Electricity kWh/t bioethanol 163.0 Belboom and Léonard (2016)
Heat MJ/t bioethanol 6248.0 Belboom and Léonard (2016)
Ethylene production
Steam t/t ethylene 1.2 Belboom and Léonard (2016)
Electricity Kwh /t ethylene 340.0 Belboom and Léonard (2016)
Heat MJ / t ethylene 200.0 Belboom and Léonard (2016)
Polymerization
Internal fuel supply t/yr 1748.0 Borealis (2008)
External fuel supply t/yr 1159.0 Borealis (2008)
Electricity MJ/yr 1.5.x 109 Borealis (2008)
To simplify the data to be used in the further calculation, Table II.2 is made to show the list of products
required to produce 1 kg of PE. The conversion ratio of each input products can be seen in the footnote
below Table II.2.
Based on Liptow and Tillman (2012) and Tsiropoulos et al. (2014), 1 tonne PE is produced from 2,400
liter bioethanol and the density of bioethanol is 0.789 kg/liter. Based on these values, the electricity and
heat consumption during bioethanol production for producing 1 kg of PE can be calculated.
The optimal distance from sugar beet plant to ethanol production is 50 km by using 32 tonnes truck
capacity (the common industrial heavy truck capacity). Hence, the total distance from sugar beet
plantation to the factory and back again to the plantation is 100 km. By using the same methodology as
sugar cane based PE in Appendix I, the transportation energy for producing 1 kg of sugar beet PE can
be obtained. The result can be seen in Table II.2.
During the polymerization process, fuel, and electricity are needed. There is no further explanation
about the types of fuel that is used. It is assumed to be using diesel fuel. The available values for fuel
and electricity are in ton per year for fuel and MJ per year for electricity. To convert these values to GJ
per kg PE, energy content in diesel and capacity production per year are needed. From Nylund and
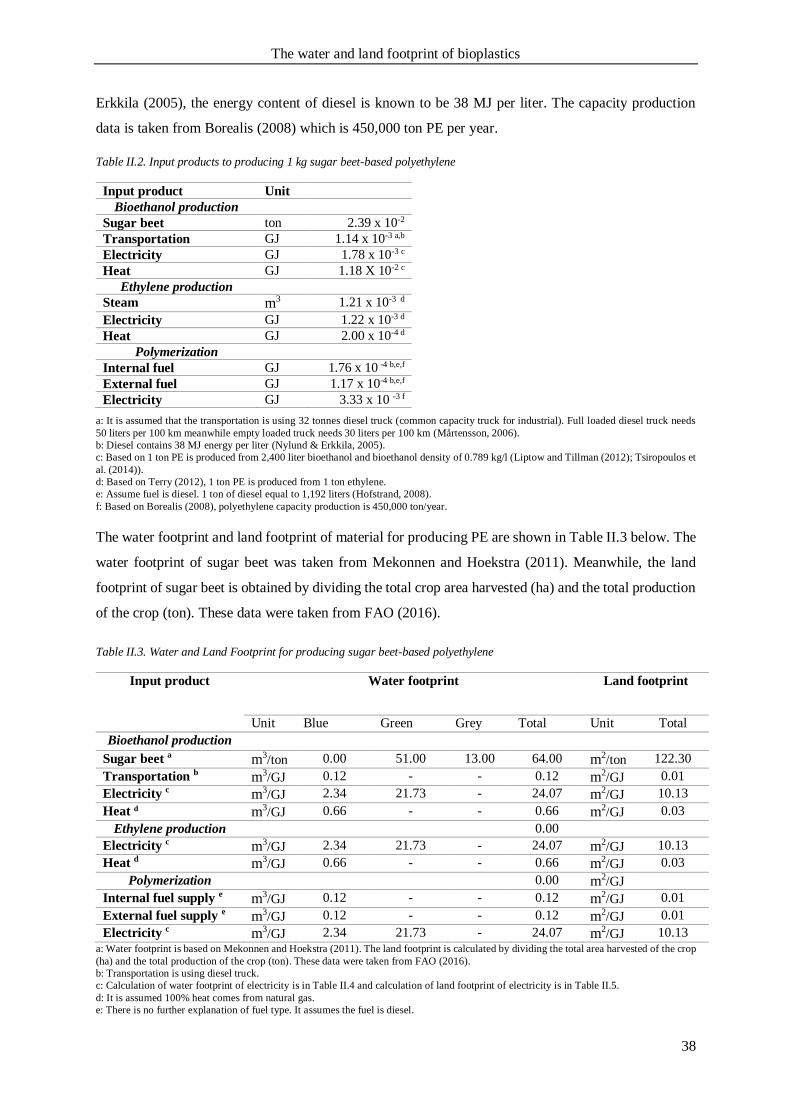
The water and land footprint of bioplastics
38
Erkkila (2005), the energy content of diesel is known to be 38 MJ per liter. The capacity production
data is taken from Borealis (2008) which is 450,000 ton PE per year.
Table II.2. Input products to producing 1 kg sugar beet-based polyethylene
a: It is assumed that the transportation is using 32 tonnes diesel truck (common capacity truck for industrial). Full loaded diesel truck needs
50 liters per 100 km meanwhile empty loaded truck needs 30 liters per 100 km (Mårtensson, 2006).
b: Diesel contains 38 MJ energy per liter (Nylund & Erkkila, 2005).
c: Based on 1 ton PE is produced from 2,400 liter bioethanol and bioethanol density of 0.789 kg/l (Liptow and Tillman (2012); Tsiropoulos et
al. (2014)).
d: Based on Terry (2012), 1 ton PE is produced from 1 ton ethylene.
e: Assume fuel is diesel. 1 ton of diesel equal to 1,192 liters (Hofstrand, 2008).
f: Based on Borealis (2008), polyethylene capacity production is 450,000 ton/year.
The water footprint and land footprint of material for producing PE are shown in Table II.3 below. The
water footprint of sugar beet was taken from Mekonnen and Hoekstra (2011). Meanwhile, the land
footprint of sugar beet is obtained by dividing the total crop area harvested (ha) and the total production
of the crop (ton). These data were taken from FAO (2016).
Table II.3. Water and Land Footprint for producing sugar beet-based polyethylene
Input product Water footprint Land footprint
Unit Blue Green Grey Total Unit Total
Bioethanol production
Sugar beet a m3/ton 0.00 51.00 13.00 64.00 m2/ton 122.30
Transportation b m3/GJ 0.12 - - 0.12 m2/GJ 0.01
Electricity c m3/GJ 2.34 21.73 - 24.07 m2/GJ 10.13
Heat d m3/GJ 0.66 - - 0.66 m2/GJ 0.03
Ethylene production 0.00
Electricity c m3/GJ 2.34 21.73 - 24.07 m2/GJ 10.13
Heat d m3/GJ 0.66 - - 0.66 m2/GJ 0.03
Polymerization 0.00 m2/GJ
Internal fuel supply e m3/GJ 0.12 - - 0.12 m2/GJ 0.01
External fuel supply e m3/GJ 0.12 - - 0.12 m2/GJ 0.01
Electricity c m3/GJ 2.34 21.73 - 24.07 m2/GJ 10.13
a: Water footprint is based on Mekonnen and Hoekstra (2011). The land footprint is calculated by dividing the total area harvested of the crop
(ha) and the total production of the crop (ton). These data were taken from FAO (2016).
b: Transportation is using diesel truck.
c: Calculation of water footprint of electricity is in Table II.4 and calculation of land footprint of electricity is in Table II.5.
d: It is assumed 100% heat comes from natural gas.
e: There is no further explanation of fuel type. It assumes the fuel is diesel.
Input product Unit
Bioethanol production
Sugar beet ton 2.39 x 10⁻²
Transportation GJ 1.14 x 10⁻³ a,b
Electricity GJ 1.78 x 10⁻³ c
Heat GJ 1.18 X 10⁻² c
Ethylene production
Steam m3 1.21 x 10⁻³ d
Electricity GJ 1.22 x 10⁻³ d
Heat GJ 2.00 x 10⁻⁴ d
Polymerization
Internal fuel GJ 1.76 x 10 -4 b,e,f
External fuel GJ 1.17 x 10⁻⁴ b,e,f
Electricity GJ 3.33 x 10 -3 f
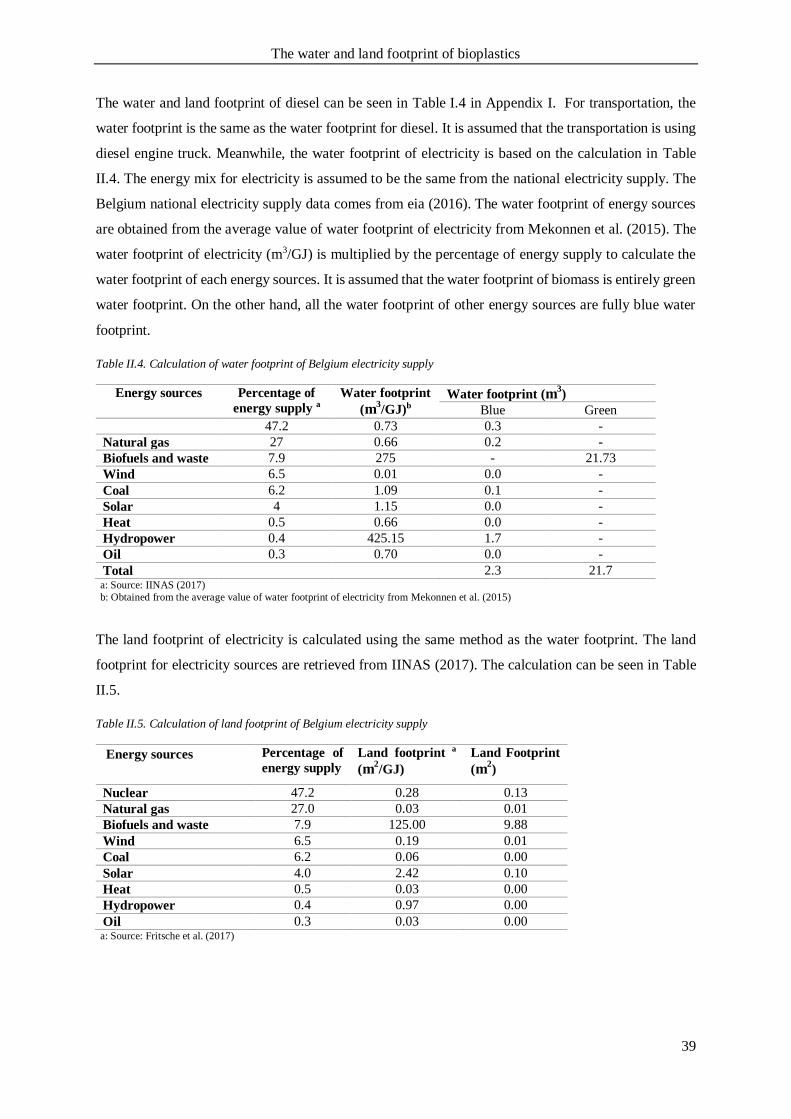
The water and land footprint of bioplastics
39
The water and land footprint of diesel can be seen in Table I.4 in Appendix I. For transportation, the
water footprint is the same as the water footprint for diesel. It is assumed that the transportation is using
diesel engine truck. Meanwhile, the water footprint of electricity is based on the calculation in Table
II.4. The energy mix for electricity is assumed to be the same from the national electricity supply. The
Belgium national electricity supply data comes from eia (2016). The water footprint of energy sources
are obtained from the average value of water footprint of electricity from Mekonnen et al. (2015). The
water footprint of electricity (m3/GJ) is multiplied by the percentage of energy supply to calculate the
water footprint of each energy sources. It is assumed that the water footprint of biomass is entirely green
water footprint. On the other hand, all the water footprint of other energy sources are fully blue water
footprint.
Table II.4. Calculation of water footprint of Belgium electricity supply
Energy sources Percentage of
energy supply a
Water footprint
(m3/GJ)b
Water footprint (m3)
Blue Green
47.2 0.73 0.3 -
Natural gas 27 0.66 0.2 -
Biofuels and waste 7.9 275 - 21.73
Wind 6.5 0.01 0.0 -
Coal 6.2 1.09 0.1 -
Solar 4 1.15 0.0 -
Heat 0.5 0.66 0.0 -
Hydropower 0.4 425.15 1.7 -
Oil 0.3 0.70 0.0 -
Total 2.3 21.7 a: Source: IINAS (2017)
b: Obtained from the average value of water footprint of electricity from Mekonnen et al. (2015)
The land footprint of electricity is calculated using the same method as the water footprint. The land
footprint for electricity sources are retrieved from IINAS (2017). The calculation can be seen in Table
II.5.
Table II.5. Calculation of land footprint of Belgium electricity supply
Energy sources Percentage of
energy supply
Land footprint a
(m2/GJ)
Land Footprint
(m2)
Nuclear 47.2 0.28 0.13
Natural gas 27.0 0.03 0.01
Biofuels and waste 7.9 125.00 9.88
Wind 6.5 0.19 0.01
Coal 6.2 0.06 0.00
Solar 4.0 2.42 0.10
Heat 0.5 0.03 0.00
Hydropower 0.4 0.97 0.00
Oil 0.3 0.03 0.00 a: Source: Fritsche et al. (2017)
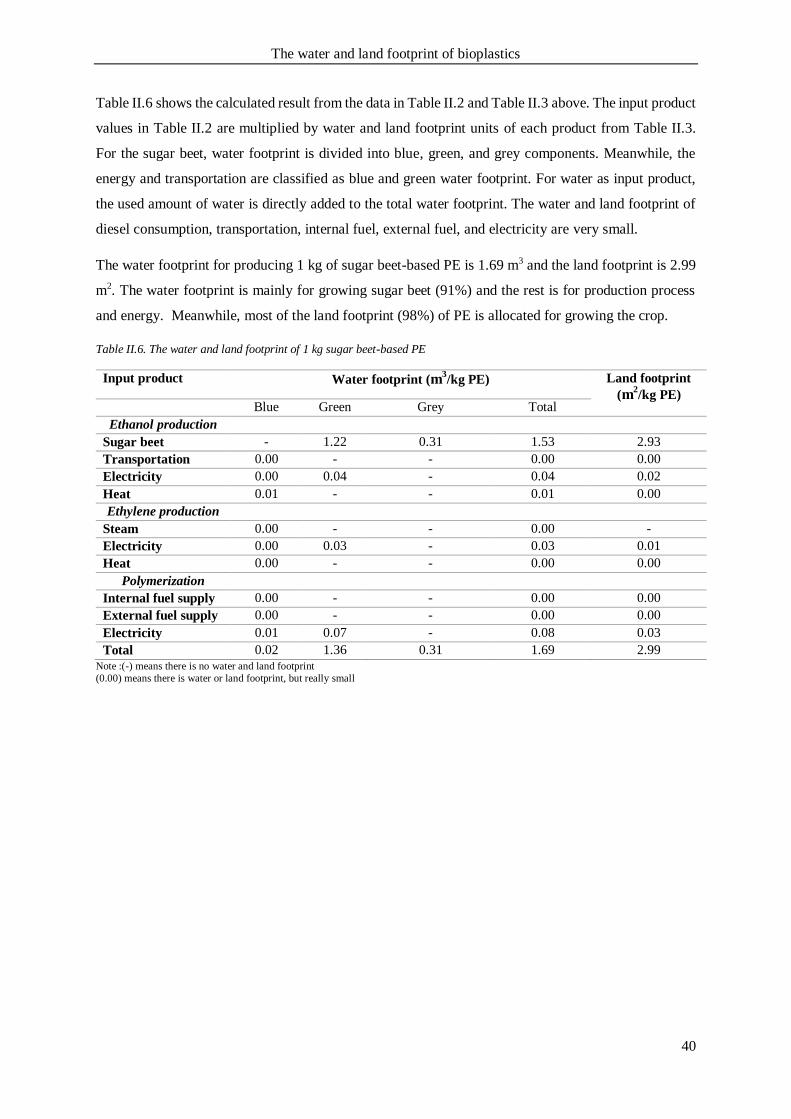
The water and land footprint of bioplastics
40
Table II.6 shows the calculated result from the data in Table II.2 and Table II.3 above. The input product
values in Table II.2 are multiplied by water and land footprint units of each product from Table II.3.
For the sugar beet, water footprint is divided into blue, green, and grey components. Meanwhile, the
energy and transportation are classified as blue and green water footprint. For water as input product,
the used amount of water is directly added to the total water footprint. The water and land footprint of
diesel consumption, transportation, internal fuel, external fuel, and electricity are very small.
The water footprint for producing 1 kg of sugar beet-based PE is 1.69 m3 and the land footprint is 2.99
m2. The water footprint is mainly for growing sugar beet (91%) and the rest is for production process
and energy. Meanwhile, most of the land footprint (98%) of PE is allocated for growing the crop.
Table II.6. The water and land footprint of 1 kg sugar beet-based PE
Input product Water footprint (m3/kg PE) Land footprint
(m2/kg PE)
Blue Green Grey Total
Ethanol production
Sugar beet - 1.22 0.31 1.53 2.93
Transportation 0.00 - - 0.00 0.00
Electricity 0.00 0.04 - 0.04 0.02
Heat 0.01 - - 0.01 0.00
Ethylene production
Steam 0.00 - - 0.00 -
Electricity 0.00 0.03 - 0.03 0.01
Heat 0.00 - - 0.00 0.00
Polymerization
Internal fuel supply 0.00 - - 0.00 0.00
External fuel supply 0.00 - - 0.00 0.00
Electricity 0.01 0.07 - 0.08 0.03
Total 0.02 1.36 0.31 1.69 2.99
Note :(-) means there is no water and land footprint
(0.00) means there is water or land footprint, but really small
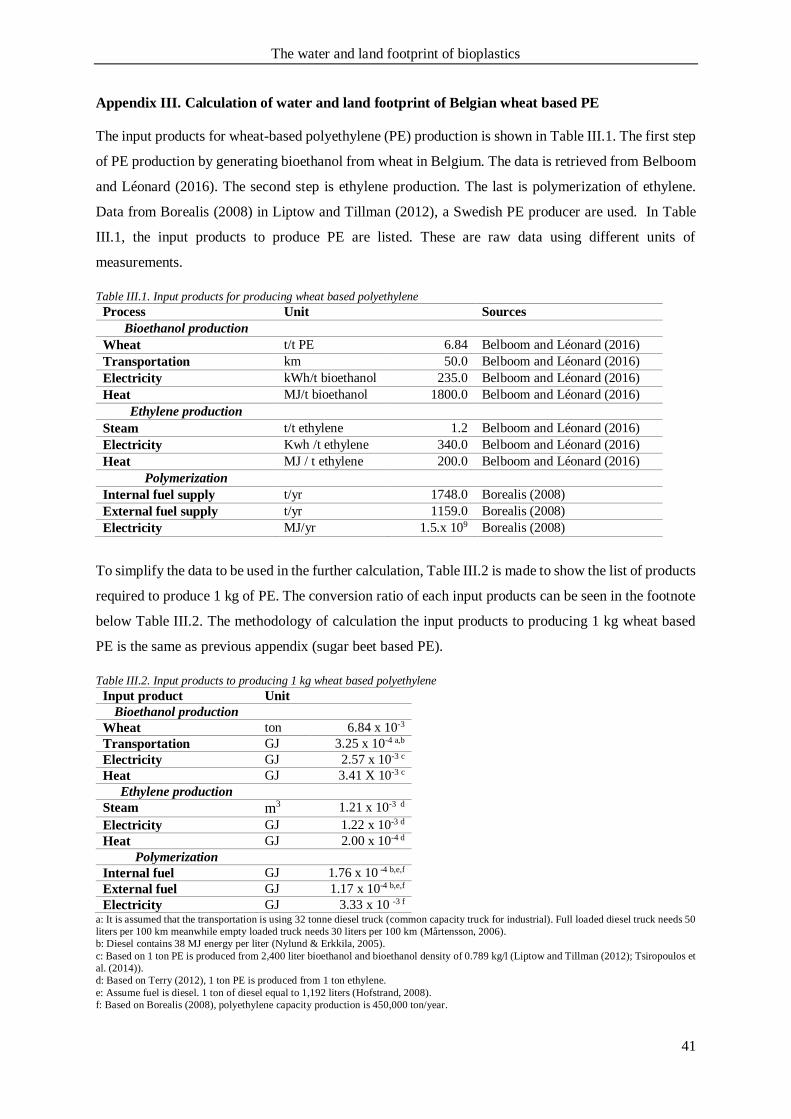
The water and land footprint of bioplastics
41
Appendix III. Calculation of water and land footprint of Belgian wheat based PE
The input products for wheat-based polyethylene (PE) production is shown in Table III.1. The first step
of PE production by generating bioethanol from wheat in Belgium. The data is retrieved from Belboom
and Léonard (2016). The second step is ethylene production. The last is polymerization of ethylene.
Data from Borealis (2008) in Liptow and Tillman (2012), a Swedish PE producer are used. In Table
III.1, the input products to produce PE are listed. These are raw data using different units of
measurements.
Table III.1. Input products for producing wheat based polyethylene
Process Unit Sources
Bioethanol production
Wheat t/t PE 6.84 Belboom and Léonard (2016)
Transportation km 50.0 Belboom and Léonard (2016)
Electricity kWh/t bioethanol 235.0 Belboom and Léonard (2016)
Heat MJ/t bioethanol 1800.0 Belboom and Léonard (2016)
Ethylene production
Steam t/t ethylene 1.2 Belboom and Léonard (2016)
Electricity Kwh /t ethylene 340.0 Belboom and Léonard (2016)
Heat MJ / t ethylene 200.0 Belboom and Léonard (2016)
Polymerization
Internal fuel supply t/yr 1748.0 Borealis (2008)
External fuel supply t/yr 1159.0 Borealis (2008)
Electricity MJ/yr 1.5.x 109 Borealis (2008)
To simplify the data to be used in the further calculation, Table III.2 is made to show the list of products
required to produce 1 kg of PE. The conversion ratio of each input products can be seen in the footnote
below Table III.2. The methodology of calculation the input products to producing 1 kg wheat based
PE is the same as previous appendix (sugar beet based PE).
Table III.2. Input products to producing 1 kg wheat based polyethylene
Input product Unit
Bioethanol production
Wheat ton 6.84 x 10⁻³
Transportation GJ 3.25 x 10⁻⁴ a,b
Electricity GJ 2.57 x 10⁻³ c
Heat GJ 3.41 X 10⁻³ c
Ethylene production
Steam m3 1.21 x 10⁻³ d
Electricity GJ 1.22 x 10⁻³ d
Heat GJ 2.00 x 10⁻⁴ d
Polymerization
Internal fuel GJ 1.76 x 10 -4 b,e,f
External fuel GJ 1.17 x 10⁻⁴ b,e,f
Electricity GJ 3.33 x 10 -3 f a: It is assumed that the transportation is using 32 tonne diesel truck (common capacity truck for industrial). Full loaded diesel truck needs 50
liters per 100 km meanwhile empty loaded truck needs 30 liters per 100 km (Mårtensson, 2006).
b: Diesel contains 38 MJ energy per liter (Nylund & Erkkila, 2005).
c: Based on 1 ton PE is produced from 2,400 liter bioethanol and bioethanol density of 0.789 kg/l (Liptow and Tillman (2012); Tsiropoulos et
al. (2014)).
d: Based on Terry (2012), 1 ton PE is produced from 1 ton ethylene.
e: Assume fuel is diesel. 1 ton of diesel equal to 1,192 liters (Hofstrand, 2008).
f: Based on Borealis (2008), polyethylene capacity production is 450,000 ton/year.
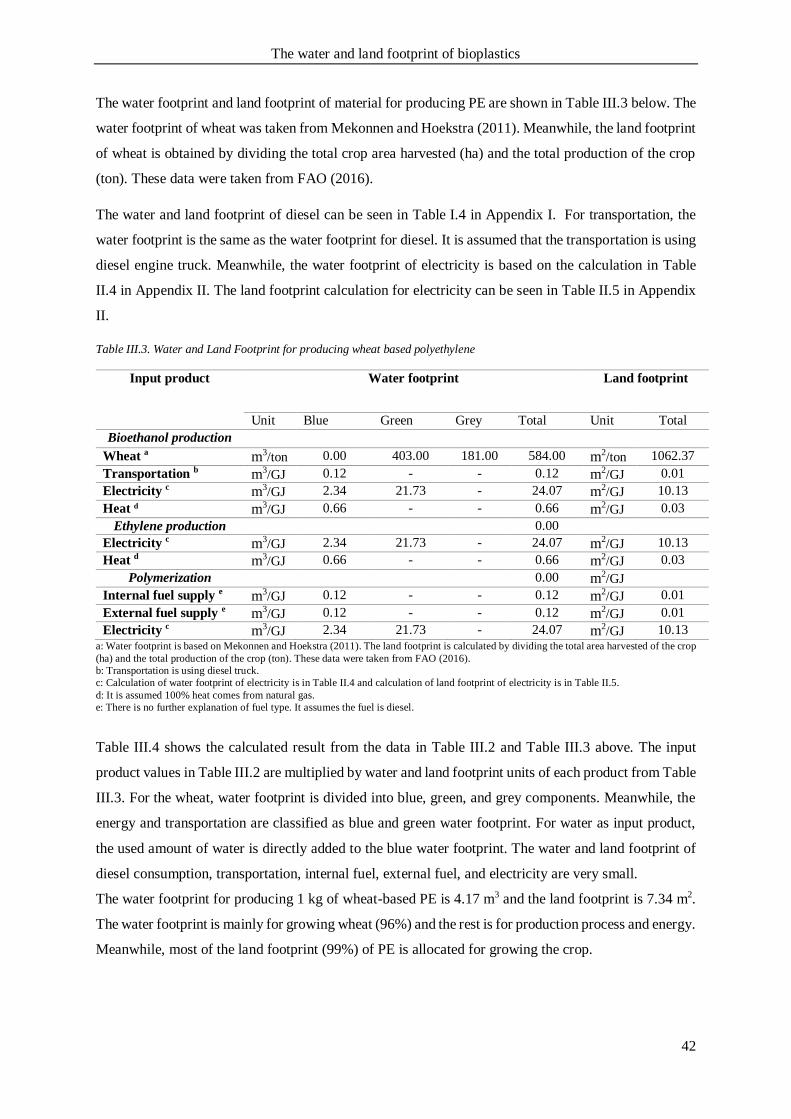
The water and land footprint of bioplastics
42
The water footprint and land footprint of material for producing PE are shown in Table III.3 below. The
water footprint of wheat was taken from Mekonnen and Hoekstra (2011). Meanwhile, the land footprint
of wheat is obtained by dividing the total crop area harvested (ha) and the total production of the crop
(ton). These data were taken from FAO (2016).
The water and land footprint of diesel can be seen in Table I.4 in Appendix I. For transportation, the
water footprint is the same as the water footprint for diesel. It is assumed that the transportation is using
diesel engine truck. Meanwhile, the water footprint of electricity is based on the calculation in Table
II.4 in Appendix II. The land footprint calculation for electricity can be seen in Table II.5 in Appendix
II.
Table III.3. Water and Land Footprint for producing wheat based polyethylene
Input product Water footprint Land footprint
Unit Blue Green Grey Total Unit Total
Bioethanol production
Wheat a m3/ton 0.00 403.00 181.00 584.00 m2/ton 1062.37
Transportation b m3/GJ 0.12 - - 0.12 m2/GJ 0.01
Electricity c m3/GJ 2.34 21.73 - 24.07 m2/GJ 10.13
Heat d m3/GJ 0.66 - - 0.66 m2/GJ 0.03
Ethylene production 0.00
Electricity c m3/GJ 2.34 21.73 - 24.07 m2/GJ 10.13
Heat d m3/GJ 0.66 - - 0.66 m2/GJ 0.03
Polymerization 0.00 m2/GJ
Internal fuel supply e m3/GJ 0.12 - - 0.12 m2/GJ 0.01
External fuel supply e m3/GJ 0.12 - - 0.12 m2/GJ 0.01
Electricity c m3/GJ 2.34 21.73 - 24.07 m2/GJ 10.13
a: Water footprint is based on Mekonnen and Hoekstra (2011). The land footprint is calculated by dividing the total area harvested of the crop
(ha) and the total production of the crop (ton). These data were taken from FAO (2016).
b: Transportation is using diesel truck.
c: Calculation of water footprint of electricity is in Table II.4 and calculation of land footprint of electricity is in Table II.5.
d: It is assumed 100% heat comes from natural gas.
e: There is no further explanation of fuel type. It assumes the fuel is diesel.
Table III.4 shows the calculated result from the data in Table III.2 and Table III.3 above. The input
product values in Table III.2 are multiplied by water and land footprint units of each product from Table
III.3. For the wheat, water footprint is divided into blue, green, and grey components. Meanwhile, the
energy and transportation are classified as blue and green water footprint. For water as input product,
the used amount of water is directly added to the blue water footprint. The water and land footprint of
diesel consumption, transportation, internal fuel, external fuel, and electricity are very small.
The water footprint for producing 1 kg of wheat-based PE is 4.17 m3 and the land footprint is 7.34 m2.
The water footprint is mainly for growing wheat (96%) and the rest is for production process and energy.
Meanwhile, most of the land footprint (99%) of PE is allocated for growing the crop.
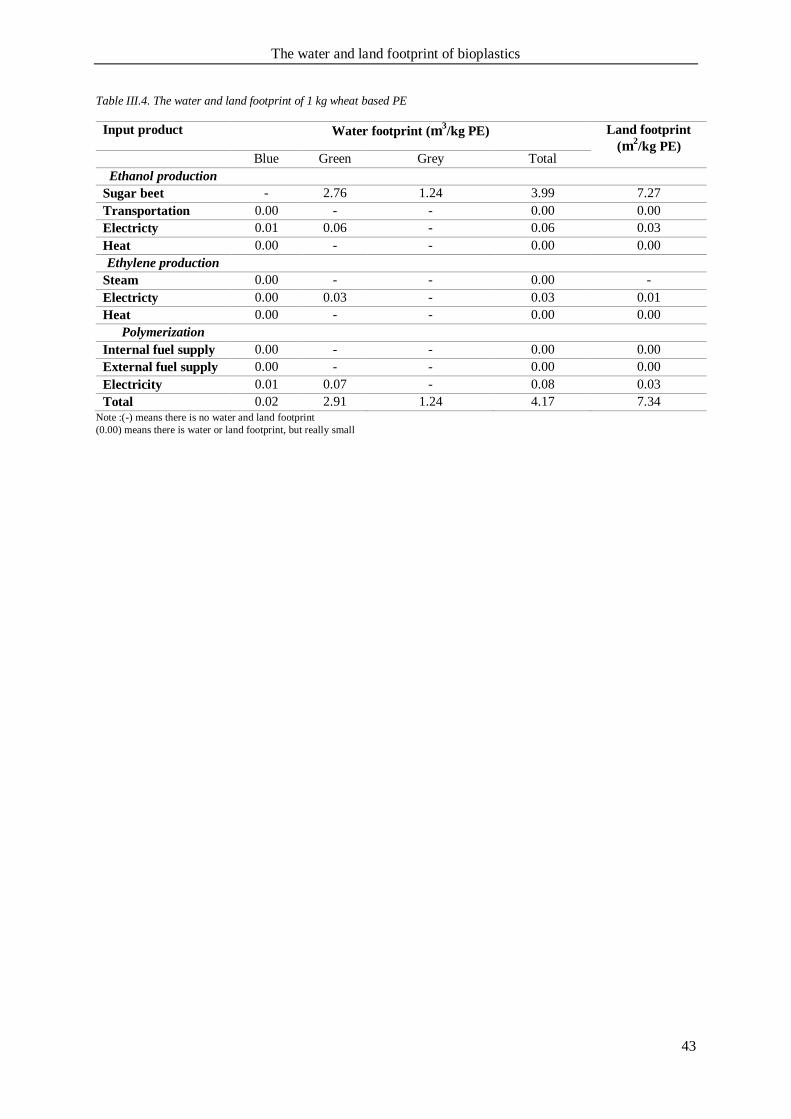
The water and land footprint of bioplastics
43
Table III.4. The water and land footprint of 1 kg wheat based PE
Input product Water footprint (m3/kg PE) Land footprint
(m2/kg PE)
Blue Green Grey Total
Ethanol production
Sugar beet - 2.76 1.24 3.99 7.27
Transportation 0.00 - - 0.00 0.00
Electricty 0.01 0.06 - 0.06 0.03
Heat 0.00 - - 0.00 0.00
Ethylene production
Steam 0.00 - - 0.00 -
Electricty 0.00 0.03 - 0.03 0.01
Heat 0.00 - - 0.00 0.00
Polymerization
Internal fuel supply 0.00 - - 0.00 0.00
External fuel supply 0.00 - - 0.00 0.00
Electricity 0.01 0.07 - 0.08 0.03
Total 0.02 2.91 1.24 4.17 7.34 Note :(-) means there is no water and land footprint
(0.00) means there is water or land footprint, but really small
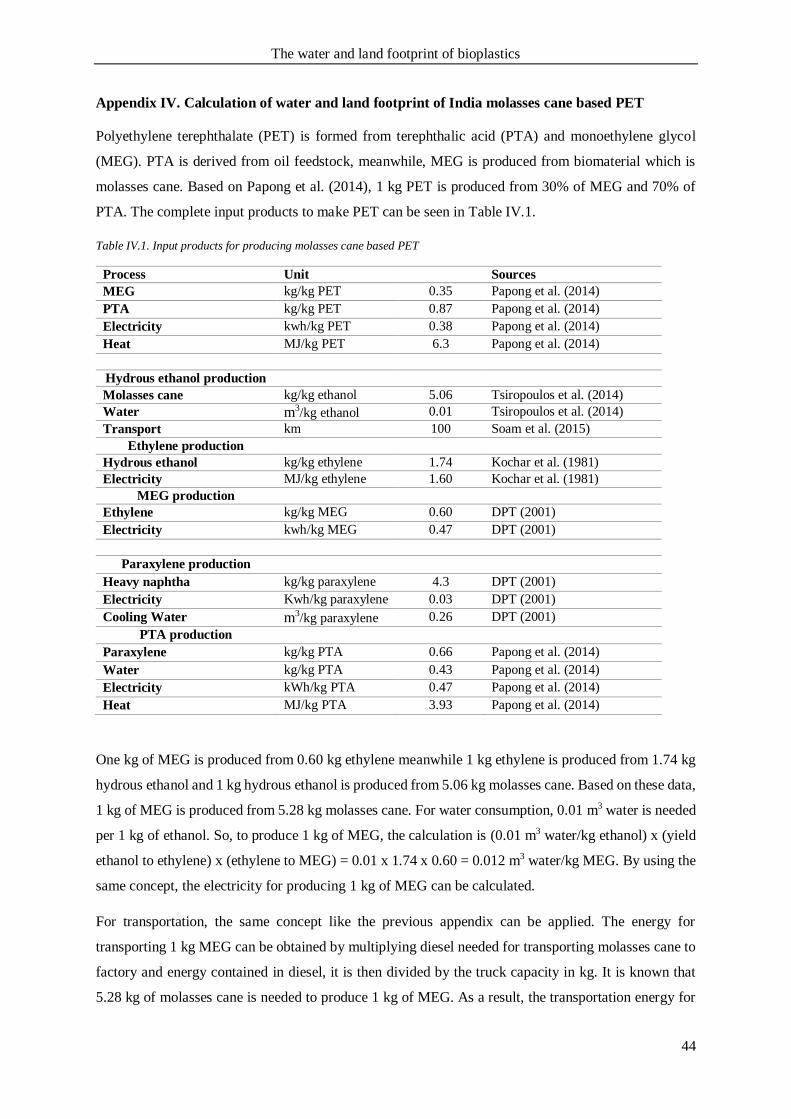
The water and land footprint of bioplastics
44
Appendix IV. Calculation of water and land footprint of India molasses cane based PET
Polyethylene terephthalate (PET) is formed from terephthalic acid (PTA) and monoethylene glycol
(MEG). PTA is derived from oil feedstock, meanwhile, MEG is produced from biomaterial which is
molasses cane. Based on Papong et al. (2014), 1 kg PET is produced from 30% of MEG and 70% of
PTA. The complete input products to make PET can be seen in Table IV.1.
Table IV.1. Input products for producing molasses cane based PET
Process Unit Sources
MEG kg/kg PET 0.35 Papong et al. (2014)
PTA kg/kg PET 0.87 Papong et al. (2014)
Electricity kwh/kg PET 0.38 Papong et al. (2014)
Heat MJ/kg PET 6.3 Papong et al. (2014)
Hydrous ethanol production
Molasses cane kg/kg ethanol 5.06 Tsiropoulos et al. (2014)
Water m3/kg ethanol 0.01 Tsiropoulos et al. (2014)
Transport km 100 Soam et al. (2015)
Ethylene production
Hydrous ethanol kg/kg ethylene 1.74 Kochar et al. (1981)
Electricity MJ/kg ethylene 1.60 Kochar et al. (1981)
MEG production
Ethylene kg/kg MEG 0.60 DPT (2001)
Electricity kwh/kg MEG 0.47 DPT (2001)
Paraxylene production
Heavy naphtha kg/kg paraxylene 4.3 DPT (2001)
Electricity Kwh/kg paraxylene 0.03 DPT (2001)
Cooling Water m3/kg paraxylene 0.26 DPT (2001)
PTA production
Paraxylene kg/kg PTA 0.66 Papong et al. (2014)
Water kg/kg PTA 0.43 Papong et al. (2014)
Electricity kWh/kg PTA 0.47 Papong et al. (2014)
Heat MJ/kg PTA 3.93 Papong et al. (2014)
One kg of MEG is produced from 0.60 kg ethylene meanwhile 1 kg ethylene is produced from 1.74 kg
hydrous ethanol and 1 kg hydrous ethanol is produced from 5.06 kg molasses cane. Based on these data,
1 kg of MEG is produced from 5.28 kg molasses cane. For water consumption, 0.01 m3 water is needed
per 1 kg of ethanol. So, to produce 1 kg of MEG, the calculation is (0.01 m3 water/kg ethanol) x (yield
ethanol to ethylene) x (ethylene to MEG) = 0.01 x 1.74 x 0.60 = 0.012 m3 water/kg MEG. By using the
same concept, the electricity for producing 1 kg of MEG can be calculated.
For transportation, the same concept like the previous appendix can be applied. The energy for
transporting 1 kg MEG can be obtained by multiplying diesel needed for transporting molasses cane to
factory and energy contained in diesel, it is then divided by the truck capacity in kg. It is known that
5.28 kg of molasses cane is needed to produce 1 kg of MEG. As a result, the transportation energy for
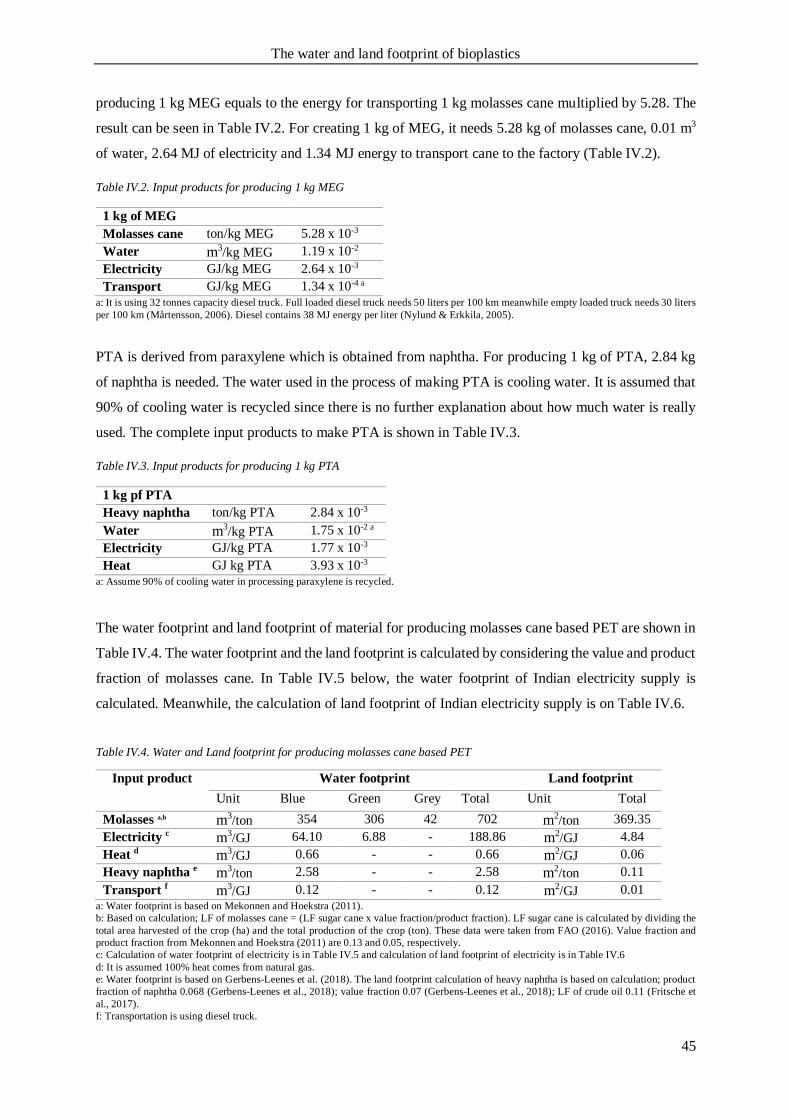
The water and land footprint of bioplastics
45
producing 1 kg MEG equals to the energy for transporting 1 kg molasses cane multiplied by 5.28. The
result can be seen in Table IV.2. For creating 1 kg of MEG, it needs 5.28 kg of molasses cane, 0.01 m3
of water, 2.64 MJ of electricity and 1.34 MJ energy to transport cane to the factory (Table IV.2).
Table IV.2. Input products for producing 1 kg MEG
1 kg of MEG
Molasses cane ton/kg MEG 5.28 x 10⁻³
Water m3/kg MEG 1.19 x 10⁻²
Electricity GJ/kg MEG 2.64 x 10⁻³
Transport GJ/kg MEG 1.34 x 10⁻⁴ a
a: It is using 32 tonnes capacity diesel truck. Full loaded diesel truck needs 50 liters per 100 km meanwhile empty loaded truck needs 30 liters
per 100 km (Mårtensson, 2006). Diesel contains 38 MJ energy per liter (Nylund & Erkkila, 2005).
PTA is derived from paraxylene which is obtained from naphtha. For producing 1 kg of PTA, 2.84 kg
of naphtha is needed. The water used in the process of making PTA is cooling water. It is assumed that
90% of cooling water is recycled since there is no further explanation about how much water is really
used. The complete input products to make PTA is shown in Table IV.3.
Table IV.3. Input products for producing 1 kg PTA
1 kg pf PTA
Heavy naphtha ton/kg PTA 2.84 x 10⁻³
Water m3/kg PTA 1.75 x 10⁻² a
Electricity GJ/kg PTA 1.77 x 10⁻³
Heat GJ kg PTA 3.93 x 10⁻³
a: Assume 90% of cooling water in processing paraxylene is recycled.
The water footprint and land footprint of material for producing molasses cane based PET are shown in
Table IV.4. The water footprint and the land footprint is calculated by considering the value and product
fraction of molasses cane. In Table IV.5 below, the water footprint of Indian electricity supply is
calculated. Meanwhile, the calculation of land footprint of Indian electricity supply is on Table IV.6.
Table IV.4. Water and Land footprint for producing molasses cane based PET
Input product Water footprint Land footprint
Unit Blue Green Grey Total Unit Total
Molasses a,b m3/ton 354 306 42 702 m2/ton 369.35
Electricity c m3/GJ 64.10 6.88 - 188.86 m2/GJ 4.84
Heat d m3/GJ 0.66 - - 0.66 m2/GJ 0.06
Heavy naphtha e m3/ton 2.58 - - 2.58 m2/ton 0.11
Transport f m3/GJ 0.12 - - 0.12 m2/GJ 0.01
a: Water footprint is based on Mekonnen and Hoekstra (2011).
b: Based on calculation; LF of molasses cane = (LF sugar cane x value fraction/product fraction). LF sugar cane is calculated by dividing the
total area harvested of the crop (ha) and the total production of the crop (ton). These data were taken from FAO (2016). Value fraction and
product fraction from Mekonnen and Hoekstra (2011) are 0.13 and 0.05, respectively.
c: Calculation of water footprint of electricity is in Table IV.5 and calculation of land footprint of electricity is in Table IV.6
d: It is assumed 100% heat comes from natural gas.
e: Water footprint is based on Gerbens-Leenes et al. (2018). The land footprint calculation of heavy naphtha is based on calculation; product
fraction of naphtha 0.068 (Gerbens-Leenes et al., 2018); value fraction 0.07 (Gerbens-Leenes et al., 2018); LF of crude oil 0.11 (Fritsche et
al., 2017).
f: Transportation is using diesel truck.
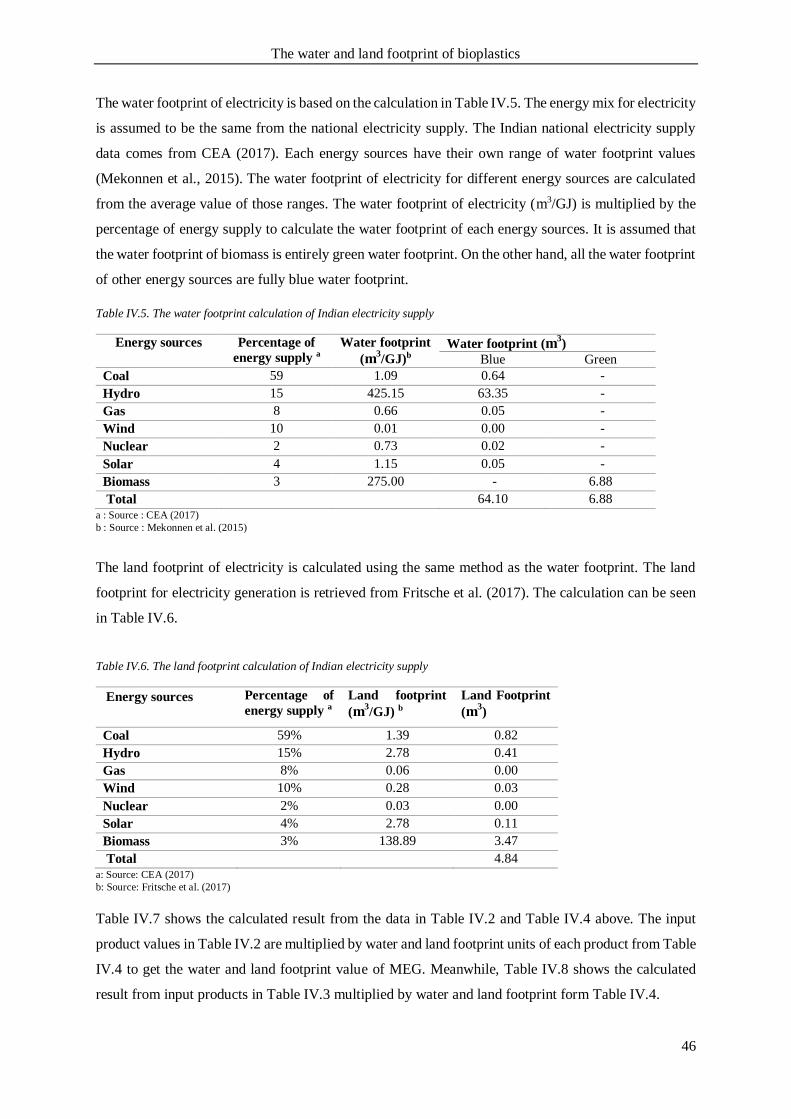
The water and land footprint of bioplastics
46
The water footprint of electricity is based on the calculation in Table IV.5. The energy mix for electricity
is assumed to be the same from the national electricity supply. The Indian national electricity supply
data comes from CEA (2017). Each energy sources have their own range of water footprint values
(Mekonnen et al., 2015). The water footprint of electricity for different energy sources are calculated
from the average value of those ranges. The water footprint of electricity (m3/GJ) is multiplied by the
percentage of energy supply to calculate the water footprint of each energy sources. It is assumed that
the water footprint of biomass is entirely green water footprint. On the other hand, all the water footprint
of other energy sources are fully blue water footprint.
Table IV.5. The water footprint calculation of Indian electricity supply
Energy sources Percentage of
energy supply a
Water footprint
(m3/GJ)b
Water footprint (m3)
Blue Green
Coal 59 1.09 0.64 -
Hydro 15 425.15 63.35 -
Gas 8 0.66 0.05 -
Wind 10 0.01 0.00 -
Nuclear 2 0.73 0.02 -
Solar 4 1.15 0.05 -
Biomass 3 275.00 - 6.88
Total 64.10 6.88
a : Source : CEA (2017)
b : Source : Mekonnen et al. (2015)
The land footprint of electricity is calculated using the same method as the water footprint. The land
footprint for electricity generation is retrieved from Fritsche et al. (2017). The calculation can be seen
in Table IV.6.
Table IV.6. The land footprint calculation of Indian electricity supply
Energy sources Percentage of
energy supply a
Land footprint
(m3/GJ) b
Land Footprint
(m3)
Coal 59% 1.39 0.82
Hydro 15% 2.78 0.41
Gas 8% 0.06 0.00
Wind 10% 0.28 0.03
Nuclear 2% 0.03 0.00
Solar 4% 2.78 0.11
Biomass 3% 138.89 3.47
Total 4.84
a: Source: CEA (2017)
b: Source: Fritsche et al. (2017)
Table IV.7 shows the calculated result from the data in Table IV.2 and Table IV.4 above. The input
product values in Table IV.2 are multiplied by water and land footprint units of each product from Table
IV.4 to get the water and land footprint value of MEG. Meanwhile, Table IV.8 shows the calculated
result from input products in Table IV.3 multiplied by water and land footprint form Table IV.4.
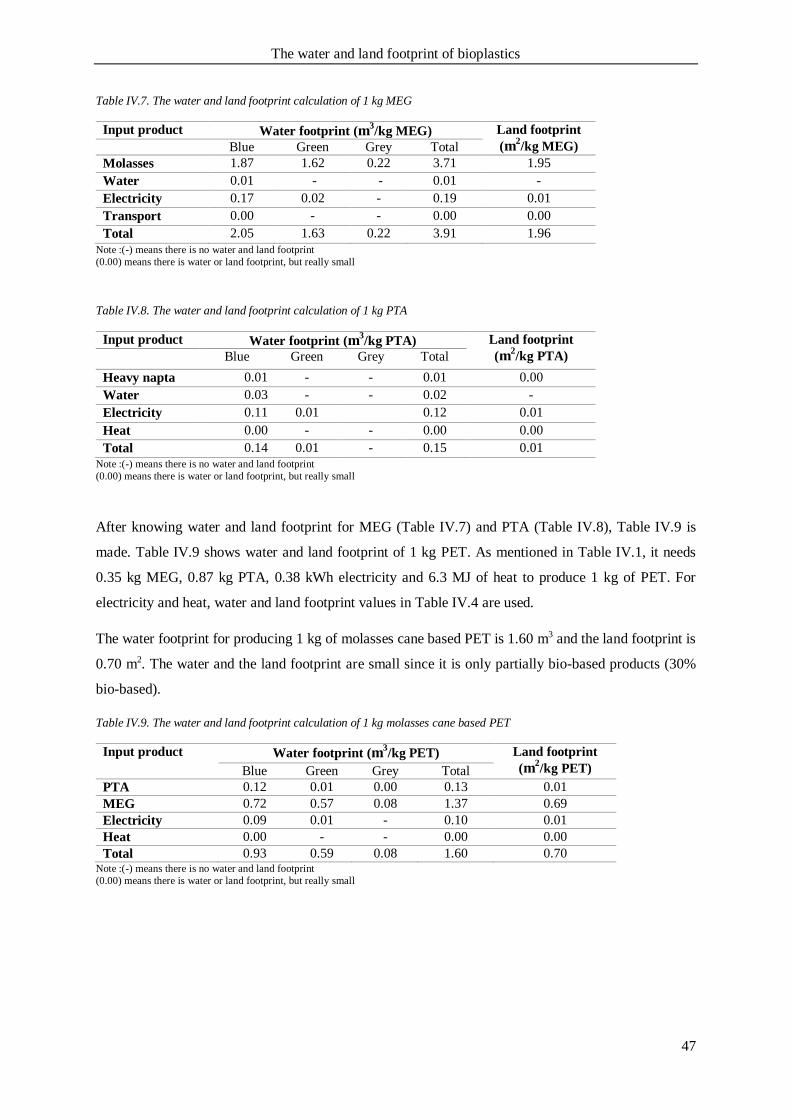
The water and land footprint of bioplastics
47
Table IV.7. The water and land footprint calculation of 1 kg MEG
Input product Water footprint (m3/kg MEG) Land footprint
(m2/kg MEG) Blue Green Grey Total
Molasses 1.87 1.62 0.22 3.71 1.95
Water 0.01 - - 0.01 -
Electricity 0.17 0.02 - 0.19 0.01
Transport 0.00 - - 0.00 0.00
Total 2.05 1.63 0.22 3.91 1.96
Note :(-) means there is no water and land footprint
(0.00) means there is water or land footprint, but really small
Table IV.8. The water and land footprint calculation of 1 kg PTA
Input product Water footprint (m3/kg PTA) Land footprint
(m2/kg PTA) Blue Green Grey Total
Heavy napta 0.01 - - 0.01 0.00
Water 0.03 - - 0.02 -
Electricity 0.11 0.01 0.12 0.01
Heat 0.00 - - 0.00 0.00
Total 0.14 0.01 - 0.15 0.01
Note :(-) means there is no water and land footprint
(0.00) means there is water or land footprint, but really small
After knowing water and land footprint for MEG (Table IV.7) and PTA (Table IV.8), Table IV.9 is
made. Table IV.9 shows water and land footprint of 1 kg PET. As mentioned in Table IV.1, it needs
0.35 kg MEG, 0.87 kg PTA, 0.38 kWh electricity and 6.3 MJ of heat to produce 1 kg of PET. For
electricity and heat, water and land footprint values in Table IV.4 are used.
The water footprint for producing 1 kg of molasses cane based PET is 1.60 m3 and the land footprint is
0.70 m2. The water and the land footprint are small since it is only partially bio-based products (30%
bio-based).
Table IV.9. The water and land footprint calculation of 1 kg molasses cane based PET
Input product
Water footprint (m
3/kg PET) Land footprint
(m2/kg PET) Blue Green Grey Total
PTA 0.12 0.01 0.00 0.13 0.01
MEG 0.72 0.57 0.08 1.37 0.69
Electricity 0.09 0.01 - 0.10 0.01
Heat 0.00 - - 0.00 0.00
Total 0.93 0.59 0.08 1.60 0.70 Note :(-) means there is no water and land footprint
(0.00) means there is water or land footprint, but really small
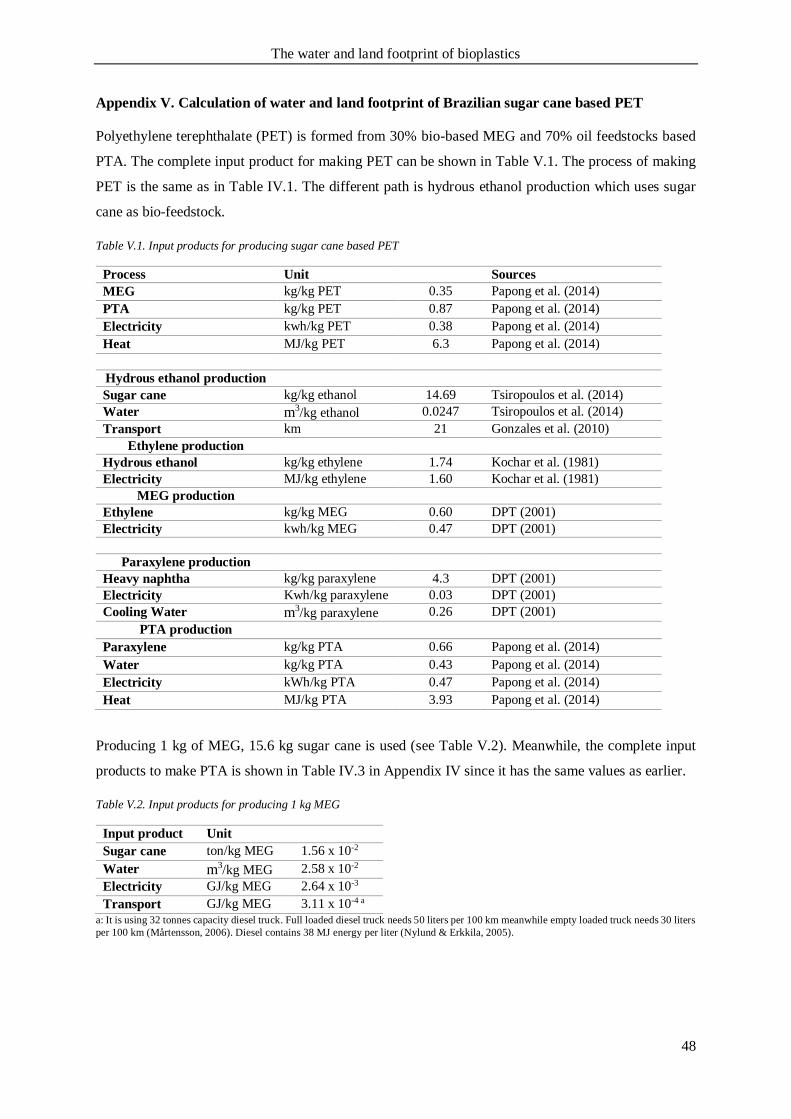
The water and land footprint of bioplastics
48
Appendix V. Calculation of water and land footprint of Brazilian sugar cane based PET
Polyethylene terephthalate (PET) is formed from 30% bio-based MEG and 70% oil feedstocks based
PTA. The complete input product for making PET can be shown in Table V.1. The process of making
PET is the same as in Table IV.1. The different path is hydrous ethanol production which uses sugar
cane as bio-feedstock.
Table V.1. Input products for producing sugar cane based PET
Process Unit Sources
MEG kg/kg PET 0.35 Papong et al. (2014)
PTA kg/kg PET 0.87 Papong et al. (2014)
Electricity kwh/kg PET 0.38 Papong et al. (2014)
Heat MJ/kg PET 6.3 Papong et al. (2014)
Hydrous ethanol production
Sugar cane kg/kg ethanol 14.69 Tsiropoulos et al. (2014)
Water m3/kg ethanol 0.0247 Tsiropoulos et al. (2014)
Transport km 21 Gonzales et al. (2010)
Ethylene production
Hydrous ethanol kg/kg ethylene 1.74 Kochar et al. (1981)
Electricity MJ/kg ethylene 1.60 Kochar et al. (1981)
MEG production
Ethylene kg/kg MEG 0.60 DPT (2001)
Electricity kwh/kg MEG 0.47 DPT (2001)
Paraxylene production
Heavy naphtha kg/kg paraxylene 4.3 DPT (2001)
Electricity Kwh/kg paraxylene 0.03 DPT (2001)
Cooling Water m3/kg paraxylene 0.26 DPT (2001)
PTA production
Paraxylene kg/kg PTA 0.66 Papong et al. (2014)
Water kg/kg PTA 0.43 Papong et al. (2014)
Electricity kWh/kg PTA 0.47 Papong et al. (2014)
Heat MJ/kg PTA 3.93 Papong et al. (2014)
Producing 1 kg of MEG, 15.6 kg sugar cane is used (see Table V.2). Meanwhile, the complete input
products to make PTA is shown in Table IV.3 in Appendix IV since it has the same values as earlier.
Table V.2. Input products for producing 1 kg MEG
Input product Unit
Sugar cane ton/kg MEG 1.56 x 10⁻²
Water m3/kg MEG 2.58 x 10⁻²
Electricity GJ/kg MEG 2.64 x 10⁻³
Transport GJ/kg MEG 3.11 x 10⁻⁴ a
a: It is using 32 tonnes capacity diesel truck. Full loaded diesel truck needs 50 liters per 100 km meanwhile empty loaded truck needs 30 liters
per 100 km (Mårtensson, 2006). Diesel contains 38 MJ energy per liter (Nylund & Erkkila, 2005).
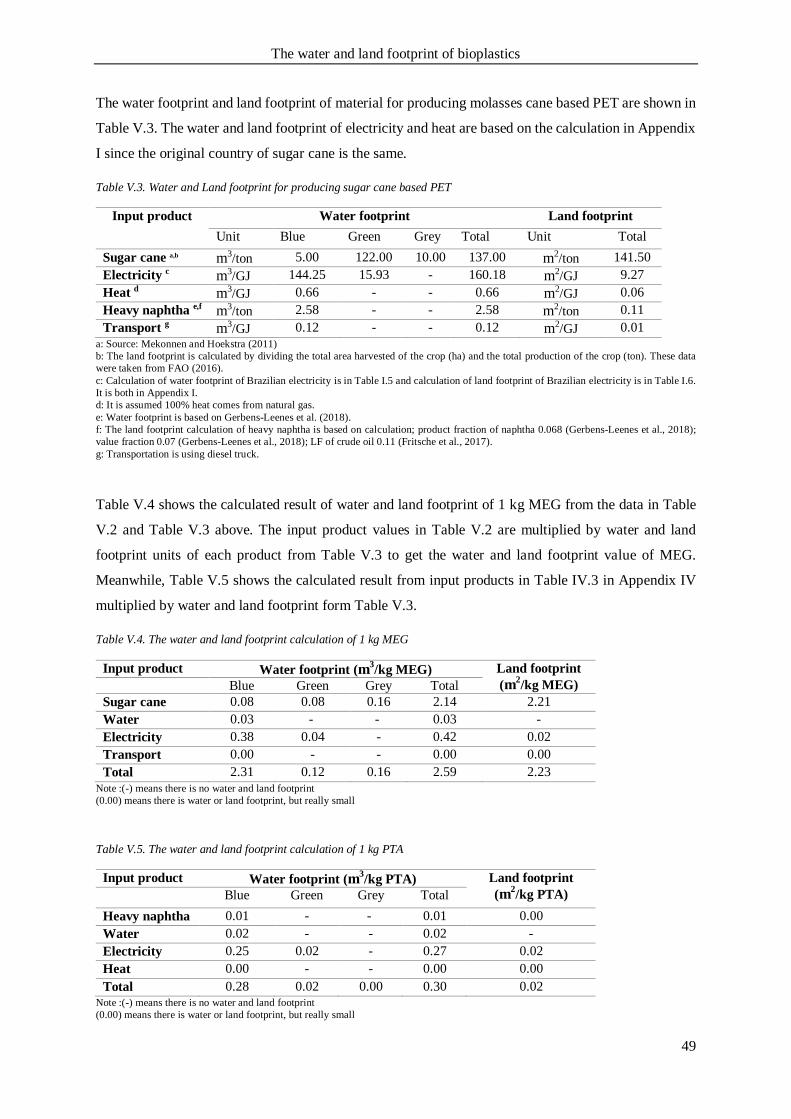
The water and land footprint of bioplastics
49
The water footprint and land footprint of material for producing molasses cane based PET are shown in
Table V.3. The water and land footprint of electricity and heat are based on the calculation in Appendix
I since the original country of sugar cane is the same.
Table V.3. Water and Land footprint for producing sugar cane based PET
Input product Water footprint Land footprint
Unit Blue Green Grey Total Unit Total
Sugar cane a,b m3/ton 5.00 122.00 10.00 137.00 m2/ton 141.50
Electricity c m3/GJ 144.25 15.93 - 160.18 m2/GJ 9.27
Heat d m3/GJ 0.66 - - 0.66 m2/GJ 0.06
Heavy naphtha e,f m3/ton 2.58 - - 2.58 m2/ton 0.11
Transport g m3/GJ 0.12 - - 0.12 m2/GJ 0.01
a: Source: Mekonnen and Hoekstra (2011)
b: The land footprint is calculated by dividing the total area harvested of the crop (ha) and the total production of the crop (ton). These data
were taken from FAO (2016).
c: Calculation of water footprint of Brazilian electricity is in Table I.5 and calculation of land footprint of Brazilian electricity is in Table I.6.
It is both in Appendix I.
d: It is assumed 100% heat comes from natural gas.
e: Water footprint is based on Gerbens-Leenes et al. (2018).
f: The land footprint calculation of heavy naphtha is based on calculation; product fraction of naphtha 0.068 (Gerbens-Leenes et al., 2018);
value fraction 0.07 (Gerbens-Leenes et al., 2018); LF of crude oil 0.11 (Fritsche et al., 2017).
g: Transportation is using diesel truck.
Table V.4 shows the calculated result of water and land footprint of 1 kg MEG from the data in Table
V.2 and Table V.3 above. The input product values in Table V.2 are multiplied by water and land
footprint units of each product from Table V.3 to get the water and land footprint value of MEG.
Meanwhile, Table V.5 shows the calculated result from input products in Table IV.3 in Appendix IV
multiplied by water and land footprint form Table V.3.
Table V.4. The water and land footprint calculation of 1 kg MEG
Input product Water footprint (m3/kg MEG) Land footprint
(m2/kg MEG) Blue Green Grey Total
Sugar cane 0.08 0.08 0.16 2.14 2.21
Water 0.03 - - 0.03 -
Electricity 0.38 0.04 - 0.42 0.02
Transport 0.00 - - 0.00 0.00
Total 2.31 0.12 0.16 2.59 2.23
Note :(-) means there is no water and land footprint
(0.00) means there is water or land footprint, but really small
Table V.5. The water and land footprint calculation of 1 kg PTA
Input product Water footprint (m3/kg PTA) Land footprint
(m2/kg PTA) Blue Green Grey Total
Heavy naphtha 0.01 - - 0.01 0.00
Water 0.02 - - 0.02 -
Electricity 0.25 0.02 - 0.27 0.02
Heat 0.00 - - 0.00 0.00
Total 0.28 0.02 0.00 0.30 0.02
Note :(-) means there is no water and land footprint
(0.00) means there is water or land footprint, but really small
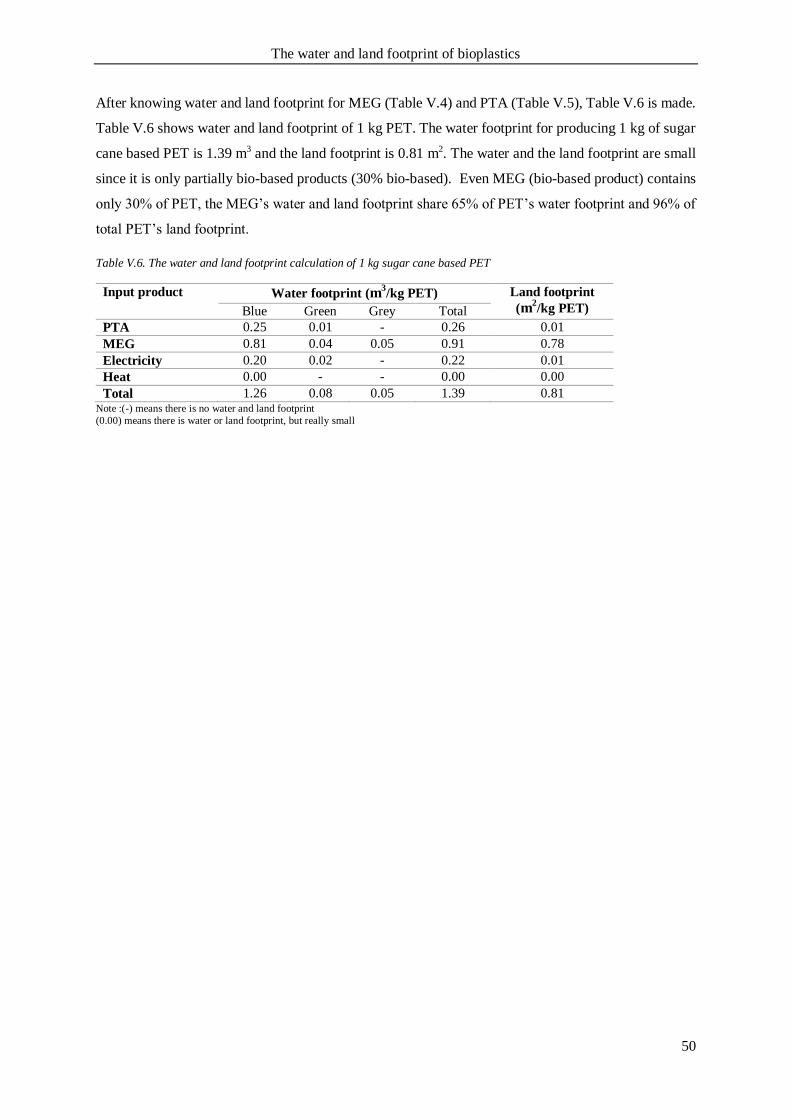
The water and land footprint of bioplastics
50
After knowing water and land footprint for MEG (Table V.4) and PTA (Table V.5), Table V.6 is made.
Table V.6 shows water and land footprint of 1 kg PET. The water footprint for producing 1 kg of sugar
cane based PET is 1.39 m3 and the land footprint is 0.81 m2. The water and the land footprint are small
since it is only partially bio-based products (30% bio-based). Even MEG (bio-based product) contains
only 30% of PET, the MEG’s water and land footprint share 65% of PET’s water footprint and 96% of
total PET’s land footprint.
Table V.6. The water and land footprint calculation of 1 kg sugar cane based PET
Input product
Water footprint (m
3/kg PET) Land footprint
(m2/kg PET) Blue Green Grey Total
PTA 0.25 0.01 - 0.26 0.01
MEG 0.81 0.04 0.05 0.91 0.78
Electricity 0.20 0.02 - 0.22 0.01
Heat 0.00 - - 0.00 0.00
Total 1.26 0.08 0.05 1.39 0.81 Note :(-) means there is no water and land footprint
(0.00) means there is water or land footprint, but really small
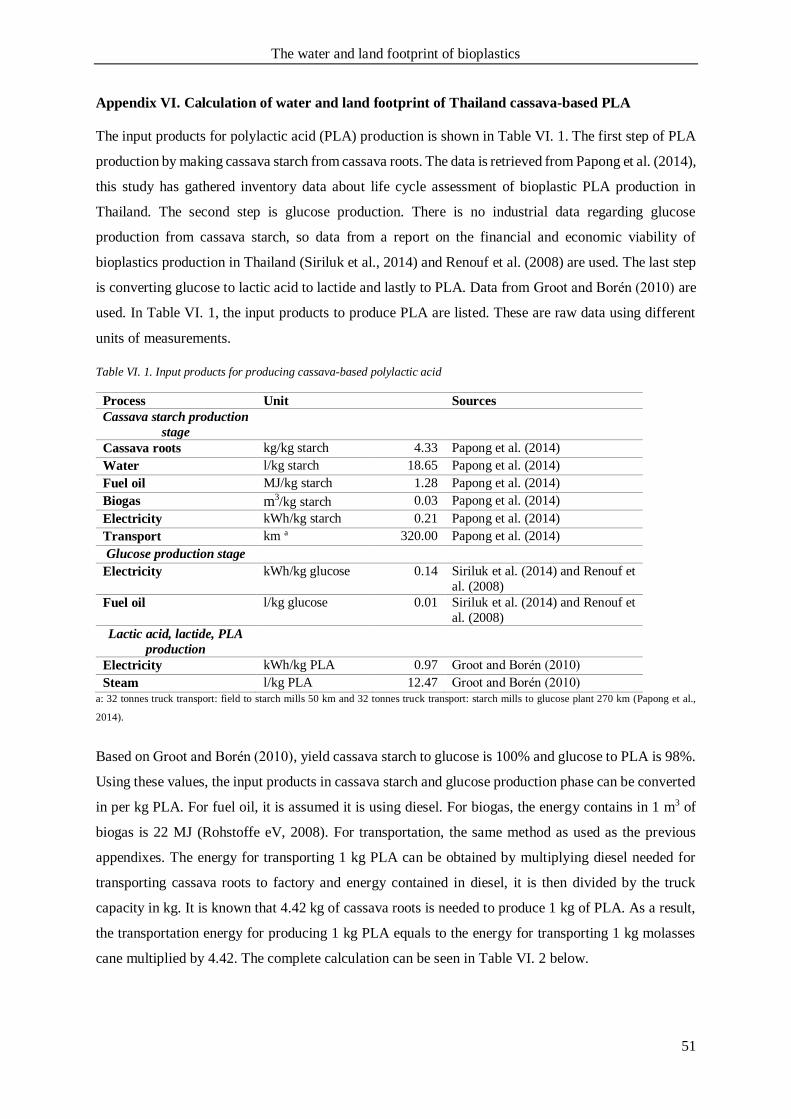
The water and land footprint of bioplastics
51
Appendix VI. Calculation of water and land footprint of Thailand cassava-based PLA
The input products for polylactic acid (PLA) production is shown in Table VI. 1. The first step of PLA
production by making cassava starch from cassava roots. The data is retrieved from Papong et al. (2014),
this study has gathered inventory data about life cycle assessment of bioplastic PLA production in
Thailand. The second step is glucose production. There is no industrial data regarding glucose
production from cassava starch, so data from a report on the financial and economic viability of
bioplastics production in Thailand (Siriluk et al., 2014) and Renouf et al. (2008) are used. The last step
is converting glucose to lactic acid to lactide and lastly to PLA. Data from Groot and Boren (2010) are
used. In Table VI. 1, the input products to produce PLA are listed. These are raw data using different
units of measurements.
Table VI. 1. Input products for producing cassava-based polylactic acid
Process Unit Sources
Cassava starch production
stage
Cassava roots kg/kg starch 4.33 Papong et al. (2014)
Water l/kg starch 18.65 Papong et al. (2014)
Fuel oil MJ/kg starch 1.28 Papong et al. (2014)
Biogas m3/kg starch 0.03 Papong et al. (2014)
Electricity kWh/kg starch 0.21 Papong et al. (2014)
Transport km a 320.00 Papong et al. (2014)
Glucose production stage
Electricity kWh/kg glucose 0.14 Siriluk et al. (2014) and Renouf et
al. (2008)
Fuel oil l/kg glucose 0.01 Siriluk et al. (2014) and Renouf et
al. (2008)
Lactic acid, lactide, PLA
production
Electricity kWh/kg PLA 0.97 Groot and Boren (2010)
Steam l/kg PLA 12.47 Groot and Boren (2010)
a: 32 tonnes truck transport: field to starch mills 50 km and 32 tonnes truck transport: starch mills to glucose plant 270 km (Papong et al.,
2014).
Based on Groot and Boren (2010), yield cassava starch to glucose is 100% and glucose to PLA is 98%.
Using these values, the input products in cassava starch and glucose production phase can be converted
in per kg PLA. For fuel oil, it is assumed it is using diesel. For biogas, the energy contains in 1 m3 of
biogas is 22 MJ (Rohstoffe eV, 2008). For transportation, the same method as used as the previous
appendixes. The energy for transporting 1 kg PLA can be obtained by multiplying diesel needed for
transporting cassava roots to factory and energy contained in diesel, it is then divided by the truck
capacity in kg. It is known that 4.42 kg of cassava roots is needed to produce 1 kg of PLA. As a result,
the transportation energy for producing 1 kg PLA equals to the energy for transporting 1 kg molasses
cane multiplied by 4.42. The complete calculation can be seen in Table VI. 2 below.
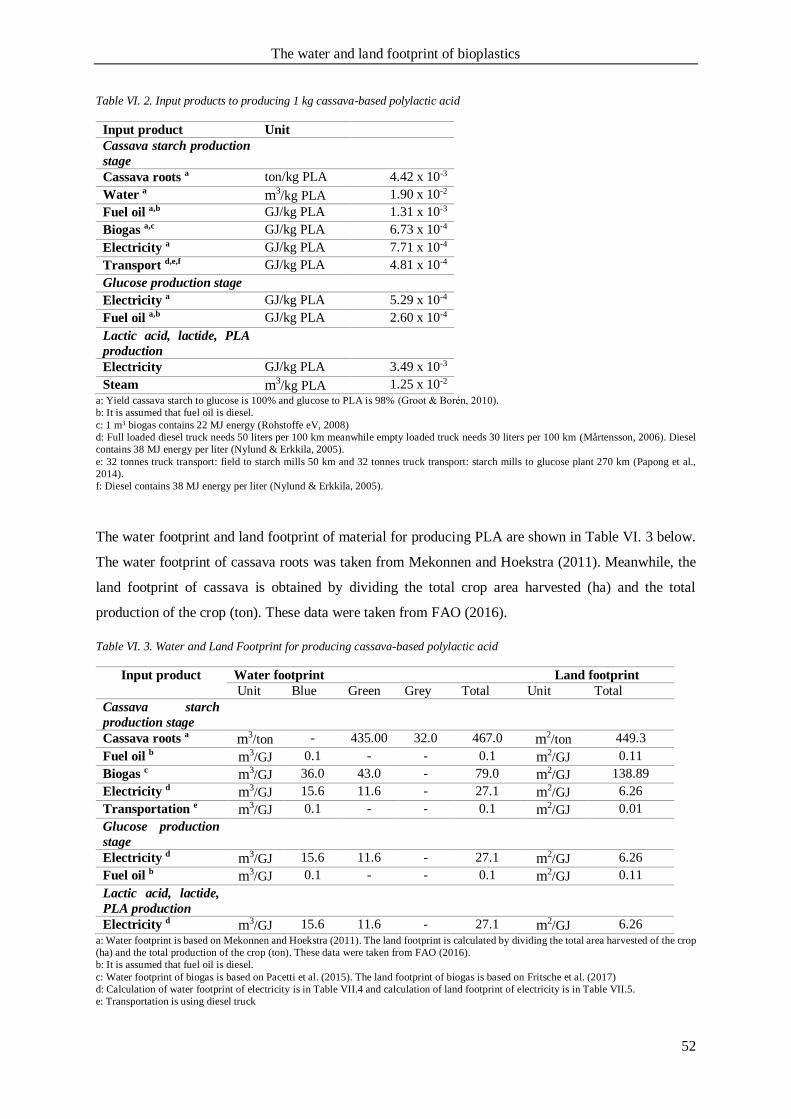
The water and land footprint of bioplastics
52
Table VI. 2. Input products to producing 1 kg cassava-based polylactic acid
Input product Unit
Cassava starch production
stage
Cassava roots a ton/kg PLA 4.42 x 10⁻³
Water a m3/kg PLA 1.90 x 10⁻²
Fuel oil a,b GJ/kg PLA 1.31 x 10⁻³
Biogas a,c GJ/kg PLA 6.73 x 10⁻⁴
Electricity a GJ/kg PLA 7.71 x 10⁻⁴
Transport d,e,f GJ/kg PLA 4.81 x 10⁻⁴
Glucose production stage
Electricity a GJ/kg PLA 5.29 x 10⁻⁴
Fuel oil a,b GJ/kg PLA 2.60 x 10⁻⁴
Lactic acid, lactide, PLA
production
Electricity GJ/kg PLA 3.49 x 10⁻³
Steam m3/kg PLA 1.25 x 10⁻²
a: Yield cassava starch to glucose is 100% and glucose to PLA is 98% (Groot & Boren, 2010).
b: It is assumed that fuel oil is diesel.
c: 1 m3 biogas contains 22 MJ energy (Rohstoffe eV, 2008)
d: Full loaded diesel truck needs 50 liters per 100 km meanwhile empty loaded truck needs 30 liters per 100 km (Mårtensson, 2006). Diesel
contains 38 MJ energy per liter (Nylund & Erkkila, 2005).
e: 32 tonnes truck transport: field to starch mills 50 km and 32 tonnes truck transport: starch mills to glucose plant 270 km (Papong et al.,
2014).
f: Diesel contains 38 MJ energy per liter (Nylund & Erkkila, 2005).
The water footprint and land footprint of material for producing PLA are shown in Table VI. 3 below.
The water footprint of cassava roots was taken from Mekonnen and Hoekstra (2011). Meanwhile, the
land footprint of cassava is obtained by dividing the total crop area harvested (ha) and the total
production of the crop (ton). These data were taken from FAO (2016).
Table VI. 3. Water and Land Footprint for producing cassava-based polylactic acid
Input product Water footprint Land footprint
Unit Blue Green Grey Total Unit Total
Cassava starch
production stage
Cassava roots a m3/ton - 435.00 32.0 467.0 m2/ton 449.3
Fuel oil b m3/GJ 0.1 - - 0.1 m2/GJ 0.11
Biogas c m3/GJ 36.0 43.0 - 79.0 m2/GJ 138.89
Electricity d m3/GJ 15.6 11.6 - 27.1 m2/GJ 6.26
Transportation e m3/GJ 0.1 - - 0.1 m2/GJ 0.01
Glucose production
stage
Electricity d m3/GJ 15.6 11.6 - 27.1 m2/GJ 6.26
Fuel oil b m3/GJ 0.1 - - 0.1 m2/GJ 0.11
Lactic acid, lactide,
PLA production
Electricity d m3/GJ 15.6 11.6 - 27.1 m2/GJ 6.26
a: Water footprint is based on Mekonnen and Hoekstra (2011). The land footprint is calculated by dividing the total area harvested of the crop
(ha) and the total production of the crop (ton). These data were taken from FAO (2016).
b: It is assumed that fuel oil is diesel.
c: Water footprint of biogas is based on Pacetti et al. (2015). The land footprint of biogas is based on Fritsche et al. (2017)
d: Calculation of water footprint of electricity is in Table VII.4 and calculation of land footprint of electricity is in Table VII.5.
e: Transportation is using diesel truck
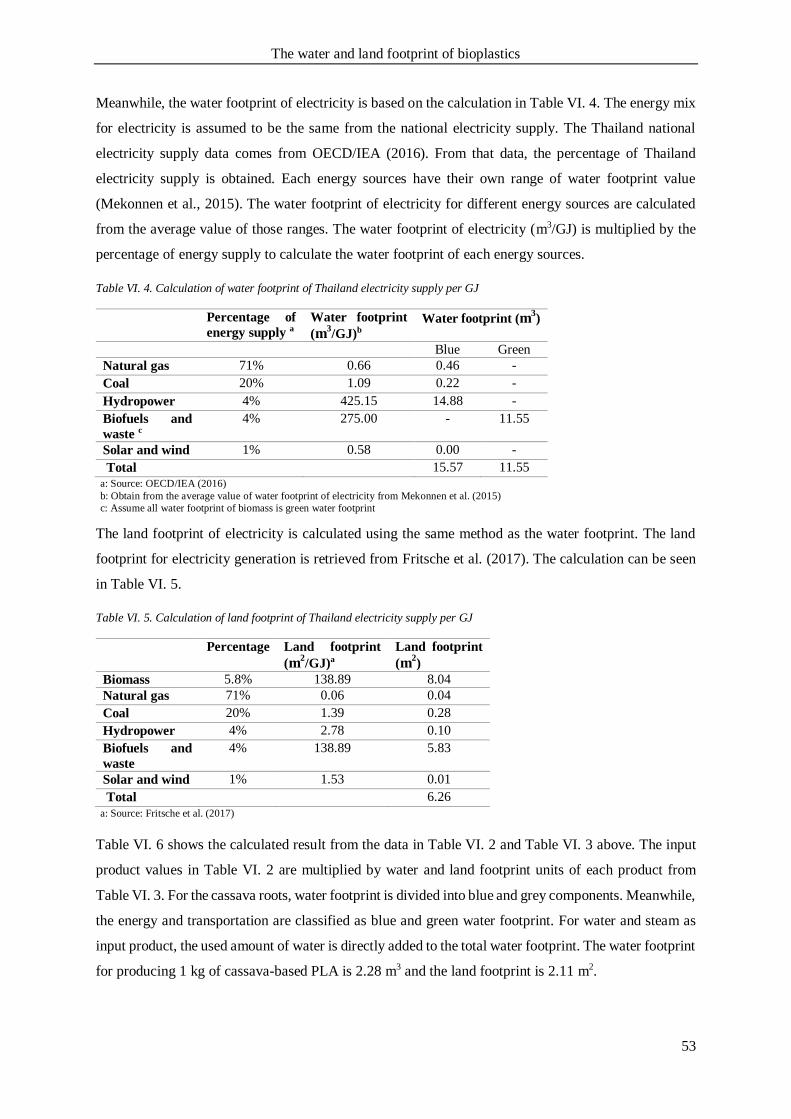
The water and land footprint of bioplastics
53
Meanwhile, the water footprint of electricity is based on the calculation in Table VI. 4. The energy mix
for electricity is assumed to be the same from the national electricity supply. The Thailand national
electricity supply data comes from OECD/IEA (2016). From that data, the percentage of Thailand
electricity supply is obtained. Each energy sources have their own range of water footprint value
(Mekonnen et al., 2015). The water footprint of electricity for different energy sources are calculated
from the average value of those ranges. The water footprint of electricity (m3/GJ) is multiplied by the
percentage of energy supply to calculate the water footprint of each energy sources.
Table VI. 4. Calculation of water footprint of Thailand electricity supply per GJ
Percentage of
energy supply a
Water footprint
(m3/GJ)b
Water footprint (m3)
Blue Green
Natural gas 71% 0.66 0.46 -
Coal 20% 1.09 0.22 -
Hydropower 4% 425.15 14.88 -
Biofuels and
waste c
4% 275.00 - 11.55
Solar and wind 1% 0.58 0.00 -
Total 15.57 11.55
a: Source: OECD/IEA (2016)
b: Obtain from the average value of water footprint of electricity from Mekonnen et al. (2015)
c: Assume all water footprint of biomass is green water footprint
The land footprint of electricity is calculated using the same method as the water footprint. The land
footprint for electricity generation is retrieved from Fritsche et al. (2017). The calculation can be seen
in Table VI. 5.
Table VI. 5. Calculation of land footprint of Thailand electricity supply per GJ
Percentage Land footprint
(m2/GJ)a
Land footprint
(m2)
Biomass 5.8% 138.89 8.04
Natural gas 71% 0.06 0.04
Coal 20% 1.39 0.28
Hydropower 4% 2.78 0.10
Biofuels and
waste
4% 138.89 5.83
Solar and wind 1% 1.53 0.01
Total 6.26
a: Source: Fritsche et al. (2017)
Table VI. 6 shows the calculated result from the data in Table VI. 2 and Table VI. 3 above. The input
product values in Table VI. 2 are multiplied by water and land footprint units of each product from
Table VI. 3. For the cassava roots, water footprint is divided into blue and grey components. Meanwhile,
the energy and transportation are classified as blue and green water footprint. For water and steam as
input product, the used amount of water is directly added to the total water footprint. The water footprint
for producing 1 kg of cassava-based PLA is 2.28 m3 and the land footprint is 2.11 m2.
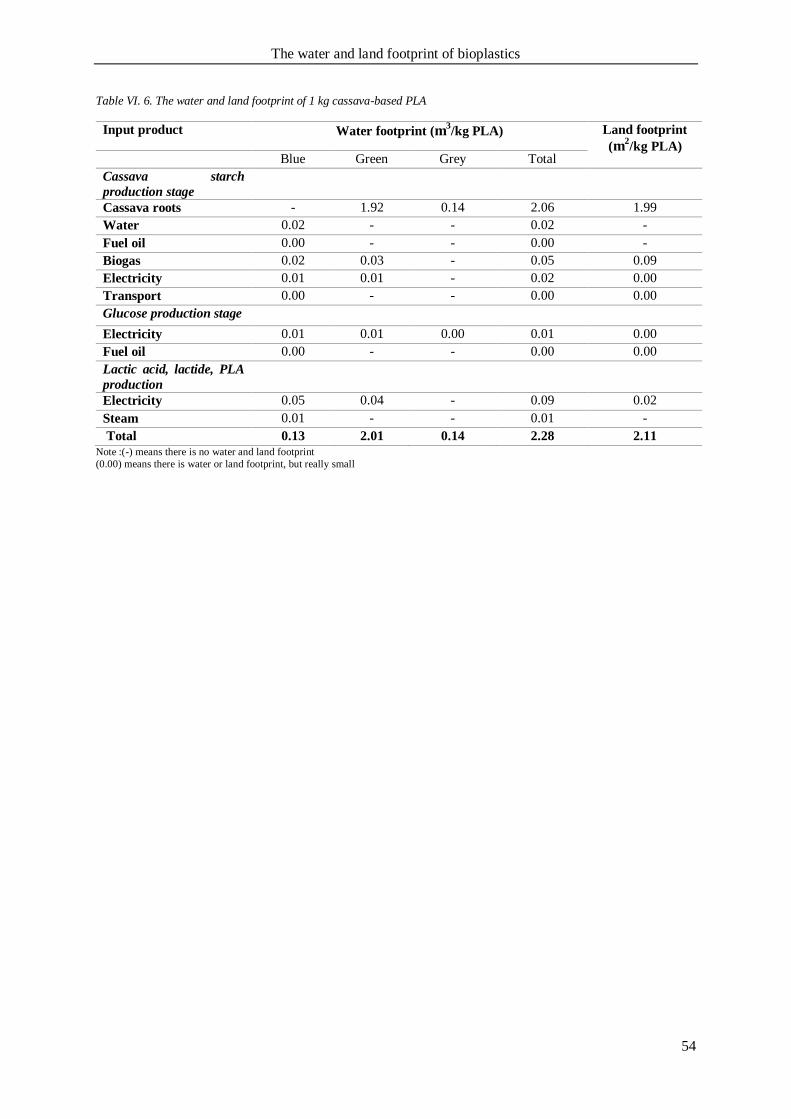
The water and land footprint of bioplastics
54
Table VI. 6. The water and land footprint of 1 kg cassava-based PLA
Input product Water footprint (m3/kg PLA) Land footprint
(m2/kg PLA)
Blue Green Grey Total
Cassava starch
production stage
Cassava roots - 1.92 0.14 2.06 1.99
Water 0.02 - - 0.02 -
Fuel oil 0.00 - - 0.00 -
Biogas 0.02 0.03 - 0.05 0.09
Electricity 0.01 0.01 - 0.02 0.00
Transport 0.00 - - 0.00 0.00
Glucose production stage
Electricity 0.01 0.01 0.00 0.01 0.00
Fuel oil 0.00 - - 0.00 0.00
Lactic acid, lactide, PLA
production
Electricity 0.05 0.04 - 0.09 0.02
Steam 0.01 - - 0.01 -
Total 0.13 2.01 0.14 2.28 2.11
Note :(-) means there is no water and land footprint
(0.00) means there is water or land footprint, but really small
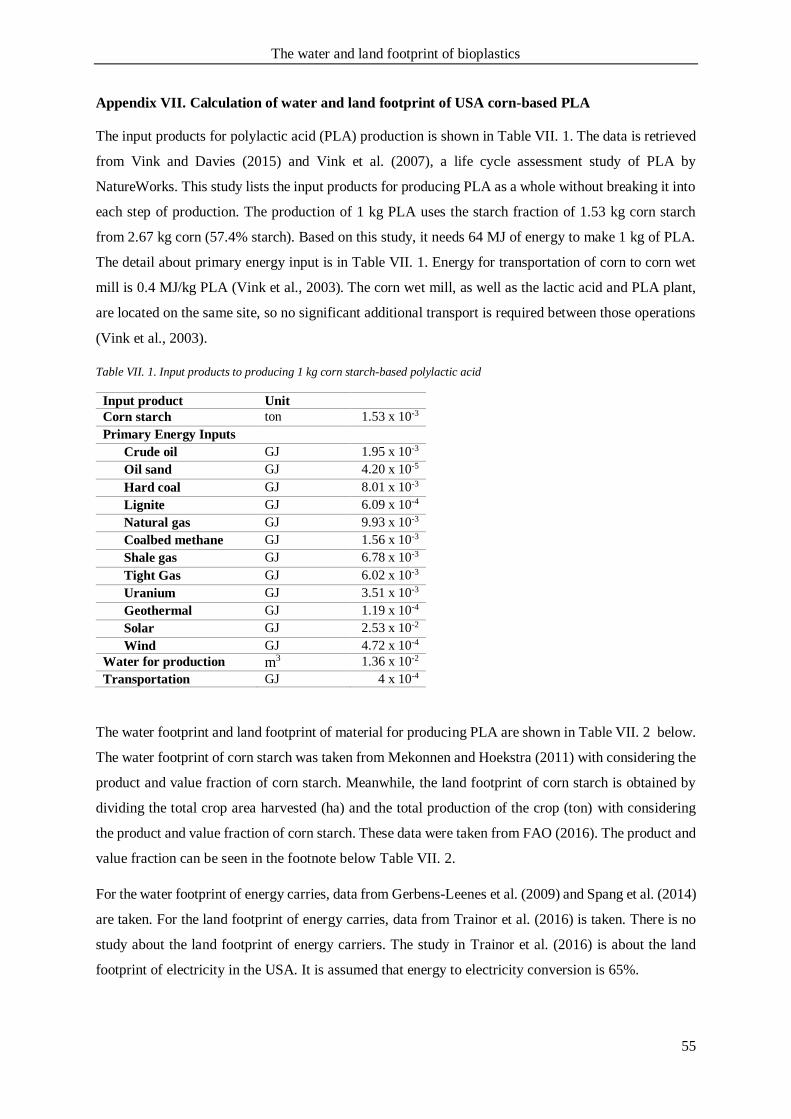
The water and land footprint of bioplastics
55
Appendix VII. Calculation of water and land footprint of USA corn-based PLA
The input products for polylactic acid (PLA) production is shown in Table VII. 1. The data is retrieved
from Vink and Davies (2015) and Vink et al. (2007), a life cycle assessment study of PLA by
NatureWorks. This study lists the input products for producing PLA as a whole without breaking it into
each step of production. The production of 1 kg PLA uses the starch fraction of 1.53 kg corn starch
from 2.67 kg corn (57.4% starch). Based on this study, it needs 64 MJ of energy to make 1 kg of PLA.
The detail about primary energy input is in Table VII. 1. Energy for transportation of corn to corn wet
mill is 0.4 MJ/kg PLA (Vink et al., 2003). The corn wet mill, as well as the lactic acid and PLA plant,
are located on the same site, so no significant additional transport is required between those operations
(Vink et al., 2003).
Table VII. 1. Input products to producing 1 kg corn starch-based polylactic acid
Input product Unit
Corn starch ton 1.53 x 10⁻³
Primary Energy Inputs
Crude oil GJ 1.95 x 10⁻³
Oil sand GJ 4.20 x 10⁻⁵
Hard coal GJ 8.01 x 10⁻³
Lignite GJ 6.09 x 10⁻⁴
Natural gas GJ 9.93 x 10⁻³
Coalbed methane GJ 1.56 x 10⁻³
Shale gas GJ 6.78 x 10⁻³
Tight Gas GJ 6.02 x 10⁻³
Uranium GJ 3.51 x 10⁻³
Geothermal GJ 1.19 x 10⁻⁴
Solar GJ 2.53 x 10⁻²
Wind GJ 4.72 x 10⁻⁴
Water for production m3 1.36 x 10⁻²
Transportation GJ 4 x 10⁻⁴
The water footprint and land footprint of material for producing PLA are shown in Table VII. 2 below.
The water footprint of corn starch was taken from Mekonnen and Hoekstra (2011) with considering the
product and value fraction of corn starch. Meanwhile, the land footprint of corn starch is obtained by
dividing the total crop area harvested (ha) and the total production of the crop (ton) with considering
the product and value fraction of corn starch. These data were taken from FAO (2016). The product and
value fraction can be seen in the footnote below Table VII. 2.
For the water footprint of energy carries, data from Gerbens-Leenes et al. (2009) and Spang et al. (2014)
are taken. For the land footprint of energy carries, data from Trainor et al. (2016) is taken. There is no
study about the land footprint of energy carriers. The study in Trainor et al. (2016) is about the land
footprint of electricity in the USA. It is assumed that energy to electricity conversion is 65%.
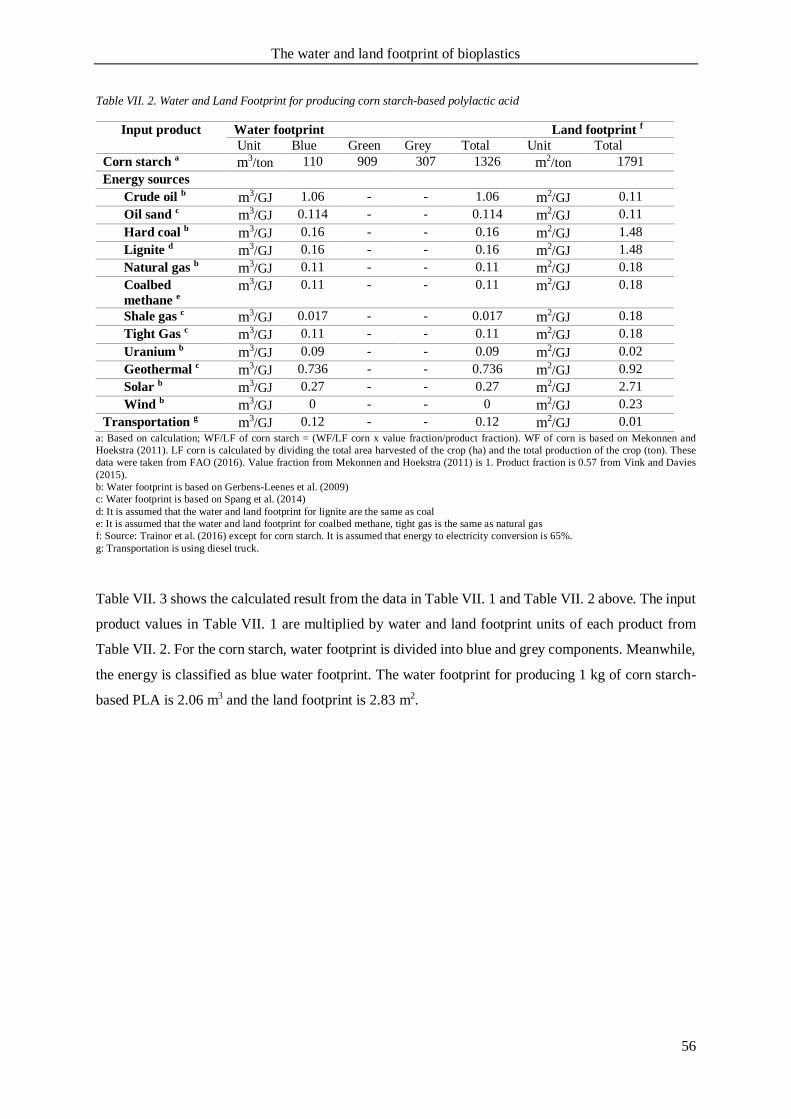
The water and land footprint of bioplastics
56
Table VII. 2. Water and Land Footprint for producing corn starch-based polylactic acid
Input product Water footprint Land footprint f
Unit Blue Green Grey Total Unit Total
Corn starch a m3/ton 110 909 307 1326 m2/ton 1791
Energy sources
Crude oil b m3/GJ 1.06 - - 1.06 m2/GJ 0.11
Oil sand c m3/GJ 0.114 - - 0.114 m2/GJ 0.11
Hard coal b m3/GJ 0.16 - - 0.16 m2/GJ 1.48
Lignite d m3/GJ 0.16 - - 0.16 m2/GJ 1.48
Natural gas b m3/GJ 0.11 - - 0.11 m2/GJ 0.18
Coalbed
methane e m3/GJ 0.11 - - 0.11 m2/GJ 0.18
Shale gas c m3/GJ 0.017 - - 0.017 m2/GJ 0.18
Tight Gas c m3/GJ 0.11 - - 0.11 m2/GJ 0.18
Uranium b m3/GJ 0.09 - - 0.09 m2/GJ 0.02
Geothermal c m3/GJ 0.736 - - 0.736 m2
/GJ 0.92
Solar b m3/GJ 0.27 - - 0.27 m2/GJ 2.71
Wind b m3/GJ 0 - - 0 m2/GJ 0.23
Transportation g m3/GJ 0.12 - - 0.12 m2/GJ 0.01
a: Based on calculation; WF/LF of corn starch = (WF/LF corn x value fraction/product fraction). WF of corn is based on Mekonnen and
Hoekstra (2011). LF corn is calculated by dividing the total area harvested of the crop (ha) and the total production of the crop (ton). These
data were taken from FAO (2016). Value fraction from Mekonnen and Hoekstra (2011) is 1. Product fraction is 0.57 from Vink and Davies
(2015).
b: Water footprint is based on Gerbens-Leenes et al. (2009)
c: Water footprint is based on Spang et al. (2014)
d: It is assumed that the water and land footprint for lignite are the same as coal
e: It is assumed that the water and land footprint for coalbed methane, tight gas is the same as natural gas
f: Source: Trainor et al. (2016) except for corn starch. It is assumed that energy to electricity conversion is 65%.
g: Transportation is using diesel truck.
Table VII. 3 shows the calculated result from the data in Table VII. 1 and Table VII. 2 above. The input
product values in Table VII. 1 are multiplied by water and land footprint units of each product from
Table VII. 2. For the corn starch, water footprint is divided into blue and grey components. Meanwhile,
the energy is classified as blue water footprint. The water footprint for producing 1 kg of corn starch-
based PLA is 2.06 m3 and the land footprint is 2.83 m2.
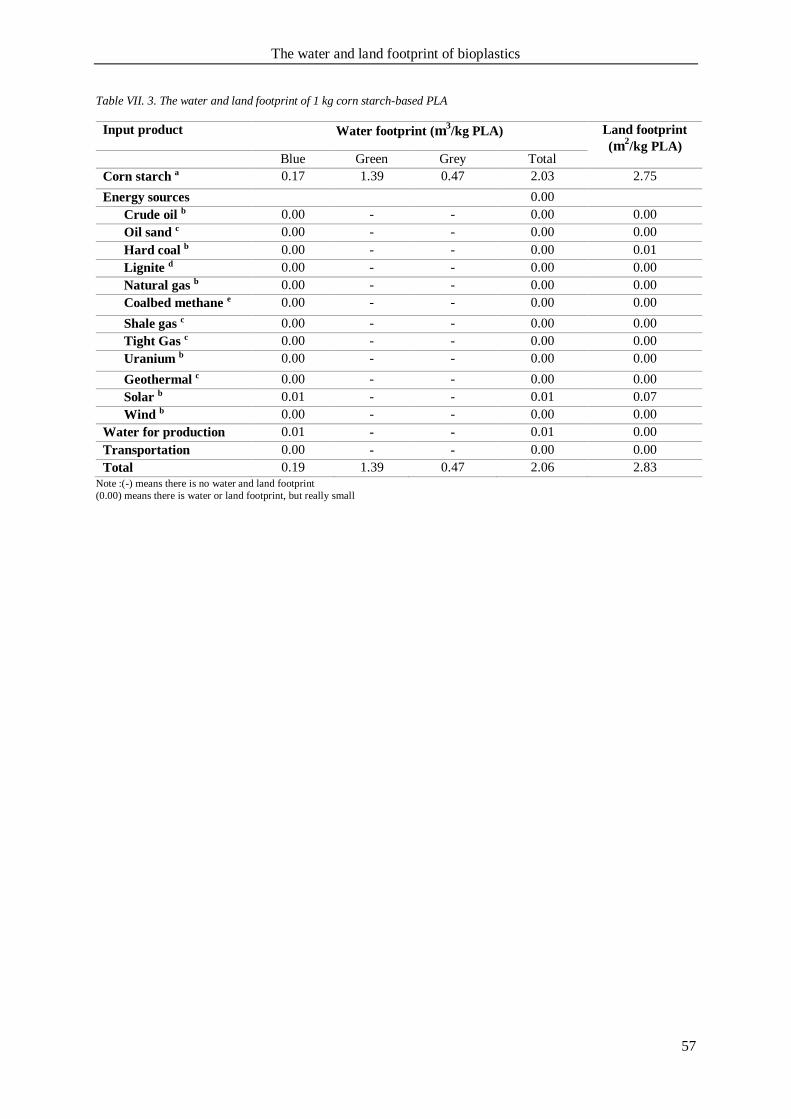
The water and land footprint of bioplastics
57
Table VII. 3. The water and land footprint of 1 kg corn starch-based PLA
Input product Water footprint (m3/kg PLA) Land footprint
(m2/kg PLA)
Blue Green Grey Total
Corn starch a 0.17 1.39 0.47 2.03 2.75
Energy sources 0.00
Crude oil b 0.00 - - 0.00 0.00
Oil sand c 0.00 - - 0.00 0.00
Hard coal b 0.00 - - 0.00 0.01
Lignite d 0.00 - - 0.00 0.00
Natural gas b 0.00 - - 0.00 0.00
Coalbed methane e 0.00 - - 0.00 0.00
Shale gas c 0.00 - - 0.00 0.00
Tight Gas c 0.00 - - 0.00 0.00
Uranium b 0.00 - - 0.00 0.00
Geothermal c 0.00 - - 0.00 0.00
Solar b 0.01 - - 0.01 0.07
Wind b 0.00 - - 0.00 0.00
Water for production 0.01 - - 0.01 0.00
Transportation 0.00 - - 0.00 0.00
Total 0.19 1.39 0.47 2.06 2.83
Note :(-) means there is no water and land footprint
(0.00) means there is water or land footprint, but really small
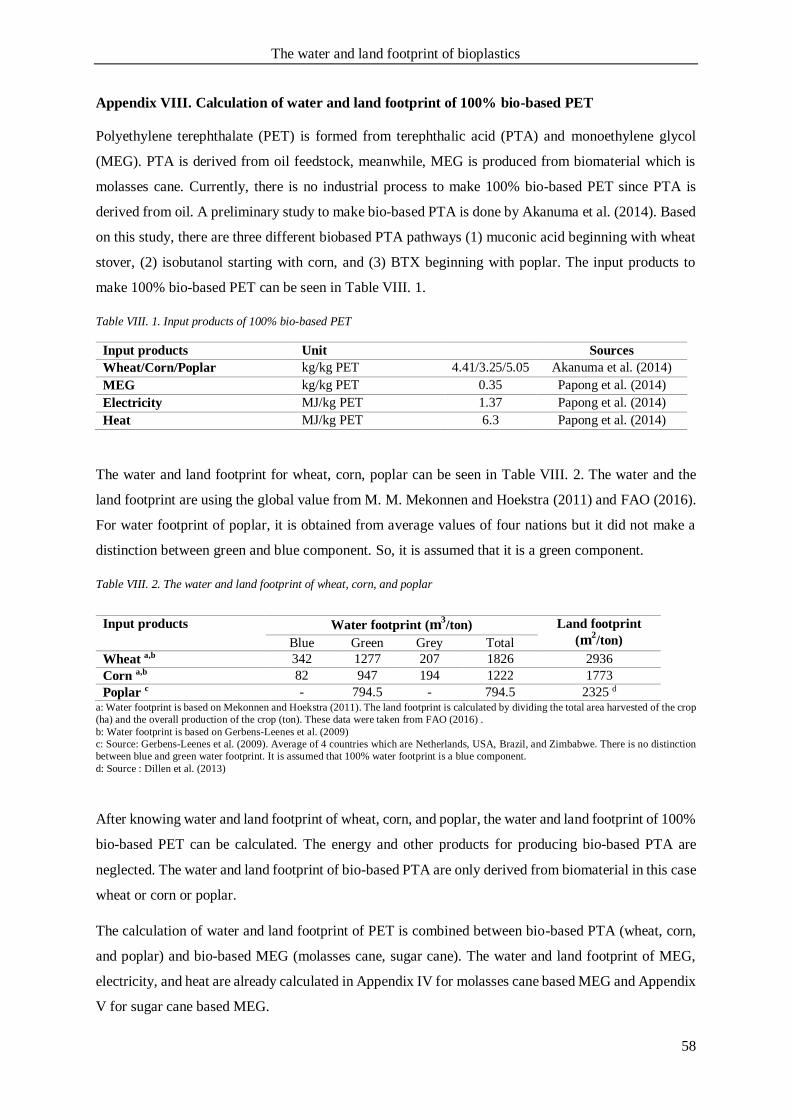
The water and land footprint of bioplastics
58
Appendix VIII. Calculation of water and land footprint of 100% bio-based PET
Polyethylene terephthalate (PET) is formed from terephthalic acid (PTA) and monoethylene glycol
(MEG). PTA is derived from oil feedstock, meanwhile, MEG is produced from biomaterial which is
molasses cane. Currently, there is no industrial process to make 100% bio-based PET since PTA is
derived from oil. A preliminary study to make bio-based PTA is done by Akanuma et al. (2014). Based
on this study, there are three different biobased PTA pathways (1) muconic acid beginning with wheat
stover, (2) isobutanol starting with corn, and (3) BTX beginning with poplar. The input products to
make 100% bio-based PET can be seen in Table VIII. 1.
Table VIII. 1. Input products of 100% bio-based PET
Input products Unit Sources
Wheat/Corn/Poplar kg/kg PET 4.41/3.25/5.05 Akanuma et al. (2014)
MEG kg/kg PET 0.35 Papong et al. (2014)
Electricity MJ/kg PET 1.37 Papong et al. (2014)
Heat MJ/kg PET 6.3 Papong et al. (2014)
The water and land footprint for wheat, corn, poplar can be seen in Table VIII. 2. The water and the
land footprint are using the global value from M. M. Mekonnen and Hoekstra (2011) and FAO (2016).
For water footprint of poplar, it is obtained from average values of four nations but it did not make a
distinction between green and blue component. So, it is assumed that it is a green component.
Table VIII. 2. The water and land footprint of wheat, corn, and poplar
a: Water footprint is based on Mekonnen and Hoekstra (2011). The land footprint is calculated by dividing the total area harvested of the crop
(ha) and the overall production of the crop (ton). These data were taken from FAO (2016) .
b: Water footprint is based on Gerbens-Leenes et al. (2009)
c: Source: Gerbens-Leenes et al. (2009). Average of 4 countries which are Netherlands, USA, Brazil, and Zimbabwe. There is no distinction
between blue and green water footprint. It is assumed that 100% water footprint is a blue component.
d: Source : Dillen et al. (2013)
After knowing water and land footprint of wheat, corn, and poplar, the water and land footprint of 100%
bio-based PET can be calculated. The energy and other products for producing bio-based PTA are
neglected. The water and land footprint of bio-based PTA are only derived from biomaterial in this case
wheat or corn or poplar.
The calculation of water and land footprint of PET is combined between bio-based PTA (wheat, corn,
and poplar) and bio-based MEG (molasses cane, sugar cane). The water and land footprint of MEG,
electricity, and heat are already calculated in Appendix IV for molasses cane based MEG and Appendix
V for sugar cane based MEG.
Input products
Water footprint (m
3/ton) Land footprint
(m2/ton) Blue Green Grey Total
Wheat a,b 342 1277 207 1826 2936
Corn a,b 82 947 194 1222 1773
Poplar c - 794.5 - 794.5 2325 d
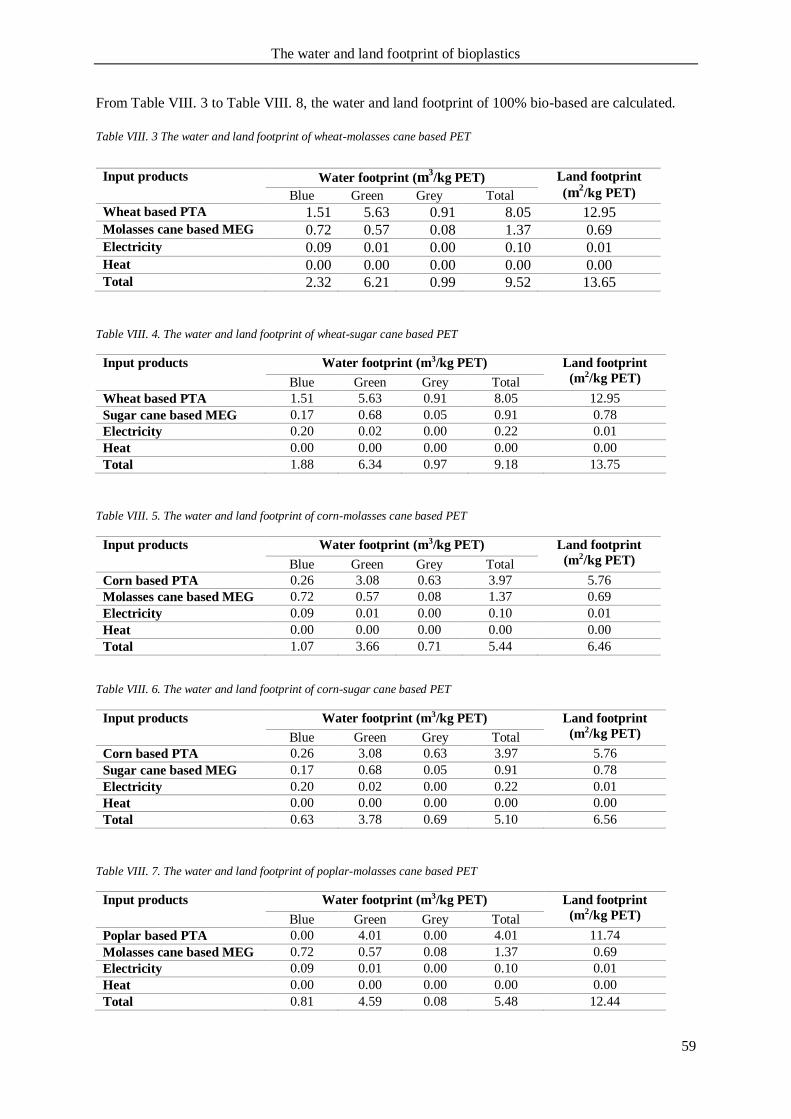
The water and land footprint of bioplastics
59
From Table VIII. 3 to Table VIII. 8, the water and land footprint of 100% bio-based are calculated.
Table VIII. 3 The water and land footprint of wheat-molasses cane based PET
Table VIII. 4. The water and land footprint of wheat-sugar cane based PET
Input products
Water footprint (m3/kg PET) Land footprint
(m2/kg PET) Blue Green Grey Total
Wheat based PTA 1.51 5.63 0.91 8.05 12.95
Sugar cane based MEG 0.17 0.68 0.05 0.91 0.78
Electricity 0.20 0.02 0.00 0.22 0.01
Heat 0.00 0.00 0.00 0.00 0.00
Total 1.88 6.34 0.97 9.18 13.75
Table VIII. 5. The water and land footprint of corn-molasses cane based PET
Input products
Water footprint (m3/kg PET) Land footprint
(m2/kg PET) Blue Green Grey Total
Corn based PTA 0.26 3.08 0.63 3.97 5.76
Molasses cane based MEG 0.72 0.57 0.08 1.37 0.69
Electricity 0.09 0.01 0.00 0.10 0.01
Heat 0.00 0.00 0.00 0.00 0.00
Total 1.07 3.66 0.71 5.44 6.46
Table VIII. 6. The water and land footprint of corn-sugar cane based PET
Input products
Water footprint (m3/kg PET) Land footprint
(m2/kg PET) Blue Green Grey Total
Corn based PTA 0.26 3.08 0.63 3.97 5.76
Sugar cane based MEG 0.17 0.68 0.05 0.91 0.78
Electricity 0.20 0.02 0.00 0.22 0.01
Heat 0.00 0.00 0.00 0.00 0.00
Total 0.63 3.78 0.69 5.10 6.56
Table VIII. 7. The water and land footprint of poplar-molasses cane based PET
Input products
Water footprint (m3/kg PET) Land footprint
(m2/kg PET) Blue Green Grey Total
Poplar based PTA 0.00 4.01 0.00 4.01 11.74
Molasses cane based MEG 0.72 0.57 0.08 1.37 0.69
Electricity 0.09 0.01 0.00 0.10 0.01
Heat 0.00 0.00 0.00 0.00 0.00
Total 0.81 4.59 0.08 5.48 12.44
Input products
Water footprint (m
3/kg PET) Land footprint
(m2/kg PET) Blue Green Grey Total
Wheat based PTA 1.51 5.63 0.91 8.05 12.95 Molasses cane based MEG 0.72 0.57 0.08 1.37 0.69 Electricity 0.09 0.01 0.00 0.10 0.01 Heat 0.00 0.00 0.00 0.00 0.00 Total 2.32 6.21 0.99 9.52 13.65
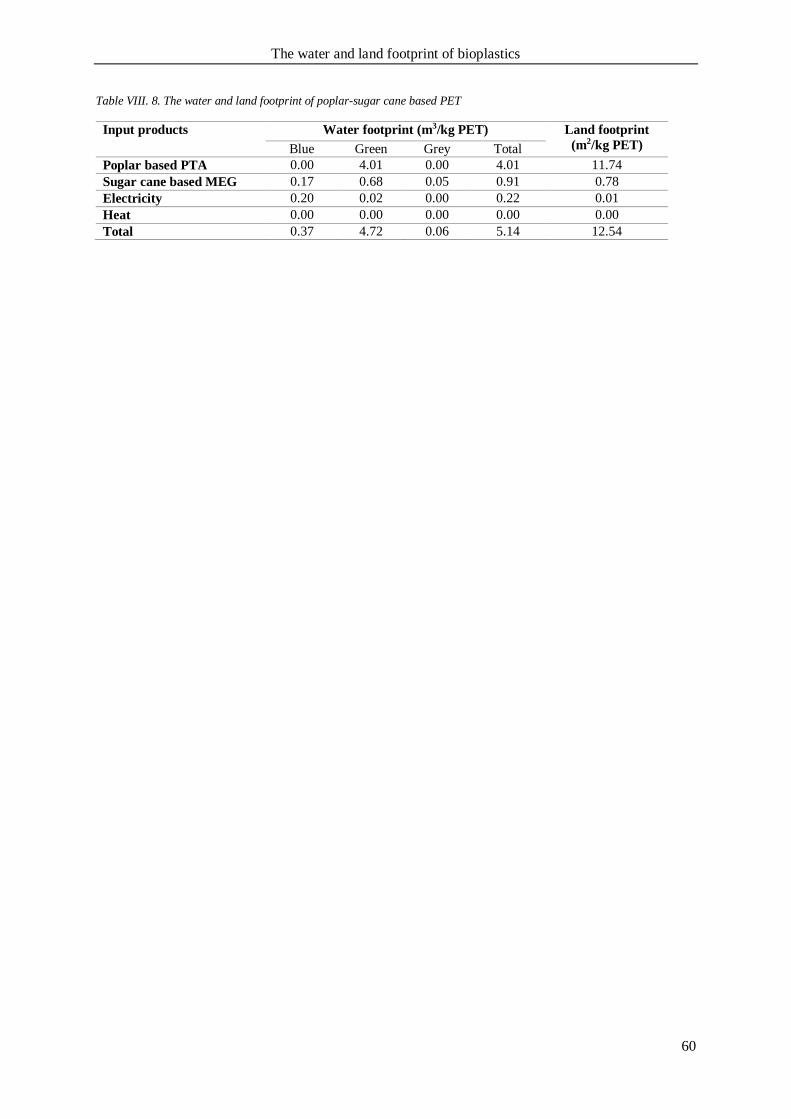
The water and land footprint of bioplastics
60
Table VIII. 8. The water and land footprint of poplar-sugar cane based PET
Input products
Water footprint (m3/kg PET) Land footprint
(m2/kg PET) Blue Green Grey Total
Poplar based PTA 0.00 4.01 0.00 4.01 11.74
Sugar cane based MEG 0.17 0.68 0.05 0.91 0.78
Electricity 0.20 0.02 0.00 0.22 0.01
Heat 0.00 0.00 0.00 0.00 0.00
Total 0.37 4.72 0.06 5.14 12.54
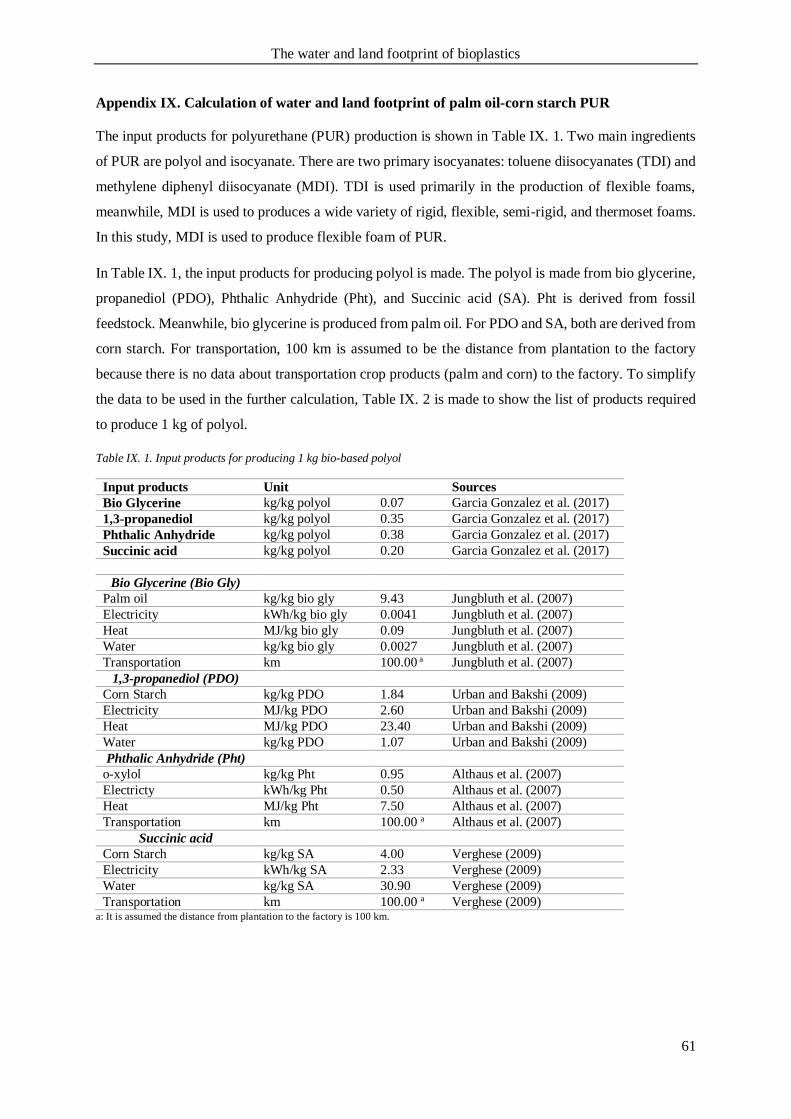
The water and land footprint of bioplastics
61
Appendix IX. Calculation of water and land footprint of palm oil-corn starch PUR
The input products for polyurethane (PUR) production is shown in Table IX. 1. Two main ingredients
of PUR are polyol and isocyanate. There are two primary isocyanates: toluene diisocyanates (TDI) and
methylene diphenyl diisocyanate (MDI). TDI is used primarily in the production of flexible foams,
meanwhile, MDI is used to produces a wide variety of rigid, flexible, semi-rigid, and thermoset foams.
In this study, MDI is used to produce flexible foam of PUR.
In Table IX. 1, the input products for producing polyol is made. The polyol is made from bio glycerine,
propanediol (PDO), Phthalic Anhydride (Pht), and Succinic acid (SA). Pht is derived from fossil
feedstock. Meanwhile, bio glycerine is produced from palm oil. For PDO and SA, both are derived from
corn starch. For transportation, 100 km is assumed to be the distance from plantation to the factory
because there is no data about transportation crop products (palm and corn) to the factory. To simplify
the data to be used in the further calculation, Table IX. 2 is made to show the list of products required
to produce 1 kg of polyol.
Table IX. 1. Input products for producing 1 kg bio-based polyol
Input products Unit Sources
Bio Glycerine kg/kg polyol 0.07 Garcia Gonzalez et al. (2017)
1,3-propanediol kg/kg polyol 0.35 Garcia Gonzalez et al. (2017)
Phthalic Anhydride kg/kg polyol 0.38 Garcia Gonzalez et al. (2017)
Succinic acid kg/kg polyol 0.20 Garcia Gonzalez et al. (2017)
Bio Glycerine (Bio Gly)
Palm oil kg/kg bio gly 9.43 Jungbluth et al. (2007)
Electricity kWh/kg bio gly 0.0041 Jungbluth et al. (2007)
Heat MJ/kg bio gly 0.09 Jungbluth et al. (2007)
Water kg/kg bio gly 0.0027 Jungbluth et al. (2007)
Transportation km 100.00 a Jungbluth et al. (2007)
1,3-propanediol (PDO)
Corn Starch kg/kg PDO 1.84 Urban and Bakshi (2009)
Electricity MJ/kg PDO 2.60 Urban and Bakshi (2009)
Heat MJ/kg PDO 23.40 Urban and Bakshi (2009)
Water kg/kg PDO 1.07 Urban and Bakshi (2009)
Phthalic Anhydride (Pht)
o-xylol kg/kg Pht 0.95 Althaus et al. (2007)
Electricty kWh/kg Pht 0.50 Althaus et al. (2007)
Heat MJ/kg Pht 7.50 Althaus et al. (2007)
Transportation km 100.00 a Althaus et al. (2007)
Succinic acid
Corn Starch kg/kg SA 4.00 Verghese (2009)
Electricity kWh/kg SA 2.33 Verghese (2009)
Water kg/kg SA 30.90 Verghese (2009)
Transportation km 100.00 a Verghese (2009) a: It is assumed the distance from plantation to the factory is 100 km.
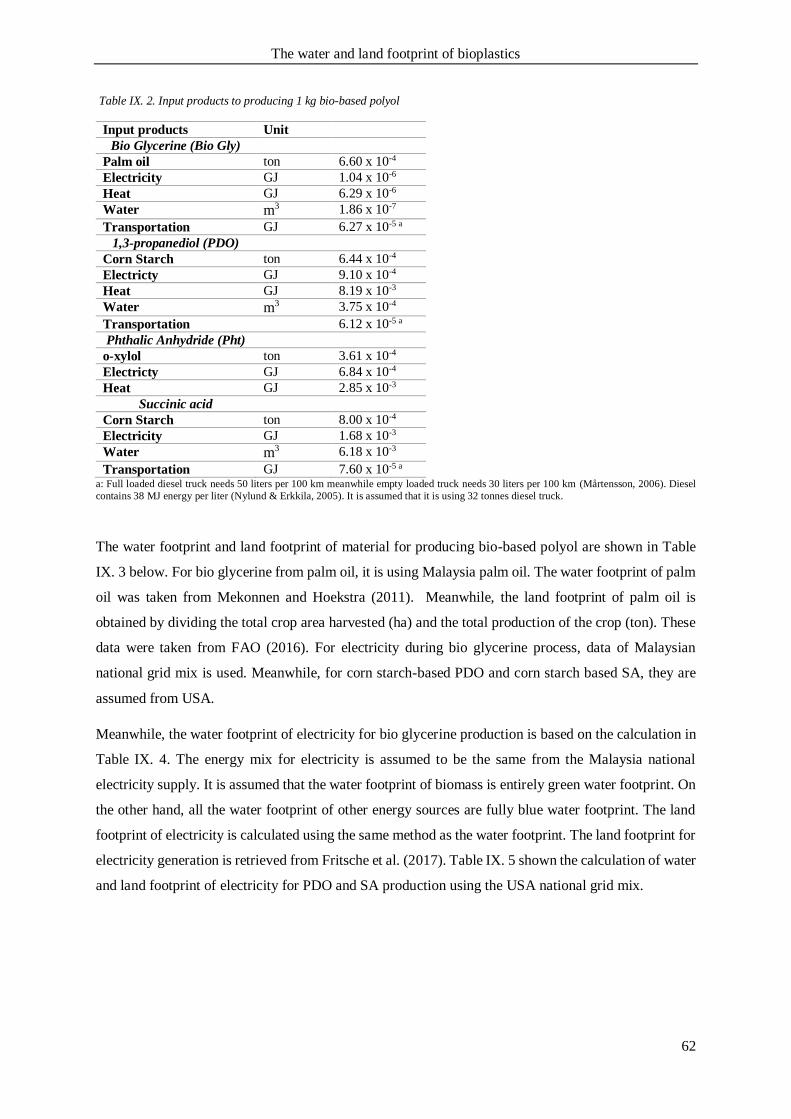
The water and land footprint of bioplastics
62
Table IX. 2. Input products to producing 1 kg bio-based polyol
Input products Unit
Bio Glycerine (Bio Gly)
Palm oil ton 6.60 x 10⁻⁴
Electricity GJ 1.04 x 10⁻⁶
Heat GJ 6.29 x 10⁻⁶
Water m3 1.86 x 10⁻⁷
Transportation GJ 6.27 x 10⁻⁵ a
1,3-propanediol (PDO)
Corn Starch ton 6.44 x 10⁻⁴
Electricty GJ 9.10 x 10⁻⁴
Heat GJ 8.19 x 10⁻³
Water m3 3.75 x 10⁻⁴
Transportation 6.12 x 10⁻⁵ a
Phthalic Anhydride (Pht)
o-xylol ton 3.61 x 10⁻⁴
Electricty GJ 6.84 x 10⁻⁴
Heat GJ 2.85 x 10⁻³
Succinic acid
Corn Starch ton 8.00 x 10⁻⁴
Electricity GJ 1.68 x 10⁻³
Water m3 6.18 x 10⁻³
Transportation GJ 7.60 x 10⁻⁵ a a: Full loaded diesel truck needs 50 liters per 100 km meanwhile empty loaded truck needs 30 liters per 100 km (Mårtensson, 2006). Diesel
contains 38 MJ energy per liter (Nylund & Erkkila, 2005). It is assumed that it is using 32 tonnes diesel truck.
The water footprint and land footprint of material for producing bio-based polyol are shown in Table
IX. 3 below. For bio glycerine from palm oil, it is using Malaysia palm oil. The water footprint of palm
oil was taken from Mekonnen and Hoekstra (2011). Meanwhile, the land footprint of palm oil is
obtained by dividing the total crop area harvested (ha) and the total production of the crop (ton). These
data were taken from FAO (2016). For electricity during bio glycerine process, data of Malaysian
national grid mix is used. Meanwhile, for corn starch-based PDO and corn starch based SA, they are
assumed from USA.
Meanwhile, the water footprint of electricity for bio glycerine production is based on the calculation in
Table IX. 4. The energy mix for electricity is assumed to be the same from the Malaysia national
electricity supply. It is assumed that the water footprint of biomass is entirely green water footprint. On
the other hand, all the water footprint of other energy sources are fully blue water footprint. The land
footprint of electricity is calculated using the same method as the water footprint. The land footprint for
electricity generation is retrieved from Fritsche et al. (2017). Table IX. 5 shown the calculation of water
and land footprint of electricity for PDO and SA production using the USA national grid mix.
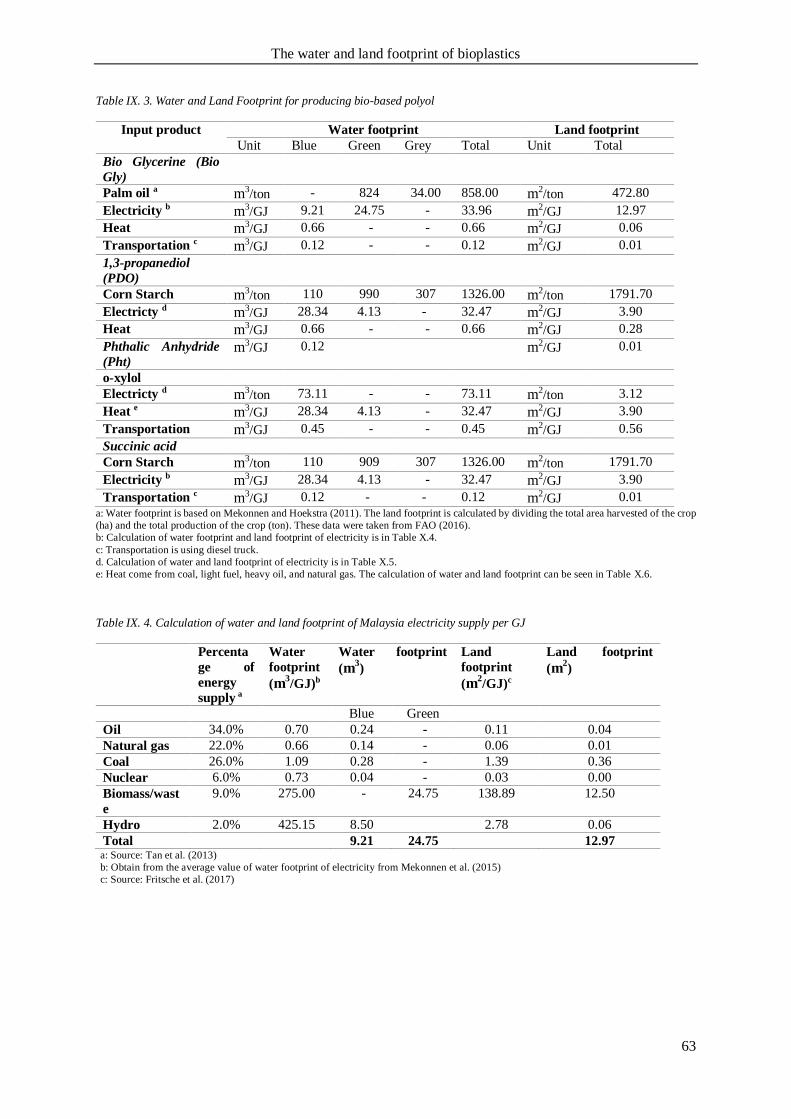
The water and land footprint of bioplastics
63
Table IX. 3. Water and Land Footprint for producing bio-based polyol
Input product Water footprint Land footprint
Unit Blue Green Grey Total Unit Total
Bio Glycerine (Bio
Gly)
Palm oil a m3/ton - 824 34.00 858.00 m2/ton 472.80
Electricity b m3/GJ 9.21 24.75 - 33.96 m2/GJ 12.97
Heat m3/GJ 0.66 - - 0.66 m2/GJ 0.06
Transportation c m3/GJ 0.12 - - 0.12 m2/GJ 0.01
1,3-propanediol
(PDO)
Corn Starch m3/ton 110 990 307 1326.00 m2/ton 1791.70
Electricty d m3/GJ 28.34 4.13 - 32.47 m2/GJ 3.90
Heat m3/GJ 0.66 - - 0.66 m2/GJ 0.28
Phthalic Anhydride
(Pht) m3/GJ 0.12 m2/GJ 0.01
o-xylol
Electricty d m3/ton 73.11 - - 73.11 m2/ton 3.12
Heat e m3/GJ 28.34 4.13 - 32.47 m2/GJ 3.90
Transportation m3/GJ 0.45 - - 0.45 m2/GJ 0.56
Succinic acid
Corn Starch m3/ton 110 909 307 1326.00 m2/ton 1791.70
Electricity b m3/GJ 28.34 4.13 - 32.47 m2/GJ 3.90
Transportation c m3/GJ 0.12 - - 0.12 m2/GJ 0.01
a: Water footprint is based on Mekonnen and Hoekstra (2011). The land footprint is calculated by dividing the total area harvested of the crop
(ha) and the total production of the crop (ton). These data were taken from FAO (2016).
b: Calculation of water footprint and land footprint of electricity is in Table X.4.
c: Transportation is using diesel truck.
d. Calculation of water and land footprint of electricity is in Table X.5.
e: Heat come from coal, light fuel, heavy oil, and natural gas. The calculation of water and land footprint can be seen in Table X.6.
Table IX. 4. Calculation of water and land footprint of Malaysia electricity supply per GJ
Percenta
ge of
energy
supply a
Water
footprint
(m3/GJ)b
Water footprint
(m3)
Land
footprint
(m2/GJ)c
Land footprint
(m2)
Blue Green
Oil 34.0% 0.70 0.24 - 0.11 0.04
Natural gas 22.0% 0.66 0.14 - 0.06 0.01
Coal 26.0% 1.09 0.28 - 1.39 0.36
Nuclear 6.0% 0.73 0.04 - 0.03 0.00
Biomass/wast
e
9.0% 275.00 - 24.75 138.89 12.50
Hydro 2.0% 425.15 8.50 2.78 0.06
Total 9.21 24.75 12.97 a: Source: Tan et al. (2013)
b: Obtain from the average value of water footprint of electricity from Mekonnen et al. (2015)
c: Source: Fritsche et al. (2017)
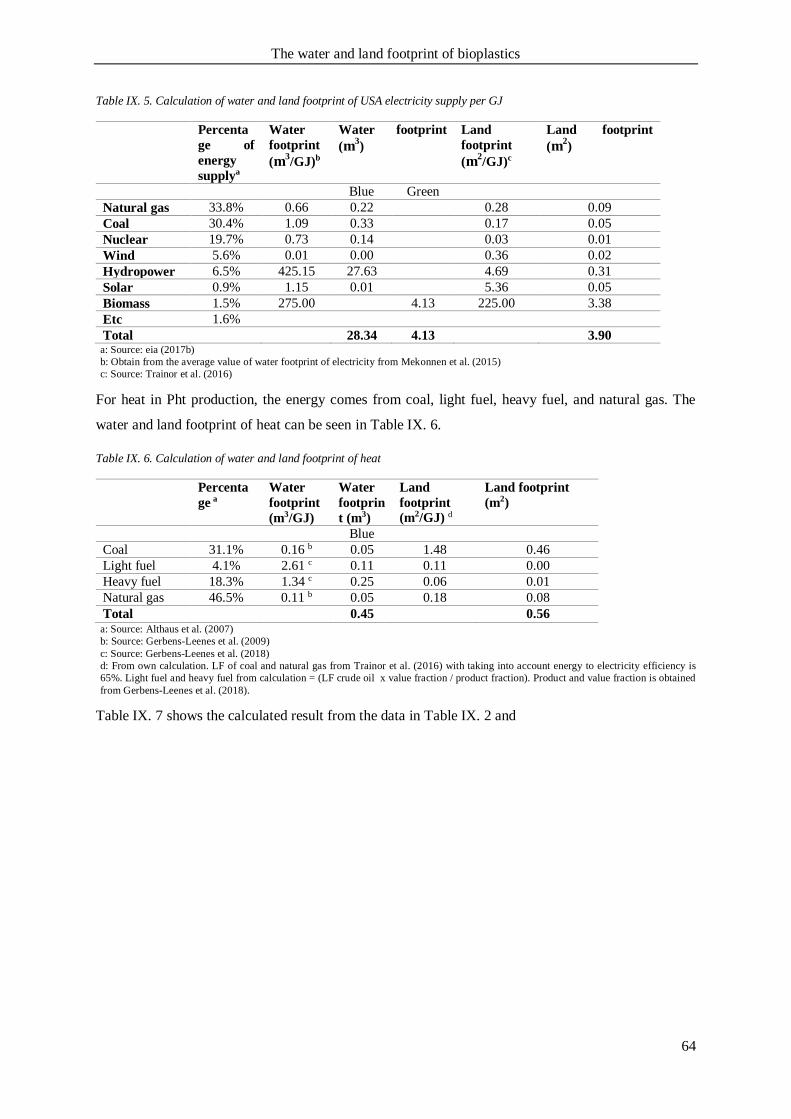
The water and land footprint of bioplastics
64
Table IX. 5. Calculation of water and land footprint of USA electricity supply per GJ
Percenta
ge of
energy
supplya
Water
footprint
(m3/GJ)b
Water footprint
(m3)
Land
footprint
(m2/GJ)c
Land footprint
(m2)
Blue Green
Natural gas 33.8% 0.66 0.22 0.28 0.09
Coal 30.4% 1.09 0.33 0.17 0.05
Nuclear 19.7% 0.73 0.14 0.03 0.01
Wind 5.6% 0.01 0.00 0.36 0.02
Hydropower 6.5% 425.15 27.63 4.69 0.31
Solar 0.9% 1.15 0.01 5.36 0.05
Biomass 1.5% 275.00 4.13 225.00 3.38
Etc 1.6%
Total 28.34 4.13 3.90 a: Source: eia (2017b)
b: Obtain from the average value of water footprint of electricity from Mekonnen et al. (2015)
c: Source: Trainor et al. (2016)
For heat in Pht production, the energy comes from coal, light fuel, heavy fuel, and natural gas. The
water and land footprint of heat can be seen in Table IX. 6.
Table IX. 6. Calculation of water and land footprint of heat
Percenta
ge a
Water
footprint
(m3/GJ)
Water
footprin
t (m3)
Land
footprint
(m2/GJ) d
Land footprint
(m2)
Blue
Coal 31.1% 0.16 b 0.05 1.48 0.46
Light fuel 4.1% 2.61 c 0.11 0.11 0.00
Heavy fuel 18.3% 1.34 c 0.25 0.06 0.01
Natural gas 46.5% 0.11 b 0.05 0.18 0.08
Total 0.45 0.56 a: Source: Althaus et al. (2007)
b: Source: Gerbens-Leenes et al. (2009)
c: Source: Gerbens-Leenes et al. (2018)
d: From own calculation. LF of coal and natural gas from Trainor et al. (2016) with taking into account energy to electricity efficiency is
65%. Light fuel and heavy fuel from calculation = (LF crude oil x value fraction / product fraction). Product and value fraction is obtained
from Gerbens-Leenes et al. (2018).
Table IX. 7 shows the calculated result from the data in Table IX. 2 and
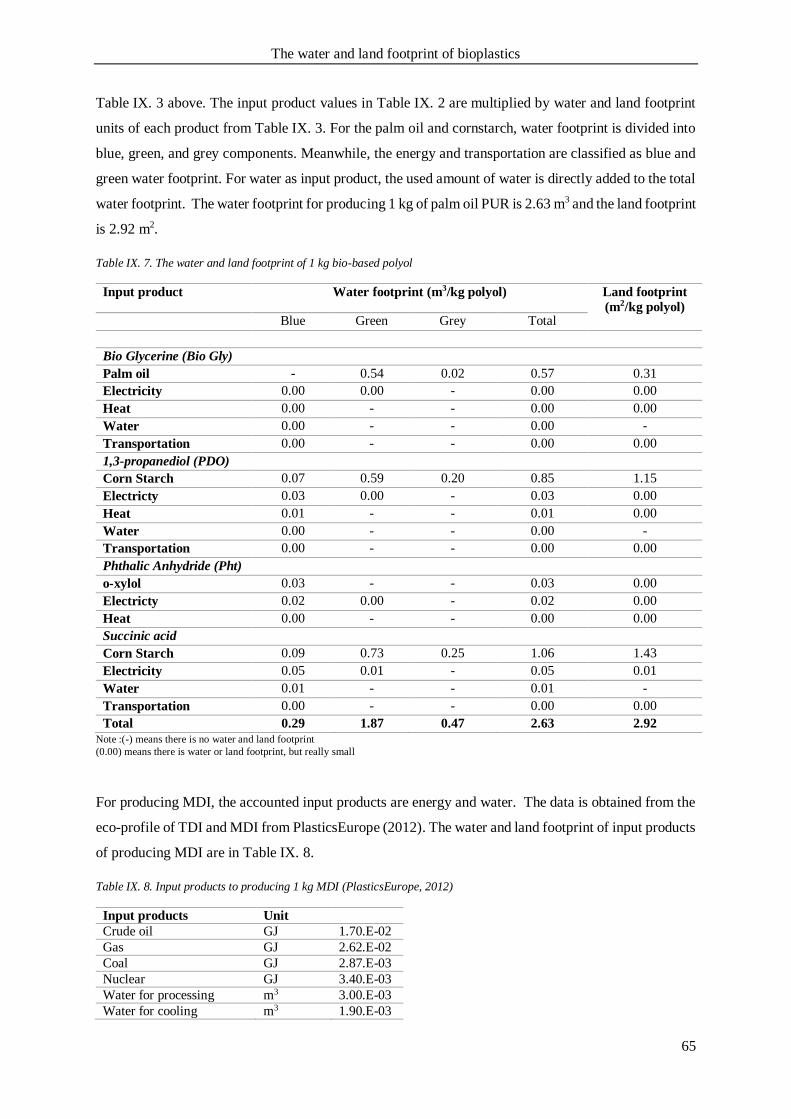
The water and land footprint of bioplastics
65
Table IX. 3 above. The input product values in Table IX. 2 are multiplied by water and land footprint
units of each product from Table IX. 3. For the palm oil and cornstarch, water footprint is divided into
blue, green, and grey components. Meanwhile, the energy and transportation are classified as blue and
green water footprint. For water as input product, the used amount of water is directly added to the total
water footprint. The water footprint for producing 1 kg of palm oil PUR is 2.63 m3 and the land footprint
is 2.92 m2.
Table IX. 7. The water and land footprint of 1 kg bio-based polyol
Input product Water footprint (m3/kg polyol) Land footprint
(m2/kg polyol) Blue Green Grey Total
Bio Glycerine (Bio Gly)
Palm oil - 0.54 0.02 0.57 0.31
Electricity 0.00 0.00 - 0.00 0.00
Heat 0.00 - - 0.00 0.00
Water 0.00 - - 0.00 -
Transportation 0.00 - - 0.00 0.00
1,3-propanediol (PDO)
Corn Starch 0.07 0.59 0.20 0.85 1.15
Electricty 0.03 0.00 - 0.03 0.00
Heat 0.01 - - 0.01 0.00
Water 0.00 - - 0.00 -
Transportation 0.00 - - 0.00 0.00
Phthalic Anhydride (Pht)
o-xylol 0.03 - - 0.03 0.00
Electricty 0.02 0.00 - 0.02 0.00
Heat 0.00 - - 0.00 0.00
Succinic acid
Corn Starch 0.09 0.73 0.25 1.06 1.43
Electricity 0.05 0.01 - 0.05 0.01
Water 0.01 - - 0.01 -
Transportation 0.00 - - 0.00 0.00
Total 0.29 1.87 0.47 2.63 2.92
Note :(-) means there is no water and land footprint
(0.00) means there is water or land footprint, but really small
For producing MDI, the accounted input products are energy and water. The data is obtained from the
eco-profile of TDI and MDI from PlasticsEurope (2012). The water and land footprint of input products
of producing MDI are in Table IX. 8.
Table IX. 8. Input products to producing 1 kg MDI (PlasticsEurope, 2012)
Input products Unit
Crude oil GJ 1.70.E-02
Gas GJ 2.62.E-02
Coal GJ 2.87.E-03
Nuclear GJ 3.40.E-03
Water for processing m3 3.00.E-03
Water for cooling m3 1.90.E-03
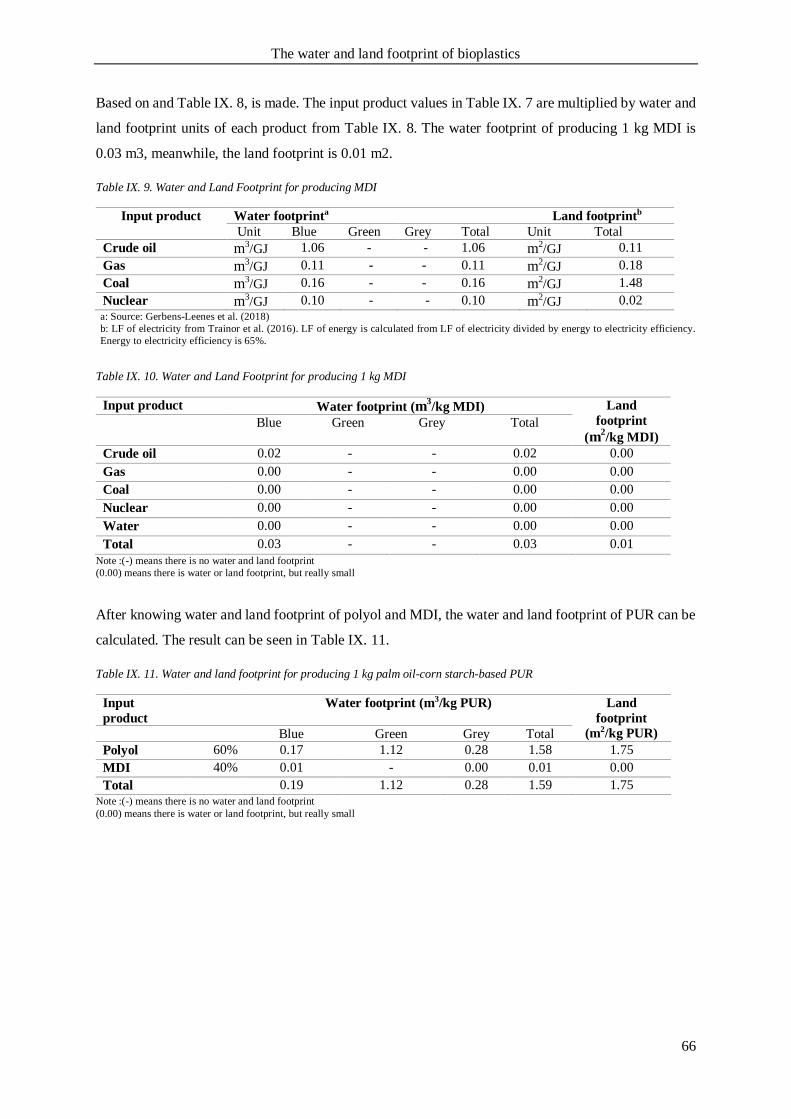
The water and land footprint of bioplastics
66
Based on and Table IX. 8, is made. The input product values in Table IX. 7 are multiplied by water and
land footprint units of each product from Table IX. 8. The water footprint of producing 1 kg MDI is
0.03 m3, meanwhile, the land footprint is 0.01 m2.
Table IX. 9. Water and Land Footprint for producing MDI
Input product Water footprinta Land footprintb
Unit Blue Green Grey Total Unit Total
Crude oil m3/GJ 1.06 - - 1.06 m2/GJ 0.11
Gas m3/GJ 0.11 - - 0.11 m2/GJ 0.18
Coal m3/GJ 0.16 - - 0.16 m2/GJ 1.48
Nuclear m3/GJ 0.10 - - 0.10 m2/GJ 0.02
a: Source: Gerbens-Leenes et al. (2018)
b: LF of electricity from Trainor et al. (2016). LF of energy is calculated from LF of electricity divided by energy to electricity efficiency.
Energy to electricity efficiency is 65%.
Table IX. 10. Water and Land Footprint for producing 1 kg MDI
Input product Water footprint (m3/kg MDI) Land
footprint
(m2/kg MDI)
Blue Green Grey Total
Crude oil 0.02 - - 0.02 0.00
Gas 0.00 - - 0.00 0.00
Coal 0.00 - - 0.00 0.00
Nuclear 0.00 - - 0.00 0.00
Water 0.00 - - 0.00 0.00
Total 0.03 - - 0.03 0.01
Note :(-) means there is no water and land footprint
(0.00) means there is water or land footprint, but really small
After knowing water and land footprint of polyol and MDI, the water and land footprint of PUR can be
calculated. The result can be seen in Table IX. 11.
Table IX. 11. Water and land footprint for producing 1 kg palm oil-corn starch-based PUR
Input
product
Water footprint (m3/kg PUR) Land
footprint
(m2/kg PUR) Blue Green Grey Total
Polyol 60% 0.17 1.12 0.28 1.58 1.75
MDI 40% 0.01 - 0.00 0.01 0.00
Total 0.19 1.12 0.28 1.59 1.75
Note :(-) means there is no water and land footprint
(0.00) means there is water or land footprint, but really small
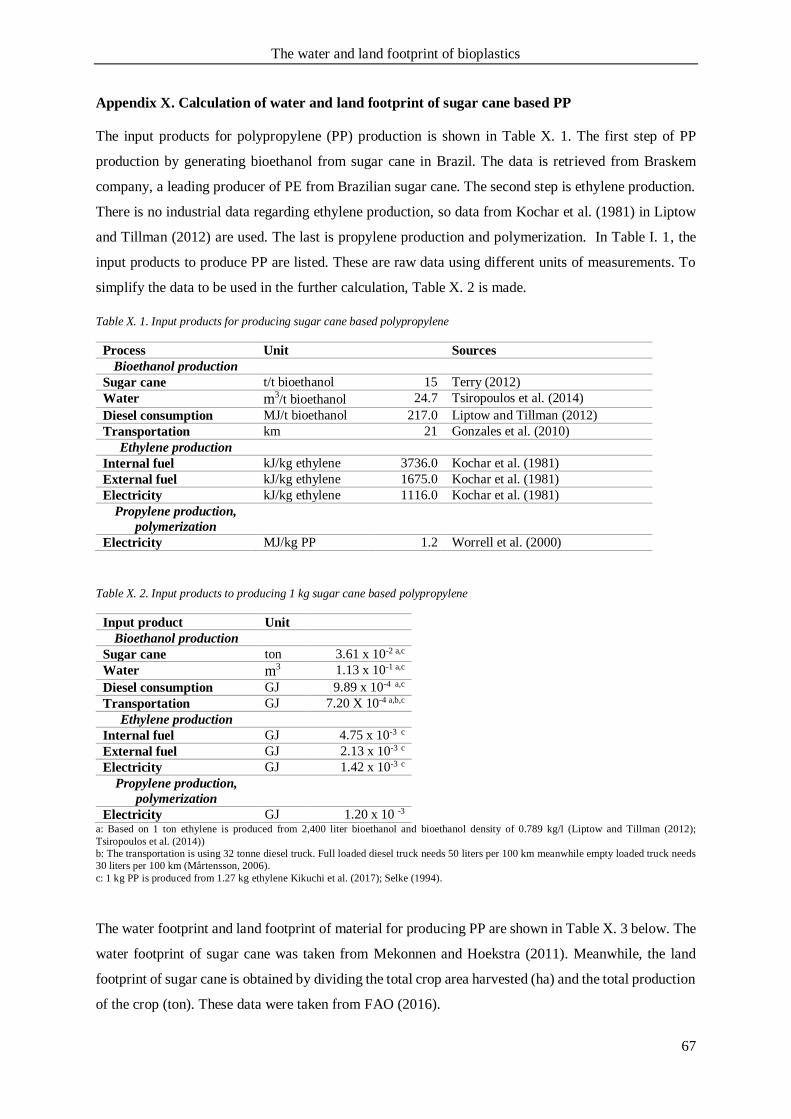
The water and land footprint of bioplastics
67
Appendix X. Calculation of water and land footprint of sugar cane based PP
The input products for polypropylene (PP) production is shown in Table X. 1. The first step of PP
production by generating bioethanol from sugar cane in Brazil. The data is retrieved from Braskem
company, a leading producer of PE from Brazilian sugar cane. The second step is ethylene production.
There is no industrial data regarding ethylene production, so data from Kochar et al. (1981) in Liptow
and Tillman (2012) are used. The last is propylene production and polymerization. In Table I. 1, the
input products to produce PP are listed. These are raw data using different units of measurements. To
simplify the data to be used in the further calculation, Table X. 2 is made.
Table X. 1. Input products for producing sugar cane based polypropylene
Process Unit Sources
Bioethanol production
Sugar cane t/t bioethanol 15 Terry (2012)
Water m3/t bioethanol 24.7 Tsiropoulos et al. (2014)
Diesel consumption MJ/t bioethanol 217.0 Liptow and Tillman (2012)
Transportation km 21 Gonzales et al. (2010)
Ethylene production
Internal fuel kJ/kg ethylene 3736.0 Kochar et al. (1981)
External fuel kJ/kg ethylene 1675.0 Kochar et al. (1981)
Electricity kJ/kg ethylene 1116.0 Kochar et al. (1981)
Propylene production,
polymerization
Electricity MJ/kg PP 1.2 Worrell et al. (2000)
Table X. 2. Input products to producing 1 kg sugar cane based polypropylene
Input product Unit
Bioethanol production
Sugar cane ton 3.61 x 10⁻² a,c
Water m3 1.13 x 10⁻¹ a,c
Diesel consumption GJ 9.89 x 10⁻⁴ a,c
Transportation GJ 7.20 X 10⁻⁴ a,b,c
Ethylene production
Internal fuel GJ 4.75 x 10⁻³ c
External fuel GJ 2.13 x 10⁻³ c
Electricity GJ 1.42 x 10⁻³ c
Propylene production,
polymerization
Electricity GJ 1.20 x 10 -3 a: Based on 1 ton ethylene is produced from 2,400 liter bioethanol and bioethanol density of 0.789 kg/l (Liptow and Tillman (2012);
Tsiropoulos et al. (2014))
b: The transportation is using 32 tonne diesel truck. Full loaded diesel truck needs 50 liters per 100 km meanwhile empty loaded truck needs
30 liters per 100 km (Mårtensson, 2006).
c: 1 kg PP is produced from 1.27 kg ethylene Kikuchi et al. (2017); Selke (1994).
The water footprint and land footprint of material for producing PP are shown in Table X. 3 below. The
water footprint of sugar cane was taken from Mekonnen and Hoekstra (2011). Meanwhile, the land
footprint of sugar cane is obtained by dividing the total crop area harvested (ha) and the total production
of the crop (ton). These data were taken from FAO (2016).
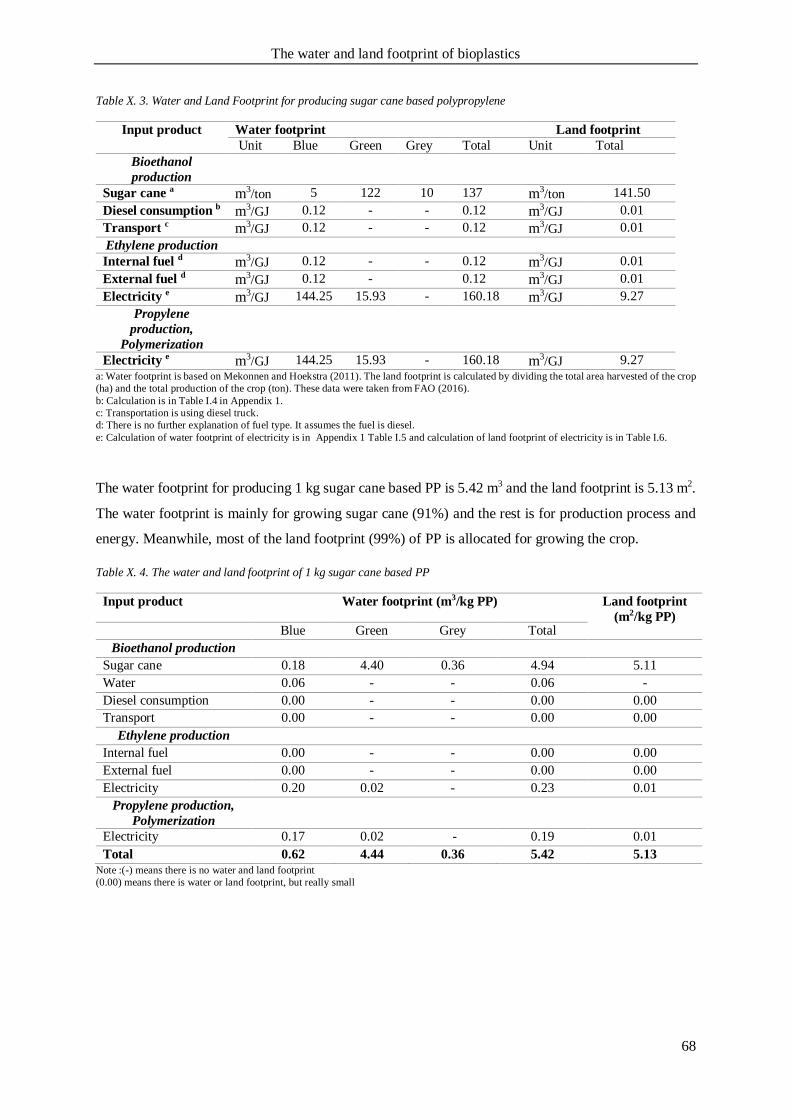
The water and land footprint of bioplastics
68
Table X. 3. Water and Land Footprint for producing sugar cane based polypropylene
Input product Water footprint Land footprint
Unit Blue Green Grey Total Unit Total
Bioethanol
production
Sugar cane a m3/ton 5 122 10 137 m3/ton 141.50
Diesel consumption b m3/GJ 0.12 - - 0.12 m3/GJ 0.01
Transport c m3/GJ 0.12 - - 0.12 m3/GJ 0.01
Ethylene production
Internal fuel d m3/GJ 0.12 - - 0.12 m3/GJ 0.01
External fuel d m3/GJ 0.12 - 0.12 m3/GJ 0.01
Electricity e m3/GJ 144.25 15.93 - 160.18 m3/GJ 9.27
Propylene
production,
Polymerization
Electricity e m3/GJ 144.25 15.93 - 160.18 m3/GJ 9.27
a: Water footprint is based on Mekonnen and Hoekstra (2011). The land footprint is calculated by dividing the total area harvested of the crop
(ha) and the total production of the crop (ton). These data were taken from FAO (2016).
b: Calculation is in Table I.4 in Appendix 1.
c: Transportation is using diesel truck.
d: There is no further explanation of fuel type. It assumes the fuel is diesel.
e: Calculation of water footprint of electricity is in Appendix 1 Table I.5 and calculation of land footprint of electricity is in Table I.6.
The water footprint for producing 1 kg sugar cane based PP is 5.42 m3 and the land footprint is 5.13 m2.
The water footprint is mainly for growing sugar cane (91%) and the rest is for production process and
energy. Meanwhile, most of the land footprint (99%) of PP is allocated for growing the crop.
Table X. 4. The water and land footprint of 1 kg sugar cane based PP
Input product Water footprint (m3/kg PP) Land footprint
(m2/kg PP) Blue Green Grey Total
Bioethanol production
Sugar cane 0.18 4.40 0.36 4.94 5.11
Water 0.06 - - 0.06 -
Diesel consumption 0.00 - - 0.00 0.00
Transport 0.00 - - 0.00 0.00
Ethylene production
Internal fuel 0.00 - - 0.00 0.00
External fuel 0.00 - - 0.00 0.00
Electricity 0.20 0.02 - 0.23 0.01
Propylene production,
Polymerization
Electricity 0.17 0.02 - 0.19 0.01
Total 0.62 4.44 0.36 5.42 5.13
Note :(-) means there is no water and land footprint
(0.00) means there is water or land footprint, but really small
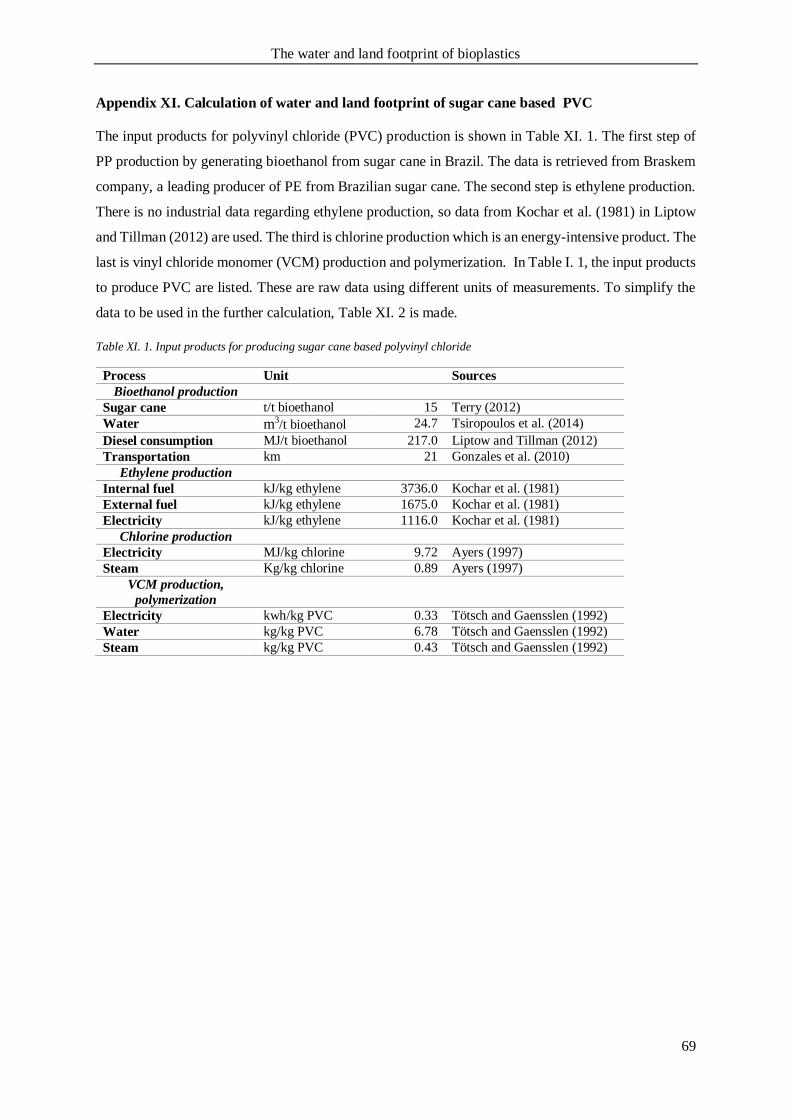
The water and land footprint of bioplastics
69
Appendix XI. Calculation of water and land footprint of sugar cane based PVC
The input products for polyvinyl chloride (PVC) production is shown in Table XI. 1. The first step of
PP production by generating bioethanol from sugar cane in Brazil. The data is retrieved from Braskem
company, a leading producer of PE from Brazilian sugar cane. The second step is ethylene production.
There is no industrial data regarding ethylene production, so data from Kochar et al. (1981) in Liptow
and Tillman (2012) are used. The third is chlorine production which is an energy-intensive product. The
last is vinyl chloride monomer (VCM) production and polymerization. In Table I. 1, the input products
to produce PVC are listed. These are raw data using different units of measurements. To simplify the
data to be used in the further calculation, Table XI. 2 is made.
Table XI. 1. Input products for producing sugar cane based polyvinyl chloride
Process Unit Sources
Bioethanol production
Sugar cane t/t bioethanol 15 Terry (2012)
Water m3/t bioethanol 24.7 Tsiropoulos et al. (2014)
Diesel consumption MJ/t bioethanol 217.0 Liptow and Tillman (2012)
Transportation km 21 Gonzales et al. (2010)
Ethylene production
Internal fuel kJ/kg ethylene 3736.0 Kochar et al. (1981)
External fuel kJ/kg ethylene 1675.0 Kochar et al. (1981)
Electricity kJ/kg ethylene 1116.0 Kochar et al. (1981)
Chlorine production
Electricity MJ/kg chlorine 9.72 Ayers (1997)
Steam Kg/kg chlorine 0.89 Ayers (1997)
VCM production,
polymerization
Electricity kwh/kg PVC 0.33 Tötsch and Gaensslen (1992)
Water kg/kg PVC 6.78 Tötsch and Gaensslen (1992)
Steam kg/kg PVC 0.43 Tötsch and Gaensslen (1992)
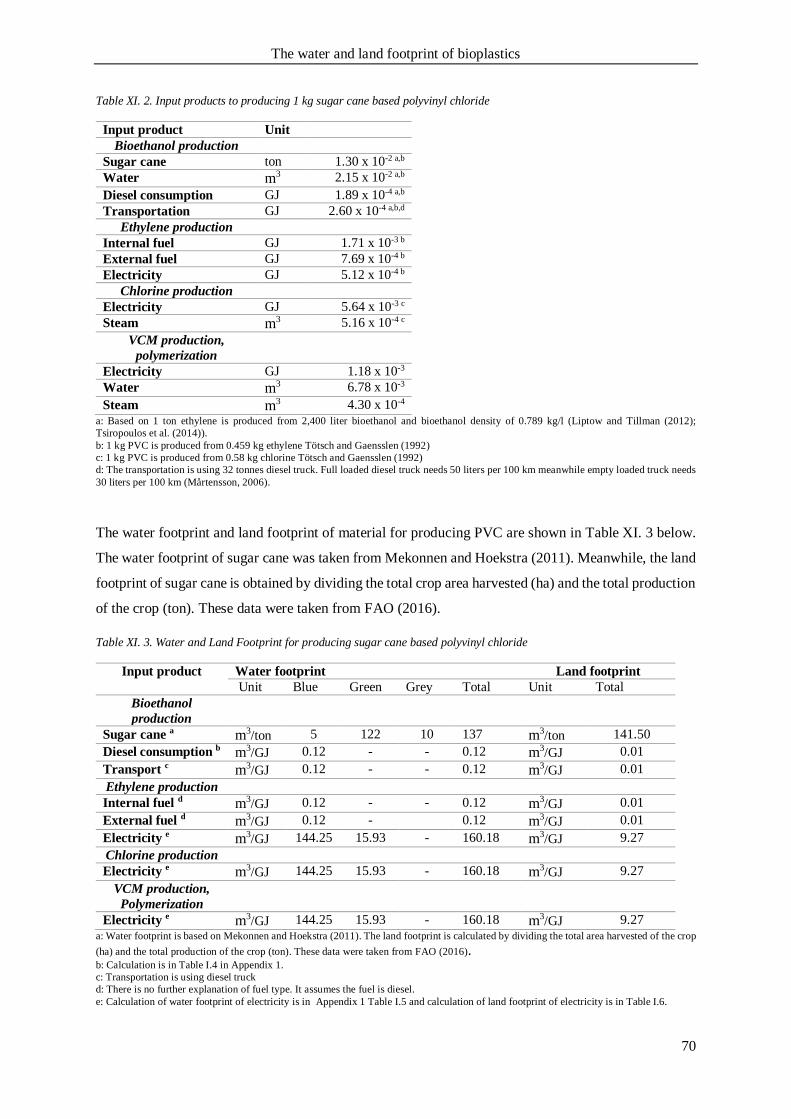
The water and land footprint of bioplastics
70
Table XI. 2. Input products to producing 1 kg sugar cane based polyvinyl chloride
Input product Unit
Bioethanol production
Sugar cane ton 1.30 x 10⁻² a,b
Water m3 2.15 x 10⁻² a,b
Diesel consumption GJ 1.89 x 10⁻⁴ a,b
Transportation GJ 2.60 x 10⁻⁴ a,b,d
Ethylene production
Internal fuel GJ 1.71 x 10⁻³ b
External fuel GJ 7.69 x 10⁻⁴ b
Electricity GJ 5.12 x 10⁻⁴ b
Chlorine production
Electricity GJ 5.64 x 10⁻³ c
Steam m3 5.16 x 10⁻⁴ c
VCM production,
polymerization
Electricity GJ 1.18 x 10⁻³
Water m3 6.78 x 10⁻³
Steam m3 4.30 x 10⁻⁴
a: Based on 1 ton ethylene is produced from 2,400 liter bioethanol and bioethanol density of 0.789 kg/l (Liptow and Tillman (2012);
Tsiropoulos et al. (2014)).
b: 1 kg PVC is produced from 0.459 kg ethylene Tötsch and Gaensslen (1992)
c: 1 kg PVC is produced from 0.58 kg chlorine Tötsch and Gaensslen (1992)
d: The transportation is using 32 tonnes diesel truck. Full loaded diesel truck needs 50 liters per 100 km meanwhile empty loaded truck needs
30 liters per 100 km (Mårtensson, 2006).
The water footprint and land footprint of material for producing PVC are shown in Table XI. 3 below.
The water footprint of sugar cane was taken from Mekonnen and Hoekstra (2011). Meanwhile, the land
footprint of sugar cane is obtained by dividing the total crop area harvested (ha) and the total production
of the crop (ton). These data were taken from FAO (2016).
Table XI. 3. Water and Land Footprint for producing sugar cane based polyvinyl chloride
Input product Water footprint Land footprint
Unit Blue Green Grey Total Unit Total
Bioethanol
production
Sugar cane a m3/ton 5 122 10 137 m3/ton 141.50
Diesel consumption b m3/GJ 0.12 - - 0.12 m3/GJ 0.01
Transport c m3/GJ 0.12 - - 0.12 m3/GJ 0.01
Ethylene production
Internal fuel d m3/GJ 0.12 - - 0.12 m3/GJ 0.01
External fuel d m3/GJ 0.12 - 0.12 m3/GJ 0.01
Electricity e m3/GJ 144.25 15.93 - 160.18 m3/GJ 9.27
Chlorine production
Electricity e m3/GJ 144.25 15.93 - 160.18 m3/GJ 9.27
VCM production,
Polymerization
Electricity e m3/GJ 144.25 15.93 - 160.18 m3/GJ 9.27
a: Water footprint is based on Mekonnen and Hoekstra (2011). The land footprint is calculated by dividing the total area harvested of the crop
(ha) and the total production of the crop (ton). These data were taken from FAO (2016). b: Calculation is in Table I.4 in Appendix 1.
c: Transportation is using diesel truck
d: There is no further explanation of fuel type. It assumes the fuel is diesel.
e: Calculation of water footprint of electricity is in Appendix 1 Table I.5 and calculation of land footprint of electricity is in Table I.6.
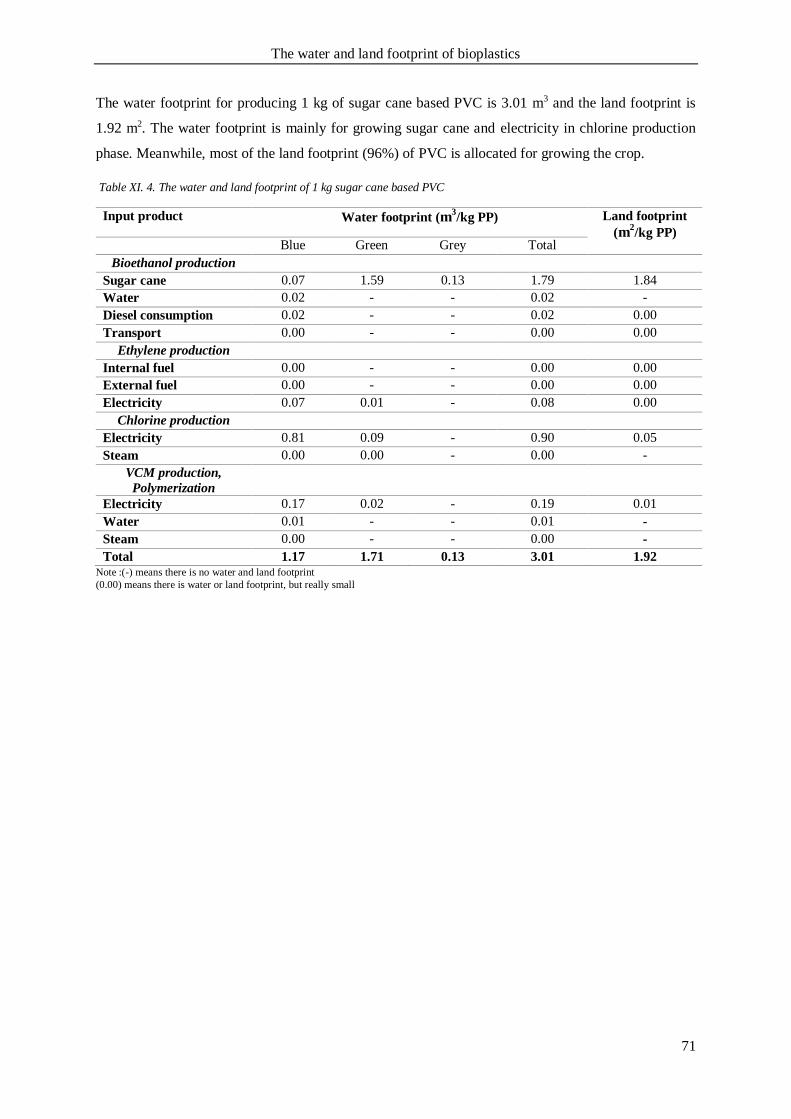
The water and land footprint of bioplastics
71
The water footprint for producing 1 kg of sugar cane based PVC is 3.01 m3 and the land footprint is
1.92 m2. The water footprint is mainly for growing sugar cane and electricity in chlorine production
phase. Meanwhile, most of the land footprint (96%) of PVC is allocated for growing the crop.
Table XI. 4. The water and land footprint of 1 kg sugar cane based PVC
Input product Water footprint (m3/kg PP) Land footprint
(m2/kg PP)
Blue Green Grey Total
Bioethanol production
Sugar cane 0.07 1.59 0.13 1.79 1.84
Water 0.02 - - 0.02 -
Diesel consumption 0.02 - - 0.02 0.00
Transport 0.00 - - 0.00 0.00
Ethylene production
Internal fuel 0.00 - - 0.00 0.00
External fuel 0.00 - - 0.00 0.00
Electricity 0.07 0.01 - 0.08 0.00
Chlorine production
Electricity 0.81 0.09 - 0.90 0.05
Steam 0.00 0.00 - 0.00 -
VCM production,
Polymerization
Electricity 0.17 0.02 - 0.19 0.01
Water 0.01 - - 0.01 -
Steam 0.00 - - 0.00 -
Total 1.17 1.71 0.13 3.01 1.92 Note :(-) means there is no water and land footprint
(0.00) means there is water or land footprint, but really small
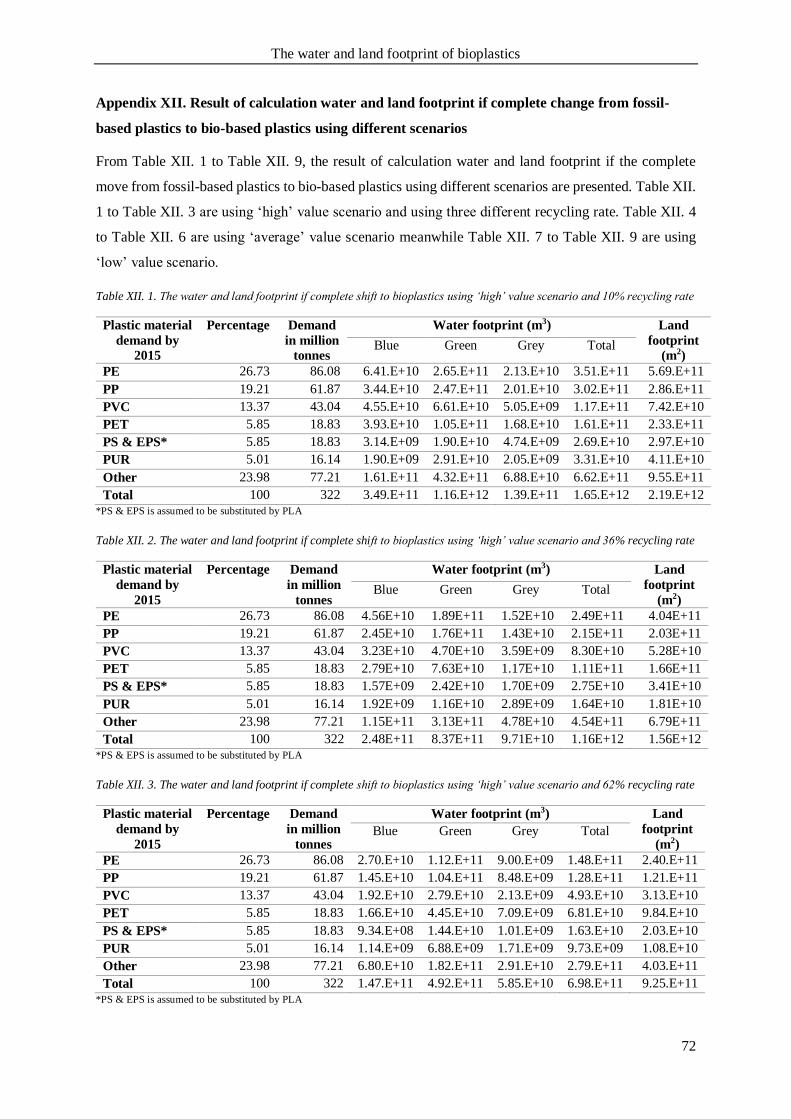
The water and land footprint of bioplastics
72
Appendix XII. Result of calculation water and land footprint if complete change from fossil-
based plastics to bio-based plastics using different scenarios
From Table XII. 1 to Table XII. 9, the result of calculation water and land footprint if the complete
move from fossil-based plastics to bio-based plastics using different scenarios are presented. Table XII.
1 to Table XII. 3 are using ‘high’ value scenario and using three different recycling rate. Table XII. 4
to Table XII. 6 are using ‘average’ value scenario meanwhile Table XII. 7 to Table XII. 9 are using
‘low’ value scenario.
Table XII. 1. The water and land footprint if complete shift to bioplastics using ‘high’ value scenario and 10% recycling rate
Plastic material
demand by
2015
Percentage Demand
in million
tonnes
Water footprint (m3) Land
footprint
(m2) Blue Green Grey Total
PE 26.73 86.08 6.41.E+10 2.65.E+11 2.13.E+10 3.51.E+11 5.69.E+11
PP 19.21 61.87 3.44.E+10 2.47.E+11 2.01.E+10 3.02.E+11 2.86.E+11
PVC 13.37 43.04 4.55.E+10 6.61.E+10 5.05.E+09 1.17.E+11 7.42.E+10
PET 5.85 18.83 3.93.E+10 1.05.E+11 1.68.E+10 1.61.E+11 2.33.E+11
PS & EPS* 5.85 18.83 3.14.E+09 1.90.E+10 4.74.E+09 2.69.E+10 2.97.E+10
PUR 5.01 16.14 1.90.E+09 2.91.E+10 2.05.E+09 3.31.E+10 4.11.E+10
Other 23.98 77.21 1.61.E+11 4.32.E+11 6.88.E+10 6.62.E+11 9.55.E+11
Total 100 322 3.49.E+11 1.16.E+12 1.39.E+11 1.65.E+12 2.19.E+12
*PS & EPS is assumed to be substituted by PLA
Table XII. 2. The water and land footprint if complete shift to bioplastics using ‘high’ value scenario and 36% recycling rate
Plastic material
demand by
2015
Percentage Demand
in million
tonnes
Water footprint (m3) Land
footprint
(m2) Blue Green Grey Total
PE 26.73 86.08 4.56E+10 1.89E+11 1.52E+10 2.49E+11 4.04E+11
PP 19.21 61.87 2.45E+10 1.76E+11 1.43E+10 2.15E+11 2.03E+11
PVC 13.37 43.04 3.23E+10 4.70E+10 3.59E+09 8.30E+10 5.28E+10
PET 5.85 18.83 2.79E+10 7.63E+10 1.17E+10 1.11E+11 1.66E+11
PS & EPS* 5.85 18.83 1.57E+09 2.42E+10 1.70E+09 2.75E+10 3.41E+10
PUR 5.01 16.14 1.92E+09 1.16E+10 2.89E+09 1.64E+10 1.81E+10
Other 23.98 77.21 1.15E+11 3.13E+11 4.78E+10 4.54E+11 6.79E+11
Total 100 322 2.48E+11 8.37E+11 9.71E+10 1.16E+12 1.56E+12
*PS & EPS is assumed to be substituted by PLA
Table XII. 3. The water and land footprint if complete shift to bioplastics using ‘high’ value scenario and 62% recycling rate
Plastic material
demand by
2015
Percentage Demand
in million
tonnes
Water footprint (m3) Land
footprint
(m2) Blue Green Grey Total
PE 26.73 86.08 2.70.E+10 1.12.E+11 9.00.E+09 1.48.E+11 2.40.E+11
PP 19.21 61.87 1.45.E+10 1.04.E+11 8.48.E+09 1.28.E+11 1.21.E+11
PVC 13.37 43.04 1.92.E+10 2.79.E+10 2.13.E+09 4.93.E+10 3.13.E+10
PET 5.85 18.83 1.66.E+10 4.45.E+10 7.09.E+09 6.81.E+10 9.84.E+10
PS & EPS* 5.85 18.83 9.34.E+08 1.44.E+10 1.01.E+09 1.63.E+10 2.03.E+10
PUR 5.01 16.14 1.14.E+09 6.88.E+09 1.71.E+09 9.73.E+09 1.08.E+10
Other 23.98 77.21 6.80.E+10 1.82.E+11 2.91.E+10 2.79.E+11 4.03.E+11
Total 100 322 1.47.E+11 4.92.E+11 5.85.E+10 6.98.E+11 9.25.E+11
*PS & EPS is assumed to be substituted by PLA
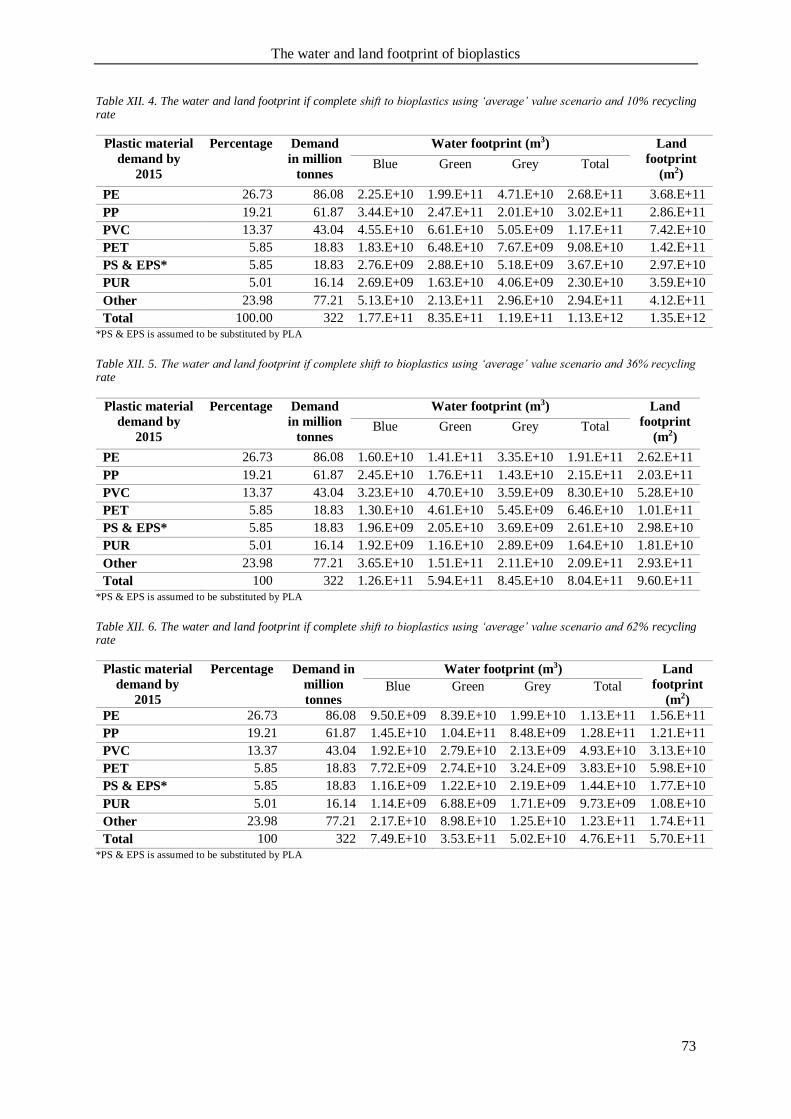
The water and land footprint of bioplastics
73
Table XII. 4. The water and land footprint if complete shift to bioplastics using ‘average’ value scenario and 10% recycling rate
Plastic material
demand by
2015
Percentage Demand
in million
tonnes
Water footprint (m3) Land
footprint
(m2) Blue Green Grey Total
PE 26.73 86.08 2.25.E+10 1.99.E+11 4.71.E+10 2.68.E+11 3.68.E+11
PP 19.21 61.87 3.44.E+10 2.47.E+11 2.01.E+10 3.02.E+11 2.86.E+11
PVC 13.37 43.04 4.55.E+10 6.61.E+10 5.05.E+09 1.17.E+11 7.42.E+10
PET 5.85 18.83 1.83.E+10 6.48.E+10 7.67.E+09 9.08.E+10 1.42.E+11
PS & EPS* 5.85 18.83 2.76.E+09 2.88.E+10 5.18.E+09 3.67.E+10 2.97.E+10
PUR 5.01 16.14 2.69.E+09 1.63.E+10 4.06.E+09 2.30.E+10 3.59.E+10
Other 23.98 77.21 5.13.E+10 2.13.E+11 2.96.E+10 2.94.E+11 4.12.E+11
Total 100.00 322 1.77.E+11 8.35.E+11 1.19.E+11 1.13.E+12 1.35.E+12
*PS & EPS is assumed to be substituted by PLA
Table XII. 5. The water and land footprint if complete shift to bioplastics using ‘average’ value scenario and 36% recycling rate
Plastic material
demand by
2015
Percentage Demand
in million
tonnes
Water footprint (m3) Land
footprint
(m2) Blue Green Grey Total
PE 26.73 86.08 1.60.E+10 1.41.E+11 3.35.E+10 1.91.E+11 2.62.E+11
PP 19.21 61.87 2.45.E+10 1.76.E+11 1.43.E+10 2.15.E+11 2.03.E+11
PVC 13.37 43.04 3.23.E+10 4.70.E+10 3.59.E+09 8.30.E+10 5.28.E+10
PET 5.85 18.83 1.30.E+10 4.61.E+10 5.45.E+09 6.46.E+10 1.01.E+11
PS & EPS* 5.85 18.83 1.96.E+09 2.05.E+10 3.69.E+09 2.61.E+10 2.98.E+10
PUR 5.01 16.14 1.92.E+09 1.16.E+10 2.89.E+09 1.64.E+10 1.81.E+10
Other 23.98 77.21 3.65.E+10 1.51.E+11 2.11.E+10 2.09.E+11 2.93.E+11
Total 100 322 1.26.E+11 5.94.E+11 8.45.E+10 8.04.E+11 9.60.E+11
*PS & EPS is assumed to be substituted by PLA
Table XII. 6. The water and land footprint if complete shift to bioplastics using ‘average’ value scenario and 62% recycling rate
Plastic material
demand by
2015
Percentage Demand in
million
tonnes
Water footprint (m3) Land
footprint
(m2) Blue Green Grey Total
PE 26.73 86.08 9.50.E+09 8.39.E+10 1.99.E+10 1.13.E+11 1.56.E+11
PP 19.21 61.87 1.45.E+10 1.04.E+11 8.48.E+09 1.28.E+11 1.21.E+11
PVC 13.37 43.04 1.92.E+10 2.79.E+10 2.13.E+09 4.93.E+10 3.13.E+10
PET 5.85 18.83 7.72.E+09 2.74.E+10 3.24.E+09 3.83.E+10 5.98.E+10
PS & EPS* 5.85 18.83 1.16.E+09 1.22.E+10 2.19.E+09 1.44.E+10 1.77.E+10
PUR 5.01 16.14 1.14.E+09 6.88.E+09 1.71.E+09 9.73.E+09 1.08.E+10
Other 23.98 77.21 2.17.E+10 8.98.E+10 1.25.E+10 1.23.E+11 1.74.E+11
Total 100 322 7.49.E+10 3.53.E+11 5.02.E+10 4.76.E+11 5.70.E+11
*PS & EPS is assumed to be substituted by PLA
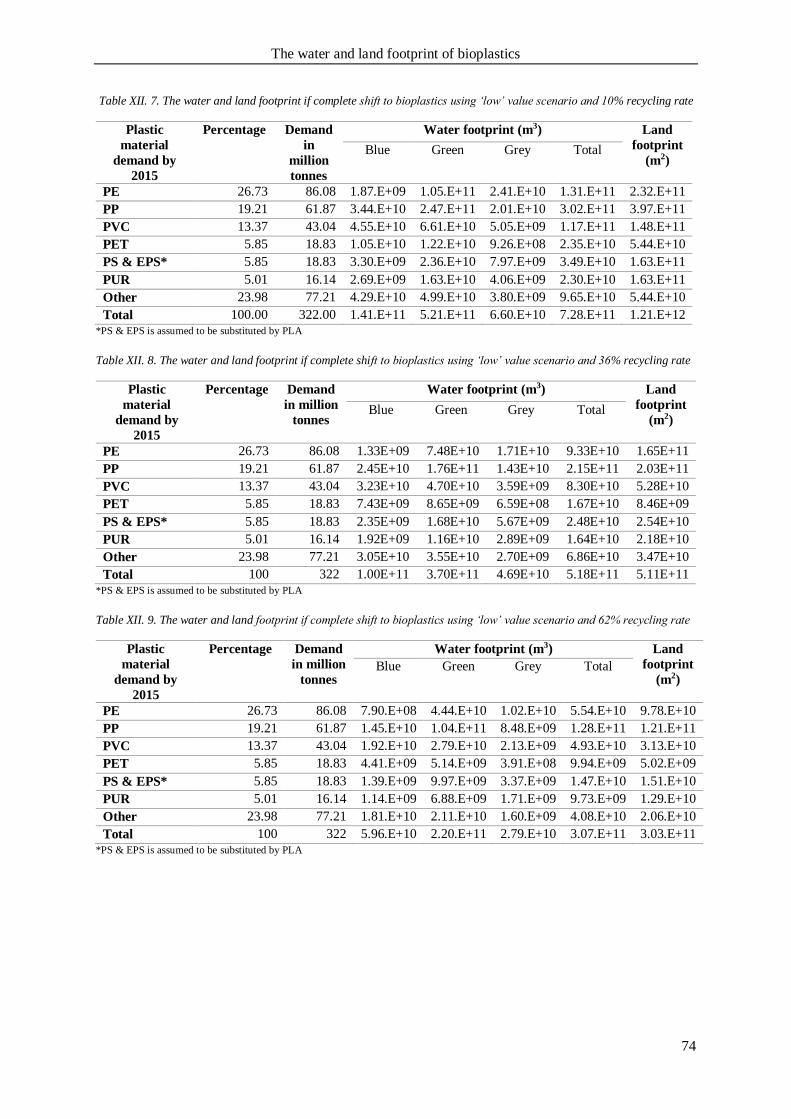
The water and land footprint of bioplastics
74
Table XII. 7. The water and land footprint if complete shift to bioplastics using ‘low’ value scenario and 10% recycling rate
Plastic
material
demand by
2015
Percentage Demand
in
million
tonnes
Water footprint (m3) Land
footprint
(m2) Blue Green Grey Total
PE 26.73 86.08 1.87.E+09 1.05.E+11 2.41.E+10 1.31.E+11 2.32.E+11
PP 19.21 61.87 3.44.E+10 2.47.E+11 2.01.E+10 3.02.E+11 3.97.E+11
PVC 13.37 43.04 4.55.E+10 6.61.E+10 5.05.E+09 1.17.E+11 1.48.E+11
PET 5.85 18.83 1.05.E+10 1.22.E+10 9.26.E+08 2.35.E+10 5.44.E+10
PS & EPS* 5.85 18.83 3.30.E+09 2.36.E+10 7.97.E+09 3.49.E+10 1.63.E+11
PUR 5.01 16.14 2.69.E+09 1.63.E+10 4.06.E+09 2.30.E+10 1.63.E+11
Other 23.98 77.21 4.29.E+10 4.99.E+10 3.80.E+09 9.65.E+10 5.44.E+10
Total 100.00 322.00 1.41.E+11 5.21.E+11 6.60.E+10 7.28.E+11 1.21.E+12
*PS & EPS is assumed to be substituted by PLA
Table XII. 8. The water and land footprint if complete shift to bioplastics using ‘low’ value scenario and 36% recycling rate
Plastic
material
demand by
2015
Percentage Demand
in million
tonnes
Water footprint (m3) Land
footprint
(m2) Blue Green Grey Total
PE 26.73 86.08 1.33E+09 7.48E+10 1.71E+10 9.33E+10 1.65E+11
PP 19.21 61.87 2.45E+10 1.76E+11 1.43E+10 2.15E+11 2.03E+11
PVC 13.37 43.04 3.23E+10 4.70E+10 3.59E+09 8.30E+10 5.28E+10
PET 5.85 18.83 7.43E+09 8.65E+09 6.59E+08 1.67E+10 8.46E+09
PS & EPS* 5.85 18.83 2.35E+09 1.68E+10 5.67E+09 2.48E+10 2.54E+10
PUR 5.01 16.14 1.92E+09 1.16E+10 2.89E+09 1.64E+10 2.18E+10
Other 23.98 77.21 3.05E+10 3.55E+10 2.70E+09 6.86E+10 3.47E+10
Total 100 322 1.00E+11 3.70E+11 4.69E+10 5.18E+11 5.11E+11
*PS & EPS is assumed to be substituted by PLA
Table XII. 9. The water and land footprint if complete shift to bioplastics using ‘low’ value scenario and 62% recycling rate
Plastic
material
demand by
2015
Percentage Demand
in million
tonnes
Water footprint (m3) Land
footprint
(m2) Blue Green Grey Total
PE 26.73 86.08 7.90.E+08 4.44.E+10 1.02.E+10 5.54.E+10 9.78.E+10
PP 19.21 61.87 1.45.E+10 1.04.E+11 8.48.E+09 1.28.E+11 1.21.E+11
PVC 13.37 43.04 1.92.E+10 2.79.E+10 2.13.E+09 4.93.E+10 3.13.E+10
PET 5.85 18.83 4.41.E+09 5.14.E+09 3.91.E+08 9.94.E+09 5.02.E+09
PS & EPS* 5.85 18.83 1.39.E+09 9.97.E+09 3.37.E+09 1.47.E+10 1.51.E+10
PUR 5.01 16.14 1.14.E+09 6.88.E+09 1.71.E+09 9.73.E+09 1.29.E+10
Other 23.98 77.21 1.81.E+10 2.11.E+10 1.60.E+09 4.08.E+10 2.06.E+10
Total 100 322 5.96.E+10 2.20.E+11 2.79.E+10 3.07.E+11 3.03.E+11
*PS & EPS is assumed to be substituted by PLA