Embed Size (px)
Citation preview

The Wage Gap: A Brief Review of the Economic Causes
(plus some STEM)
Presented at the Equal Pay Taskforce MeetingButte, MontanaApril 10, 2015
Presented by Barbara Wagner, Chief Economist
MT Dept. of Labor and Industry

The Raw Wage Gap
Nationally,Women earn 70.6% of
men.
In Montana,Women earn 67.5% of
men.
Raw Gap=
Source: 2013 American Community Survey, 3-Year Estimates 2

The Full-Time, Year-Round Wage Gap
Women are more likely to work part-time than men.
• Including only people that work full-time, year-round,– Women earn 78% of men nationally,– Women earn 75% of men in Montana.
3
𝑚𝑒𝑑𝑖𝑎𝑛𝑒𝑎𝑟𝑛𝑖𝑛𝑔𝑠𝑜𝑓 𝑤𝑜𝑚𝑒𝑛 h𝑤 𝑜𝑤𝑜𝑟𝑘𝑦𝑒𝑎𝑟 −𝑟𝑜𝑢𝑛𝑑𝑎𝑛𝑑 𝑓𝑢𝑙𝑙−𝑡𝑖𝑚𝑒
𝑚𝑒𝑑𝑖𝑎𝑛𝑒𝑎𝑟𝑛𝑖𝑛𝑔𝑠𝑜𝑓 𝑚𝑒𝑛 h𝑤 𝑜𝑤𝑜𝑟𝑘𝑦𝑒𝑎𝑟 −𝑟𝑜𝑢𝑛𝑑𝑎𝑛𝑑 𝑓𝑢𝑙𝑙−𝑡𝑖𝑚𝑒
Source: 2013 American Community Survey, 3-Year Estimates

U.S. Median Earnings by Education Category(25 Years and Older with Earnings)
Less
than HS
HS Grad or GED
Some College, 2
-Year Degre
e
Bachelor's
Higher than Bach
elor's$0
$10
$20
$30
$40
$50
$60
$70
$80
$90
Thou
sand
s of
Dol
lars
67.0%$7,400
Source: 2013 American Community Survey 3-Year estimates, U.S. Census Bureau
68.3%$10,250
68.0%$13,050
67.8%$19,550
Women
Men
67.1%$27,150
4

U.S. Median Earnings by Race and Gender(Full-time, Year-Round Workers)
Asian White Black Native American Hispanic0
10,000
20,000
30,000
40,000
50,000
60,000
70,000
Med
ian
Earn
ings
5Source: ACS 2013 3-year estimates, U.S. Census Bureau
WomenMen
90%$3,100
86%$5,050
90%$3,950
78%$11,200
80%$11,200
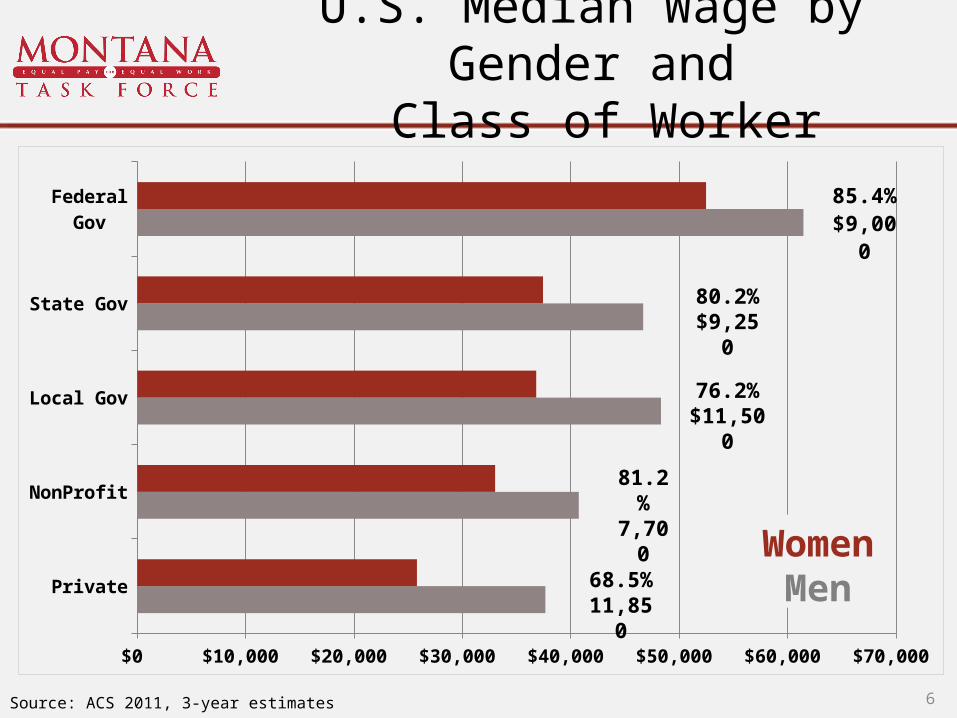
U.S. Median Wage by Gender and Class of Worker
Private
NonProfit
Local Gov
State Gov
Federal Gov
$0 $10,000 $20,000 $30,000 $40,000 $50,000 $60,000 $70,000
85.4%$9,000
Source: ACS 2011, 3-year estimates
WomenMen
6
80.2%$9,250
76.2%$11,500
81.2%7,700
68.5%11,850

Source: American Community Survey, 2012. Map prepared by Forbes.com. Casserly, Meghan, “The Geography of the Gender Pay Gap: Women’s Earnings by State” http://www.forbes.com/sites/meghancasserly/2013/09/19/the-geography-of-the-gender-pay-gap-womens-earnings-by-state .
7
8

Take Away Points
• Gender Wage Gap exists across– Most occupations (there are a few where pay is equal)– All industries– Private, public, and nonprofit– All education groups– All age groups– All states, with Montana on the bottom half
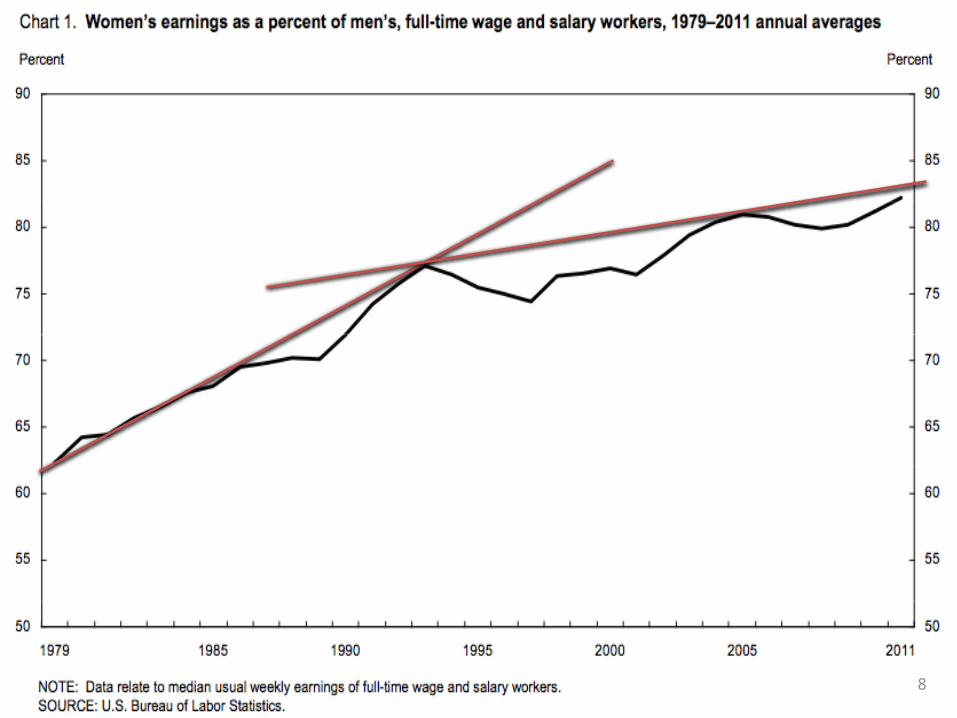
• Gap has improved over time, but improvement is slow.
9

10
What Causes the Wage Gap?
• It’s not just discrimination– Occupation choice– Industry choice– Education– Experience – Part-time work/ flexible scheduling– Time out of workforce for family care– Union status
• Other factors that influence the size of the wage gap– Race -- Other factors– Age -- Behavior (i.e. asking for raises)
11
Some of these factors may be influenced by
discrimination.

U.S. Occupations where Women Work
12Source: ACS, 2013 3-Year Estimates. Some small occupations removed for simplicity.
Food preparation and serving
Personal care
Building and grounds cleaning
Healthcare support
Sales and related
Office and admin support
Production and transport
Arts, entertainment, and media
Community services
Education and library
Healthcare practitioner
Life and social science
Business and financial
Management
Computer and math
Legal
0 2 4 6 8 10 12 14 16
Millions of U.S. Working Women
More Money
Less Money
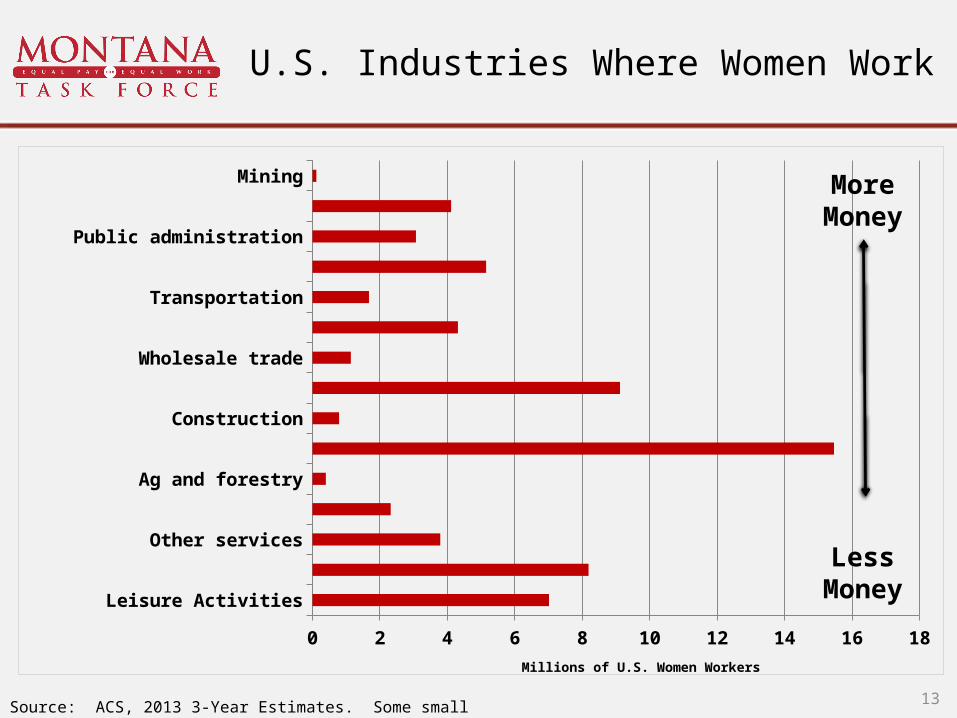
U.S. Industries Where Women Work
13Source: ACS, 2013 3-Year Estimates. Some small industries removed for simplicity.
Leisure Activities
Retail
Other services
Admin support
Ag and forestry
Health care
Construction
Education
Wholesale trade
Manufacturing
Transportation
Financial Activities
Public administration
Professional and technical services
Mining
0 2 4 6 8 10 12 14 16 18
Millions of U.S. Women Workers
More Money
Less Money
Construction and extraction
Installation and repair
Protective service
Computer and math
Management
Building cleaning and maintenance
Arts and media
Sales and related
Legal
Food preparation and serving
Business and financial
Community services
Office and admin
Education and library
Healthcare practitioner
Personal care
Healthcare support
0% 10% 20% 30% 40% 50% 60% 70% 80% 90% 100%
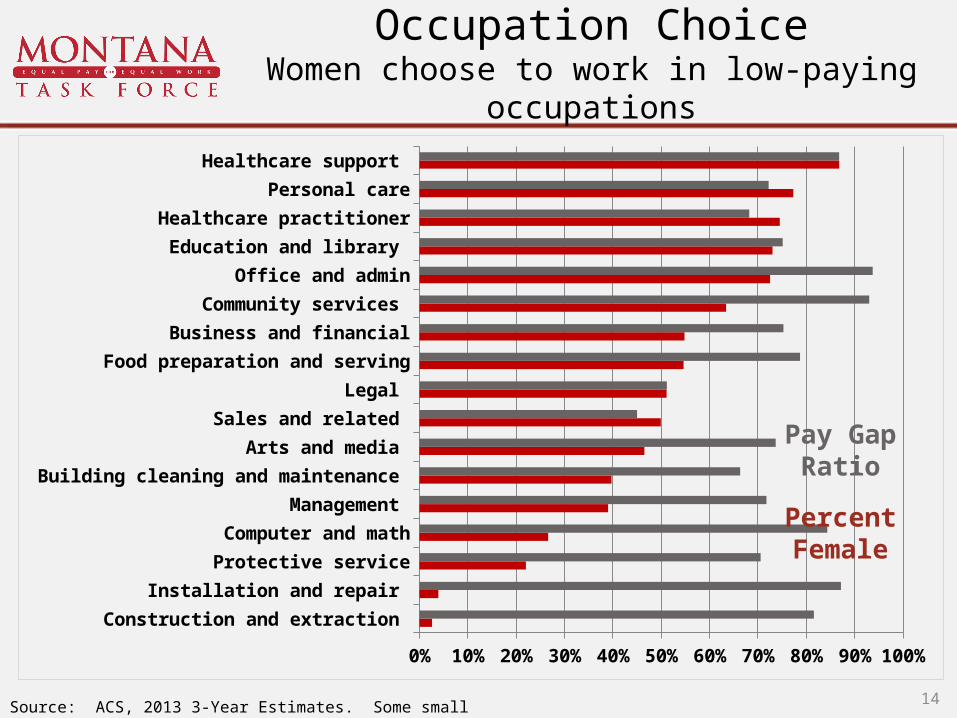
Occupation ChoiceWomen choose to work in low-paying occupations
14
Pay Gap Ratio
Percent Female
Source: ACS, 2013 3-Year Estimates. Some small industries removed for simplicity.

Occupation and Industry ChoiceChoices are Good
• Choice and aptitudes.
• Women may prefer benefits, flexibility, or time off instead of high wages.– Men are slightly more likely to have access to paid leave.– Men and women roughly equally likely to have access
to flexible scheduling
• Taking leave– Women more likely to take paid leave (among those that have it).– Some studies suggest men more likely to have flexible scheduling approved.
• Women more likely to work multiple jobs.
15
Source: Access to and use of paid leave from American Time Use Survey, Bureau of Labor Statistics (BLS), 2011 annual. Access to flexible scheduling from McMenamin, Terence. Monthly Labor Review, BLS, Dec. 2007. For studies on approval of flexible scheduling, see Brescoll, Glass, and Sedlovskaya, Journal of Social Issues, June 2013.

Occupation and Industry Explains Part of the Wage Gap, But There are Caveats
• Even within each industry / occupation, there is a wage gap.
• Men are more likely to be promoted to management positions.– Only 39% of U.S. managers are female.– Only 26% of U.S. chief executives are female.
• Men are more likely to be hired than women, with the bias towards men increasing in higher-paid jobs.– For a low-wage job, females are 9% less likely to get the job. – At the top of the wage distribution, females are 50% less likely to get the
job.16
Source: 2013 ACS 3-Year estimates, Census. 2014 Current Population Data, BLS . Gobillon, Meurs, Roux in Journal of Labor Economics, V33, n2, April 2015 and other studies.
State Pay Audit
• Found that occupations are the primary reason for pay discrepancies.– Very few women in blue collar (high pay) jobs.
• Women tend to be under-employed in lower band levels.– We don’t know if by choice or by system.– Fewer women than men in supervisor positions at nearly all band levels.
• Women tend to have slightly less experience in their current position.– No way to know if experience overall or if differences in skills.
17
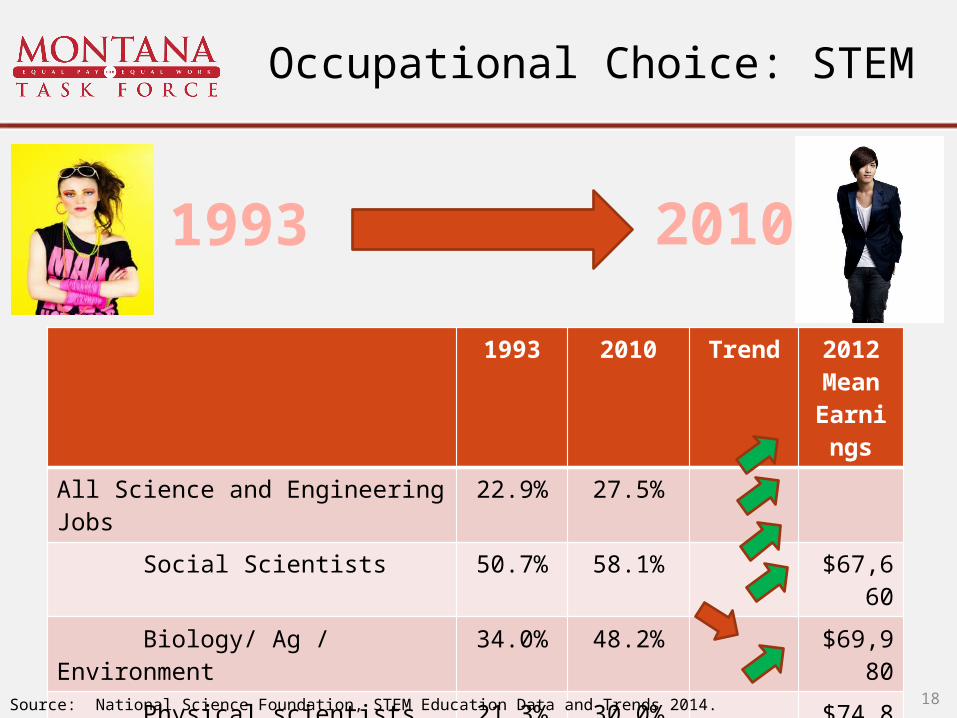
Occupational Choice: STEM
1993 2010 Trend 2012 Mean
Earnings
All Science and Engineering Jobs 22.9% 27.5%
Social Scientists 50.7% 58.1% $67,660
Biology/ Ag / Environment 34.0% 48.2% $69,980
Physical scientists 21.3% 30.0% $74,880
Computer/ math 30.8% 25.1% $76,170
Engineers 8.6% 12.7% $86,50018
1993 2010
Source: National Science Foundation, STEM Education Data and Trends 2014.
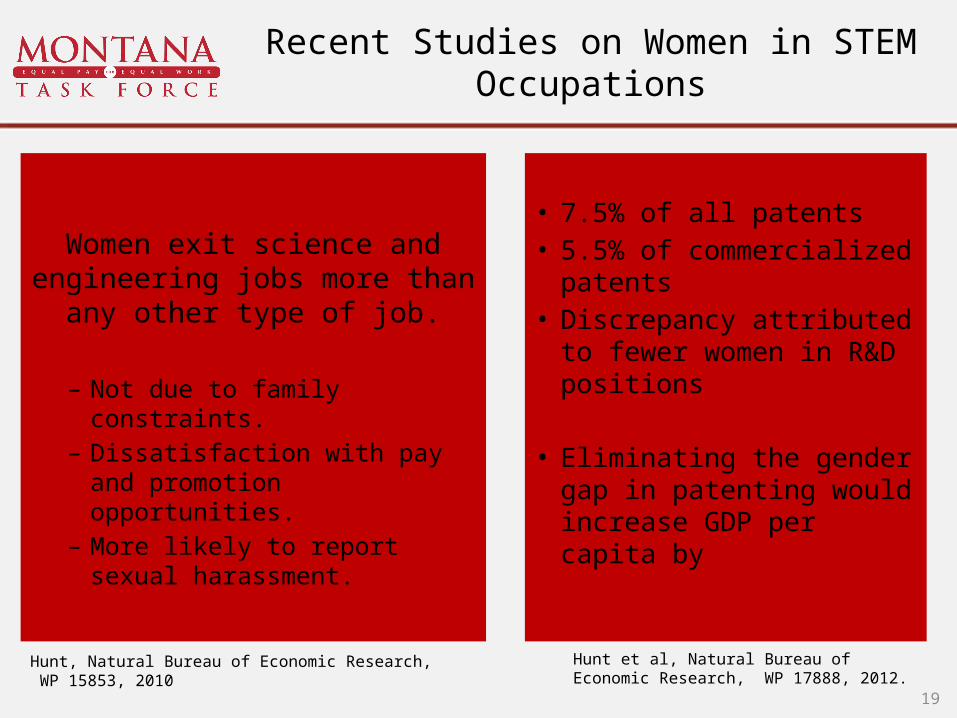
Recent Studies on Women in STEM Occupations
Women Leaving Engineering
Women exit science and engineering jobs more than
any other type of job.
– Not due to family constraints.– Dissatisfaction with pay and
promotion opportunities.– More likely to report sexual
harassment.
Women and Patents• 7.5% of all patents• 5.5% of commercialized
patents• Discrepancy attributed to
fewer women in R&D positions
• Eliminating the gender gap in patenting would increase GDP per capita by 2.7%
19
Hunt et al, Natural Bureau of Economic Research, WP 17888, 2012.
Hunt, Natural Bureau of Economic Research, WP 15853, 2010

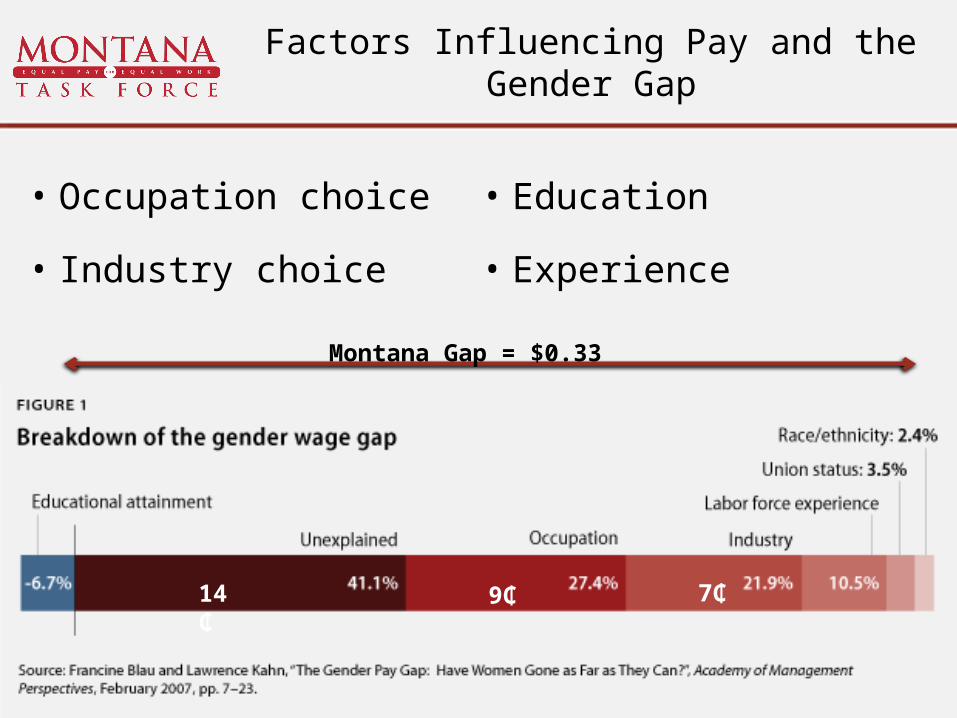
Factors Influencing Pay and the Gender Gap
• Occupation choice
• Industry choice
• Education
• Experience
• Part-time work/ flexible scheduling
• Time out of workforce for family care
20
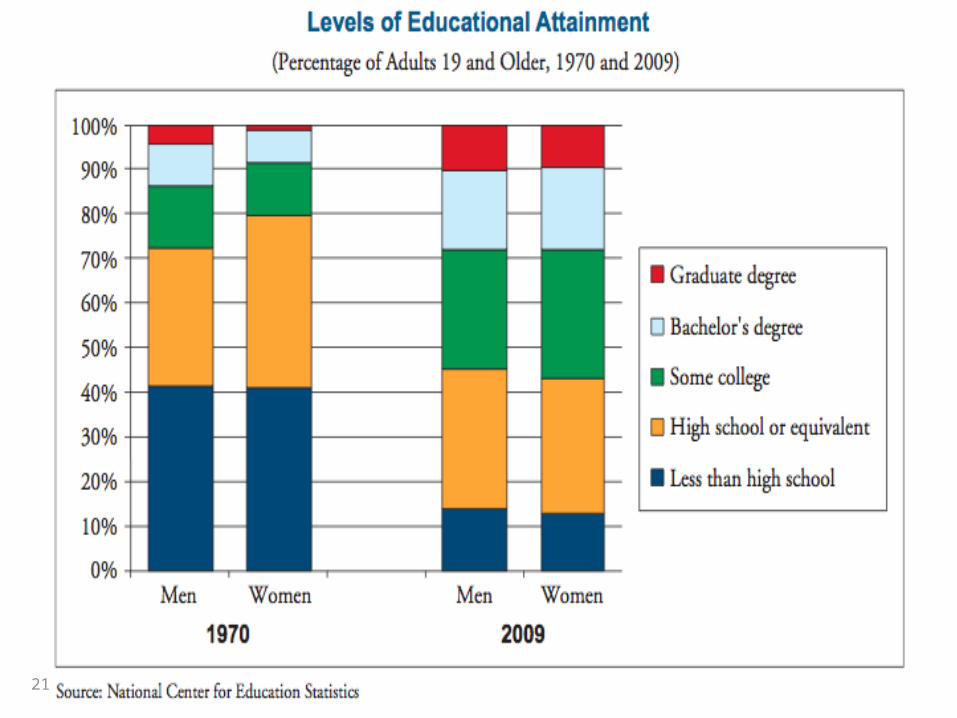
21

What do studies show?
• Women have more education and slightly higher grades than men– Do women stay in school longer because they perform well?
• Different college majors plays a role– Even among students with the same major and equal school
performance, men out-earn women– Significant attention to recruiting women into STEM degrees
22

U.S. Median Earnings by Education Category(25 Years and Older with Earnings)
Less
than HS
HS Grad or GED
Some College, 2
-Year Degre
e
Bachelor's
Higher than Bach
elor's$0
$10
$20
$30
$40
$50
$60
$70
$80
$90
Thou
sand
s of
Dol
lars
67.0%$7,400
23Source: 2013 American Community Survey 3-Year estimates, U.S. Census Bureau
68.3%$10,250
68.0%$13,050
67.8%$19,550
Women
Men
67.1%$27,150

Specific to STEM Education
• In high school, performance differences manifest, with females are less likely to take AP exams in STEM.
• Some research has suggested that STEM teachers give male students more praise and opportunities. Other research disagrees.
24
• In elementary, males and females have equal performance in math and science.
• In 8th grade, white males slightly outperform females on math and science exams. For blacks, the opposite is true, suggesting cultural factors play a role.
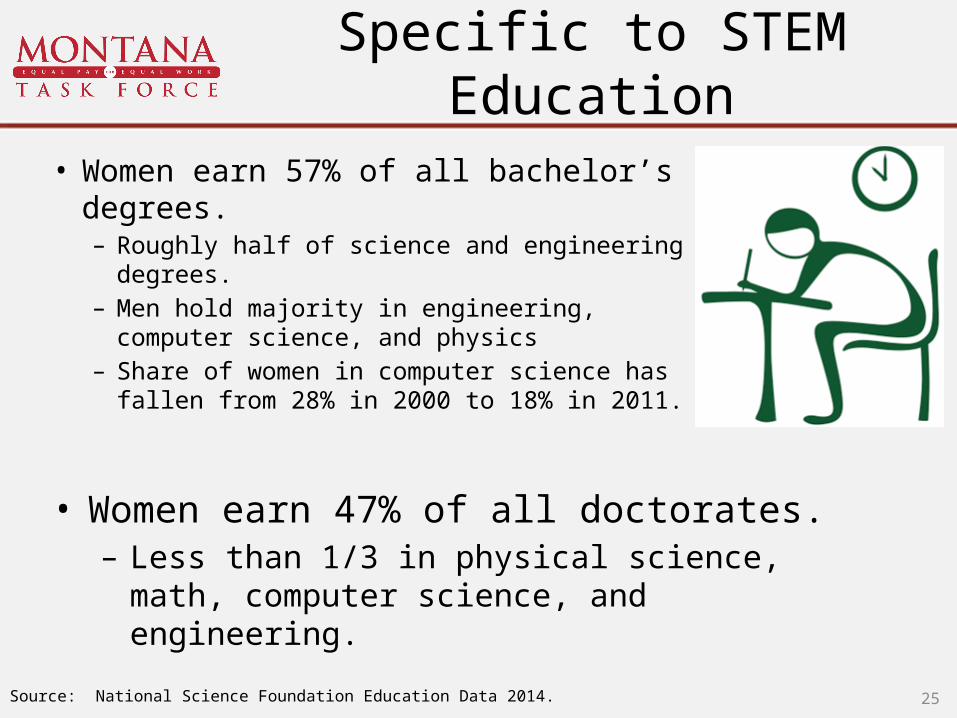
Specific to STEM Education
25
• Women earn 57% of all bachelor’s degrees.– Roughly half of science and engineering degrees.– Men hold majority in engineering, computer
science, and physics– Share of women in computer science has fallen
from 28% in 2000 to 18% in 2011.
• Women earn 47% of all doctorates.– Less than 1/3 in physical science, math, computer science,
and engineering.
Source: National Science Foundation Education Data 2014.

Factors Influencing Pay and the Gender Gap
• Occupation choice
• Industry choice
• Education
• Experience
• Part-time work/ flexible scheduling
• Time out of workforce for family care
26

Did not Work 35 Hours or More 15 to 34 Hours 1 to 14 Hours0%
10%
20%
30%
40%
50%
60%
70%
80%
Male
Female
Usual Hours Worked
Experience: Part-Time Status
27Source: 2013 ACS 3-year Estimates

Experience and Part-Time Work
Women are more likely to care for children and family.• Time out of workforce for childbearing.
• Choose part-time work or relaxed occupations to allow for work and family.
• Economic theory suggests that the lower-paid partner will take on more home responsibilities.
28

Pay Gap over Time by Age Group
29

Because of Part-Time Work and Motherhood, Women have Less Experience.
Is this problematic?
• Why it might not be:– Women may choose to work part-time or take longer parental
leave time for family care.
• Why it might be:– Discrimination causes men to earn higher wages, so families
decide women should stay home. – What about dads?– Cultural pressure to work at home or fulfill motherly duties– Discrimination in hiring practices– Expectation of motherhood and early “leaning out”
30

Union Representation Narrows GapMedian Weekly Earnings by Union Status and Gender
Represented by Unions Non-Union$0
$200
$400
$600
$800
$1,000
$1,200
$1,015
$840 $899
$687
Males
Females 81.7%
31Source: Bureau of Labor Statistics, 2014 Current Population Survey.
88.5%
Factors Influencing Pay and the Gender Gap
• Occupation choice
• Industry choice
• Education
• Experience
32
Montana Gap = $0.33
14₵ 9₵ 7₵

Conclusions
• Much of the wage gap can be explained by human capital factors and productivity.
• There remains a gap.
• Research suggests cultural stereotypes of greater detriment than overt sexism.
• Culture changing more slowly than human capital factors.
33

What can we do?
• Economics traits that seem to help– Knowledge jobs over muscle jobs– Centralized pay decisions– Wage compression– Changing cultural norms
• Paid family leave increases women’s labor force participation and increases experience levels.
• Increased pay transparency provides greater ability to negotiate pay.– Both male and female managers can show bias in performance
evaluations and discounting women’s experience.– Women often given office duties that can detract from achievements. 34

DATA AND PRESENTATIONS AVAILABLE AT
WWW.EQUALPAY.MT.GOV
35
A special thank you for research assistance to Isabel HuffSmith College