Embed Size (px)
Citation preview
Edward R. Tufte
The Visual Display of Quantitative Information
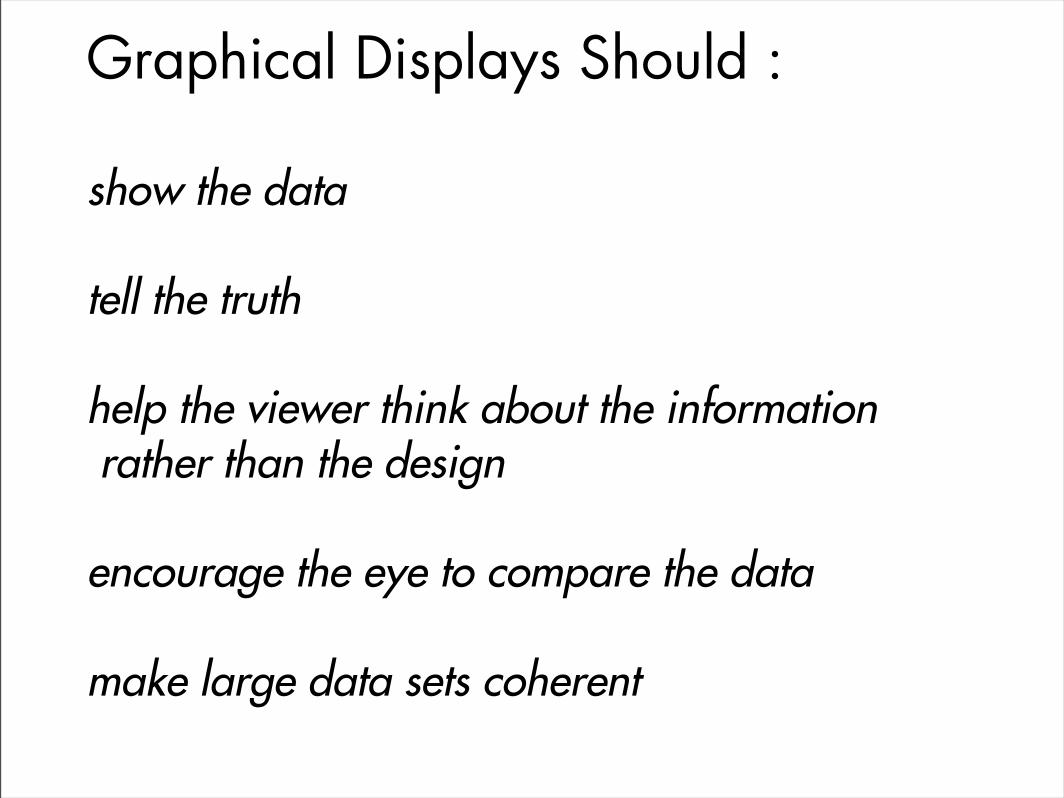
Graphical Displays Should :
show the data
tell the truth
help the viewer think about the information rather than the design
encourage the eye to compare the data
make large data sets coherent
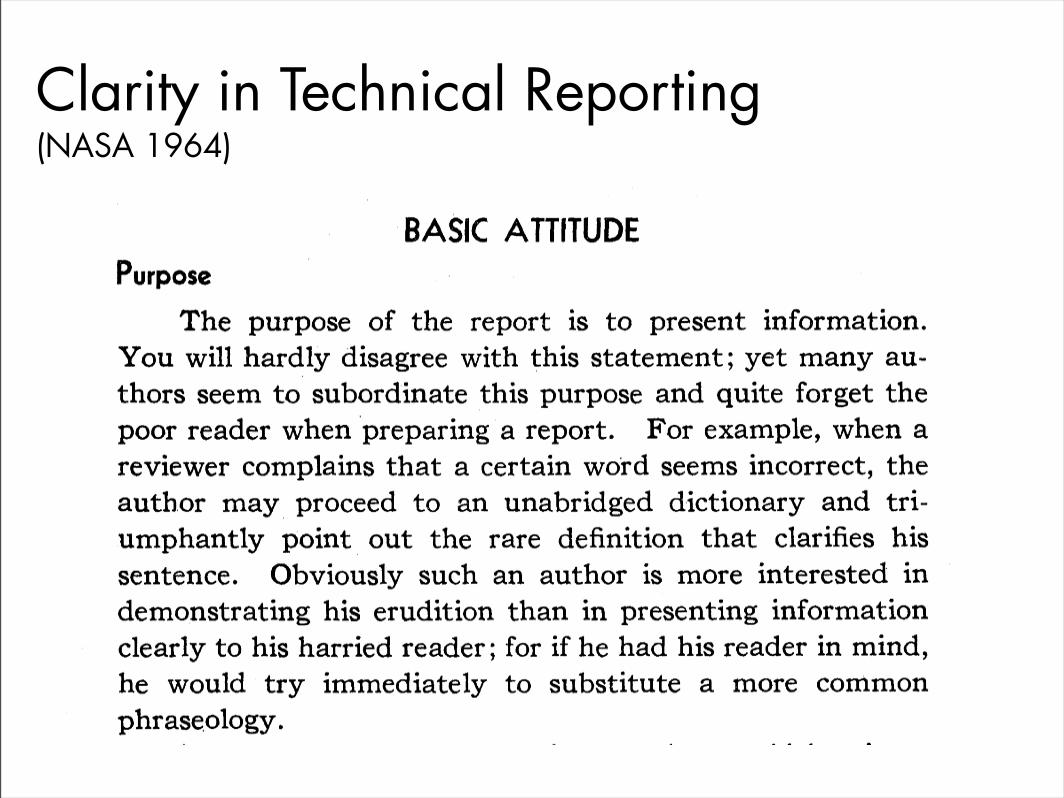
Clarity in Technical Reporting(NASA 1964)
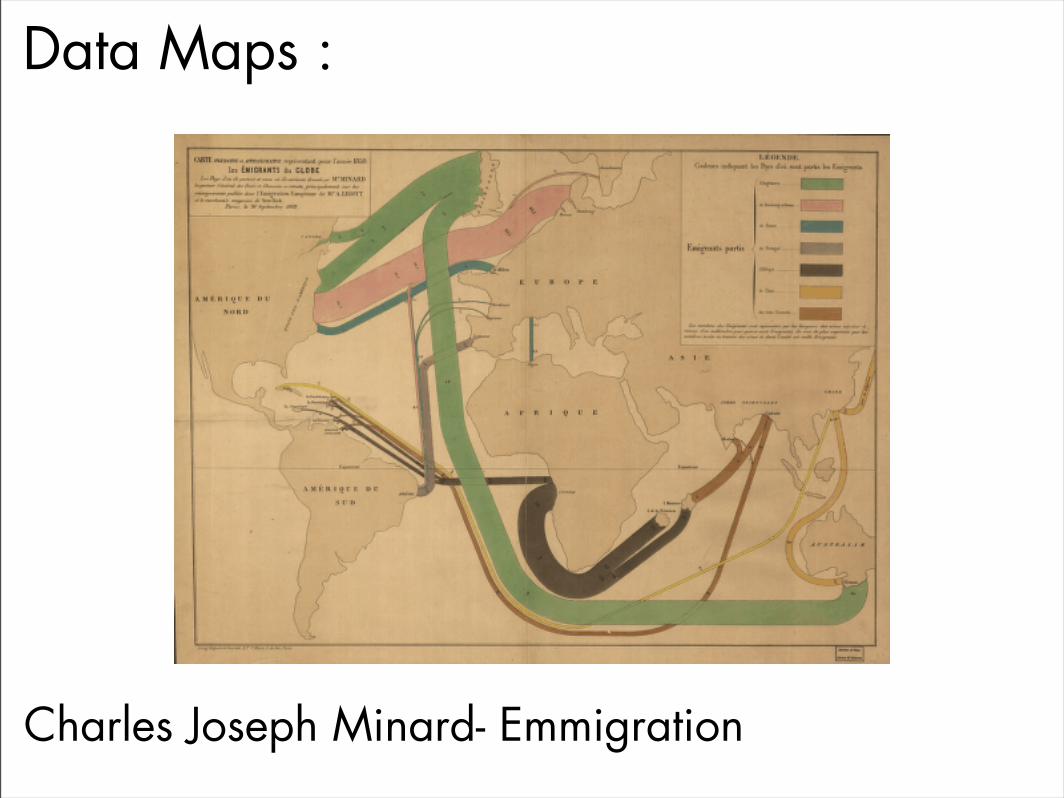
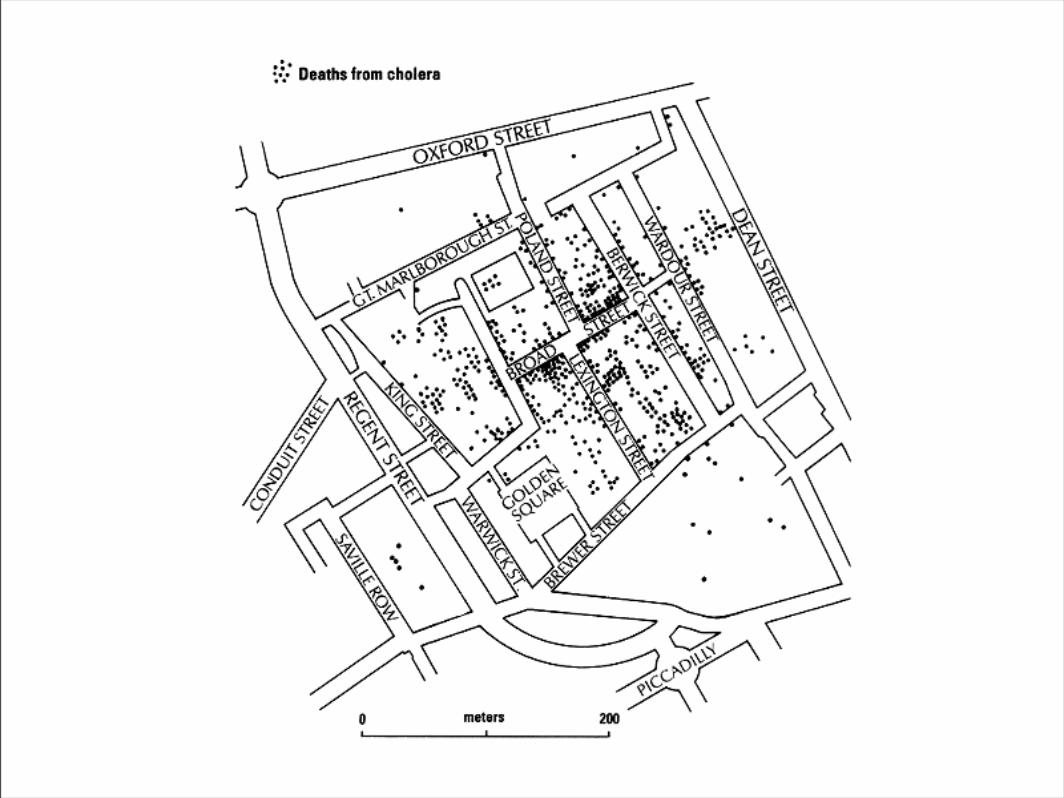
Data Maps :
Charles Joseph Minard- Emmigration
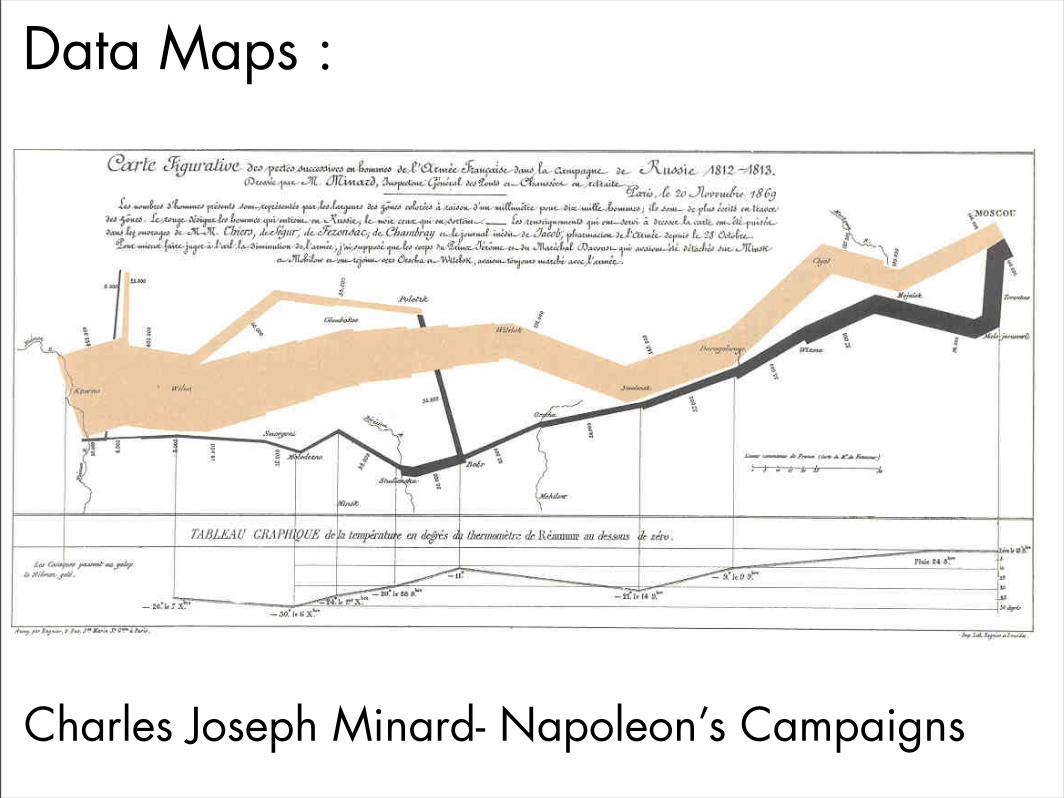
Data Maps :
Charles Joseph Minard- Napoleon’s Campaigns
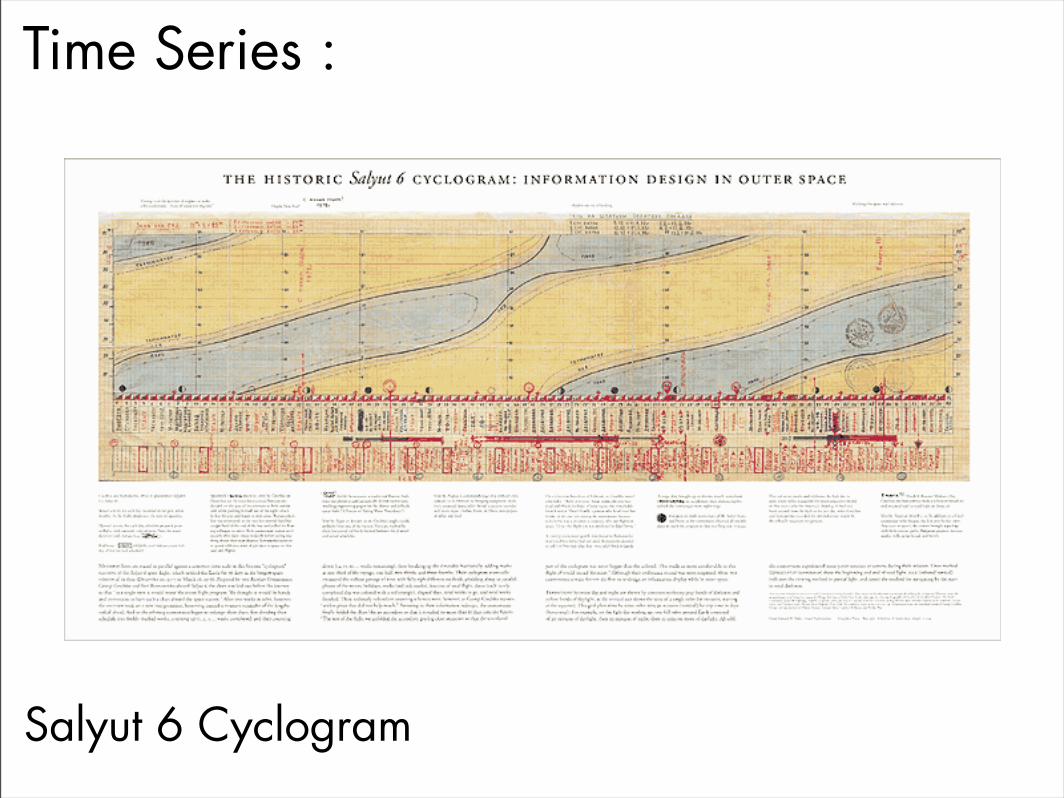
Time Series :
Salyut 6 Cyclogram

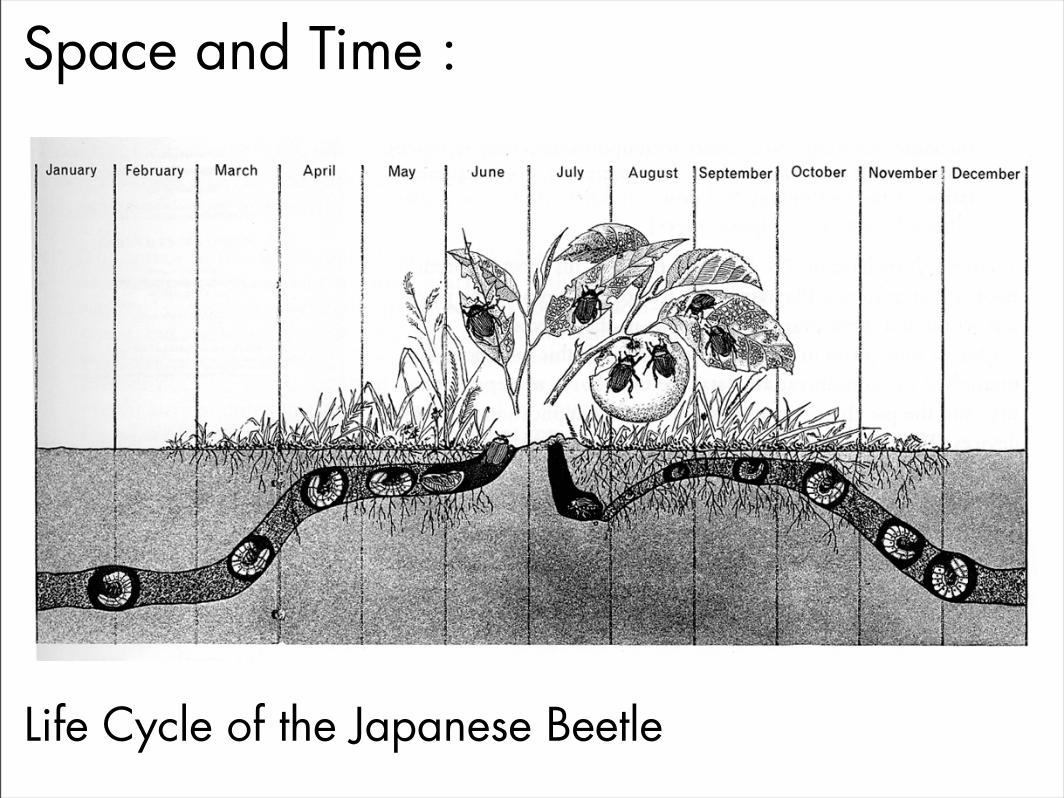
Space and Time :
Life Cycle of the Japanese Beetle
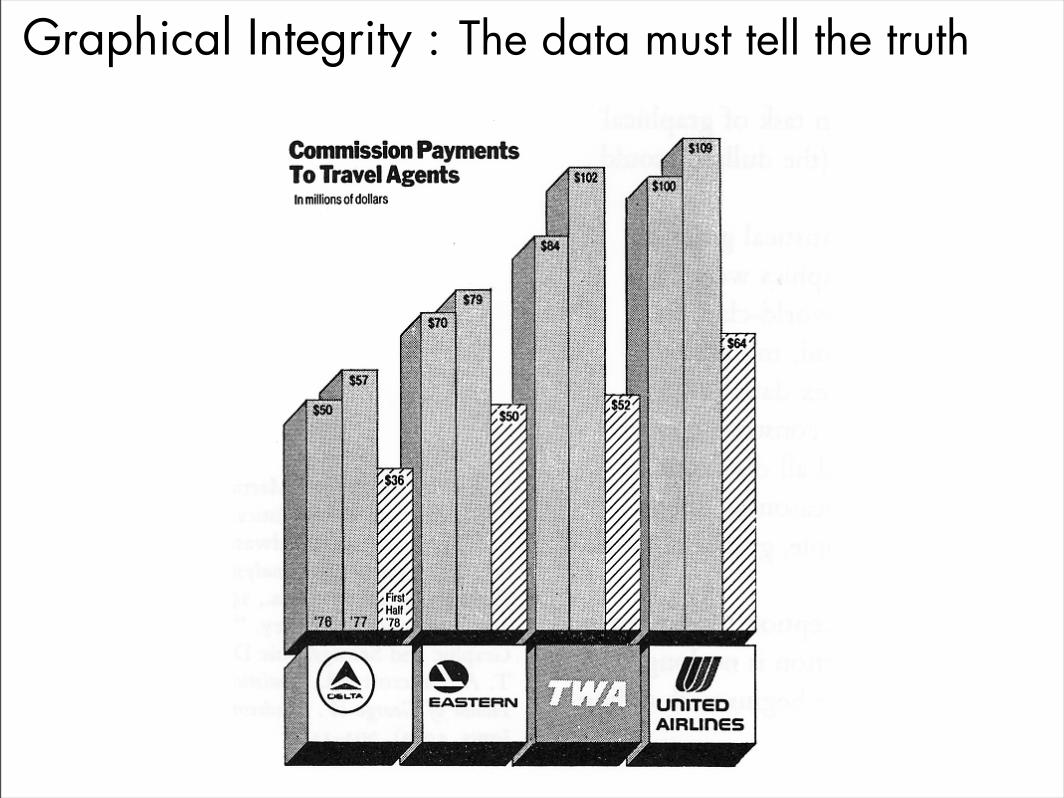
Graphical Integrity : The data must tell the truth
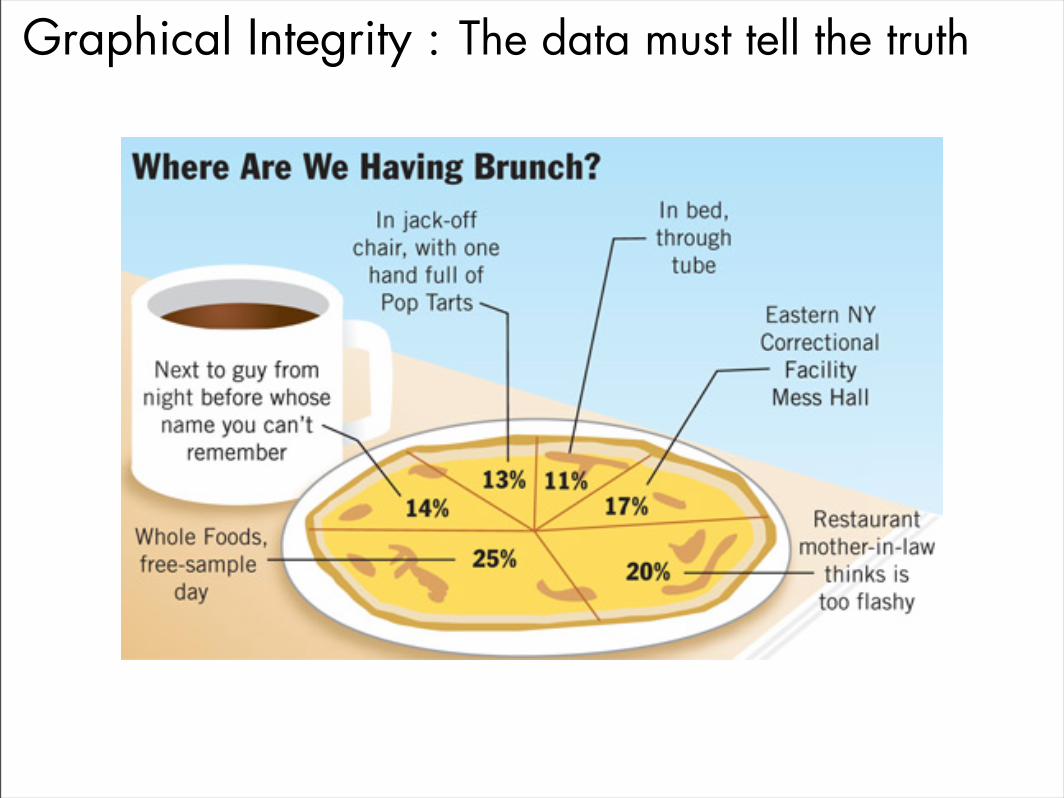
Graphical Integrity : The data must tell the truth

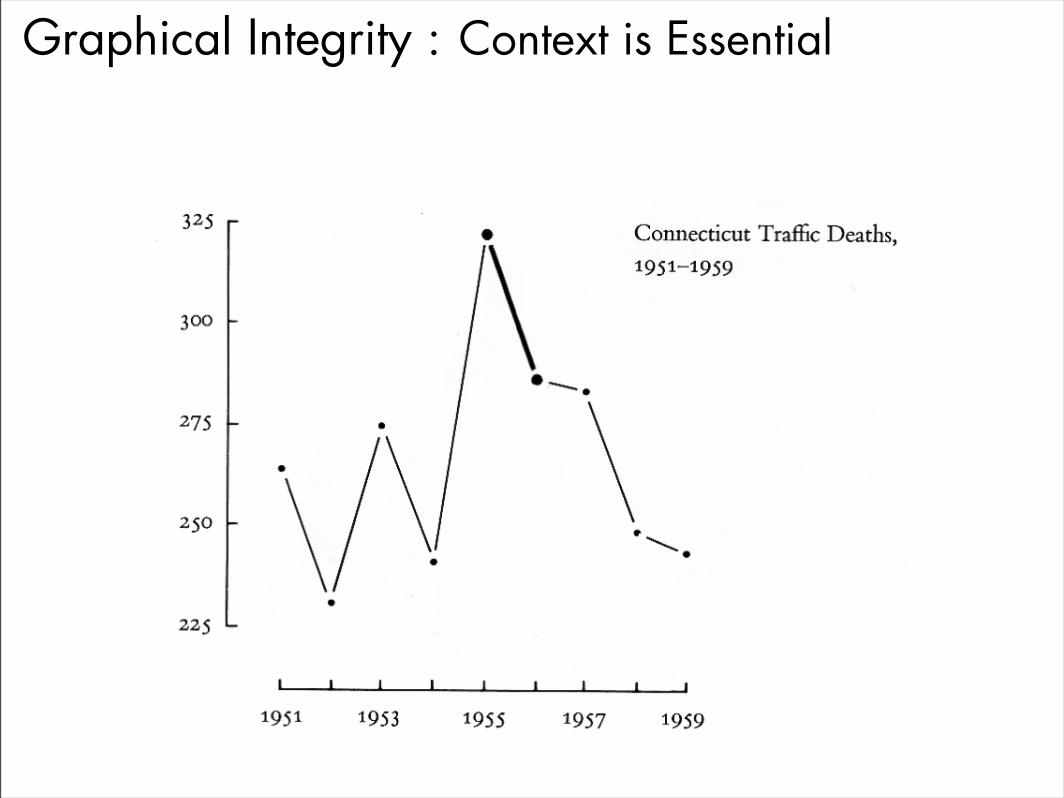
Graphical Integrity : Context is Essential
Graphical Integrity : Context is Essential
Other Design Considerations :
color
line and form
typography
format and scale

Color :
Joseph Albers- The Interaction of Color
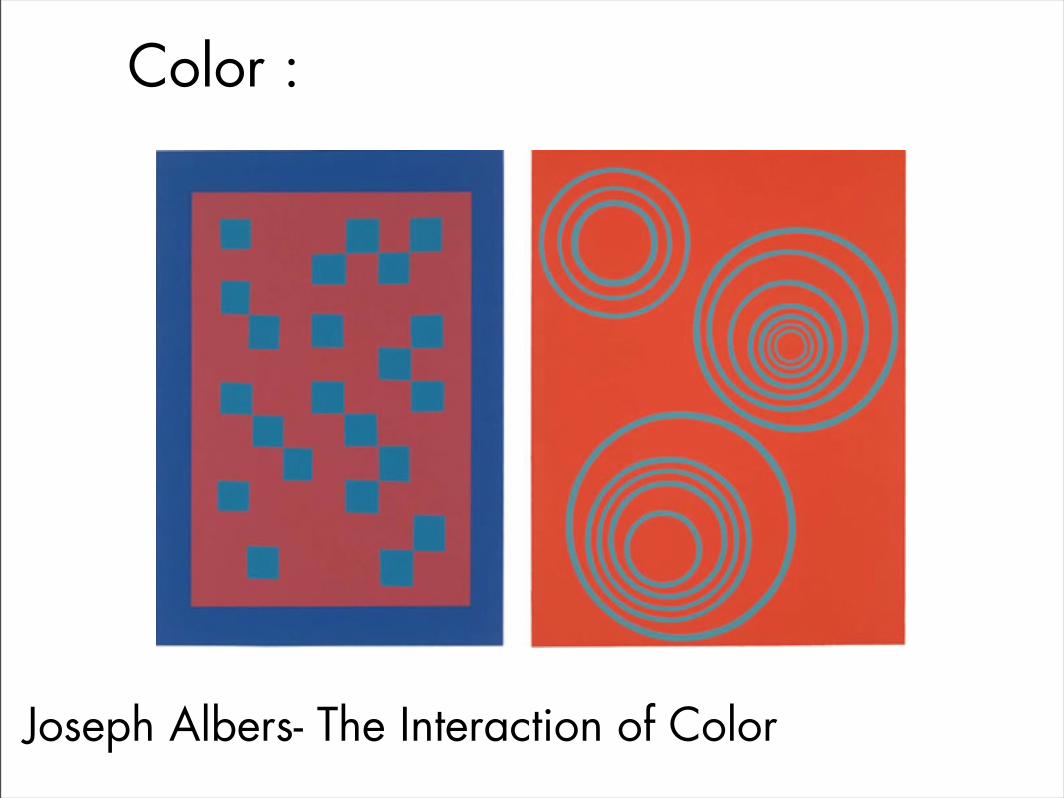
Color :
Joseph Albers- The Interaction of Color
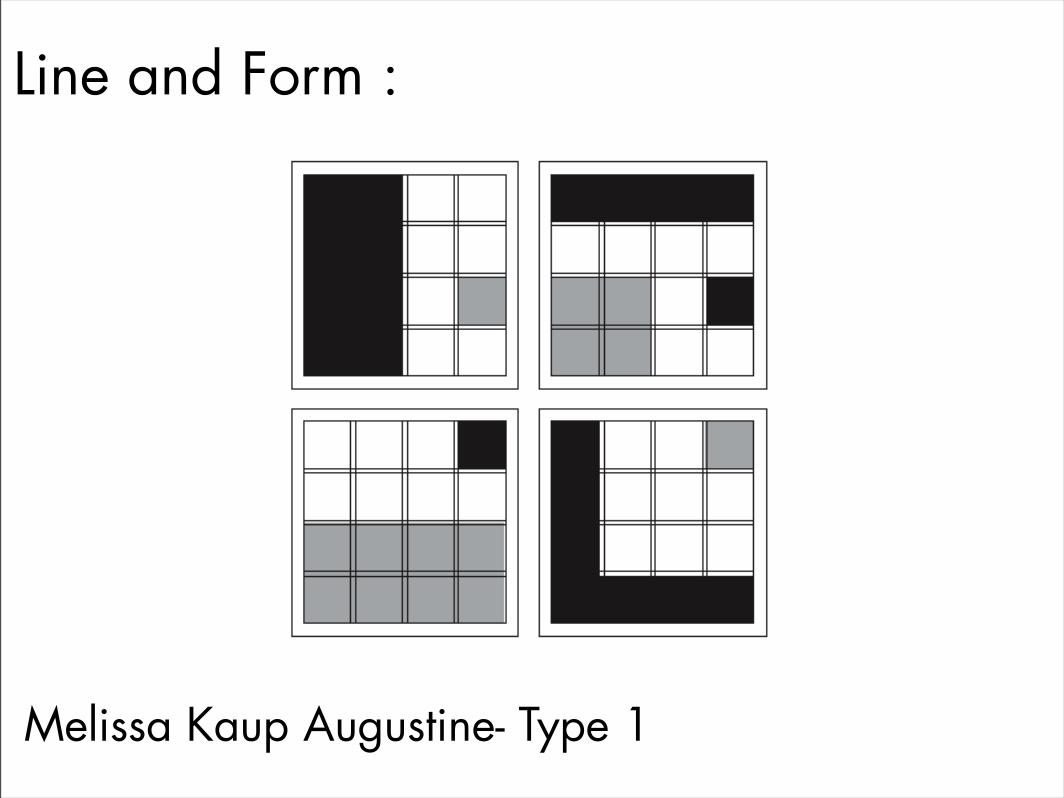
Line and Form :
Melissa Kaup Augustine- Type 1
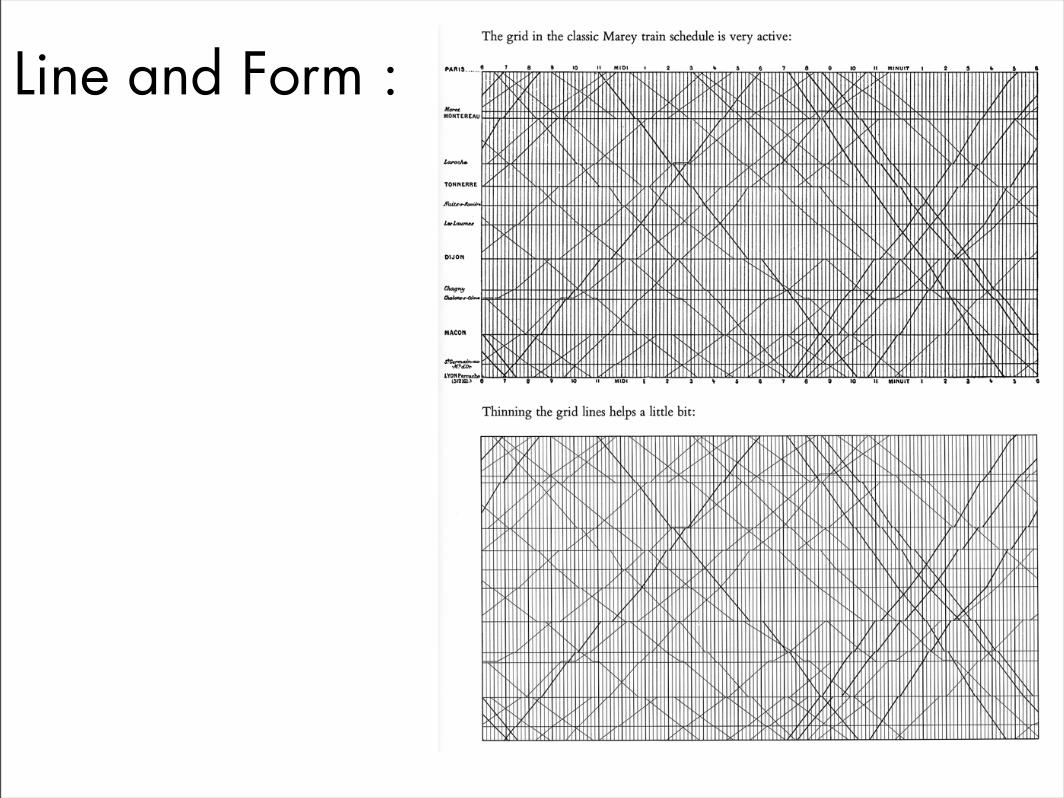
Line and Form :

Line and Form :
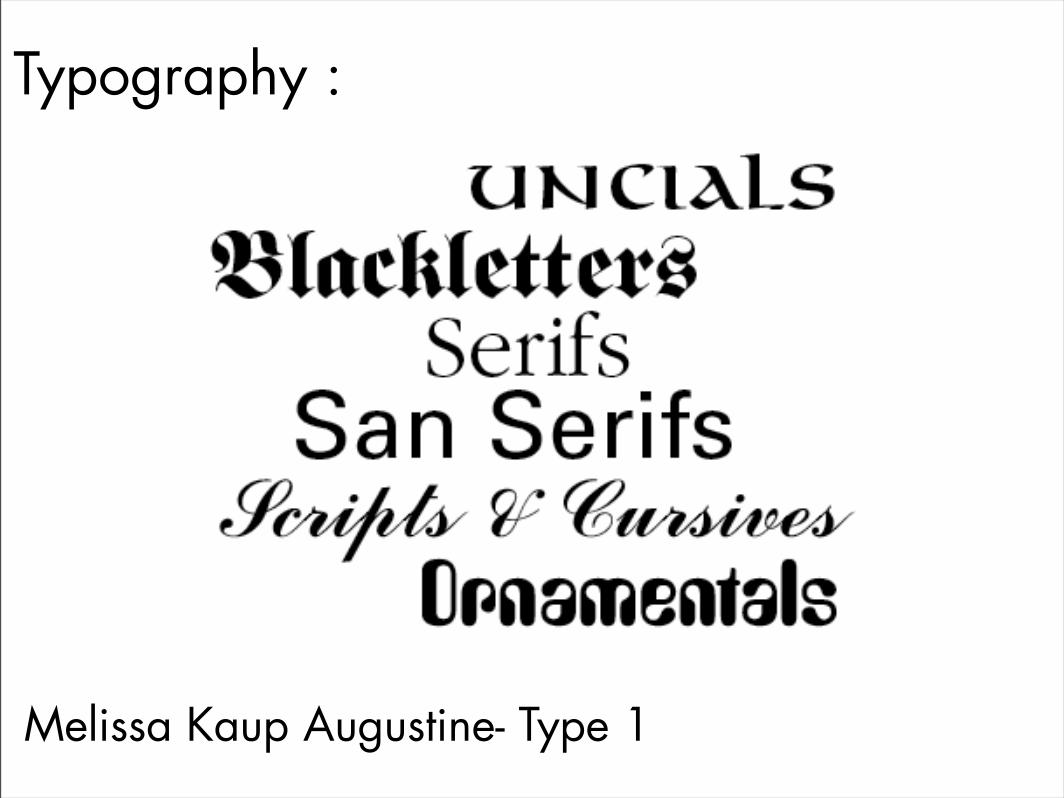
Typography :
Melissa Kaup Augustine- Type 1
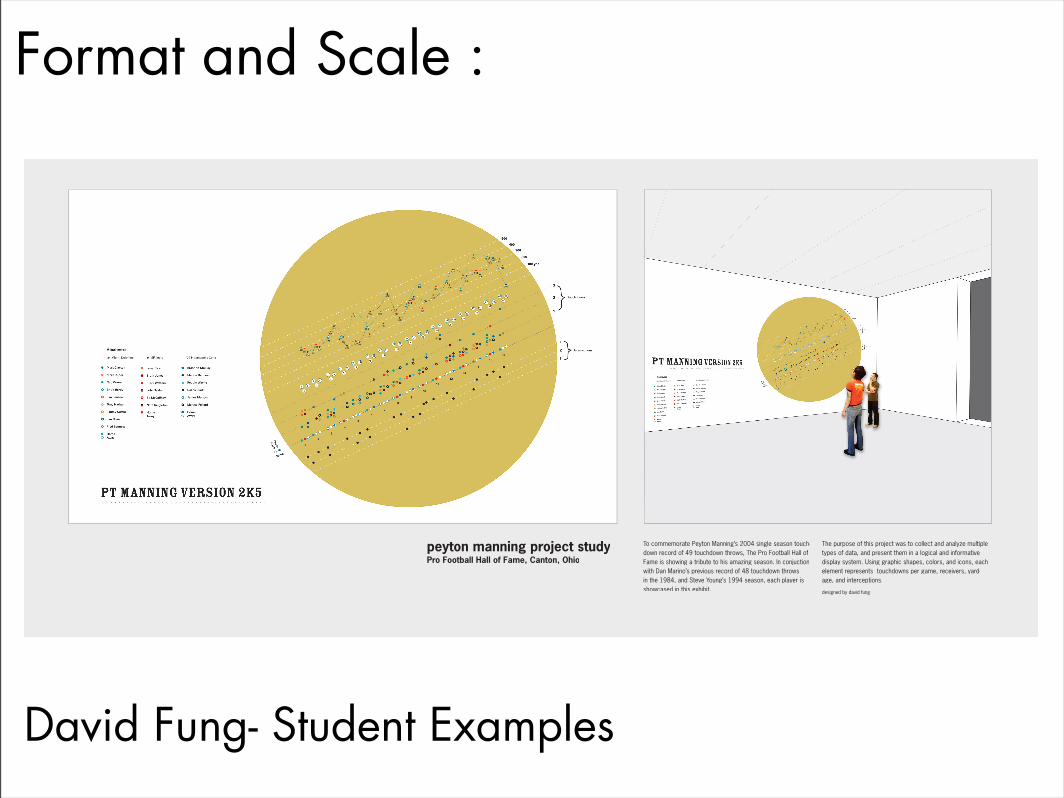
Format and Scale :
David Fung- Student Examples

Format and Scale :
Christina Gonzalez- Student Examples
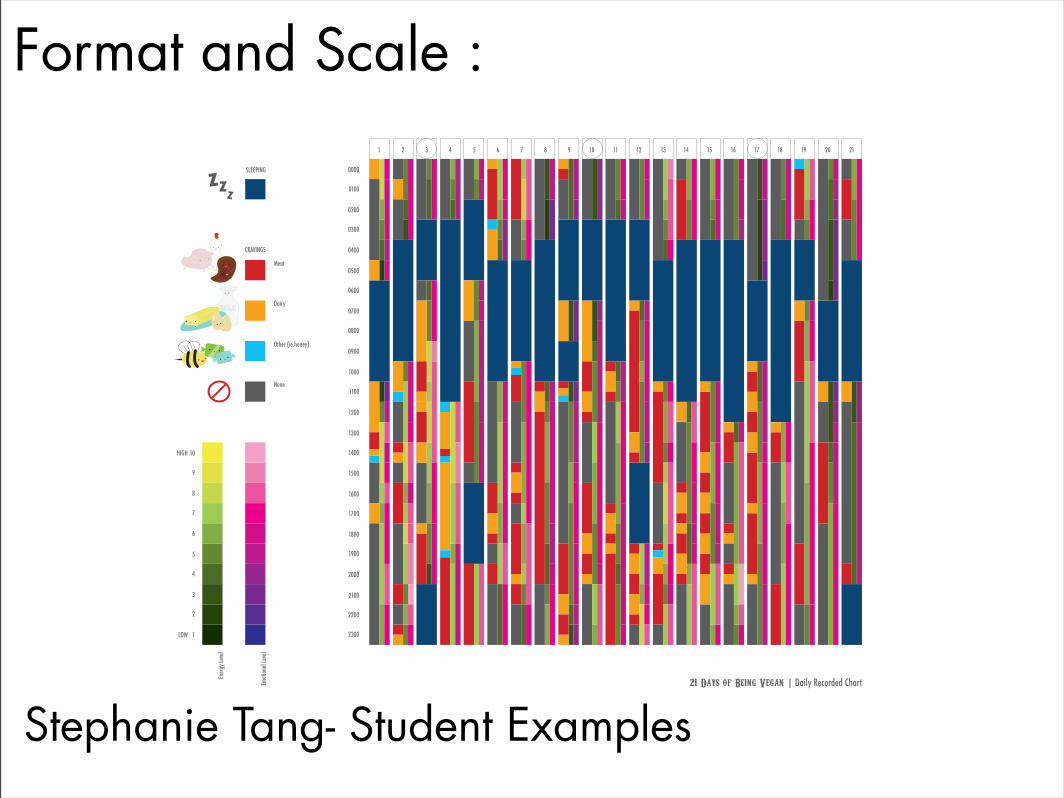
Format and Scale :
Stephanie Tang- Student Examples
1 2 3 4 5 6 7 8 9 10 11 12 13 14 15 16 17 18 19 20 21
0000
0100
0200
0300
0400
0500
0600
0700
0800
0900
1000
1100
1200
1300
1400
1500
1600
1700
1800
1900
2000
2100
2200
2300
10
9
8
7
6
5
4
3
2
1
Ener
gy L
evel
Emot
iona
l Lev
el
CRAVINGS
SLEEPING
ZZ
Z
HIGH
LOW
Meat
Dairy
Other (ie.honey)
None
21 Days of Being Vegan | Daily Recorded Chart
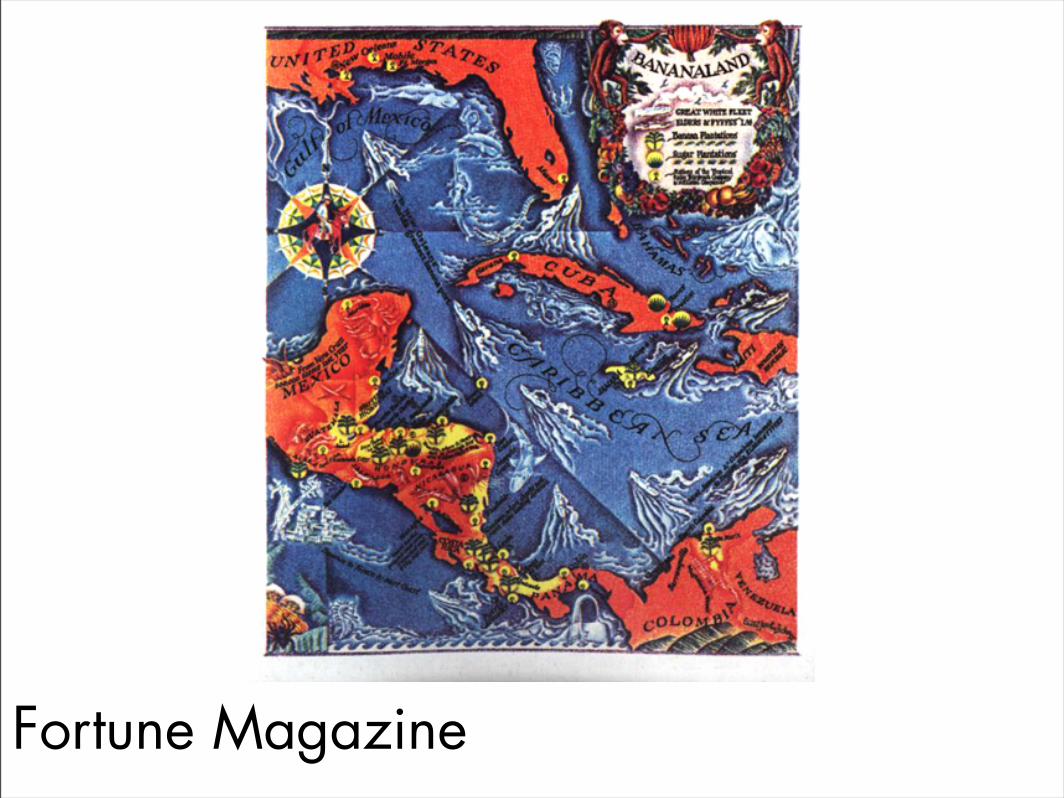
Fortune Magazine


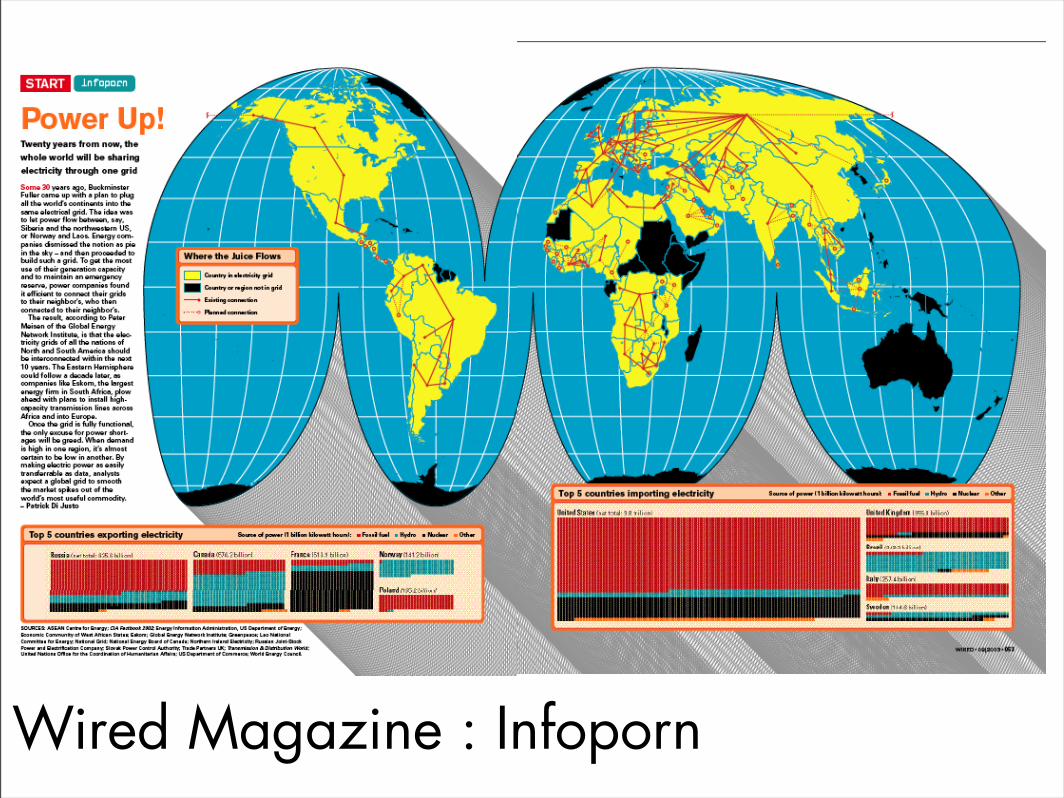
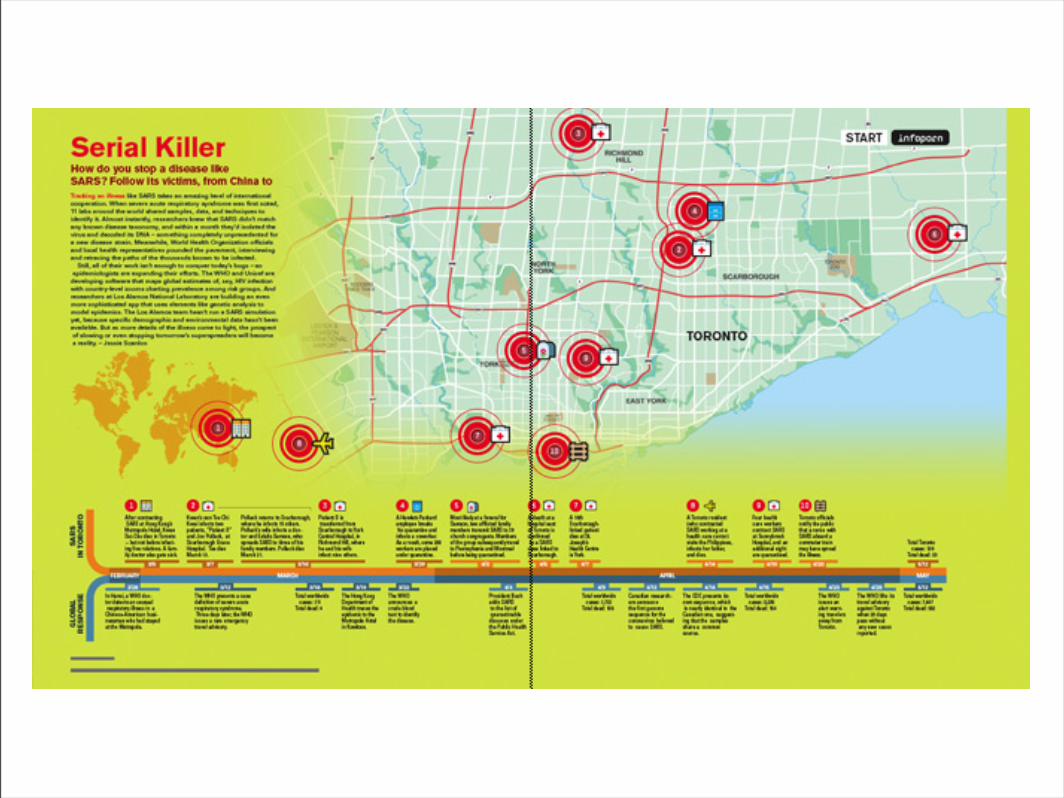
Wired Magazine : Infoporn

0% 20% 40% 60% 80% 100%
0
1996
1997
1998
1999
2000
2001
2002
2003
3500 50 100 150 200 250 300
700
019
86
1987
1988
1989
1990
1991
1992
1993
1994
1995
1996
1997
1998
1999
2000
100200300400500600700800
2003
2002
2001
2000
1999
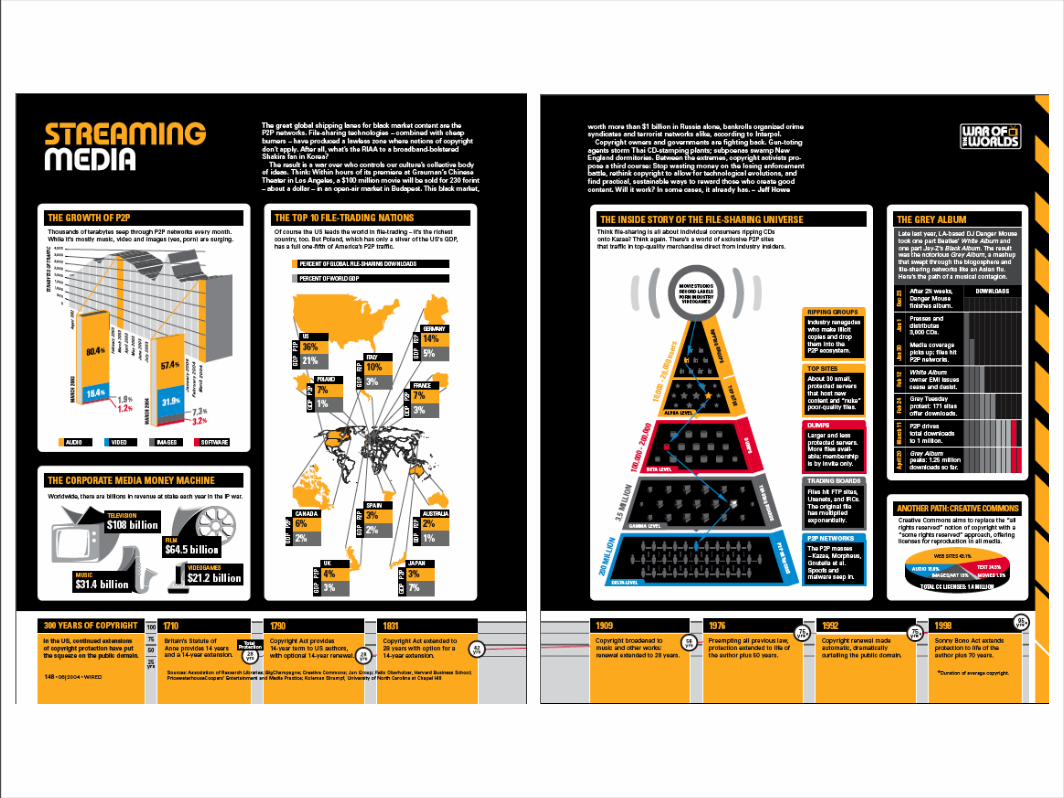
152 • 06|2004 • WIRED
WHO OWNS AGRICULTURAL BIOTECHWhile public entities control many enabling technologies for agricultural biotech, a handful of private companies owns three-quarters of US patents, including the most relevant genes.
About 10,000 years ago, probably in what is now Turkey,some proto-agronomy genius got sick of hunting and gathering and decided to grow food instead. Too bad that guy didn’t get a business method patent. But it didn’t takelong for farmers who raised better animals or developedhardier seeds to learn they could charge more, an ideaformalized in the last two centuries with proprietary rightsassigned to breeds and strains. Today, agriculture is steeped in intellectual property: Plants come with license agreements,farmers can’t sow seeds from last year’s crops without fear
Genetically modified crops offer many benefits – but carry theadded burdens of patent-protected agriculture. So farmers whoplant GM in developing nations also reap a bumper crop oflicensing agreements.
The boom in biotechnology in the 1980s came with a relatedblossoming of patents, especially in the US.
GM MOVES TO THE DEVELOPING WORLD
THE RISE OF AG PATENTS
The total supply of cropland worldwide is holding steady at nearly700 million acres. More and more of those crops are geneticallymodified – which means they’re grown on intellectual property.
GM IN THE FIELD
US BIOTECH PATENTS
MONSANTO 14%
PUBLIC SECTOR 24%DUPONT 13%
SYNGENTA 7%
BAYER 4%
DOW 3%
OTHER PRIVATE 33%
UNKNOWN 2%
JAPAN EU
PRIVATE 86% PRIVATE 25%
INDUSTRIAL NATIONS DEVELOPING NATIONS
PUBLIC 75%PUBLIC 14%
NON-GM GM
MILLIONS OF ACRESWHERE GM CROPS ARE GROWN
CANOLA
US A
G PA
TEN
TSM
ILLI
ONS
OF A
CRES
COTTON
SOYBEAN
CORN
2003 BY CROP


Design Project Harper’s Index
1. select one or two of the facts on this month’s Index
2. create a graphic interpretation of the information
3. adhere to Tufte’s principles of graphical display
{show the data, tell the truth, help the viewer think about the information rather than the design, encourage the eye to compare the data, make large data sets coherent}

Amount that a Colorado state prisoner is paid to work a day as a field hand at a local farm: 60¢
Amount the prisons are paid by farmers for each inmate's daily work: $77.20

Percentage of West Virginia public schools that will use the video game Dance Dance Revolution in P.E. classes next year: 100

Percentage change in the number of Louisiana and Mississippi newborns named Katrina in the year after the hurricane: +153

Design Project Harper’s Index
1. select one or two of the facts on this month’s Index
2. create a graphic interpretation of the information
3. adhere to Tufte’s principles of graphical display
{show the data, tell the truth, help the viewer think about the information rather than the design, encourage the eye to compare the data, make large data sets coherent}


![The Visual Display of Quantitative Information...Visual Display of Quantitative Information" by Edward R. Tufte [1]. Chapter 1 Graphical Integrity When looking up graphical integrity](https://img.pdfslide.us/doc/110x75/5f02fef07e708231d407062b/the-visual-display-of-quantitative-information-visual-display-of-quantitative.jpg)


![[eBook] Edward Rolf Tufte - The Visual Display of Quantitative Information (1983)](https://img.pdfslide.us/doc/110x75/55cf9db1550346d033aec1c1/ebook-edward-rolf-tufte-the-visual-display-of-quantitative-information.jpg)
