Embed Size (px)
Citation preview
The vertical-horizontal illusion: Assessing the contributions ofanisotropy, abutting, and crossing to the misperception ofsimple line stimuli
Kyriaki Mikellidou #
Department of Translational Research onNew Technologies in Medicine and Surgery,
University of Pisa, Italy
Peter Thompson #Department of Psychology, University of York, York, UK
Mamassian and de Montalembert (2010) have proposeda simple model of the vertical-horizontal illusion. Thismodel identified two components, an anisotropy whichresults in horizontal lines being perceived approximately6% shorter than verticals and a bisection componentwhich results in a bisected line being perceivedapproximately 16% shorter. We have shown that thisbisection component confounds two effects: One whenlines cross one another and a second effect when oneline abuts another. We propose an extension to theMamassian-de Montalembert model in which theirbisection component is replaced by separate crossingand abutting components.
Introduction
One of the first visual illusions to be described in anydetail was the Oppel-Kundt illusion (Oppel, 1855) inwhich a horizontal line with a series of vertical ‘‘ticks’’along its length appears longer than a line of equallength without the ticks. Helmholtz (1925) saw thisillusion as being an example of filled extents beingperceived as larger than unfilled extents. He citedeveryday examples of the illusions—that empty roomslook smaller than furnished rooms, walls covered witha paper pattern look larger than one painted in auniform color, and (most controversially) that womenwear horizontal stripes in order to look taller (seeThompson & Mikellidou, 2011). Although the optimalnumber of ticks has not been established with anyrigor, there are reports to suggest that the effectincreases as more ticks are introduced up to somenumber between 7 (Obonai, 1933) and 14 (Piaget &Osterrieth, 1953).
A second illusion of similar antiquity is the vertical-horizontal illusion, first reported by Frick (1851, as citedin Avery & Day, 1969). Usually shown as an inverted Tfigure with equal-length vertical and horizontal compo-nents, it is reported that the vertical appears significantlylonger than the horizontal. This illusion has been thesubject of much research, but the most thoroughinvestigation was carried out by Mamassian and deMontalembert (2010) who have proposed a simplemodel to describe quantitatively the overestimation ofthe vertical segment compared to the horizontal in thevertical-horizontal illusion. They investigated the illusionin three configurations of a pair of vertical andhorizontal lines: ‘‘T,’’ ‘‘L,’’ and ‘‘þ.’’ They interpretedtheir results as showing two independent components, inagreement with previous studies (Charras & Lupianez,2010; Kunnapas, 1955): (a) an anisotropy bias causing a6% overestimation of the vertical segment relative to thehorizontal one and (b) a bisection bias of approximately16%, causing an underestimation of the bisected linerelative to the bisecting line.
The supposition that bisection is responsible for alarge underestimation in perceived length does not siteasily with an interpretation of the Oppel-Kundt illusionbeing an illusion of filled extent; why should bisecting aline reduce its perceived length by 16% whereasintroducing more lines increases it perceived length?
The aim of the present paper is to evaluate the twoindependent components of the vertical-horizontalillusion proposed by Mamassian and de Montalembert(2010), specifically ‘‘anisotropy’’ and ‘‘bisection’’ and toattempt to reconcile findings on the vertical-horizontalillusion with those on the Oppel-Kundt illusion. Severalof our experiments have used exactly the sameconfigurations as Mamassian and de Montalembert
Citation: Mikellidou, K. & Thompson, P. (2013). The vertical-horizontal illusion: Assessing the contributions of anisotropy,abutting, and crossing to the misperception of simple line stimuli. Journal of Vision, 13(8):7, 1–11, http://www.journalofvision.org/content/13/8/7, doi:10.1167/13.8.7.
Journal of Vision (2013) 13(8):7, 1–11 1http://www.journalofvision.org/content/13/8/7
doi: 10 .1167 /13 .8 .7 ISSN 1534-7362 � 2013 ARVOReceived March 07, 2013; published July 9, 2013
(2010) did in their study of the vertical-horizontalillusion, but whereas they compared the horizontal tothe vertical component with each configuration, we havealso compared the vertical or horizontal segment of oneof our stimuli with another independent line of the sameorientation. Based on results from two experiments, wepropose a new model to describe quantitatively theoverestimation of the vertical segment compared to thehorizontal in the vertical-horizontal illusion.
Furthermore, we have investigated the bisectioncomponent as described by Mamassian and deMontalembert (2010) by which the horizontal segmentof an inverted T configuration is underestimated byapproximately 16% when compared to the verticalsegment of the same configuration. Whereas theyproposed that bisection results in the underestimation ofthe bisected line, we present evidence to suggest anoverestimation of the bisecting line. Throughout thispaper Mamassian and de Montalembert (2010) will bereferred to as MdM.
Experiment 1
This experiment evaluates the ‘‘anisotropy compo-nent’’ as described by the MdM model in which the sizeof a vertical line is always overestimated whencompared to a horizontal one of the same length.
Method
Subjects
Eleven naıve participants, six female (age range 18–27), participated in the experiment. Stimuli were viewedbinocularly from a viewing distance of 57 cm.
Design
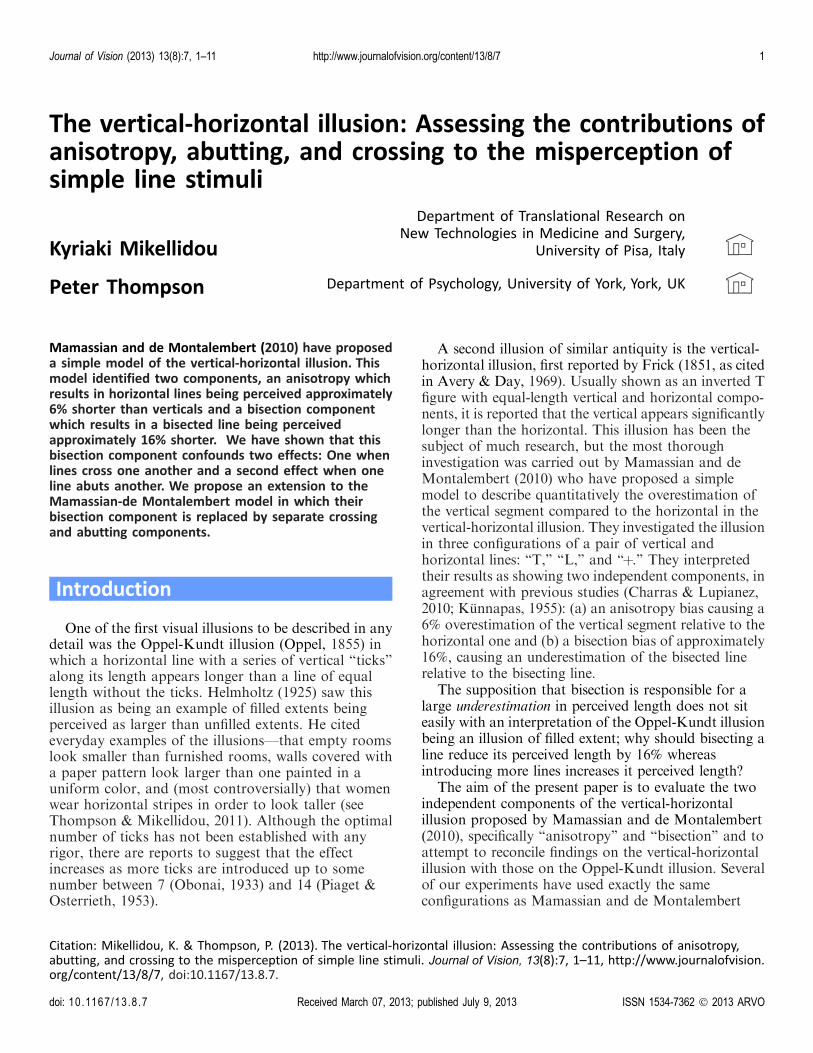
Stimuli were generated on the screen of a ClintonMonoray display with green phosphor. Two conditionswere interleaved; in one condition a horizontal and avertical line were positioned along the horizontal axis,one next to the other (see Figure 1A), and in the othercondition the two lines were positioned along thevertical axis, one above the other (see Figure 1B). Bothconditions were fully counterbalanced: in 50% of thetrials the horizontal line was acting as the standardstimulus, and the remaining 50% of the trials thevertical line was the standard stimulus. The standardstimulus in each case was 6.18 long and was comparedwith one of seven orthogonal comparator stimuli,varying in size from slightly smaller to slightly longerthan the standard. As in all subsequent experiments,the deviations from the standard length were �0.98,
�0.68, �0.38, 08, 0.38, 0.68, 0.98; thus, the length of the
comparator stimulus ranged between 5.28 and 7.08.Ninety-five percent confidence intervals were calculated
and displayed for each condition.
Each participant undertook 336 trials; eight pairs of
stimuli each presented six times for seven comparator
stimulus sizes. Participants were asked to indicate thelonger line using a response box. Stimuli were presented
simultaneously for 500ms. The lines of the stimuli were
bright green on a black background.
Stimuli
Results
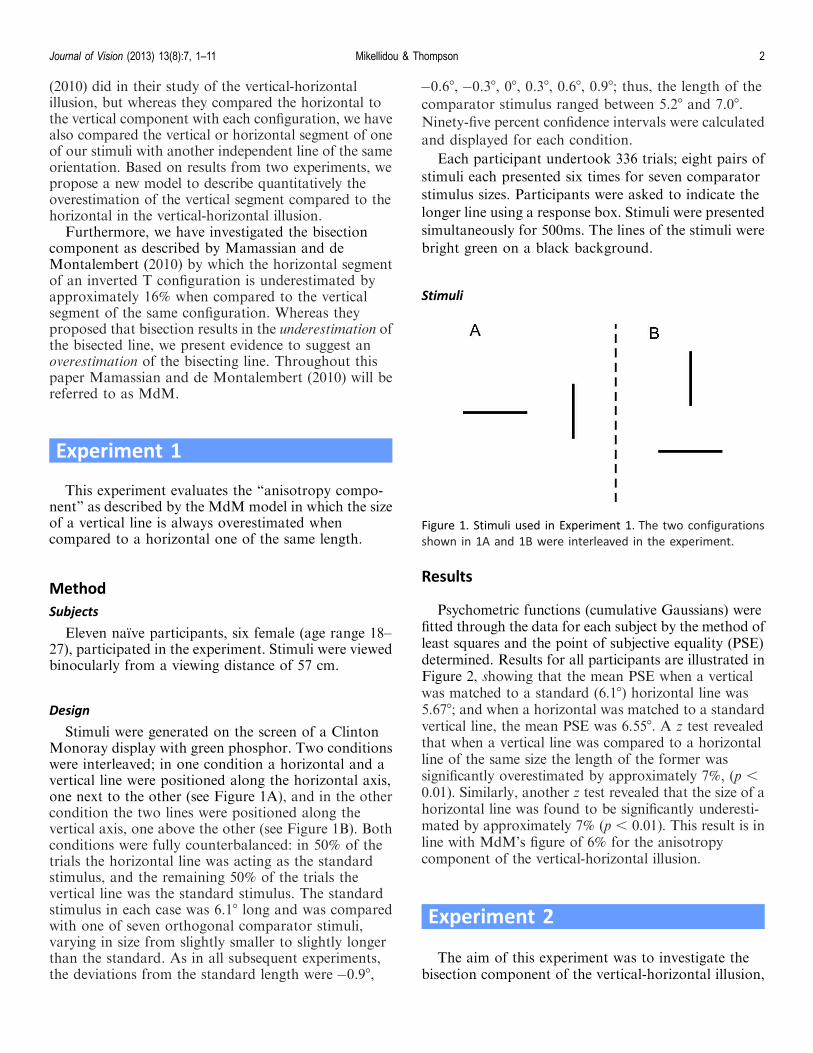
Psychometric functions (cumulative Gaussians) werefitted through the data for each subject by the method ofleast squares and the point of subjective equality (PSE)determined. Results for all participants are illustrated inFigure 2, showing that the mean PSE when a verticalwas matched to a standard (6.18) horizontal line was5.678; and when a horizontal was matched to a standardvertical line, the mean PSE was 6.558. A z test revealedthat when a vertical line was compared to a horizontalline of the same size the length of the former wassignificantly overestimated by approximately 7%, (p ,
0.01). Similarly, another z test revealed that the size of ahorizontal line was found to be significantly underesti-mated by approximately 7% (p , 0.01). This result is inline with MdM’s figure of 6% for the anisotropycomponent of the vertical-horizontal illusion.
Experiment 2
The aim of this experiment was to investigate thebisection component of the vertical-horizontal illusion,
Figure 1. Stimuli used in Experiment 1. The two configurations
shown in 1A and 1B were interleaved in the experiment.
Journal of Vision (2013) 13(8):7, 1–11 Mikellidou & Thompson 2
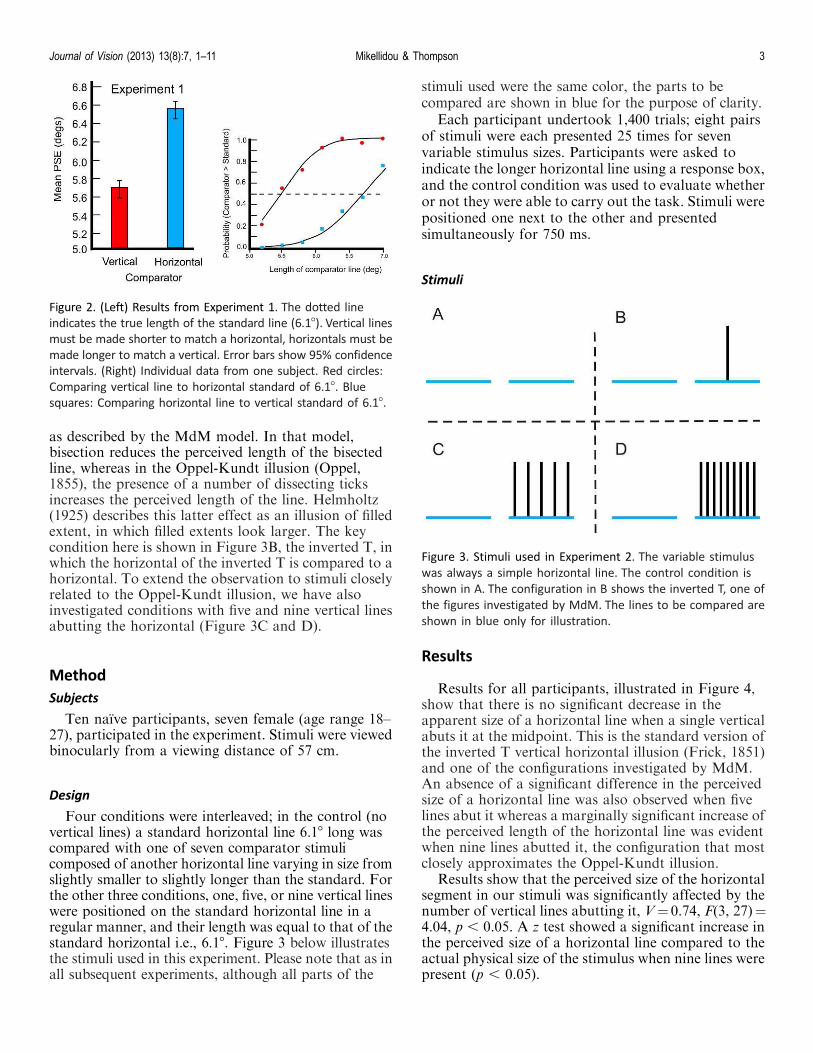
as described by the MdM model. In that model,bisection reduces the perceived length of the bisectedline, whereas in the Oppel-Kundt illusion (Oppel,1855), the presence of a number of dissecting ticksincreases the perceived length of the line. Helmholtz(1925) describes this latter effect as an illusion of filledextent, in which filled extents look larger. The keycondition here is shown in Figure 3B, the inverted T, inwhich the horizontal of the inverted T is compared to ahorizontal. To extend the observation to stimuli closelyrelated to the Oppel-Kundt illusion, we have alsoinvestigated conditions with five and nine vertical linesabutting the horizontal (Figure 3C and D).
Method
Subjects
Ten naıve participants, seven female (age range 18–27), participated in the experiment. Stimuli were viewedbinocularly from a viewing distance of 57 cm.
Design
Four conditions were interleaved; in the control (novertical lines) a standard horizontal line 6.18 long wascompared with one of seven comparator stimulicomposed of another horizontal line varying in size fromslightly smaller to slightly longer than the standard. Forthe other three conditions, one, five, or nine vertical lineswere positioned on the standard horizontal line in aregular manner, and their length was equal to that of thestandard horizontal i.e., 6.18. Figure 3 below illustratesthe stimuli used in this experiment. Please note that as inall subsequent experiments, although all parts of the
stimuli used were the same color, the parts to becompared are shown in blue for the purpose of clarity.
Each participant undertook 1,400 trials; eight pairsof stimuli were each presented 25 times for sevenvariable stimulus sizes. Participants were asked toindicate the longer horizontal line using a response box,and the control condition was used to evaluate whetheror not they were able to carry out the task. Stimuli werepositioned one next to the other and presentedsimultaneously for 750 ms.
Stimuli
Results
Results for all participants, illustrated in Figure 4,show that there is no significant decrease in theapparent size of a horizontal line when a single verticalabuts it at the midpoint. This is the standard version ofthe inverted T vertical horizontal illusion (Frick, 1851)and one of the configurations investigated by MdM.An absence of a significant difference in the perceivedsize of a horizontal line was also observed when fivelines abut it whereas a marginally significant increase ofthe perceived length of the horizontal line was evidentwhen nine lines abutted it, the configuration that mostclosely approximates the Oppel-Kundt illusion.
Results show that the perceived size of the horizontalsegment in our stimuli was significantly affected by thenumber of vertical lines abutting it, V¼ 0.74, F(3, 27)¼4.04, p , 0.05. A z test showed a significant increase inthe perceived size of a horizontal line compared to theactual physical size of the stimulus when nine lines werepresent (p , 0.05).
Figure 2. (Left) Results from Experiment 1. The dotted line
indicates the true length of the standard line (6.18). Vertical lines
must be made shorter to match a horizontal, horizontals must be
made longer to match a vertical. Error bars show 95% confidence
intervals. (Right) Individual data from one subject. Red circles:
Comparing vertical line to horizontal standard of 6.18. Blue
squares: Comparing horizontal line to vertical standard of 6.18.
Figure 3. Stimuli used in Experiment 2. The variable stimulus
was always a simple horizontal line. The control condition is
shown in A. The configuration in B shows the inverted T, one of
the figures investigated by MdM. The lines to be compared are
shown in blue only for illustration.
Journal of Vision (2013) 13(8):7, 1–11 Mikellidou & Thompson 3
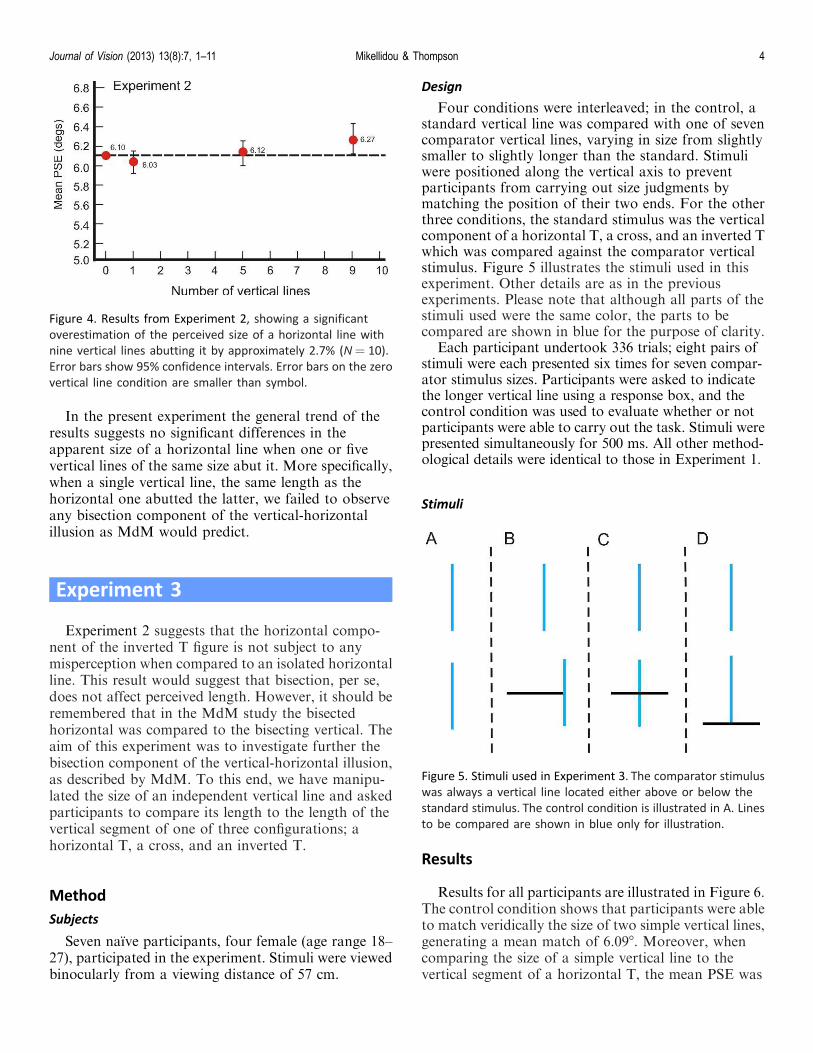
In the present experiment the general trend of theresults suggests no significant differences in theapparent size of a horizontal line when one or fivevertical lines of the same size abut it. More specifically,when a single vertical line, the same length as thehorizontal one abutted the latter, we failed to observeany bisection component of the vertical-horizontalillusion as MdM would predict.
Experiment 3
Experiment 2 suggests that the horizontal compo-nent of the inverted T figure is not subject to anymisperception when compared to an isolated horizontalline. This result would suggest that bisection, per se,does not affect perceived length. However, it should beremembered that in the MdM study the bisectedhorizontal was compared to the bisecting vertical. Theaim of this experiment was to investigate further thebisection component of the vertical-horizontal illusion,as described by MdM. To this end, we have manipu-lated the size of an independent vertical line and askedparticipants to compare its length to the length of thevertical segment of one of three configurations; ahorizontal T, a cross, and an inverted T.
Method
Subjects
Seven naıve participants, four female (age range 18–27), participated in the experiment. Stimuli were viewedbinocularly from a viewing distance of 57 cm.
Design
Four conditions were interleaved; in the control, astandard vertical line was compared with one of sevencomparator vertical lines, varying in size from slightlysmaller to slightly longer than the standard. Stimuliwere positioned along the vertical axis to preventparticipants from carrying out size judgments bymatching the position of their two ends. For the otherthree conditions, the standard stimulus was the verticalcomponent of a horizontal T, a cross, and an inverted Twhich was compared against the comparator verticalstimulus. Figure 5 illustrates the stimuli used in thisexperiment. Other details are as in the previousexperiments. Please note that although all parts of thestimuli used were the same color, the parts to becompared are shown in blue for the purpose of clarity.
Each participant undertook 336 trials; eight pairs ofstimuli were each presented six times for seven compar-ator stimulus sizes. Participants were asked to indicatethe longer vertical line using a response box, and thecontrol condition was used to evaluate whether or notparticipants were able to carry out the task. Stimuli werepresented simultaneously for 500 ms. All other method-ological details were identical to those in Experiment 1.
Stimuli
Results
Results for all participants are illustrated in Figure 6.The control condition shows that participants were ableto match veridically the size of two simple vertical lines,generating a mean match of 6.098. Moreover, whencomparing the size of a simple vertical line to thevertical segment of a horizontal T, the mean PSE was
Figure 4. Results from Experiment 2, showing a significant
overestimation of the perceived size of a horizontal line with
nine vertical lines abutting it by approximately 2.7% (N ¼ 10).
Error bars show 95% confidence intervals. Error bars on the zero
vertical line condition are smaller than symbol.
Figure 5. Stimuli used in Experiment 3. The comparator stimulus
was always a vertical line located either above or below the
standard stimulus. The control condition is illustrated in A. Lines
to be compared are shown in blue only for illustration.
Journal of Vision (2013) 13(8):7, 1–11 Mikellidou & Thompson 4
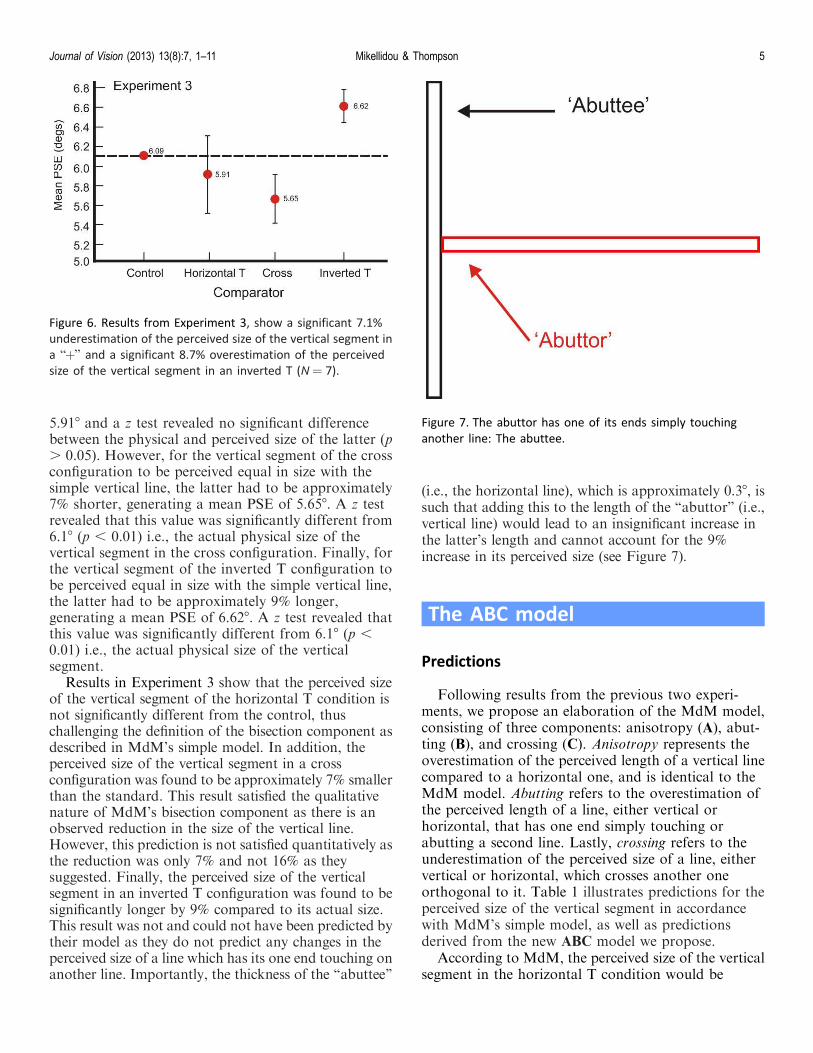
5.918 and a z test revealed no significant differencebetween the physical and perceived size of the latter (p. 0.05). However, for the vertical segment of the crossconfiguration to be perceived equal in size with thesimple vertical line, the latter had to be approximately7% shorter, generating a mean PSE of 5.658. A z testrevealed that this value was significantly different from6.18 (p , 0.01) i.e., the actual physical size of thevertical segment in the cross configuration. Finally, forthe vertical segment of the inverted T configuration tobe perceived equal in size with the simple vertical line,the latter had to be approximately 9% longer,generating a mean PSE of 6.628. A z test revealed thatthis value was significantly different from 6.18 (p ,0.01) i.e., the actual physical size of the verticalsegment.
Results in Experiment 3 show that the perceived sizeof the vertical segment of the horizontal T condition isnot significantly different from the control, thuschallenging the definition of the bisection component asdescribed in MdM’s simple model. In addition, theperceived size of the vertical segment in a crossconfiguration was found to be approximately 7% smallerthan the standard. This result satisfied the qualitativenature of MdM’s bisection component as there is anobserved reduction in the size of the vertical line.However, this prediction is not satisfied quantitatively asthe reduction was only 7% and not 16% as theysuggested. Finally, the perceived size of the verticalsegment in an inverted T configuration was found to besignificantly longer by 9% compared to its actual size.This result was not and could not have been predicted bytheir model as they do not predict any changes in theperceived size of a line which has its one end touching onanother line. Importantly, the thickness of the ‘‘abuttee’’
(i.e., the horizontal line), which is approximately 0.38, issuch that adding this to the length of the ‘‘abuttor’’ (i.e.,vertical line) would lead to an insignificant increase inthe latter’s length and cannot account for the 9%increase in its perceived size (see Figure 7).
The ABC model
Predictions
Following results from the previous two experi-ments, we propose an elaboration of the MdM model,consisting of three components: anisotropy (A), abut-ting (B), and crossing (C). Anisotropy represents theoverestimation of the perceived length of a vertical linecompared to a horizontal one, and is identical to theMdM model. Abutting refers to the overestimation ofthe perceived length of a line, either vertical orhorizontal, that has one end simply touching orabutting a second line. Lastly, crossing refers to theunderestimation of the perceived size of a line, eithervertical or horizontal, which crosses another oneorthogonal to it. Table 1 illustrates predictions for theperceived size of the vertical segment in accordancewith MdM’s simple model, as well as predictionsderived from the new ABC model we propose.
According to MdM, the perceived size of the verticalsegment in the horizontal T condition would be
Figure 6. Results from Experiment 3, show a significant 7.1%
underestimation of the perceived size of the vertical segment in
a ‘‘þ’’ and a significant 8.7% overestimation of the perceived
size of the vertical segment in an inverted T (N ¼ 7).
Figure 7. The abuttor has one of its ends simply touching
another line: The abuttee.
Journal of Vision (2013) 13(8):7, 1–11 Mikellidou & Thompson 5
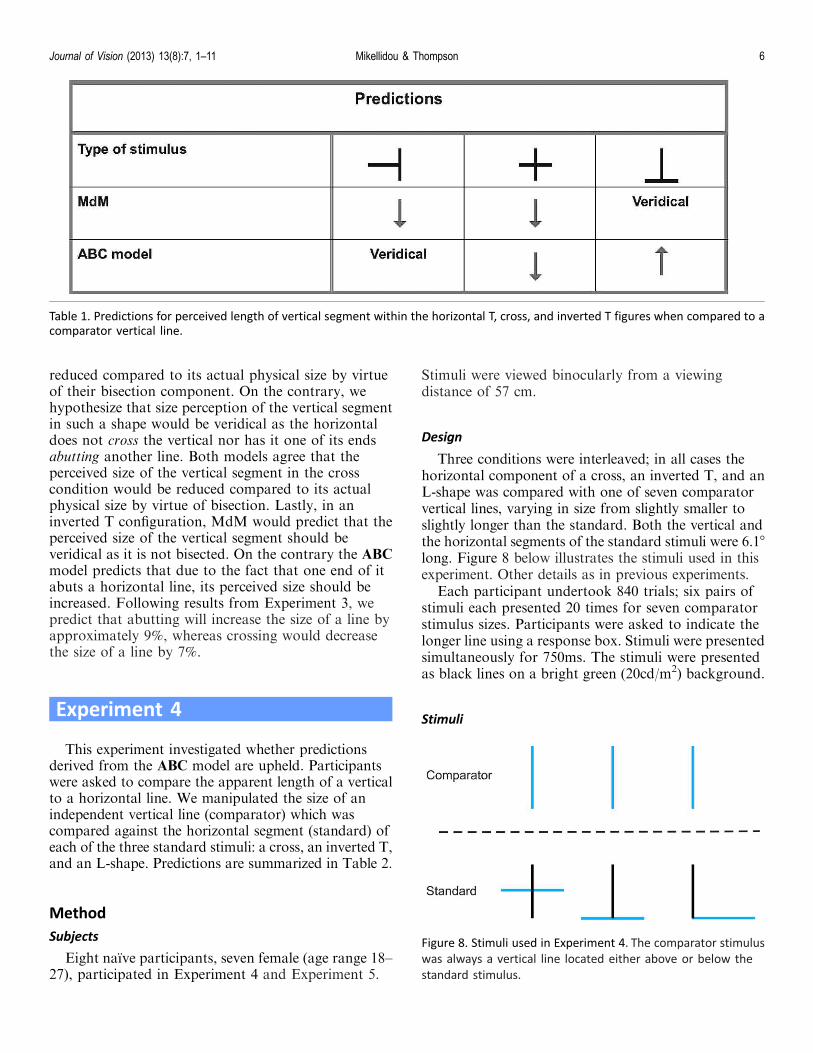
reduced compared to its actual physical size by virtueof their bisection component. On the contrary, wehypothesize that size perception of the vertical segmentin such a shape would be veridical as the horizontaldoes not cross the vertical nor has it one of its endsabutting another line. Both models agree that theperceived size of the vertical segment in the crosscondition would be reduced compared to its actualphysical size by virtue of bisection. Lastly, in aninverted T configuration, MdM would predict that theperceived size of the vertical segment should beveridical as it is not bisected. On the contrary the ABCmodel predicts that due to the fact that one end of itabuts a horizontal line, its perceived size should beincreased. Following results from Experiment 3, wepredict that abutting will increase the size of a line byapproximately 9%, whereas crossing would decreasethe size of a line by 7%.
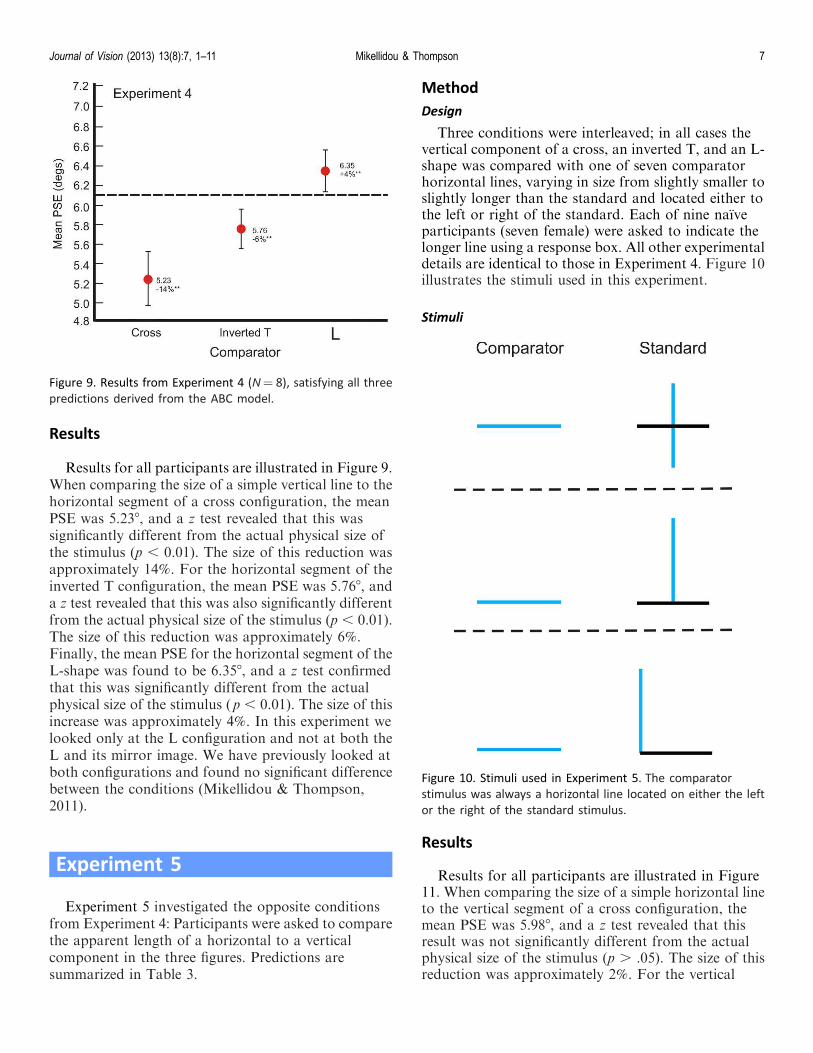
Experiment 4
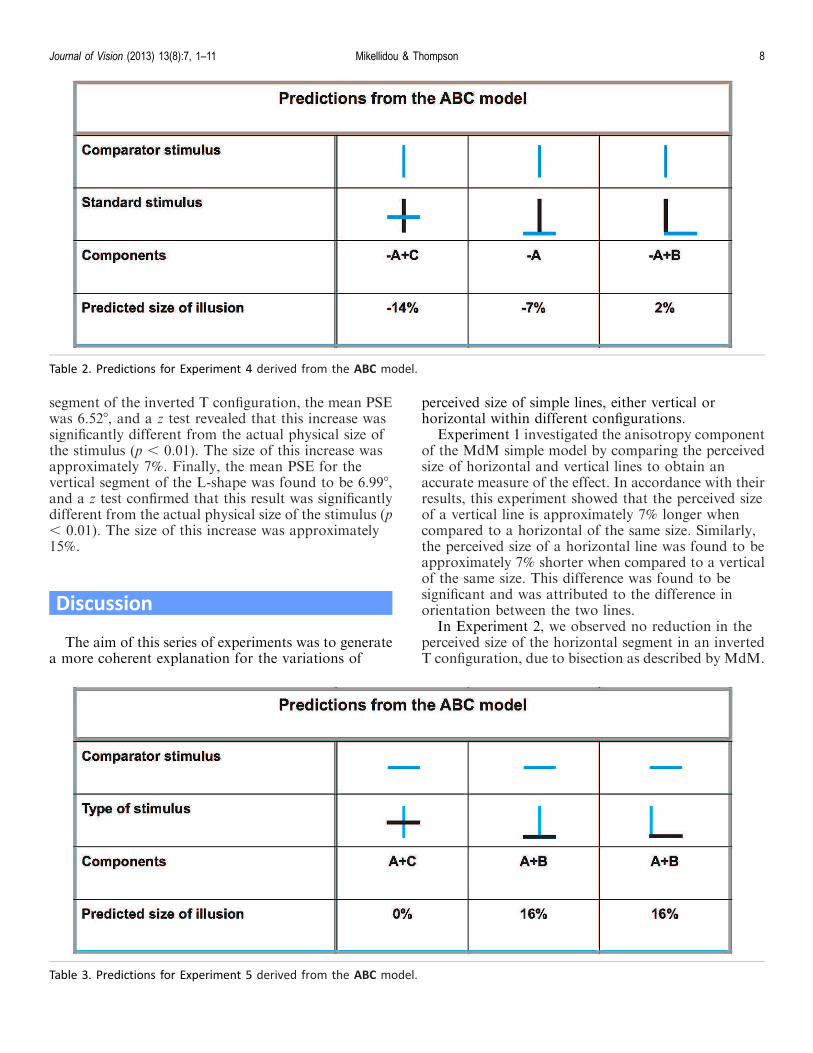
This experiment investigated whether predictionsderived from the ABC model are upheld. Participantswere asked to compare the apparent length of a verticalto a horizontal line. We manipulated the size of anindependent vertical line (comparator) which wascompared against the horizontal segment (standard) ofeach of the three standard stimuli: a cross, an inverted T,and an L-shape. Predictions are summarized in Table 2.
Method
Subjects
Eight naıve participants, seven female (age range 18–27), participated in Experiment 4 and Experiment 5.
Stimuli were viewed binocularly from a viewingdistance of 57 cm.
Design
Three conditions were interleaved; in all cases thehorizontal component of a cross, an inverted T, and anL-shape was compared with one of seven comparatorvertical lines, varying in size from slightly smaller toslightly longer than the standard. Both the vertical andthe horizontal segments of the standard stimuli were 6.18
long. Figure 8 below illustrates the stimuli used in thisexperiment. Other details as in previous experiments.
Each participant undertook 840 trials; six pairs ofstimuli each presented 20 times for seven comparatorstimulus sizes. Participants were asked to indicate thelonger line using a response box. Stimuli were presentedsimultaneously for 750ms. The stimuli were presentedas black lines on a bright green (20cd/m2) background.
Stimuli
Table 1. Predictions for perceived length of vertical segment within the horizontal T, cross, and inverted T figures when compared to acomparator vertical line.
Figure 8. Stimuli used in Experiment 4. The comparator stimulus
was always a vertical line located either above or below the
standard stimulus.
Journal of Vision (2013) 13(8):7, 1–11 Mikellidou & Thompson 6
Results
Results for all participants are illustrated in Figure 9.When comparing the size of a simple vertical line to thehorizontal segment of a cross configuration, the meanPSE was 5.238, and a z test revealed that this wassignificantly different from the actual physical size ofthe stimulus (p , 0.01). The size of this reduction wasapproximately 14%. For the horizontal segment of theinverted T configuration, the mean PSE was 5.768, anda z test revealed that this was also significantly differentfrom the actual physical size of the stimulus (p , 0.01).The size of this reduction was approximately 6%.Finally, the mean PSE for the horizontal segment of theL-shape was found to be 6.358, and a z test confirmedthat this was significantly different from the actualphysical size of the stimulus (p , 0.01). The size of thisincrease was approximately 4%. In this experiment welooked only at the L configuration and not at both theL and its mirror image. We have previously looked atboth configurations and found no significant differencebetween the conditions (Mikellidou & Thompson,2011).
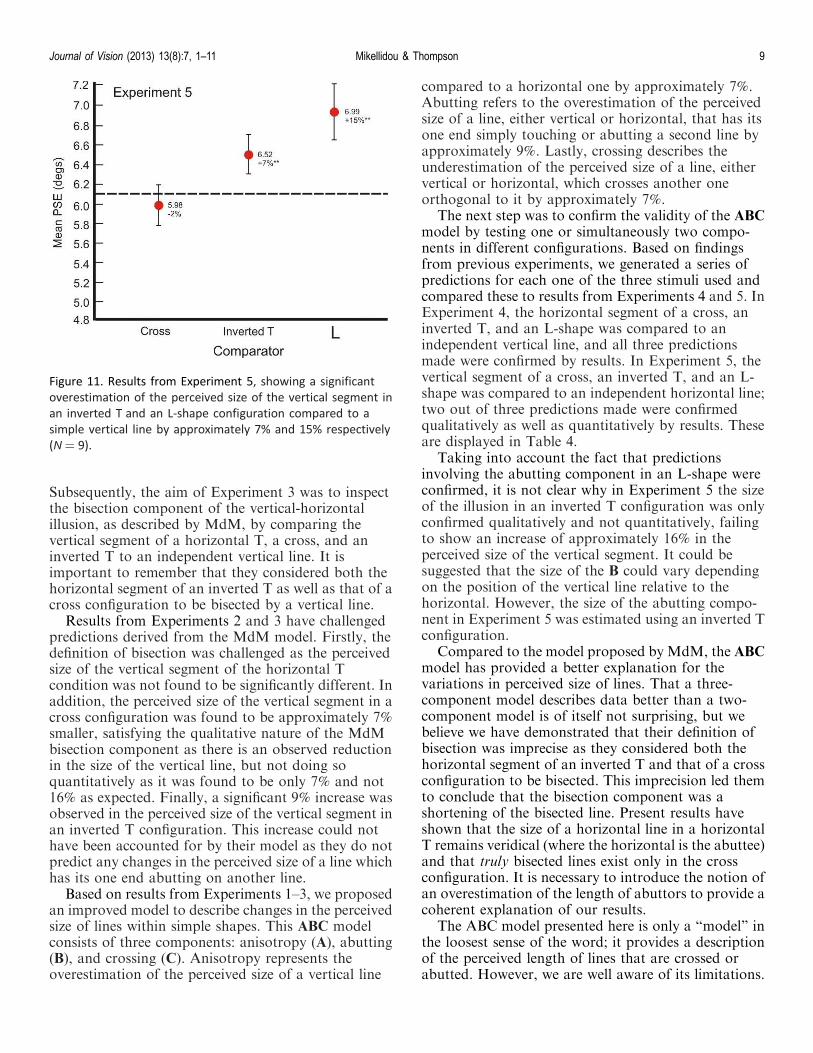
Experiment 5
Experiment 5 investigated the opposite conditionsfrom Experiment 4: Participants were asked to comparethe apparent length of a horizontal to a verticalcomponent in the three figures. Predictions aresummarized in Table 3.
Method
Design
Three conditions were interleaved; in all cases thevertical component of a cross, an inverted T, and an L-shape was compared with one of seven comparatorhorizontal lines, varying in size from slightly smaller toslightly longer than the standard and located either tothe left or right of the standard. Each of nine naıveparticipants (seven female) were asked to indicate thelonger line using a response box. All other experimentaldetails are identical to those in Experiment 4. Figure 10illustrates the stimuli used in this experiment.
Stimuli
Results
Results for all participants are illustrated in Figure11. When comparing the size of a simple horizontal lineto the vertical segment of a cross configuration, themean PSE was 5.988, and a z test revealed that thisresult was not significantly different from the actualphysical size of the stimulus (p . .05). The size of thisreduction was approximately 2%. For the vertical
Figure 9. Results from Experiment 4 (N¼ 8), satisfying all three
predictions derived from the ABC model.
Figure 10. Stimuli used in Experiment 5. The comparator
stimulus was always a horizontal line located on either the left
or the right of the standard stimulus.
Journal of Vision (2013) 13(8):7, 1–11 Mikellidou & Thompson 7
segment of the inverted T configuration, the mean PSEwas 6.528, and a z test revealed that this increase wassignificantly different from the actual physical size ofthe stimulus (p , 0.01). The size of this increase wasapproximately 7%. Finally, the mean PSE for thevertical segment of the L-shape was found to be 6.998,and a z test confirmed that this result was significantlydifferent from the actual physical size of the stimulus (p, 0.01). The size of this increase was approximately15%.
Discussion
The aim of this series of experiments was to generatea more coherent explanation for the variations of
perceived size of simple lines, either vertical orhorizontal within different configurations.
Experiment 1 investigated the anisotropy componentof the MdM simple model by comparing the perceivedsize of horizontal and vertical lines to obtain anaccurate measure of the effect. In accordance with theirresults, this experiment showed that the perceived sizeof a vertical line is approximately 7% longer whencompared to a horizontal of the same size. Similarly,the perceived size of a horizontal line was found to beapproximately 7% shorter when compared to a verticalof the same size. This difference was found to besignificant and was attributed to the difference inorientation between the two lines.
In Experiment 2, we observed no reduction in theperceived size of the horizontal segment in an invertedT configuration, due to bisection as described by MdM.
Table 3. Predictions for Experiment 5 derived from the ABC model.
Table 2. Predictions for Experiment 4 derived from the ABC model.
Journal of Vision (2013) 13(8):7, 1–11 Mikellidou & Thompson 8
Subsequently, the aim of Experiment 3 was to inspectthe bisection component of the vertical-horizontalillusion, as described by MdM, by comparing thevertical segment of a horizontal T, a cross, and aninverted T to an independent vertical line. It isimportant to remember that they considered both thehorizontal segment of an inverted T as well as that of across configuration to be bisected by a vertical line.
Results from Experiments 2 and 3 have challengedpredictions derived from the MdM model. Firstly, thedefinition of bisection was challenged as the perceivedsize of the vertical segment of the horizontal Tcondition was not found to be significantly different. Inaddition, the perceived size of the vertical segment in across configuration was found to be approximately 7%smaller, satisfying the qualitative nature of the MdMbisection component as there is an observed reductionin the size of the vertical line, but not doing soquantitatively as it was found to be only 7% and not16% as expected. Finally, a significant 9% increase wasobserved in the perceived size of the vertical segment inan inverted T configuration. This increase could nothave been accounted for by their model as they do notpredict any changes in the perceived size of a line whichhas its one end abutting on another line.
Based on results from Experiments 1–3, we proposedan improved model to describe changes in the perceivedsize of lines within simple shapes. This ABC modelconsists of three components: anisotropy (A), abutting(B), and crossing (C). Anisotropy represents theoverestimation of the perceived size of a vertical line
compared to a horizontal one by approximately 7%.Abutting refers to the overestimation of the perceivedsize of a line, either vertical or horizontal, that has itsone end simply touching or abutting a second line byapproximately 9%. Lastly, crossing describes theunderestimation of the perceived size of a line, eithervertical or horizontal, which crosses another oneorthogonal to it by approximately 7%.
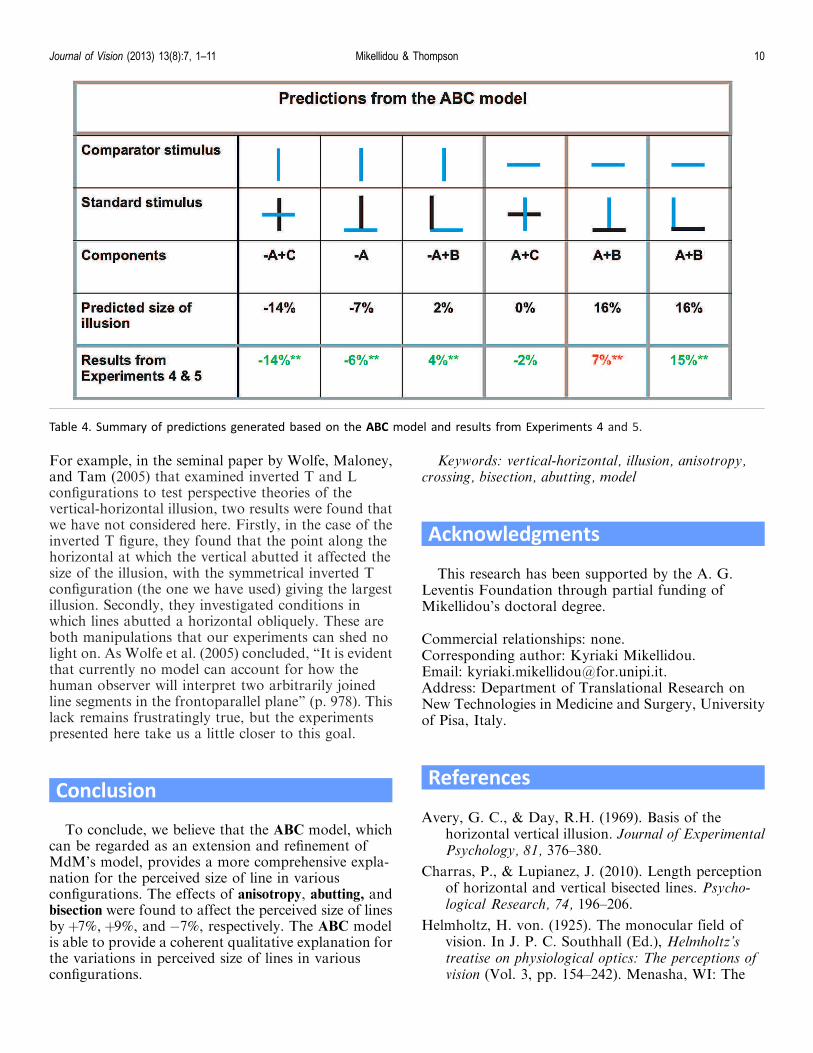
The next step was to confirm the validity of the ABCmodel by testing one or simultaneously two compo-nents in different configurations. Based on findingsfrom previous experiments, we generated a series ofpredictions for each one of the three stimuli used andcompared these to results from Experiments 4 and 5. InExperiment 4, the horizontal segment of a cross, aninverted T, and an L-shape was compared to anindependent vertical line, and all three predictionsmade were confirmed by results. In Experiment 5, thevertical segment of a cross, an inverted T, and an L-shape was compared to an independent horizontal line;two out of three predictions made were confirmedqualitatively as well as quantitatively by results. Theseare displayed in Table 4.
Taking into account the fact that predictionsinvolving the abutting component in an L-shape wereconfirmed, it is not clear why in Experiment 5 the sizeof the illusion in an inverted T configuration was onlyconfirmed qualitatively and not quantitatively, failingto show an increase of approximately 16% in theperceived size of the vertical segment. It could besuggested that the size of the B could vary dependingon the position of the vertical line relative to thehorizontal. However, the size of the abutting compo-nent in Experiment 5 was estimated using an inverted Tconfiguration.
Compared to the model proposed by MdM, the ABCmodel has provided a better explanation for thevariations in perceived size of lines. That a three-component model describes data better than a two-component model is of itself not surprising, but webelieve we have demonstrated that their definition ofbisection was imprecise as they considered both thehorizontal segment of an inverted T and that of a crossconfiguration to be bisected. This imprecision led themto conclude that the bisection component was ashortening of the bisected line. Present results haveshown that the size of a horizontal line in a horizontalT remains veridical (where the horizontal is the abuttee)and that truly bisected lines exist only in the crossconfiguration. It is necessary to introduce the notion ofan overestimation of the length of abuttors to provide acoherent explanation of our results.
The ABC model presented here is only a ‘‘model’’ inthe loosest sense of the word; it provides a descriptionof the perceived length of lines that are crossed orabutted. However, we are well aware of its limitations.
Figure 11. Results from Experiment 5, showing a significant
overestimation of the perceived size of the vertical segment in
an inverted T and an L-shape configuration compared to a
simple vertical line by approximately 7% and 15% respectively
(N ¼ 9).
Journal of Vision (2013) 13(8):7, 1–11 Mikellidou & Thompson 9
For example, in the seminal paper by Wolfe, Maloney,and Tam (2005) that examined inverted T and Lconfigurations to test perspective theories of thevertical-horizontal illusion, two results were found thatwe have not considered here. Firstly, in the case of theinverted T figure, they found that the point along thehorizontal at which the vertical abutted it affected thesize of the illusion, with the symmetrical inverted Tconfiguration (the one we have used) giving the largestillusion. Secondly, they investigated conditions inwhich lines abutted a horizontal obliquely. These areboth manipulations that our experiments can shed nolight on. As Wolfe et al. (2005) concluded, ‘‘It is evidentthat currently no model can account for how thehuman observer will interpret two arbitrarily joinedline segments in the frontoparallel plane’’ (p. 978). Thislack remains frustratingly true, but the experimentspresented here take us a little closer to this goal.
Conclusion
To conclude, we believe that the ABC model, whichcan be regarded as an extension and refinement ofMdM’s model, provides a more comprehensive expla-nation for the perceived size of line in variousconfigurations. The effects of anisotropy, abutting, andbisection were found to affect the perceived size of linesbyþ7%, þ9%, and �7%, respectively. The ABC modelis able to provide a coherent qualitative explanation forthe variations in perceived size of lines in variousconfigurations.
Keywords: vertical-horizontal, illusion, anisotropy,crossing, bisection, abutting, model
Acknowledgments
This research has been supported by the A. G.Leventis Foundation through partial funding ofMikellidou’s doctoral degree.
Commercial relationships: none.Corresponding author: Kyriaki Mikellidou.Email: [email protected]: Department of Translational Research onNew Technologies in Medicine and Surgery, Universityof Pisa, Italy.
References
Avery, G. C., & Day, R.H. (1969). Basis of thehorizontal vertical illusion. Journal of ExperimentalPsychology, 81, 376–380.
Charras, P., & Lupianez, J. (2010). Length perceptionof horizontal and vertical bisected lines. Psycho-logical Research, 74, 196–206.
Helmholtz, H. von. (1925). The monocular field ofvision. In J. P. C. Southhall (Ed.), Helmholtz’streatise on physiological optics: The perceptions ofvision (Vol. 3, pp. 154–242). Menasha, WI: The
Table 4. Summary of predictions generated based on the ABC model and results from Experiments 4 and 5.
Journal of Vision (2013) 13(8):7, 1–11 Mikellidou & Thompson 10
Optical Society of America. (Original work pub-lished 1867).
Kunnapas, T. M. (1955). An analysis of the ‘‘vertical-horizontal illusion.’’ Vision Research, 49(2), 134–160.
Mamassian, P., & de Montalembert, M. (2010). Asimple model of the vertical-horizontal illusion.Vision Research, 50(10), 956–962.
Mikellidou, K., & Thompson, P. (2011). Bisection anddissection of horizontal lines: The long and theshort of the Oppel-Kundt illusion. Journal ofVision, 11(11): 1184. [Article]
Obonai, T. (1933). Contributions to the study ofpsychophysical induction: III. Experiments on theillusions of filled space. Japanese Journal ofPsychology, 8, 699–720.
Oppel, J. J. (1855). Uber geometrisch-optische Tau-schungen [Translation: About geometric-optical
illusions]. Jahresbericht des Frankfurter Vereins,1854–1855, 37–47.
Piaget, J., & Osterrieth, P. A. (1953). Recherches sur ledeveloppement des perceptions: XVII. L’evolutionde l’illusion d’Oppel–Kundt en fonction de l’age[Translation: Research on the development ofperceptions: XVIII The evolution of the Oppel-Kundt illusion as a function of age]. Archives dePsychologie, 34, 1–38.
Thompson, P., & Mikellidou, K. (2011). Applying theHelmholtz illusion to fashion: horizontal stripeswon’t make you look fatter. i-Perception, 2(1), 69–76.
Wolfe, U., Maloney, L. T., & Tam, M. (2005).Distortions of perceived length in the frontoparallelplane: Tests of perspective theories. Perception &Psychophysics, 67, 969–979.
Journal of Vision (2013) 13(8):7, 1–11 Mikellidou & Thompson 11