Embed Size (px)
Citation preview

The verification technology for the quality and reliability of parts Kiyoharu Akimoto, Shinji Koyama
[Summary] Electronic measuring instruments are becoming lighter and smaller through increased use of ex-tremely small electrical parts, especially semiconductor and high-frequency active parts. Addi-tionally, PC boards are becoming increasingly higher count multi-layer, faster and more complex with use of multi-pole, fine-pitch internal connectors. As a consequence, it is becoming increasingly difficult to assure the reliability and quality of parts. Moreover, parts procurement has become globalized, which also increases quality risks. In these circumstances, verification of parts quality at every stage from development through to delivery is critical to assuring selection of high-reliability parts and stable quality during mass production. This article describes some effective solutions for increasing quality using structural analysis and inspection of parts.
(1)
1 Introduction
To assure the reliability of parts purchased for use in
products and improve product quality, Anritsu in April 2013
integrated the previously independent Parts Analysis Team
and the Quality Assurance Purchasing Team. As a result,
we have established a system at the product development
process for proactively evaluating parts at every stage
starting at the parts selection (Figure 1).
Figure 1 Parts Evaluation System
As we have expanded exports of electronic instruments
and food inspection systems to newly industrializing econ-
omies (NIEs), there have been an increasing number of
product issues due to poor operating environments (con-
tamination, atmospheric pollution, etc.) and inappropriate
handling.
The above-mentioned department integration has helped
develop parts’ quality verification aimed at reducing failure
risks by developing systems for selecting parts as well as
leveraging experience in parts verification. Quality verifi-
cation results are fed back to the design and production
departments, which also helps improve reliability.
2 Quality Verification System
To assure product quality and reliability, we investigated
inherent failure risks from the original parts design selec-
tion stage as an effective proactive fault prevention.
As a result, when using new parts, the product development
departments now prepare early Design Review 3 (DR3) materi-
als for parts verification and any resulting quality improve-
ments are fed back to the QA department before product release.
Figure 2 shows the quality verification system classified
into analysis of good parts during and after development,
and fault analysis after mass-production and shipping.
Figure 2 Quality Verification System
Each activity is explained below.
(1) Quality Analysis Points
Analysis of good parts is diagnostic analysis of fault risks
under normal conditions. This analysis requires highly spe-
cialized knowledge and experience as well as understanding of
manufacturing procedures. The reliability test equipment
shown in Table 1 is used to reproduce quality and reliability
aging phenomena that are then examined using the SEM,
EDX, and X-ray CT equipment described below to clarify fault
risks. Analysis of new parts is undertaken to develop coun-
termeasures for preventing part faults due to natural aging.
115

Anritsu Technical Review No.24 September 2016 The verification technology for the quality and reliability of parts
(2)
Table 1 Reliability Test Equipment
Environ-mental factors
Assumed aging Test equipment
Environ-mental aging and elapsed time aging
Temperature related aging Temperature cham-ber and dryer
Humidity related aging Temperature and humidity chamber
Sudden temperature change related aging
Thermal shock tester
Ultraviolet related aging Weather meter
Sulfide related aging Accelerated sulfura-tion aging tester
Mechanical aging
Vibration related aging Vibration tester
Mechanical shock related aging
Drop tester
For example, assuring the functions and quality of the in-
ternal patterns of mass-produced PC boards is difficult.
Consequently, we use a cross-section analysis at the design
stage to determine whether the accuracy of the internal pat-
terns of the circuit boards will be adequate and support con-
sistent quality and sufficient margin for mass production.
(2) Fault Analysis Points
Fault analysis uses a fault tree to systematically analyze
the causes and primary factors of fault phenomena, clari-
fying the true causes. Since part faults occurring at manu-
facturing and after shipment require the fastest possible
clarification of causes, causal analysis and occurrence
mechanisms are the main investigation items.
Quick countermeasures to fault occurrences are taken
based on the analysis results to minimize the spread of a
fault by correcting mass production and thereby suppress-
ing fault recurrence after shipment.
3 Main Inspection Facilities
In-house inspection equipment supports detailed fault
analysis at the lowest costs in the shortest possible time and
the results are then shared with all related departments in
near real-time.
When even more detailed analysis is required, outside
laboratories are utilized.
The following sections introduce some of the main in-
spection equipment available in our internal facility.
3.1 Scanning Electron Microscope (SEM)
Figure 3 shows the scanning electron microscope (SEM).
Materials are scanned by an electron beam generated from an
electron gun to produce an electron micrograph obtained by
detecting secondary electrons radiated from the material and
reflected as electrons. Since the SEM can magnify images up
to about 20,000 times, it is very useful for detailed examina-
tions of corrosion, cracks, internal damage, and others.
Figure 3 External View of SEM/EDX Equipment
Figure 4 shows a SEM micrograph (150x magnification) of
a solder break in a BGA, and of 40-µm tin whiskers (1500x).
Figure 4 Example of SEM Images
3.2 Energy Dispersive X-ray Spectrometry (EDX)
Energy dispersive X-ray spectrometry (EDX) scans the
test material with an electron beam from an electron gun
and X-rays (unique to the elements). Radiation from the
material is detected to give an instantaneous identification
of the composition of the elements. Since EDX uses the
same electron gun as an SEM, the procedure can be per-
formed jointly (Figure 3).
EDX can be used to identify the elements of non-organic
materials, such as metals, ceramics, etc. Figure 5 shows an
example of elemental analysis of JIS SUS304 stainless steel
with the results verifying that the material satisfies the JIS
standard.
116

Anritsu Technical Review No.24 September 2016 The verification technology for the quality and reliability of parts
(3)
Figure 5 EDX Analysis of SUS304 Stainless Material
3.3 Accelerated Sulfuration Aging Test Equipment
This test equipment shortens the time required for de-
tecting metal corrosion caused by sulfur-containing gases,
such as hydrogen sulfide (H2S) and sulfur dioxide (SO2).
Figure 6 shows the equipment.
Figure 6 Sulfuration Accelerated Aging Test Equipment
The test is performed by immersing the parts for a speci-
fied time in hot oil containing sulfur components. Section
4.5 b shows some accelerated sulfuration aging test results
for various chip resistors.
High levels of air pollution in NIEs, such as India, China,
Southeast Asian Countries, causes accelerated sulfide cor-
rosion of electronic parts. As a result, evaluation of re-
sistance to sulfurization for new parts using an active gas
tolerance index is a key design standard.
3.4 X-ray Computed Tomography (CT) Scanning
Equipment
The X-ray CT scanner provides detailed internal exami-
nations of parts by using graphical processing to assemble
cross-sectional images obtained by scanning with X-rays in
all dimensions into 3D stereoscopic images. Since the in-
ternal structure can be observed without physical damage
to the part, it is used for direct observation of damage when
investigating the validity of a structural design.
It is also useful for examining inherent faults by deter-
mining internal structures of parts that the part’s manu-
facturer does not publish. Overall, it is used for the ac-
ceptance testing of new parts and for fault analysis.
4 Parts Analysis Examples
The results of parts reliability and quality verification
tests are fed-back to the development, purchase, production,
and service departments to help with the selection of
high-quality and high-reliability parts, which is important
in preventing post-shipment aging deterioration and in
maintaining long-term parts quality. Some examples of
analysis effects are described below.
4.1 Verification of Internal Structure of Multi-layer
PC Boards
Figure 7 shows the cross-section of a multi-layer PC board.
This cross-sectioning process can be used to determine
whether the dimensional accuracy between the multi-layer
PC board patterns satisfies the design criteria. It can also
be used to evaluate deviations from the design values, and
plating quality by providing details of the internal board
structure.
The cross-sectional analysis is required when creating a
new PC board design or using a special layer configuration.
It is used in cooperation with the PC board manufacturers
to assure product reliability and quality.
Figure 7 Cross Section of Multi-layer PC Board
4.2 Analysis of Wire Bonding Breakage
RF modules have the potential to be susceptible to breaks
in the internal wiring as shown in Figure 8.
Figure 8 Wire Break
EDX Analysis Results [mass %]
Detected Elements Si Cr Mn Fe Ni
Detected Amount 0.7 17.7 0.8 73.1 7.7
117
Anritsu Technical Review No.24 September 2016 The verification technology for the quality and reliability of parts
(4)
Figure 9 shows the wire bonding at the PC board side,
comparing a good and bad process. In the bad process the
bonding tip is convex compared to concave in the good process.
Figure 9 Magnified View of Wire Bonding
Wire bonding is a 2-step connection process and wire
breaks are more likely to occur after the second bonding
step, depending on which side is done first. At the second
bonding step, the concave tip leaves a cutting scar. It would
appear that the scarring is from the first bond in bad lots,
while it is actually from the second bond.
As shown in Figure 10, in a good process, the angle of the
second bond is low helping minimize the tensile stress.
Figure 10 Schematic of Good Lot
Conversely, in a bad process, as shown in Figure 11, the
angle of the wire is high from the first bond to the second
bond. As a result, the base of the first bond is subjected to
high tensile stress, causing the wire clip to potentially
break.
Figure 11 Schematic of Faulty Lot
Sharing these break analysis results with manufacturers
has helped stabilize quality by standardizing on the wire
bonding sequence.
Wire bonding is widely used in RF assemblies, and this
process has been spread throughout the industry as a pre-
ferred wire bonding method.
4.3 Analysis of Electrostatic Damage to Semicon-
ductor Switch
As circuit traces become smaller due to the trend towards
using lower voltages, immunity to high-voltage electrostatic
discharge (ESD) is becoming lower and more ICs are suf-
fering ESD damage. Figure 12 shows an example of using
SEM for analysis of damage caused by ESD.
Figure 12 ESD Break in IC Chip (SEM)
Trace breaks and cracks in various layers can be discov-
ered by opening the IC package and scanning with a SEM.
Due to the extremely microscopic damage, we generally be-
lieve that this damage is caused by ESD, and this type of
damage is also increasingly present in high-frequency
modules. As a countermeasure to this increase in damage
from ESD, we have not only established an in-house in-
spection system but are also perfecting inspection by ex-
ternal agencies, manufacturers, and others.
4.4 Sulfuration Analysis of Thick-Film Chip Resistors
Silver is commonly used for internal electrodes of
thick-film chip resistors, but silver is easily corroded by
atmospheric gases containing sulfur. Formation of silver
sulfide (AgS) causes growth of AgS crystals with a needle
like (whisker) form, depleting the electrode silver content
and also causing short circuits. (Figure 13).
Figure 13 Cross-Section of Thick-Film Chip Resistor
118

Anritsu Technical Review No.24 September 2016 The verification technology for the quality and reliability of parts
(5)
Figure 14 shows silver whiskers growing on a thick film
chip resistor.
Figure 14 Silver Sulfide Crystal Formation (SEM)
An analysis using EDX (See Table 2 below) confirmed the
presence of Ag and S in the parts and confirmed the exist-
ence of sulfide corrosion.
Table 2 Needle Crystal EDX Analysis Results [mass %]
C O Si S Ag Sn Total
Contaminant 16.5 13.2 3.6 9.3 51.7 5.7 100.0
4.5 Accelerated Sulfuration Test Effect on Chip
Resistors
The accelerated sulfuration test described in section 3.3
can be used to estimate the part’s reliability from prede-
termined acceleration factors. Figure 15 shows examples for
various types of chip resistor.
Figure15 Accelerated Sulfuration Resistance Test
We are also promoting the same evaluations for standard
parts other than chip resistors with feed-back of the results
to design departments.
4.6 Power Supply Unit (PSU) Corrosion Analysis
Using EDX
Since the power supply unit in electrical equipment gen-
erates heat, ventilating cooling fans are used to disperse
this heat. However, the ventilation air moved by the fans
also pulls in dust and dirt, which can cause faults. Figure 16
shows an example of a failed PSU contaminated by dust and
corrosion. The picture shows a large volume of accumulated
dust between the choke coil and PC board. EDX analysis of
this dust (Table 3) confirms the presence of high chlorine
(Cl) levels.
Figure 16 Internal View of PSU
Table 3 EDX Analysis Results of Coil Dust Contaminant [mass %]
Na Mg Al Si S Cl K Ca Fe
Dust Contaminant
12.0 2.3 4.9 11.4 8.0 15.6 4.6 29.0 12.2
This corrosion is due to the presence of Cl in the dust and
humidity in the ventilation air. Dusty and contaminated
atmospheric air is common in NIEs where these faults are
becoming increasingly common. As a countermeasure, spec-
ifying protective dust filters and PC board coatings at the
design stage is effective, and parts manufacturers are being
urged to use these countermeasures for their production as
well.
4.7 Safety Verification of an AC Adapter DC Plug
Insulation Plastics Using EDX
Insulation plastics include red phosphorus, which can
cause insulation aging. When the insulation plastic of DC
plugs of AC adapters ages, there is a high risk of shorting
between the external and internal electrodes, which may
cause a fire. Figure 17 shows the internal structure of these
plugs.
Figure 17 DC Plug Internal Structure
119
Anritsu Technical Review No.24 September 2016 The verification technology for the quality and reliability of parts
(6)
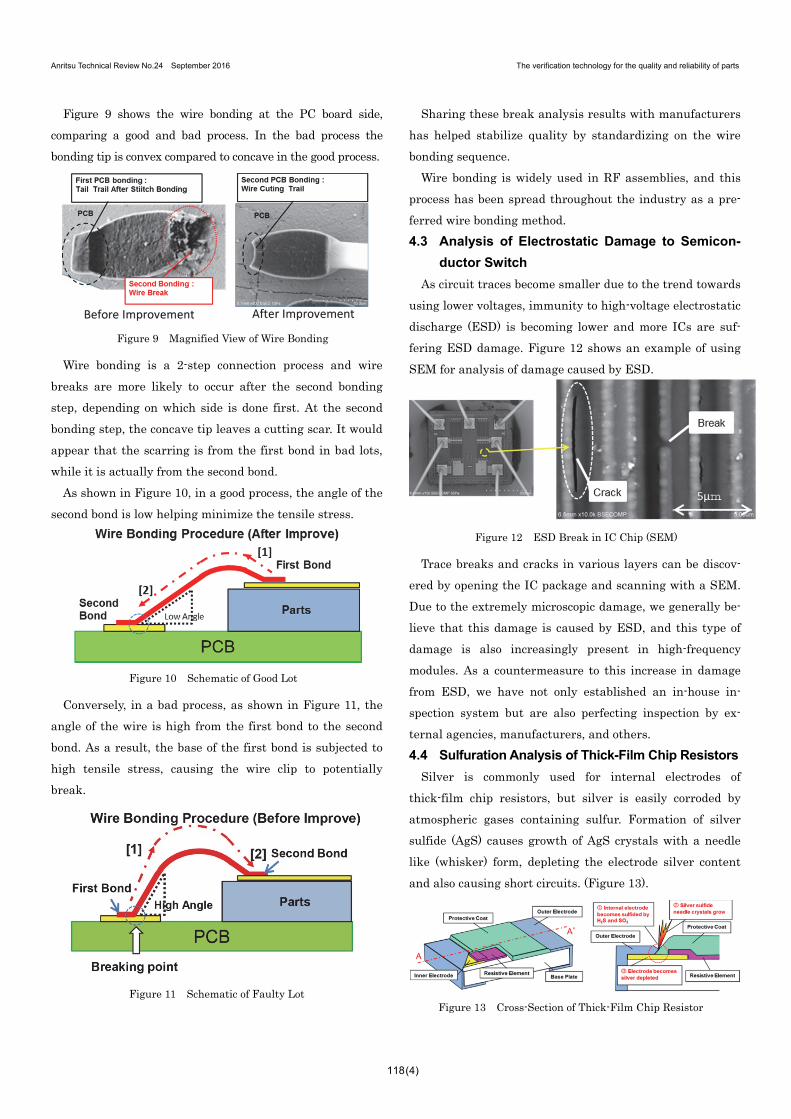
An EDX analysis can provide information about the pres-
ence of red phosphorus. The results of the following EDX
analysis for red phosphorus (Table 4) in the insulation mate-
rials of a connector show that no phosphorus (P) is present.
Table 4 EDX Analysis Results of DC Plug Insulation Plastics
[mass %]
C O Si Ca Cu Zn Br Sb Total
Insulation 58.2 29.5 2.2 1.2 1.5 0.5 5.8 1.2 100.0
4.8 Internal Analysis of DC/DC Converter
Reflowing of solder during the Printed Circuit Board as-
sembly process causes Ball Grid Array electrodes that are in
contact with the internal structural parts to suffer failure
risk if the pattern is crushed and shorted by the weight of
the part.
This can be analyzed using an industrial X-ray CT scanner.
Figure 18 shows a magnified view of the BGA electrode con-
nections. To avoid high-risk faults, parts with structural sta-
bility are used, helping prevent failures.
Figure 18 Magnified X-ray CT Scan
This issue has been observed in DC to DC converters,
where it is important to use X-ray scanning equipment for
internal inspections at the design stage.
4.9 High-Density Multi-pole Connector Contact
Fault Analysis
Analysis of connector contact structures has the following
problems:
• Inability to observe contact structure to confirm good or
bad contact conditions from outside the connector
• When disconnecting the connector, the contact returns to
the original state as a result of the spring action, prevent-
ing observation of a fault condition.
It has been shown that X-ray CT scanning equipment plays
a vital role in revealing the causes of connection failure in
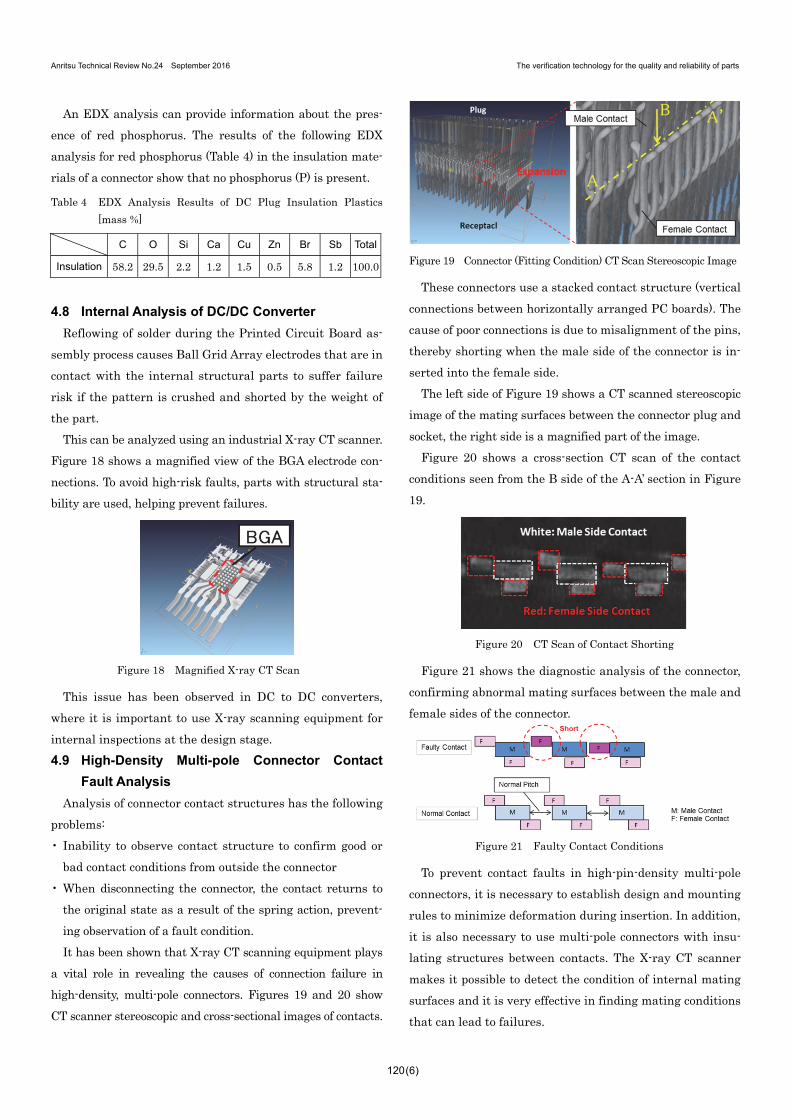
high-density, multi-pole connectors. Figures 19 and 20 show
CT scanner stereoscopic and cross-sectional images of contacts.
Figure 19 Connector (Fitting Condition) CT Scan Stereoscopic Image
These connectors use a stacked contact structure (vertical
connections between horizontally arranged PC boards). The
cause of poor connections is due to misalignment of the pins,
thereby shorting when the male side of the connector is in-
serted into the female side.
The left side of Figure 19 shows a CT scanned stereoscopic
image of the mating surfaces between the connector plug and
socket, the right side is a magnified part of the image.
Figure 20 shows a cross-section CT scan of the contact
conditions seen from the B side of the A-A’ section in Figure
19.
Figure 20 CT Scan of Contact Shorting
Figure 21 shows the diagnostic analysis of the connector,
confirming abnormal mating surfaces between the male and
female sides of the connector.
Figure 21 Faulty Contact Conditions
To prevent contact faults in high-pin-density multi-pole
connectors, it is necessary to establish design and mounting
rules to minimize deformation during insertion. In addition,
it is also necessary to use multi-pole connectors with insu-
lating structures between contacts. The X-ray CT scanner
makes it possible to detect the condition of internal mating
surfaces and it is very effective in finding mating conditions
that can lead to failures.
120
Anritsu Technical Review No.24 September 2016 The verification technology for the quality and reliability of parts
(7)
5 Summary
The materials, structures and fabrication processes for
increasingly small and diverse parts are undergoing a
technological revolution, increasing the need for higher lev-
els of analysis and inspection technologies. Consequently,
understanding the fine detail of internal parts structures
and developing high-reliability test methods are urgent
problems to solve for manufacturers.
Anritsu’s has made a large investment in equipment and
expertise to ensure that parts and products are of the highest
quality and reliability. Our inspection activities are focused
on continuing to deliver materials and parts inspection ser-
vice guides using our in-house Web services, as well as on
building an easily searchable database of materials surveys
that can be shared to implement pre-inspections before risks
can occur.
We are continuing to build systems and processes cover-
ing a wide range of activities ensuring quality at every stage
from design to production and ensuring highly reliable
products.
Authors
Kiyoharu Akimoto Global Sourcing Team Global Procurement Operation Div.
Shinji Koyama Global Sourcing Team Global Procurement Operation Div.
Publicly available
121