Embed Size (px)
Citation preview
Honts, Handler, Shaw, Gougler
Polygraph, 2015, Volume 44 (1) 62
The Vasomotor Response in the Comparison Question Test
Charles R. Honts1, Mark Handler1, Pam Shaw2 and Mike Gougler2
Abstract We tested an algorithm-based assessment tool for measuring vasomotor responses generated with a photoelectric plethysmograph in a mock crime laboratory experiment. Ten students completing their basic polygraph training participated in the study as examiners and as test subjects. Forty examinations were conducted and analyzed. Empirical Scoring System (ESS, Nelson et al., 2011) scores for the vasomotor response significantly predicted guilt and innocence and were more strongly correlated with the Guilt Criterion than were blood pressure and respiration. Discriminant analysis of our data produced a three-variable solution ordering the predictors (strongest first), electrodermal, vasomotor, and blood pressure. Respiration did not contribute significantly to the solution and was not included in the model. On N - 1 cross validation, our discriminant analysis model correctly classified 92.5% of the examinations. These results are consistent with a large body of research that shows the vasomotor response to be a valuable contribution to physiological deception detection. Examiners are urged to adopt its use. Keywords: vasomotor response, photoelectric plethysmograph, finger pulse amplitude, directed-lie comparison test. The Vasomotor Response in the Comparison Question Test For over 50 years researchers studied the vasomotor response as a predictive measure in deception detection (for early examples see, Kubis, 1962; Podlesny & Raskin, 1978). Typically the vasomotor response is measured with a photo-electric plethysmograph placed on a finger or thumb. Finger pulse amplitude (FPA, high-pass filter) and finger blood volume (unfiltered) measures of vasomotor activity (Podlesny and Raskin, 1978) were both examined with finger pulse amplitude generally having been shown to be the stronger and more easily scored measure (Kircher, 1983).
Measures of the vasomotor response provided statistically significant discrimina-tion between guilty and innocent subjects in a number of previous studies of the comparison question test (Barland & Raskin, 1975; Honts, Amato & Gordon, 2000; Honts & Reavy, 2015; Horowitz, Kircher, Honts &
Raskin, 1997; Kircher & Raskin, 1988, Kircher, Packard, Bell & Bernhardt, 2005; Kubis, 1962; Podlesny & Raskin, 1978; Rovner, 1986; Raskin & Hare, 1978; Raskin & Kircher, 1990). In Kircher and Raskin (1988) the finger pulse amplitude measurement (FPA) produced a stronger correlation with guilt (.60) than did relative blood pressure (.53) and respiration (.57). Honts, Amato & Gordon (2000) reported the correlation of vasomotor numerical scores with criterion (guilt and innocence) to be 0.51, which was the same as for blood pressure. Kircher et al., (2005) reported similar FPA and blood pressure correlations for probable-lie tests (.43 versus .42). For directed-lie tests, the FPA correlation exceeded that of the blood pressure (.44 versus .31). More recently, Honts & Reavy (2015) reported that the vasomotor correlation with the criterion (.45) exceeded correlations for blood pressure (.41) and respiration (.24) and approached that of the electrodermal response (.48). Podlesny & Truslow (1993) is the only peer-reviewed
1Honts, Handler, and Hartwig, LLC 2National Polygraph Academy
The Vasomotor Response In The Comparison Question Test
Polygraph, 2015, Volume 44 (1) 63
published study we could find that did not report a significant effect for at least one feature of the vasomotor response Bell, Raskin, Honts, and Kircher (1999) and Handler (2006) describe the Utah Scoring System criteria for the FPA. The FPA criteria require visually assessing the relative differences of decrease in FPA and the duration of that decrease between relevant and comparison questions. However, a measure of vasomotor activity is not included in the test data analysis (TDA) used by the U.S. Federal Government programs (Department of Defense, 2006). The Federal program is used as a model for a number of other American Polygraph Association accredited training programs.
The vast majority of the currently available data show that adopting the FPA criteria in the numerical scoring process improves the discrimination of the truthful and deceptive in comparison question tests. What is not known is why there is resistance in the polygraph profession to incorporating the FPA criteria into numerical scoring evaluations. One reason may be a concern for the reliability of evaluating the FPA criteria due to possible subjectivity in using the scoring criteria. Trying to separate similar amplitude changes and durations might be difficult for some examiners, especially when they are new to polygraph. For this reason we sought to develop and evaluate an algorithmic assessment tool to reliably index differences in FPA reactions between questions. Thus one goal of the present study was to provide examiners with a highly reliable and easy to use means of comparing responses in their vasomotor recordings.
Method
Participants
A cohort of ten polygraph examiner trainees participated in this study as both examiner and test subject. Participants were in their tenth week (the last week) of instruction at a polygraph school accredited by the American Polygraph Association. Participation in the study was voluntary. Refusal to participate had no effect on the employment, performance grades, or training status of the participants. Nine of the ten
participants were experienced law enforcement investigators with an average of more than 19 years in policing. The remaining participant had completed an undergraduate degree in social and behavioral sciences and was a retired probation officer with 27 years’ experience. Eight of the participants were male. Participant ages ranged from 33 to 61, with a mean of 44.5 years.
Apparatus
The student examiners used four Lafayette Instrument Company LX-5000 and one LX-4000 computerized polygraph instruments. Thoracic and abdominal respiration was measured using standard sealed rubber pneumograph systems. Electrodermal activity (EDA) was measured as skin resistance using stainless steel electrodes attached to the distal phalanges of the left or right first and third fingers. Relative blood pressure was measured using a cuff placed on the subject’s forearm or upper arm opposite from the EDA measurement. Finger pulse amplitude was measured with a photoelectric plethysmograph placed on the subject’s left or right middle fingertip (on whichever hand was used to collect the EDA). A sensor located in the seat of the subject chair monitored movement activity.
The second author worked with
hardware and software engineers from Lafayette Instrument Company (Lafayette, IN) to improve the plethysmograph and develop the vasomotor assessment tool we evaluated in this project. The time windows for the assessment tool were developed from research findings reported by Podlesny & Raskin (1978) and Rovner (1986). The plethysmograph used in this experiment was a Lafayette Instrument Company (Lafayette, IN) model 76604A-5L with an infrared LED bulb emitting at 950 nanometers. The electronic signal from the phototransistor was AC-coupled with a high pass filter with a cutoff of 0.5 Hz and a low pass filter with a cutoff of 10 Hz before outputting the vasomotor waveform (Finger Pulse Amplitude) for visual inspection. The raw data from the phototransistor were sampled at 30 samples per second and output to the computer
Honts, Handler, Shaw, Gougler
Polygraph, 2015, Volume 44 (1) 64
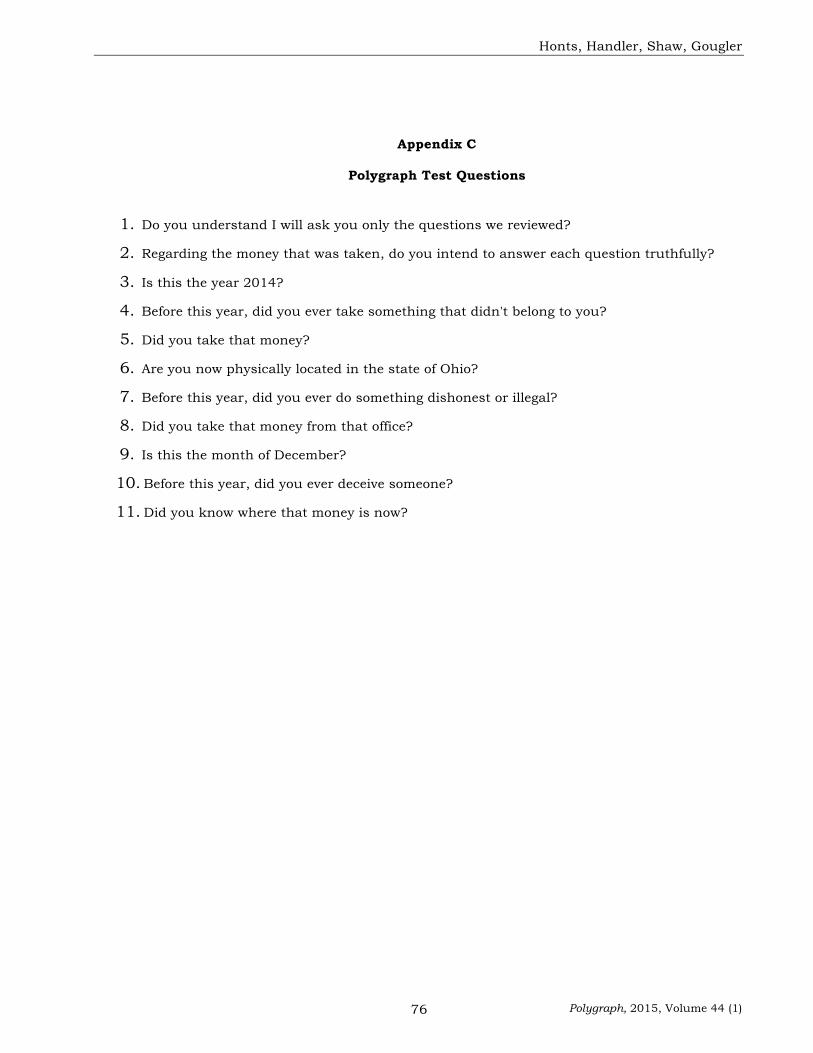
assessment tool for the virtual plot. For the virtual plot, the average amplitude measured for five seconds through ten seconds post-stimulus is divided by the average amplitude measured for three seconds pre-stimulus through stimulus onset to produce a “response ratio”. After a question sequence is collected, the resulting response ratios are plotted so that a higher point indicates a larger response. The examiner then looks at the height of the response ratios of the comparative relevant and comparison questions to determine the score. The response ratio “points” are placed at the stimulus onset by convention. A visibly higher point indicates a greater reduction in amplitude to the test question. See Appendix D for a sample of the virtual plot and Appendix E for an example of the display from the comparable software available with Stoelting instruments.
Procedure
The design of this study for data collection was a simple two-condition, Guilty and Innocent mock crime experiment. The design was implemented using a variation of a mock crime scenario developed at the University of Utah (Podlesny & Raskin, 1978). Upon being called to an office designated by the school director, participants were asked to select one of ten envelopes. The ten envelopes had one of five guilty assignment letters (Appendix A) and five innocent assignment letters (Appendix B). Student examiners were given the option to not participate in the study and could select an alternative means of completing the practical assignment, though none opted out.
Half the participants (Innocent) were instructed to drop off an envelope contained in their selected envelope to a mailbox in a busy office area. They were told they were not to steal anything and if they could produce non-deceptive results on a series of polygraph examinations they would be placed in the running for ten extra points on their final exam grade. Participants were also cautioned against attempting to affect the results of their test by using countermeasures. They were informed that two experienced reviewers would inspect the
charts they produced and if the reviewers agreed the subject used countermeasures they would lose 20 points from their final examination grade. (See Appendix A for Innocent Instructions.)
Other participants (Guilty) received instructions that assigned them to steal an envelope from the same busy office area without getting caught. There was a $20 bill inside the envelope the guilty participants “stole” and they were instructed to keep that bill on them for the remainder of the experiment and the school director would collect the bill at the conclusion of the experiment. They too were offered a ten point final examination grade incentive for producing non-deceptive test results. Guilty participants were given the same countermeasures warning the innocent subjects received. (See Appendix B for Guilty Instructions.)
A confederate surreptitiously monitored the actions of the innocent and guilty participants. All participants completed their assigned tasks without incident. Over the course of the next two days, each subject tested four of his or her classmates. The testing schedule was arranged for each student examiner to test two innocent and two guilty subjects, though the order was randomized to help hide their status. Upon reporting for testing, each student examiner followed a standard Utah comparison question test protocol (Raskin & Honts, 2002). The school director assigned each test subject to an examiner who began by collecting some information on the test subject’s general health, hours of sleep from the night before, and whether they had eaten on the day of the examination. Participants were told that money had been stolen from an office and all participants denied stealing the money. The student examiners asked each test subject to described their activities in the school building, including the office from where the money was stolen.
Next the student examiners explained the function of each sensor and gave the subject an overview of the testing process, including that they might experience some discomfort as a result of the pressure in the blood pressure cuff. Each test subject then
The Vasomotor Response In The Comparison Question Test
Polygraph, 2015, Volume 44 (1) 65
signed a waiver consenting to placement of the components and testing was then continued. Each subject was then given a practice examination to acquaint them with the testing procedures and all subjects were given positive feedback on their practice test performance (Kircher et al., 2001). The practice examination was a known solution examination where the subject wrote the number 3 on a piece of paper with pre-printed numbers 1, 2, 4 and 5. Then the examiner asked them “Regarding the number you wrote on that paper, was it the number 1?”and continued through the number 5.
Data were collected using a single-issue three relevant question examination following the Utah protocol (Raskin & Honts, 2002). The examinations were conducted with Directed-Lie comparison questions (DLC). All examinations consisted of five repetitions of the questions with data recording (see Appendix C for questions and subjects’ answers). After each data collection, the examiner released the pressure in the cuff and gave the subject about one minute of rest before adding air and collecting the next chart. After data for five repetitions were collected, the examiner removed the components and dismissed the test subject. Each student took four examinations (with one exception for a student with an excused medical absence one day who was replaced with another student programmed with the same criterion state). Half the examinations were randomly programmed guilty and a total of 40 examinations were collected. The school director or a senior instructor reviewed all data for correct collection procedures. One student examiner was asked to repeat an examination because the pretest was insufficient and did not conform to standard practices. The inadequate examination was not included in our study data analyses.
After all the data were collected the student examiners scored the tests they conducted. Their recorded results were scanned and kept as part of their school record. The individual examinations were anonymized and emailed to an experienced examiner who was aware of the approximate
base rate but unaware of any subjects’ assignment. The experienced examiner had displayed proficiency in numerical scoring in several prior experiments, including one where FPA was evaluated (Honts & Reavy, 2015). The experienced examiner analyzed the data using the ESS for the respiration, EDA and cardio components and used the vasomotor assessment tool the FPA score for 36 of the 40 examinations. One student used an LX-4000 and did not identify the auxiliary port to which the plethysmograph was connected. This resulted in a loss of vasomotor assessment tool data for four exams. In those cases, the experienced examiner scored the plethysmograph component visually. FPA scores were assigned with the standard ESS three-point scale, -1, 0, +1. The experienced examiner entered all scores into an Excel (Microsoft, 2013) spreadsheet and sent that spreadsheet to the school director (third author). The school director then sent the experienced examiner’s scores and the individual testing and criterion assignment to the first author for analysis.
Results
Since the vasomotor responses in four examinations were scored using the Utah numerical scoring criteria rather than the newly developed vasomotor scoring tool, we ran an initial analysis to see if there were significant differences between total vasomotor scores generated by the tool and the Utah scoring. A Guilt (Guilty, Innocent) X Method (Utah, Tool) ANOVA of the total vasomotor scores produced no significant effects involving the Method variable. The main effect of Guilt was significant, F(1, 36) = 9.88, p = .003, ηp2 = 0.215.
Numerical Scores
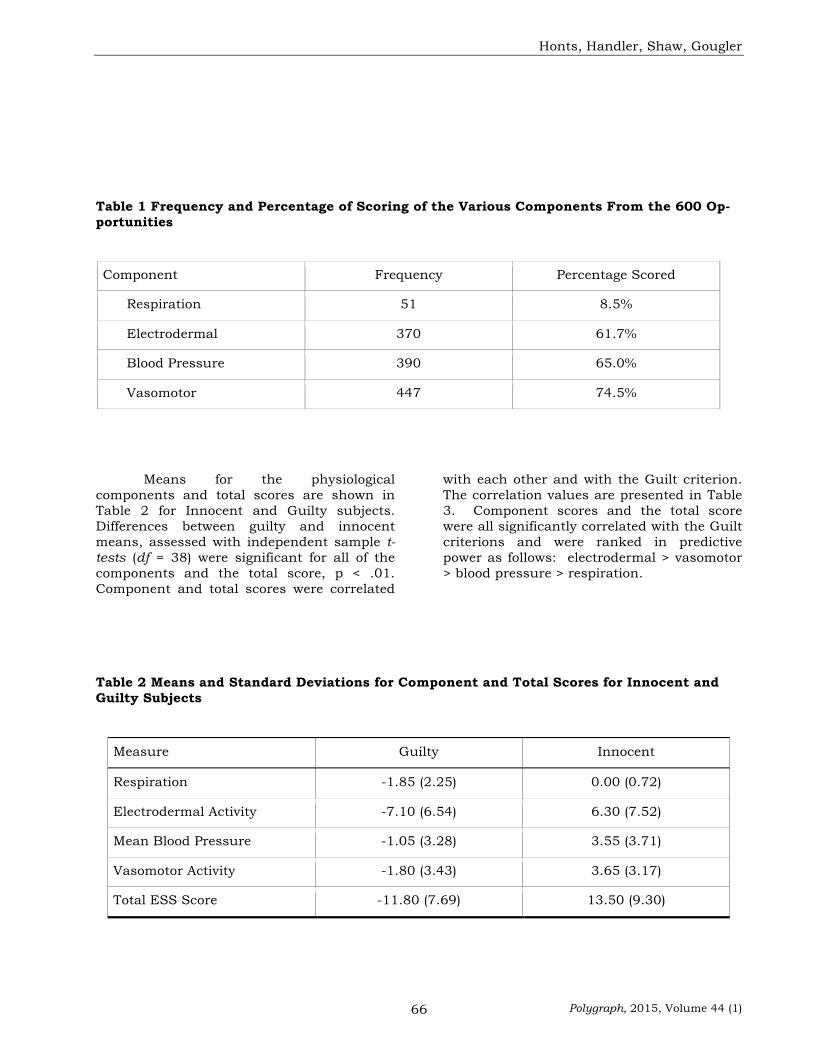
With 40 examinations, five question repetitions, and three relevant questions, there were 600 possible occasions to assign a numerical score in each of the components. The rate of assigning scores is shown in Table 1. Vasomotor response were scored the most and respiration responses the least
.
Honts, Handler, Shaw, Gougler
Polygraph, 2015, Volume 44 (1) 66
Table 1 Frequency and Percentage of Scoring of the Various Components From the 600 Op-portunities
Component Frequency Percentage Scored
Respiration 51 8.5%
Electrodermal 370 61.7%
Blood Pressure 390 65.0%
Vasomotor 447 74.5%
Means for the physiological components and total scores are shown in Table 2 for Innocent and Guilty subjects. Differences between guilty and innocent means, assessed with independent sample t-tests (df = 38) were significant for all of the components and the total score, p < .01. Component and total scores were correlated
with each other and with the Guilt criterion. The correlation values are presented in Table 3. Component scores and the total score were all significantly correlated with the Guilt criterions and were ranked in predictive power as follows: electrodermal > vasomotor > blood pressure > respiration.
Table 2 Means and Standard Deviations for Component and Total Scores for Innocent and Guilty Subjects
Measure Guilty Innocent
Respiration -1.85 (2.25) 0.00 (0.72)
Electrodermal Activity -7.10 (6.54) 6.30 (7.52)
Mean Blood Pressure -1.05 (3.28) 3.55 (3.71)
Vasomotor Activity -1.80 (3.43) 3.65 (3.17)
Total ESS Score -11.80 (7.69) 13.50 (9.30)
The Vasomotor Response In The Comparison Question Test
Polygraph, 2015, Volume 44 (1) 67
Table 3 Correlation of Component and Total Scores with Guilt
Measure Respiration Electrodermal Blood Pres-sure
Vasomotor Total
Electrodermal 0.41b
Blood Pres-sure
0.25 0.37a
Vasomotor 0.22 0.44b 0.35a
Total 0.52b 0.91b 0.64b 0.68b
Guilt 0.49b 0.70b 0.56b 0.65b 0.84b
a p < .05 b p < .01
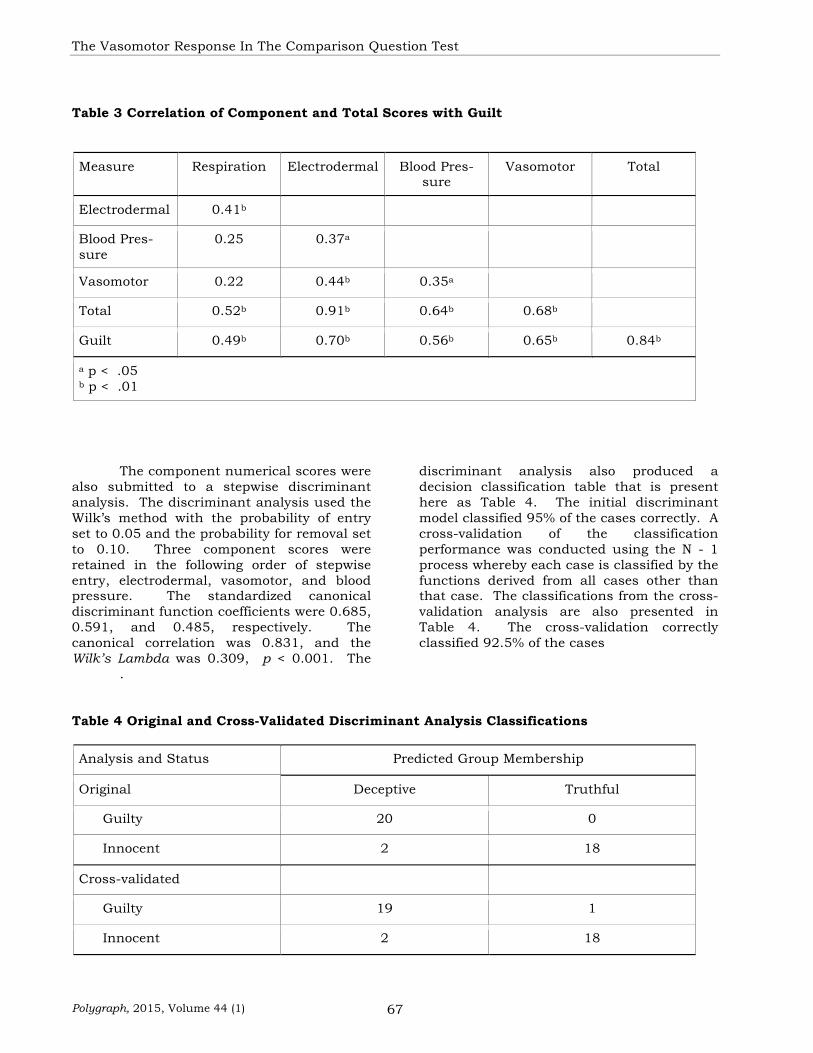
The component numerical scores were also submitted to a stepwise discriminant analysis. The discriminant analysis used the Wilk’s method with the probability of entry set to 0.05 and the probability for removal set to 0.10. Three component scores were retained in the following order of stepwise entry, electrodermal, vasomotor, and blood pressure. The standardized canonical discriminant function coefficients were 0.685, 0.591, and 0.485, respectively. The canonical correlation was 0.831, and the Wilk’s Lambda was 0.309, p < 0.001. The
discriminant analysis also produced a decision classification table that is present here as Table 4. The initial discriminant model classified 95% of the cases correctly. A cross-validation of the classification performance was conducted using the N - 1 process whereby each case is classified by the functions derived from all cases other than that case. The classifications from the cross-validation analysis are also presented in Table 4. The cross-validation correctly classified 92.5% of the cases
.
Table 4 Original and Cross-Validated Discriminant Analysis Classifications
Analysis and Status Predicted Group Membership
Original Deceptive Truthful
Guilty 20 0
Innocent 2 18
Cross-validated
Guilty 19 1
Innocent 2 18
Honts, Handler, Shaw, Gougler
Polygraph, 2015, Volume 44 (1) 68
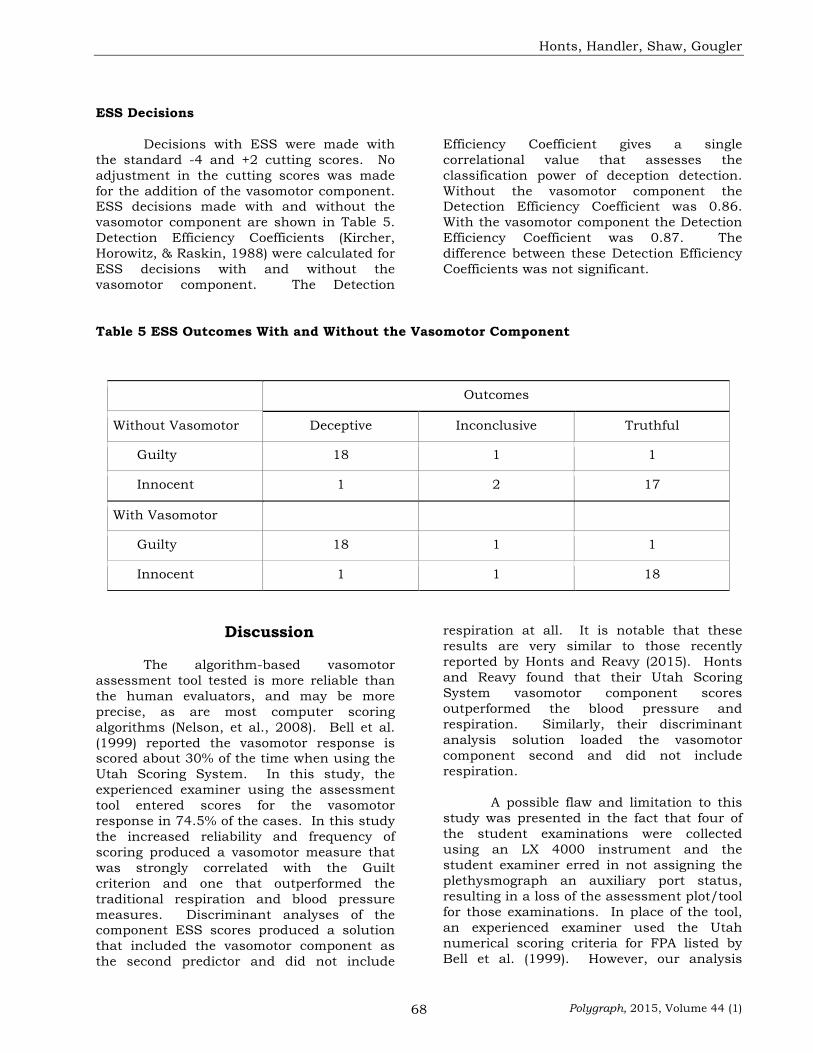
ESS Decisions Decisions with ESS were made with
the standard -4 and +2 cutting scores. No adjustment in the cutting scores was made for the addition of the vasomotor component. ESS decisions made with and without the vasomotor component are shown in Table 5. Detection Efficiency Coefficients (Kircher, Horowitz, & Raskin, 1988) were calculated for ESS decisions with and without the vasomotor component. The Detection
Efficiency Coefficient gives a single correlational value that assesses the classification power of deception detection. Without the vasomotor component the Detection Efficiency Coefficient was 0.86. With the vasomotor component the Detection Efficiency Coefficient was 0.87. The difference between these Detection Efficiency Coefficients was not significant.
Table 5 ESS Outcomes With and Without the Vasomotor Component
Discussion The algorithm-based vasomotor
assessment tool tested is more reliable than the human evaluators, and may be more precise, as are most computer scoring algorithms (Nelson, et al., 2008). Bell et al. (1999) reported the vasomotor response is scored about 30% of the time when using the Utah Scoring System. In this study, the experienced examiner using the assessment tool entered scores for the vasomotor response in 74.5% of the cases. In this study the increased reliability and frequency of scoring produced a vasomotor measure that was strongly correlated with the Guilt criterion and one that outperformed the traditional respiration and blood pressure measures. Discriminant analyses of the component ESS scores produced a solution that included the vasomotor component as the second predictor and did not include
respiration at all. It is notable that these results are very similar to those recently reported by Honts and Reavy (2015). Honts and Reavy found that their Utah Scoring System vasomotor component scores outperformed the blood pressure and respiration. Similarly, their discriminant analysis solution loaded the vasomotor component second and did not include respiration.
A possible flaw and limitation to this study was presented in the fact that four of the student examinations were collected using an LX 4000 instrument and the student examiner erred in not assigning the plethysmograph an auxiliary port status, resulting in a loss of the assessment plot/tool for those examinations. In place of the tool, an experienced examiner used the Utah numerical scoring criteria for FPA listed by Bell et al. (1999). However, our analysis
Outcomes
Without Vasomotor Deceptive Inconclusive Truthful
Guilty 18 1 1
Innocent 1 2 17
With Vasomotor
Guilty 18 1 1
Innocent 1 1 18
The Vasomotor Response In The Comparison Question Test
Polygraph, 2015, Volume 44 (1) 69
failed to find any significant differences between the vasomotor scores generated with the Utah Scoring system and those scores generated with that assessment tool. Moreover, our results are very similar to those obtained by Honts and Reavy (2015) who used only the Utah Scoring System.
In this study the experienced examiner was familiar with the hardware and software of the assessment tool and recognized how artifacts might adversely affect the reaction ratio. When the experienced examiner noted artifacts in the pre or post-stimulus visual waveform, those data were excluded from consideration. If the unusable data were from a comparison question, the experienced examiner used the nearest comparison question that was without artifact. If the artifact was in a relevant question the experienced examiner scored it by assigning the value of zero. It is uncertain how well the assessment tool would work without training on data collection and artifacts. Additionally, it is not known how the repeated testing of individuals within this study affected the test data. Little work in test-retest reliability exists, though perhaps this scenario offers opportunity to fill in the knowledge gap. In this study serving as a subject in multiple tests seems to have had little impact on the accuracy of the examinations, as that accuracy was very high. Moreover, the results of this study were very similar to Honts and Reavy (2015) who used naive subjects recruited from the general community.
Finally, it is unknown how the inclusion of the vasomotor scores might affect the published reference distributions used to develop the ESS cutting scores. The ESS has published p-values for subtotal and grand total scores that were derived without the vasomotor component score. Since the ESS is being taught at many polygraph seminars and schools it would be important to know if, and how, these plethysmograph scores affect the distributions. We made no adjustments here and achieved high performance, but the generalizability of our findings should be established through replication with other subject populations.
One additional finding in this study is worth noting. Honts and Handler (2014) addressed the issue of numerically evaluating respiration in directed-lie tests. They reviewed the literature and concluded that the available data supported scoring respiration as normal when directed-lie comparison questions were used. This study employed directed lies and significant correlations with the guilt criterion were obtained with the ESS scores from the respiration component that was scored with the standard ESS rules. While the stepwise discriminant model did not include respiration, this should not be taken as an indication that respiration should not be evaluated. The lack of inclusion of respiration in the stepwise discriminant analysis indicates that after the other three variables were entered, respiration did not significantly improve the accuracy of the model. The original model was already classifying 95% of the subjects correctly. Thus the ability of the statistical model to improve more was limited by approaching the ceiling on accuracy. Respiration produced a significant and substantial correlation with the guilt criterion of 0.49. That correlation is a strong indication that respiration is a valuable measure for scoring. Thus, these results provide additional evidence to support the Honts & Handler’s (2014) recommendation that the respiration component be scored as normal with the Utah or the ESS criteria and rules.
Conclusion
The results of this study provide general support for the effectiveness of the algorithm-based assessment tool we tested. The vasomotor scores derived using the assessment tool strongly correlated with the Guilt criterion and outperformed the traditional blood pressure and respiration components. These results are consistent with the large body of research supporting the use of the vasomotor response for deception detection. In total this body of scientific studies provides strong support for the use of the vasomotor response in field application.
Honts, Handler, Shaw, Gougler
Polygraph, 2015, Volume 44 (1) 70
References
Barland, G. H., & Raskin, D. C. (1975). An evaluation of field techniques in detection of deception. Psychophysiology, 12, 321-330.
Bell, B. G., Raskin, D. C., Honts, C. R., & Kircher, J. C. (1999). The Utah numerical scoring system. Polygraph, 28, 1-9.
Department of Defense (2006). Federal Psychophysiological Detection of Deception Examiner Handbook. Retrieved from http://www.antipolygraph.org/documents/federal-polygraph-handbook-02-10-2006.pdf on 3-31-2007. Reprinted in Polygraph, 40(1), 2-66.
Handler, M.D. (2006). Utah Probable Lie Comparison Test. Polygraph 35 (3), 139-148.
Honts, C. R., Amato, S., & Gordon, A. (2000). Validity of outside-issue questions in the control ques-tion test: Final report on grant no. N00014-98-1-0725. Submitted to the Office of Naval Re-search and the Department of Defense Polygraph Institute. Applied Cognition Research In-stitute, Boise State University. DTIC# ADA376666.
Honts, C.R. & Handler, M., (2014) Scoring Respiration When Using Directed Lie Comparison Questions, Polygraph, 43 (3).
Honts, C. R., & Reavy, R., (2015). The comparison question polygraph test: A contrast of methods and scoring. Manuscript revised and resubmitted.
Horowitz, S. W., Kircher, J. C., Honts, C. R., & Raskin, D. C. (1997). The role of comparison ques-tions in physiological detection of deception. Psychophysiology, 34, 108-115.
Kircher, J.C. (1983). Computerized decision-making and patterns of activation in the detection of de-ception. Unpublished doctoral dissertation, University of Utah, Salt Lake City.
Kircher, J. C., Horowitz, S. W. & Raskin, D. C. (1988). Meta-analysis of mock crime studies of the control question polygraph technique. Law and Human Behavior, 12, 79-90.
Kircher, J. C., Packard, T., Bell, B. G., & Bernhardt, P. C. (2001). Effects of prior demonstrations of polygraph accuracy on outcomes of probable-lie and directed-lie polygraph tests. Polygraph 39, 22–67.Kircher, J. C., & Raskin, D. C. (1988). Human versus computerized evaluations of polygraph data in a laboratory setting. Journal of Applied Psychology, 73, 291-302.
Kubis, J.F. 1962 Studies in Lie Detection: Computer Feasibility Considerations. RADC-TR 62-205, Contract AF 30(602)-2270. Air Force Systems Command, U.S. Air Force, Griffiss Air Force Base. New York: Rome Air Development Center.
Nelson, R., Krapohl, D. & Handler, M. (2008). Brute force comparison: A Monte Carlo study of the Objective Scoring System version 3 (OSS-3) and human polygraph scorers. Polygraph, 37, 185-215.
Nelson, R. Handler, M. Shaw, P., Gougler, M., Blalock, B., Russell, C., Cushman, B., & Oelrich, M. (2011). Using the Empirical Scoring System, Polygraph, 40 (2).
Podlesny, J. A., & Raskin, D. C. (1978). Effectiveness of techniques and physiological measures in the detection of deception. Psychophysiology, 15, 344-358.
The Vasomotor Response In The Comparison Question Test
Polygraph, 2015, Volume 44 (1) 71
Podlesny, J. A., & Truslow, C. M. (1993). Validity of an expanded-issue (modified general question) polygraph technique in a simulated distributed-crime-roles context. Journal of Applied Psychology, 78, 788-797.
Raskin, D. C. & Hare, R.D. (1978). Psychopathy and detection of deception in a prison population. Psychophysiology, 15, 126-136.
Raskin, D.C. & Honts, C.R. (2002). The comparison question test. In M. Kleiner (Ed.), Handbook of polygraph testing. London: Academic (1-49).
Raskin, D. C. & Kircher, J. C. (1990). Development of a computerized polygraph system and physiological measures for detection of deception and countermeasures: A pilot study (Contract 88-L55300-000). Salt Lake City: Scientific Assessment Technologies.
Rovner, L. I. (1986). The accuracy of physiological detection of deception for subjects with prior knowledge. Polygraph, 15, 1-39.
Honts, Handler, Shaw, Gougler
Polygraph, 2015, Volume 44 (1) 72
Appendix A. Instructions, Innocent Condition
By now you have agreed to be a participant in this study.
There are different conditions in this study. These instructions will tell you about your role in the experiment.
Your condition assignment was made on a random basis, and you actually chose it with the envelope you selected.
None of the polygraph examiners know whether you will be telling the truth during the poly-graph examinations. Do not tell them!
You have been selected to be in the innocent condition.
Please read these instructions carefully and make sure that you understand exactly what you are to do. Reread these instructions if necessary. You may make a few notes to help you remem-ber what to do as you carry out these instructions - there are writing materials on the desk for you.
This is a polygraph, or psychophysiological detection of deception experiment. About half of the subjects in the experiment are instructed to commit a theft. They are to go to a room and steal some money from an envelope. Then they report back for a polygraph examination. If they are found innocent on the test, they are placed in a pool for a considerable bonus on their final exami-nation grade - in addition to earning required class credit during their participation in the experi-ment.
You are not one of those subjects. You are not to steal anything. Your mission, if you choose to accept it, will be to drop off an envelope (located in this packet) in the staff mailbox slot labeled “Pallante” inside the door of the Academy Personnel Office (along the hallway leading to the cafete-ria) in the Ohio State Highway Patrol Academy Building.
You are an innocent suspect. But you too can receive a chance for the bonus by being found innocent on the polygraph examination. The bonus, in addition to the class credit you will receive for participating in this experiment, is ten points added to your final examination grade. The inno-cent student scoring the highest truthful average scores will receive ten extra points added to their final examination grade. Therefore, it is in your best interest to be truthful during the test and de-ny having anything to do with the theft of the money. It is also in your best interest to produce truthful charts without attempting to defeat or distort the test in any manner.
Two experienced polygraph examiners will scrutinize each examination, looking for evidence of countermeasure activity. Any examination deemed suspicious by the evaluators will result in a loss of twenty points from the final examination grade of the test subject. So while it is in your best interest to appear truthful and pass the test, you are highly discouraged from cheating while act-ing as a test subject. Acts of cheating will be dealt with as violations of the school’s honor code - this includes revealing your status to any other student or instructor until allowed to do so.
Before you leave this room, check the time. You have 5 minutes to complete this task. Do not return early. If you finish early, wait until the 5 minutes are up, and then return to the room you are in now, and wait until someone comes for you.
You will be given a series of tests by fellow student polygraph examiners. The examiners will not know if you are innocent or guilty of the theft, which is why you will be treated as though you are a suspect. This is so that the decision can be made entirely on the results of the polygraph
The Vasomotor Response In The Comparison Question Test
Polygraph, 2015, Volume 44 (1) 73
test. Remember, you will be in the OSHP Academy Building delivering an envelope to the staff mailbox slot labeled “Pallante, but you won't see money or steal anything. You could easily give yourself away by accidentally revealing any other details, so please maintain your innocence wise-ly. Remember that revealing your status before completion of the project will ruin the project, disquali-fy you and possibly result in disciplinary action for violating the honor code.
You will be eligible to receive the bonus only if the examiner finds you innocent and your aver-age score is the highest truthful score. So you must actually convince the examiner and evaluator of your innocence. If either the examiner or evaluator decides that you are deceptive (or cannot determine whether you are deceptive or innocent) you will not be eligible to receive the bonus.
Those are your instructions. You must follow those instructions exactly to be eligible for the bonus and to receive credit for participation. If you do not wish to participate in this experiment, please inform the school director and you will be assigned an equivalent amount of practical work over the weekend before graduation. If you are not entirely sure of what to do, reread the instruc-tions.
Tear up the written script you are reading now and dispose of it in the trashcan in this room before you leave.
Once you leave this room, you should return in exactly 5 minutes, not sooner, and not later. That is it. Good luck with the examinations.

Honts, Handler, Shaw, Gougler
Polygraph, 2015, Volume 44 (1) 74
Appendix B. Instructions Guilty Condition
By now you have agreed to be a participant in this study.
There are different conditions in this study and these instructions will tell you about your role in the experiment.
Your condition assignment was made on a random basis, and you actually chose it with the envelope you selected.
None of the polygraph examiners know whether you will be telling the truth on the polygraph examination.
You have been selected to be in the deceptive condition.
Please read to these instructions carefully and make sure that you understand exactly what you are to do. Reread these instructions if necessary. You may make a few notes to help you re-member what to do as you carry out these instructions. There are writing materials on the desk for you.
This is a polygraph, or psychophysiological detection of deception experiment. Because you are in the deceptive condition, you will steal an envelope containing money from the Ohio State High-way Patrol Academy Building. You will then be given a series of polygraph examinations. If you can “beat the polygraphs” by appearing innocent on that tests, you will be eligible for a substantial bonus in the form of points added to your final examination grade. Also you will receive the re-quired credit towards your graduation for participating in the experiment.
Your mission, if you choose to accept it, is as follows: You will go to the Academy Personnel Of-fice (along the hallway leading to the cafeteria) of the OSHP Academy Building and remove the en-velope from the mailbox labeled “Pallante”. That envelope is addressed to Sam Stone. You will ver-ify its contents. Take the contents out of the envelope and conceal it on your person. You can hide it in your wallet or in any of your pockets, but do not put it in your shoe or in your sock. Tear the envelope up and dispose of it in any trashcan. If you are found Innocent on the polygraph ex-amination, you will be placed in the running for ten extra points added to your final examination score. The guilty student who produces the highest average truthful score will receive an extra ten points on his or her final examination grade.
WARNING- Two experienced polygraph examiners will scrutinize each examination, look-ing for evidence of countermeasure activity. Any examination deemed suspicious by the evaluators will result in a loss of twenty points from the final examination grade of the test subject. So while it is in your best interest to appear truthful and pass the test, you are highly discouraged from cheating while acting as a test subject. Acts of cheating will be dealt with as violations of the school’s honor code. This includes revealing your status to any other student or instructor until allowed to do so.
You must return the money from the envelope when the polygraph experiment is completed, only after you are told to do so. Be careful not to leave any fingerprints, and be sure to dispose of the envelope where it will not be found. It is extremely important that you steal the money without alerting anyone to the theft. For example, since the Academy Personnel Office is a faculty office area, be sure to have your alibi ready in case someone asks you what you are doing.
You are not, and I repeat, not to tell anyone that you are participating in an experiment. YOU DO NOT WANT TO GET CAUGHT COMMITTING THIS CRIME so be prepared to do this mission in a discrete fashion. If you do get caught please call Pam Shaw or Mike Gougler immediately. None
The Vasomotor Response In The Comparison Question Test
Polygraph, 2015, Volume 44 (1) 75
of the academy staff knows we are conducting this experiment and any theft discovered may ap-pear real.
Before you leave this room, check the time. You have 5 minutes to complete your theft once you leave. Do not return early. If you finish early, wait until the 5 minutes are up, and then re-turn to the room you are in now, and wait until someone comes for you.
You will be given a number of examinations by student polygraph examiners. The examiners will be testing you about the theft of the missing money, and he or she will not know if you are in-nocent or guilty of the theft because about half of the subjects in the experiment have not commit-ted the theft. This is so that the decision can be made entirely on the results of the polygraph test. Do not make the examiner suspicious when he or she is interviewing you during the initial portion of the test. Your alibi is to tell the examiner you were in the OSHP Building delivering an envelope to Pallante’s mailbox, but that you never saw money or stole anything. You could easily give your-self away by accidentally revealing any other details, so please maintain your innocence wisely.
So, when the polygraph examiners ask you questions or details about the theft, you must not only deny knowing anything other than that, but you must do so sincerely so that he or she does not be-come suspicious. If at some point during the test you think you blew it, do not give up.
You will receive the bonus only if the evaluating examiner finds you innocent and you have the top truthful scores from the guilty group. So you must actually convince the examiner that you are innocent. If the examiner decides that you are deceptive (or cannot determine whether you are deceptive or innocent) you will not be eligible to receive the bonus.
Those are your instructions. You must follow those instructions exactly to be eligible for the bonus points. If you do not wish to participate in this experiment, please inform Pam Shaw. She will arrange alternative course time over the weekend before graduation to make up for not participating in this study. If you are not entirely sure of what you are to do, reread the in-structions until you are sure.
Tear up the written script you are reading now and dispose of it in the trashcan in this room before you leave.
Once you leave this room, you should return in exactly 5 minutes, not sooner, and not later. That is it. Good luck with the examination.
Honts, Handler, Shaw, Gougler
Polygraph, 2015, Volume 44 (1) 76
Appendix C
Polygraph Test Questions
1. Do you understand I will ask you only the questions we reviewed?
2. Regarding the money that was taken, do you intend to answer each question truthfully?
3. Is this the year 2014?
4. Before this year, did you ever take something that didn't belong to you?
5. Did you take that money?
6. Are you now physically located in the state of Ohio?
7. Before this year, did you ever do something dishonest or illegal?
8. Did you take that money from that office?
9. Is this the month of December?
10. Before this year, did you ever deceive someone?
11. Did you know where that money is now?
The Vasomotor Response In The Comparison Question Test
Polygraph, 2015, Volume 44 (1) 77
Appendix D
Lafayette Instrument Vasomotor Assessment Tool Example
When using the Lafayette Instrument Company software LXSoftware 11.4 or greater a “virtual trace” default-labeled PA can be plotted upon completion of the test chart. Using average ampli-tude for pre and post stimulus times described above, the software plots a relative reaction ratio point at the beginning of each stimulus. The reaction ratio is calculated by dividing the post stim-ulus data by the pre stimulus data and plotting the ratio so the higher of two points reflects a rela-tive greater degree of pulse amplitude suppression, or greater reaction. The points are connected by lines to allow the reviewer to assess differences in height. In the above example the plotted point for 2R1 is lower than either of the comparative points at 1C2 or 2C1 so there was greater re-action at the comparison questions. The scores for each relevant question and the rationale are written in for convenience. PLE scores in ESS are either 0, +1, or -1.
Honts, Handler, Shaw, Gougler
Polygraph, 2015, Volume 44 (1) 78
Appendix E
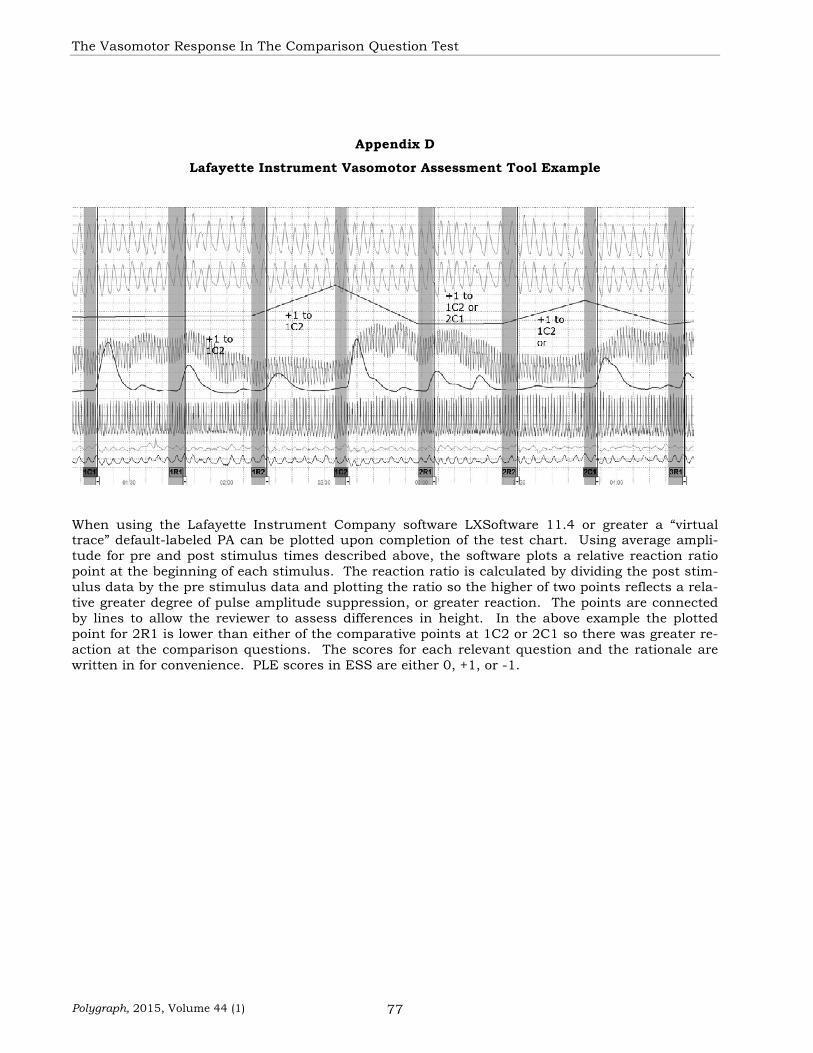
Stoelting CPSPro Fusion Scoring Screen
When numerically scoring in CPSPro Fusion clicking in the scoring matrix or on a component will highlight (in yellow on a color screen, here shown in grey) the scorable area in the tracing. The highlighted tracing represents the scorable area according to the University of Utah Scoring System Criteria. The CPSPro Fusion manual (Stoelting, 2011) provides the following description for the vasomotor response, “Plethysmograph: the magnitude and duration of decreases in the amplitude of finger pulses that began a minimum of two seconds after the question onset.” (p. 121) The numbers shown along the bottom are relative strength of reaction for that component. The manual describes those numbers, “These measurements indicate the relative strength of the reactions ranging from 0 (smallest reaction on the chart) to 99 (largest reaction on the chart).” (p. 120). Larger numbers thus indicate larger responses with regard to the University of Utah criteria. In the image above the vasomotor response to C3 has a value of 53 while the response to R3 has a value of 26. Thus the response to C3 is slightly more than twice the size of the response to R3. A positive numerical score would be assigned at this spot. In the University of Utah Scoring system this vasomotor comparison would be scored as a +2.