Embed Size (px)
Citation preview
The variability of PCDD/F concentrations in the effluentof wastewater treatment plants with regard to theirhydrological environment
Magdalena Urbaniak & Edyta Kiedrzyńska &
Adam Grochowalski
Received: 27 November 2015 /Accepted: 18 January 2017 /Published online: 31 January 2017# The Author(s) 2017. This article is published with open access at Springerlink.com
Abstract The occurrence, concentrations, patterns, andloads of 17 2,3,7,8-substituted congeners ofpolychlorinated dibenzo-p-dioxins (PCDDs) andpolychlorinated dibenzofurans (PCDFs) were determinedin treated wastewater collected at the outlets from 14wastewater treatment plants (WTPs), divided into threesize categories. The analysis also considered the effect ofwastewater outflow on the final concentrations ofPCDDs/Fs, as the samples were collected during floodingand stable hydrological conditions. None of the studiedWTPs were found to completely remove toxic congenersof PCDDs/Fs fromwastewater: the PCDD concentrationsin the outgoing effluent during stable wastewater flowranged from 2.99 to 177.19 pg/L, PCDFs from 6.05 to51.30 pg/L, and the Toxic Equivalent (TEQ) was
between 0.94 and 4.87 pg/L. The results from highwastewater flow were less diversified, ranging from5.04 to 8.85 pg/L for PCDDs, from 11.47 to 32.33 pg/Lfor PCDFs and from 2.00 to 4.65 pg/L for TEQ. Thesmallest WTPs demonstrated the highest average totaland TEQ concentrations due to limited volume, shortretention time and outdated technology, and, hence, in-sufficient treatment efficiency. The largest WTPs havethe potential to substantially affect the quality of riverwater, as despite being associated with the lowest con-centrations, they released much greater volumes of treat-ed wastewater and, hence, the greatest amounts of ana-lyzed compounds. Elevated TEQ values were observed athigh flow in allWTP size categories indicating the impactof high and stable wastewater flow on the concentrationsof the observed PCDDs/Fs.
Keywords PCDDs/Fs .Wastewater .WTP. Effluents
Introduction
The global population has grown rapidly from approx-imately 5.3 billion in 1992 (UNEP 2012) to about 6.97billion in 2011 (UN Population Division 2011), andaccording to the United Nation projections, the numberswill reach over eight billion in 2030 and nine billion in2050. The effect of such rapid population growth isreflected in increasing consumption of global waterand consequential production of wastewater. The USEPA reports (2000; 2004) and Carey and Migliccio(2009) note that influent wastewater flow in the USA
Environ Monit Assess (2017) 189: 90DOI 10.1007/s10661-017-5794-9
Electronic supplementary material The online version of thisarticle (doi:10.1007/s10661-017-5794-9) contains supplementarymaterial, which is available to authorized users.
M. Urbaniak (*) : E. KiedrzyńskaEuropean Regional Centre for Ecohydrology of the PolishAcademy of Sciences, Tylna 3, 90-364 Lodz, Polande-mail: [email protected]
M. Urbaniak : E. KiedrzyńskaDepartment of Applied Ecology, Faculty of Biology andEnvironmental Protection, University of Lodz, Banacha 12/16,90-237 Lodz, Poland
A. GrochowalskiDepartment of Chemical Engineering and Technology,Department of Chemical Engineering and Technology, KrakowUniversity of Technology, Warszawska 24, 31-155 Krakow,Poland
is predicted to rise from 100,000,000 m3/day in 1996 to170,000,000 m3/day in 2025. This is also the case ofPoland, where the total amount of treated wastewaterincreased by about 38% between 1980 and 2007(Wałęga et al. 2009).
The accession of Poland to the European Union andthe consequent implementation of European water man-agement directives, with their implications for inlandwater quality (Mostert 2003) and European water andwastewater policy (Kiedrzyńska et al. 2014a), haveobliged the country to improve wastewater managementby 2015. The Water Framework Directive (WFD2000/60/EC), for example, requires good inland waterstatus to be achieved and for certain priority substancesto be managed, through integrated river basin manage-ment. The Nitrates Directive (ND 91/676/EEC), in turn,promotes various nitrogen-reducing management prac-tices in the agricultural sector, and the Urban Wastewa-ter Treatment Directive (UWWTD 91/271/EEC) regu-lates the collection and treatment of wastewater in urbanareas (Kiedrzyńska et al. 2014a).
However, in the case of PCDDs/Fs, which arethe most toxic organochlorine compounds occur-ring in the water environment, the regulationsconcerning their concentrations and limits in thewastewater effluents discharged into the river re-cipients remain insufficient. For example, one ofthe most important Polish regulations in the fieldof water policy, the Water Law (OJ 2001 No. 115,item 1229, act of July 19 2001, Water Law) doesnot regulate the limits for the concentration oftoxic PCDDs/Fs in either wastewater effluents orin surface water. Such limits can be found in ECRegulation No. 166/2006 of the European Parlia-ment and of the Council of 18 January 2006concerning the establishment of a European Pollut-ant Release and Transfer Register and amendmentsto Council Directives 91/689/EEC and 96/61/EC,which establish a threshold of 0.0001 kg per yearfor releases of PCDD + PCDF (as TEQ) frommunicipal WTPs into the water column, for apopulation equivalent equal to 100,000. However,smaller WTPs are not inspected with regard toPCDD/F release.
Intensive studies on the occurrence of PCDDs/Fs inuntreated wastewater and sewage sludge during recentdecades have revealed very high concentrations, with apredominance of highly chlorinated congeners(Hagenmayer et al. 1986; Rappe et al. 1989; Broman
et al. 1990; Näf et al. 1990; Sewart et al. 1995; Alcockand Jones 1997; McLachlan et al. 1996; Rappe et al.1998; Eljarrat et al. 1999, 2003; Koch et al. 2001;Dudzińska and Czerwiński 2002; Oleszek-Kudlaket al. 2005). Nevertheless, little is known of their fateduring wastewater treatment and their final concentra-tions in the treated effluents (Rogers 1996). Some pre-vious studies have demonstrated that the wastewaterpurification process results in increased concentrationsof lower chlorinated, more toxic PCDD/F congeners inoutgoing wastewater (Sztamberek-Gola et al. 2003;Oleszek-Kudlak et al. 2005) and so emphasize the needfor wastewater effluent monitoring.
Hence, the aim of this study was to determine theoccurrence, concentrations, patterns, and loads of2,3,7,8-substituted congeners of PCDD and PCDF intreated wastewater discharged from 14 WTPs, dividedinto three size categories, all of which are located in oneriver catchment. The effect of wastewater outflow on thefinal concentrations of PCDDs/Fs was also examined, asthe treated wastewater samples were collected duringspring flood and during stable hydrological conditionsin late summer.
Materials and methods
Study area and WTP descriptions
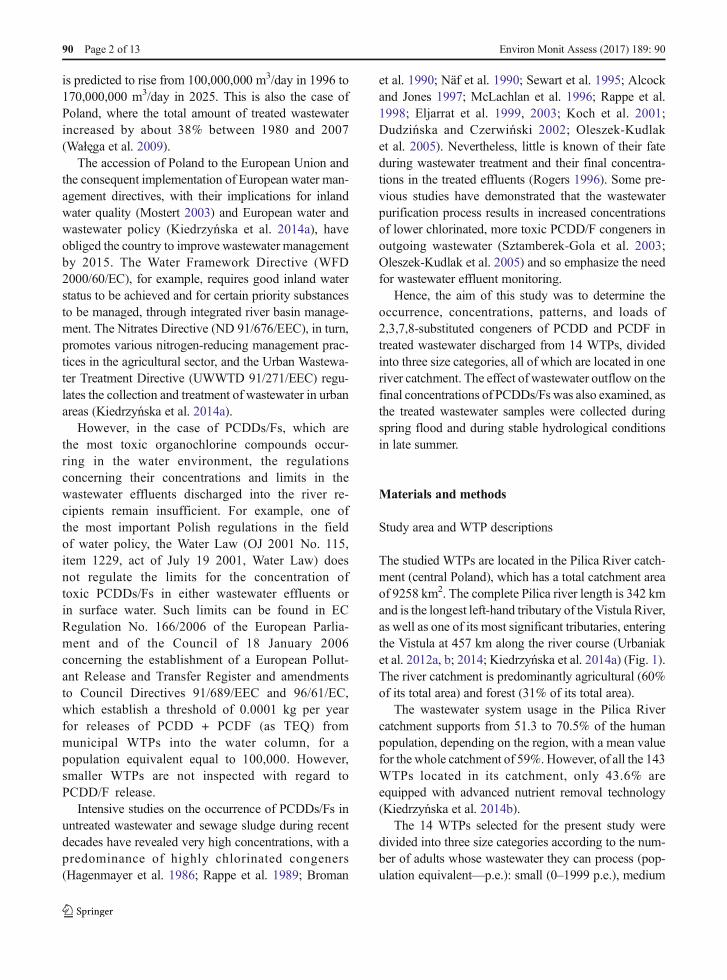
The studied WTPs are located in the Pilica River catch-ment (central Poland), which has a total catchment areaof 9258 km2. The complete Pilica river length is 342 kmand is the longest left-hand tributary of the Vistula River,as well as one of its most significant tributaries, enteringthe Vistula at 457 km along the river course (Urbaniaket al. 2012a, b; 2014; Kiedrzyńska et al. 2014a) (Fig. 1).The river catchment is predominantly agricultural (60%of its total area) and forest (31% of its total area).
The wastewater system usage in the Pilica Rivercatchment supports from 51.3 to 70.5% of the humanpopulation, depending on the region, with a mean valuefor the whole catchment of 59%.However, of all the 143WTPs located in its catchment, only 43.6% areequipped with advanced nutrient removal technology(Kiedrzyńska et al. 2014b).
The 14 WTPs selected for the present study weredivided into three size categories according to the num-ber of adults whose wastewater they can process (pop-ulation equivalent—p.e.): small (0–1999 p.e.), medium
90 Page 2 of 13 Environ Monit Assess (2017) 189: 90
(2000–9999 p.e), and large (15,000–99,999 p.e.). Thestudy included seven small WTPs, three medium-sizedWTPs, and four large WTPs (Table 1). Five WTPs,those in Koniecpol, Sulejów, Tomaszów Mazowiecki,NoweMiasto, and Warka, released the treated wastewa-ter directly into the Pilica River, while the remainderwas discharged into the Pilica River tributaries. All thestudiedWTPs utilize secondary (mechanical-biological)treatment.
Sampling
Two 5 L samples of treated wastewater were collectedfrom each WTP. The samples were taken at high waste-water flow (19-20.05.2010) and at stable wastewaterflow (26-27.09.2010) (Fig. 1; Table 1). The sampleswere collected directly from the wastewater outflow intothe Pilica River or its tributaries into amber containers
and transported to the laboratory in a car fridge at atemperature of 4 °C.
Analysis of PCDD/F concentration
The PCDD/F analyses were performed in an accreditedlaboratory at the Krakow University of Technology,Krakow, Poland, according to Urbaniak et al. (2014).Briefly, 2.00 L samples of treated wastewater werespiked with 60.0 pg of 17 13C-labeled PCDDs/Fs(NK-LCS-G and WP-LCS, Wellington Laboratories)dissolved in 1 mL methanol. Toluene was then usedfor liquid/liquid extraction. The obtained extract wasplaced in the bottom of a tube sealed by a polyethylenesemipermeable membrane and cleaned overnight with100 mL hexane. The obtained dialysate was thencleaned using a silica gel column filled with 44.0%sulphuric acid and alumina (U.S. EPA Method 1613
Large WTP sampling point
MediumWTPssampling point
Small WTP sampling point
Fig. 1 Location of the WTP sampling points located in the Pilica River catchment (central Poland)
Environ Monit Assess (2017) 189: 90 Page 3 of 13 90
1994). After this step, 20.0μL of precision and recoverysolution prepared in nonane was added to the obtainedextracts (EPA1613 ISS mix of 200 ng/mL of 13C12-1,2,3,4-TCDD and 13C12-1,2,3,7,8,9-HxCDD).
A Thermo Scientific GCQ-1100/Trace2000 Isotopedilution gas chromatography-tandemmass spectrometry(ID-GC/MS-MS) system and Xcalibur data acquisitionand analysis software were used to determine the quan-tities of seven PCDDs and ten PCDFs in the water. Forproper separation of congeners, a 30.0 m × 0.250 mmi.d. DB5MS J&W capillary column with 25-μm filmand DB17 30.0 m × 0.250 mm i.d. DB5MS J&Wcapillary column with 25-μm film was used. A2.50 μL sample volume was injected into the SSLinjector at a temperature of 260 °C.
The GC oven was programmed with the followingsequence: the initial temperature of 130 °C was main-tained for 3 min before being ramp by 50 °C/min to180 °C, then again by 2 °C/min to 270 °C, and then by20 °C/min to 300 °C, where it was held for 5 min. Theresulting uncertainty was expressed as extended mea-surement uncertainty for k = 2 at a confidence level of95% (Urbaniak et al. 2014).
Quality assurance/quality control
The Laboratory for Trace Organic Analyses at theKrakow University of Technology, Poland, is a memberof the Interlaboratories for Dioxins Circuit organized bythe Interuniversity Consortium BChemistry for theEnvironment^ and LabService Analytica S.r.l. The in-ternal reference materials were used to properly validatethe analytical method; the analytical laboratory is fullyaccredited with accreditation no. AB 749.
Quantification was achieved by the internal standardmethod using certified calibration standards. A methodblank, a matrix spike, and replicate samples were used ineach analytical batch. Moreover, in order to assess theartifacts, a reagent blank was used, while duplicateanalyses were used to verify the precision. The samplespikes were used to further confirm accuracy. Recover-ies were estimated using samples spiked with PCDDs/Fs and were found to range from 64 to 122%, whileLOD ranged from 0.22 pg/L for TeCDD/TeCDF to2.80 pg/L for OCDD/OCDF.
All glassware and bottles used in the field and labo-ratory were cleaned with detergent then rinsed with
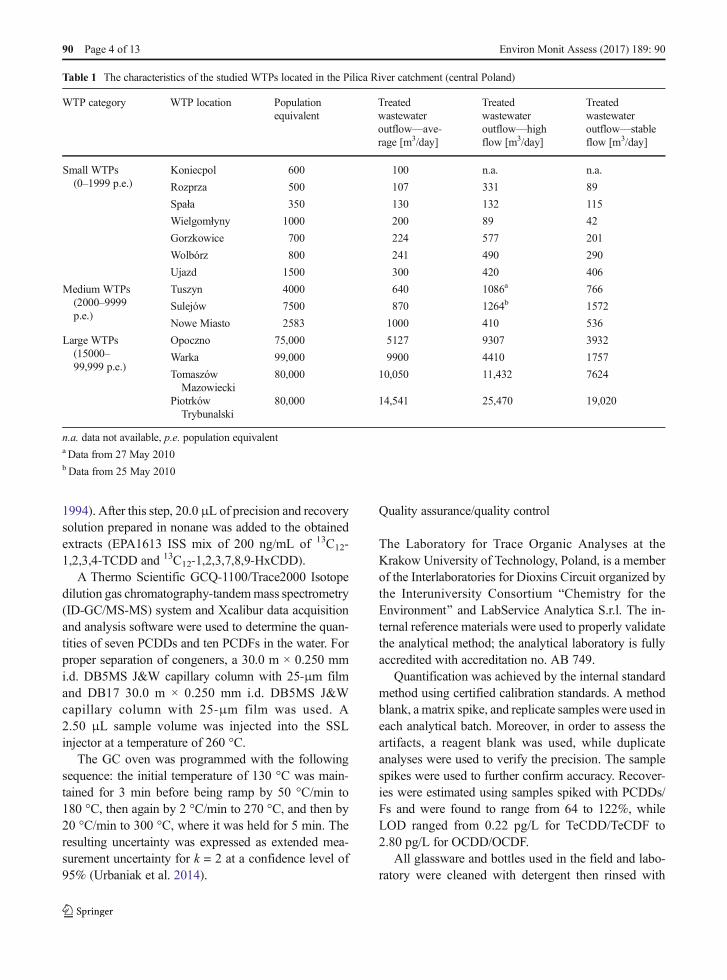
Table 1 The characteristics of the studied WTPs located in the Pilica River catchment (central Poland)
WTP category WTP location Populationequivalent
Treatedwastewateroutflow—ave-rage [m3/day]
Treatedwastewateroutflow—highflow [m3/day]
Treatedwastewateroutflow—stableflow [m3/day]
Small WTPs(0–1999 p.e.)
Koniecpol 600 100 n.a. n.a.
Rozprza 500 107 331 89
Spała 350 130 132 115
Wielgomłyny 1000 200 89 42
Gorzkowice 700 224 577 201
Wolbórz 800 241 490 290
Ujazd 1500 300 420 406
Medium WTPs(2000–9999p.e.)
Tuszyn 4000 640 1086a 766
Sulejów 7500 870 1264b 1572
Nowe Miasto 2583 1000 410 536
Large WTPs(15000–99,999 p.e.)
Opoczno 75,000 5127 9307 3932
Warka 99,000 9900 4410 1757
TomaszówMazowiecki
80,000 10,050 11,432 7624
PiotrkówTrybunalski
80,000 14,541 25,470 19,020
n.a. data not available, p.e. population equivalenta Data from 27 May 2010bData from 25 May 2010
90 Page 4 of 13 Environ Monit Assess (2017) 189: 90
ultrapure water and heated at 450 °C overnight. Beforeuse, the glassware was rinsed with acetone and thenhexane. Similarly, the Teflon containers used in the fieldwere cleaned with detergent, rinsed with ultrapure wa-ter, and rinsed with acetone and hexane beforeapplication.
Analysis of PCDD/F load
To calculate the daily loads of PCDDs, PCDFs, andTEQ, the daily wastewater outflows (m3/day) measuredat each studied WTPs during conditions of flooding andstable hydrology (Table 1) were multiplied by the totaland TEQ concentrations (pg/L) of the PCDDs andPCDFs. The obtained loads were depicted as microgramof total PCDDs, PCDFs, or TEQ per day.
Results and discussion
The National Program of Urban Wastewater Treatment(Poland) (KZGW 2013) requires any agglomerationproducing wastewater with a pollution load equivalentto the amount of wastewater generated by 2000 adults(p.e. more than 2000) to be equipped with a wastewatercollection and treatment system appropriate to localconditions and needs. Between 2003 and 2015, 1700WTPs were designed for operation in 1577 agglomera-tions of more than 2000 p.e., while a further 29 WTPsare intended for agglomerations of less than 2000 p.e.(Smołka 2008; KZGW 2013).
Such a rapid growth of WTPs should lead to moreeffective removal of contaminants from inflowingwastewater, thereby producing an effluent which is en-vironmentally safe. Nevertheless, the available literaturedata indicates that conventional wastewater treatmentsystems are not able to sufficiently remove hydrophobiccontaminants, and these have adverse effects on thereceiving water ecosystem (Pham et al. 1999; Blanchardet al. 2001; Katsoyiannias and Samara 2004; Bergqvistet al. 2006; Joss et al. 2006; Katsoyiannis and Samara2007; Cirja et al. 2008; Carey and Migliccio 2009; Jelicet al. 2011; Grover et al. 2011; Saffari and Saffari 2013;Urbaniak et al. 2014; Kiedrzyńska et al. 2014b). Thisinsufficiency results in the presence of organic com-pounds in river water worldwide (Gotz et al. 1994;Camusso et al. 2000; Kakimoto et al. 2006; Chen et al.2008; Chi et al. 2011; Minomo et al. 2011), including
Polish water bodies (Kowalewska et al. 2003; Wolskaet al. 2003; Urbaniak et al. 2012a, b; 2014).
For many years, quantification of wastewater efflu-ents and receiving river water pollution was restricted tomonitoring biochemical oxygen demand, chemical ox-ygen demand, nitrogen and phosphorus concentrations,and total suspended solids (Cirja et al. 2008). However,as shown in our earlier study, significant concentrationsof nitrogen and phosphorus which exceed the allowablelimits for the type of WTP may be present in treatedwastewater, with the highest values in the smallestWTPs (Kiedrzyńska et al. 2014b). A similar situationwas observed by Urbaniak et al. (2014) in the case ofPCDDs/Fs. All WTPs studied by Urbaniak et al. (2014)were found to discharge toxic PCDD/F and dl-PCBcompounds into their receiving rivers. This can be at-tributed to insufficient regulation of the discharge oftoxic congeners of PCDDs/Fs by municipal WTPs: theexisting regulations only apply to municipal WTPs witha p.e. of 100,000 which exclude the studied WTPslocated in the Pilica River catchment. This, togetherwith the increasing number of municipal WTPs(KZGW 2013) and increases in the concentrations ofthe lower chlorinated, and hence more toxic, PCDDs/FsinWTP outlet water, as noted by Sztamberek-Gola et al.(2003) and Oleszek-Kudlak et al. (2005), may result inpoorer quality of the receiving waters. Consequently, theresults obtained in the present study provide hithertomissing information about the concentrations, patterns,and loads of PCDDs/Fs in treated wastewaterdischarged into the Pilica River and its tributaries undervarious hydrological conditions, which are reflected inthe composition of the treated wastewater outflow.
The occurrence and changes in total and TEQconcentrations at high and stable wastewater flowaccording to WTP size categories
The total and TEQ concentrations of seven 2,3,7,8-substituted PCDDs and ten 2,3,7,8-substituted PCDFsare given in Table 2 and Fig. 2.
The highest concentration diversity was noted duringstable wastewater flow for the sum of seven PCDDcongeners, ranging from 2.99 to 173.19 pg/L. Very highaverage values were also observed for small WTPs(37.40 pg/L) as an effect of increased PCDD concentra-tion in the Wolbórz WTP, while these values wereseveral times lower for medium and large WTPs (5.04and 8.85 pg/L, respectively) (Table 2). In contrast, the
Environ Monit Assess (2017) 189: 90 Page 5 of 13 90
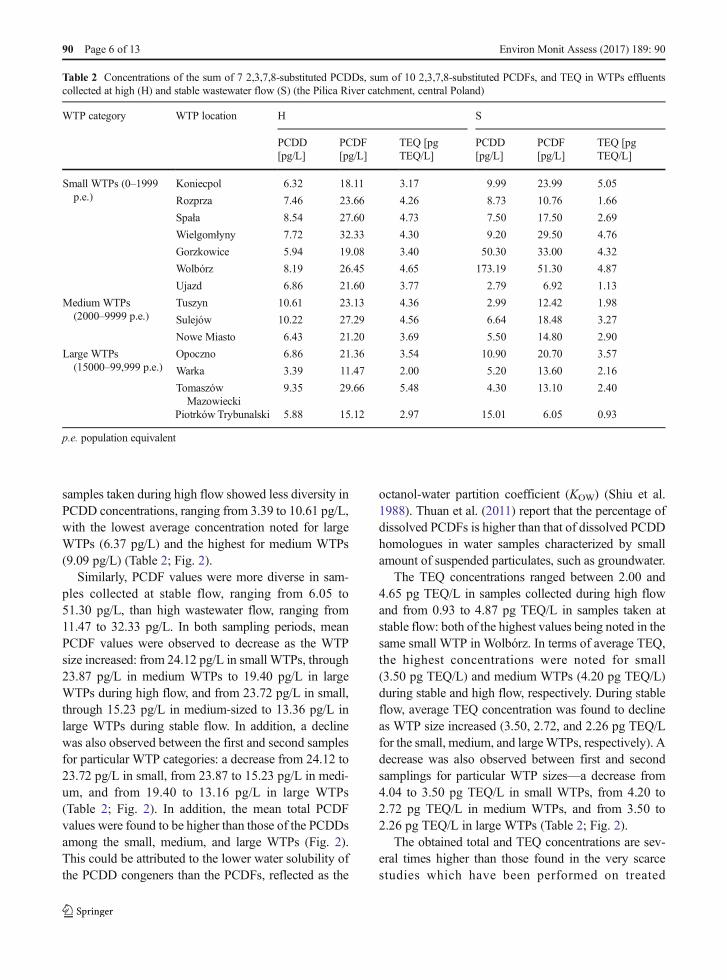
samples taken during high flow showed less diversity inPCDD concentrations, ranging from 3.39 to 10.61 pg/L,with the lowest average concentration noted for largeWTPs (6.37 pg/L) and the highest for medium WTPs(9.09 pg/L) (Table 2; Fig. 2).
Similarly, PCDF values were more diverse in sam-ples collected at stable flow, ranging from 6.05 to51.30 pg/L, than high wastewater flow, ranging from11.47 to 32.33 pg/L. In both sampling periods, meanPCDF values were observed to decrease as the WTPsize increased: from 24.12 pg/L in small WTPs, through23.87 pg/L in medium WTPs to 19.40 pg/L in largeWTPs during high flow, and from 23.72 pg/L in small,through 15.23 pg/L in medium-sized to 13.36 pg/L inlarge WTPs during stable flow. In addition, a declinewas also observed between the first and second samplesfor particular WTP categories: a decrease from 24.12 to23.72 pg/L in small, from 23.87 to 15.23 pg/L in medi-um, and from 19.40 to 13.16 pg/L in large WTPs(Table 2; Fig. 2). In addition, the mean total PCDFvalues were found to be higher than those of the PCDDsamong the small, medium, and large WTPs (Fig. 2).This could be attributed to the lower water solubility ofthe PCDD congeners than the PCDFs, reflected as the
octanol-water partition coefficient (KOW) (Shiu et al.1988). Thuan et al. (2011) report that the percentage ofdissolved PCDFs is higher than that of dissolved PCDDhomologues in water samples characterized by smallamount of suspended particulates, such as groundwater.
The TEQ concentrations ranged between 2.00 and4.65 pg TEQ/L in samples collected during high flowand from 0.93 to 4.87 pg TEQ/L in samples taken atstable flow: both of the highest values being noted in thesame small WTP in Wolbórz. In terms of average TEQ,the highest concentrations were noted for small(3.50 pg TEQ/L) and medium WTPs (4.20 pg TEQ/L)during stable and high flow, respectively. During stableflow, average TEQ concentration was found to declineas WTP size increased (3.50, 2.72, and 2.26 pg TEQ/Lfor the small, medium, and largeWTPs, respectively). Adecrease was also observed between first and secondsamplings for particular WTP sizes—a decrease from4.04 to 3.50 pg TEQ/L in small WTPs, from 4.20 to2.72 pg TEQ/L in medium WTPs, and from 3.50 to2.26 pg TEQ/L in large WTPs (Table 2; Fig. 2).
The obtained total and TEQ concentrations are sev-eral times higher than those found in the very scarcestudies which have been performed on treated
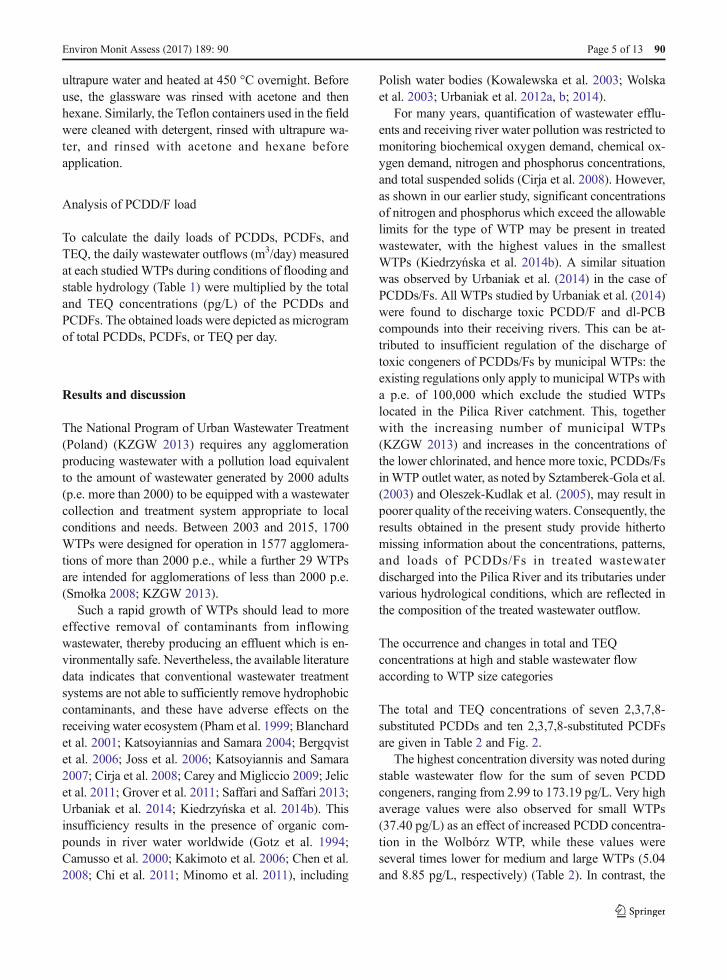
Table 2 Concentrations of the sum of 7 2,3,7,8-substituted PCDDs, sum of 10 2,3,7,8-substituted PCDFs, and TEQ in WTPs effluentscollected at high (H) and stable wastewater flow (S) (the Pilica River catchment, central Poland)
WTP category WTP location H S
PCDD[pg/L]
PCDF[pg/L]
TEQ [pgTEQ/L]
PCDD[pg/L]
PCDF[pg/L]
TEQ [pgTEQ/L]
Small WTPs (0–1999p.e.)
Koniecpol 6.32 18.11 3.17 9.99 23.99 5.05
Rozprza 7.46 23.66 4.26 8.73 10.76 1.66
Spała 8.54 27.60 4.73 7.50 17.50 2.69
Wielgomłyny 7.72 32.33 4.30 9.20 29.50 4.76
Gorzkowice 5.94 19.08 3.40 50.30 33.00 4.32
Wolbórz 8.19 26.45 4.65 173.19 51.30 4.87
Ujazd 6.86 21.60 3.77 2.79 6.92 1.13
Medium WTPs(2000–9999 p.e.)
Tuszyn 10.61 23.13 4.36 2.99 12.42 1.98
Sulejów 10.22 27.29 4.56 6.64 18.48 3.27
Nowe Miasto 6.43 21.20 3.69 5.50 14.80 2.90
Large WTPs(15000–99,999 p.e.)
Opoczno 6.86 21.36 3.54 10.90 20.70 3.57
Warka 3.39 11.47 2.00 5.20 13.60 2.16
TomaszówMazowiecki
9.35 29.66 5.48 4.30 13.10 2.40
Piotrków Trybunalski 5.88 15.12 2.97 15.01 6.05 0.93
p.e. population equivalent
90 Page 6 of 13 Environ Monit Assess (2017) 189: 90
wastewater. Data presented by Sztamberek-Golaet al. (2003) and Oleszek-Kudlak et al. (2005),obtained on the basis of three WTP analyses,revealed total and TEQ concentrations within therange from 107.26 to 219.19 pg/m3 for PCDDs,from 201.75 to 736.50 pg/m3 for PCDFs, and from14.70 to 116.40 pg I-TEQ/m3 for TEQ. Moreover,the authors observed increased PCDD and PCDFconcentrations to be related to increased dailywastewater flow: the lowest values were noted ineffluents from the smallest WTP, with a daily flowof 20,000 m3, whereas samples coming WTPs with
twice the flow (40,000 and 45,000 m3) were foundto have concentrations about two times higher. This isprobably due to the greater input of toxic industrialwastewater in the case of the larger WTP. However,the opposite tendency was observed in our findings,with the lower total and TEQ concentrations in thelargest WTPs with the highest flow. This is probablyrelated to the insufficient treatment of wastewater insmall WTPs, partly because of not only the limitedvolume and short retention time of wastewater in theWTP but also the use of outdated technology in somecases, as demonstrated in Kiedrzyńska et al. (2014b)with regard to nitrogen and phosphorus removal.
Changes in PCDD/F patterns with regard to WTP sizecategories at high and stable wastewater flows
The occurrence of PCDDs/Fs in inflowing wastewatercauses considerable problems for the WTPs, becauseconventional biological and chemical processes are in-sufficient for their removal. What is more, scarce dataexists to explain how wastewater treatment affects thebehavior and fate of PCDDs/Fs. Since PCDDs/Fs have avery high sorption potential (Mackay et al. 2006), theyare expected to partition into the sewage sludge part ofthe wastewater during treatment processes. In addition,as the majority of treatment processes employ volatili-zation at some stage, the low volatilization potentials ofPCDDs/Fs reduce their loss (Oleszek-Kudlak et al.2005).
Oleszek-Kudlak et al. (2005) and Sztamberek-Golaet al. (2003) note that wastewater treatment affects the fateof PCDDs/Fs, with increased amounts of congeners withlower degrees of chlorination, and hence, greater toxicity,in the outlet effluents. As a consequence, the I-TEQ (In-ternational TEQ) concentrations are more than five timeshigher in the outgoing treated effluent than the incomingwastewater. Moreover, the authors report a predominanceof PCDFs over PCDDs in the outgoing effluents, as notedin the present study, where at highwastewater flow, PCDDlevels were only a fifth to a third of the PCDF levels(Fig. 3), with the average PCDDs content being 23.46,27.32, and 24.77% in the small, medium, and largeWTPs,respectively. A lower PCDD content was also observed inaqueous samples by Thuan et al. (2011).
For the samples collected at stable wastewater flow,three WTPs, Gorzkowice and Wolbórz (small WTPs)and Piotrków Trybunalski (large WTP), showed anopposite tendency with higher levels of PCDDs being
0
5
10
15
20
25
30
Con
cent
ratio
n [p
g/dm
3 ]
H S
0
5
10
15
20
25
30
35
40
Con
cent
ratio
n [p
g/dm
3 ]
0
5
10
15
20
25
30
35
40
PCDDs PCDFs TEQ
Conc
entr
a�on
[pg/
dm3 ]
Large WTPs
Medium WTPs
Small WTPs
Fig. 2 Changes in the average PCDD, PCDF, and TEQ concen-trations at high (H) and stable wastewater flow (S) (the Pilica Rivercatchment, central Poland)
Environ Monit Assess (2017) 189: 90 Page 7 of 13 90
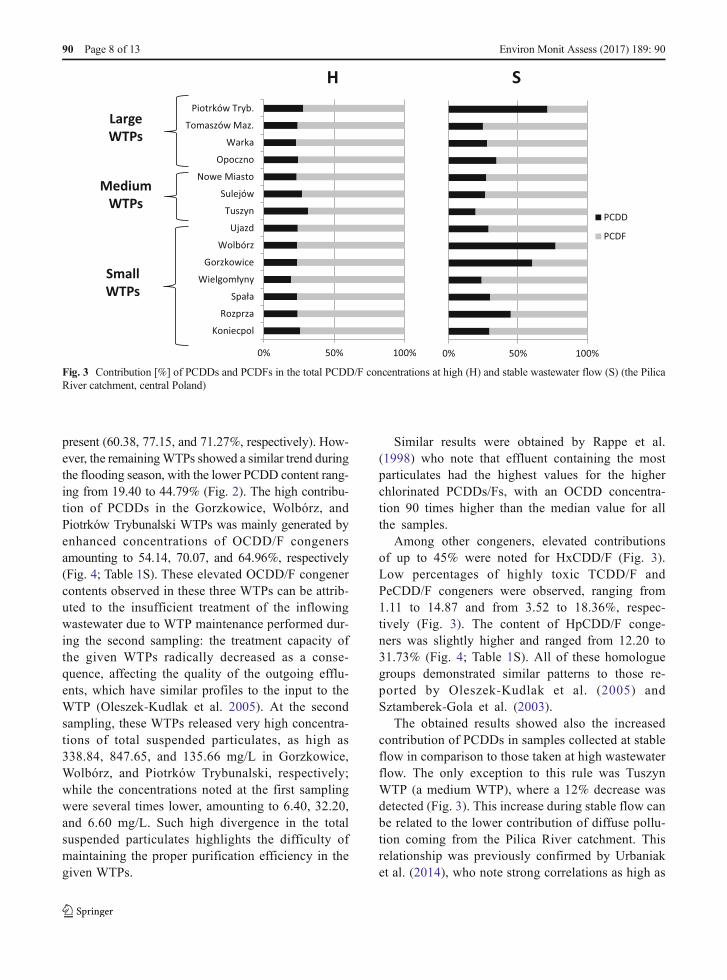
present (60.38, 77.15, and 71.27%, respectively). How-ever, the remainingWTPs showed a similar trend duringthe flooding season, with the lower PCDD content rang-ing from 19.40 to 44.79% (Fig. 2). The high contribu-tion of PCDDs in the Gorzkowice, Wolbórz, andPiotrków Trybunalski WTPs was mainly generated byenhanced concentrations of OCDD/F congenersamounting to 54.14, 70.07, and 64.96%, respectively(Fig. 4; Table 1S). These elevated OCDD/F congenercontents observed in these three WTPs can be attrib-uted to the insufficient treatment of the inflowingwastewater due to WTP maintenance performed dur-ing the second sampling: the treatment capacity ofthe given WTPs radically decreased as a conse-quence, affecting the quality of the outgoing efflu-ents, which have similar profiles to the input to theWTP (Oleszek-Kudlak et al. 2005). At the secondsampling, these WTPs released very high concentra-tions of total suspended particulates, as high as338.84, 847.65, and 135.66 mg/L in Gorzkowice,Wolbórz, and Piotrków Trybunalski, respectively;while the concentrations noted at the first samplingwere several times lower, amounting to 6.40, 32.20,and 6.60 mg/L. Such high divergence in the totalsuspended particulates highlights the difficulty ofmaintaining the proper purification efficiency in thegiven WTPs.
Similar results were obtained by Rappe et al.(1998) who note that effluent containing the mostparticulates had the highest values for the higherchlorinated PCDDs/Fs, with an OCDD concentra-tion 90 times higher than the median value for allthe samples.
Among other congeners, elevated contributionsof up to 45% were noted for HxCDD/F (Fig. 3).Low percentages of highly toxic TCDD/F andPeCDD/F congeners were observed, ranging from1.11 to 14.87 and from 3.52 to 18.36%, respec-tively (Fig. 3). The content of HpCDD/F conge-ners was slightly higher and ranged from 12.20 to31.73% (Fig. 4; Table 1S). All of these homologuegroups demonstrated similar patterns to those re-ported by Oleszek-Kudlak et al. (2005) andSztamberek-Gola et al. (2003).
The obtained results showed also the increasedcontribution of PCDDs in samples collected at stableflow in comparison to those taken at high wastewaterflow. The only exception to this rule was TuszynWTP (a medium WTP), where a 12% decrease wasdetected (Fig. 3). This increase during stable flow canbe related to the lower contribution of diffuse pollu-tion coming from the Pilica River catchment. Thisrelationship was previously confirmed by Urbaniaket al. (2014), who note strong correlations as high as
0% 50% 100%
Koniecpol
Rozprza
Spała
Wielgomłyny
Gorzkowice
Wolbórz
Ujazd
Tuszyn
Sulejów
Nowe Miasto
Opoczno
Warka
Tomaszów Maz.
Piotrków Tryb.
0% 50% 100%
PCDD
PCDF
SmallWTPs
Medium WTPs
LargeWTPs
H S
Fig. 3 Contribution [%] of PCDDs and PCDFs in the total PCDD/F concentrations at high (H) and stable wastewater flow (S) (the PilicaRiver catchment, central Poland)
90 Page 8 of 13 Environ Monit Assess (2017) 189: 90
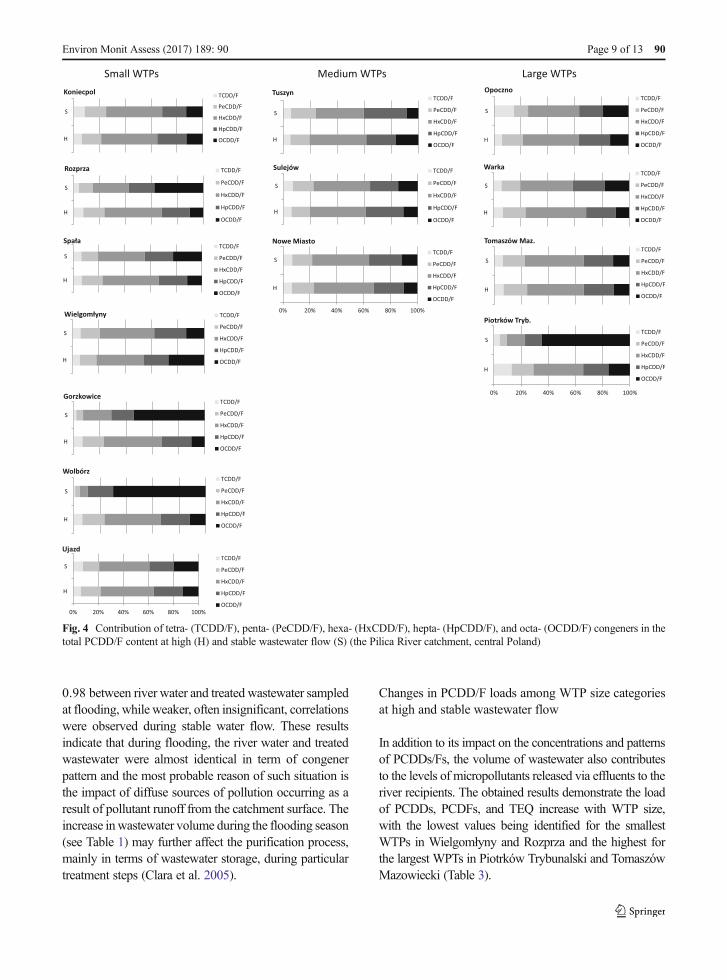
0.98 between river water and treated wastewater sampledat flooding, while weaker, often insignificant, correlationswere observed during stable water flow. These resultsindicate that during flooding, the river water and treatedwastewater were almost identical in term of congenerpattern and the most probable reason of such situation isthe impact of diffuse sources of pollution occurring as aresult of pollutant runoff from the catchment surface. Theincrease inwastewater volume during the flooding season(see Table 1) may further affect the purification process,mainly in terms of wastewater storage, during particulartreatment steps (Clara et al. 2005).
Changes in PCDD/F loads among WTP size categoriesat high and stable wastewater flow
In addition to its impact on the concentrations and patternsof PCDDs/Fs, the volume of wastewater also contributesto the levels of micropollutants released via effluents to theriver recipients. The obtained results demonstrate the loadof PCDDs, PCDFs, and TEQ increase with WTP size,with the lowest values being identified for the smallestWTPs in Wielgomłyny and Rozprza and the highest forthe largest WPTs in Piotrków Trybunalski and TomaszówMazowiecki (Table 3).
H
S
Koniecpol TCDD/F
PeCDD/F
HxCDD/F
HpCDD/F
OCDD/F
H
S
Wielgomłyny TCDD/F
PeCDD/F
HxCDD/F
HpCDD/F
OCDD/F
H
S
Rozprza TCDD/F
PeCDD/F
HxCDD/F
HpCDD/F
OCDD/F
H
S
Spała TCDD/F
PeCDD/F
HxCDD/F
HpCDD/F
OCDD/F
H
S
Sulejów TCDD/F
PeCDD/F
HxCDD/F
HpCDD/F
OCDD/F
0% 20% 40% 60% 80% 100%
H
S
Nowe Miasto TCDD/F
PeCDD/F
HxCDD/F
HpCDD/F
OCDD/F
H
S
Tuszyn TCDD/F
PeCDD/F
HxCDD/F
HpCDD/F
OCDD/F
Small WTPs Medium WTPs
H
S
Tomaszów Maz. TCDD/F
PeCDD/F
HxCDD/F
HpCDD/F
OCDD/F
H
S
Warka TCDD/F
PeCDD/F
HxCDD/F
HpCDD/F
OCDD/F
0% 20% 40% 60% 80% 100%
H
S
Piotrków Tryb. TCDD/F
PeCDD/F
HxCDD/F
HpCDD/F
OCDD/F
H
S
Opoczno TCDD/F
PeCDD/F
HxCDD/F
HpCDD/F
OCDD/F
Large WTPs
H
S
Gorzkowice TCDD/F
PeCDD/F
HxCDD/F
HpCDD/F
OCDD/F
0% 20% 40% 60% 80% 100%
H
S
Ujazd TCDD/F
PeCDD/F
HxCDD/F
HpCDD/F
OCDD/F
H
S
Wolbórz TCDD/F
PeCDD/F
HxCDD/F
HpCDD/F
OCDD/F
Fig. 4 Contribution of tetra- (TCDD/F), penta- (PeCDD/F), hexa- (HxCDD/F), hepta- (HpCDD/F), and octa- (OCDD/F) congeners in thetotal PCDD/F content at high (H) and stable wastewater flow (S) (the Pilica River catchment, central Poland)
Environ Monit Assess (2017) 189: 90 Page 9 of 13 90
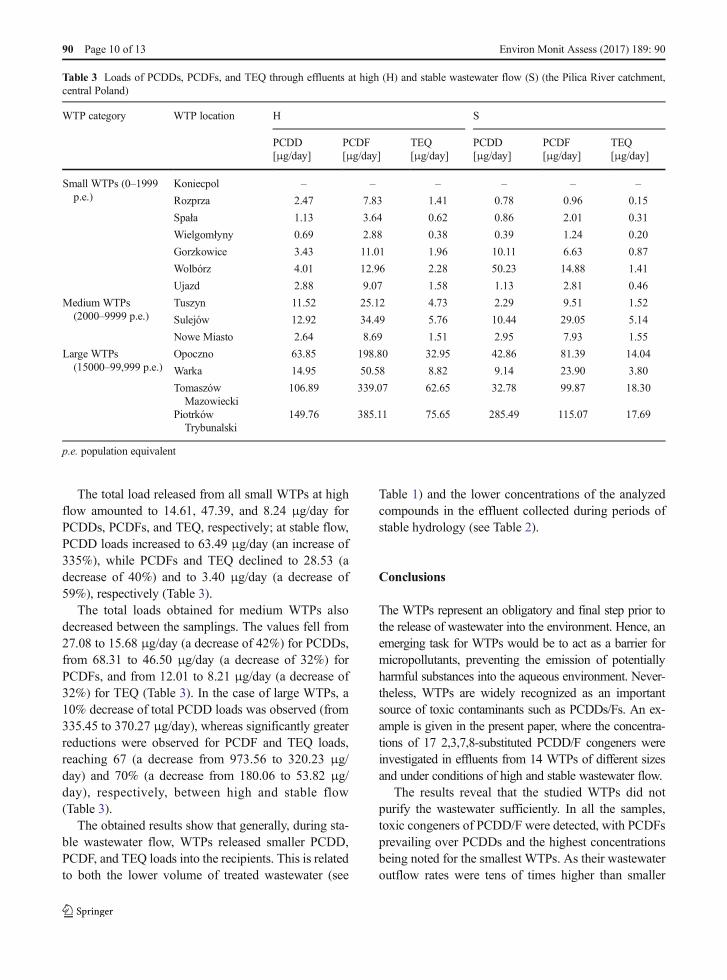
The total load released from all small WTPs at highflow amounted to 14.61, 47.39, and 8.24 μg/day forPCDDs, PCDFs, and TEQ, respectively; at stable flow,PCDD loads increased to 63.49 μg/day (an increase of335%), while PCDFs and TEQ declined to 28.53 (adecrease of 40%) and to 3.40 μg/day (a decrease of59%), respectively (Table 3).
The total loads obtained for medium WTPs alsodecreased between the samplings. The values fell from27.08 to 15.68 μg/day (a decrease of 42%) for PCDDs,from 68.31 to 46.50 μg/day (a decrease of 32%) forPCDFs, and from 12.01 to 8.21 μg/day (a decrease of32%) for TEQ (Table 3). In the case of large WTPs, a10% decrease of total PCDD loads was observed (from335.45 to 370.27 μg/day), whereas significantly greaterreductions were observed for PCDF and TEQ loads,reaching 67 (a decrease from 973.56 to 320.23 μg/day) and 70% (a decrease from 180.06 to 53.82 μg/day), respectively, between high and stable flow(Table 3).
The obtained results show that generally, during sta-ble wastewater flow, WTPs released smaller PCDD,PCDF, and TEQ loads into the recipients. This is relatedto both the lower volume of treated wastewater (see
Table 1) and the lower concentrations of the analyzedcompounds in the effluent collected during periods ofstable hydrology (see Table 2).
Conclusions
The WTPs represent an obligatory and final step prior tothe release of wastewater into the environment. Hence, anemerging task for WTPs would be to act as a barrier formicropollutants, preventing the emission of potentiallyharmful substances into the aqueous environment. Never-theless, WTPs are widely recognized as an importantsource of toxic contaminants such as PCDDs/Fs. An ex-ample is given in the present paper, where the concentra-tions of 17 2,3,7,8-substituted PCDD/F congeners wereinvestigated in effluents from 14 WTPs of different sizesand under conditions of high and stable wastewater flow.
The results reveal that the studied WTPs did notpurify the wastewater sufficiently. In all the samples,toxic congeners of PCDD/F were detected, with PCDFsprevailing over PCDDs and the highest concentrationsbeing noted for the smallest WTPs. As their wastewateroutflow rates were tens of times higher than smaller
Table 3 Loads of PCDDs, PCDFs, and TEQ through effluents at high (H) and stable wastewater flow (S) (the Pilica River catchment,central Poland)
WTP category WTP location H S
PCDD[μg/day]
PCDF[μg/day]
TEQ[μg/day]
PCDD[μg/day]
PCDF[μg/day]
TEQ[μg/day]
Small WTPs (0–1999p.e.)
Koniecpol – – – – – –
Rozprza 2.47 7.83 1.41 0.78 0.96 0.15
Spała 1.13 3.64 0.62 0.86 2.01 0.31
Wielgomłyny 0.69 2.88 0.38 0.39 1.24 0.20
Gorzkowice 3.43 11.01 1.96 10.11 6.63 0.87
Wolbórz 4.01 12.96 2.28 50.23 14.88 1.41
Ujazd 2.88 9.07 1.58 1.13 2.81 0.46
Medium WTPs(2000–9999 p.e.)
Tuszyn 11.52 25.12 4.73 2.29 9.51 1.52
Sulejów 12.92 34.49 5.76 10.44 29.05 5.14
Nowe Miasto 2.64 8.69 1.51 2.95 7.93 1.55
Large WTPs(15000–99,999 p.e.)
Opoczno 63.85 198.80 32.95 42.86 81.39 14.04
Warka 14.95 50.58 8.82 9.14 23.90 3.80
TomaszówMazowiecki
106.89 339.07 62.65 32.78 99.87 18.30
PiotrkówTrybunalski
149.76 385.11 75.65 285.49 115.07 17.69
p.e. population equivalent
90 Page 10 of 13 Environ Monit Assess (2017) 189: 90
WTPs, the largest WTPs discharged much higher loadsof the analyzed compounds, despite having the lowesttotal and TEQ concentrations. Hence, they may deteri-orate the quality of the receiving river water to a muchgreater extent.
Moreover, the study shows the impact of hydrologicalconditions with regard to high and stable wastewater flowon PCDD/F concentrations. Elevated TEQ values, andhence a lower quality of treatedwastewater, were observedat high flow due to reduced treatment efficiency.
The results obtained herein, together with previousliterature data, indicate the need to better understand thefate of PCDDs/Fs during the wastewater treatment pro-cess and to more precisely quantify the efficiency of thepurification methods. This better understanding willallow more effective methods for their removal to befurther developed and applied.
Acknowledgements The research was supported by the PolishMinistry of Science and Higher Education, Project: N N305365738 BAnalysis of point sources pollution of nutrients, dioxinsand dioxin-like compounds in the Pilica River catchment and drawup of reclamation methods.^
Open Access This article is distributed under the terms of theCreative Commons Attribution 4.0 International License (http://creativecommons.org/licenses/by/4.0/), which permits unrestrict-ed use, distribution, and reproduction in any medium, providedyou give appropriate credit to the original author(s) and the source,provide a link to the Creative Commons license, and indicate ifchanges were made.
References
Alcock, R. E., & Jones, K. C. (1997). Pentachlorophenol (PCP)and chloranil as PCDD/Fs sources to sewage sludge andsludge amended soils in the UK. Chemosphere, 35, 2317–2330.
Bergqvist, P. A., Augulyte, L., & Jurjoniene, V. (2006). PAH andPCB removal efficiencies in Umea (Sweden) and Sialial(Lithuania) municipal wastewater treatment plants. WaterAir and Soil Pollution, 175, 291–303.
Blanchard, M., Teil, M. J., Ollivon, D., Garban, B., Chesterikoff,C., & Chevreuil, M. (2001). Origin and distribution ofpolyaromatic hydrocarbons and polychlorobiphenyls in ur-ban effluents to wastewater treatment plants of the Paris area(France). Water Air and Soil Pollution, 35, 3679–3687.
Broman, D., Näf, C., Rolff, C., & Zebühr, Y. (1990). Analysis ofpolychlorinated dibenzo-p-dioxins (PCDD) andpolychlorinated dibenzofurans (PCDF) in soil and digestedsewage sludge from Stockholm, Sweden. Chemosphere, 21,1213–1220.
Camusso, M., Vignati, D., & Van De Guchte, C. (2000).Ecotoxicological assessment in the rivers Rhine(The Netherlands) and Po (Italy). Aquatic Ecosystem Healthand Management, 3, 335–345.
Carey, R. O., & Migliccio, K. W. (2009). Contribution of waste-water treatment plant effluents to nutrient dynamics in aquat-ic systems: a review. Environmental Management, 44, 205–217.
Chen, J.-A., Luo, J., Qiu, Z., Xu, C., Huang, Y., Jin, Y.-H., Saito,N., Yoshida, T., Ozawa, K., Cao, J., & Shu, W. (2008).PCDDs/PCDFs and PCBs in water samples from the ThreeGeorge Reservoir. Chemosphere, 79(9), 1545–1551.
Chi, K. H., Hsu, S.-C., Lin, C.-Y., Kao, S. J., & Lee, T. Y. (2011).Deposition fluxes of PCDD/Fs in a reservoir system in north-ern Taiwan. Chemosphere, 83, 745–752.
Cirja, M., Ivashechkin, P., Schäffer, A., & Corvine, P. G. F. X.(2008). Factors affecting the removal of organicmicropollutants from wastewater in conventional treatmentplants (CTP) and membrane bioreactors (MBR). Reviews inEnvironmental Science and Biotechnology, 7, 61–78.
Clara, M., Kreuzinger, N., Strenn, B., Gans, O., & Kroiss, H.(2005). The solids retention time—a suitable design param-eter to evaluate the capacity of wastewater treatment plants toremove micropollutants. Water Research, 39, 97–106.
Dudzińska, M., & Czerwiński, J. (2002). PCDD/F in sewages ludge f rom MWTP in sou th -eas t e rn Po land .Organohalogen Compounds, 57, 305–308.
Eljarrat, E., Caixach, J., & Rivera, J. (1999). Decline in PCDD andPCDF levels in sewage sludges from Catalonia (Spain).Environmental Science & Technology, 33, 2493–2498.
Eljarrat, E., Caixach, J., & Rivera, J. (2003). Comparison of TEQcontributions from PCDDs, PCDFs and dioxin-like PCBs insewage sludge from Catalonia (Spain). Chemosphere, 51,595–601.
Gotz, R., Enge, P., Friiesel, P., Roch, K., Kjeller, L.-O., Kulp, S. E.,& Rappe, C. (1994). Sampling and analysis of water andsuspended particulate matter of the river Elbe forpolychlorinated dibenzo-p-dioxins (PCDDs) and dibenzofu-rans (PCDFs). Chemosphre, 28, 63–74.
Grover, D. P., Balaam, J., Pacitto, S., Readman, J.W., White, S., &Zhou, J. L. (2011). Endocrine disrupting activities in sewageeffluent and river water determined by chemical analysis andin vivo assay in the context of granular activated carbonupgrade. Chemosphere, 84, 1512–1520.
Hagenmayer, H., Brunner, H., Haag, R., & Berchtold, A. (1986).PCDDs and PCDFs in sewage sludge, river and lake sedi-ments from south west Germany. Chemosphere, 15, 1421–1428.
Jelic, A., Gros, M., Ginebreda, A., Cespedes-Sanches, R., Ventura, F.,Petrovic, M., & Barcelo, D. (2011). Occurrence, partition andremoval of pharmaceuticals in sewage water and sludge duringwastewater treatment.Water Research, 45, 1165–1176.
Joss, A., Zabczynski, S., Gobel, A., Hoffmann, B., Loffler, D.,McArdell, C. S., Ternes, T. A., Thomsen, A., & Siegrist, H.(2006). Biological degradation of pharmaceuticals in munic-ipal wastewater treatment: proposing a classification scheme.Water Research, 40, 1686–1696.
Kakimoto, H., Oka, H., Miyata, Y., Yonezawa, Y., Niikawa, A.,Kyudo, H., Tang, N., Toriba, A., Kizu, R., & Hayakawa, K.(2006). Homologue and isomer distribution of dioxins observed
Environ Monit Assess (2017) 189: 90 Page 11 of 13 90
in water samples collected from Kahokugata Lagoon andinflowing rivers, Japan.Water Resources, 40, 1929–1940.
Katsoyiannias, A., & Samara, C. (2004). Persistent organic pol-lutants (POPs) in the sewage treatment plant in Thessaloniki,northern Greece: occurrence and removal. Water Research,38, 2685–2698.
Katsoyiannis, A., & Samara, C. (2007). Comparison of active andpassive sampling for the determination of persistent organicpollutants (POPs) in sewage treatment plants. Chemosphere,67, 1375–1382.
Kiedrzyńska, E., Jóźwik, A., Kiedrzyński, M., & Zalewski, M.(2014b). Hierarchy of factors exerting an impact on nutrientload of the Baltic Sea and sustainable management of itsdrainage basin. Marine Pollution Bulletin, 88, 162–173.
Kiedrzyńska, E., Kiedrzyński, M., Urbaniak, M., Magnuszewski,A., Skłodowski, M., Wyrwicka, A., & Zalewski, M. (2014a).Point sources of nutrient pollution in the lowland river catch-ment in the context of the Baltic Sea eutrophication.Ecological Engineering, 70, 337–348.
Koch, M., Knoth, W., & Rotard, W. (2001). Source identificationof PCDD/Fs in a sewage treatment plant of s German village.Chemosphere, 43, 737–741.
Kowalewska, G., Konat-Stepowicz, J., Wawrzyniak-Wydrowska,B., & Szymczyk-Żyła, M. (2003). Transfer of organic con-taminants to the Baltic in the Odra Estuary.Marine PollutionBulletin, 46, 703–718.
KZGW (2013). Gospodarka ściekowa w Polsce w latach 2010–2011.[ang: Wastewater management in Poland in the years 2010–2011]. Krajowy Zarząd Gospodarki Wodnej, Warszawa 2013ht tp : / /www.kzgw.gov.p l / f i l e s / f i l e /Mate r ia ly_ i_Informacje/Programy/KPOSK/Gospodarka2010_2011.pdf.
Mackay, D., Shiu, W. Y., Ma, K.-C., Lee, S. C. (2006). Handbookof physical-chemical properties and environmental fate fororganic chemicals Second Edition. Taylor & Francis Group,LLC.
McLachlan, M. S., Horstmann, M., & Hinkel, M. (1996).Polychlorinated dibenzo-p-dioxins and dibenzofurans insewage sludge: sources and fate following sludge applicationto land. The Science of the Total Environment, 185, 109–123.
Minomo, K., Ohtsuka, N., Hosono, S., Nojiri, K., & Kawamura,K. (2011). Seasonal change of PCDDs/PCDFs/DL-PCBs inwater of Ayase River, Japan: pollution sources and theircontributions to TEQ. Chemosphere, 85, 188–194.
Mostert, E. (2003). The European water framework directive andwater management research. Physics and Chemistry of theEarth, Parts A/B/C, 28, 523–527.
Näf, C., Broman, D., Ishaq, R., & Zebühr, Y. (1990). PCDDs andPCDFs in water, sludge and air samples from various levelsin a waste treatment plant with respect to composition chang-es and total flux. Chemosphere, 20, 1503–1510.
Oleszek-Kudlak, S., Grabda, M., Czaplicka, M., Rosik-Dulweska,C., Shibata, E., &Nakamura, T. (2005). Fate of PCDD/PCDFTuring mechnical -b io logica l s tudge t rea tment .Chamosphere, 61, 389–397.
Pham, T.-T., Proulx, S., Brochu, C., & Moore, S. (1999).Composition of PCBs and PAHs in the Montreal urbancommunity wastewater and in the surface water of the St.Lawrence river (Canada). Water Air and Soil Pollution, 111,251–270.
Rappe, C., Andersson, R., Bonner, M., Cooper, K., Fiedler, H., &Howell, F. (1998). PCDDs and PCDFs in municipal sewage
sludge and effluent from POTW in the state of Mississippi,USA. Chemosphere, 36, 315–328.
Rappe, C., Kjeller, L.-O., & Andersson, R. (1989). Analyses ofPCDDs and PCDFs in sludge and water samples.Chemosphere, 10, 13–20.
Rogers, H. R. (1996). Sources, behaviour and fate of organiccontaminants during sewage treatment and in sewage sludge.The Science of the Total Environment, 185, 3–26.
Saffari, R. V., & Saffari, M. (2013). Effect of treated municipalwastewater on bean growth, soil chemical properties, andchemical fractions of zinc and copper. Arabian Journal ofGeosciences, 6, 4475–4485.
Sewart, A., Harrad, S. J., McLachlan, M. S., McGrath, S. P., &Jones, K. C. (1995). PCDDs/Fs and non-o-PCBs in digestedUK sewage sludges. Chemosphere, 30, 51–67.
Smołka, A.B. (2008). Raport nt. Gospodarki ściekowej I problempunktowych zanieczyszczeń substancjami biogennymi wPolsce. [ang: report on wastewater management and the prob-lem of point nutrient pollution in Poland] Coalition Clean Baltic– Polski Klub Ekologiczny Koło Miejskie w Gliwicach(http://www.pkegliwice.pl/aktualnosci/2008/RAPORT_pol.pdf).
Shiu, W. Y., Doucette, W., Gobas, F. A. P. C., Andren, A., &Mackay, D. (1988). Physical–chemical properties of chlori-nated dibenzo-p-dioxins. Environmental Science &Technology, 22, 651–658. doi:10.1021/es00171a006.
Sztamberek-Gola, I., Grochowalski, A., & Chrząszcz, R. (2003).Monitoring of PCDDs, PCDFs and PAHs in waste-waterwith use the semipermeable membrane devices (SPMD).Organohalogen Compounds, 60, 45–48.
Thuan, N., Tsai, C. L., Weng, Y. M., Lee, T. Y., & Chang, M. B.(2011). Analysis of polychlorinated dibenzo-p-dioxins andfurans in various aqueous samples in Taiwan. Chemosphere,83, 760–766. doi:10.1016/j.chemosphere.2011.02.065.
UNEP (2012). The UN-Water status report on the application ofintegrated approaches to water resources management.
United Nations, Department of Economic and Social Affairs,Population Division (2011). World population prospects:the 2010 revision, highlights and advance tables. WorkingPaper No. ESA/P/WP.220.
Urbaniak, M., Kiedrzyńska, E., & Zalewski, M. (2012a). The roleof a lowland reservoir in the transport of micropollutants,nutrients and the suspended particulate matter along the rivercontinuum. Hydrology Research, 43(4), 400–411.
Urbaniak, M., Kiedrzyńska, E., Kiedrzyński, M., Mendra, M., &Grochowalski, A. (2014). The impact of point sources ofpollution on the transport of micropollutants along the rivercontinuum. Hydrology Research, 45(3), 391–410.
Urbaniak, M., Skowron, A., Zieliński, M., & Zalewski, M.(2012b). Hydrological and environment al conditions askey drivers for spatial and seasonal changes in PCDD/PCDF concentrations, transport and deposition along urbancascade reservoirs. Chemosphere, 88, 1358–1367.
US EPA (1994). Estimating exposure to dioxin-like compounds.Volume II: properties, sources, occurrence, and backgroundexposures. United States Environmental Protection. Agency,Office of Research and Development,Washington. EPA/600/6–88/005cb.
US EPA (2000). Progress in water quality: an evaluation for thenational investment in municipal wastewater treatment. EPA-832-R-00-008. Washington.
90 Page 12 of 13 Environ Monit Assess (2017) 189: 90
US EPA (2004). Clean watersheds needs survey 2004—report toc o n g r e s s . h t t p : / / w a t e r . e p a . g o v / s c i t e c h /?datait/databases/cwns/upload/2008_01_09_2004rtc_cwns2004rtc.pdf.
Wałęga, A., Chmielowski, K., & Satora, S. (2009). Water andwastewater management condition in Poland regarding water
framework directive implementation. Infrastructure andEcology of Rural Areas, 4, 57–72.
Wolska, I., Galer, K., & Namieśnik, J. (2003). Transport andspeciation of PAHs and PCBs in a river ecosystem. PolishJournal of Environmental Studies, 12(10), 105–110.
Environ Monit Assess (2017) 189: 90 Page 13 of 13 90


![Our Mission - pcdd.org Report-2010 pictures a… · Web viewA word from PCDD. Annual Report [2010] 7. Annual Report 2010During the year 2010 PCDD consolidated its fruitful partnerships](https://img.pdfslide.us/doc/110x75/5e08e4b45659d7779a512b94/our-mission-pcdd-report-2010-pictures-a-web-viewa-word-from-pcdd-annual-report.jpg)