Embed Size (px)
Citation preview

Determination of PCDD/Fs in Environmental Samples using Accelerated Solvent Extraction (ASE) and GC-MS/MSPaul Silcock,1 David Gardner,2 John Fardon,2 Steve Moss2 and Inge de Dobbeleer1 1Thermo Scientific POPs Centre of Excellence, Bremen, Germany2National Laboratory Service - Environment Agency, Leeds, United Kingdom
Ap
plica
tion
No
te 1
03
36
Key WordsDioxins, furans, PCDD, PCDF, environmental, fly ash, sediments, complex matrix, accelerated solvent extraction, isotope dilution, pressurized solvent extraction
IntroductionThe measurement of PCDD/Fs in the environment is a widespread activity carried out by many regulatory agencies globally. The chronic toxicity of these compounds to humans and wildlife at extremely low concentrations requires that the techniques used in determination must be both sensitive and selective enough to allow high confidence results. This is especially true when measuring background levels in environmental matrices, such as soil and sediment or byproducts from waste incineration processes. Traditionally high resolution magnetic sector GC-MS (GC-HRMS) instrumentation has delivered the required analytical performance and has become the gold standard technique. In recent years, there has been more interest in GC triple-quadrupole instrumentation for this purpose, especially in the area of food safety control.1,2 For this area and environmental analysis, it is necessary to deliver data that performs in the range of HRMS systems, which requires especially sensitive triple-quadrupole systems. It is also necessary to incorporate data-processing software specifically designed to handle the complex calculations associated with dioxins analysis.
This application note describes the use of the Thermo Scientific™ TSQ Quantum™ XLS Ultra GC-MS/MS as applied to the analysis of PCDDs/PCDFs in sediments, soils, bottom, and fly ash (as incineration by-products) at the levels of interest and the level of agreement with “gold standard” analysis using GC-HRMS.
During this study, instrumental LOQs using GC-MS/MS were calculated in the low fg/µL concentration ranges. This, along with further analytical performance, is discussed alongside GC-HRMS; especially the degree of agreement between the techniques in some routine sample batches.
Materials and MethodsExtraction and CleanupThe standard spiking protocols, extraction, and cleanup process for all sediment and soil samples were performed using an ISO17025 accredited in-house variation of EPA 1613B3. For incinerator ash samples, an in-house method based upon EN 19484 was applied.
For both of these methods, accelerated solvent extraction was used as the preferred technique for extraction after initial sample processing. This is routinely used in the laboratory to reduce solvent consumption, allow for automation, and to generate efficient sample extractions within the performance limits required.
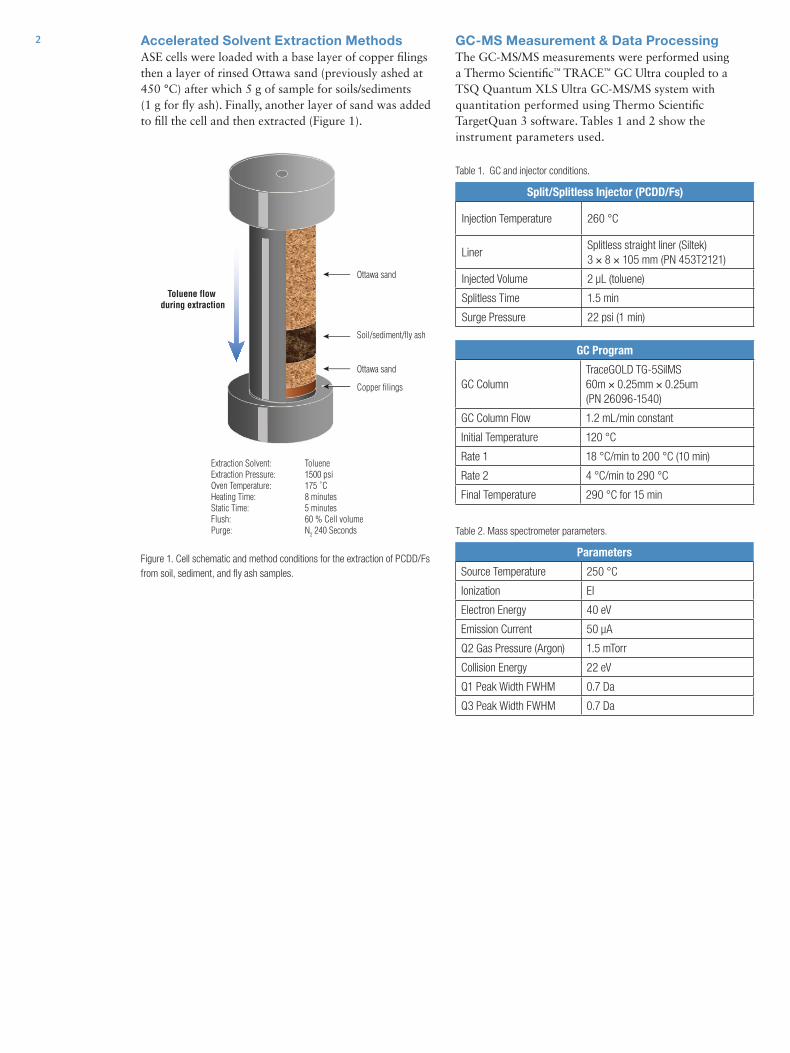
2 Accelerated Solvent Extraction MethodsASE cells were loaded with a base layer of copper filings then a layer of rinsed Ottawa sand (previously ashed at 450 °C) after which 5 g of sample for soils/sediments (1 g for fly ash). Finally, another layer of sand was added to fill the cell and then extracted (Figure 1).
Figure 1. Cell schematic and method conditions for the extraction of PCDD/Fs from soil, sediment, and fly ash samples.
Table 1. GC and injector conditions.
Table 2. Mass spectrometer parameters.
GC-MS Measurement & Data ProcessingThe GC-MS/MS measurements were performed using a Thermo Scientific™ TRACE™ GC Ultra coupled to a TSQ Quantum XLS Ultra GC-MS/MS system with quantitation performed using Thermo Scientific TargetQuan 3 software. Tables 1 and 2 show the instrument parameters used.
Split/Splitless Injector (PCDD/Fs)
Injection Temperature 260 °C
LinerSplitless straight liner (Siltek) 3 × 8 × 105 mm (PN 453T2121)
Injected Volume 2 µL (toluene)
Splitless Time 1.5 min
Surge Pressure 22 psi (1 min)
GC Program
GC ColumnTraceGOLD TG-5SilMS 60m × 0.25mm × 0.25um (PN 26096-1540)
GC Column Flow 1.2 mL/min constant
Initial Temperature 120 °C
Rate 1 18 °C/min to 200 °C (10 min)
Rate 2 4 °C/min to 290 °C
Final Temperature 290 °C for 15 min
Parameters
Source Temperature 250 °C
Ionization EI
Electron Energy 40 eV
Emission Current 50 µA
Q2 Gas Pressure (Argon) 1.5 mTorr
Collision Energy 22 eV
Q1 Peak Width FWHM 0.7 Da
Q3 Peak Width FWHM 0.7 Da
Extraction Solvent: TolueneExtraction Pressure: 1500 psiOven Temperature: 175 ˚CHeating Time: 8 minutesStatic Time: 5 minutesFlush: 60 % Cell volumePurge: N2 240 Seconds
Ottawa sand
Ottawa sand
Soil/sediment/fly ash
Copper filings
Toluene flow during extraction
3
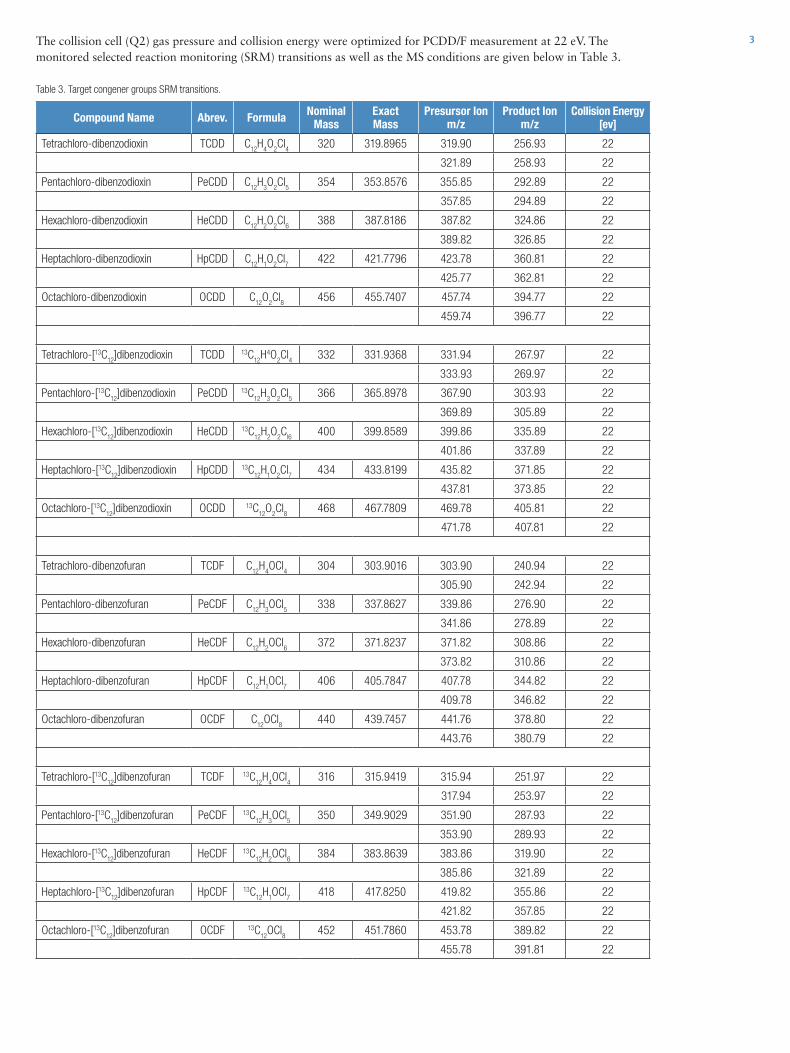
Table 3. Target congener groups SRM transitions.
The collision cell (Q2) gas pressure and collision energy were optimized for PCDD/F measurement at 22 eV. The monitored selected reaction monitoring (SRM) transitions as well as the MS conditions are given below in Table 3.
Compound Name Abrev. Formula Nominal Mass
Exact Mass
Presursor Ion m/z
Product Ion m/z
Collision Energy [ev]
Tetrachloro-dibenzodioxin TCDD C12
H4O
2Cl
4320 319.8965 319.90 256.93 22
321.89 258.93 22
Pentachloro-dibenzodioxin PeCDD C12
H3O
2Cl
5354 353.8576 355.85 292.89 22
357.85 294.89 22
Hexachloro-dibenzodioxin HeCDD C12
H2O
2Cl
6388 387.8186 387.82 324.86 22
389.82 326.85 22
Heptachloro-dibenzodioxin HpCDD C12
H1O
2Cl
7422 421.7796 423.78 360.81 22
425.77 362.81 22
Octachloro-dibenzodioxin OCDD C12
O2Cl
8456 455.7407 457.74 394.77 22
459.74 396.77 22
Tetrachloro-[13C12
]dibenzodioxin TCDD 13C12
H4O2Cl
4332 331.9368 331.94 267.97 22
333.93 269.97 22
Pentachloro-[13C12
]dibenzodioxin PeCDD 13C12
H3O
2Cl
5366 365.8978 367.90 303.93 22
369.89 305.89 22
Hexachloro-[13C12
]dibenzodioxin HeCDD 13C12
H2O
2C
l6400 399.8589 399.86 335.89 22
401.86 337.89 22
Heptachloro-[13C12
]dibenzodioxin HpCDD 13C12
H1O
2Cl
7434 433.8199 435.82 371.85 22
437.81 373.85 22
Octachloro-[13C12
]dibenzodioxin OCDD 13C12
O2Cl
8468 467.7809 469.78 405.81 22
471.78 407.81 22
Tetrachloro-dibenzofuran TCDF C12
H4OCl
4304 303.9016 303.90 240.94 22
305.90 242.94 22
Pentachloro-dibenzofuran PeCDF C12
H3OCl
5338 337.8627 339.86 276.90 22
341.86 278.89 22
Hexachloro-dibenzofuran HeCDF C12
H2OCl
6372 371.8237 371.82 308.86 22
373.82 310.86 22
Heptachloro-dibenzofuran HpCDF C12
H1OCl
7406 405.7847 407.78 344.82 22
409.78 346.82 22
Octachloro-dibenzofuran OCDF C12
OCl8
440 439.7457 441.76 378.80 22
443.76 380.79 22
Tetrachloro-[13C12
]dibenzofuran TCDF 13C12
H4OCl
4316 315.9419 315.94 251.97 22
317.94 253.97 22
Pentachloro-[13C12
]dibenzofuran PeCDF 13C12
H3OCl
5350 349.9029 351.90 287.93 22
353.90 289.93 22
Hexachloro-[13C12
]dibenzofuran HeCDF 13C12
H2OCl
6384 383.8639 383.86 319.90 22
385.86 321.89 22
Heptachloro-[13C12
]dibenzofuran HpCDF 13C12
H1OCl
7418 417.8250 419.82 355.86 22
421.82 357.85 22
Octachloro-[13C12
]dibenzofuran OCDF 13C12
OCl8
452 451.7860 453.78 389.82 22
455.78 391.81 22
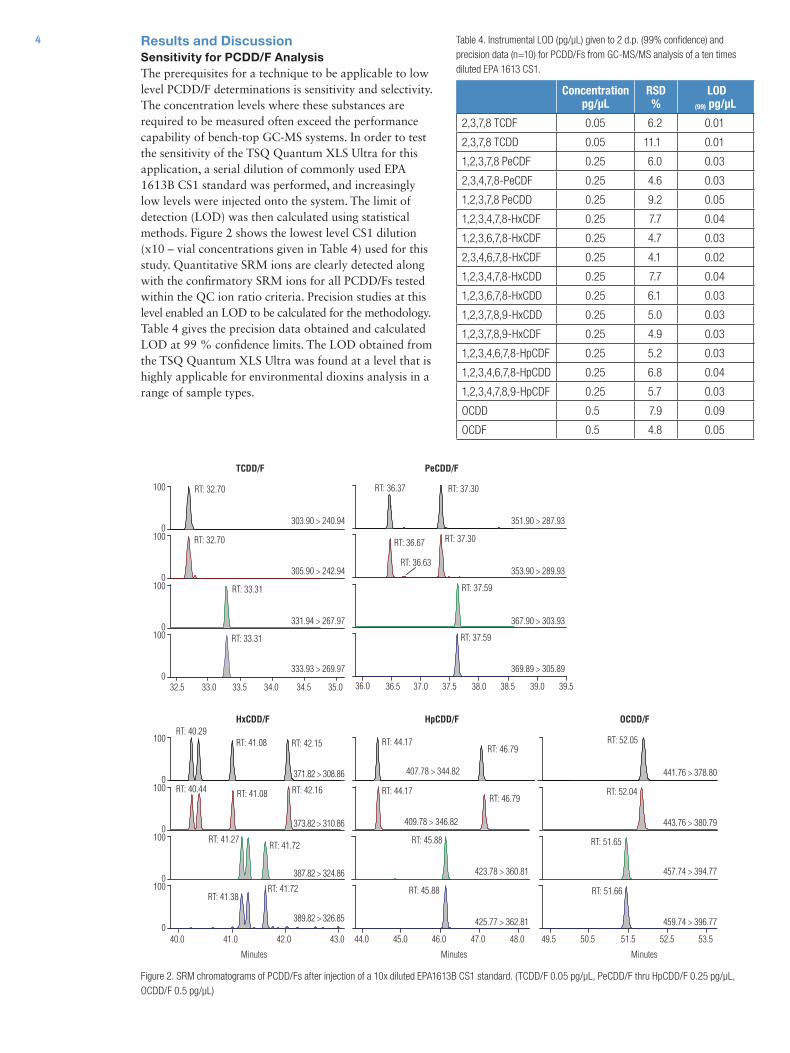
4 Results and DiscussionSensitivity for PCDD/F Analysis The prerequisites for a technique to be applicable to low level PCDD/F determinations is sensitivity and selectivity. The concentration levels where these substances are required to be measured often exceed the performance capability of bench-top GC-MS systems. In order to test the sensitivity of the TSQ Quantum XLS Ultra for this application, a serial dilution of commonly used EPA 1613B CS1 standard was performed, and increasingly low levels were injected onto the system. The limit of detection (LOD) was then calculated using statistical methods. Figure 2 shows the lowest level CS1 dilution (x10 – vial concentrations given in Table 4) used for this study. Quantitative SRM ions are clearly detected along with the confirmatory SRM ions for all PCDD/Fs tested within the QC ion ratio criteria. Precision studies at this level enabled an LOD to be calculated for the methodology. Table 4 gives the precision data obtained and calculated LOD at 99 % confidence limits. The LOD obtained from the TSQ Quantum XLS Ultra was found at a level that is highly applicable for environmental dioxins analysis in a range of sample types.
Table 4. Instrumental LOD (pg/µL) given to 2 d.p. (99% confidence) and precision data (n=10) for PCDD/Fs from GC-MS/MS analysis of a ten times diluted EPA 1613 CS1.
Figure 2. SRM chromatograms of PCDD/Fs after injection of a 10x diluted EPA1613B CS1 standard. (TCDD/F 0.05 pg/µL, PeCDD/F thru HpCDD/F 0.25 pg/µL, OCDD/F 0.5 pg/µL)
Concentration pg/µL
RSD %
LOD (99) pg/µL
2,3,7,8 TCDF 0.05 6.2 0.01
2,3,7,8 TCDD 0.05 11.1 0.01
1,2,3,7,8 PeCDF 0.25 6.0 0.03
2,3,4,7,8-PeCDF 0.25 4.6 0.03
1,2,3,7,8 PeCDD 0.25 9.2 0.05
1,2,3,4,7,8-HxCDF 0.25 7.7 0.04
1,2,3,6,7,8-HxCDF 0.25 4.7 0.03
2,3,4,6,7,8-HxCDF 0.25 4.1 0.02
1,2,3,4,7,8-HxCDD 0.25 7.7 0.04
1,2,3,6,7,8-HxCDD 0.25 6.1 0.03
1,2,3,7,8,9-HxCDD 0.25 5.0 0.03
1,2,3,7,8,9-HxCDF 0.25 4.9 0.03
1,2,3,4,6,7,8-HpCDF 0.25 5.2 0.03
1,2,3,4,6,7,8-HpCDD 0.25 6.8 0.04
1,2,3,4,7,8,9-HpCDF 0.25 5.7 0.03
OCDD 0.5 7.9 0.09
OCDF 0.5 4.8 0.05
32.5 33.0 33.5 34.0 34.5 35.0
40.0 41.0 42.0 43.0
36.0 36.5 37.0 37.5 38.0 39.038.5 39.5
100
0100
0100
0100
0
100
0100
0100
0100
044.0 45.0 46.0 47.0 48.0 49.5 50.5 51.5 52.5 53.5
TCDD/F
HxCDD/F HpCDD/F
PeCDD/F
OCDD/F
Minutes Minutes Minutes
RT: 46.79
RT: 32.70
303.90 > 240.94
305.90 > 242.94
331.94 > 267.97
333.93 > 269.97
371.82 > 308.86
373.82 > 310.86
387.82 > 324.86
389.82 > 326.85
351.90 > 287.93
353.90 > 289.93
367.90 > 303.93
369.89 > 305.89
407.78 > 344.82 441.76 > 378.80
443.76 > 380.79
457.74 > 394.77
459.74 > 396.77
409.78 > 346.82
423.78 > 360.81
425.77 > 362.81
RT: 32.70
RT: 33.31
RT: 33.31
RT: 36.37 RT: 37.30
RT: 36.67
RT: 36.63
RT: 37.30
RT: 37.59
RT: 37.59
RT: 40.29RT: 41.08 RT: 42.15
RT: 40.44 RT: 41.08 RT: 42.16
RT: 41.27RT: 41.72
RT: 41.38RT: 41.72
RT: 44.17
RT: 44.17RT: 46.79
RT: 45.88
RT: 45.88
RT: 52.05
RT: 52.04
RT: 51.65
RT: 51.66
5
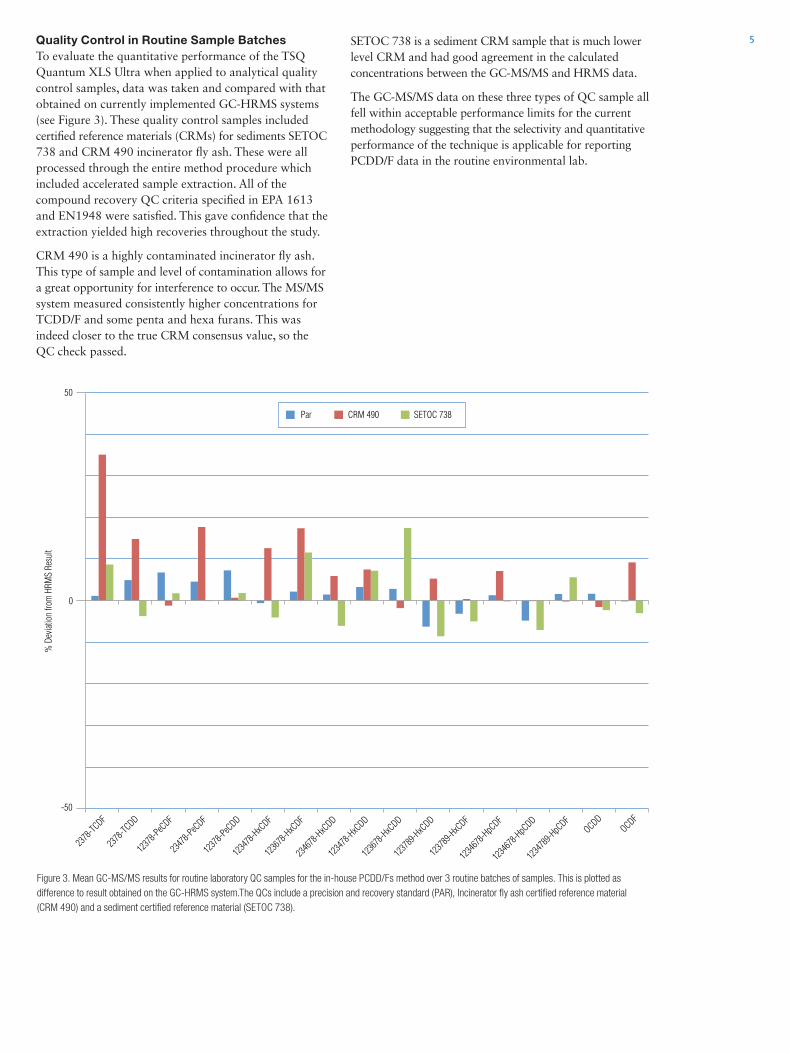
Figure 3. Mean GC-MS/MS results for routine laboratory QC samples for the in-house PCDD/Fs method over 3 routine batches of samples. This is plotted as difference to result obtained on the GC-HRMS system.The QCs include a precision and recovery standard (PAR), Incinerator fly ash certified reference material (CRM 490) and a sediment certified reference material (SETOC 738).
Quality Control in Routine Sample BatchesTo evaluate the quantitative performance of the TSQ Quantum XLS Ultra when applied to analytical quality control samples, data was taken and compared with that obtained on currently implemented GC-HRMS systems (see Figure 3). These quality control samples included certified reference materials (CRMs) for sediments SETOC 738 and CRM 490 incinerator fly ash. These were all processed through the entire method procedure which included accelerated sample extraction. All of the compound recovery QC criteria specified in EPA 1613 and EN1948 were satisfied. This gave confidence that the extraction yielded high recoveries throughout the study.
CRM 490 is a highly contaminated incinerator fly ash. This type of sample and level of contamination allows for a great opportunity for interference to occur. The MS/MS system measured consistently higher concentrations for TCDD/F and some penta and hexa furans. This was indeed closer to the true CRM consensus value, so the QC check passed.
SETOC 738 is a sediment CRM sample that is much lower level CRM and had good agreement in the calculated concentrations between the GC-MS/MS and HRMS data.
The GC-MS/MS data on these three types of QC sample all fell within acceptable performance limits for the current methodology suggesting that the selectivity and quantitative performance of the technique is applicable for reporting PCDD/F data in the routine environmental lab.
% D
eviat
ion
from
HRM
S Re
sult
50
0
-50
2378
-TCDF
2378
-TCDD
1237
8-PeC
DF
2347
8-PeC
DF
1237
8-PeC
DD
1234
78-H
xCDF
1236
78-H
xCDF
2346
78-H
xCDD
1234
78-H
xCDD
1236
78-H
xCDD
1237
89-H
xCDD
1237
89-H
xCDF
1234
678-H
pCDF
1234
678-H
pCDD
1234
789-H
pCDF
OCDDOCDF
Par CRM 490 SETOC 738
6
Table 5. Calculated concentrations of TCDD/F congeners in soil and sediment samples run on both GC-MS/MS and GC-HRMS. (ND=not detected)
Soil Sediment 1 Sediment 2 SETOC 738 (CRM
GC-MS/MS ng/kg
GC-HRMS ng/kg
GC-MS/MS ng/kg
GC-HRMS ng/kg
GC-MS/MS ng/kg
GC-HRMS ng/kg
GC-MS/MS ng/kg
GC-HRMS ng/kg
2,3,7,8 TCDF 0.992 1.23 16.0 10.4 2.15 1.51 17.9 17.1
2,3,7,8 TCDD ND ND 1.85 2.29 2.03 5.10 23.1 23.9
1,2,3,7,8 PeCDF 1.26 <1.79 25.4 25.4 4.90 4.52 7.36 6.76
2,3,4,7, 8 PeCDF 1.57 1.96 41.5 44.2 10.7 9.29 47.8 45.4
1,2,3,7,8, PeCDD 0.436 ND 5.49 5.71 9.14 7.95 7.26 6.91
1,2,3,4,7,8,-HxCDF 1.89 1.89 56.1 57.3 64.8 71.9 43.8 45.1
1,2,3,6,7,8,-HxCDF 1.81 2.14 64.8 55.0 223 197 15.1 14.7
2,3,4,6,7,8,-HxCDF 2.53 2.83 86.9 91.5 9.47 11.5 20.2 18.4
1,2,3,4,7,8,-HxCDD 0.271 ND 5.38 6.34 15.0 10.9 10.4 8.62
1,2,3,6,7,8,-HxCDD 0.382 0.905 8.33 8.58 17.6 16.7 28.1 20.1
1,2,3,7,8,9-HxCDD 0.469 ND 6.62 6.97 17.5 14.0 21.4 22.4
1,2,3,7,8,9-HxCDF 0.932 ND 25.8 31.4 15.2 13.4 4.65 5.40
1,2,3,4,6,7,8-HpCDF 12.9 14.2 464 473 5.05 4.58 214 202
1,2,3,4,6,7,8-HpCDD 4.80 5.78 63.4 62.2 18.3 16.6 416 433
1,2,3,4,7,8,9-HpCDF 1.90 3.07 48.8 48.8 68.3 54.4 15.1 15.4
OCDD 24.7 23.8 153 191 6.38 5.38 3020 3030
OCDF 258 291 475 554 47.7 39.5 290 316
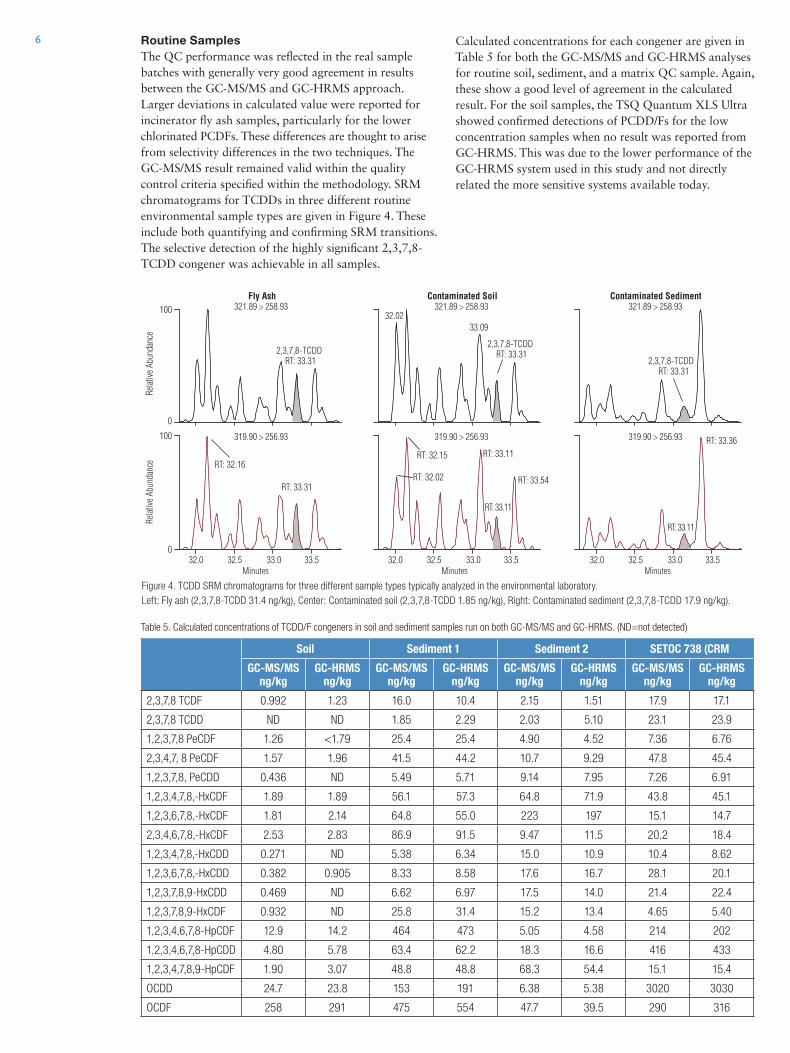
Figure 4. TCDD SRM chromatograms for three different sample types typically analyzed in the environmental laboratory. Left: Fly ash (2,3,7,8-TCDD 31.4 ng/kg), Center: Contaminated soil (2,3,7,8-TCDD 1.85 ng/kg), Right: Contaminated sediment (2,3,7,8-TCDD 17.9 ng/kg).
Routine SamplesThe QC performance was reflected in the real sample batches with generally very good agreement in results between the GC-MS/MS and GC-HRMS approach. Larger deviations in calculated value were reported for incinerator fly ash samples, particularly for the lower chlorinated PCDFs. These differences are thought to arise from selectivity differences in the two techniques. The GC-MS/MS result remained valid within the quality control criteria specified within the methodology. SRM chromatograms for TCDDs in three different routine environmental sample types are given in Figure 4. These include both quantifying and confirming SRM transitions. The selective detection of the highly significant 2,3,7,8-TCDD congener was achievable in all samples.
Calculated concentrations for each congener are given in Table 5 for both the GC-MS/MS and GC-HRMS analyses for routine soil, sediment, and a matrix QC sample. Again, these show a good level of agreement in the calculated result. For the soil samples, the TSQ Quantum XLS Ultra showed confirmed detections of PCDD/Fs for the low concentration samples when no result was reported from GC-HRMS. This was due to the lower performance of the GC-HRMS system used in this study and not directly related the more sensitive systems available today.
Relat
ive A
bund
ance
Relat
ive A
bund
ance
Minutes Minutes Minutes
100
0
100
032.0 32.5 33.0 33.5 32.0 32.5 33.0 33.5 32.0 32.5 33.0 33.5
321.89 > 258.93 321.89 > 258.93 321.89 > 258.93Fly Ash Contaminated Soil Contaminated Sediment
319.90 > 256.93 319.90 > 256.93 319.90 > 256.93
2,3,7,8-TCDDRT: 33.31
2,3,7,8-TCDDRT: 33.31
2,3,7,8-TCDDRT: 33.31
32.0233.09
RT: 32.16
RT: 33.31RT: 32.02
RT: 32.15 RT: 33.11
RT: 33.11
RT: 33.54
RT: 33.11
RT: 33.36
Africa-Other +27 11 570 1840Australia +61 3 9757 4300Austria +43 1 333 50 34 0Belgium +32 53 73 42 41Canada +1 800 530 8447China +86 10 8419 3588Denmark +45 70 23 62 60
Europe-Other +43 1 333 50 34 0Finland/Norway/Sweden +46 8 556 468 00France +33 1 60 92 48 00Germany +49 6103 408 1014India +91 22 6742 9434Italy +39 02 950 591
Japan +81 45 453 9100Latin America +1 561 688 8700Middle East +43 1 333 50 34 0Netherlands +31 76 579 55 55New Zealand +64 9 980 6700Russia/CIS +43 1 333 50 34 0South Africa +27 11 570 1840
Spain +34 914 845 965Switzerland +41 61 716 77 00UK +44 1442 233555USA +1 800 532 4752
www.thermoscientific.com©2013 Thermo Fisher Scientific Inc. All rights reserved. ISO is a trademark of the International Standards Organization. All other trademarks are the property of Thermo Fisher Scientific Inc. and its subsidiaries. Specifications, terms and pricing are subject to change. Not all products are available in all countries. Please consult your local sales representative for details.
Ap
plica
tion
No
te 1
03
36
Thermo Fisher Scientific, Austin, TX USA is ISO 9001:2013 Certified.
AN10336_E 07/13S
Conclusion• TheTSQQuantumXLSUltraGC-MS/MSisahighly
sensitive and selective system applicable to dioxins and furans analysis in a range of environmental sample types and generates results that perform within current in-house QC criteria.
• Somedifferencesariseinthecalculatedconcentrationbetween the GC-MS/MS and GC-HRMS analysis. These are thought to be related to the differences in the selectivity mechanism of each system.
• GC-MS/MSappliedtoPCDD/Fsstillallowsforfullisotope dilution quantitation as currently used by GC-HRMS systems. TargetQuan 3 software can be used with the TSQ Quantum XLS Ultra to provide the specific calculations required.
• TheThermoScientific™ Dionex™ ASE™ Accelerated Solvent Extractor system allows for unattended, efficient extractions from all samples and enabled recoveries well within QC criteria.
References1. Ingelido, A. M.; Brambilla, G.; Abballe, A.;
di Domenico, A.; Fulgenzi, A. R.; Iacovela, N.; Lamiceli, L.; Valentini, S.; De Felip, E. Rapid Commun. Mass Spectrom. 2012, 26(3), 236–242.
2. Kotz, A.;, Malisch, R.; Wahl, K.; Bitomsky, N.; Adamovic, K.; Gerteisen, I.; Leswal, S.; Schächtele, J.; Tritschler, R.; Winterhalter, H. Organohalogen Compd. 2011, 73, 688–691.
3. Silcock, P.; Krumwiede, D.; de Dobbeleer, I.; Huebschmann, H. J.; Kotz, A. 2011, Thermo Scientific Application Note 52266.


![Our Mission - pcdd.org Report-2010 pictures a… · Web viewA word from PCDD. Annual Report [2010] 7. Annual Report 2010During the year 2010 PCDD consolidated its fruitful partnerships](https://img.pdfslide.us/doc/110x75/5e08e4b45659d7779a512b94/our-mission-pcdd-report-2010-pictures-a-web-viewa-word-from-pcdd-annual-report.jpg)