Embed Size (px)
Citation preview

Purdue UniversityPurdue e-Pubs
Purdue CIBER Working Papers Krannert Graduate School of Management
1-1-2001
The Value Relevance and Reliability of BrandAssets Recognized by UK FirmsSanjay KallapurPurdue University
Sabrina KwanHong Kong University of Science and Technology
Follow this and additional works at: http://docs.lib.purdue.edu/ciberwp
This document has been made available through Purdue e-Pubs, a service of the Purdue University Libraries. Please contact [email protected] foradditional information.
Kallapur, Sanjay and Kwan, Sabrina, "The Value Relevance and Reliability of Brand Assets Recognized by UK Firms" (2001). PurdueCIBER Working Papers. Paper 18.http://docs.lib.purdue.edu/ciberwp/18
The Value Relevance and Reliability of Brand Assets
Recognized by UK Firms
Sanjay Kallapur*
Purdue University
And
University of California, Irvine
Phone: (949) 824-1279
Sabrina Kwan
Hong Kong University of Science and Technology
Phone: (852) 2358-7566
Fax: (852) 2358-1693
December 2002 *Corresponding author. We thank Ashiq Ali, Mary Barth, Kevin Chen, Kay Stice, T. J. Wong, and seminar participants at the Hong Kong University of Science and Technology and Purdue University for useful comments. Sanjay Kallapur thanks the Center for International Business Education and Research at Purdue University for financial support.
The Value Relevance and Reliability of Brand Assets Recognized by UK Firms
ABSTRACT
We examine the value relevance and reliability of brand assets recognized by 33 UK firms, and the stock price reaction to the announcement of brand capitalization. We find that brand assets are value relevant, i.e., associated with market values. However, the market capitalization rates of brands of firms with low contracting incentives—firms with no transactions that avoided the London Stock Exchange (LSE) rule requiring shareholder approval for acquisitions/disposals, and firms with industry-adjusted leverage below the sample median—are higher than those of firms with high contracting incentives. Thus there could be substantial differences in the extent of bias or error in brand valuations of firms with different levels of contracting incentives, i.e., brand asset measures might not be reliable. The stock price reaction during the 21 days surrounding the first announcement of brand recognition has a significantly positive association with the recognized brand amount. However, the brand coefficient is only a small fraction of the reaction that would be expected if markets did not impute any value to brands before firms recognized them. Few previous value-relevance studies have examined intangible assets recognized in financial statements, and none have examined the effects of contracting incentives on the reliability of intangible assets.
Key Words: brand assets, intangible assets, contracting incentives, value relevance, and reliability. JEL Classification Codes: M4. Data Availability: The data are available from public sources identified in the text.
1
The Value Relevance and Reliability of Brand Assets Recognized by UK Firms
I. Introduction
Previous studies, including one on brands (Barth et al. 1998b), find that intangible
assets are value relevant (see Holthausen and Watts, 2001, 21, and their Table 1 which
lists eight value-relevance studies on intangible assets). The intangible assets examined in
these studies (except Barth and Clinch, 1998, who examine Australian firms’ revaluations
of both tangible and intangible assets) were not recognized in the financial statements.
Rather, the asset measures were constructed by researchers or other outside parties who,
unlike managers, do not have contracting incentives to bias their valuations.
Our study adds to the literature by examining the relevance and reliability of
brands recognized on the balance sheets of 33 UK firms beginning in 1985. Brand asset
measurement in our sample is subject to managerial discretion—the sample firms
acquired brands not in isolation but instead as part of a business acquisition, and valued
them separately from goodwill. We examine three research questions. One, are
recognized brand asset measures value relevant? Two, do the market capitalization rates
of brand assets differ for firms that have high and low incentives to bias the recognized
brand amounts? Three, did the news of brand capitalization convey information to stock
markets?
Regressing market values on brand assets, with book values of net non-brand
assets, net income, and fixed year- and firm-effects as control variables, we find a
positive (+1.24) and significant (at better than the 1 percent level) coefficient on brand
assets. Our sample consists of 232 firm-year observations of the 33 brand capitalizing
2
firms during the 1984-1998 period. As do previous studies (see Barth et al., 2001), we
interpret a significant coefficient to mean that managers’ brand valuations are relevant
and at least to some degree reliable.
By showing the value relevance of a recognized intangible asset we address one
of Holthausen and Watts’s (2001) criticisms of existing value-relevance studies that
examine outsiders’ valuations. They point out that managers have incentives to bias
recognized amounts because of incentives relating to contracts such as bonus plans,
compensation based on stock price which could be temporarily affected by managerial
mis-statements, or debt covenants. Therefore, Holthausen and Watts (2001) argue, an
asset measure that was value relevant when it was merely disclosed could cease to
become value relevant when recognized. Contracting incentives are likely to be strong in
our setting because brand assets are a substantial fraction of net assets: the median firm’s
brand assets are 44.2 percent of book value of equity (including brands). Also, brand
accounting was regarded as controversial.1 We find that brands are value-relevant despite
these reasons to expect that lack of reliability might overwhelm relevance.
Although value relevance implies that brand asset measures are not totally
unreliable, we also perform a stronger test of reliability by investigating differences in
brand capitalization rates of firms with strong and weak contracting incentives. If firms
with high contracting incentives overvalue brands or introduce greater noise (as
Holthausen and Watts, 2001, 29, argue) then their brand capitalization rates should be
1Farquhar, Han, and Ijiri (1992) quote a statement by the chairman of Britain’s Accounting Standards Committee that brand accounting was the major accounting controversy of the last twenty years. Smith (1996) includes it among controversial accounting practices. A London Business School study commissioned by the Institute of Chartered Accountants in England and Wales (Barwise et al. 1989, 78) concludes that the problems facing brand valuation, including subjectivity and lack of precision, are “too intractable to produce useful and meaningful numbers.”
3
lower. Predictable differences in valuation biases or noise would suggest a lack of
consensus, violating verifiability, a component of reliability.2 We base our measures of
contracting incentives on Mather and Peasnell’s (1991) and Muller’s (1999) findings that
brand recognition helped firms avoid London Stock Exchange (LSE) rules requiring
shareholder approval for certain transactions, and reduce their leverage.3 We thus
partition our sample into subsamples according to (1) whether or not the firm was
affected by the LSE rule requiring shareholder approval for large acquisitions/disposals,
and (2) whether the industry-adjusted debt-to-book-equity ratio was above or below the
median.
Regressing market values on book values, net incomes, brand assets, the variables
interacted with a dummy variable based on the LSE rule, and firm- and year-effects, we
find that the brand coefficients for firms with high and low incentives to overstate brands
are 0.35 and 1.94 respectively. Similarly, we find that brand coefficients for high- and
low-leverage firms are 0.40 and 1.91. In each regression the difference between brand
capitalization rates of firms with low and high incentives (1.94 – 0.35 = 1.59 and 1.91 –
0.40 = 1.51 respectively) is statistically significant, while the brand coefficient for firms
with high contracting incentives to overstate brands (0.35 and 0.40 respectively) is
insignificant. These findings suggest that managers’ discretionary valuations of intangible
assets recognized in financial statements might not be reliable. However, given the
2 Statement of Financial Accounting Concepts (SFAC) 2: Qualitative Characteristics of Accounting Information (1980) defines verifiability as “the ability through consensus among measurers to ensure that information represents what it purports to represent or that the chosen method of measurement has been used without error or bias.” Differences in error and bias among different groups of firms would therefore signify a lack of verifiability. Besides verifiability, SFAC 2 mentions representational faithfulness and neutrality as the other components of reliability. 3 These studies, however, do not provide any evidence on value relevance or on whether these contracting incentives affect the market capitalization rates of the recognized amounts, the central questions in this study.
4
differences in market capitalization rates, the markets do seem capable of seeing through
the differences in reliability--our findings therefore do not suggest that markets are
misled by the lack of reliability.
It is possible on the other hand that markets are misled by non-recognition of
brands, i.e., they undervalue brand-intensive firms in the absence of disclosure or
recognition of brand asset values. If so, the news of brand recognition should convey
information to stock markets. We find that announcements of brand capitalization indeed
result in positive abnormal returns on average equaling 12 percent of the value of the
brands deflated by market value. Besides undervaluation, the benefits of relaxing
contracting constraints can also explain the positive return. Although we attempt to
distinguish between the two possible explanations by examining difference in abnormal
returns to firms with high and low contracting incentives, we obtain insignificant
coefficient differences; this prevents us from drawing any conclusions. Nevertheless,
undervaluation, if any, is small in magnitude--the 0.12 coefficient is much lower than the
brand capitalization rate we obtain in our value-relevance regression, 1.24, suggesting
that most of the brand values had been capitalized into share prices before firms
recognized them.
We are not aware of any study that examines the reliability of intangible assets,
except those that find intangible assets to be value relevant and hence conclude that their
measures are at least to some degree reliable. In other work on the value relevance of
discretionary amounts recognized in financial statements, Aboody et al. (1999) examine
the value relevance of upward revaluations of tangible fixed assets by UK firms, and
examine the effect on value relevance of the debt-to-book-equity ratio. The difference in
5
coefficients between high- and low-leverage firms in their study is lower than in our
sample. A possible explanation for their smaller difference is that we study an intangible
asset; such assets are generally considered to be more difficult to value (Barth and
Landsman, 1995) and hence afford managers more discretion. Also, our sample firms’
brand assets are a much higher fraction of book values of net assets, for the median firm
44.2 percent, than are revaluation reserves in Aboody et al.’s (1999) sample (6.5 percent).
Our finding therefore indicates that large cross-sectional differences in market
capitalization rates could be observed if valuations are subjective and contracting
incentives are strong.
In contributing to the literature on value relevance and reliability of intangible
assets, and more generally of recognized discretionary amounts, our findings also
contribute to the policy debate on recognition of intangible assets. An article in Forbes
(Stewart 2001), for example, opines that the existing accounting system that ignores self-
generated intangible assets is like an octogenarian butler; although faithful, he has “lost
track of some valuable jewels, paid no attention to the furnace and the water heater, and
put the place at risk.” The Economist (2001), on the other hand, argues that intangible
assets cannot be reliably valued, and “soft measures, if required by the authorities, could
end up being used to hoodwink investors.” Also, responding to suggestions in “hundreds
of recent articles, studies, and consultants’ reports” (FASB, 2001, 2), in January 2002 the
FASB added to its agenda a project on disclosure of self-generated intangible assets. The
proposal (FASB, 2001) states that a secondary goal of the project is to take a step towards
potential eventual recognition of the intangible assets. While our results should help
standard setters by providing evidence of value relevance and suggesting problems with
6
reliability, we do not draw explicit policy conclusions because the trade-off between
relevance and reliability for standard setting is not precisely quantified (Barth et al. 2001,
81). Moreover, accounting standards are shaped by factors other than value relevance and
reliability (Holthausen and Watts, 2001).
II. Brand Accounting in UK, and Contracting Incentives
UK company law and Statement of Standard Accounting Practice (SSAP) 14:
Group Accounts (1978)4 permit companies to recognize acquired as well as self-
generated brands, trademarks and titles. The Companies Act 1985 allows intangible
assets, including self-generated ones, other than goodwill, to be recognized at “current
cost” (generally taken to be the lower of replacement cost or realizable value). SSAP 14
requires that the purchase price of a business acquisition be allocated to tangible assets
and identifiable intangible assets other than goodwill on the basis of fair value to
acquiror. Trademarks and publishing titles are cited as examples of identifiable intangible
assets in the Companies Act 1985, SSAP 14, and SSAP 22: Accounting for Goodwill
(1984).
Three of our 33 sample firms capitalized self-generated titles and brands (along
with other acquired ones),5 but the other firms capitalized only brands obtained as part of
a business acquisition. In either case managers have discretion in valuation—in the case
of self-generated brands for determination of replacement costs and realizable values, and
in the case of acquired brands for determination of fair values.
4 SSAP 14 was superseded by the Financial Reporting Standard (FRS) 2: Accounting for subsidiary undertakings in 1992. FRS 2 does not change the relevant SSAP 14 provisions about allocation of the purchase price. 5 Rank Hovis McDougall capitalized acquired and self-generated brands when it was subject to a takeover threat. The Telegraph and Goodhead also capitalized self-generated titles.
7
Firms had contracting incentives to overstate brand assets in business acquisitions
because any part of the acquisition price that was not allocated to tangible assets and
identifiable intangible assets was instead allocated to goodwill (SSAP 22). Unlike in the
USA, goodwill was immediately written off to owners’ equity. Brands, on the other hand,
were capitalized. Moreover, firms were not required to amortize brands except in case of
value impairment. The difference in the treatment of goodwill versus brands gave firms
an incentive to recognize brands separately from goodwill.6 Overstatement of brand
assets would reduce the amount of goodwill written off to owners’ equity, and thereby
reduce the adverse effect on debt-to-book-equity ratios.7 This is an important contracting
consideration because many UK firms have a provision in their charter prohibiting them
from borrowing if it increases the debt-to-book-equity ratio beyond a certain limit.8 UK
banks also consider the debt-to-book-equity ratio in making their lending decisions
(Citron 1992).
Another contracting motivation for brand capitalization was to avoid LSE
constraints on large acquisition and disposal transactions. LSE listing rules require that
6 In the US, APB Opinion 17: Intangible Assets (1970, paragraph 26, subsequently superceded by SFAS 142) required identifiable intangible assets to be recognized separately and SFAS 142: Goodwill and Other Intangible Assets, (2001, paragraphs B33-B35) requires firms to value separately any intangibles that either arise from contractual or other legal rights, or are separable. However, there is no difference in treatment of brands versus goodwill—under APB 17 both were capitalized and amortized, and under SFAS 142 both are capitalized and need not be amortized, but must be tested for impairment. Also, in December 1997 the UK Accounting Standards Board issued Financial Reporting Standard (FRS) 10: Goodwill and Intangible Assets to replace SSAP 22. FRS 10 became effective on December 23, 1998. Similar to SFAS 142, it removes the distinction between goodwill and identifiable intangible assets by not requiring amortization of either kind of intangible asset if it has an indefinite life. From our sample we exclude observations with fiscal years ending on or after December 23, 1998. Thus brand asset measures in our sample are unaffected by changes in accounting standards. 7 Although it recommended an immediate write-off, SSAP 22 (1984, paragraphs 32-35) permitted UK companies to capitalize goodwill, as in the USA. Because of the amortization requirement, and consequent reduction in future earnings, most companies preferred an immediate write-off. On Compustat Global Vantage we find only 155 firm-year observations with a non-zero goodwill asset, out of over 7,900 firm-year observations of UK firms between 1989 and 1997. 8 In its 1989 annual report, Cadbury Schweppes plc, one of our sample firms, explicitly cited such a provision as a reason for capitalizing brands.
8
companies obtain shareholders’ approval for each “material” acquisition or disposal.
Although transactions are considered material if any one of five specified ratios9 exceeds
25 per cent, the binding constraint in the majority of cases is the ratio of total acquisition
price to the book value of net assets of the acquiring firm (Moorhouse, 1990). Firms
wishing to avoid the expense and delay associated with a shareholder vote10 in future
acquisitions or disposals therefore have an incentive to place a higher valuation on brand
assets rather than goodwill. Because goodwill is written off against equity, a higher
valuation on brand assets increases the book value of the firm’s net assets; for a given
amount of acquisition/disposal consideration this reduces the consideration-to-assets ratio
and permits the firm to undertake larger acquisitions or disposals without seeking
shareholder approval.11
9 The five ratios are:
1. The net assets of the acquired/disposed unit (hereafter target) divided by the book value of net assets of the acquiring/divesting firm (hereafter parent).
2. Net profits (before taxation and extraordinary items) attributable to the assets of the target divided by those of the parent.
3. The purchase/sale price divided by the book value of net assets of the parent. 4. The purchase/sale price divided by the market value of all the common shares of the parent. 5. The gross capital of the target divided by the gross capital of the parent. For the parent, gross
capital is defined as the aggregate value of common shares (at market value immediately prior to announcement), preferred shares, debt (at market value, if listed), net current liabilities, and all other liabilities such as minority interests and deferred taxes. For the target, a similar aggregation is used except that the amount of the purchase/sale price is used instead of the market value of the common shares being acquired.
10 The expenses include those related to holding an extraordinary general meeting to seek shareholder approval, professional advisory fees, and administrative expenses. For acquisitive companies, book equity depletion resulting from goodwill writeoffs means that shareholder approval is required for even small acquisitions. This process causes delay and is a 'deal breaker' in many potential acquisitions (KATO Communications, 1993, 143). 11 A simple numerical example illustrates the benefit. Suppose XYZ company originally has £100 of assets and is all-equity financed. It acquires a company for £50 in cash. The tangible assets of the target have a fair value of £20. If the £30 (50 – 20) excess is entirely attributed to goodwill, XYZ’s total assets and equity will equal £70 (assets = 100 – cash paid, 50 + tangible assets acquired, 20; owners’ equity = 100 – goodwill write-off, 30). On the other hand, if £10 of the purchase price is allocated to brands, then goodwill would equal £20 (50 – tangible assets, 20 – brands, 10). So total assets and equity will equal £80 (assets = 100 – cash paid, 50 + tangible assets acquired, 20 + brands, 10; equity = 100 – goodwill write-off, 20). Subsequent to the acquisition if XYZ company wants to acquire another company for £18, it will have to seek shareholders permission in the first case where no brands were recognized (because 18/70 exceeds 25 percent), but not if brands had been recognized (because 18/80 does not exceed 25 percent).
9
Mather and Peasnell (1991) and Muller (1999) find evidence that both contracting
considerations motivated firms to capitalize brands. Muller measures the impact of LSE
rules on firms by constructing a CLASSTEST variable representing the number of
transactions that could avoid the LSE shareholder approval rules in the year subsequent
to the first capitalization of brands. Although Muller finds in univariate tests that both
leverage and CLASSTEST are associated with firms’ decisions to capitalize brands, his
multiple logit regression indicates that CLASSTEST is more significantly associated with
brand capitalization, than is leverage.
III. Sample and Descriptive Statistics
Initially we used Extel Company Analysis (one of a family of databases, formerly
produced by Financial Times, of UK company financials, share prices, and news) to
identify UK firms reporting intangible assets in excess of 1 percent of total assets. We
determined the nature of the capitalized intangibles from firms’ annual reports because
brand values are not separately reported in available databases.12 We include 33 firms
that capitalized brands or titles (such as newspaper or magazine titles) in our sample.13
The earliest instance of capitalization (of titles) was by Reed International in 1985. For
the tests that follow, we hand-collected brand values from annual reports and obtained
12 For example, Compustat’s Global Vantage data item 82 records the value of all intangibles; no breakdown is given except for goodwill (item 93). 13 Some firms give a single figure, without a break-down, for all intangibles including brands, patents, copyrights, licenses, know-how, etc. We exclude these cases to concentrate on the more controversial assets such as brands and titles. Firms that capitalized brands or titles acquired individually (not as part of an acquisition) are also excluded as the valuations are not subject to managers' discretion. Two firms which capitalized brands were excluded for the following reasons. At the first balance sheet date, one firm, Mirror Group Newspaper plc, was under investigation for serious financial and pension fraud and its shares were suspended from trading over an extended period of time. Another firm, SmithKline Beecham, had a substantial portion of its equity in the form of overseas equity units and substantial price differences were documented between the two equity types (Frost and Pownall, 1996). The relationship between its market value, book value and brands is thus expected to be unrepresentative.
10
stock prices and accounting data from Global Vantage’s 1998 Industrial/Commercial File
and Issue File, Extel Company Analysis, Extel Company Research, Extel Equity
Research, and Microview.
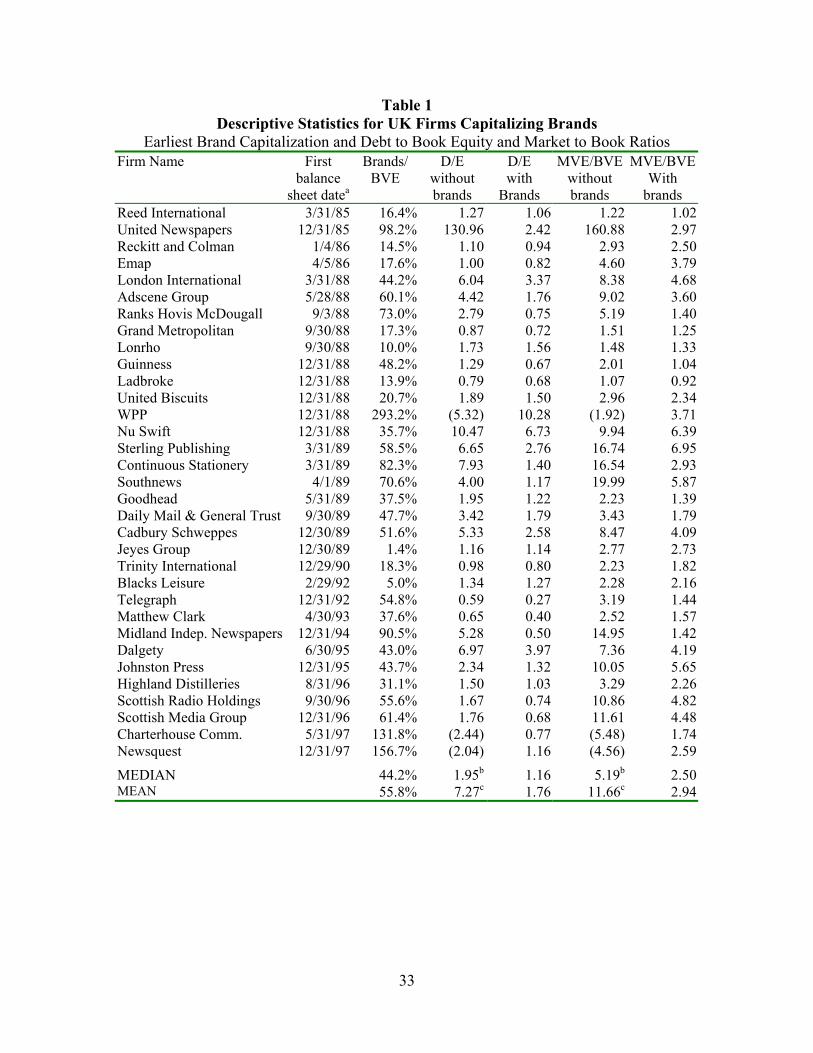
In Table 1 we present a list of the brand-capitalizing firms. The capitalized
brands form a substantial percentage of book values of equity for the sample firms--the
percentage ranges from a low of 1.4 percent to a high of 293.2 percent (median 44.2
percent). When brand assets are subtracted from book values of equity, the median
sample firm’s leverage is 1.95. It decreases substantially, to 1.16 when we include
brands in book values. Market-to-book values of the median sample firms are similarly
5.19 and 2.50 without and with brands. Thus the brand assets of the sample firms are
significant in comparison to book values of equity and debt; sample firms are therefore
expected to have strong incentives to overvalue brands.
[Table 1]
We examined financial statements to determine the sample firms’ policies on
brand assets (not reported in any table). The basis of valuation is “cost [at acquisition],”
“historical cost,” or “fair value on acquisition” in most cases. The remaining firms
mention “valuation,” “directors’ valuation,” “fair value,” or “use value” as the basis.
However, very few firms provide details about the methods or assumptions used in the
valuation. Only three firms amortized the brand assets. Yet brand assets do change over
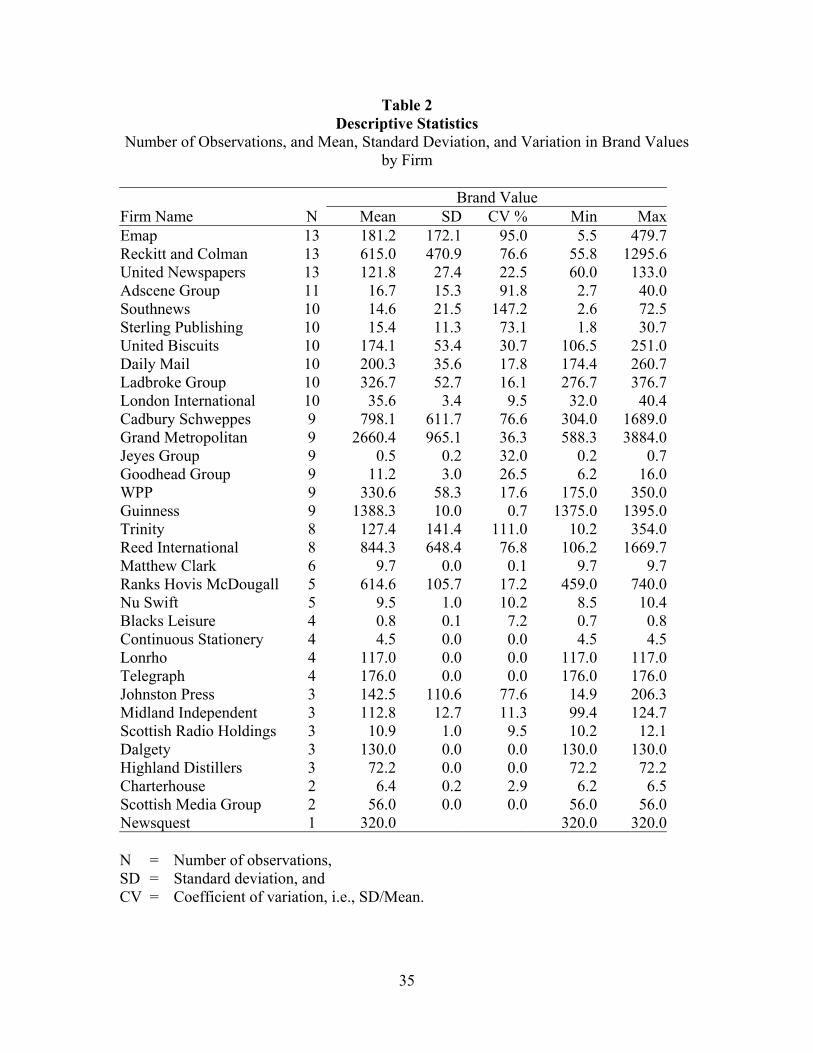
time, primarily because of acquisitions and disposals. Descriptive statistics presented in
Table 2 show that the coefficient of variation of brands exceeds 10 percent for 20 of the
33 firms. Of the remaining 13, one firm has only a single observation, and six others have
no variation in brands. The coefficient of variation of brands is generally increasing with
11
the number of observations; the six firms with no brand variation have only 20 firm-year
observations in total.
[Table 2]
IV. Research Design and Findings
Value Relevance of Brand Assets
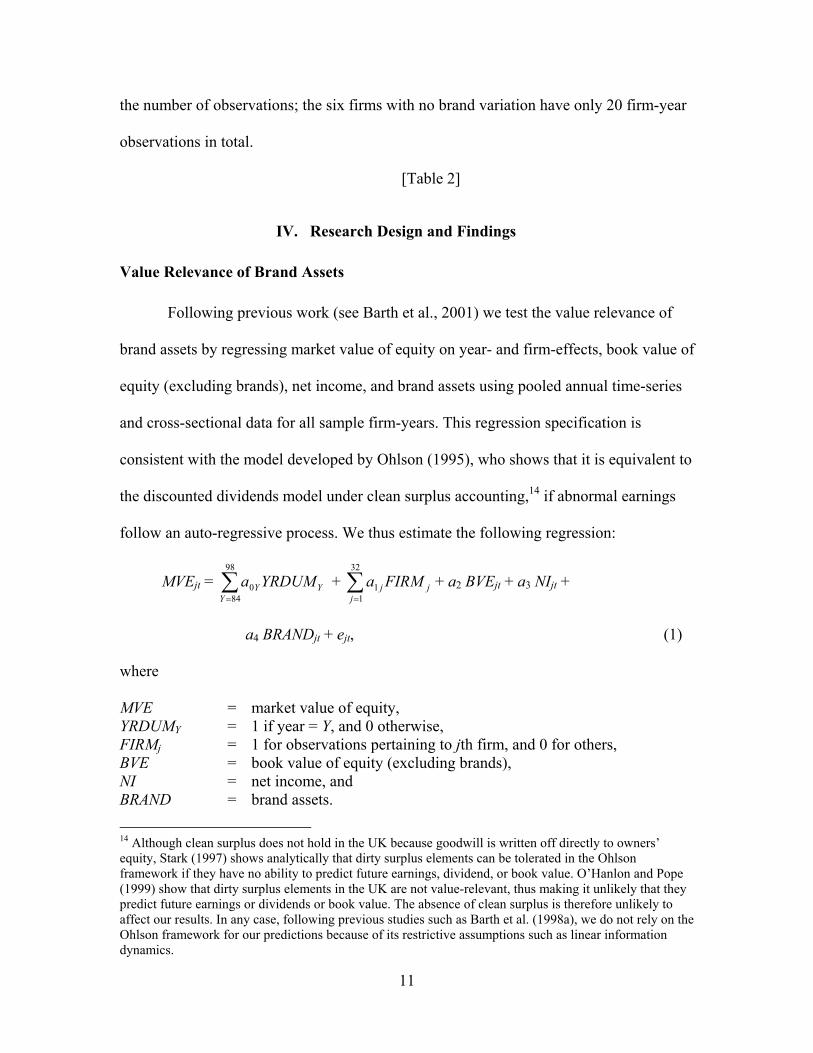
Following previous work (see Barth et al., 2001) we test the value relevance of
brand assets by regressing market value of equity on year- and firm-effects, book value of
equity (excluding brands), net income, and brand assets using pooled annual time-series
and cross-sectional data for all sample firm-years. This regression specification is
consistent with the model developed by Ohlson (1995), who shows that it is equivalent to
the discounted dividends model under clean surplus accounting,14 if abnormal earnings
follow an auto-regressive process. We thus estimate the following regression:
MVEjt = ∑=
98
840
YYYYRDUMa + ∑
=
32
11
jjj FIRMa + a2 BVEjt + a3 NIjt +
a4 BRANDjt + ejt, (1)
where
MVE = market value of equity, YRDUMY = 1 if year = Y, and 0 otherwise, FIRMj = 1 for observations pertaining to jth firm, and 0 for others, BVE = book value of equity (excluding brands), NI = net income, and BRAND = brand assets.
14 Although clean surplus does not hold in the UK because goodwill is written off directly to owners’ equity, Stark (1997) shows analytically that dirty surplus elements can be tolerated in the Ohlson framework if they have no ability to predict future earnings, dividend, or book value. O’Hanlon and Pope (1999) show that dirty surplus elements in the UK are not value-relevant, thus making it unlikely that they predict future earnings or dividends or book value. The absence of clean surplus is therefore unlikely to affect our results. In any case, following previous studies such as Barth et al. (1998a), we do not rely on the Ohlson framework for our predictions because of its restrictive assumptions such as linear information dynamics.
12
We use net income after extraordinary items because FRS 3: Reporting Financial
Performance, effective June 22, 1993, effectively outlawed extraordinary items. Net
income before extraordinary items is therefore inconsistent before and after 1993.15 A
significantly positive coefficient a4 indicates that brand assets are associated with market
values after controlling for book value and net income. As in other value-relevance
studies, we interpret an association as indicating value relevance and at least some degree
of reliability (Barth et al., 2001, 81).
We include year dummies to control for fixed year-effects, e.g., effects of
macroeconomic factors on stock prices. If correlated with the independent variables,
these effects could otherwise bias the regression coefficients. Even if uncorrelated, the
effects could bias the t-statistics by inducing contemporaneous cross-correlation of
residuals. Similarly, we include fixed firm effects to control for any omitted variables that
are firm-specific (i.e., constant over time) and for cross-correlation among residuals for
the same firm. The use of panel data allows us to include both year- and firm-effects,
thereby enabling us to mitigate bias in coefficients as well as standard errors.
Barth and Kallapur (1996) show that scale effects likely do not bias the
coefficient of interest in cases such as the present one because BVE and NI are likely
more highly correlated with scale than is BRAND. Moreover, they show that in some
cases deflation worsens bias, so we use undeflated variables in our regression. We use all
firm-years beginning with the first year of each firm’s brand capitalization, and ending on
or before December 22, 1998, the day before the effective date of a new accounting
standard on intangible assets, Financial Reporting Standard 10. This results in a sample
13
of 232 observations. We delete five outliers identified using the DFBETAS statistic
proposed by Belsley, Kuh, and Welsch (1980).16
[Table 3]
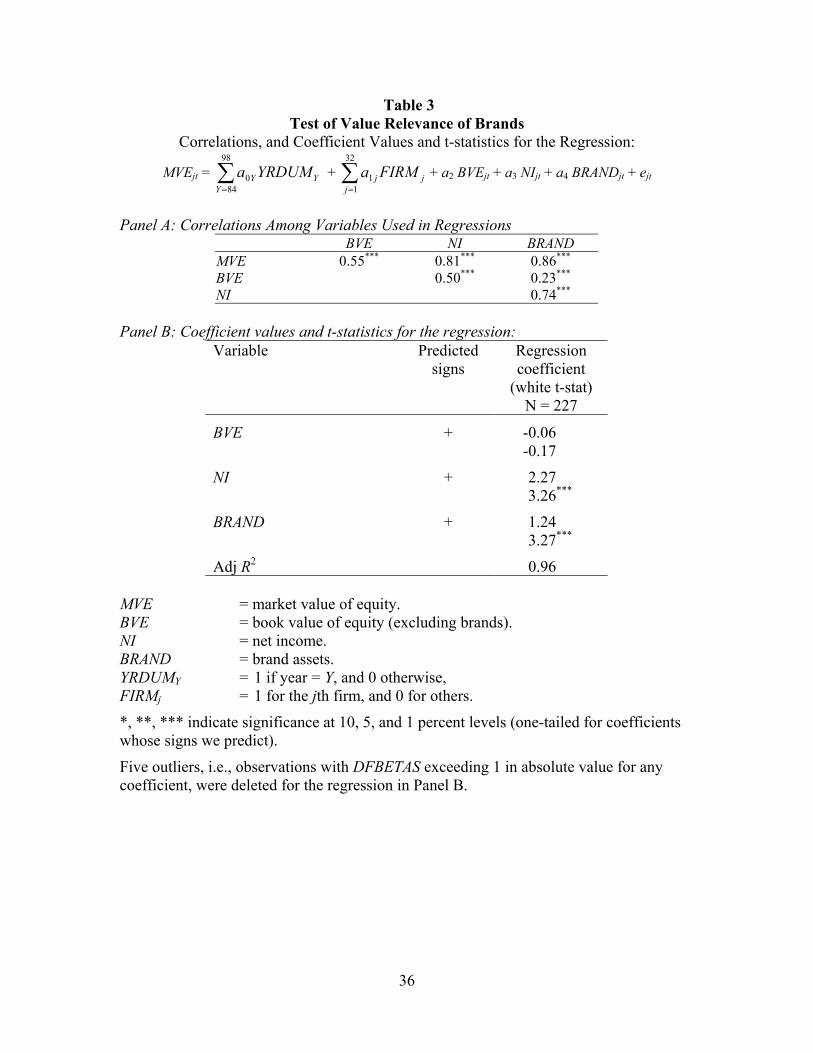
Panel A of Table 3 presents correlations among the dependent and independent
variables used in the regressions. Although correlations among BVE, NI, and BRAND are
high and significant, condition indexes in the regression estimation (not reported in the
table) are below 10 and thus multi-collinearity does not affect regression coefficients
(Belsley et al., 1980). BRAND is more highly correlated with NI than with BVE; this is
consistent with some of the brand value being reflected in profitability. Results of
estimating regression equation (1) presented in Panel B of Table 3 show that the
coefficient on BRAND is positive (+1.24) and significant at better than the 1 percent
level; brands are thus value relevant despite firms’ incentives to overvalue them.
In our specification it is difficult to compare the brand coefficient with that on
BVE because variation in BVE at the firm level is likely to be low; the fixed firm effects
might therefore capture much of the effect of BVE. Indeed, if we omit firm effects then
the coefficient on BVE increases to 0.83 and is significant. Therefore, we do not draw
conclusions from the insignificance of BVE. The problem is less likely with NI, even
though the coefficient on NI also is lower than when we drop firm fixed effects.
A coefficient value exceeding 1 on BRAND would seem to indicate that firms on
average understate brands. This is consistent with the fact that the leading brand valuation
15 We also estimated all our regressions using only data for fiscal years ending before June 22, 1993 (119 observations on 25 firms) and our results were qualitatively unchanged. 16 In this and subsequent regressions we eliminate observations that have a DFBETAS exceeding 1 in absolute value for any regression coefficient. We also estimate the regressions after deleting observations that have DFBETAS exceeding 3/√(nobs), as recommended by Belsley, Kuh, and Welsch. This results in the deletion of 29 to 34 observations in the different regressions, but leaves the results qualitatively unchanged.
14
method, developed by the consulting firm Interbrand and used by many of our sample
firms, capitalizes current excess profits using a multiple that is determined based on a
judgmental assessment of the brand’s strength (Birkin, 1993). Potential profits from
future sales growth and new products that may be launched under existing brand names
are ignored in brand valuation, which could result in an understatement of brand values
relative to those capitalized by the market. A coefficient exceeding 1 on brand assets is
also consistent with Jennings et al.’s (1996) findings related to goodwill. An alternative
explanation that we cannot rule out is that the coefficient is affected by correlated omitted
variables. We believe, however, that omitted variables are less likely because, as
previously mentioned, we control for omitted variables using fixed year- and firm-effects.
We also report below that the brand coefficient is largely unchanged when we control for
the effects of variables such as riskiness, growth, and persistence on NI and BVE.
We checked the robustness of our results using several alternative specifications
described below. First, we perform a randomization test for the purpose of checking
whether sample firms’ brands and market values are mechanically related given that both
are large in relation to book values. We regress actual market values on randomly
generated brand values and the control variables used before--actual year- and firm-
effects, book values, and net income. Consistent with the test’s purpose, we generate
random brand values such that the distribution of the ratio of random brand values
divided by the excess of market value over book value (brand ratio) is the same as its
actual sample distribution. We do this by randomly shuffling the brand ratios and then
converting randomized brand ratios into random brand values. For example, Reed
International’s brands, book value of non-brand assets, and market value for the year
15
ending on 3/31/1985 are 106.2, 542.9, and 664.2 respectively. Its brand ratio therefore
equals 106.2/(664.2 - 542.9) = 0.88. Similarly, Grand Metropolitan’s brands, book value,
and market value for 1988 are 588.3, 2818.7, and 4266.9 respectively. If Reed’s 1985
brand ratio is randomly assigned to Grand Metropolitan for 1988 then Grand
Metropolitan’s randomized brand value used instead of its actual brand value in the
regression is 0.88*(4266.9 – 2818.7) = 1274.4. We perform 100 randomization trials
using random brand values instead of the actual ones. The randomized p-value (not
reported in any table) is 0.00; none of the brand coefficients in the randomized
regressions exceed the actual coefficient. We thus reject the explanation that the
significance of brands is a mechanical relation. However, because our sample brand
values are large in relation to book values of equity, our findings may not generalize to
firms whose brands values are small.
Second, previous research finds evidence that the coefficients on BVE and NI vary
as functions of earnings persistence and riskiness. Variables used to proxy for these
factors include: persistence of abnormal earnings (estimated in Dechow et al., 1999,
using an AR(1) model), return on equity (Burgstahler and Dichev, 1997), standard
deviation of monthly stock returns, and size, i.e., book value of total assets (Barth et al.,
1998a). We create a dummy variable partitioning the sample firm-years into two groups
based on persistence (estimated by an AR(1) model using the time series of each firm’s
abnormal earnings during the sample period), and re-estimate regression equation (1)
allowing the intercept and coefficients on BVE and NI to vary with persistence. We
similarly re-estimate regression equation (1) with dummy variables for each of the other
factors. We also estimate a model with dummies for all the control variables described
16
above, and their interactions with BVE and NI, jointly included in the regression
equations. The coefficient on BRAND is significant in each of these cases at the 1
percent level or better. Also, the brand coefficient remains above 1—it ranges from 1.12
to 1.36. Third, we controlled for sales growth rates because brand assets might proxy for
them—managers and outside appraisers might be more comfortable justifying high brand
values when sales growth is high. The results remain similar. Overall, the results of the
sensitivity analysis reinforce the conclusion that brand assets are value relevant.
Reliability of Brand Assets
The value relevance finding indicates that any bias or measurement error in brand
valuation is not severe enough to eliminate its relevance. Nevertheless, the question of
whether there are predictable differences in bias and measurement error is likely to be of
importance to standard setters as these are features of reliability, a desirable characteristic
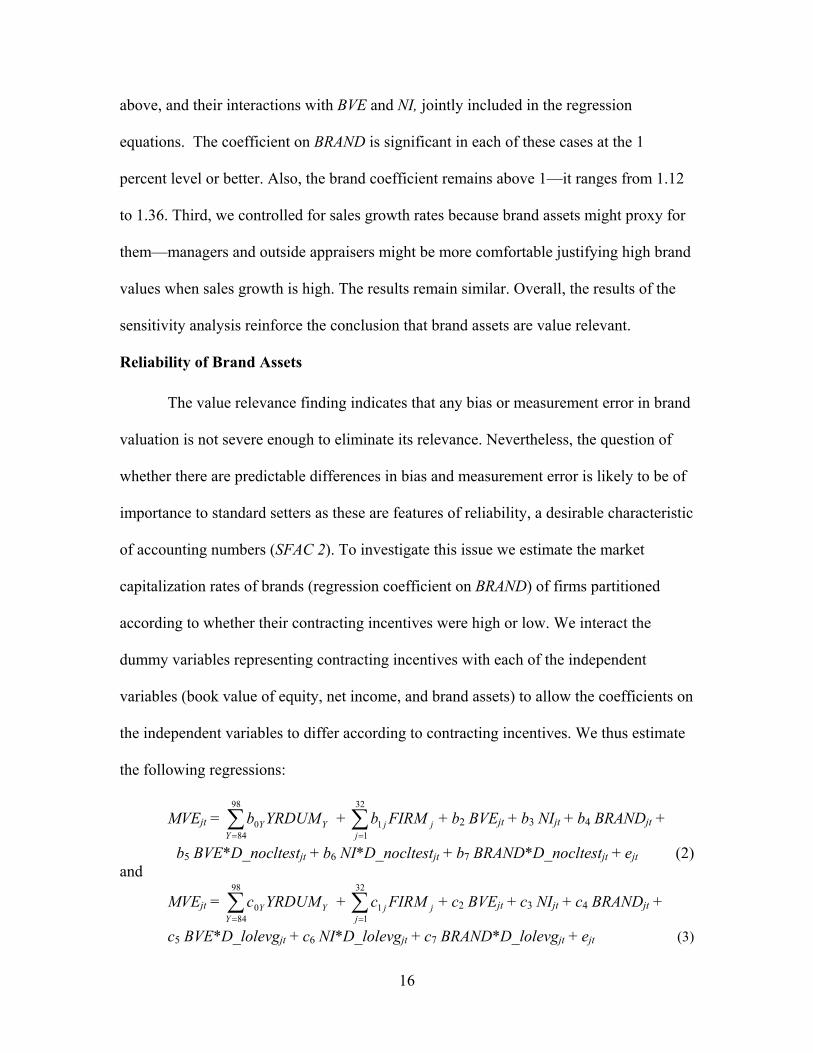
of accounting numbers (SFAC 2). To investigate this issue we estimate the market
capitalization rates of brands (regression coefficient on BRAND) of firms partitioned
according to whether their contracting incentives were high or low. We interact the
dummy variables representing contracting incentives with each of the independent
variables (book value of equity, net income, and brand assets) to allow the coefficients on
the independent variables to differ according to contracting incentives. We thus estimate
the following regressions:
MVEjt = ∑=
98
840
YYYYRDUMb + ∑
=
32
11
jjj FIRMb + b2 BVEjt + b3 NIjt + b4 BRANDjt +
b5 BVE*D_nocltestjt + b6 NI*D_nocltestjt + b7 BRAND*D_nocltestjt + ejt (2) and
MVEjt = ∑=
98
840
YYYYRDUMc + ∑
=
32
11
jjj FIRMc + c2 BVEjt + c3 NIjt + c4 BRANDjt +
c5 BVE*D_lolevgjt + c6 NI*D_lolevgjt + c7 BRAND*D_lolevgjt + ejt (3)
17
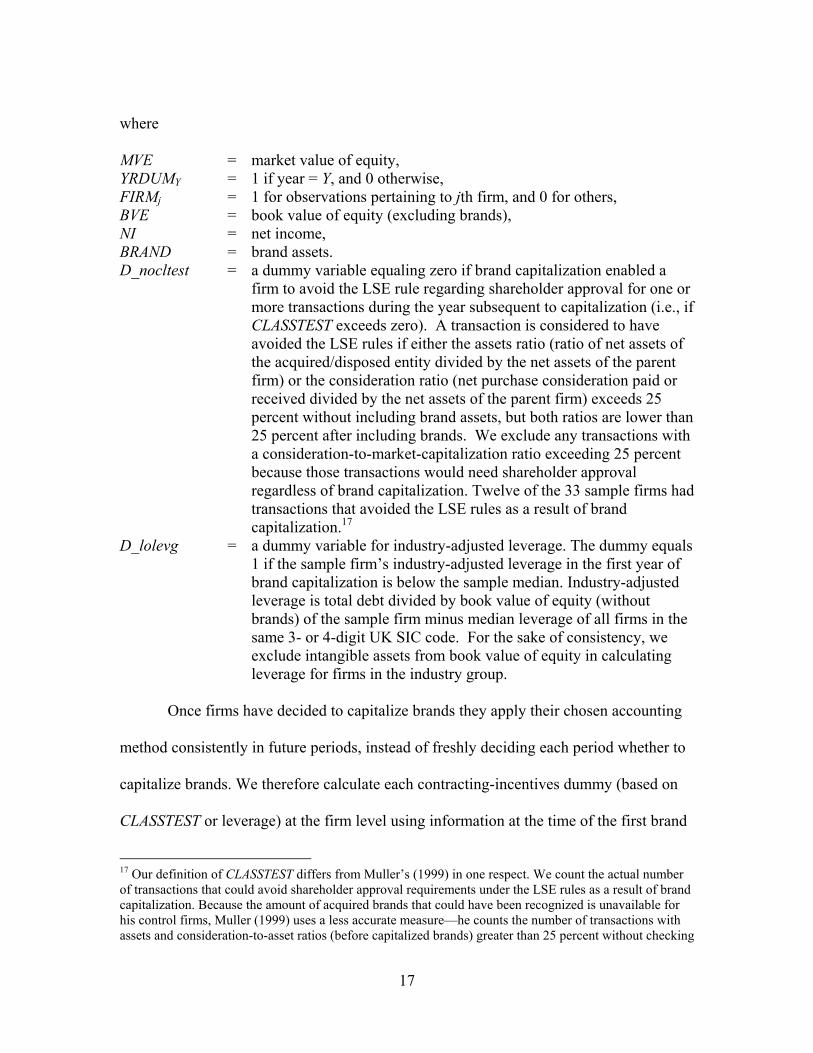
where
MVE = market value of equity, YRDUMY = 1 if year = Y, and 0 otherwise, FIRMj = 1 for observations pertaining to jth firm, and 0 for others, BVE = book value of equity (excluding brands), NI = net income, BRAND = brand assets. D_nocltest = a dummy variable equaling zero if brand capitalization enabled a
firm to avoid the LSE rule regarding shareholder approval for one or more transactions during the year subsequent to capitalization (i.e., if CLASSTEST exceeds zero). A transaction is considered to have avoided the LSE rules if either the assets ratio (ratio of net assets of the acquired/disposed entity divided by the net assets of the parent firm) or the consideration ratio (net purchase consideration paid or received divided by the net assets of the parent firm) exceeds 25 percent without including brand assets, but both ratios are lower than 25 percent after including brands. We exclude any transactions with a consideration-to-market-capitalization ratio exceeding 25 percent because those transactions would need shareholder approval regardless of brand capitalization. Twelve of the 33 sample firms had transactions that avoided the LSE rules as a result of brand capitalization.17
D_lolevg = a dummy variable for industry-adjusted leverage. The dummy equals 1 if the sample firm’s industry-adjusted leverage in the first year of brand capitalization is below the sample median. Industry-adjusted leverage is total debt divided by book value of equity (without brands) of the sample firm minus median leverage of all firms in the same 3- or 4-digit UK SIC code. For the sake of consistency, we exclude intangible assets from book value of equity in calculating leverage for firms in the industry group.
Once firms have decided to capitalize brands they apply their chosen accounting
method consistently in future periods, instead of freshly deciding each period whether to
capitalize brands. We therefore calculate each contracting-incentives dummy (based on
CLASSTEST or leverage) at the firm level using information at the time of the first brand
17 Our definition of CLASSTEST differs from Muller’s (1999) in one respect. We count the actual number of transactions that could avoid shareholder approval requirements under the LSE rules as a result of brand capitalization. Because the amount of acquired brands that could have been recognized is unavailable for his control firms, Muller (1999) uses a less accurate measure—he counts the number of transactions with assets and consideration-to-asset ratios (before capitalized brands) greater than 25 percent without checking
18
capitalization. Therefore all firm-year observations for a given firm j have the same value
of the contracting-incentives dummy.
Coefficient b4 (c4) measures the brand assets’ market capitalization rate for firms
with at least one acquisition/disposal transaction that avoided the LSE rules (high-
leverage firms), and b7 (c7) measures how this rate differs for firms without transactions
that avoided the LSE rules (low-leverage firms). If there is an upward bias in brand
measures of firms with greater contracting incentives, then the market capitalization rate
for those firms’ brands will be lower. In a regression context if an independent variable is
multiplied by a constant k, (> 1 for high-contracting-incentive firms because of upward
bias) then the estimated coefficient for that group of firms equals the original coefficient
divided by k, and hence is smaller.
In addition to bias, Holthausen and Watts (2001, 29) suggest that managers might
also introduce noise to mislead auditors and stock markets. Such noise would lead to
errors in brand measures, which would bias the estimated regression coefficient towards
zero in a multiple regression if other regressors are measured without error (Garber and
Klepper, 1980). Because the brand coefficient is expected to be positive, bias towards
zero implies a smaller coefficient for firms with greater contracting incentives. Thus we
expect both upward bias and greater error in brand measures to result in a smaller brand
coefficient.18 Accordingly the brand coefficient for firms with lower contracting
whether these ratios are less than 25 percent after brand recognition. Like us, Muller excludes transactions with a consideration-to-market capitalization ratio exceeding 25 percent. 18 The regression coefficient remains biased towards zero even if other variables are measured with error, as long as those errors are small (i.e., have low variance). On the other hand, if the error in measuring other variables is large, then the effect of measurement error on the coefficient could be opposite to that of the bias, weakening our ability to find the hypothesized results.
19
incentives will be higher, and a positive value would be obtained for coefficients b7 and
c7.
We include BVE*D_nocltest, and NI*D_nocltest (BVE*D_lolevg, and
NI*D_lolevg) to ensure that the estimated coefficient on BRAND*D_nocltest
(BRAND*D_lolevg) is unaffected by any association between stock prices and
interactions of the contracting proxy with BVE and NI. The firm dummies included in the
regression are finer than the contracting proxy (whose value depends on whether an
observation pertains to a firm that is classified into the high- or low-contracting-
incentives group). Therefore we do not include contracting proxies in the regression—
they would be collinear with some of the firm dummies if we did. In addition to the firm
dummies, as in estimating regression equation (1), we include year dummies to capture
fixed year effects. The sample, as before, consists of 232 firm-year observations. In each
regression (equations 2 and 3) the DFBETAS statistic proposed by Belsley, Kuh, and
Welsch (1980) results in deletion of two outliers.
[Table 4]
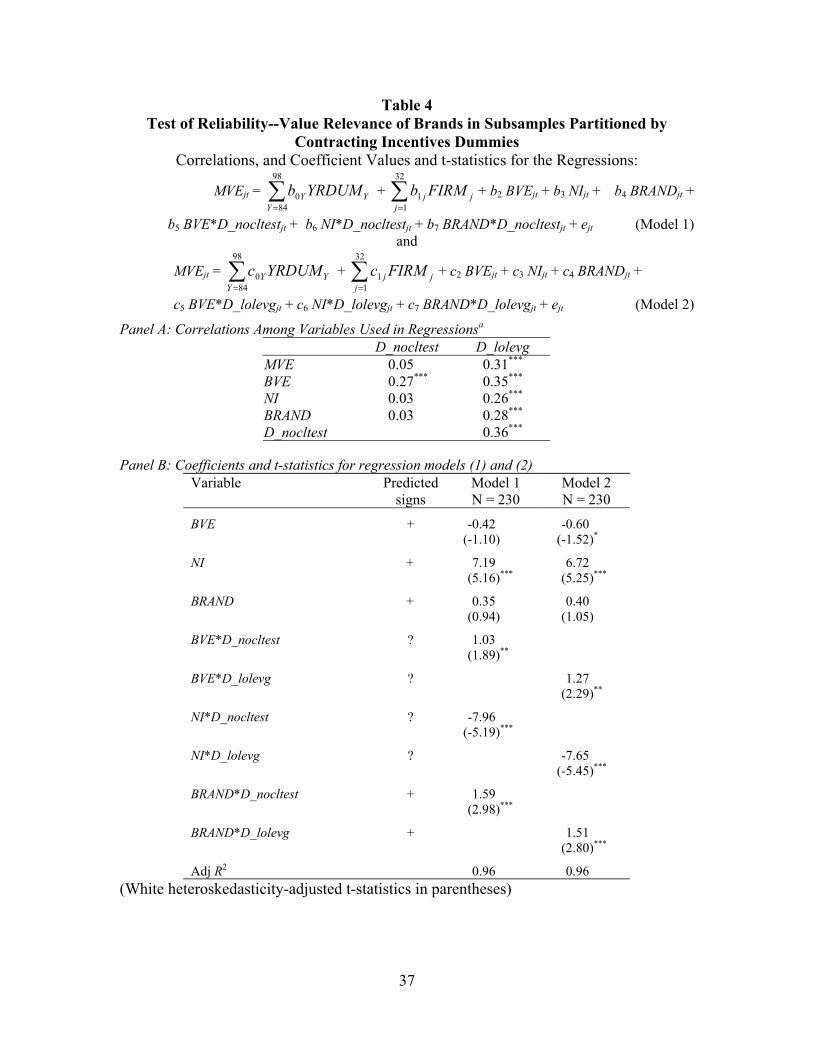
Panel A of Table 4 reports the correlations between the contracting dummies and
the other regression variables. Although the CLASSTEST-based and leverage-based
dummies are significantly correlated (0.36), the correlation is far from perfect; results
based on the two proxies are therefore not merely repeated versions of each other. Results
of estimating regression equations (2) and (3), reported in Panel B of Table 4, show that
the coefficient on BRAND*D_nocltest (BRAND*D_lolevg) is positive, 1.59 (1.51), and
significantly different from zero at p < 0.01. The effective number of observations in each
case—the number of observations with contracting- incentives dummy equal to 1—is 153
20
and 117 respectively for dummies based on CLASSTEST and leverage. The significant
coefficient indicates that the market’s brand capitalization rate for firms with lower
contracting incentives to over-state brands (firms with no transactions that escaped the
LSE requirements, or with low leverage) is higher than that for firms with higher
contracting incentives. The coefficient on BRAND for firms with transactions that
avoided the LSE rule (high leverage) is 0.35 (0.40), and these values are not statistically
significant. The market’s capitalization rates for brand assets of firms with low
contracting incentives are 1.94 (0.35 + 1.59) and 1.91 (0.40 + 1.51) in regressions (2) and
(3) respectively.
The point estimates of the coefficients therefore indicate that the brand
capitalization rates for firms with lower contracting incentives are five to six times
(1.94/0.35 = 5.5 and 1.91/040 = 4.8) the capitalization rates of firms with high
contracting incentives. Thus the differences in brand capitalization rates of firms with
high and low contracting incentives are statistically as well as economically significant,
suggesting that brand asset measures might lack reliability. This conclusion is contrary to
that in Barth and Clinch (1998) who find that discretionary revaluations of intangible
assets in Australia are as value relevant as are revaluations of tangible assets. They,
however, do not condition their analysis on contracting incentives—ours is therefore a
stronger test of reliability.
Another study, Aboody et al. (1999), finds modest differences in value relevance
of discretionary revaluations of tangible fixed assets in the UK depending on firms’ debt
to equity ratio—in regressions with stock price as the dependent variable, they find that
the coefficient on the revaluation balance is 0.44, and that on the revaluation balance
21
interacted with the debt to book equity ratio is –0.02. Aboody et al. (1999) use a
continuous debt to equity ratio measure unlike the dummy we use. Nevertheless, we can
estimate that the difference between the coefficients of high- and low-leverage firms in
their sample is definitely below 0.10 (0.02*5)--they report that the debt to book equity
ratio does not exceed 5 for any firm. The 0.10 coefficient is smaller than in our study
(1.51) in absolute as well as in relative terms (0.10/0.44 versus 1.51/1.91). One possible
reason is that we examine the value relevance of an intangible asset; these assets are
generally considered to be more difficult to value (Barth and Landsman, 1995) and hence
afford managers more discretion. Second, the median firm’s revaluation reserves are only
6.5 percent of book values in their sample while the median firm’s brand assets are 44.2
percent of book values in ours. Our finding therefore adds to the literature by showing
that large cross-sectional differences in market capitalization rates could be observed if
valuations are subjective and contracting incentives are strong.
The coefficients 0.35 and 0.40 on BRAND in regressions (2) and (3) are
statistically insignificant at conventional levels. This is consistent with lack of reliability
overwhelming their value relevance. However, because the sample sizes are relatively
small, we do not draw conclusions from insignificant coefficients.
One potential problem with the use of the D_nocltest variable is that errors in
brand valuation could affect whether the firm subsequently avoids the LSE requirements.
That is, if firms’ brand valuations are unbiased but have some error, firms with positive
valuation error (over-valuers) will have lower brand capitalization rates (if markets undo
the effects of the error) and be more likely to avoid the LSE requirements in the future.
Thus the finding of lower brand capitalization rates for firms with D_nocltest = 0 could
22
be attributable to valuation errors rather than contracting incentives. The small and
insignificant correlation between D_nocltest and BRAND (0.03, reported in Panel A of
Table 4) casts doubt on the validity of this explanation. Nevertheless, in another attempt
to rule out this explanation19 we use an alternative measure for CLASSTEST, namely
whether the firm needed shareholder approval for any acquisition during the year prior to
the date of the balance sheet in which brands were first capitalized. This measure proxies
for the probability of a firm being subject to the LSE requirements in future, assuming
that past acquisitions are good indicators of future acquisitions. Specifically we define
D_nocltest0 = 1 if the firm had no transactions that required shareholder approval under
the LSE rules during the year ending on the date of the first balance sheet containing
capitalized brands. The coefficient BRAND*D_nocltest0 remains significant at better than
the 1 percent level using this alternative specification.
Our findings regarding the significance of coefficients on BRAND*D_nocltest,
and BRAND*D_lolevg are largely unaffected when we perform the robustness tests
described for the unpartitioned sample. There is however, one exception: the
randomization p-values are 0.15 and 0.14.20 Our finding that brand capitalization rates of
firms with high and low contracting incentives differ must therefore be interpreted with
caution. Besides, our findings are based on market capitalization rates and therefore do
not indicate that markets are misled by the lack of reliability.
19We measure leverage using book value of equity excluding brands; the leverage-based contracting incentive measure is therefore unaffected by this problem. 20 The purpose of the regression equations is to assess whether the brand coefficient differs according to contracting incentives. Accordingly for the randomization test we randomly assign firms to D_nocltest = 0 and D_nocltest = 1 categories, and leave other variables unchanged (similalrly for D_lolevg).
23
Stock Price Effects of Brand Recognition
Although markets may not be misled by lack of reliability, previous evidence
suggests that markets undervalue intangible-asset-intensive firms in the absence of
recognition (Aboody and Lev 2000; Chan et al. 2000; Lev et al. 2000, Lev 2001). Lev et
al. (2000) and Chan et al. (2000) find positive risk-adjusted returns to portfolios of stocks
of firms with high R&D growth rates and high R&D-to-market-value ratios respectively.
Aboody and Lev (2000) find that trades by insiders in R&D-intensive firms are three to
four times as profitable as are trades by insiders in non-R&D-intensive firms, thus
suggesting greater information asymmetries in R&D-intensive firms.
In case of brands, undervaluation could result because markets impute
conservative brand valuations to all firms in the absence of disclosure. Alternatively
markets could be unbiased on average, and firms whose brands are undervalued could
selectively resort to brand recognition to signal their true values. In either case,
undervaluation before recognition is consistent with firms overcoming information
asymmetries through brand recognition.
If brands were undervalued before firms recognized them, then news of brand
recognition must convey positive information to markets. Besides undervaluation,
positive information content could also be explained by the benefit to firms of having
relaxed contracting constraints. On the other hand, Smith (1996) considers brand
capitalization a controversial accounting practice and its use a signal of an underlying
weakness in the firm’s financial position. If markets interpret brand capitalization as such
then we should observe a negative stock price reaction to the news of brand
capitalization.
24
We could estimate the market reaction for only 24 of the 33 sample firms: for six
firms the earliest announcement was before its stock was publicly traded, for two firms
the stocks were newly listed and previous returns for estimating the market model are not
available, and in one other case we could not determine the date of earliest announcement
of brand values. To determine the market reaction to brand announcements we regress
market-and-risk-adjusted abnormal returns (estimated using market model betas
calculated over the 60 days ending 30 days before the event date) on BRAND/MVE. Our
specification is as follows:
,)/( 1,10 jttjjtjt eMVEBRANDddAR ++= − (4) where
ARjt = announcement period (days -10 to +10)21 abnormal returns for the jth firm in year t (estimated as the difference between actual returns and expected returns based on market model parameters estimated over the 60 trading days ending 30 days before the announcement).
BRANDjt = brand assets at the end of year t. MVEj,t-1 = market value of equity at the end of year t-1.
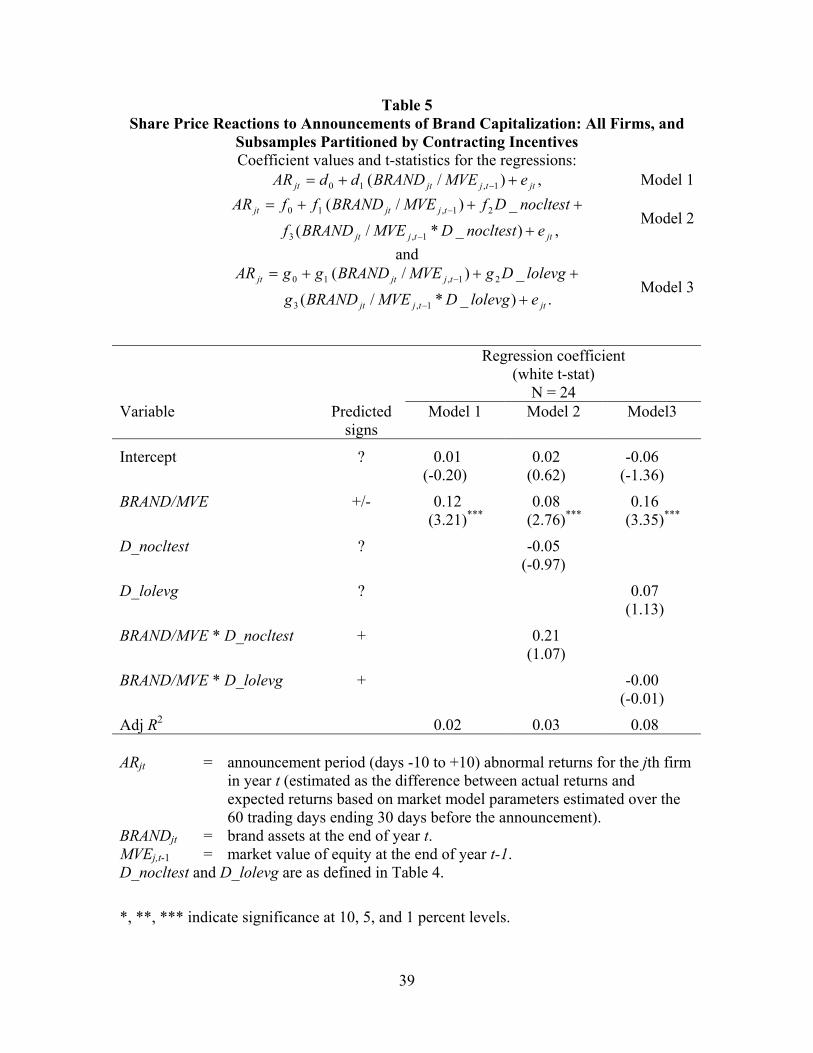
[Table 5]
Results presented in Table 5 show that the coefficient on BRAND/MVE is +0.12
and significant at better than the 1 percent level.22 The coefficient should equal that on
BRAND in regression equation (1) if 10 days before news of brand capitalization the
markets expected zero brand values, and did not receive news about any other variables
during the 21-day returns accumulation period;23 under these assumptions regression
21 Results for other announcement period such as days –2 to +1 and –5 to +5 were slightly weaker. 22 A randomization test similar to the one for the value-relevance regression indicates that the coefficient on BRAND/MVE is significant at the 4 percent level. We randomly shuffled non-zero BRAND/MVE values, keeping all other variables unchanged. 23 In fact, twelve of the 24 announcements were concurrent with earnings announcements. We conduct additional sensitivity tests by adjusting the abnormal returns for earnings levels and changes (following Easton and Harris, 1991) in these cases. We determine response coefficients on earnings levels and changes, required for the adjustment, by regressing abnormal returns on earnings levels and changes using
25
equation (4) can be derived from regression equation (1) by first-differencing and
deflating by market value. The comparison of coefficients, however, indicates that the
0.12 coefficient on BRAND/MVE in regression equation (4) is much lower than the 1.24
coefficient on BRAND in regression equation (1). Thus the market had already capitalized
all but 10 percent (=0.12/1.24) of the brand values into prices before brands were actually
capitalized by firms. Thus undervaluation of brands, if any, is small in economic
magnitude.
The significantly positive return to news of brand capitalization is consistent with
either undervaluation or the benefit to firms from relaxing contracting constraints through
brand capitalization; it is inconsistent with brand recognition being interpreted as a signal
of weakness. To evaluate the constraint relaxation explanation, we interact BRAND/MVE
with contracting dummies (D_nocltest or D_lolevg) and include the interaction term in
the regression, as follows.
,)_*/(
_)/(
1,3
21,10
jttjjt
tjjtjt
enocltestDMVEBRANDf
nocltestDfMVEBRANDffAR
+
+++=
−
− (5)
and
.)_*/(
_)/(
1,3
21,10
jttjjt
tjjtjt
elolevgDMVEBRANDg
lolevgDgMVEBRANDggAR
+
+++=
−
− (6)
where all variables are as defined before.
Results presented in Table 5 show that the coefficients on BRAND/MVE *
D_nocltest and BRAND/MVE * D_lolevg, 0.21 and -0.00 do not differ significantly from
zero; the contracting constraint relaxation explanation predicts positive coefficients.
Because of their insignificance we are unable to distinguish between the two possible
explanations for positive returns at the announcement of brand capitalization. Thus we
pooled cross-section and time-series data for all available years for the 12 firms. Our results are similar to
26
cannot rule out undervaluation of brands, but as argued above, the magnitude of
undervaluation is small.
V. Conclusions
This study examines the value relevance and reliability of brand assets recognized
by 33 UK firms beginning in 1985. Most previous studies on the value relevance of
intangible assets have examined valuations of outside parties rather than managers who
could be subject to contracting incentives to bias recognized amounts. The only other
study that examines recognized intangible assets, Barth and Clinch (1998), does not
examine the effects of contracting incentives on value relevance. Also, previous studies
on brand recognition in the UK (e.g., Muller, 1999) have examined the incentives for
brand recognition, but not the effects of these incentives on the value relevance and
reliability of the recognized brand values.
Our results suggest that recognized brand values are value relevant despite
managers’ incentives to over-value them. These findings are robust to several sensitivity
tests. However, market capitalization rates of brands of firms with low contracting
incentives--firms with no transactions that avoided the LSE rules requiring shareholder
approval for acquisitions/disposals, and firms with industry-adjusted leverage below the
sample median--are substantially higher than those of firms with high contracting
incentives. The difference in market capitalization rates indicates differences in the
amount of bias or error in brand valuations of different groups of firms, suggesting that
brand asset measures lack reliability. These results must however be interpreted with
those reported.
27
caution because in a randomization test we perform for sensitivity analysis, the
differences are significant at only the 15 and 14 percent levels. Another caveat is that our
findings are based on market capitalization rates; they therefore do not indicate that
markets are misled by the lack of reliability.
Previous studies that investigate the effects of contracting incentives on the value
relevance of managers’ discretionary valuations, e.g., Aboody et al. (1999), which
examines managers’ revaluations of tangible fixed assets, find much smaller differences
in capitalization rates. Brand assets in our sample are higher as a proportion of total assets
than is the revaluation balance in Aboody et al.’s sample. Besides, valuation of intangible
assets like brands is likely subject to greater discretion. Subject to caveats mentioned
before, our study therefore contributes to the literature by showing that substantial
differences in market capitalization rates of recognized assets could be observed for
different groups of firms when contracting incentives are strong, and the valuations are
subjective.
We also find a significantly positive association between market returns during
the 21-day period surrounding the first announcement of brand asset values. The positive
association could result either from undervaluation of brands by markets prior to
recognition, as suggested by Lev (2001), or from the relaxation of contracting constraints.
Although we attempt to distinguish between the two explanations for a positive
association, insignificant coefficients prevent us from doing so. We are thus unable to
rule out the undervaluation explanation, but the magnitude of undervaluation is small.
By examining the value relevance and reliability of intangible assets, our evidence
contributes to the policy debate on recognition of intangible assets. We, however, do not

28
draw any policy conclusions because our evidence suggests relevance as well as a
possible lack of reliability, and the trade-off between these considerations is not precisely
quantified (Barth et al., 2001). Besides, accounting standards are shaped by factors other
than value relevance and reliability (Holthausen and Watts, 2001).
29
REFERENCES
Aboody, D., Barth, M., and Kasznik, R., 1999. Revaluations of fixed assets and future
firm performance: Evidence from the UK. Journal of Accounting and Economics
26, 149-178.
Aboody, D., and B. Lev. 2000. Information Asymmetry, R&D, and Insider Gains.
Journal of Finance (LV), 2747–2766.
Barth, M., Beaver, W., and Landsman, W., 1998a. Relative valuation roles of equity
book value and net income as a function of financial health. Journal of
Accounting and Economics 25, 1-34.
Barth, M., Beaver, W., and Landsman, W., 2001. The relevance of the value relevance
literature for financial accounting standard setting: Another view. Journal of
Accounting and Economics 31(1-3): 77-104.
Barth, M., Clement, M., Foster, G., and Kasznik, R., 1998b. Brand Values and Capital
Market Valuation. Review of Accounting Studies 3, 41-68.
Barth, M., and Clinch, G., 1998. Revalued financial, tangible, and intangible assets:
Associations with share prices and non market-based estimates. Journal of
Accounting Research 36, 199-233.
Barth, M., and Kallapur, S., 1996. The effects of cross-sectional scale differences on
regression results in empirical accounting research. Contemporary Accounting
Research, 527-567.
Barth, M., and Landsman, W., 1995. Fundamental issues related to using fair value
accounting for financial reporting. Accounting Horizons 9:4, 97-107.
30
Barwise, P., Higson, C., Likierman, A., and Marsh, P., 1989. Accounting for Brands.
London Business School and the Institute of Chartered Accountants in England
and Wales, London, U.K.
Belsley, D. A., Kuh, E., and Welsch, R. E., 1980. Regression Diagnostics. John Wiley &
Sons, Inc., New York, NY.
Birkin, M. 1993. Interbrand: The valuation of trade marks and brand names. In
Accounting for Brands. KATO Communications, London, U.K.: Financial Times
Business Information.
Burgstahler, D., and Dichev, I., 1997. Earnings, adaptation, and equity value. The
Accounting Review 72, 187-215.
Chan, L., J. Lakonishok and T. Sougiannis, 2000. The Stock Market Valuation of
Research and Development Expenditures. Working Paper. University of Illinois.
Citron, D.B. 1992. Accounting measurement rules in UK bank loan contracts.
Accounting and Business Research 23, 21-30.
Dechow, P., Hutton, A., and Sloan, R., 1999. An empirical assessment of the residual
income model. Journal of Accounting and Economics 26, 1-34.
Easton, P. D., and T. Harris, 1991. Earnings as an Explanatory Variable for Returns.
Journal of Accounting Research 29(1): 19-36.
The Economist, 2001. Touchy-feely. (5/17/01).
Farquhar, P., Han, J., and Ijiri, Y., 1992. Brands on the balance sheet. Marketing
Management, Winter, 16-22.
31
Financial Accounting Standards Board (FASB), 2001. Proposal for a new agenda project:
Disclosure of information about intangible assets not recognized in financial
statements.
Frost, C., and G. Pownall, 1996. Interdependencies in the global markets for capital and
information: The case of Smithkline Beecham plc. Accounting Horizons 10.1:38-
57.
Garber, S., and Klepper, S., 1980. Extending the classical normal errors-in-variables
model. Econometrica 48(6), 1541-1546.
Holthausen, R. W., and Watts, R. L., 2001. The relevance of the value relevance
literature for financial accounting standard setting. Journal of Accounting and
Economics 31(1-3): 3-76.
Jennings, R, J. Robinson, R. Thompson II, and L. Duvall, 1996. The relation between
accounting goodwill numbers and equity values. Journal of Business Finance &
Accounting 23(4): 513-533.
KATO Communications, 1993. Accounting for brands. Financial Times Business
Information, London, U.K.
Lev, B., 2001. Intangibles: Management, Measurement, and Reporting. The Brookings
Institution.
Lev, B., B. Sarath, and T. Sougiannis, 2000. R&D Reporting Biases and Their
Consequences. Working Paper, Stern School of Business, New York University.
Mather, P.R., and Peasnell, K. V., 1991. An examination of the economic circumstances
surrounding the decisions to capitalize brands. British Journal of Management 2,
151-164.
32
Moorhouse, M., 1990. The case for capitalising brands. In: Michael Power, eds., Brand
and Goodwill Accounting Strategies. Woodhead-Faulkner, New York, NY.
Muller, K. A., 1999. An examination of the voluntary recognition of acquired brand
names in the United Kingdom. Journal of Accounting and Economics 26, 179-
191.
O'Hanlon, J.F., and P. F. Pope, 1999. The value-relevance of UK dirty surplus accounting
flows. British Accounting Review 32: 459-482.
Ohlson, J., 1995. Earnings, book values, and dividends in security valuation.
Contemporary Accounting Research, 661-688.
Smith, T., 1996. Accounting for growth: Stripping the camouflage from company
accounts. Century Business, London, U.K.
Stark, A. W., 1997. Linear information dynamics, dividend irrelevance, corporate
valuation, and the clean surplus relationship. Acccounting and Business Research,
Summer, 219-228.
Stewart, T. A., 2001. Accounting gets radical. Fortune (4/16/01).
33
Table 1 Descriptive Statistics for UK Firms Capitalizing Brands
Earliest Brand Capitalization and Debt to Book Equity and Market to Book Ratios Firm Name First
balance sheet datea
Brands/ BVE
D/E without brands
D/E with
Brands
MVE/BVE without brands
MVE/BVE With
brands Reed International 3/31/85 16.4% 1.27 1.06 1.22 1.02 United Newspapers 12/31/85 98.2% 130.96 2.42 160.88 2.97 Reckitt and Colman 1/4/86 14.5% 1.10 0.94 2.93 2.50 Emap 4/5/86 17.6% 1.00 0.82 4.60 3.79 London International 3/31/88 44.2% 6.04 3.37 8.38 4.68 Adscene Group 5/28/88 60.1% 4.42 1.76 9.02 3.60 Ranks Hovis McDougall 9/3/88 73.0% 2.79 0.75 5.19 1.40 Grand Metropolitan 9/30/88 17.3% 0.87 0.72 1.51 1.25 Lonrho 9/30/88 10.0% 1.73 1.56 1.48 1.33 Guinness 12/31/88 48.2% 1.29 0.67 2.01 1.04 Ladbroke 12/31/88 13.9% 0.79 0.68 1.07 0.92 United Biscuits 12/31/88 20.7% 1.89 1.50 2.96 2.34 WPP 12/31/88 293.2% (5.32) 10.28 (1.92) 3.71 Nu Swift 12/31/88 35.7% 10.47 6.73 9.94 6.39 Sterling Publishing 3/31/89 58.5% 6.65 2.76 16.74 6.95 Continuous Stationery 3/31/89 82.3% 7.93 1.40 16.54 2.93 Southnews 4/1/89 70.6% 4.00 1.17 19.99 5.87 Goodhead 5/31/89 37.5% 1.95 1.22 2.23 1.39 Daily Mail & General Trust 9/30/89 47.7% 3.42 1.79 3.43 1.79Cadbury Schweppes 12/30/89 51.6% 5.33 2.58 8.47 4.09 Jeyes Group 12/30/89 1.4% 1.16 1.14 2.77 2.73 Trinity International 12/29/90 18.3% 0.98 0.80 2.23 1.82 Blacks Leisure 2/29/92 5.0% 1.34 1.27 2.28 2.16 Telegraph 12/31/92 54.8% 0.59 0.27 3.19 1.44 Matthew Clark 4/30/93 37.6% 0.65 0.40 2.52 1.57 Midland Indep. Newspapers 12/31/94 90.5% 5.28 0.50 14.95 1.42 Dalgety 6/30/95 43.0% 6.97 3.97 7.36 4.19 Johnston Press 12/31/95 43.7% 2.34 1.32 10.05 5.65 Highland Distilleries 8/31/96 31.1% 1.50 1.03 3.29 2.26 Scottish Radio Holdings 9/30/96 55.6% 1.67 0.74 10.86 4.82 Scottish Media Group 12/31/96 61.4% 1.76 0.68 11.61 4.48 Charterhouse Comm. 5/31/97 131.8% (2.44) 0.77 (5.48) 1.74 Newsquest 12/31/97 156.7% (2.04) 1.16 (4.56) 2.59 MEDIAN 44.2% 1.95b 1.16 5.19b 2.50 MEAN 55.8% 7.27c 1.76 11.66c 2.94
34
Table 1 (continued) D/E = Debt/Equity ratio = Total Liabilities / Book Value of Shareholders’ Equity MVE = Market value of shareholders’ equity BVE = Book value of shareholders’ equity (including brands, except where noted otherwise). a For six firms share prices are not available at the date of the first balance sheet containing
brand assets, because, e.g., they were not publicly listed at the time. For these firms we report the first balance sheet date with available share price information.
b Firms with negative leverage or MVE/BVE are treated as having the highest leverage or
MVE/BVE.
c Excluding firms with negative book value of equity.
35
Table 2 Descriptive Statistics
Number of Observations, and Mean, Standard Deviation, and Variation in Brand Values by Firm
Brand Value Firm Name N Mean SD CV % Min MaxEmap 13 181.2 172.1 95.0 5.5 479.7Reckitt and Colman 13 615.0 470.9 76.6 55.8 1295.6United Newspapers 13 121.8 27.4 22.5 60.0 133.0Adscene Group 11 16.7 15.3 91.8 2.7 40.0Southnews 10 14.6 21.5 147.2 2.6 72.5Sterling Publishing 10 15.4 11.3 73.1 1.8 30.7United Biscuits 10 174.1 53.4 30.7 106.5 251.0Daily Mail 10 200.3 35.6 17.8 174.4 260.7Ladbroke Group 10 326.7 52.7 16.1 276.7 376.7London International 10 35.6 3.4 9.5 32.0 40.4Cadbury Schweppes 9 798.1 611.7 76.6 304.0 1689.0Grand Metropolitan 9 2660.4 965.1 36.3 588.3 3884.0Jeyes Group 9 0.5 0.2 32.0 0.2 0.7Goodhead Group 9 11.2 3.0 26.5 6.2 16.0WPP 9 330.6 58.3 17.6 175.0 350.0Guinness 9 1388.3 10.0 0.7 1375.0 1395.0Trinity 8 127.4 141.4 111.0 10.2 354.0Reed International 8 844.3 648.4 76.8 106.2 1669.7Matthew Clark 6 9.7 0.0 0.1 9.7 9.7Ranks Hovis McDougall 5 614.6 105.7 17.2 459.0 740.0Nu Swift 5 9.5 1.0 10.2 8.5 10.4Blacks Leisure 4 0.8 0.1 7.2 0.7 0.8Continuous Stationery 4 4.5 0.0 0.0 4.5 4.5Lonrho 4 117.0 0.0 0.0 117.0 117.0Telegraph 4 176.0 0.0 0.0 176.0 176.0Johnston Press 3 142.5 110.6 77.6 14.9 206.3Midland Independent 3 112.8 12.7 11.3 99.4 124.7Scottish Radio Holdings 3 10.9 1.0 9.5 10.2 12.1Dalgety 3 130.0 0.0 0.0 130.0 130.0Highland Distillers 3 72.2 0.0 0.0 72.2 72.2Charterhouse 2 6.4 0.2 2.9 6.2 6.5Scottish Media Group 2 56.0 0.0 0.0 56.0 56.0Newsquest 1 320.0 320.0 320.0
N = Number of observations, SD = Standard deviation, and CV = Coefficient of variation, i.e., SD/Mean.
36
Table 3 Test of Value Relevance of Brands
Correlations, and Coefficient Values and t-statistics for the Regression:
MVEjt = ∑=
98
840
YYYYRDUMa + ∑
=
32
11
jjj FIRMa + a2 BVEjt + a3 NIjt + a4 BRANDjt + ejt
Panel A: Correlations Among Variables Used in Regressions
BVE NI BRAND MVE 0.55*** 0.81*** 0.86*** BVE 0.50*** 0.23*** NI 0.74***
Panel B: Coefficient values and t-statistics for the regression:
Variable Predicted signs
Regression coefficient
(white t-stat) N = 227
BVE + -0.06 -0.17
NI + 2.27 3.26***
BRAND + 1.24 3.27***
Adj R2 0.96 MVE = market value of equity. BVE = book value of equity (excluding brands). NI = net income. BRAND = brand assets. YRDUMY = 1 if year = Y, and 0 otherwise, FIRMj = 1 for the jth firm, and 0 for others.
*, **, *** indicate significance at 10, 5, and 1 percent levels (one-tailed for coefficients whose signs we predict).
Five outliers, i.e., observations with DFBETAS exceeding 1 in absolute value for any coefficient, were deleted for the regression in Panel B.
37
Table 4 Test of Reliability--Value Relevance of Brands in Subsamples Partitioned by
Contracting Incentives Dummies Correlations, and Coefficient Values and t-statistics for the Regressions:
MVEjt = ∑=
98
840
YYYYRDUMb + ∑
=
32
11
jjj FIRMb + b2 BVEjt + b3 NIjt + b4 BRANDjt +
b5 BVE*D_nocltestjt + b6 NI*D_nocltestjt + b7 BRAND*D_nocltestjt + ejt (Model 1) and
MVEjt = ∑=
98
840
YYYYRDUMc + ∑
=
32
11
jjj FIRMc + c2 BVEjt + c3 NIjt + c4 BRANDjt +
c5 BVE*D_lolevgjt + c6 NI*D_lolevgjt + c7 BRAND*D_lolevgjt + ejt (Model 2)
Panel A: Correlations Among Variables Used in Regressionsa
D_nocltest D_lolevg MVE 0.05 0.31*** BVE 0.27*** 0.35*** NI 0.03 0.26*** BRAND 0.03 0.28*** D_nocltest 0.36***
Panel B: Coefficients and t-statistics for regression models (1) and (2) Variable Predicted
signs Model 1 N = 230
Model 2 N = 230
BVE + -0.42 -0.60 (-1.10) (-1.52)*
NI + 7.19 6.72 (5.16)*** (5.25)***
BRAND + 0.35 0.40 (0.94) (1.05)
BVE*D_nocltest ? 1.03 (1.89)**
BVE*D_lolevg ? 1.27 (2.29)**
NI*D_nocltest ? -7.96 (-5.19)***
NI*D_lolevg ? -7.65 (-5.45)***
BRAND*D_nocltest + 1.59 (2.98)***
BRAND*D_lolevg + 1.51 (2.80)***
Adj R2 0.96 0.96 (White heteroskedasticity-adjusted t-statistics in parentheses)
38
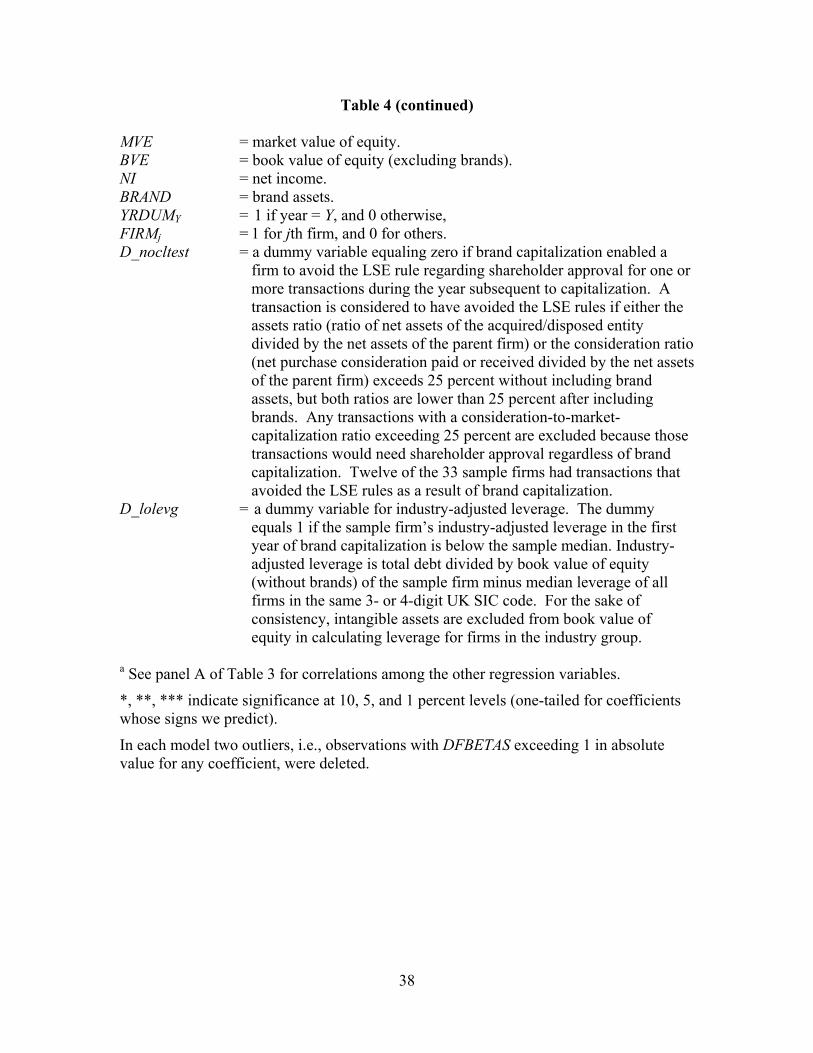
Table 4 (continued) MVE = market value of equity. BVE = book value of equity (excluding brands). NI = net income. BRAND = brand assets. YRDUMY = 1 if year = Y, and 0 otherwise, FIRMj = 1 for jth firm, and 0 for others. D_nocltest = a dummy variable equaling zero if brand capitalization enabled a
firm to avoid the LSE rule regarding shareholder approval for one or more transactions during the year subsequent to capitalization. A transaction is considered to have avoided the LSE rules if either the assets ratio (ratio of net assets of the acquired/disposed entity divided by the net assets of the parent firm) or the consideration ratio (net purchase consideration paid or received divided by the net assets of the parent firm) exceeds 25 percent without including brand assets, but both ratios are lower than 25 percent after including brands. Any transactions with a consideration-to-market-capitalization ratio exceeding 25 percent are excluded because those transactions would need shareholder approval regardless of brand capitalization. Twelve of the 33 sample firms had transactions that avoided the LSE rules as a result of brand capitalization.
D_lolevg = a dummy variable for industry-adjusted leverage. The dummy equals 1 if the sample firm’s industry-adjusted leverage in the first year of brand capitalization is below the sample median. Industry-adjusted leverage is total debt divided by book value of equity (without brands) of the sample firm minus median leverage of all firms in the same 3- or 4-digit UK SIC code. For the sake of consistency, intangible assets are excluded from book value of equity in calculating leverage for firms in the industry group.
a See panel A of Table 3 for correlations among the other regression variables.
*, **, *** indicate significance at 10, 5, and 1 percent levels (one-tailed for coefficients whose signs we predict).
In each model two outliers, i.e., observations with DFBETAS exceeding 1 in absolute value for any coefficient, were deleted.
39
Table 5 Share Price Reactions to Announcements of Brand Capitalization: All Firms, and
Subsamples Partitioned by Contracting Incentives Coefficient values and t-statistics for the regressions:
,)/( 1,10 jttjjtjt eMVEBRANDddAR ++= − Model 1
,)_*/(
_)/(
1,3
21,10
jttjjt
tjjtjt
enocltestDMVEBRANDf
nocltestDfMVEBRANDffAR
+
+++=
−
− Model 2
and
.)_*/(
_)/(
1,3
21,10
jttjjt
tjjtjt
elolevgDMVEBRANDg
lolevgDgMVEBRANDggAR
+
+++=
−
− Model 3
Regression coefficient
(white t-stat) N = 24
Variable Predicted signs
Model 1 Model 2 Model3
Intercept ? 0.01 0.02 -0.06 (-0.20) (0.62) (-1.36)
BRAND/MVE +/- 0.12 0.08 0.16 (3.21)*** (2.76)*** (3.35)***
D_nocltest ? -0.05 (-0.97)
D_lolevg ? 0.07 (1.13)
BRAND/MVE * D_nocltest + 0.21 (1.07)
BRAND/MVE * D_lolevg + -0.00 (-0.01)
Adj R2 0.02 0.03 0.08 ARjt = announcement period (days -10 to +10) abnormal returns for the jth firm
in year t (estimated as the difference between actual returns and expected returns based on market model parameters estimated over the 60 trading days ending 30 days before the announcement).
BRANDjt = brand assets at the end of year t. MVEj,t-1 = market value of equity at the end of year t-1. D_nocltest and D_lolevg are as defined in Table 4.
*, **, *** indicate significance at 10, 5, and 1 percent levels.