Embed Size (px)
Citation preview

653
J Am Acad Audiol 18:653–664 (2007)
*Audiology Department, Ealing Hospital, London; †Department of Experimental Psychology, University of Cambridge
Hashir Aazh, Audiology Department, Ealing Hospital, Uxbridge Road, Southall, London UB1 3HW, UK; Phone: +44 (0) 20 8967 5410;E-mail: [email protected]
The Value of Routine Real Ear Measurement of the Gain of Digital Hearing Aids
Hashir Aazh*Brian C.J. Moore†
Abstract
The main aims of this study were: (1) to determine whether routine real earinsertion gain (REIG) measurement is necessary in fitting digital hearing aids;and (2) to assess the extent to which modifying the frequency-gain responseof an aid can lead to better matches to the target in cases where the targetgain was not initially achieved. The target formula was selected as NAL-NL1in the programming software of four types of digital hearing aids. REIGmeasurements on 42 ears showed that 64% of cases failed to come within ±10dB of the target at one or more of the following frequencies: 0.25, 0.5, 0.75,1, 1.5, 2, and 4 kHz. After adjusting the frequency-gain response of the aids,based on the REIG results, 83% of cases came within ±10 dB of the target.The target was met more often, both before and after adjustment, for aids withseven gain “handles” than for aids with four gain “handles.” The resultsindicate that REIG measurements can and should be used to achieve moreaccurate fittings but that accurate adjustments are difficult with some aids.
Key Words: Real ear insertion gain, digital hearing aid, slope of audiogram,pure tone average, real ear unaided gain
Abbreviations: BTE = behind the ear; CAMEQ = Cambridge prescriptionmethod based on loudness equalization; CAMREST = Cambridge prescriptionmethod based on loudness restoration; DSL= desired sensation level; MHAS= Modernizing Hearing Aid Services; NAL = National Acoustic Laboratories;NAL-NL1= National Acoustic Laboratories’ non linear fitting procedure, version1; NAL RP = National Acoustic Laboratories Revised, Profound; NHS = NationalHealth Service; PTA = pure-tone average; REAR= real-ear aided response;RECD= real-ear coupler difference; REDD= real-ear dial difference; REM =real ear measurement; REIG = real-ear insertion gain; REOG = real-earoccluded gain; REUG= real-ear unaided gain
Sumario
Los propósitos principales de este estudio fueron: (1) determinar si lasmediciones rutinarias de ganancia de inserción en oído real (REIG) sonnecesarias para adaptar auxiliares auditivos digitales; y (2) evaluar el gradoen que la modificación de la respuesta de ganancia por frecuencia de un auxiliarpuede llevar a mejores ajustes en los casos donde la ganancia meta no le logróinicialmente. La fórmula meta fue seleccionada como la NAL-NL1 en elsoftware de programación de cuatro tipo de auxiliares auditivos digitales. Lasmediciones del REIG en 42 oídos mostró que el 64% de los casos fallaron enacercarse a ± 10 dB de la meta, en una o más de las siguientes frecuencias:

The initial fitting of hearing aids isoften based on a prescription tar-get, usually derived from audio-
metric thresholds. Examples areNAL(R) (Byrne and Dillon, 1986), NAL-NL1 (Dillon, 1999; Byrne et al, 2001),DSL[i/o] (Cornelisse et al, 1995),CAMEQ (Moore et al, 1999), CAMREST(Moore, 2000), and the “DSL multistageinput/output algorithm” (Scollie et al,2005). At least some of these targets arebased on empirical measurements show-ing that fitting according to the targetleads to greater speech intelligibility inquiet or in noise and/or better subjectivequality than fittings that deviate signif-icantly from the target (Byrne, 1986;Byrne and Cotton, 1988; Moore et al,2001). Also, fitting according to a targetcan optimize the audibility of speech fora given overall loudness (Moore and
Glasberg, 1998). Therefore, it wouldseem desirable to meet the target asclosely as possible.
Measurement of real ear insertiongain (REIG) is a reliable and accurateprocedure for determining how well ahearing aid is adjusted to match a pre-scription target, and for adjusting ahearing aid so as to improve the match(Seewald et al, 1999). REIG is definedas “the SPL at the eardrum when aidedminus the SPL at the eardrum whenunaided” (Dillon, 2001). Following themodernizing of hearing aid services(MHAS) in the UK, REIG measurementsare widely used in fitting of digital hear-ing aids in the majority of audiologydepartments in the National HealthService (NHS). However, the recommen-dation that REIG should be measured isnot always followed in the UK or else-
JJoouurrnnaall ooff tthhee AAmmeerriiccaann AAccaaddeemmyy ooff AAuuddiioollooggyy/Volume 18, Number 8, 2007
654
0.25, 0.5, 0.75, 1, 1.5, 2, y 4 kHz. Luego de ajustar la respuesta de gananciapor frecuencia, con base en los resultados del REIG, 83% de los casos seacercaron a ± 10 dB de la meta. La meta fue alcanzada más a menudo, tantoantes y después del ajuste, para auxiliares con siete ajustes de ganancia quepara auxiliares con cuatro ajustes. Los resultados indican que las medicionesde REIG pueden y deberían ser utilizadas para lograr adaptaciones másexactas, pero que tales ajustes exactos son difíciles en algunos auxiliares.
Palabras Clave: Ganancia de inserción por oído real, auxiliar auditivo digital;pendiente del audiograma, promedio tonal puro, ganancia no amplificada deoído real
Abreviaturas: BTE = retroauricular; CAMEQ = método de prescripción deCambridge con base en ecualización de la sonoridad; CAMREST = métodode prescripción de Cambridge con base en restauración de la sonoridad;DSL = nivel deseado de sensación; MHAS = Modernizando los Servicios deAuxiliares Auditivos; NAL = Laboratorios Nacionales de Acústica; NAL-NL1 =Procedimientos no lineales de adaptación de los Laboratorios Nacionales deAcústica, versión 1; NAL RP = Laboratorios Nacionales de Acústica, Revisado,Profundo; NHS = Servicio Nacional de Salud; PTA = promedio tonal puro; REAR= respuestas amplificadas de oído real; RECD = diferencia del acoplador enoído real; REDD = diferencia en el dial en oído real; REM = medición en oídoreal; REIG = ganancia de inserción en oído real; REOG = ganancia ocluidaen oído real; REUG = ganancia no amplificada en oído real

where, and some authors have reportedthat relatively few audiologists andhearing aid dispensers routinely usereal ear measurements (REMs) to verifyhearing aid fitting (Mueller, 2003;Kirkwood, 2004). The value of routineREIG measurement in the fitting ofanalog hearing aids has been investigat-ed in several studies (Swan andGatehouse, 1995; Harrowven, 1998;Norman and James, 2000).
Swan and Gatehouse (1995) investi-gated the necessity of measuring REIGsto identify inadequate hearing aid pre-scriptions through a prospective studyof 319 new analog hearing aid userswith a mean pure tone average (PTA)hearing threshold at 0.5, 1, 2, and 4 kHzof 47 dB (SD=11). The insertion gainrecommended by the National AcousticLaboratories (NAL) fitting method(Byrne and Dillon, 1986) was chosen asthe target. The fitting was consideredacceptable if the difference between theREIG and the NAL target was less than10 dB at all frequencies from 0.25 to 4kHz. Their results revealed that 76% offittings were not acceptable. The PTAand the overall slope of the audiogramdid not differ significantly for caseswhose fittings failed to achieve the NALtarget and those that met the target.However, the former, called here the“fail group,” had significantly poorerhearing at 4 kHz and had significantlymore steeply sloping audiogramsbetween 2 and 4 kHz than the “pass”group. This suggests that patients withmore steeply sloping audiograms andmore severe high-frequency hearinglosses are more difficult to fit well.Sixty-eight patients from 241 in the failgroup attended an additional fitting ses-sion. After appropriate changes in thetubing, filters, horn, and hearing aids,62% came within 10 dB of the NAL tar-get at all frequencies. Swan andGatehouse concluded that the routineuse of REIG in all analog hearing aidfittings would result in many patientshaving a more accurately fitted hearingaid.
In recent years many technicaladvances have been applied to hearingaids, and digital hearing aids have
become increasingly popular. Theseoffer many advantages over analoghearing aids (Levitt et al, 1990; Wouterset al, 2002). In particular, since digitalhearing aids offer more possibilities forcontrolling the frequency-gain charac-teristic, some authors have questionedwhether it is still essential to performREM in routine hearing aid fitting, orwhether the first fit program of digitalhearing aids can be relied upon to pro-vide gain consistent with a given pre-scription formulae (Hawkins and Cook,2003; Aarts and Caffee, 2005).
Hawkins and Cook (2003) investigat-ed the accuracy of hearing aid fittingspredicted by the manufacturer’s soft-ware, using 12 subjects. Their resultsrevealed that the fitting software over-estimated actual real-ear gains, particu-larly at higher frequencies. The meas-ured insertion gain at and above 2 kHzconsistently fell short of the predictedinsertion gain. Aarts and Caffee (2005)further examined the predictive accura-cy of the real-ear aided response (REAR)values provided by one hearing aid man-ufacturer’s fitting software, for a nine-channel digital hearing aid, using 79ears. They found that the REARs pre-dicted by the manufacturer ’s fittingsoftware were inaccurate for almost allsubjects. They concluded that one of thecauses of the discrepancy between pre-dicted and measured REAR values isthe use of average real-ear unaided gain(REUG) in the hearing aid fitting soft-ware. The REUG represents theamount of natural amplification of theopen ear resulting from the resonancesof the concha and ear canal in the fre-quency range 0.25–4 kHz. In practice,the REUG varies significantly acrossindividual ears, especially in terms ofthe location and magnitude of the pri-mary resonance peak (Weiner and Ross,1946).
The studies described above onlyassessed the discrepancy between gainspredicted by the manufacturers’ soft-ware and gains actually measured.They did not assess the extent to whichfitting could be made more accurate byadjustment of the hearing aids. Also,they did not explore the influence of sev-
VVaalluuee ooff RRoouuttiinnee RReeaall EEaarr MMeeaassuurreemmeennttss/Aazh and Moore
655

eral factors that might affect the devia-tion from the target values. The aims ofthe present study were: (1) to investigatethe number of fittings which came within±10 dB of the NAL-NL1 (Dillon, 1999)insertion gain target through the first fitor quick fit program of four types of digi-tal hearing aids when the NAL-NL1 pre-scription was selected as the gain formu-la in the programming software of theaids; (2) to assess the extent to whichmodifying the frequency-gain response ofthe aids led to a better match to the tar-get for those who did not initially achievethe target gains; (3) to determine thepass/fail rate for different types of hear-ing aids and different earmolds; (4) todetermine the extent to which the REUGis related to the difference between themeasured REIG and the insertion gaintarget, which is denoted here “target mis-match.”
MMEETTHHOODD
SSuubbjjeeccttss aanndd AAuuddiiooggrraammss
Forty-two ears of a consecutive sampleof 24 patients (12 female, 30 male) whowere considered for provision of digitalhearing aids in the period April to June2006 at the Audiology Department (clinicB), Ealing Hospital, London, were includ-ed in this study. Pure tone thresholdswere measured in a sound-attenuatingroom following the British Society ofAudiology recommended procedure(2004), using an Aurical audiometer withMadsen HB7 (TDH 39P) headphones andRadioear B71 bone vibrator. The Auricalwas calibrated in November 2005. Airconduction thresholds were measured at0.25, 0.5, 1, 2, 4, and 8 kHz. The meanPTA for the frequencies 0.5, 1, 2, and 4kHz was 53 dB HL (SD= 16). This studywas performed in accordance with theHelsinki declaration on medical ethicsissues.
HHeeaarriinngg AAiiddss aanndd EEaarr MMoollddss
The hearing aids used were 16 Spirit 3(Oticon, known in some parts of the worldas “Tego Pro”), eight Prisma 2 Pro(Siemens), three Prisma 2 DSP+ (Siemens),
and 15 Danalogic 6 (GNReSound, knownin some parts of the world as “Pixel”),chosen based on the patients’ audiogramsand the recommended fitting range of thehearing aids. If two or more hearing aidswere suitable for an individual case, thenthe hearing aid was chosen based on itsavailability from stock in the clinic orrandomly. Spirit 3 is a six-channel hear-ing aid. It has six gain “handles” withcenter frequencies at 0.25, 0.75, 1.5, 2.5,4.5, and 7 kHz, and crossover frequenciesare adjustable. Prisma 2 Pro and Prisma2 DSP+ are four-channel aids with threeindividually adjustable crossover fre-quencies at 0.35/0.55, 0.71/1.12/1.8, and2.25/2.8/3.5 kHz. Danalogic 6 has 17channels, but the software includes onlyseven gain “handles” at 0.25, 0.5, 1, 2, 3,4, and 6 kHz.
Twenty-two hearing aids were fittedusing non-occluding ear molds (eightOticon Corda, nine Starkey skeleton openmolds with D/F Ring, and fiveGNReSound flex-tube), five using all softshell molds, two using non-allergic shells,six using skeleton acrylic soft tips and 1mm vents, three using skeleton acrylicsoft tips and 2 mm vents, and four usingskeleton acrylic soft tips and no vents.Skeleton molds had standard size 13 tub-ing. Oticon Corda and GNReSound flex-tube had narrow tubing. The inner diam-eters of the narrow and standard tubingare about 0.7 and 1.9 mm, respectively,while the outer diameters are about 1 and3.3 mm, respectively.
FFiittttiinngg PPrroocceedduurree
The fitting session usually lasted aboutone hour. Twenty-five minutes of that wasallocated to programming the aid andperforming REM, 30 minutes to auditoryrehabilitation, and 5 minutes to journalentry. The target gains used here werebased on the NAL-NL1 fitting method(Dillon, 1999). This is a non-linear ver-sion of the NAL-R method (Byrne andDillon, 1987). NAL-NL1 is one of the mostwidely used methods for fitting compres-sion hearing aids to adults. Its aim is tomaximize speech intelligibility for a spec-ified loudness level, as calculated using aloudness model (Moore and Glasberg,1997). The factors taken into account for
JJoouurrnnaall ooff tthhee AAmmeerriiccaann AAccaaddeemmyy ooff AAuuddiioollooggyy/Volume 18, Number 8, 2007
656

calculating the insertion gain at each fre-quency are hearing level and air-bone gapat that frequency, three-frequency aver-age hearing level, and the overall speechinput level (Byrne et al, 2001). For medi-um input levels, the gains prescribed byNAL-NL1 are similar to those prescribedby NAL(R), and there have been studiesshowing that subjects prefer gains andfrequency responses based on NAL(R) asopposed to gains and/or frequencyresponses that deviate significantly fromthose prescribed by NAL(R) (Byrne, 1986;Byrne and Cotton, 1988).
The hearing aids were programmed fol-lowing the recommended procedures andguidelines of the hearing aid manufactur-ers. The aids were programmed using themost recent version of the manufacturers’propriety software contained in theNOAH 3 platform (Genie 6 for Spirit3,Connexx 5.2 for Prisma 2 Pro and Prisma2 DSP+, and Aventa 2.10 for Danalogic 6).A PC housed the NOAH 3 software aswell as the Madsen Aurical REM module(version 2.50) used for REM.
Siemens and Oticon recommend use ofthe NAL-NL1 formula for the fitting oftheir aids, and then verification againstthe NAL-NL1 insertion gain target. TheConnexx 5.2 software has four acclimati-zation levels (level four corresponds tothe most experienced), and it is recom-mended that the aids are set to level fourif it is desired to achieve the NAL-NL1prescription target; the gain may then bemodified based on the patient’s prefer-ences and experience with the hearingaid. The Genie 6 software has threeacclimatization levels, and it is recom-mended that the aids are set to levelthree to achieve the NAL-NL1 prescrip-tion. Siemens and Oticon do not recom-mend changing the programming of theaid following initial fitting unless REMreveals gross deviations from the targetinsertion gain. If necessary, adjustmentsto the programming should then be madeto achieve a closer fit to insertion gaintarget, as long as the patient finds thesound acceptable and comfortable. Theseadjustments to the programming can bemade while the insertion gain is active onscreen, using the two NOAH modules(Connexx/Genie/Aventa and REM) togeth-er. GNReSound recommends use of either
audiogram+ or NAL-NL1 targets for thefitting of the aids.
For all hearing aids, NAL-NL1 wasselected as the target formula, and thehearing aid features were selected in thesoftware as follows: expansion off, noisereduction off, feedback cancellation off,voice activity detection off. Type of tubing(number 13 or thinner tubing) and ventsize (1 mm, 2 mm, and open) were alsoselected as appropriate in the fitting soft-ware. REIG was measured following theMHAS guidelines using an Aurical(Madsen) system as follows: NAL-NL1was selected as the REIG target, then theNAL-NL1 insertion gain target was gen-erated by specifying multi-channel limit-ing, four-channel compression (the maxi-mum number of channels allowed by theNAL-NL1 software), compression thresh-old (CT) for a wideband signal equal to 52dB SPL for Prisma 2 Pro, Prisma 2DSP+,and Danalogic 6 and 57 dB for Spirit 3,reference position on head surface, headorientation at 45º, bilateral or unilateralas appropriate, tubing on number 13(there was no option for thinner tubing inthe REM module), vent size as appropri-ate, input level at 65 dB, real-ear couplerdifference (RECD) on predicted, real-earunaided gain (REUG) on predicted, real-ear dial difference (REDD) on predicted,transducer type on supra-aural head-phone and hearing instrument as BTE.Several of these settings do not influencethe outcome of the REM, but they arementioned here as they are part of theprocedure specified by the MHAS guide-lines. It should be noted that the NAL-NL1 software sometimes does not give arecommendation for gain at certain fre-quencies if the hearing loss is large. Thishappened most often at 4 kHz but some-times at other frequencies. In such cases,the manufacturers’ software usuallyassigned a gain at the “missing” frequen-cy that was equal to the gain at the nextlowest frequency.
Otoscopy always preceded REM, tocheck that the ear canal was healthy andnot obstructed by cerumen. The probetube was calibrated using a pure tonesweep at 65 dB SPL. To perform calibra-tion, the probe tube was placed close tothe reference microphone aperture in theREM headset, and the headset was held
VVaalluuee ooff RRoouuttiinnee RReeaall EEaarr MMeeaassuurreemmeennttss/Aazh and Moore
657
0.5 m in front of the loudspeaker andwith the microphone and probe tube fac-ing the loudspeaker. The calibration waschecked by holding the headset in thesame position and running a REUGmeasurement using a 65 dB SPL modu-lated speech noise stimulus. The calibra-tion was considered as accurate if themeasured REUG response was 0 dB at allfrequencies. If not the calibration wasrepeated. The patient was positioned sothat the ear under test was at 45º to theloudspeaker, 0.5 m from the loudspeaker,and level with the center of the loud-speaker. The patient was instructed to sitas still as possible during recording. Thethinner (1.1 mm) microphone probe tube(with a black-colored marker) was used.The marker was set 27 mm from the endof the probe tube, and the probe tube wasinserted until the marker was at the tra-gus. For all subsequent measurements,the signal was a 65 dB SPL modulatedspeech-shaped noise. With the probe tubein place, the REUG was recorded. Thenthe hearing aid was placed behind theear, and the earmold was inserted intothe ear, leaving the probe in place. Withthe hearing aid switched off, the real earoccluded gain (REOG) was recorded.Then the aid was switched on, and thereal ear aided gain was recorded. Fromthis, the REM software calculated theREIG.
The difference between the REIG andthe NAL-NL1 target was recorded as thefirst fit target mismatch at 0.25, 0.5, 0.75,1, 1.5, 2, 3, and 4 kHz. The fitting wasconsidered acceptable if the differencebetween the REIG and the NAL-NL1 tar-get gain was less than 10 dB at all fre-quencies. If the NAL-NL1 software did
not give a recommended gain at a specificfrequency, then that frequency wasignored for the purpose of decidingwhether a fitting was acceptable or not. Ifa fitting was not acceptable, the frequen-cy-gain response was modified using thegain “handles” in the hearing aid software,and by adjusting cross over frequencies ifappropriate, to achieve a closer fit to theinsertion gain target, following the manu-facturers’ recommended procedure. TheREIG was then remeasured. The differ-ence between the final REIG and the NAL-NL1 insertion gain target was recorded asthe final target mismatch.
RREESSUULLTTSS
PPrrooppoorrttiioonn ooff FFaaiill CCaasseess aanndd EEffffeeccttooff AAddjjuussttmmeenntt
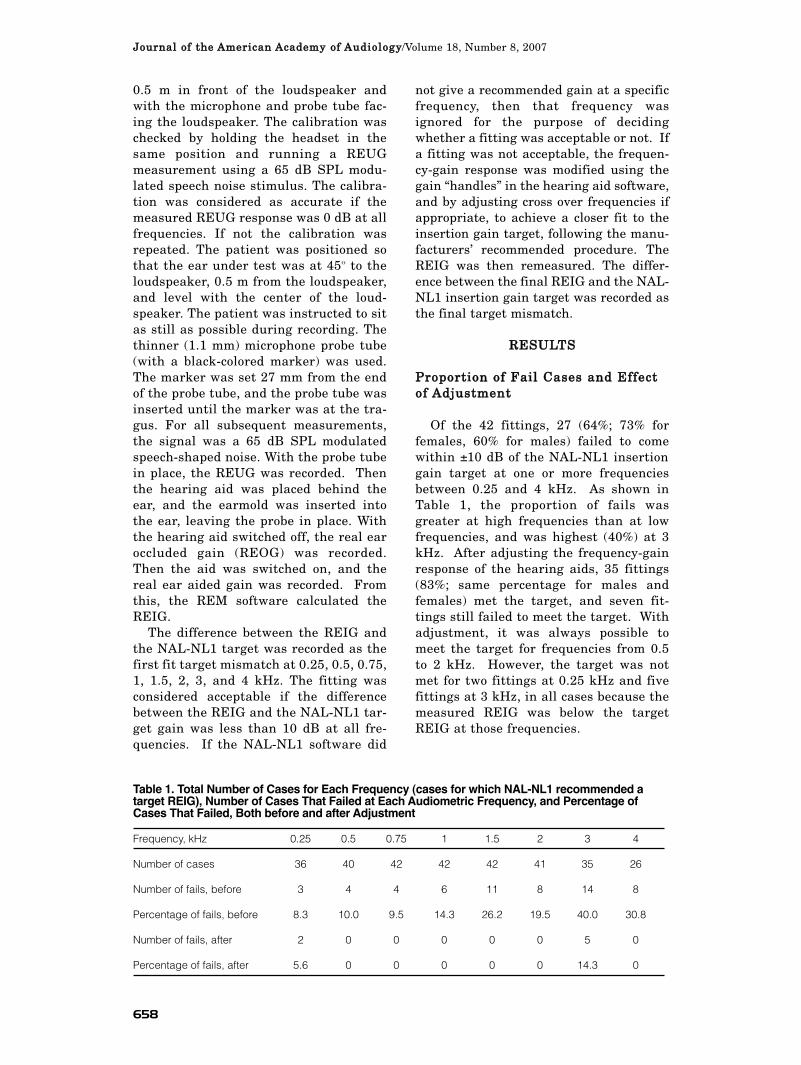
Of the 42 fittings, 27 (64%; 73% forfemales, 60% for males) failed to comewithin ±10 dB of the NAL-NL1 insertiongain target at one or more frequenciesbetween 0.25 and 4 kHz. As shown inTable 1, the proportion of fails wasgreater at high frequencies than at lowfrequencies, and was highest (40%) at 3kHz. After adjusting the frequency-gainresponse of the hearing aids, 35 fittings(83%; same percentage for males andfemales) met the target, and seven fit-tings still failed to meet the target. Withadjustment, it was always possible tomeet the target for frequencies from 0.5to 2 kHz. However, the target was notmet for two fittings at 0.25 kHz and fivefittings at 3 kHz, in all cases because themeasured REIG was below the targetREIG at those frequencies.
JJoouurrnnaall ooff tthhee AAmmeerriiccaann AAccaaddeemmyy ooff AAuuddiioollooggyy/Volume 18, Number 8, 2007
658
Table 1. Total Number of Cases for Each Frequency (cases for which NAL-NL1 recommended atarget REIG), Number of Cases That Failed at Each Audiometric Frequency, and Percentage ofCases That Failed, Both before and after Adjustment
Frequency, kHz 0.25 0.5 0.75 1 1.5 2 3 4
Number of cases 36 40 42 42 42 41 35 26
Number of fails, before 3 4 4 6 11 8 14 8
Percentage of fails, before 8.3 10.0 9.5 14.3 26.2 19.5 40.0 30.8
Number of fails, after 2 0 0 0 0 0 5 0
Percentage of fails, after 5.6 0 0 0 0 0 14.3 0
CCoommppaarriissoonn ooff AAuuddiiooggrraammCCoonnffiigguurraattiioonnss bbeettwweeeenn tthhee FFaaiill aannddPPaassss GGrroouuppss
The mean slope of the audiogrambetween 2 and 4 kHz was 11 dB/oct(SD=10) for the pass group and 21 dB/oct(SD=19) for the fail group, and the differ-ence was statistically significant (t=-2.23,df= 39.79, p <0.05). The slope of theaudiogram between 2 and 4 kHz for thefittings which initially came within 10 dBof the target (15 ears) was always lessthan 35 dB/oct. All fittings for the cases(six ears) with slope over 35 dB/oct ini-tially failed to meet the target (thesecases were fitted with completely openmolds). However, poor fits were not asso-ciated only with steep slopes, since therewere 21 cases out of 36 with slopes lessthan 35 dB/oct which initially failed tomeet the target.
The overall slope of the audiogrambetween 0.25 and 4 kHz was 8 dB/oct(SD=6) for the pass group and 7 dB/oct(SD=6) for the fail group, and the differ-ence was not statistically significant(t=0.346, df= 40, p =0.731). The PTA(average of 0.5, 1, 2, and 4 kHz) was 57dB (SD=13) for the pass group and 50 dB(SD=19) for the fail group, and this dif-ference was also not statistically signifi-cant (t=1.32, df= 37.84, p =0.192).
OOppeenn FFiittttiinnggss vveerrssuuss OOcccclluuddiinnggMMoollddss
For patients with good high-frequencyhearing combined with mild low- andmid-frequency hearing losses, non-occlud-ing earmolds were fitted, because theseresult in better sound quality, reducedocclusion effect, better externalizationand localization of sound, and more com-fortable listening (Byrne et al, 1996;Upfold et al, 1997). They may also makeit easier to obtain the target frequency-gain response. However, as describedbelow, the fail rate was slightly higheroverall for fittings with non-occludingearmolds (68%) than for fittings withoccluding earmolds (60%), perhapsbecause the former were used for patientswith more steeply sloping losses.
Of 13 hearing aids fitted using Cordaand Flex tube (completely open molds
with thinner tubing), eight hearing aids(62%) initially failed to meet the target atmid- and high frequencies, and two ofthem failed to meet the target after mod-ifying the frequency gain response in thefinal REIG examination. These two aidsdid not provide the 28 dB insertion gainat 3 kHz which was prescribed by NAL-NL1 even after increasing the gain by 10dB at 3 kHz (because of the risk of feed-back it was not possible to increase thegain even more at 3 kHz). Of the 13 sub-jects who were fitted with completelyopen molds, four were prescribed with5–8 dB of gain at 0.25 kHz, and the restdid not require any gain at 0.25 kHz.However, in the four cases that didrequire gain at 0.25 kHz, REIG measure-ments showed at most 4 dB gain at thatfrequency even after increasing the pro-grammed gain at 0.25 kHz by 5–8 dB.This is explained by the fact that, forsounds delivered by a hearing aid, thevent provides a low-cut to the frequencyresponse and wider vents or open moldsmove the insertion gain toward 0 dB atlow frequencies (Upfold et al, 1997;Dillon, 2001; Kates, 2005).
Of nine aids fitted using open moldswith standard number 13 tubing (Starkeyskeleton open molds D/F Ring), seven(78%) initially failed to meet the target atmid- and high frequencies, and one ofthem failed to meet the target after mod-ifying the frequency-gain response. In thelast case, the aid could not provide the 18dB gain at 3 kHz which was prescribed byNAL-NL1. This hearing aid did not havea gain “handle” for 3 kHz, although it hadgain “handles” at 2.5 and 4.5 kHz.Therefore, it was not possible to increasethe gain specifically at 3 kHz because itled to over-amplification at 2 and 4 kHz.
Of 20 aids with occluding molds, 12(60%) failed initially to meet the target atlow, mid-, or high frequencies, and four ofthem failed to meet the target after mod-ifying the frequency-gain response. In thelast four cases, the aids could not providethe prescribed gain at high (4 kHz) andlow (0.25 and 0.5 kHz) frequencies whilemeeting the target gain at midfrequen-cies (0.75, 1, 1.5, 2 and 3 kHz). The hear-ing aids used for these four fittings werefour-channel aids, and increases in gainat high or low frequencies or changing the
VVaalluuee ooff RRoouuttiinnee RReeaall EEaarr MMeeaassuurreemmeennttss/Aazh and Moore
659

cross-over frequencies led to over-amplifi-cation at midfrequencies, so it was notpossible to meet the target gain at lowand high frequencies while preservingthe gain at midfrequencies.
VVaalluueess ooff TTaarrggeett MMiissmmaattcchh aannddRReellaattiioonn ttoo RREEUUGG
Table 2 shows the maximum mismatchat each frequency, the mean and standarddeviation of the mismatches, and themean and standard deviation of theabsolute values of the mismatches (i.e.,the mean and SD ignoring the direction ofthe mismatches). A negative value indi-cates a measured REIG below the targetgenerated by NAL-NL1. For the initialfittings, the mean values were consistent-ly negative, indicating that the REIG wassystematically lower than estimatedusing the manufacturers’ software. Themean error was especially large at 3 kHz(-10.2 dB) and 4 kHz (-8.2 dB). Followingadjustment, the means of the mismatchesdecreased, as expected. However, for thefrequency of 3 kHz, the mean mismatchremained relatively high, at -5.4 dB (SD =
6 dB), reflecting the fact that it was notpossible to achieve the target gain at 3kHz for some of the aids.
For the initial fittings, the mean of theabsolute values of the mismatches wasequal (but opposite in sign) to the mean ofthe mismatches at 0.25 and 4 kHz. Thisreflects the fact that all of the mismatch-es at these two frequencies were nega-tive; the REIG values were all below thetarget values. At 0.25 kHz this was usu-ally a result of the use of non-occludingearmolds, as discussed earlier, and ithappened despite the fact that non-occluding earmolds had been specified inthe manufacturers’ software. The consis-tent negative mismatches at 4 kHz reflectthe trend that has been reported in previ-ous studies for the REIG at high frequen-cies to be lower than set in the manufac-turers’ software (Hawkins and Cook,2003). For frequencies from 0.5 to 2 kHz,the initial mismatches were sometimespositive and sometimes negative. Themaximum mismatches for the initial fitswere positive at 0.75 and 1 kHz, reflect-ing the fact that the REIG at those fre-quencies was sometimes markedly higher
JJoouurrnnaall ooff tthhee AAmmeerriiccaann AAccaaddeemmyy ooff AAuuddiioollooggyy/Volume 18, Number 8, 2007
660
Table 2. For Each Frequency, the Number of Cases (cases for which NAL-NL1 recommended atarget REIG), Maximum Mismatch, Mean and SD of the Initial and Final Mismatches, and Mean and SD of the Absolute Values (abs) of the Initial and Final Mismatches
Frequency Number Fitting Max Mean SD Mean of SD of(kHz) of cases (dB) (dB) (dB) abs (dB) abs (dB)
Initial -20 -3.9 6 3.9 6
Final -20 -2.9 5 3.5 5
Initial -14 -2.7 5 3.5 4
Final -10 -0.7 3 1.9 3
Initial 18 -1.4 6 4.3 4
Final -8 0.1 3 2.2 2
Initial 20 -4.0 7 7.7 5
Final -10 -2.2 3 2.6 3
Initial -24 -6.0 8 7.8 6
Final -20 -2.6 4 3.1 4
Initial ±16 -4.0 7 6.5 4
Final 6 -0.8 3 1.9 2
Initial -30 -10.2 7 10.5 7
Final -22 -5.4 6 5.8 6
Initial -16 -8.2 5 8.2 5
Final -10 -3.0 4 4.0 3
Note: A negative number indicates that the REIG was below the target. For the initial fitting at 2 kHz therewere two mismatches that were equally large, but opposite in sign, so the maximum is shown as ±16.
0.25 36
0.5 40
0.75 42
1 42
1.5 42
2 41
3 35
4 26

than indicated by the manufacturers’software. For the final fittings, the max-imum mismatches were all negativeexcept at 2 kHz.
The means of the absolute values of themismatches represent the typical magni-tude of the deviation from the target ateach frequency, regardless of sign. Thesemeans always became smaller followingadjustment, often by a factor of two ormore. For example, at 1.5 kHz the meanof the absolute values of the mismatcheswas 7.8 dB for the initial fitting and 3.1after adjustment. This indicates thevalue of making adjustments based onREMs.
The frequency response of the unaidedear plays a crucial role in determininginsertion gain, because the response forthe unaided ear is subtracted from theresponse for the aided ear (Fikret-Pasaand Revit, 1992). If the client’s ear canalresonance does not correspond to averagevalues in terms of center frequency andmagnitude, this could result in mismatchto the target REIG and to unwantedpeaks and dips in the REIG (Upfold andByrne, 1988; Mueller, 2001).
To determine the extent to which indi-vidual variability of ear canal resonanceis related to the target mismatch, weassessed the correlation between the fol-lowing two quantities: (1) the differencebetween the measured REUG and the averageREUG incorporated in the aid’s software at 2,3, and 4 kHz, and (2) the target mismatch at2, 3, and 4 kHz.
The average REUG values usuallyincorporated in the hearing aid softwareare 12 dB at 2 kHz, 17 dB at 3 kHz, and15 or 14 dB at 4 kHz (personal communi-cations with companies). The correlationwas not significant at any frequency: for 2kHz, r= -0.118, p = 0.468; for 3 kHz, r= -0.124,p=0.471; for 4 kHz, r= 0.056, p=0.785. Thislack of correlation indicates that it is notpossible to predict the degree of mis-match from the extent to which the indi-vidual’s REUR differs from the averageREUG incorporated in the aid’s software.
It should be noted that, for some pre-scription methods, such as DSL[i/o](Cornelisse et al, 1995), CAMEQ (Mooreet al, 1999) and CAMREST (Moore, 2000),the sound level at the eardrum, as meas-ured using the real ear aided response
(REAR), is considered more importantand more relevant than the REIG. If thetarget is specified as the REAR, then itbecomes unnecessary to measure theREUR; what is important is to achievethe appropriate sound levels at theeardrum. However, individual differ-ences in ear canal geometry, such as theresidual volume in the ear canal, and fac-tors such as vent dimensions, can strong-ly affect the REAR. This provides anoth-er reason to perform REM.
PPaassss//FFaaiill RRaattee ffoorr DDiiffffeerreenntt DDiiggiittaallHHeeaarriinngg AAiiddss
Figure 1 shows the percentage of aidsof each type for which the target was meton the first fitting (black bars) and afteradjustment (final fitting: light gray bars).The proportion of aids meeting the targetfollowing initial fitting was highest forthe Danalogic 6 and lowest for the Prisma2DSP+. Following adjustment, the targetwas met for all of the fittings withDanalogic 6, but a substantial proportionof fittings failed to meet the target for theother three types of aids. This is probablyrelated to the fact that the Danalogic 6 hasmore channels and more adjustable “gainhandles” than the other aids.
DDIISSCCUUSSSSIIOONN
According to MHAS guidelines for fit-ting digital hearing aids, tolerances to
the prescription rationale of ±5 dB at 0.25,0.5, 1, and 2 kHz, and of ±8 dB at 3 and 4kHz should be achieved in all cases.However, the criterion used here for ade-quacy of hearing aid fitting was that theREIG at all frequencies should be within±10 dB of the target. We chose this criteri-on to be able to compare our results withthose of others. Despite the laxity of thiscriterion in comparison to the guideline,64% of the initial fittings failed to achieveit. This result is consistent with theresults of other studies (Hawkins andCook, 2003; Mueller, 2003; Aarts andCaffee, 2005). After modifying the frequen-cy-gain response of the aids, 17% (sevenaids) still did not meet the target. Two ofthe aids that failed to meet the target werefitted using completely open molds and,
VVaalluuee ooff RRoouuttiinnee RReeaall EEaarr MMeeaassuurreemmeennttss/Aazh and Moore
661

given the risk of the feedback, it was notpossible to increase the gain at the failedfrequency of 3 kHz. For the remaining fiveaids that failed to meet the target, it wasnot possible to increase the gain at somefrequencies while preserving the gain atothers. This problem occurred for the aidswith four gain “handles” and not for theaids with seven gain “handles.” For thehearing aids with seven gain channel“handles,” it was possible to increase thegain at a specific frequency with only aminor effect on the gain at neighboringfrequencies. Given the fact that 100% ofthe fittings using the hearing aids withseven gain “handles” came within ±10 dBof the insertion gain target after adjust-ment, it seems that the chance of meetingthe prescription target is higher for hear-ing aids with more adjustable “handles”(and more channels).
For patients who were fitted with com-pletely open molds, the REIG measure-ments did not show more than 5 dB of gainat low frequencies. This is consistent withthe results of Upfold et al (1997) suggest-ing that, when a non-occluding earmold isused, it is necessary to increase the hear-ing aid’s programmed low-frequency gainto provide the same insertion gain as whena closed earmold is used. In many cases, itmay be impossible to increase the pro-grammed gain sufficiently to provide use-ful gain at low frequencies (Moore et al,2005; Kates, 2005).
The proportion of mismatches and themagnitudes of the mismatches were bothgreatest at 3 and 4 kHz (Tables 1 and 2),
and the mismatches at these frequencies,at least for the initial fittings, were near-ly always negative. This is consistentwith the results of Hawkins and Cooke(2003). They obtained insertion gainmeasures for 12 patients. Their resultsshowed that there were clear differencesbetween the measured gain and insertiongain simulated by the hearing aid soft-ware. At 3 and 4 kHz, the measuredinsertion gain was always below the sim-ulated insertion gain. At 4 kHz, 50% ofcases had insertion gains that were morethan 10 dB below simulated values. Inour study, the mean mismatch for the ini-tial fitting at 4 kHz was -8.2 dB, a valuecomparable to that found by Hawkins andCooke. The large negative mismatches at3 and 4 kHz may occur partly becausemanufacturers of hearing aids have diffi-culty in producing the increase in gainaround 3–4 kHz that is required to com-pensate for the loss of the ear canal reso-nance when a mold is placed in the earcanal.
More generally, hearing aid softwaremay not adequately adjust the hearingaid to achieve a target if the averageREUG, microphone location effect, andvent and tubing effects incorporated inthe hearing aid software are differentfrom the individual values (Dillon andKeidser, 2003). Unusual shapes or sizesof ear canals may result in especiallylarge discrepancies between the targetand measured REIG values (Sanborn,1998).
As noted earlier, it is debatable
JJoouurrnnaall ooff tthhee AAmmeerriiccaann AAccaaddeemmyy ooff AAuuddiioollooggyy/Volume 18, Number 8, 2007
662
FFiigguurree 11.. The percentage of fittings that came within ±10 dB of the NAL-NL1 target in the frequencyrange 0.25 to 4 kHz using the first fit program of the aids (black bars) and after adjustments in fre-quency-gain response (light gray bars), for four different types of digital hearing aids.
whether attention should be focused onachieving the correct REIG. Most fittingprocedures have as their goal for a givenhearing loss a specific target spectrum forspeech, as measured at the eardrum andcharacterized by the REAR measuredwith a speech-shaped noise or with realspeech. For example, in connection withthe CAMEQ fitting method, Moore et al(1999) stated that “In the case of theCambridge formula, the aim is to achievea spectrum at the eardrum that leads to aflat specific loudness pattern for speechpresented at a free-field level of 65 dBSPL. Therefore, to get the appropriategains for a specific individual ear, it ispreferable to perform real-ear measure-ments using a probe microphone system,and to express the target gains as gainsat the eardrum.” In other words, theREAR is more relevant than the REIG,and to achieve the appropriate REAR val-ues, REMs are needed. Similarly, theDSL[i/o] fitting procedure, both in itsoriginal version (Cornelisse et al, 1995)and in the more recent version (Scollie etal, 2005), specifies targets in terms ofsound pressure level at the eardrum for agiven type of input.
CCOONNCCLLUUSSIIOONNSS
For a representative sample of digitalhearing aids fitted using the manu-
facturers’ first fit or quick fit program,64% of fittings failed to come within ±10dB of the NAL-NL1 insertion gain targetat one or more of the audiometric fre-quencies between 0.25 and 4 kHz. Themean slope of the audiogram between 2and 4 kHz was significantly greater forfittings which failed to meet the targetthan for those which met the target. Thedegree of target mismatch at 2, 3, and 4kHz was not correlated with the differ-ence between the individual’s REUG andthe average REUG incorporated in theaid’s software. There was no marked dif-ference in the percentage of fittings thatfailed to meet the target between thoseusing open molds and those using occlud-ing molds. After adjustment, 100% of thefittings for the aids with seven gain “han-dles” came within ±10 dB of the target,but this was true for only 62% of fittingsfor hearing aids with four gain “handles.”
This suggests that the chance of meetingthe prescription target after adjustmentis higher for hearing aids with more gain“handles.” Adjustments based on REIGmeasurements led to clear improvementsin the match to target, the pass rate ris-ing from 64% using the first fit programof the hearing aid’s software to 83% usingREIG measurements. The adjustmentstypically resulted in the magnitudes ofthe mismatches (absolute values in dB)decreasing by a factor of two or more.These outcomes suggest that routineREM measurement is useful for achiev-ing more accurate matches to prescriptivetargets.
AAcckknnoowwlleeddggmmeennttss.. We thank Pete Roberts, SarahHills, and two anonymous reviewers for their commentson an earlier version of this paper.
VVaalluuee ooff RRoouuttiinnee RReeaall EEaarr MMeeaassuurreemmeennttss/Aazh and Moore
663
RREEFFEERREENNCCEESS
Aarts NL, Caffee CS. (2005) Manufacturer predictedand measured REAR values in adult hearing aid fit-ting: accuracy and clinical usefulness. Int J Audiol44:239–301.
British Society of Audiology. (2004) Pure Tone Air andBone Conduction Threshold Audiometry with andwithout Masking and Determination of UncomfortableLoudness Levels. Reading, UK: British Society ofAudiology.
Byrne D. (1986) Effects of frequency response charac-teristics on speech discrimination and perceived intel-ligibility and pleasantness of speech for hearing-impaired listeners. J Acoust Soc Am 80:494–504.
Byrne D, Cotton S. (1988) Evaluation of the NationalAcoustic Laboratories' new hearing aid selection proce-dure. J Speech Hear Res 31:178–186.
Byrne D, Dillon H. (1986) The National AcousticLaboratories' (NAL) new procedure for selecting thegain and frequency response of a hearing aid. Ear Hear7:257–265.
Byrne D, Dillon H, Ching T, Katsch R, Keidser G.(2001) NAL-NL1 procedure for fitting nonlinear hear-ing aids: characteristics and comparisons with otherprocedures. J Am Acad Audiol 12:37–51.
Byrne D, Noble W, Glauerdt B. (1996) Effects of ear-mold type on ability to locate sounds when wearinghearing aids. Ear Hear 17:218–228.
Cornelisse LE, Seewald RC, Jamieson DG. (1995) Theinput/output formula: a theoretical approach to the fit-ting of personal amplification devices. J Acoust Soc Am97:1854–1864.
Dillon H. (1999) NAL-NL1: a new procedure for fittingnon-linear hearing aids. Hear J 52:10–16.
Dillon H. (2001) Hearing Aids. Sydney: BoomerangPress.
Dillon H, Keidser G. (2003) Is probe-mic measurementof HA gain-frequency response best practice? Hear J56:28–30.
Fikret-Pasa S, Revit LJ. (1992) Individual correctionfactors in the preselection of hearing aids. J SpeechHear Res 35:384–394.
Harrowven RG. (1998) Insertion gain versus medianear corrected coupler gain: a comparison of two fittingmethods in new NHS hearing aid users. Br J Audiol32:153–165.
Hawkins DB, Cook JA. (2003) Hearing aid softwarepredictive gain values: how accurate are they? Hear J56:26, 28, 32, 34.
Kates JM. (2005) Principles of digital dynamic-rangecompression. Trends Amplif 9:45–76.
Kirkwood DH. (2004) Survey finds most dispensersbullish, but not on over-the-counter devices. Hear J57:19, 20, 24–26, 28, 30.
Levitt H, Neuman A, Sullivan J. (1990) Studies withdigital hearing aids. Acta Otolaryngol Suppl469:57–69.
Moore BCJ. (2000) Use of a loudness model for hearingaid fitting. IV. Fitting hearing aids with multi-channelcompression so as to restore "normal" loudness forspeech at different levels. Br J Audiol 34:165–177.
Moore BCJ, Alcántara JI, Marriage JE. (2001)Comparison of three procedures for initial fitting ofcompression hearing aids. I. Experienced users, fittedbilaterally. Br J Audiol 35:339–353.
Moore BCJ, Glasberg BR. (1997) A model of loudnessperception applied to cochlear hearing loss. AudNeurosci 3:289–311.
Moore BCJ, Glasberg BR. (1998) Use of a loudnessmodel for hearing aid fitting. I. Linear hearing aids. BrJ Audiol 32:317–335.
Moore BCJ, Glasberg BR, Stone MA. (1999) Use of aloudness model for hearing aid fitting. III. A generalmethod for deriving initial fittings for hearing aidswith multi-channel compression. Br J Audiol33:241–258.
Moore BCJ, Marriage JE, Alcántara JI, Glasberg BR.(2005) Comparison of two adaptive procedures for fit-ting a multi-channel compression hearing aid. Int JAudiol 44:345–357.
Mueller G. (2001) Probe microphone measurements:20 years of progress. Trends Amplif 5:35–68.
Mueller G. (2003) Fitting test protocols are “more hon-ored in the breach than the observance.” Hear J 56:19,20, 22–24, 26.
Norman M, James P. (2000) Insertion gain measure-ments using two low-powered analogue hearing aids.Br J Audiol 34:375–377.
Sanborn PE. (1998) Predicting hearing aid response inreal ears. J Acoust Soc Am 103:3407–3417.
Scollie S, Seewald R, Cornelisse L, et al. (2005) TheDesired Sensation Level multistage input/output algo-rithm. Trends Amplif 9:159–197.
Seewald RC, Moodie SK, Sinclair ST, Scollie SD. (1999)Predictive validity of a procedure for pediatric hearinginstrument fitting. Am J Audiol 8:143–152.
Swan IR, Gatehouse S. (1995) The value of routine in-the-ear measurement of hearing aid gain. Br J Audiol29:271–277.
Upfold G, Byrne D. (1988) Variability of ear canal res-onance and its implications for the design of hearingaids and earplugs. Aust J Audiol 10:97–102.
Upfold G, Byrne D, Sinclair S, Noble W. (1997) Fieldtrial of sleeve earmould fittings. In: National AcousticLaboratories Annual Report 1996/97. Chatswood,NSW, Australia: Australian Hearing.
Weiner FM, Ross DA. (1946) The pressure distributionin the auditory canal in a progressive sound field. JAcoust Soc Am 1:401–408.
Wouters J, Geurts L, Laneau J, Luts H, Maj JB,Moonen M, Royackers L, Spriet A, Van den Bogaert T,van Wieringen A. (2002) Digital hearing aids andfuture directions for hearing aids. ActaOtorhinolaryngol Belg 56:357–361.
JJoouurrnnaall ooff tthhee AAmmeerriiccaann AAccaaddeemmyy ooff AAuuddiioollooggyy/Volume 18, Number 8, 2007
664