Embed Size (px)
Citation preview

The Value of Measurements and Where they Apply
Data Requirements for Evaluation of Population Policy
Liezl Coetzee
Southern Hemisphere Consultants
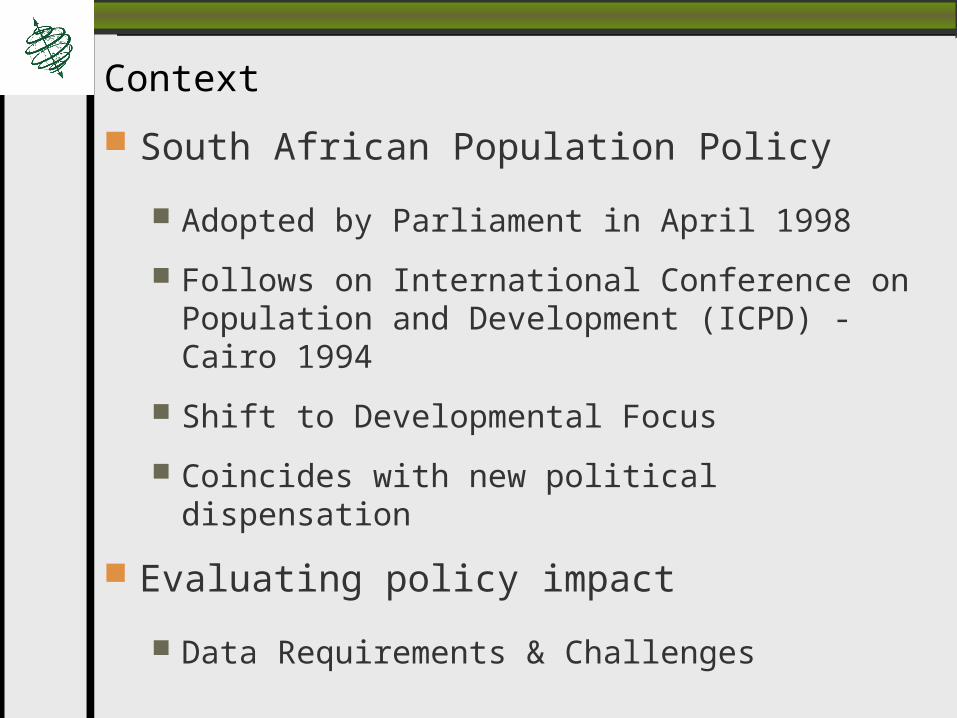
Context
South African Population Policy
Adopted by Parliament in April 1998
Follows on International Conference on Population and Development (ICPD) - Cairo 1994
Shift to Developmental Focus
Coincides with new political dispensation
Evaluating policy impact
Data Requirements & Challenges
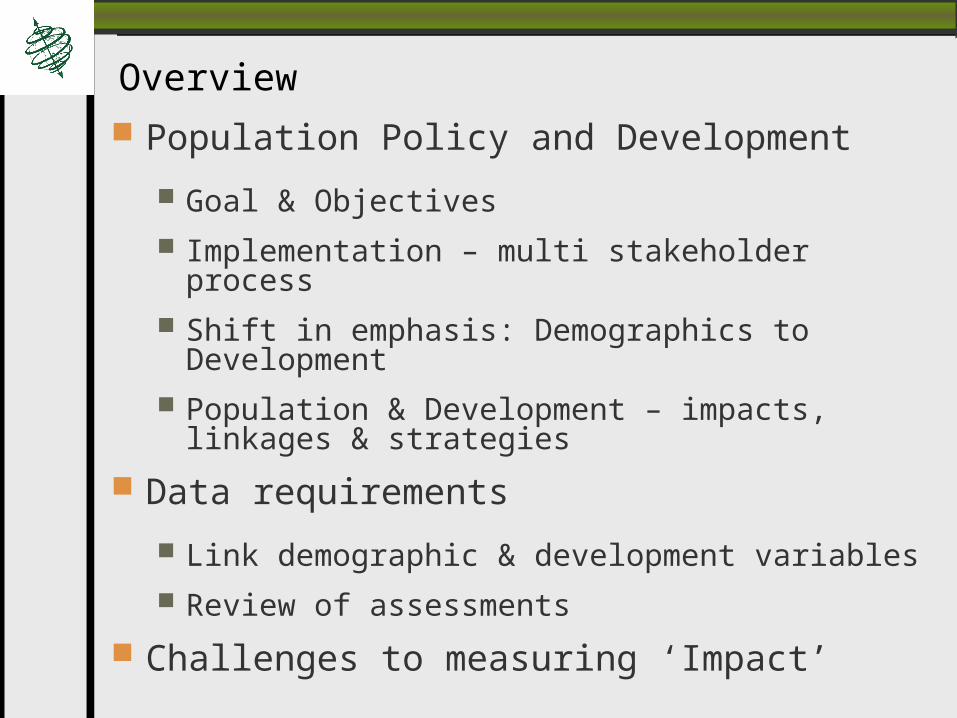
Overview Population Policy and Development
Goal & Objectives Implementation – multi stakeholder process Shift in emphasis: Demographics to
Development Population & Development – impacts,
linkages & strategies
Data requirements
Link demographic & development variables Review of assessments
Challenges to measuring ‘Impact’

Policy goal & Objectives Goal:
“Bring about changes in the determinants of the country’s population trends, so that these trends are consistent with the achievement of sustainable human development.”
Objectives:
1. Ensure systematic integration of population factors into all policies, plans, programs and strategies aimed at enhancing quality of life at all levels and in all sectors;
2. Ensure a coordinated, multi-sectoral, interdisciplinary & integrated approach in design and implementation of programs & interventions that impact on major national population concerns.
3. Ensure availability of reliable, up-to-date information on population and human development situation to inform policy making & program design, implementation, monitoring and evaluation at all levels and in all sectors;
Population Policy Implementation
Implemented by National & Provincial Population Units (Dept. Social Development)
Multi-sectoral & multi disciplinary
Collaboration of all departments + civil society partners
Integrate population issues in policies, programmes & projects
Address population concerns in sustainable development context
Challenges to co-ordinating implementing partners.
Shift in emphasis
Former focus
fertility, mortality, family planning – quantitative demographic targets to measure success
New focus
impacts of demographics on development – qualitative indicators to measure living standards
Implications for monitoring & evaluating impact…
How to measure “development”?
Population Policy Strategies Population and human development:
1. poverty reduction
2. environmental sustainability
3. health, mortality and fertility
4. gender, women, youth and children
5. education
6. employment
7. migration and urbanization.
Policy implementation capacity:
8. co-ordination and capacity building for integrating population and development planning
9. advocacy and population information, education and communication (IEC)
10. data collection and research.
Population Policy & Data
Capacity for implementation weak i.t.o.
Availability of data & information
Institutional & technical capacity.
To build capacity, the policy set an objective
To “Ensure availability of reliable, up-to-date information on the population and human development situation to inform policy making & program design, implementation, monitoring and evaluation at all levels and in all sectors.”
Emphasis on availability of information to inform policy making.
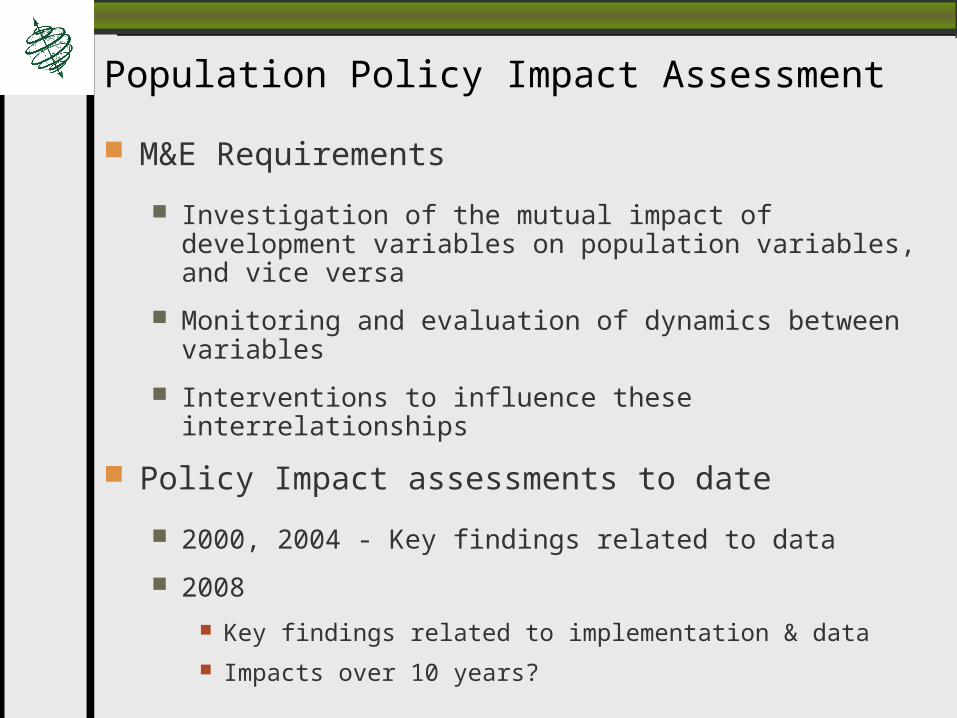
Population Policy Impact Assessment
M&E Requirements
Investigation of the mutual impact of development variables on population variables, and vice versa
Monitoring and evaluation of dynamics between variables
Interventions to influence these interrelationships
Policy Impact assessments to date
2000, 2004 - Key findings related to data
2008
Key findings related to implementation & data Impacts over 10 years?
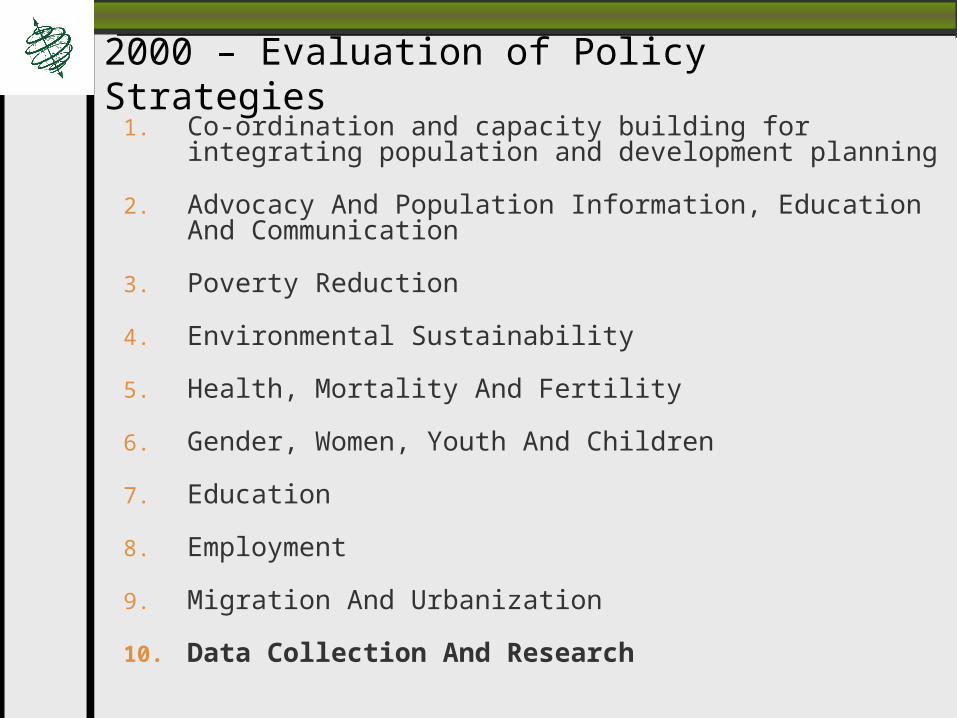
2000 – Evaluation of Policy Strategies1. Co-ordination and capacity building for integrating
population and development planning
2. Advocacy And Population Information, Education And Communication
3. Poverty Reduction
4. Environmental Sustainability
5. Health, Mortality And Fertility
6. Gender, Women, Youth And Children
7. Education
8. Employment
9. Migration And Urbanization
10. Data Collection And Research

2000 – Key Findings: Data Collection And Research Programs do not support the essence of the population
policy strategy on data collection and research:
Lack of commitment, technical capacity and mechanisms to promote an integrated approach for data and information management
Little if any sharing and mutual utilization of data and information. Systems developed in different departments inaccessible for other users outside the department.
Little evidence of ways to ensure that primary data and information are further analyzed and interpreted for use by secondary users
“Silo planning”
Need analyzed and interpreted population information in user-friendly and accessible formats.
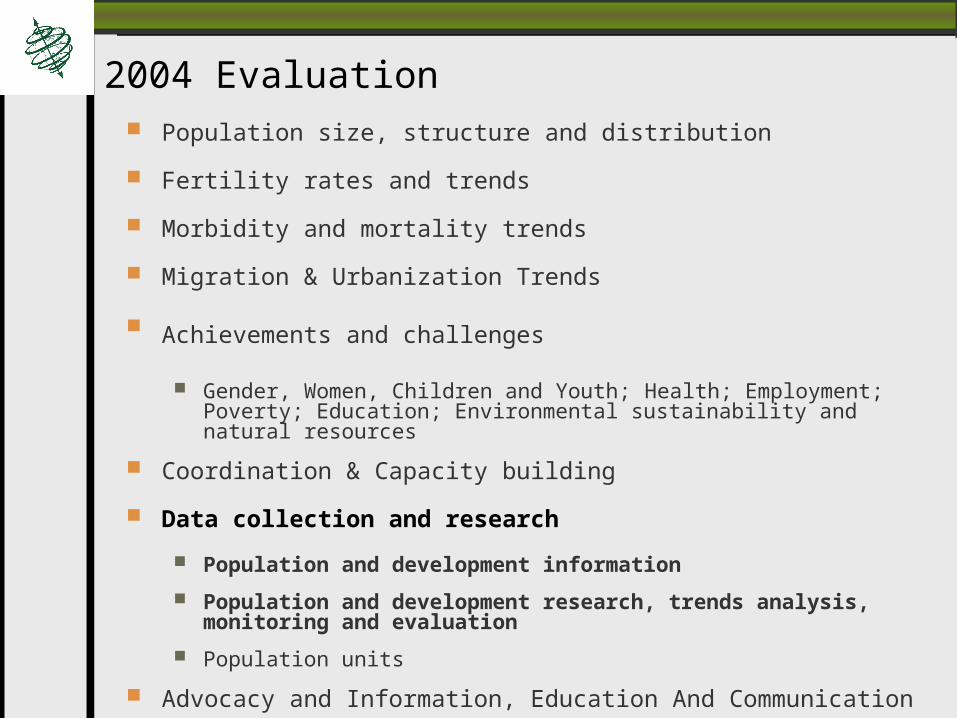
2004 Evaluation Population size, structure and distribution
Fertility rates and trends
Morbidity and mortality trends
Migration & Urbanization Trends
Achievements and challenges Gender, Women, Children and Youth; Health; Employment; Poverty;
Education; Environmental sustainability and natural resources
Coordination & Capacity building
Data collection and research
Population and development information
Population and development research, trends analysis, monitoring and evaluation
Population units
Advocacy and Information, Education And Communication

2004 – Key Findings: Data Data gathering
Population and Development Information Service (Dept Social Development, 1999)
National Statistics System
Information Sharing
Southern Africa Research on Poverty Network (SARPN)
Housing and Urbanisation Information System (HUIS)
Municipal Demarcation Board databases
Education Management Information System, National Centre for Curriculum Research and Development
Research initiatives around population and development issues:
Government Departments
Academic institutions
“Progress has been made with the implementation of the policy, in all sectors.”
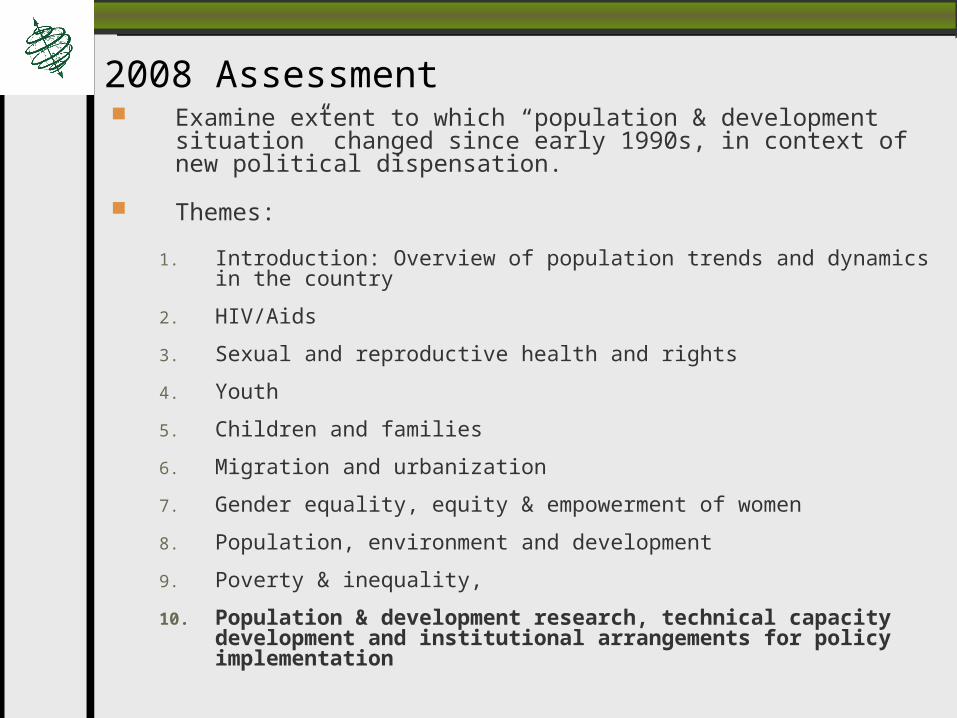
2008 Assessment Examine extent to which “population & development situation”
changed since early 1990s, in context of new political dispensation.
Themes:
1. Introduction: Overview of population trends and dynamics in the country
2. HIV/Aids
3. Sexual and reproductive health and rights
4. Youth
5. Children and families
6. Migration and urbanization
7. Gender equality, equity & empowerment of women
8. Population, environment and development
9. Poverty & inequality,
10. Population & development research, technical capacity development and institutional arrangements for policy implementation

Key findings – Implementation
Indicators :
Output performance indicators & targets for implementation, not suitable for measuring ‘impact’
Institutional system
Numerous initiatives : Research, Advocacy, Capacity Building
Significant activity & output, relevant projects
Appropriate synergies
Points to effective institutional system for policy implementation.
But doesn’t measure… Impact…
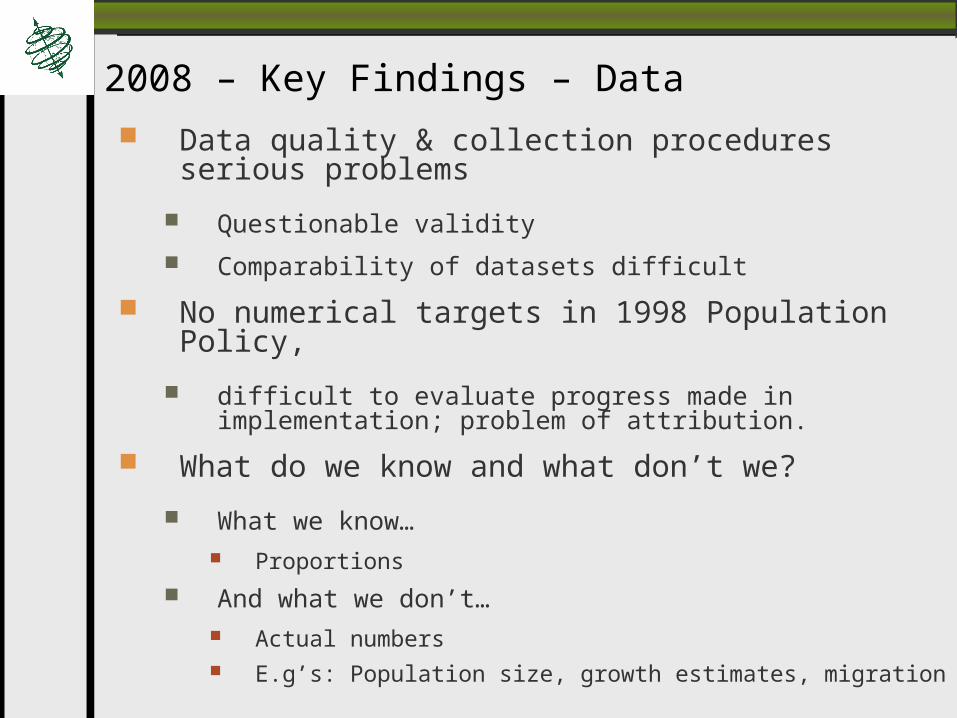
2008 – Key Findings – Data Data quality & collection procedures serious
problems
Questionable validity
Comparability of datasets difficult
No numerical targets in 1998 Population Policy,
difficult to evaluate progress made in implementation; problem of attribution.
What do we know and what don’t we?
What we know… Proportions
And what we don’t… Actual numbers E.g’s: Population size, growth estimates, migration
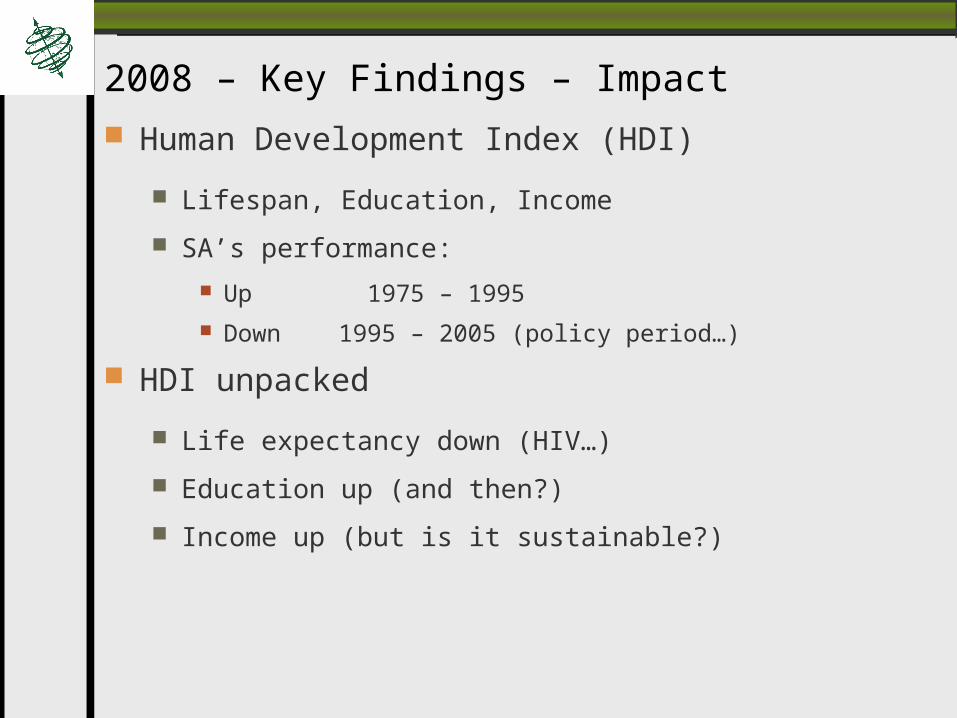
Human Development Index (HDI)
Lifespan, Education, Income
SA’s performance:
Up 1975 – 1995 Down 1995 – 2005 (policy period…)
HDI unpacked
Life expectancy down (HIV…)
Education up (and then?)
Income up (but is it sustainable?)
2008 – Key Findings – Impact
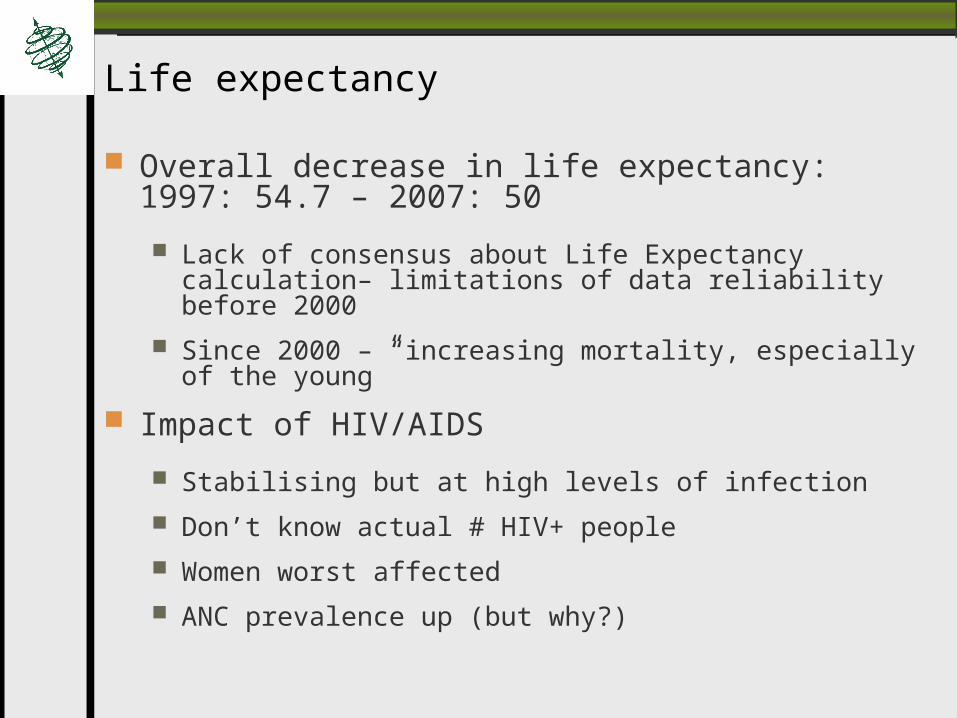
Life expectancy
Overall decrease in life expectancy: 1997: 54.7 – 2007: 50
Lack of consensus about Life Expectancy calculation– limitations of data reliability before 2000
Since 2000 – “increasing mortality, especially of the young”
Impact of HIV/AIDS
Stabilising but at high levels of infection
Don’t know actual # HIV+ people
Women worst affected
ANC prevalence up (but why?)
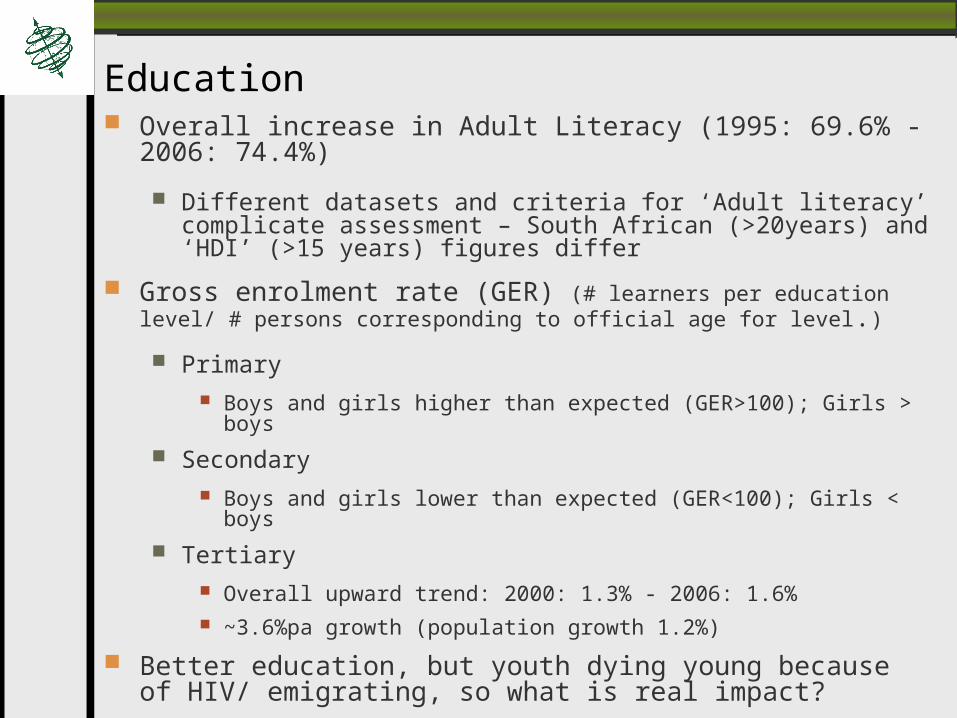
Education Overall increase in Adult Literacy (1995: 69.6% - 2006:
74.4%)
Different datasets and criteria for ‘Adult literacy’ complicate assessment – South African (>20years) and ‘HDI’ (>15 years) figures differ
Gross enrolment rate (GER) (# learners per education level/ # persons corresponding to official age for level.)
Primary Boys and girls higher than expected (GER>100); Girls > boys
Secondary Boys and girls lower than expected (GER<100); Girls < boys
Tertiary Overall upward trend: 2000: 1.3% - 2006: 1.6% ~3.6%pa growth (population growth 1.2%)
Better education, but youth dying young because of HIV/ emigrating, so what is real impact?

Income Equality? Productivity?
(In)equality:
Mean: 1995: R1 101.48 – 2005: R 1514.81. = 37%
Median: 1995: R428.74 – 2005: R483.87. = 12.9%
Mean consistently higher, and increased more than median from 1995-2000 - distribution skewed to right: Few (and fewer) rich and more poor.
Income up, but is productivity?
Social grants recipients up: 1996/7: 2.4m – 2007/8: 12.3m =~25.5% of total population
Employment growth: 2001: 24.9%– 2007: 27.4% (=2.4%pa) (Unemployment down: ‘Official: 29.4% - 23%; ‘Unofficial’: 40% - 34.3%)
Expanded Public Works Programme (EPWP): Temporary job opportunities up: 2004/5: 174 854 – 2007/8: 291 953 (~1mil in total)
Implications for sustainability?
Challenges to measuring Policy Impact’
Heavy reliance on existing information, not always in compatible formats
Monitoring change - Accurate & consistent data collection & analysis NB
Attributing change to policy
Defining ‘success’ – what if…?
Policy Evaluations
Output/ Performance indicators can be used to evaluate implementation
But ‘Impact’… ???