Embed Size (px)
Citation preview
1
This is the post-print version (author’s manuscript as accepted for publishing after peer review but prior to final layout and copyediting) of the article: Lin, Z., Patel, P., & Oghazi, P. (2021). The value of managerial ability and general ability for inventor CEOs. Journal of Business Research, 135, 78-98. https://doi.org/10.1016/j.jbusres.2021.06.014 Readers are kindly asked to use the official publication in references. This version is stored in the Institutional Repository of the Hanken School of Economics, DHanken.
The value of managerial ability and general ability for Inventor CEOs
Zhilu Lin
Assistant Professor of Finance The David D. Reh School of Business
Clarkson University 365 Bertrand H. Snell Hall Potsdam, NY 13676, USA
Tel: (617) 690-9488 Email: [email protected]
ORCID: https://orcid.org/0000-0002-7752-9864
Pankaj Patel Professor of Management
Villanova School of Business Villanova University
800 E. Lancaster Avenue Villanova, PA 19085, USA
Tel: (610) 519-4317 Email: [email protected]
ORCID: https://orcid.org/0000-0003-4934-8166
Pejvak Oghazi* 1Hanken School of Economics
Helsinki, Finland 2Sodertorn University,
School of Social Sciences, 1Email: [email protected]
2Email: [email protected]
2
The value of managerial ability and general ability for inventor CEOs Abstract Although inventor CEOs drive firm innovation, widely recognized CEO abilities—general ability or managerial ability—could be central to leveraging CEOs’ invention abilities to drive firm innovation. Using CEO copatentors’ invention ability (defined as CEO patent coauthors’ average number of forward citations over the average number of patents) as an instrument for inventor CEOs, we study the value of CEOs’ general ability and managerial ability in enhancing the influence of inventor CEOs on firm innovation. Firms led by inventor CEOs with higher general abilities spur greater firm innovation. Surprisingly, however, firms led by inventor CEOs with a higher level of managerial ability realized lower firm innovation. Inventor CEOs with greater general abilities also translate firm innovation into better product-market outcomes and spur more firm innovation under better corporate governance. Our findings have implications for the influence of an inventor CEO on firm innovation outcomes. 1 Introduction
With the combined market capitalization of firms with inventor CEOs at 25% of the total market
capitalization in the U.S., there is a growing interest in understanding the value of inventor CEOs for
driving firm innovation and performance (Bostan and Mian, 2019, Islam and Zein, 2020). However, the
appointment of an inventor as CEO could be a double-edged sword—it could facilitate either panoptic
(divergent) or telescopic (narrow) views of managing a firm. Although research on inventor CEOs has
explored their direct association with innovation outcomes, the abilities accumulated over the course of an
executive’s career could facilitate or impede CEOs’ innovative abilities. On the one hand, related to the
benefits of the panoptic view, an inventor CEO with a better understanding of the challenges of
innovation can better align internal knowledge systems and processes. With a better knowledge of the
risky and resource-consuming innovation process, inventor CEOs are more likely to take a long-term
perspective on firm strategy and to initiate improvement in strategic alignment between innovation
priorities and functional areas. With mixed evidence on extrinsic pay-for-performance explanations of
innovation performance (Ederer and Manso, 2013), inventor CEOs are more likely to be intrinsically
motivated to innovate (Amabile, 1988) and are central to driving an innovation culture (Berson, Oreg and
Dvir, 2008, Jung, Chow and Wu, 2003). On the other hand, related to the narrow telescopic view, because
inventors have a restricted technological background, inventor CEOs may not venture outside their
technological focus, and more importantly, their invention skills may not necessarily translate into better
business skills. Their focus on innovation could come at the expense of other functional areas, and their
tunnel vision on innovation could also lead to failures and excessive resource outlays (Bostan and Mian,
2019).
To complement innovation ability, the type of executive career experience could help explain
why some inventor CEOs are more successful than others. Given that “CEOs have heterogeneous talents
and abilities that map into firm performance” (Kaplan, Klebanov and Sorensen, 2012, page 973), general
ability and managerial ability have been among the most widely received measures of executive ability in
3
recent years. Custódio, Ferreira and Matos (2013) measure the general ability index based on the number
of past (i) positions, (ii) firms, and (iii) industries in which s/he worked, (iv) whether s/he held a CEO
position at a different company, and (v) whether s/he worked for a conglomerate firm. Demerjian, Lev,
Lewis, and McVay (2012b) proposed the measure of managerial ability as “managers’ efficiency, relative
to their industry peers, in transforming corporate resources to revenues [based on] multitude of revenue-
generating resources: cost of inventory, general and administrative expenses, fixed assets, operating
leases, past research and development (R&D) expenditures, and intangible assets” (in page 1229). Note
that managerial ability is a firm-level measure, whereas general ability is a CEO career-level measure. We
also conduct a statistical exercise and confirm that they are indeed distinct measures that reflect different
dimensions of executive ability.
Related to the panoptic perspective, inventor CEOs with higher general abilities could draw on
their variegated past experiences to develop diverse and rich knowledge combinations. General ability
helps overcome the perception of the narrow role of innovation and helps leverage diverse experiences in
industries and firms to devise a robust and inclusive innovation strategy. Inventor CEOs with greater
general abilities may be more effective in searching, identifying, transferring, and implementing
knowledge at multiple levels in the firm.
Related to the telescopic perspective, managerial ability focused on efficiency in generating
revenues (Demerjian, Lev, and McVay, 2012a) could also complement the narrower view of inventor
CEOs. Inventor CEOs with a higher level of managerial abilities could leverage their telescopic view of
the invention process by applying their in-depth knowledge of input-output conversion routines. As such,
we hypothesize that for the inventor CEO, either managerial or general ability could help improve
inventor performance.
Our study differs from two recent studies on this issue (Bostan and Mian, 2019, Islam and Zein,
2020) in that we attempt to further explore the role of CEO human capital in explaining the success of
inventor CEOs. In line with Bostan and Mian (2019), we draw on a sample of all S&P 1500 firms
(compared to only technology firms used in Islam and Zein, 2020). We extend existing studies on
inventor CEOs by taking a complementary view of the two additional measures of CEO ability. While
prior work tends to focus on either the framework of general ability (Custódio et al., 2013) or that of
managerial ability (Demerjian et al., 2012b), we take a more comprehensive perspective by drawing
connections between these two frameworks at the same time.
To address endogeneity concerns of inventor CEOs, we use CEO copatentors’ ability, which is
defined as CEO coauthors’ average number of forward citations over the average number of patents, as an
instrument to identify the effect of inventor CEOs. In our sample of 18,229 firm-year observations (2,134
unique firms and 340 inventor CEOs among 3,952 unique CEOs) from 1992 to 2008, firms led by
4
inventor CEOs with greater general abilities spur greater firm innovation. However, firms led by inventor
CEOs with a higher managerial ability realized lower firm innovation. Inventor CEOs with greater
general abilities also translate firm innovation into better product-market outcomes. We also find that
firms with inventor CEOs experience less idiosyncratic volatility and that firms led by inventor CEOs
with higher managerial ability experience more idiosyncratic volatility only when the firm develops fewer
new products. Inventor CEOs with a higher level of general ability spur more firm innovation under better
corporate governance, but we do not find that managerial ability helps inventor CEOs improve innovation
outcomes under better corporate governance. Furthermore, our empirical analyses reveal that the
relationships among inventor CEOs, general/managerial ability, and firm innovation is contingent upon
CEO executive overconfidence or CEO pay-performance sensitivity but does not depend on risk-taking
incentives. Inventor CEOs improve innovation in both more and less innovative industries. Our results are
robust to different firm performance measures, CEO tenure, and alternative measures of an inventor CEO.
Our findings support the benefit that general abilities of inventor CEOs provide for firms,
indicating the value of a panoramic view of CEO experience. In other words, inventor CEOs with a
higher general ability realize better innovation performance. The findings do not support the telescopic
view under the managerial ability framework. That is, inventor CEOs with greater managerial abilities do
not improve innovation performance. Collectively, the findings of this study contribute to the CEO human
capital literature by considering an important CEO human capital attribute (i.e., ability to invent) and the
two broadly received CEO ability characteristics (i.e., general ability and managerial ability). We provide
evidence that inventor CEOs with a higher managerial ability may not realize innovation success and that
the presence of inventor CEOs may not unambiguously lead to higher performance. Taken together, our
findings stress the role of general ability as an important consideration for firms in hiring inventor CEOs.
This paper contributes to the literature in mainly three ways. First, this paper complements a growing
body of literature that explores the impact of CEOs on corporate performance. For example, Chen, Zhou,
and Zhu (2019) study the relationship between CEO tenure and corporate social responsibility
performance. Similarly, McClelland, Barker III and Oh (2012) examine the influence of CEO career
horizon and tenure on firm future performance. We add to the literature by showing how CEOs’
innovation ability, general ability, and managerial ability impact corporate innovation. Second, this paper
contributes to the literature that explores the effects of CEO characteristics on corporate innovation.
Sariol and Abebe (2017) study the influence of CEO power on firm explorative and exploitative
innovation. Tabesh, Vera and Keller (2019) investigate how CEO tenure, background breadth and
technical education impact unabsorbed slack resources, which in turn impact firm innovation. Chen,
Sharma, Zhan and Liu (2019) investigate the impact of CEO transformational leadership on firm
innovation performance. Third, this paper also complements the literature that studies the impact of
5
CEOs’ managerial ability and general ability on corporate investment decisions. For example, Andreou,
Karasamani, Louca and Ehrlich (2017) examine the impact of managerial ability on corporate investment
during a crisis period. We add to this literature by showing that the general abilities of inventor CEOs are
a significant driver of corporate innovation.
2 Background
CEOs’ human capital is central to organizational performance (Chiu, Johnson, Hoskisson and Pathak,
2016, Reid, Anglin, Baur, Short and Buckley, 2018, Chen, Tang, Jin, Xie and Li, 2014, Caridi‐Zahavi,
Carmeli and Arazy, 2016). In the past decade, two prominent types of CEO human capital have garnered
increasing interest—general ability and managerial ability. Blending recent interest in inventor CEOs
with these two ability types, we draw on Becker’s (1962) framework of managerial capital to assess the
type of ability that helps the inventor CEO increase innovation. Managerial capital provides a competitive
edge to firms and is typically embedded in the practices of managers (Garretsen, Stoker and Weber,
2020).
2.1 Inventor CEO and General Ability
The generalist vs. specialist dilemma has been widely discussed in the broader organizational literature
and more recently in the context of CEOs’ human capital (e.g., Datta and Iskandar-Datta, 2014). In one of
the first studies on generalist CEOs, Custódio et al. (2013) find that generalist CEOs, compared to
specialist CEOs, are paid an annual pay premium of 19%.1 Moreover, the pay premium is higher when
CEOs are hired to perform complex tasks such as restructuring and acquisitions. In a related study on
CFOs, Datta and Iskandar-Datta (2014) find that generalist CFOs consistently command a compensation
premium, while specialist CFOs do not. Firms with generalist CEOs have a higher cost of capital but also
higher expected returns than firms with specialist CEOs (Mishra, 2014). Generalist-outsider CEOs receive
the highest total compensation, followed by generalist–insiders, specialist–outsiders, and specialist–
insiders; however, the generalist-specialist effect remains constant over time, while the insider-outsider
effect diminishes over time (Brockman, Lee and Salas, 2016). Chen, Liu and Song (2018) find that firms
with generalist CEOs have a lower level of corporate social responsibility. This negative effect is stronger
in tighter labor markets and in firms where shareholders are short-term oriented. Xu, Fund, Xu, Li and
Chan (2018) find that generalist CEOs execute more M&As than specialist CEOs because generalist
CEOs are more willing to take on risk and execute cross-industry and cross-location M&As. Firms led by
CEOs with higher general ability have higher post-M&A returns. In a study of 722 IPO firms from 1999
1 Custodio et al. (2013) define CEO general managerial skills from five aspects of a CEO’s professional career: past number of (1) positions, (2) firms, and (3) industries in which a CEO worked; (4) whether the CEO held a CEO position at a different company; and (5) whether the CEO worked for a conglomerate.
6
to 2009, Gounopoulos and Pham (2018) find that IPO firms with generalist CEOs have a higher
probability of failure and a shorter time of survival.
Conversely, building from Custódio, Ferreira and Matos (2017), it is also possible that specialist
CEOs with invention experience would self-select into industries representing their respective fields of
expertise and may be better able to manage their firm’s innovation portfolio. Li and Patel (2019) study a
sample of 16,158 CEO firm-year observations from 2,243 firms and find that firms with generalist CEOs
have lower Tobin’s Q, ROA, ROE, and total shareholder returns. It is plausible that generalist CEOs may
also face blind spots in leveraging diverse external experiences into firm-specific resources and
knowledge bases. Because invention requires highly specialized expertise and extensive experience in the
subject domain, this would imply that specialist CEOs with invention experience may be more adept at
improving innovation outcomes. Generalist CEOs have less knowledge of innovation, and their focus on
growth as a short-term goal could be detrimental to innovation efforts that may require a long-term focus.
A specialist inventor CEO may be more likely to leverage prior invention experiences in fewer firms and
industries, thus resulting in more focused innovation efforts.
Building upon Custódio et al. (2017), we expect that inventor CEOs with general abilities will be
able to improve innovation performance. CEOs with greater general ability bring new knowledge from
their variegated experience to further apply their invention ability toward innovation efforts (Custódio et
al., 2017). Leveraging their diverse professional experience, generalist CEOs who are also inventors
would perceive less risk in pursuing innovative projects and would be more adept at translating and
managing uncertainties related to developing viable products and services. Relatively, inventor CEOs
with lower general abilities are more likely to be specialized and would create a smaller locus of
innovation possibilities with strategic needs; furthermore, their specialized experience would further limit
their ability to manage emerging uncertainties in the innovation process. Due to greater labor market
options for generalist CEOs, such CEOs may also be willing to take a greater innovation-related risk and
thereby are less averse to undertaking innovation projects (Kraiczy, Hack, and Kellermanns, 2015).
Inventor CEOs who have wider industry and firm experience can better leverage their business
knowledge to manage the combined uncertainty of innovation and business-specific knowledge (Fleming,
2001). The accumulated human capital from working in different industries and firms provides the
necessary repository of knowledge and experiences that provide the bulwark for innovation-related
changes. Facing the changing external environment and strategy-making context, generalist CEOs can
leverage both their broader experience and invention ability to improve strategic information processing,
enhance internal and external sense-making, and revise strategic implementation to meld strategic and
technical domains. With diffusing firm boundaries, increasing the intensity of collaboration across
boundaries, and flattening organizational structures, an inventor CEO with generalist abilities would be
7
more adept at enhancing innovation performance by improving information flow, storage, and processing
across functional boundaries, thus leading to improved innovation combinations.
On average, we expect that inventor CEOs better leverage generalist skills to improve innovation
performance.
Hypothesis 1. There is a positive association between inventor CEOs with greater general ability
and innovation performance.
2.2 Managerial ability, inventor CEO and performance
Managerial ability, or the efficiency in generating revenue, represents a multifaceted ability to understand
technology and industry trends, manage inventory and demand, create value-creating strategic outlays,
and effectively manage costs (Demerjian et al., 2012a, Demerjian et al., 2012b). Although related to
specialist CEOs, managerial ability is distinct because it focuses on the ability to convert resources
effectively in the current organization.
However, the evidence on the efficacy of managerial ability in improving performance remains
mixed. In the first study on this topic, Demerjian et al. (2012a) find that greater managerial ability is
positively associated with firm performance. In other studies, higher managerial ability is associated with
more precise earnings forecasts (Baik, Farber and Lee, 2011), lower tax avoidance (Francis, Sun and Wu,
2013), lower audit fees (Krishnan and Wang, 2014), and better credit ratings (Cornaggia, Krishnan and
Wang, 2017). However, greater managerial abilities are also associated with earnings smoothing
(Demerjian, Lewis-Western and McVay, 2017). Cheung, Naidu, Navissi and Ranjeeni (2017) find that
higher managerial discretion and closer monitoring may be necessary to improve performance among
CEOs with higher managerial ability.
On the one hand, an inventor CEO with higher managerial ability may be better able to improve
knowledge conversion in the firm and thereby increase innovation. Multidimensional and multifaceted
knowledge about the firm could be the centripetal forces that help an inventor CEO achieve better
innovation performance. Innovation is inherently risky, prone to failure, and resource-consuming. An
inventor CEO with high managerial ability is particularly central to maintaining an efficient innovation
focus that is timely and relevant and that would not engage in under- or overinvestment in resources. For
example, using the 2008 financial crisis as the research context, Andreou, Karasamani, Louca, and
Ehrlich (2017) find that CEOs with higher managerial ability invest more during crisis periods to mitigate
the underinvestment problem, leading to an increase in firm value. Yung and Chen (2018) find that CEOs
with higher managerial ability are receptive to risk-taking, cut capital expenditure, and spend more on
R&D projects, while CEOs with lower managerial ability may refrain from risk-taking and reduce both
capital expenditures and R&D expenses. They also find that firms led by CEOs with higher managerial
ability are more focused, less leveraged, and valued higher than those led by CEOs with lower managerial
8
ability. In a similar vein, inventor CEOs with greater managerial ability may be more adept at taking risks
necessary to realize innovation outcomes. Bonsall, Holzman, and Miller (2016) find that higher
managerial ability is associated with lower variability in future earnings and stock returns and higher
credit ratings. Relatedly, inventor CEOs with higher managerial ability would also be able to manage risk
associated with innovation more appropriately. CEOs whose managerial abilities are higher are also better
able to engender stakeholder trust, which lowers the cost of capital, and are better positioned to allocate
and position innovation-related resources (Chen, Podolski, and Veeraraghavan, 2015).
On the other hand, inventor CEOs with a higher managerial ability may be more efficient at
converting resources. Intuitively, a long-term (and uncertain) process could impact conversion efficiency
and thereby lead to undesired innovation outcomes. Furthermore, managerial ability may indirectly lead
an executive to follow steady and well-established conversion routines, whereas innovation is inherently
rooted in developing novel and alternative routines, thus limiting the efficacy of managerial ability for an
inventor CEO in improving innovation outcomes. Koester, Shevlin, and Wangerin (2016) find that firms
led by CEOs with higher managerial ability are associated with greater tax avoidance. Jiraporn, Leelalai,
and Tong (2016) find that firms led by CEOs with higher managerial ability are more likely to pay
dividends and, among firms that pay dividends, pay significantly larger dividends. These efficiency gains,
which require less engagement in innovation activity (so that firms can pay larger dividends), could limit
an inventor CEO’s ability to improve innovation outcomes.
Therefore, it is an empirical question of whether inventor CEOs are better able to leverage higher
or lower managerial ability. We propose:
Hypothesis 2. There is a negative association between inventor CEOs with higher managerial
ability and innovation performance.
3 Data and Measures
3.1 Sample Construction
Our data is obtained from multiple sources. Data for CEO characteristics are obtained from ExecuComp,
which covers S&P 1500 firms starting from 1992. ExecuComp provides information on the
characteristics (e.g., names, titles, age, among others) and compensation (e.g., base salary, bonus,
incentives, among others) of the top five highest-paid executives. Data for firm financial information are
obtained from Compustat. We obtain firm patent information from the database collected by Kogan,
Papanikolaou, Seru and Stoffman (2017), who provide firm-level innovation data (i.e., patent assignee,
citation received by each patent, and patent application date) from 1975 to 2010. In merging the three
datasets, because the average time lag between a patent’s application date and grant date is approximately
two years according to Hall, Jaffe and Trajtenberg (2001), we consider 2008 to be the last year in our
sample to accommodate the last year (2010), as in (Kogan et al., 2017). Consistent with other studies on
9
inventor CEOs, our sample is from 1992-2008. Ending the sample in 2008 also avoids the potentially
confounding effects of the Great Recession (2009-2010).
Furthermore, we follow the common practice in the literature (Custódio et al., 2017) by excluding
firms in the financial (SIC codes 6000-6799) and regulated utility (SIC codes 4000-4999) sectors. Based
on recent research on firm innovation (Sunder, Sunder, and Zhang, 2017), we exclude industries where
the average number of patents per firm is less than one. This restriction allows us to exclude industries
where innovation is not very important but at the same time to include firms with no patents. Our final
sample includes 18,229 firm-year observations (2,134 unique firms and 3,952 unique CEOs) from 1992 to
2008.
3.2 Identifying Inventor CEOs
Information on patent inventors is obtained from the Harvard Business School (HBS) patenting database
(Li, Lai, D’Amour, Doolin, Sun, Torvik, Amy and Fleming, 2014), which provides detailed information
regarding patent inventors, including their first names, middle names, last names, residence addresses,
and patent assignee names from 1975 to 2010.2 A CEO who is also a patent inventor is defined as an
inventor CEO. However, the identification of the inventor CEO is not a trivial task because there is no
common identifier across the datasets we use. Consistent with (Islam and Zein, 2020), we manually
identify inventor CEOs in two steps. First, we obtain all the CEOs’ names from ExecuComp. Second, we
merge CEOs’ names with patent inventors’ names by their first, middle, and last names. We hand-collect
CEOs’ biographical information to ensure that the CEO is the patent inventor.3 In our sample, we have
340 CEOs who are also patent inventors and 3,612 CEOs who have no patents assigned under their
names. An inventor CEO is operationalized as a dummy variable equal to one if the CEO has at least one
patent from 1975 to 2010.4
3.3 Measuring CEO General Ability
We follow Custódio et al. (2013) to construct the CEO general ability index (GAI), which captures a
CEO’s general ability based on their past working experience in publicly traded firms. A CEO’s GAI is
defined as:
𝐺𝐺𝐺𝐺𝐺𝐺𝑖𝑖,𝑡𝑡 = 0.268𝑋𝑋1𝑖𝑖,𝑡𝑡 + 0.312𝑋𝑋2𝑖𝑖,𝑡𝑡 + 0.309𝑋𝑋3𝑖𝑖,𝑡𝑡 + 0.218𝑋𝑋4𝑖𝑖,𝑡𝑡 + 0.153𝑋𝑋5𝑖𝑖,𝑡𝑡, (1)
where X1 is the number of different positions the CEO held before year t, X2 is the number of different
companies the CEO worked before year t, X3 is the number of different industries (at the four-digit SIC
code level) the CEO worked at before year t, X4 is a dummy variable equal to one if the CEO worked at
2 The unique identifier for each patent inventors in the HBS patenting database is Invnum_N. 3 The websites we used to collect CEOs’ biographical information are the company website, Bloomberg CEO Biography, Wikipedia, Notable Names Data Base, LinkedIn, news information, and Forbes website. 4 Although our sample period is from 1992 to 2008, the HBS patenting database has inventor information from 1975 to 2010. For example, if a CEO had a patent in 1980, the CEO is defined as an inventor CEO in our sample.
10
another firm as a CEO before the current CEO position in year t and zero otherwise, and X5 is a dummy
variable equal to one if the CEO worked for a multidivisional firm before year t and zero otherwise.5 A
CEO has a higher general ability if the GAI is greater.
3.4 Measuring Managerial Ability
We follow Demerjian et al. (2012a) to measure managerial ability. They use the Tobit model and regress
total firm efficiency on six firm-specific characteristics, including firm size, firm market share, cash
availability, life cycle, operation complexity, and foreign operations, controlling for year fixed effects by
industry. The residuals from the regression represent managerial ability. A CEO has a higher managerial
ability if his/her corresponding residual is higher. We use the decile to rank managerial ability (by
industry and year) in the regression analysis.
3.5 Measuring Firm Innovation
We measure firm innovation productivity using two indicators. The first measure (Firm patent) is the
logarithm of one plus the simple count of the number of patents a firm applied in a given year. The
second measure is the citations received by the patent that the firm applied for in a given year.
Specifically, we follow Kogan et al. (2017) to construct the second measure (Citation-weighted firm
innovation). This measure can also adjust for citation truncation lags (Hall et al., 2001). We first construct
the sum of the weight of citations on each patent (𝜔𝜔𝑖𝑖,𝑡𝑡),
𝜔𝜔𝑖𝑖,𝑡𝑡 = � �1 +𝐶𝐶𝑗𝑗𝐶𝐶𝚥𝚥�� ,
𝑗𝑗∈𝑃𝑃𝑖𝑖,𝑡𝑡
(2)
where 𝐶𝐶𝑗𝑗 is the number of citations received by patent j, 𝐶𝐶𝚥𝚥� is the average number of citations received by
patents that were applied in the same year as patent j, 𝑃𝑃𝑖𝑖,𝑡𝑡 is all the patents that firm i applied in year t, and
𝜔𝜔𝑖𝑖,𝑡𝑡 is one plus the sum of the weighted citation on each patent in year t for firm i. Since 𝜔𝜔𝑖𝑖,𝑡𝑡 is increasing
in firm size, we follow Kogan et al. (2017) and scale 𝜔𝜔𝑖𝑖,𝑡𝑡 by book assets,
𝑊𝑊𝑖𝑖,𝑡𝑡𝑐𝑐𝑐𝑐 =
𝜔𝜔𝑖𝑖,𝑡𝑡
𝐵𝐵𝑖𝑖,𝑡𝑡 , (3)
where 𝐵𝐵𝑖𝑖,𝑡𝑡 is firm i’s book assets in year t, and 𝑊𝑊𝑖𝑖,𝑡𝑡𝑐𝑐𝑐𝑐 is the citation-weighted firm innovation for firm i in
year t.
3.6 Control Variables
We follow prior literature to control for time-varying firm characteristics and CEO characteristics that
may impact firm innovation. Controls related to firm characteristics variables include Tobin’s Q, defined
as the ratio of the market value of assets to the book value of assets. Tobin’s Q controls for future growth
prospects of the firm, which may conflate with the inventor CEO’s initiatives. Firm size is defined as the
5 If a company has more than one business segment, the company is defined as a multidivisional firm.
11
natural logarithm of total assets. Larger firms have added legitimacy in capital markets and are more
likely to leverage stakeholders to drive firm performance. The next three control variables are associated
with a relative focus on innovation (R&D intensity) or operations (capital intensity) or limitations on
risky expenditures (debt ratio). Capital intensity is defined as the logarithm of the ratio of net property,
plant, and equipment to the number of employees, leverage is defined as the ratio of debt to total assets,
and research and development (R&D) spending is defined as the ratio of R&D expenses to lagged total
assets.
The characteristics of the CEO can also influence the outcome variable. CEO tenure can be
associated with firm-specific knowledge of the firm and increased power in the top management team.
Older CEOs are also less likely to take risks. Controls related to CEO characteristics include CEO tenure,
defined as the number of months the CEO is in the CEO position, and CEO age (in years). We also
control for CEO pay-performance sensitivity and CEO risk-taking incentives, which are measured by the
delta and vega of the CEO’s stock and options portfolio. The data for delta and vega were obtained from
Coles, Daniel, and Naveen (2006).6 The delta is defined as the dollar change in CEO stock and options
portfolio for a 1% change in stock price. Vega is defined as the dollar change in CEO option holdings for
a 1% change in stock return volatility. We also control for industry fixed effects and year fixed effects or
firm fixed effects and year fixed effects. All the control variables are lagged by one year.
3.7 Descriptive statistics
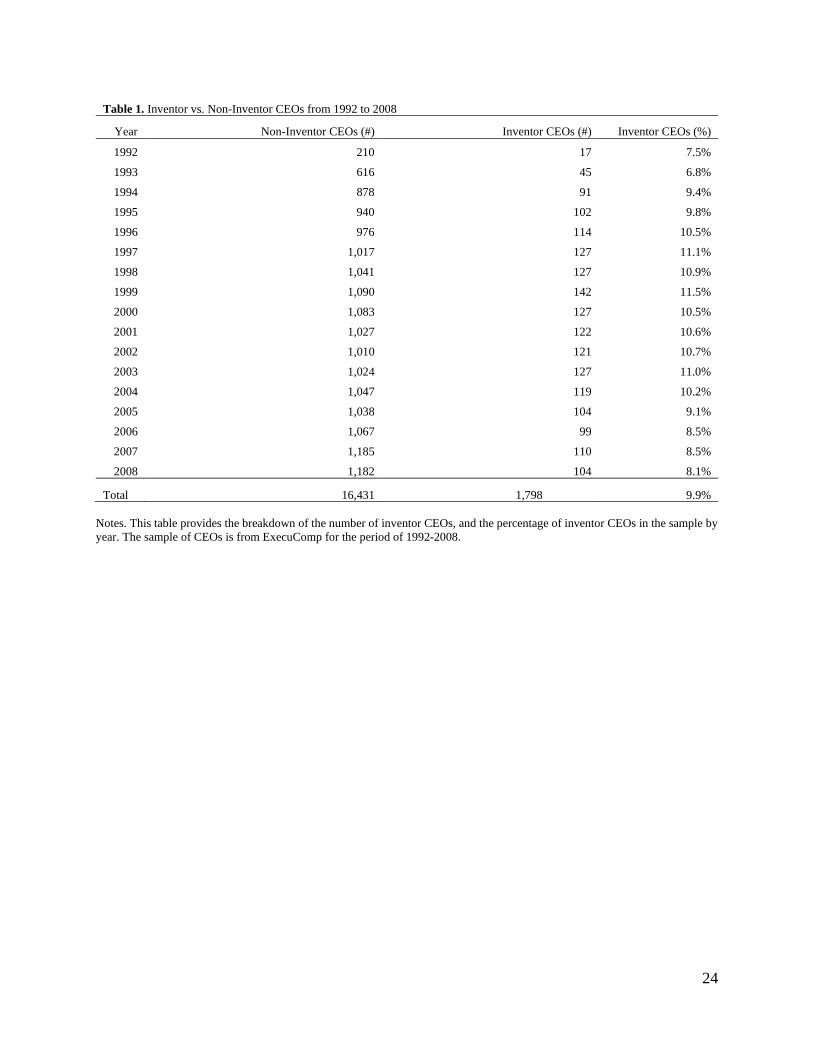
Table 1 presents the distribution of inventor CEOs by year. On average, 9.9% of CEOs are inventor
CEOs. The range of the percentage of inventor CEOs is from 6.8% in 1993 to 11.5% in 1999, indicating
that the presence of the inventor was the highest during the tech bubble of the late 1990s.
[Insert Table 1 here]
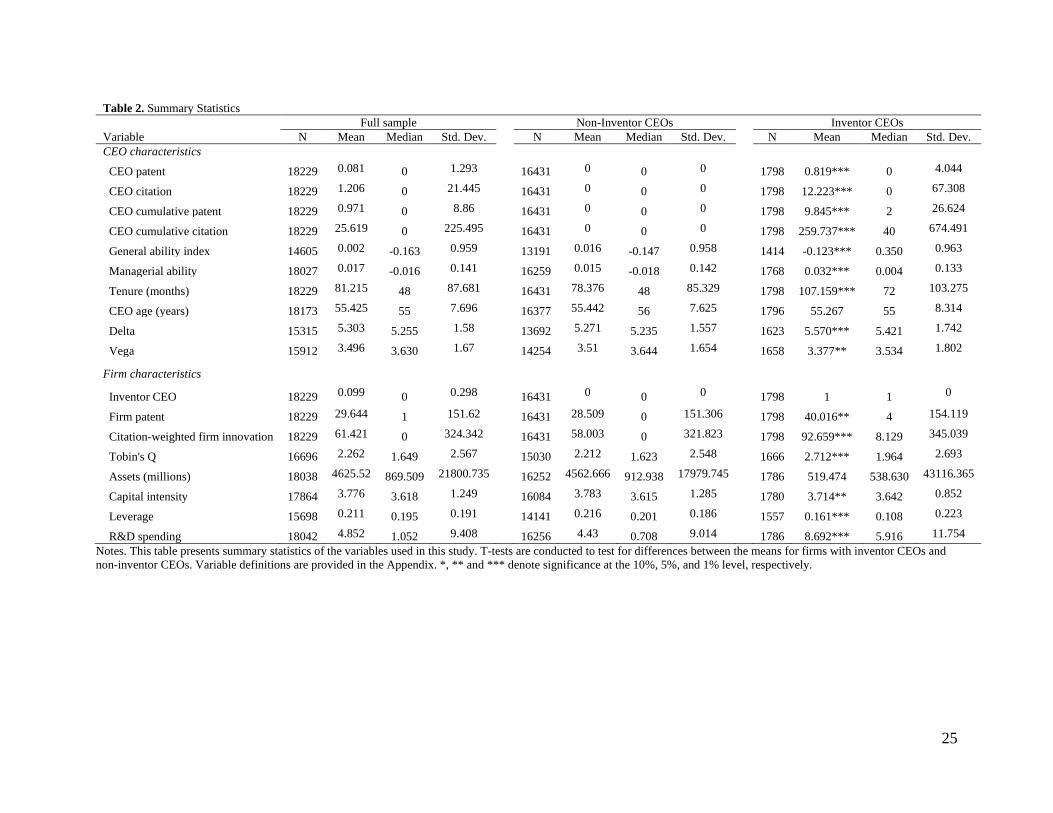
Table 2 presents summary statistics for CEO characteristics and firm characteristics. On average,
a firm files 30 patents per year, which is similar to the 31 patents per year in the sample of Custodio,
Ferreira, and Matos (2017). Inventor CEOs have an average of 0.8 patents in a given year (CEO patent)
and 12.23 citations in a given year (CEO citation) on the patent. We also find that, on average, inventor
CEOs have 9.8 patents up to a given year (CEO cumulative patent) and 259.7 citations on the patents up
to a given year (CEO cumulative citation).
In Table 2, we also divide the sample into two subsamples: inventor CEOs and noninventor
CEOs. We conduct a t-test to examine the difference between the means for firms with inventor CEOs
and firms without. Comparing firms with inventor CEOs and firms with noninventor CEOs, we find that
firms with inventor CEOs have significantly more patents, a higher count of citation-weighted patents,
6 The calculation method of delta and vega is documented in Core and Guay (2002).
12
higher Tobin’s Q, and spend more on R&D projects. Firms with inventor CEOs have lower capital
intensity and leverage than firms with noninventor CEOs. Regarding CEO characteristics, we find that
inventor CEOs have significantly lower general ability and vega but higher managerial ability, longer
tenure, and higher delta than noninventor CEOs. However, there is no significant difference in firm size
and CEO age between firms with inventor CEOs and firms with noninventor CEOs.
[Insert Table 2 here]
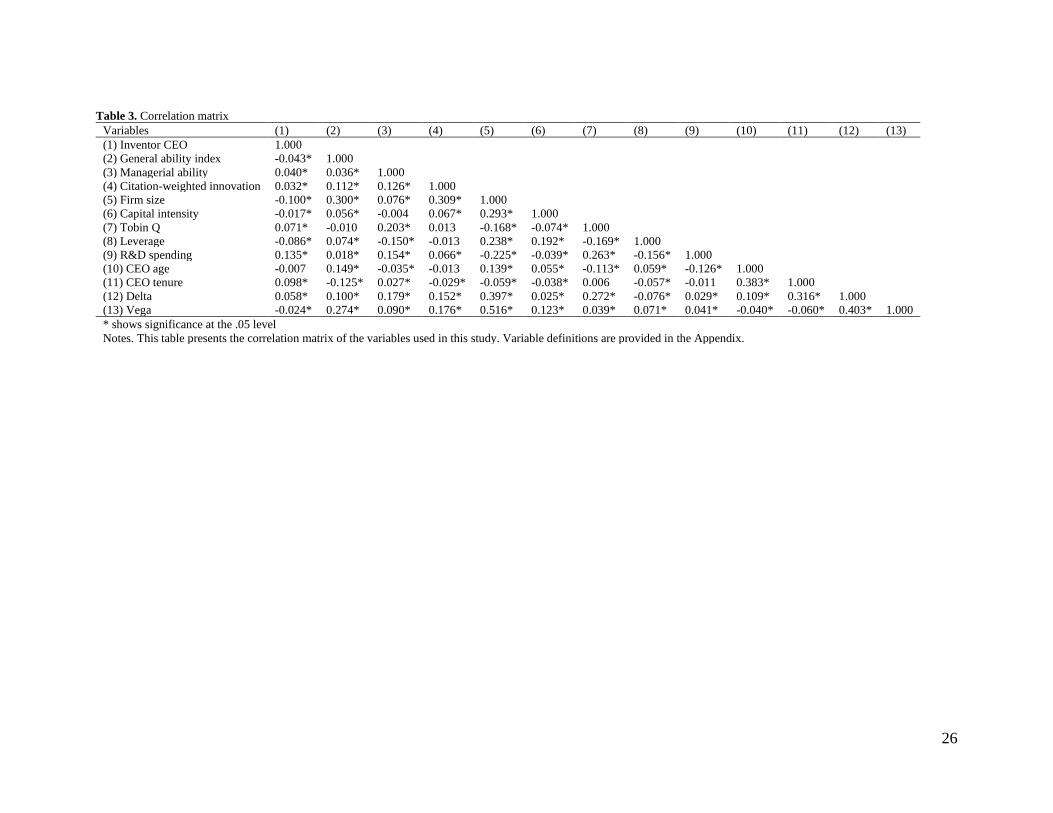
Table 3 provides the correlation matrix for dependent variables and independent variables in the
regression. We find that no correlation between the two variables is more than 0.5. We also compute the
variance inflation factors (VIFs) and find no signs of multicollinearity since none of the VIFs exceeds
2.03 (Mansfield and Helms, 1982).
[Insert Table 3 here]
3.8 Is general ability distinct from managerial ability?
We test the strength of the association between general and managerial ability to assess the degree of
multicollinearity and potential overlap between the two measures. In Figure 1, we plot the scatter between
general ability and managerial ability. The line of fit is almost flat. Furthermore, the partial correlation
between general ability and managerial ability, controlling for the covariates in the main specification, is
0.0096 (p-value = 0.3243).
[Insert Figure 1 here]
4 Main Results
4.1 Endogeneity, Inventor CEOs and Firm Innovation
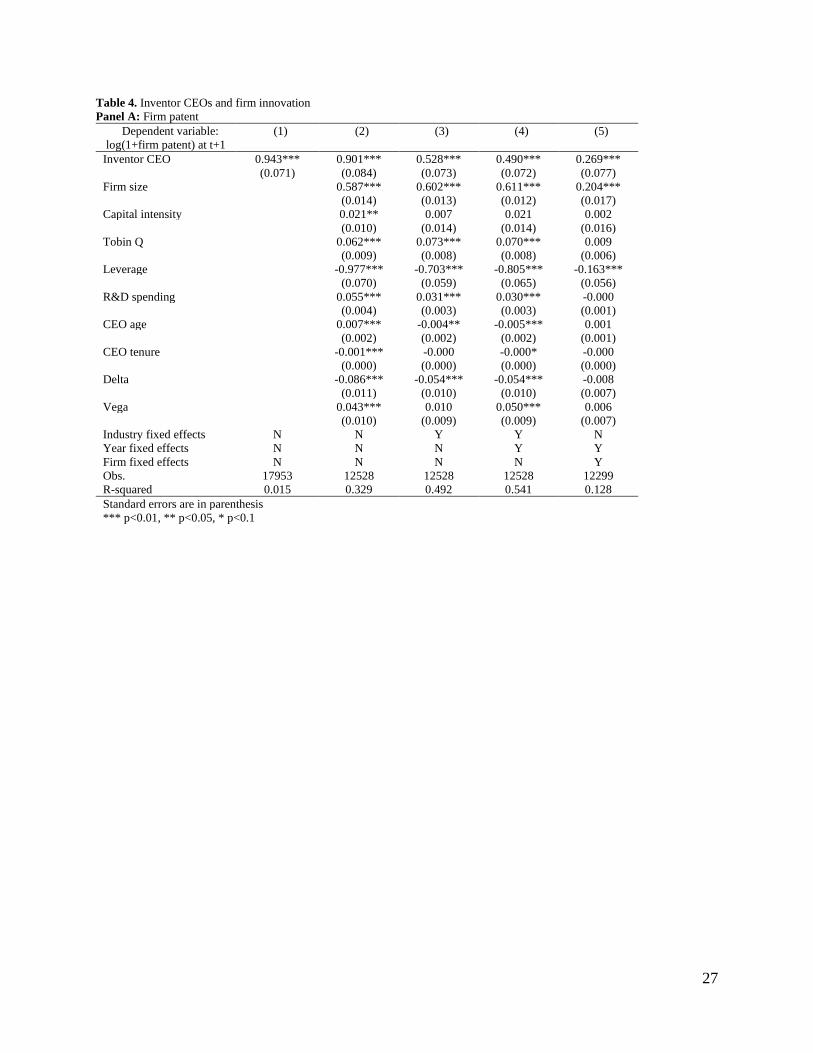
Table 4 presents the effects of inventor CEOs on firm innovation from two-stage least square (2SLS)
regressions. If an innovative firm is more likely to hire inventor CEOs, there may be a concern for
endogeneity. To address this problem, we specify a 2SLS model by choosing an instrumental variable.
The instrumental variable is the CEO copatentees’ ability, defined as CEO coauthors’ average
number of forwarding citations over an average number of patents. CEO coauthors’ average citation
(patent) is defined as the average citation (patent) the coauthor has shared with other authors, not
including the CEO. We drop CEOs who are single authors for all patents (276 observations). Individuals
with higher invention capacity (i.e., a higher number of forwarding patent citations) are more likely to
collaborate with other individuals with a higher invention ability; however, the ability of CEOs’ coauthors
is unlikely to directly impact firm innovation, thereby strengthening the exclusion criteria. We present the
results of the first-stage regression in Appendix Table A2. The partial F-test and the change in R-squared
both indicate that our instrument is significantly associated with the endogenous variable (inventor CEO),
thus providing support for instrument relevance.
13
Using 2SLS regressions, we report the effects of inventor CEOs on firm innovation without
controls in column (1), and we add all the controls in column (2). We control for industry fixed effects in
column (3), both industry and year fixed effects in column (4), and both year and firm fixed effects in
column (5). Standard errors are clustered at the firm level to account for within-firm correlation.
In Panel A, the dependent variable is the logarithm of one plus the number of patents the firm
applied for in a given year. We find that firms with inventor CEOs have more innovation outcomes than
firms with noninventor CEOs, which is consistent with the findings of Islam and Zein (2020).
Specifically, firms with inventor CEOs have 9.19% more patents than firms with noninventor CEOs after
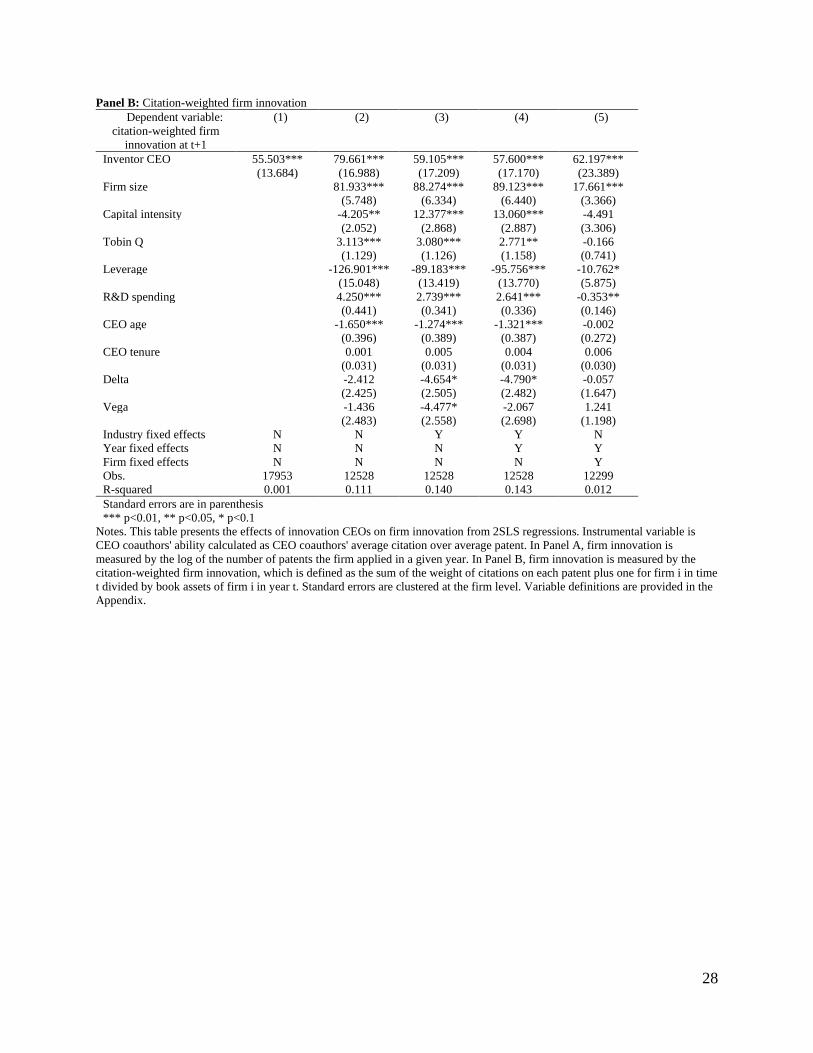
controlling for both year and firm fixed effects.7 Panel B presents the effects of inventor CEOs on a
firm’s innovation quality and citation-weighted firm innovation. The coefficients of inventor CEOs are
positively significant, suggesting that firms with inventor CEOs produce better quality innovations than
firms with noninventor CEOs. The effects are even stronger when we control for both year and firm fixed
effects (in column (5)).
[Insert Table 4 here]
4.2 Inventor CEOs, CEO General Ability and Firm Innovation
In this subsection, we test, and find strong support for, Hypothesis 1 by showing that firms with inventor
CEOs who have a higher general ability produce better-quality firm innovation. Table 5 presents the
effects of inventor CEOs and CEOs’ general ability on firm innovation from 2SLS regressions. Our
model specification is similar to that in Table 4. To test Hypothesis 1, we add two additional variables,
namely, the general ability index and the interaction of inventor CEO and the general ability index. In
columns (1) and (2), the dependent variable is the logarithm of one plus the number of patent applications
of the firm in a given year. In columns (3) and (4), the dependent variable reflects the quality of firm
innovation, namely, citation-weighted firm innovation. We control for both year and firm fixed effects.
Standard errors are clustered at the firm level to account for within-firm correlation.
We find that after controlling for inventor CEOs and general ability, the interaction of inventor
CEOs and the general ability index is positively significant, suggesting that firms with inventor CEOs
who have a higher general ability produce better-quality firm innovations. Figure 2 (a) plots these
interaction effects. Firms led by inventor CEOs have a positive slope, while firms led by noninventor
CEOs have a downward slope. The plots show that 15 out of 18 point estimates are significantly different
from zero. Thus, Hypothesis 1 is supported.
[Insert Table 5 here]
[Insert Figure 2 here]
7 (𝑒𝑒0.269-1)*0.298=9.19%. 0.298 is the standard deviation of inventor CEO.
14
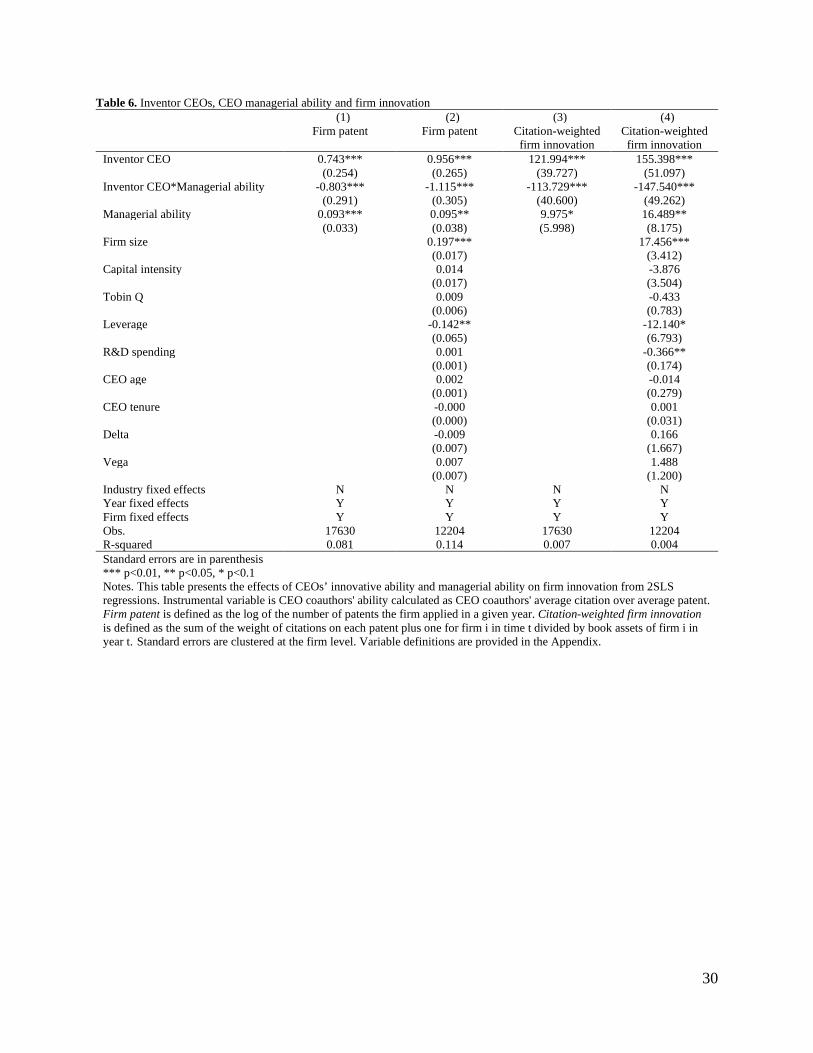
4.3 Inventor CEOs, CEO Managerial Ability and Firm Innovation
Next, we test for Hypothesis 2 and find strong support for Hypothesis 2 by showing that inventor CEOs
who have better managerial skills are a detriment to firm innovation. Table 6 examines the effects of
inventor CEOs and CEOs’ managerial ability on firm innovation from 2SLS regressions. Our model
specification is similar to that in Table 4. To test Hypothesis 2, we add two additional variables, namely,
managerial ability and the interaction of inventor CEO and managerial ability. In columns (1) and (2), the
dependent variable is the logarithm of one plus the number of patents the firm applied for in a given year.
In columns (3) and (4), the dependent variable reflects the quality of firm innovation and citation-
weighted firm innovation. We find that although inventor CEOs and managerial ability are positively
related to firm innovation, the interaction of inventor CEOs and managerial ability is negatively
significantly related to firm innovation. The results suggest that inventor CEOs who have better
managerial skills are a detriment to firm innovation. Figure 2 (b) plots this interaction effect. Firms led by
inventor CEOs have a downward slope, while firms led by noninventor CEOs have an upward slope. The
plots show that all point estimates are significantly different from zero. Therefore, our empirical results
lend support to Hypothesis 2.
[Insert Table 6 here]
4.4 Additional tests
Thus far, the results are consistent with the idea that inventor CEOs spur firm innovation, and inventor
CEOs with greater general abilities spur more firm innovation, but inventor CEOs with higher managerial
abilities hurt firm innovation. In this section, we attempt to uncover the interplay among inventor CEOs,
general ability, and managerial ability. 8
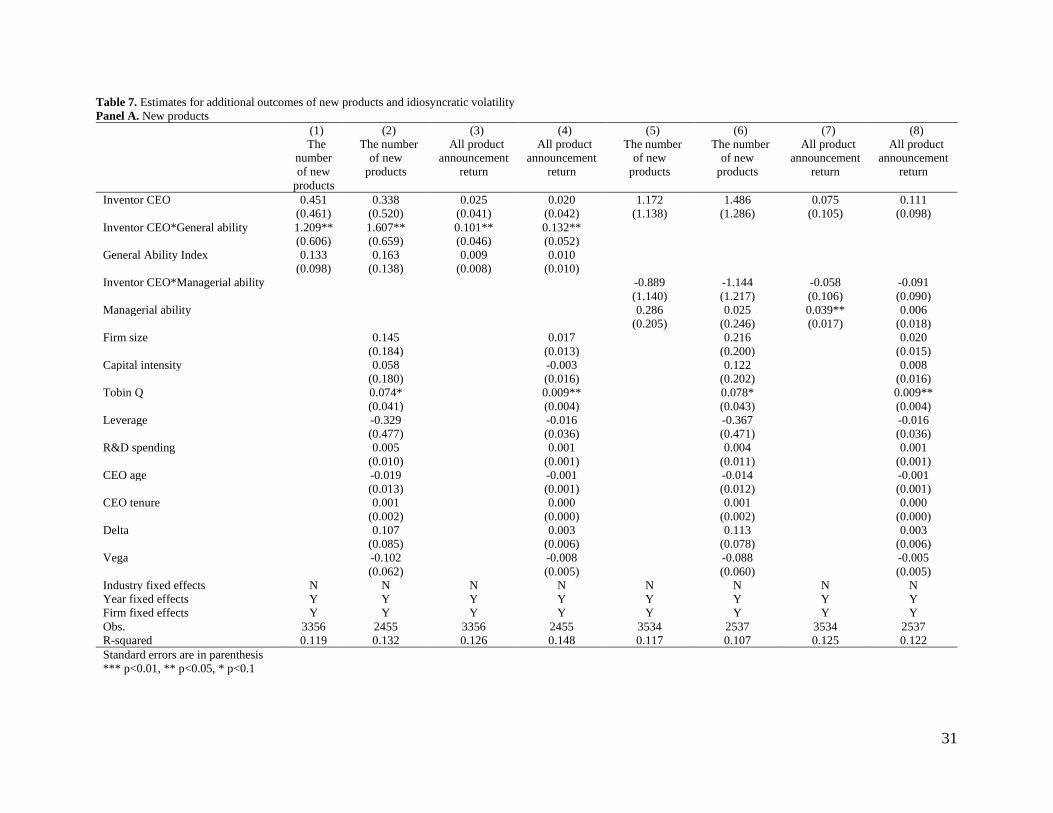
4.4.1 New Products
Islam and Zein (2020) find that inventor CEOs spur firm innovation, and inventor CEOs also translate
those innovations into superior product market outcomes. Specifically, they find that inventor CEOs are
associated with more new products. In this vein, we expect that inventor CEOs with higher general
abilities are associated with more new products and that inventor CEOs with higher managerial abilities
may not be associated with more new products.
Using data are from Mukherjee, Singh and Žaldokas (2017), we use new product announcement
stock returns to proxy for new products. They used textual analysis and event study to determine the
8 In our sample, only three inventor CEOs are female inventor CEOs. We find that although male CEOs spur more firm innovation, male inventor CEOs are associated with less firm innovation compared to female inventor CEOs. We also find that CEO gender does not impact the effects of inventor CEOs and general ability on firm innovation. However, firms led by male inventor CEOs with higher managerial ability have greater firm innovation compared to firms led by female inventor CEOs with higher managerial ability. However, we should interpret the results with caution since they could be driven by a specific female inventor CEOs. The results are available upon request.
15
magnitude of stock returns of new product announcements. In particular, they estimated the cumulative
abnormal returns over the three-day window around the date that a firm announced the new product and
constructed two variables associated with the stock returns of new product announcements. The first
variable is all product announcement returns, defined as the sum of all positive cumulative abnormal
returns of new product announcements over a given year. The second is the number of new products,
defined as the number of announcements with cumulative abnormal returns that are above the 75th
percentile in the sample.
Table 7 Panel A presents the results from the 2SLS regressions. Again, we use the ability of
CEOs’ coauthors as our instrumental variable. The dependent variable is all product announcement
returns in columns (1), (3), (5), and (7) and the number of new products in columns (2), (4), (6), and (8).
We find that the interaction effect between inventor CEOs and general ability is positively and
significantly associated with both all product announcement returns and the number of new products,
suggesting that inventor CEOs with higher general ability produce more new products. In contrast,
inventor CEOs with higher managerial abilities do not produce more products. The coefficient on the
interaction of inventor CEOs and managerial ability is negative but not significant. Overall, the results are
consistent with our hypotheses that inventor CEOs spur firm innovation and that those innovations
translate into better products, while inventor CEOs with higher managerial ability do not produce better
products.
4.4.2 Idiosyncratic Volatility
Next, we examine the impact of inventor CEOs, CEOs’ general and managerial abilities on firm
idiosyncratic volatility. In addition to their impact on innovation activity and firm performance, one might
expect that inventor CEOs, through greater resource outlays, may increase firm volatility, as riskiness in
returns may also increase with greater innovation initiatives (Pan, Wang, and Weisbach, 2015). Prior
analysis shows support for increasing product announcements and improving the stock of patents (both
count and citations) that could also increase firm-specific risk.
The dependent variable is idiosyncratic volatility, which is estimated from Beta Suite by WRDS.
Idiosyncratic volatility in a given year is the average daily idiosyncratic volatility using the 252-day
estimation window and 126-day minimum window. Table 7 Panel B shows the results. In column (1), we
find that the coefficient of inventor CEOs is negatively significant, suggesting that inventor CEOs help
the firm decrease firm idiosyncratic risk. However, inventor CEOs with higher general ability do not have
an impact on firm idiosyncratic volatility. In column (4), we find that firms with inventor CEOs
experience lower idiosyncratic volatility, but firms led by inventor CEOs with higher managerial ability
experience higher idiosyncratic volatility.
16
Furthermore, we split our sample into two subsamples: firms with fewer new products and firms
with more new products. Firms with more (fewer) new products are defined as the number of new
products being more (fewer) than the median value of the number of new products in a given year. In
columns (2) and (3), we find that there is no difference in the effects of inventor CEOs with higher
general ability on the idiosyncratic volatility between firms with fewer new products and firms with more
new products. In columns (5) and (6), firms led by inventor CEOs with higher managerial ability
experience higher idiosyncratic volatility when firms have fewer new products; however, when firms
have more new products, inventor CEOs with higher managerial ability have no impact on idiosyncratic
volatility.
[Insert Table 7 here]
4.4.3 Corporate governance
In this subsection, we examine whether the impact of inventor CEOs on firm innovation is conditional on
the corporate governance environment. We use the governance index (Gompers, Ishii, and Metrick, 2003)
as a measure of the firm’s governance environment.9 The higher the governance index, the lower
shareholder rights. Table 8 presents the results from 2SLS regressions. In Panel A, we find that firms led
by inventor CEOs with better governance (lower governance index) are associated with more firm
innovation, suggesting that in a better corporate governance environment, inventor CEOs can drive more
firm innovation. Next, we examine the impact of corporate governance on the effects of inventor CEOs,
general ability, and managerial ability on firm innovation. In Panel B, the three-way interaction of
inventor CEO, general ability, and the governance index shows that the coefficients are negatively
significant after controlling for both year and firm fixed effects, suggesting that firms led by inventor
CEOs with higher general abilities in a better corporate governance environment are associated with more
firm innovation. In Panel C, the coefficients of the three-way interaction of inventor CEO, managerial
ability, and the governance index are positive but not significant, suggesting that corporate governance
does not impact the effects of inventor CEO with managerial ability on firm innovation.
[Insert Table 8 here]
5 Robustness checks
5.1 Credit Rating
Bonsall et al. (2016) find that firms led by CEOs with higher managerial ability are associated with higher
credit ratings. In the current context, because inventor CEOs may focus more on innovation, a risk borne
by equity holders, the credit rating of firms with such CEOs may deteriorate. We test whether such CEOs
worsen credit ratings and whether general ability helps lower concerns for credit ratings or whether higher
9 Gompers, Ishii and Metrick (2003) use the incidence of 24 governance rules to construct the governance index.
17
managerial ability helps temper excessive resource outlays by inventor CEOs to improve credit ratings.
We assess this relationship based on two types of CEO incentives: intrinsic (high and low
overconfidence) and incentive-based (CEO delta and vega).
We follow Bonsall et al. (2016) to define credit rating as the S&P issuer-level long-term credit
ratings four months after the fiscal year-end. The credit rating is measured by the natural log of numbers
assigned by S&P. A better rating is indicated by a larger number.10 We control for the firm’s previous
CEO’s managerial ability, previous CEO’s general ability, subordinated debt (defined as a dummy
variable equal to one if the firm has subordinated debt and zero otherwise), loss (defined as a dummy
variable equal to one if the firm has negative earnings per share and zero other), and idiosyncratic
volatility. We also control for firm characteristics and CEO characteristics, which are similar to the
control variables shown in the previous tables.
Table 9 presents the results of inventor CEOs, CEOs’ general ability and managerial ability on
the credit rating from ordinary least squares (OLS) regression. In Panel A, we split the sample into two
subsamples: CEO overconfidence and CEO nonoverconfidence. CEO overconfidence is defined as a
dummy variable equal to one if a CEO postpones the exercise of vested options that are at least 67% in
the money and zero otherwise (Koh, Reeb and Zhao, 2017, Malmendier and Tate, 2005). We find that
firms led by inventor CEOs who are overconfident experience better credit ratings (column (3)). In
column (4), after controlling for managerial ability, we find that inventor CEOs have a negative impact on
firm credit ratings. In the subsamples based on CEO overconfidence, we find that firms led by inventor
CEOs with higher managerial ability have higher credit ratings, and the positive effects are higher when
CEOs are not overconfident (column (5)) compared to firms with CEOs who are overconfident (column
(6)). We also find that firms led by inventor CEOs with higher general ability are associated with higher
credit ratings when CEOs are overconfident (column (9)).
In Panel B, we split the sample into two subsamples: low CEO delta and high CEO delta. A high
(low) CEO delta is defined as a CEO delta higher (lower) than the average CEO delta in a given year. We
find that firms with inventor CEOs experience lower credit ratings when the CEOs have lower pay-
performance sensitivity (column (2)). We also find that when CEOs have higher pay-performance
sensitivity, firms led by inventor CEOs with higher managerial ability are associated with better credit
ratings (column (6)). There is no difference in the impacts of inventor CEOs with higher general ability
on firm credit ratings between CEOs with lower pay-performance sensitivity and CEOs with higher pay-
performance sensitivity.
10 For example, AAA is 22, AAa is 21 and D is 1.
18
In Panel C, we also split the sample into two subsamples: low CEO vega and high CEO vega.
High (low) CEO vega is defined as a CEO vega higher (lower) than the average CEO vega in a given
year. We find that CEO risk-taking incentives do not impact the effects of inventor CEOs and general
ability on firm innovation or the effects of inventor CEOs and managerial ability on firm innovation.
[Insert Table 9 here]
5.2 CEO Tenure
To deal with the endogenous matching of inventor CEOs, we restrict our sample to CEOs with at least
two or three years of tenure in the firm. Table 10 presents the results. Panel A only includes CEOs with a
tenure of more than two years, and Panel B includes CEOs with a tenure of greater than three years. We
find that our results are robust to the different cutoffs of CEO tenure.
[Insert Table 10 here]
5.3 Innovative versus Less-Innovative Industries
Another concern is that inventor CEOs are more likely to be hired in more innovative industries. We split
our sample into two subsamples: innovative industry and less-innovative industry. We follow Hirshleifer,
Low and Teoh (2012) to define an industry as an innovative industry if the average citation per patent for
the industry is greater than the median average citation per patent across all industries in a given year.
Table 11 presents the results. We find that inventor CEOs spur firm innovation in both innovative
industries and less innovative industries. Firms led by inventor CEOs with higher general ability
experience more firm innovation only in innovative industries. Firms led by inventor CEOs with higher
managerial ability are associated with less firm innovation in both innovative industries and
noninnovative industries.
[Insert Table 11 here]
5.4 Alternate Measures of Inventor CEOs
If CEOs use their power to force their name on the patent created by their companies’ employees, the
patents that belong to CEOs in their lifetime cannot accurately capture CEOs’ innovative ability.
Therefore, we use alternative measures of inventor CEOs. We first define the inventor CEO as a dummy
variable equal to one if the CEO has at least one patent applied for before the date of becoming CEO in
the firm or joining the firm. Our results remain the same. Next, we defined the inventor CEO as a dummy
variable equal to one if the CEO has at least one patent applied for after the date of becoming CEO in the
firm or joining the firm. In this definition, we find that firms led by inventor CEOs with higher general
abilities are not associated with less firm innovation, which contradicts the previous finding. We still find
that firms led by inventor CEOs with higher managerial ability are detrimental to firm innovation. The
results are available upon request.
19
Next, we construct the inventor CEO generality to capture the CEOs’ innovation depth and
breadth. We first calculate the weight of the CEO’s patent over the total number of patents in a
technological class in a given year. Then, we sum up the square of the weight for a CEO in each given
year. Again, our results are robust to this measure. The results are available upon request.
6 Conclusion
Prior research documents that inventor CEOs improve innovation and financial performance (Bostan and
Mian, 2019, Islam and Zein, 2020). In parallel, the effects of managerial and general ability on a variety
of firm-related outcomes remain mixed (Cheung et al., 2017, Li and Patel, 2019). Our study assesses the
plausible panoramic and panoptic views of inventor CEOs based on the nature of their executive career
experience. We find that inventor CEOs with a higher level of general ability generate better innovative
performance; however, inventor CEOs with a higher managerial ability have a negative to neutral effect
on innovation performance. Collectively, the findings show that inventor CEOs with more diverse firm
and industry experiences are better positioned to leverage their inventor skills with variegated business
knowledge. However, inventor CEOs with well-honed managerial abilities may realize limited success in
innovation outcomes. Our paper contributes to the literature in three ways. First, this paper is
complementary to a growing body of literature that explores the impact of CEOs on corporate
performance. We add to the literature by showing how CEOs’ innovation ability, general ability, and
managerial ability impact corporate innovation. Second, this paper contributes to the literature that
explores the effects of CEO characteristics on corporate innovation. Third, this paper complements the
literature that studies the impact of CEO managerial ability and general ability on corporate investment
decisions. We add to this literature by showing that the general abilities of inventor CEOs are a significant
driver of corporate innovation.
Our analysis of whether CEOs’ general ability or managerial ability is more effective at
improving the innovation performance of inventor CEOs informs the board of directors in making hiring
decisions. Controlling for incentives and other confounding variables, we provide evidence that prior
human capital is an important driver of innovation performance. The propensity to invent, coupled with
generalist human capital, provides both divergent (from general ability) and convergent (from innovation
ability) processes that are needed to drive innovation. Managerial ability may be a liability for an inventor
CEO, and the associated innovation improvements are to be less expected. With the increasing
importance of a knowledge-based economy, we provide new insights into why the type of CEO human
capital is an important complement for inventor CEOs. Our study is subject to limitations and provides
avenues for future research. First, since our data are based on publicly traded firms in the United States,
the evidence and results may not necessarily apply to other countries. Future research may expand the
study scope into more countries and economies. Second, most of our results are firm-specific. Future

20
research may study the “spillover” effect within the same industry and peer firms. Similarly, future
studies could focus on the knowledge-based view of the firm to assess CEO- and firm-level interactions in
driving innovation outcomes.
21
References Amabile, T. M. 1988. A model of creativity and innovation in organizations. Research in organizational
behavior, 10, 123-167.
Andreou, P. C., Karasamani, I., Louca, C.and Ehrlich, D. 2017. The impact of managerial ability on crisis-period corporate investment. Journal of Business Research, 79, 107-122.
Baik, B., Farber, D. B.and Lee, S. 2011. CEO ability and management earnings forecasts. Contemporary Accounting Research, 28, 1645-1668.
Becker, G. S. 1962. Investment in human capital: A theoretical analysis. Journal of Political Economy, 70, 9-49.
Berson, Y., Oreg, S.and Dvir, T. 2008. CEO values, organizational culture and firm outcomes. Journal of Organizational Behavior, 29, 615-633.
Bonsall, S. B., Holzman, E. R.and Miller, B. P. 2016. Managerial ability and credit risk assessment. Management Science, 63, 1425-1449.
Bostan, I.and Mian, G. M. 2019. Inventor Chief Executive Officers and Firm Innovation. International Review of Finance, 19, 247-286.
Brockman, P., Lee, H. S. G.and Salas, J. M. 2016. Determinants of CEO compensation: Generalist–specialist versus insider–outsider attributes. Journal of Corporate Finance, 39, 53-77.
Caridi‐Zahavi, O., Carmeli, A.and Arazy, O. 2016. The influence of CEOs' visionary innovation leadership on the performance of high‐technology ventures: The mediating roles of connectivity and knowledge integration. Journal of Product Innovation Management, 33, 356-376.
Chen, J., Liu, X.and Song, W. 2018. CEO general managerial skills and corporate social responsibility.
Chen, Y., Podolski, E. J.and Veeraraghavan, M. 2015. Does managerial ability facilitate corporate innovative success? Journal of Empirical Finance, 34, 313-326.
Chen, Y., Tang, G., Jin, J., Xie, Q.and Li, J. 2014. CEO s’ transformational leadership and product innovation performance: The roles of corporate entrepreneurship and technology orientation. Journal of Product Innovation Management, 31, 2-17.
Cheung, K. T. S., Naidu, D., Navissi, F.and Ranjeeni, K. 2017. Valuing talent: Do CEOs' ability and discretion unambiguously increase firm performance. Journal of Corporate Finance, 42, 15-35.
Chiu, S.-c., Johnson, R. A., Hoskisson, R. E.and Pathak, S. 2016. The impact of CEO successor origin on corporate divestiture scale and scope change. The Leadership Quarterly, 27, 617-633.
Coles, J. L., Daniel, N. D.and Naveen, L. 2006. Managerial incentives and risk-taking. Journal of Financial Economics, 79, 431-468.
Cornaggia, K. J., Krishnan, G. V.and Wang, C. 2017. Managerial ability and credit ratings. Contemporary Accounting Research, 34, 2094-2122.
22
Custódio, C., Ferreira, M. A.and Matos, P. 2013. Generalists versus specialists: Lifetime work experience and chief executive officer pay. Journal of Financial Economics, 108, 471-492.
Custódio, C., Ferreira, M. A.and Matos, P. 2017. Do general managerial skills spur innovation? Management Science, 65, 459-476.
Datta, S.and Iskandar-Datta, M. 2014. Upper‐echelon executive human capital and compensation: Generalist vs specialist skills. Strategic Management Journal, 35, 1853-1866.
Demerjian, P., Lev, B.and McVay, S. 2012a. Quantifying managerial ability: A new measure and validity tests. Management science, 58, 1229-1248.
Demerjian, P., Lewis-Western, M.and McVay, S. 2017. How does intentional earnings smoothing vary with managerial ability? Journal of Accounting, Auditing & Finance, 0148558X17748405.
Demerjian, P. R., Lev, B., Lewis, M. F.and McVay, S. E. 2012b. Managerial ability and earnings quality. The Accounting Review, 88, 463-498.
Ederer, F.and Manso, G. 2013. Is pay for performance detrimental to innovation? Management Science, 59, 1496-1513.
Fleming, L. 2001. Recombinant uncertainty in technological search. Management Science, 47, 117-132.
Francis, B. B., Sun, X.and Wu, Q. 2013. Managerial ability and tax avoidance. Available at SSRN, 2348695.
Garretsen, H., Stoker, J. I.and Weber, R. A. 2020. Economic perspectives on leadership: Concepts, causality, and context in leadership research. The Leadership Quarterly, 101410.
Gompers, P., Ishii, J.and Metrick, A. 2003. Corporate governance and equity prices. Quarterly Journal of Economics, 118, 107-156.
Gounopoulos, D.and Pham, H. 2018. Specialist CEOs and IPO survival. Journal of Corporate Finance, 48, 217-243.
Hall, B. H., Jaffe, A. B.and Trajtenberg, M. 2001. The NBER patent citation data file: Lessons, insights and methodological tools. National Bureau of Economic Research.
Hirshleifer, D., Low, A.and Teoh, S. H. 2012. Are Overconfident CEOs Better Innovators? Journal of Finance, 67, 1457-1498.
Islam, E.and Zein, J. 2020. Inventor CEOs. Journal of Financial Economics, 135, 505-527.
Jiraporn, P., Leelalai, V.and Tong, S. 2016. The effect of managerial ability on dividend policy: how do talented managers view dividend payouts? Applied Economics Letters, 23, 857-862.
Jung, D. I., Chow, C.and Wu, A. 2003. The role of transformational leadership in enhancing organizational innovation: Hypotheses and some preliminary findings. The Leadership Quarterly, 14, 525-544.
Kaplan, S. N., Klebanov, M. M.and Sorensen, M. 2012. Which CEO Characteristics and Abilities Matter? Journal of Finance, 67, 973-1007.
23
Koester, A., Shevlin, T.and Wangerin, D. 2016. The role of managerial ability in corporate tax avoidance. Management Science, 63, 3285-3310.
Kogan, L., Papanikolaou, D., Seru, A.and Stoffman, N. 2017. Technological innovation, resource allocation, and growth. Quarterly Journal of Economics, 132, 665-712.
Koh, P.-S., Reeb, D. M.and Zhao, W. 2017. CEO confidence and unreported R&D. Management Science, 64, 5725-5747.
Kraiczy, N. D., Hack, A.and Kellermanns, F. W. 2015. What makes a family firm innovative? CEO risk‐taking propensity and the organizational context of family firms. Journal of Product Innovation Management, 32, 334-348.
Krishnan, G. V.and Wang, C. 2014. The relation between managerial ability and audit fees and going concern opinions. Auditing: A Journal of Practice & Theory, 34, 139-160.
Li, G.-C., Lai, R., D’Amour, A., Doolin, D. M., Sun, Y., Torvik, V. I., Amy, Z. Y.and Fleming, L. 2014. Disambiguation and co-authorship networks of the US patent inventor database (1975–2010). Research Policy, 43, 941-955.
Li, M.and Patel, P. C. 2019. Jack of all, master of all? CEO generalist experience and firm performance. The Leadership Quarterly, 30, 320-334.
Malmendier, U.and Tate, G. 2005. CEO Overconfidence and Corporate Investment. Journal of Finance, 60, 2661-2700.
Mansfield, E. R.and Helms, B. P. 1982. Detecting multicollinearity. The American Statistician, 36, 158-160.
Mishra, D. R. 2014. The dark side of CEO ability: CEO general managerial skills and cost of equity capital. Journal of Corporate Finance, 29, 390-409.
Mukherjee, A., Singh, M.and Žaldokas, A. 2017. Do corporate taxes hinder innovation? Journal of Financial Economics, 124, 195-221.
Pan, Y., Wang, T. Y.and Weisbach, M. S. 2015. Learning About CEO Ability and Stock Return Volatility. Review of Financial Studies, 28, 1623-1666.
Reid, S. W., Anglin, A. H., Baur, J. E., Short, J. C.and Buckley, M. R. 2018. Blazing new trails or opportunity lost? Evaluating research at the intersection of leadership and entrepreneurship. The Leadership Quarterly, 29, 150-164.
Sunder, J., Sunder, S. V.and Zhang, J. 2017. Pilot CEOs and corporate innovation. Journal of Financial Economics, 123, 209-224.
Xu, Y., Fund, Z. P., Xu, N., Li, Z.and Chan, K. C. 2018. Generalists vs. specialists: Who are the better acquirers? Working paper.
Yung, K.and Chen, C. 2018. Managerial ability and firm risk-taking behavior. Review of Quantitative Finance and Accounting, 51, 1005-1032.
24
Table 1. Inventor vs. Non-Inventor CEOs from 1992 to 2008 Year Non-Inventor CEOs (#) Inventor CEOs (#) Inventor CEOs (%)
1992 210 17 7.5%
1993 616 45 6.8%
1994 878 91 9.4%
1995 940 102 9.8%
1996 976 114 10.5%
1997 1,017 127 11.1%
1998 1,041 127 10.9%
1999 1,090 142 11.5%
2000 1,083 127 10.5%
2001 1,027 122 10.6%
2002 1,010 121 10.7%
2003 1,024 127 11.0%
2004 1,047 119 10.2%
2005 1,038 104 9.1%
2006 1,067 99 8.5%
2007 1,185 110 8.5%
2008 1,182 104 8.1%
Total 16,431 1,798 9.9% Notes. This table provides the breakdown of the number of inventor CEOs, and the percentage of inventor CEOs in the sample by year. The sample of CEOs is from ExecuComp for the period of 1992-2008.
25
Table 2. Summary Statistics Full sample Non-Inventor CEOs Inventor CEOs Variable N Mean Median Std. Dev. N Mean Median Std. Dev. N Mean Median Std. Dev. CEO characteristics CEO patent 18229 0.081 0 1.293 16431 0 0 0 1798 0.819*** 0 4.044
CEO citation 18229 1.206 0 21.445 16431 0 0 0 1798 12.223*** 0 67.308
CEO cumulative patent 18229 0.971 0 8.86 16431 0 0 0 1798 9.845*** 2 26.624
CEO cumulative citation 18229 25.619 0 225.495 16431 0 0 0 1798 259.737*** 40 674.491
General ability index 14605 0.002 -0.163 0.959 13191 0.016 -0.147 0.958 1414 -0.123*** 0.350 0.963
Managerial ability 18027 0.017 -0.016 0.141 16259 0.015 -0.018 0.142 1768 0.032*** 0.004 0.133
Tenure (months) 18229 81.215 48 87.681 16431 78.376 48 85.329 1798 107.159*** 72 103.275
CEO age (years) 18173 55.425 55 7.696 16377 55.442 56 7.625 1796 55.267 55 8.314
Delta 15315 5.303 5.255 1.58 13692 5.271 5.235 1.557 1623 5.570*** 5.421 1.742
Vega 15912 3.496 3.630 1.67 14254 3.51 3.644 1.654 1658 3.377** 3.534 1.802
Firm characteristics
Inventor CEO 18229 0.099 0 0.298 16431 0 0 0 1798 1 1 0
Firm patent 18229 29.644 1 151.62 16431 28.509 0 151.306 1798 40.016** 4 154.119
Citation-weighted firm innovation 18229 61.421 0 324.342 16431 58.003 0 321.823 1798 92.659*** 8.129 345.039
Tobin's Q 16696 2.262 1.649 2.567 15030 2.212 1.623 2.548 1666 2.712*** 1.964 2.693
Assets (millions) 18038 4625.52 869.509 21800.735 16252 4562.666 912.938 17979.745 1786 519.474 538.630 43116.365
Capital intensity 17864 3.776 3.618 1.249 16084 3.783 3.615 1.285 1780 3.714** 3.642 0.852
Leverage 15698 0.211 0.195 0.191 14141 0.216 0.201 0.186 1557 0.161*** 0.108 0.223
R&D spending 18042 4.852 1.052 9.408 16256 4.43 0.708 9.014 1786 8.692*** 5.916 11.754 Notes. This table presents summary statistics of the variables used in this study. T-tests are conducted to test for differences between the means for firms with inventor CEOs and non-inventor CEOs. Variable definitions are provided in the Appendix. *, ** and *** denote significance at the 10%, 5%, and 1% level, respectively.
26
Table 3. Correlation matrix
Variables (1) (2) (3) (4) (5) (6) (7) (8) (9) (10) (11) (12) (13) (1) Inventor CEO 1.000 (2) General ability index -0.043* 1.000 (3) Managerial ability 0.040* 0.036* 1.000 (4) Citation-weighted innovation 0.032* 0.112* 0.126* 1.000 (5) Firm size -0.100* 0.300* 0.076* 0.309* 1.000 (6) Capital intensity -0.017* 0.056* -0.004 0.067* 0.293* 1.000 (7) Tobin Q 0.071* -0.010 0.203* 0.013 -0.168* -0.074* 1.000 (8) Leverage -0.086* 0.074* -0.150* -0.013 0.238* 0.192* -0.169* 1.000 (9) R&D spending 0.135* 0.018* 0.154* 0.066* -0.225* -0.039* 0.263* -0.156* 1.000 (10) CEO age -0.007 0.149* -0.035* -0.013 0.139* 0.055* -0.113* 0.059* -0.126* 1.000 (11) CEO tenure 0.098* -0.125* 0.027* -0.029* -0.059* -0.038* 0.006 -0.057* -0.011 0.383* 1.000 (12) Delta 0.058* 0.100* 0.179* 0.152* 0.397* 0.025* 0.272* -0.076* 0.029* 0.109* 0.316* 1.000 (13) Vega -0.024* 0.274* 0.090* 0.176* 0.516* 0.123* 0.039* 0.071* 0.041* -0.040* -0.060* 0.403* 1.000 * shows significance at the .05 level Notes. This table presents the correlation matrix of the variables used in this study. Variable definitions are provided in the Appendix.
27
Table 4. Inventor CEOs and firm innovation Panel A: Firm patent
Dependent variable: log(1+firm patent) at t+1
(1) (2) (3) (4) (5)
Inventor CEO 0.943*** 0.901*** 0.528*** 0.490*** 0.269*** (0.071) (0.084) (0.073) (0.072) (0.077) Firm size 0.587*** 0.602*** 0.611*** 0.204*** (0.014) (0.013) (0.012) (0.017) Capital intensity 0.021** 0.007 0.021 0.002 (0.010) (0.014) (0.014) (0.016) Tobin Q 0.062*** 0.073*** 0.070*** 0.009 (0.009) (0.008) (0.008) (0.006) Leverage -0.977*** -0.703*** -0.805*** -0.163*** (0.070) (0.059) (0.065) (0.056) R&D spending 0.055*** 0.031*** 0.030*** -0.000 (0.004) (0.003) (0.003) (0.001) CEO age 0.007*** -0.004** -0.005*** 0.001 (0.002) (0.002) (0.002) (0.001) CEO tenure -0.001*** -0.000 -0.000* -0.000 (0.000) (0.000) (0.000) (0.000) Delta -0.086*** -0.054*** -0.054*** -0.008 (0.011) (0.010) (0.010) (0.007) Vega 0.043*** 0.010 0.050*** 0.006 (0.010) (0.009) (0.009) (0.007) Industry fixed effects N N Y Y N Year fixed effects N N N Y Y Firm fixed effects N N N N Y Obs. 17953 12528 12528 12528 12299 R-squared 0.015 0.329 0.492 0.541 0.128 Standard errors are in parenthesis *** p<0.01, ** p<0.05, * p<0.1
28
Panel B: Citation-weighted firm innovation Dependent variable: citation-weighted firm
innovation at t+1
(1) (2) (3) (4) (5)
Inventor CEO 55.503*** 79.661*** 59.105*** 57.600*** 62.197*** (13.684) (16.988) (17.209) (17.170) (23.389) Firm size 81.933*** 88.274*** 89.123*** 17.661*** (5.748) (6.334) (6.440) (3.366) Capital intensity -4.205** 12.377*** 13.060*** -4.491 (2.052) (2.868) (2.887) (3.306) Tobin Q 3.113*** 3.080*** 2.771** -0.166 (1.129) (1.126) (1.158) (0.741) Leverage -126.901*** -89.183*** -95.756*** -10.762* (15.048) (13.419) (13.770) (5.875) R&D spending 4.250*** 2.739*** 2.641*** -0.353** (0.441) (0.341) (0.336) (0.146) CEO age -1.650*** -1.274*** -1.321*** -0.002 (0.396) (0.389) (0.387) (0.272) CEO tenure 0.001 0.005 0.004 0.006 (0.031) (0.031) (0.031) (0.030) Delta -2.412 -4.654* -4.790* -0.057 (2.425) (2.505) (2.482) (1.647) Vega -1.436 -4.477* -2.067 1.241 (2.483) (2.558) (2.698) (1.198) Industry fixed effects N N Y Y N Year fixed effects N N N Y Y Firm fixed effects N N N N Y Obs. 17953 12528 12528 12528 12299 R-squared 0.001 0.111 0.140 0.143 0.012 Standard errors are in parenthesis *** p<0.01, ** p<0.05, * p<0.1
Notes. This table presents the effects of innovation CEOs on firm innovation from 2SLS regressions. Instrumental variable is CEO coauthors' ability calculated as CEO coauthors' average citation over average patent. In Panel A, firm innovation is measured by the log of the number of patents the firm applied in a given year. In Panel B, firm innovation is measured by the citation-weighted firm innovation, which is defined as the sum of the weight of citations on each patent plus one for firm i in time t divided by book assets of firm i in year t. Standard errors are clustered at the firm level. Variable definitions are provided in the Appendix.

29
Table 5. Inventor CEOs, CEO general ability and firm innovation (1) (2) (3) (4) Firm patent Firm patent Citation-weighted
firm innovation Citation-weighted firm innovation
Inventor CEO 0.271*** 0.369*** 48.119** 63.675** (0.088) (0.086) (21.478) (28.335) Inventor CEO*General ability 0.065 0.068 48.965*** 42.885*** (0.046) (0.053) (14.929) (16.302) General Ability Index 0.031*** -0.002 -3.776 -12.775** (0.011) (0.012) (4.286) (6.030) Firm size 0.227*** 20.101*** (0.018) (3.912) Capital intensity -0.008 -3.332 (0.019) (4.287) Tobin Q 0.010* -0.102 (0.006) (0.808) Leverage -0.114* -13.207* (0.060) (7.547) R&D spending -0.001 -0.369** (0.001) (0.183) CEO age 0.001 0.420 (0.002) (0.352) CEO tenure -0.000 -0.025 (0.000) (0.040) Delta -0.001 0.067 (0.008) (2.020) Vega 0.009 1.465 (0.008) (1.522) Industry fixed effects N N N N Year fixed effects Y Y Y Y Firm fixed effects Y Y Y Y Obs. 14252 10267 14252 10267 R-squared 0.058 0.084 0.019 0.019 Standard errors are in parenthesis *** p<0.01, ** p<0.05, * p<0.1
Notes. This table presents the effects of CEOs’ innovative ability and general ability on firm innovation from 2SLS regressions. Instrumental variable is CEO coauthors' ability calculated as CEO coauthors' average citation over average patent. Firm patent is defined as the log of the number of patents the firm applied in a given year. Citation-weighted firm innovation is defined as the sum of the weight of citations on each patent plus one for firm i in time t divided by book assets of firm i in year t. Standard errors are clustered at the firm level. Variable definitions are provided in the Appendix.
30
Table 6. Inventor CEOs, CEO managerial ability and firm innovation (1) (2) (3) (4) Firm patent Firm patent Citation-weighted
firm innovation Citation-weighted firm innovation
Inventor CEO 0.743*** 0.956*** 121.994*** 155.398*** (0.254) (0.265) (39.727) (51.097) Inventor CEO*Managerial ability -0.803*** -1.115*** -113.729*** -147.540*** (0.291) (0.305) (40.600) (49.262) Managerial ability 0.093*** 0.095** 9.975* 16.489** (0.033) (0.038) (5.998) (8.175) Firm size 0.197*** 17.456*** (0.017) (3.412) Capital intensity 0.014 -3.876 (0.017) (3.504) Tobin Q 0.009 -0.433 (0.006) (0.783) Leverage -0.142** -12.140* (0.065) (6.793) R&D spending 0.001 -0.366** (0.001) (0.174) CEO age 0.002 -0.014 (0.001) (0.279) CEO tenure -0.000 0.001 (0.000) (0.031) Delta -0.009 0.166 (0.007) (1.667) Vega 0.007 1.488 (0.007) (1.200) Industry fixed effects N N N N Year fixed effects Y Y Y Y Firm fixed effects Y Y Y Y Obs. 17630 12204 17630 12204 R-squared 0.081 0.114 0.007 0.004 Standard errors are in parenthesis *** p<0.01, ** p<0.05, * p<0.1 Notes. This table presents the effects of CEOs’ innovative ability and managerial ability on firm innovation from 2SLS regressions. Instrumental variable is CEO coauthors' ability calculated as CEO coauthors' average citation over average patent. Firm patent is defined as the log of the number of patents the firm applied in a given year. Citation-weighted firm innovation is defined as the sum of the weight of citations on each patent plus one for firm i in time t divided by book assets of firm i in year t. Standard errors are clustered at the firm level. Variable definitions are provided in the Appendix.
31
Table 7. Estimates for additional outcomes of new products and idiosyncratic volatility Panel A. New products
(1) (2) (3) (4) (5) (6) (7) (8) The
number of new
products
The number of new
products
All product announcement
return
All product announcement
return
The number of new
products
The number of new
products
All product announcement
return
All product announcement
return
Inventor CEO 0.451 0.338 0.025 0.020 1.172 1.486 0.075 0.111 (0.461) (0.520) (0.041) (0.042) (1.138) (1.286) (0.105) (0.098) Inventor CEO*General ability 1.209** 1.607** 0.101** 0.132** (0.606) (0.659) (0.046) (0.052) General Ability Index 0.133 0.163 0.009 0.010 (0.098) (0.138) (0.008) (0.010) Inventor CEO*Managerial ability -0.889 -1.144 -0.058 -0.091 (1.140) (1.217) (0.106) (0.090) Managerial ability 0.286 0.025 0.039** 0.006 (0.205) (0.246) (0.017) (0.018) Firm size 0.145 0.017 0.216 0.020 (0.184) (0.013) (0.200) (0.015) Capital intensity 0.058 -0.003 0.122 0.008 (0.180) (0.016) (0.202) (0.016) Tobin Q 0.074* 0.009** 0.078* 0.009** (0.041) (0.004) (0.043) (0.004) Leverage -0.329 -0.016 -0.367 -0.016 (0.477) (0.036) (0.471) (0.036) R&D spending 0.005 0.001 0.004 0.001 (0.010) (0.001) (0.011) (0.001) CEO age -0.019 -0.001 -0.014 -0.001 (0.013) (0.001) (0.012) (0.001) CEO tenure 0.001 0.000 0.001 0.000 (0.002) (0.000) (0.002) (0.000) Delta 0.107 0.003 0.113 0.003 (0.085) (0.006) (0.078) (0.006) Vega -0.102 -0.008 -0.088 -0.005 (0.062) (0.005) (0.060) (0.005) Industry fixed effects N N N N N N N N Year fixed effects Y Y Y Y Y Y Y Y Firm fixed effects Y Y Y Y Y Y Y Y Obs. 3356 2455 3356 2455 3534 2537 3534 2537 R-squared 0.119 0.132 0.126 0.148 0.117 0.107 0.125 0.122 Standard errors are in parenthesis *** p<0.01, ** p<0.05, * p<0.1
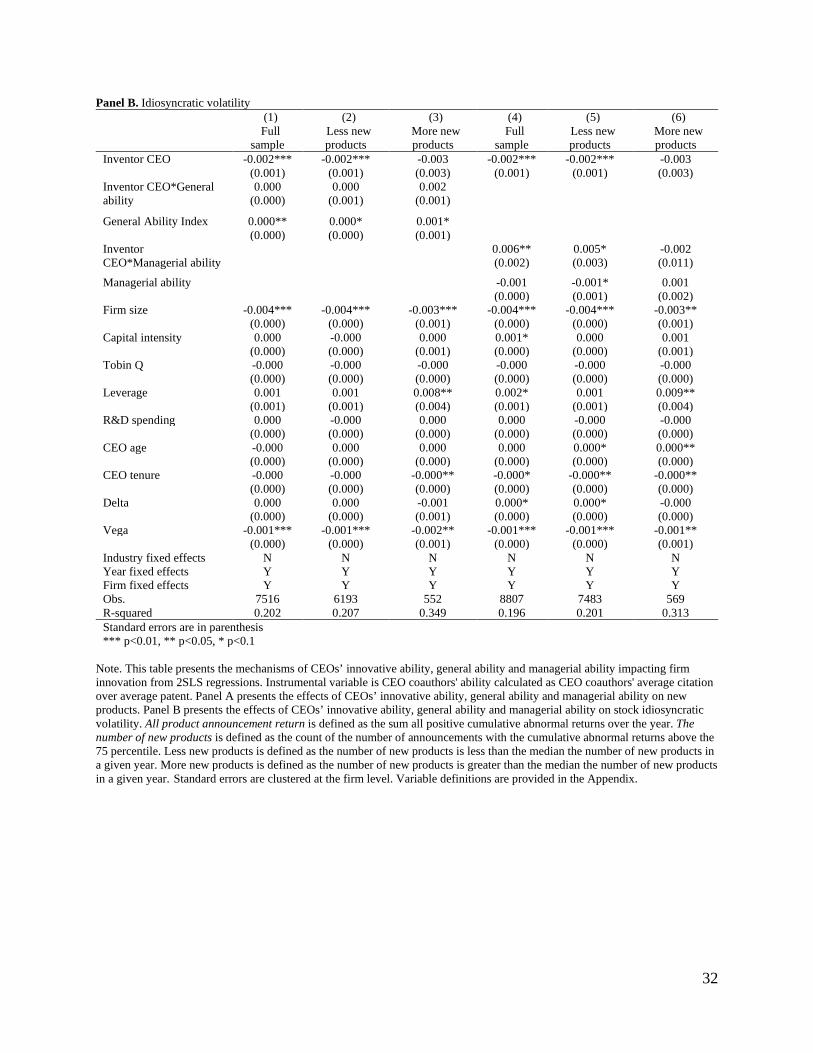
32
Panel B. Idiosyncratic volatility (1) (2) (3) (4) (5) (6) Full
sample Less new products
More new products
Full sample
Less new products
More new products
Inventor CEO -0.002*** -0.002*** -0.003 -0.002*** -0.002*** -0.003 (0.001) (0.001) (0.003) (0.001) (0.001) (0.003) Inventor CEO*General ability
0.000 0.000 0.002 (0.000) (0.001) (0.001)
General Ability Index 0.000** 0.000* 0.001* (0.000) (0.000) (0.001) Inventor CEO*Managerial ability
0.006** 0.005* -0.002 (0.002) (0.003) (0.011)
Managerial ability -0.001 -0.001* 0.001 (0.000) (0.001) (0.002) Firm size -0.004*** -0.004*** -0.003*** -0.004*** -0.004*** -0.003** (0.000) (0.000) (0.001) (0.000) (0.000) (0.001) Capital intensity 0.000 -0.000 0.000 0.001* 0.000 0.001 (0.000) (0.000) (0.001) (0.000) (0.000) (0.001) Tobin Q -0.000 -0.000 -0.000 -0.000 -0.000 -0.000 (0.000) (0.000) (0.000) (0.000) (0.000) (0.000) Leverage 0.001 0.001 0.008** 0.002* 0.001 0.009** (0.001) (0.001) (0.004) (0.001) (0.001) (0.004) R&D spending 0.000 -0.000 0.000 0.000 -0.000 -0.000 (0.000) (0.000) (0.000) (0.000) (0.000) (0.000) CEO age -0.000 0.000 0.000 0.000 0.000* 0.000** (0.000) (0.000) (0.000) (0.000) (0.000) (0.000) CEO tenure -0.000 -0.000 -0.000** -0.000* -0.000** -0.000** (0.000) (0.000) (0.000) (0.000) (0.000) (0.000) Delta 0.000 0.000 -0.001 0.000* 0.000* -0.000 (0.000) (0.000) (0.001) (0.000) (0.000) (0.000) Vega -0.001*** -0.001*** -0.002** -0.001*** -0.001*** -0.001** (0.000) (0.000) (0.001) (0.000) (0.000) (0.001) Industry fixed effects N N N N N N Year fixed effects Y Y Y Y Y Y Firm fixed effects Y Y Y Y Y Y Obs. 7516 6193 552 8807 7483 569 R-squared 0.202 0.207 0.349 0.196 0.201 0.313 Standard errors are in parenthesis *** p<0.01, ** p<0.05, * p<0.1
Note. This table presents the mechanisms of CEOs’ innovative ability, general ability and managerial ability impacting firm innovation from 2SLS regressions. Instrumental variable is CEO coauthors' ability calculated as CEO coauthors' average citation over average patent. Panel A presents the effects of CEOs’ innovative ability, general ability and managerial ability on new products. Panel B presents the effects of CEOs’ innovative ability, general ability and managerial ability on stock idiosyncratic volatility. All product announcement return is defined as the sum all positive cumulative abnormal returns over the year. The number of new products is defined as the count of the number of announcements with the cumulative abnormal returns above the 75 percentile. Less new products is defined as the number of new products is less than the median the number of new products in a given year. More new products is defined as the number of new products is greater than the median the number of new products in a given year. Standard errors are clustered at the firm level. Variable definitions are provided in the Appendix.
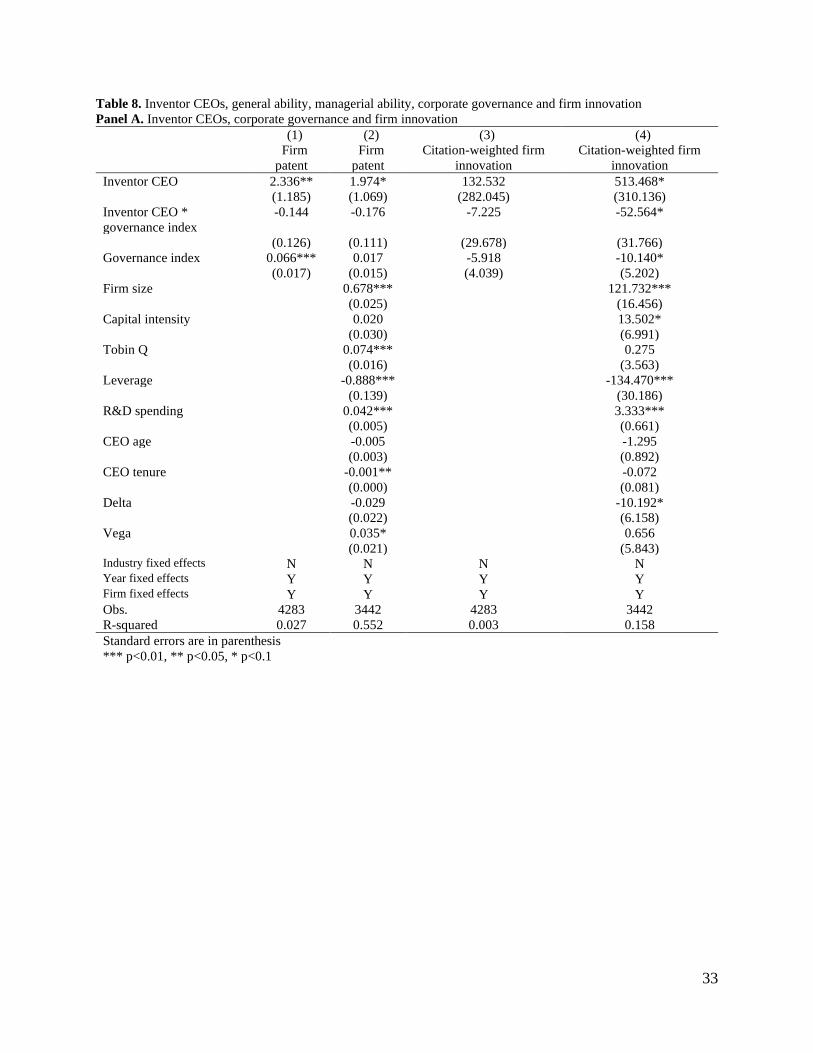
33
Table 8. Inventor CEOs, general ability, managerial ability, corporate governance and firm innovation Panel A. Inventor CEOs, corporate governance and firm innovation
(1) (2) (3) (4) Firm
patent Firm patent
Citation-weighted firm innovation
Citation-weighted firm innovation
Inventor CEO 2.336** 1.974* 132.532 513.468* (1.185) (1.069) (282.045) (310.136) Inventor CEO * governance index
-0.144 -0.176 -7.225 -52.564*
(0.126) (0.111) (29.678) (31.766) Governance index 0.066*** 0.017 -5.918 -10.140* (0.017) (0.015) (4.039) (5.202) Firm size 0.678*** 121.732*** (0.025) (16.456) Capital intensity 0.020 13.502* (0.030) (6.991) Tobin Q 0.074*** 0.275 (0.016) (3.563) Leverage -0.888*** -134.470*** (0.139) (30.186) R&D spending 0.042*** 3.333*** (0.005) (0.661) CEO age -0.005 -1.295 (0.003) (0.892) CEO tenure -0.001** -0.072 (0.000) (0.081) Delta -0.029 -10.192* (0.022) (6.158) Vega 0.035* 0.656 (0.021) (5.843) Industry fixed effects N N N N Year fixed effects Y Y Y Y Firm fixed effects Y Y Y Y Obs. 4283 3442 4283 3442 R-squared 0.027 0.552 0.003 0.158 Standard errors are in parenthesis *** p<0.01, ** p<0.05, * p<0.1
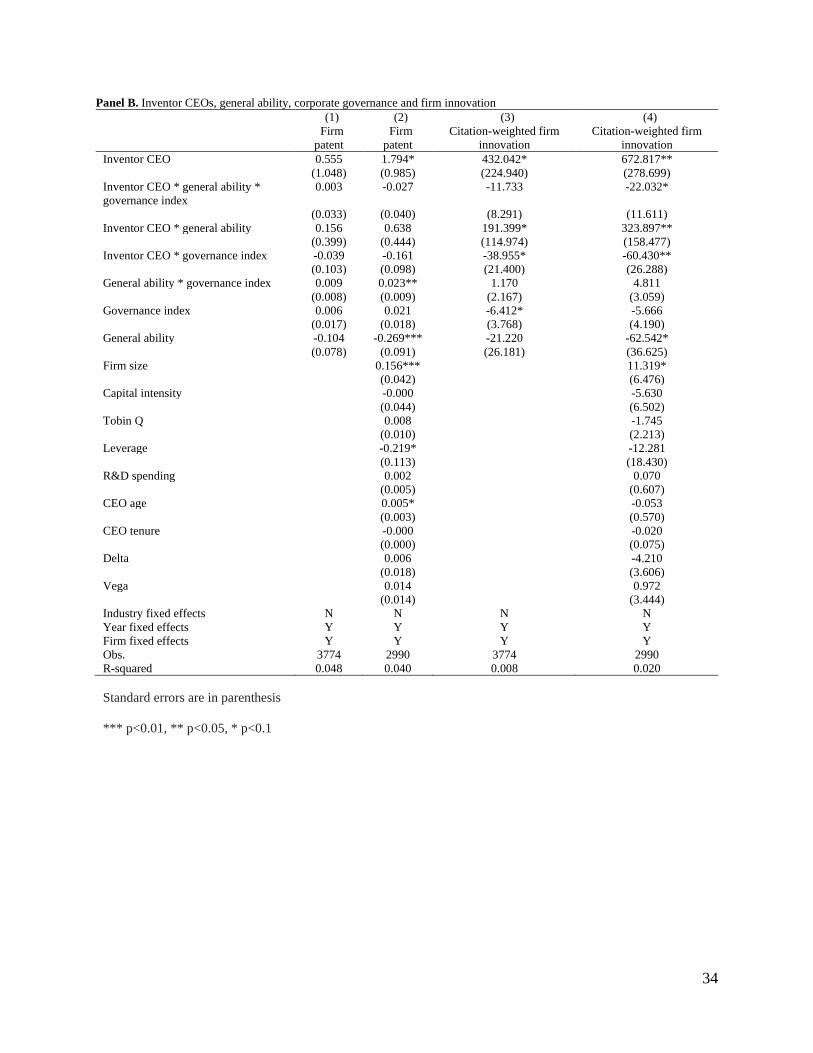
34
Panel B. Inventor CEOs, general ability, corporate governance and firm innovation (1) (2) (3) (4) Firm
patent Firm patent
Citation-weighted firm innovation
Citation-weighted firm innovation
Inventor CEO 0.555 1.794* 432.042* 672.817** (1.048) (0.985) (224.940) (278.699) Inventor CEO * general ability * governance index
0.003 -0.027 -11.733 -22.032*
(0.033) (0.040) (8.291) (11.611) Inventor CEO * general ability 0.156 0.638 191.399* 323.897** (0.399) (0.444) (114.974) (158.477) Inventor CEO * governance index -0.039 -0.161 -38.955* -60.430** (0.103) (0.098) (21.400) (26.288) General ability * governance index 0.009 0.023** 1.170 4.811 (0.008) (0.009) (2.167) (3.059) Governance index 0.006 0.021 -6.412* -5.666 (0.017) (0.018) (3.768) (4.190) General ability -0.104 -0.269*** -21.220 -62.542* (0.078) (0.091) (26.181) (36.625) Firm size 0.156*** 11.319* (0.042) (6.476) Capital intensity -0.000 -5.630 (0.044) (6.502) Tobin Q 0.008 -1.745 (0.010) (2.213) Leverage -0.219* -12.281 (0.113) (18.430) R&D spending 0.002 0.070 (0.005) (0.607) CEO age 0.005* -0.053 (0.003) (0.570) CEO tenure -0.000 -0.020 (0.000) (0.075) Delta 0.006 -4.210 (0.018) (3.606) Vega 0.014 0.972 (0.014) (3.444) Industry fixed effects N N N N Year fixed effects Y Y Y Y Firm fixed effects Y Y Y Y Obs. 3774 2990 3774 2990 R-squared 0.048 0.040 0.008 0.020
Standard errors are in parenthesis
*** p<0.01, ** p<0.05, * p<0.1
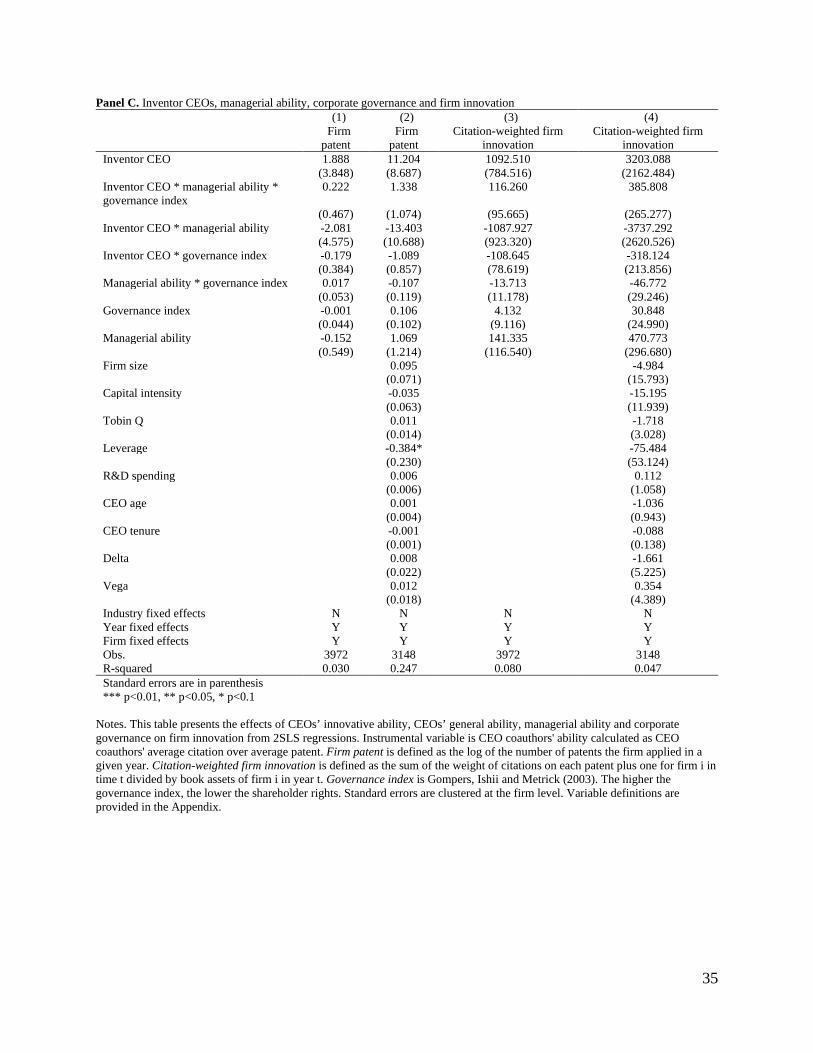
35
Panel C. Inventor CEOs, managerial ability, corporate governance and firm innovation (1) (2) (3) (4) Firm
patent Firm patent
Citation-weighted firm innovation
Citation-weighted firm innovation
Inventor CEO 1.888 11.204 1092.510 3203.088 (3.848) (8.687) (784.516) (2162.484) Inventor CEO * managerial ability * governance index
0.222 1.338 116.260 385.808
(0.467) (1.074) (95.665) (265.277) Inventor CEO * managerial ability -2.081 -13.403 -1087.927 -3737.292 (4.575) (10.688) (923.320) (2620.526) Inventor CEO * governance index -0.179 -1.089 -108.645 -318.124 (0.384) (0.857) (78.619) (213.856) Managerial ability * governance index 0.017 -0.107 -13.713 -46.772 (0.053) (0.119) (11.178) (29.246) Governance index -0.001 0.106 4.132 30.848 (0.044) (0.102) (9.116) (24.990) Managerial ability -0.152 1.069 141.335 470.773 (0.549) (1.214) (116.540) (296.680) Firm size 0.095 -4.984 (0.071) (15.793) Capital intensity -0.035 -15.195 (0.063) (11.939) Tobin Q 0.011 -1.718 (0.014) (3.028) Leverage -0.384* -75.484 (0.230) (53.124) R&D spending 0.006 0.112 (0.006) (1.058) CEO age 0.001 -1.036 (0.004) (0.943) CEO tenure -0.001 -0.088 (0.001) (0.138) Delta 0.008 -1.661 (0.022) (5.225) Vega 0.012 0.354 (0.018) (4.389) Industry fixed effects N N N N Year fixed effects Y Y Y Y Firm fixed effects Y Y Y Y Obs. 3972 3148 3972 3148 R-squared 0.030 0.247 0.080 0.047 Standard errors are in parenthesis *** p<0.01, ** p<0.05, * p<0.1
Notes. This table presents the effects of CEOs’ innovative ability, CEOs’ general ability, managerial ability and corporate governance on firm innovation from 2SLS regressions. Instrumental variable is CEO coauthors' ability calculated as CEO coauthors' average citation over average patent. Firm patent is defined as the log of the number of patents the firm applied in a given year. Citation-weighted firm innovation is defined as the sum of the weight of citations on each patent plus one for firm i in time t divided by book assets of firm i in year t. Governance index is Gompers, Ishii and Metrick (2003). The higher the governance index, the lower the shareholder rights. Standard errors are clustered at the firm level. Variable definitions are provided in the Appendix.
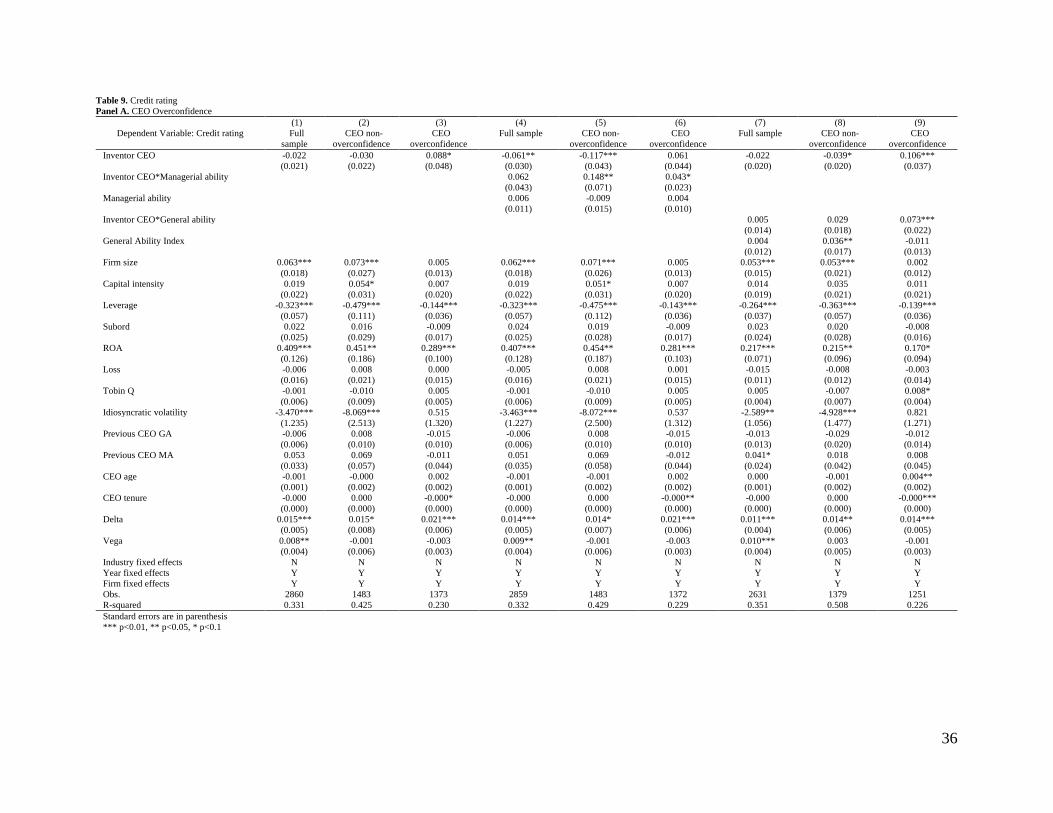
36
Table 9. Credit rating Panel A. CEO Overconfidence
(1) (2) (3) (4) (5) (6) (7) (8) (9) Dependent Variable: Credit rating Full
sample CEO non-
overconfidence CEO
overconfidence Full sample CEO non-
overconfidence CEO
overconfidence Full sample CEO non-
overconfidence CEO
overconfidence Inventor CEO -0.022 -0.030 0.088* -0.061** -0.117*** 0.061 -0.022 -0.039* 0.106*** (0.021) (0.022) (0.048) (0.030) (0.043) (0.044) (0.020) (0.020) (0.037) Inventor CEO*Managerial ability 0.062 0.148** 0.043* (0.043) (0.071) (0.023) Managerial ability 0.006 -0.009 0.004 (0.011) (0.015) (0.010) Inventor CEO*General ability 0.005 0.029 0.073*** (0.014) (0.018) (0.022) General Ability Index 0.004 0.036** -0.011 (0.012) (0.017) (0.013) Firm size 0.063*** 0.073*** 0.005 0.062*** 0.071*** 0.005 0.053*** 0.053*** 0.002 (0.018) (0.027) (0.013) (0.018) (0.026) (0.013) (0.015) (0.021) (0.012) Capital intensity 0.019 0.054* 0.007 0.019 0.051* 0.007 0.014 0.035 0.011 (0.022) (0.031) (0.020) (0.022) (0.031) (0.020) (0.019) (0.021) (0.021) Leverage -0.323*** -0.479*** -0.144*** -0.323*** -0.475*** -0.143*** -0.264*** -0.363*** -0.139*** (0.057) (0.111) (0.036) (0.057) (0.112) (0.036) (0.037) (0.057) (0.036) Subord 0.022 0.016 -0.009 0.024 0.019 -0.009 0.023 0.020 -0.008 (0.025) (0.029) (0.017) (0.025) (0.028) (0.017) (0.024) (0.028) (0.016) ROA 0.409*** 0.451** 0.289*** 0.407*** 0.454** 0.281*** 0.217*** 0.215** 0.170* (0.126) (0.186) (0.100) (0.128) (0.187) (0.103) (0.071) (0.096) (0.094) Loss -0.006 0.008 0.000 -0.005 0.008 0.001 -0.015 -0.008 -0.003 (0.016) (0.021) (0.015) (0.016) (0.021) (0.015) (0.011) (0.012) (0.014) Tobin Q -0.001 -0.010 0.005 -0.001 -0.010 0.005 0.005 -0.007 0.008* (0.006) (0.009) (0.005) (0.006) (0.009) (0.005) (0.004) (0.007) (0.004) Idiosyncratic volatility -3.470*** -8.069*** 0.515 -3.463*** -8.072*** 0.537 -2.589** -4.928*** 0.821 (1.235) (2.513) (1.320) (1.227) (2.500) (1.312) (1.056) (1.477) (1.271) Previous CEO GA -0.006 0.008 -0.015 -0.006 0.008 -0.015 -0.013 -0.029 -0.012 (0.006) (0.010) (0.010) (0.006) (0.010) (0.010) (0.013) (0.020) (0.014) Previous CEO MA 0.053 0.069 -0.011 0.051 0.069 -0.012 0.041* 0.018 0.008 (0.033) (0.057) (0.044) (0.035) (0.058) (0.044) (0.024) (0.042) (0.045) CEO age -0.001 -0.000 0.002 -0.001 -0.001 0.002 0.000 -0.001 0.004** (0.001) (0.002) (0.002) (0.001) (0.002) (0.002) (0.001) (0.002) (0.002) CEO tenure -0.000 0.000 -0.000* -0.000 0.000 -0.000** -0.000 0.000 -0.000*** (0.000) (0.000) (0.000) (0.000) (0.000) (0.000) (0.000) (0.000) (0.000) Delta 0.015*** 0.015* 0.021*** 0.014*** 0.014* 0.021*** 0.011*** 0.014** 0.014*** (0.005) (0.008) (0.006) (0.005) (0.007) (0.006) (0.004) (0.006) (0.005) Vega 0.008** -0.001 -0.003 0.009** -0.001 -0.003 0.010*** 0.003 -0.001 (0.004) (0.006) (0.003) (0.004) (0.006) (0.003) (0.004) (0.005) (0.003) Industry fixed effects N N N N N N N N N Year fixed effects Y Y Y Y Y Y Y Y Y Firm fixed effects Y Y Y Y Y Y Y Y Y Obs. 2860 1483 1373 2859 1483 1372 2631 1379 1251 R-squared 0.331 0.425 0.230 0.332 0.429 0.229 0.351 0.508 0.226 Standard errors are in parenthesis *** p<0.01, ** p<0.05, * p<0.1
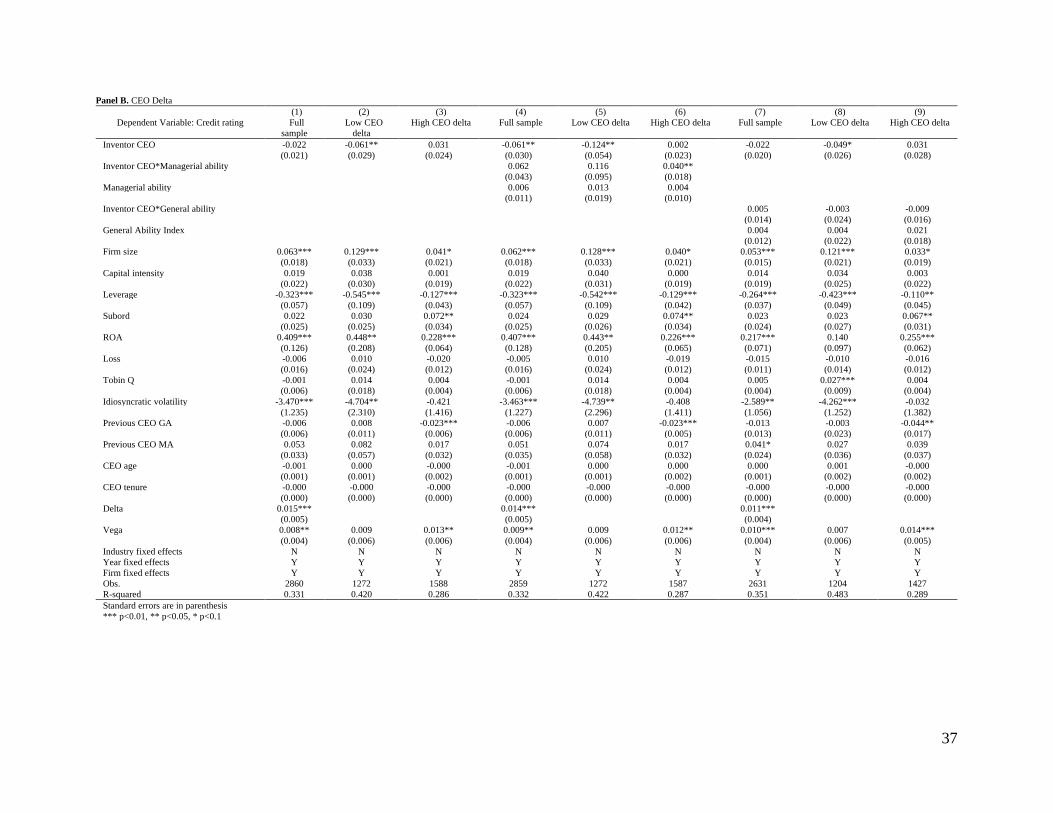
37
Panel B. CEO Delta (1) (2) (3) (4) (5) (6) (7) (8) (9)
Dependent Variable: Credit rating Full sample
Low CEO delta
High CEO delta Full sample Low CEO delta High CEO delta Full sample Low CEO delta High CEO delta
Inventor CEO -0.022 -0.061** 0.031 -0.061** -0.124** 0.002 -0.022 -0.049* 0.031 (0.021) (0.029) (0.024) (0.030) (0.054) (0.023) (0.020) (0.026) (0.028) Inventor CEO*Managerial ability 0.062 0.116 0.040** (0.043) (0.095) (0.018) Managerial ability 0.006 0.013 0.004 (0.011) (0.019) (0.010) Inventor CEO*General ability 0.005 -0.003 -0.009 (0.014) (0.024) (0.016) General Ability Index 0.004 0.004 0.021 (0.012) (0.022) (0.018) Firm size 0.063*** 0.129*** 0.041* 0.062*** 0.128*** 0.040* 0.053*** 0.121*** 0.033* (0.018) (0.033) (0.021) (0.018) (0.033) (0.021) (0.015) (0.021) (0.019) Capital intensity 0.019 0.038 0.001 0.019 0.040 0.000 0.014 0.034 0.003 (0.022) (0.030) (0.019) (0.022) (0.031) (0.019) (0.019) (0.025) (0.022) Leverage -0.323*** -0.545*** -0.127*** -0.323*** -0.542*** -0.129*** -0.264*** -0.423*** -0.110** (0.057) (0.109) (0.043) (0.057) (0.109) (0.042) (0.037) (0.049) (0.045) Subord 0.022 0.030 0.072** 0.024 0.029 0.074** 0.023 0.023 0.067** (0.025) (0.025) (0.034) (0.025) (0.026) (0.034) (0.024) (0.027) (0.031) ROA 0.409*** 0.448** 0.228*** 0.407*** 0.443** 0.226*** 0.217*** 0.140 0.255*** (0.126) (0.208) (0.064) (0.128) (0.205) (0.065) (0.071) (0.097) (0.062) Loss -0.006 0.010 -0.020 -0.005 0.010 -0.019 -0.015 -0.010 -0.016 (0.016) (0.024) (0.012) (0.016) (0.024) (0.012) (0.011) (0.014) (0.012) Tobin Q -0.001 0.014 0.004 -0.001 0.014 0.004 0.005 0.027*** 0.004 (0.006) (0.018) (0.004) (0.006) (0.018) (0.004) (0.004) (0.009) (0.004) Idiosyncratic volatility -3.470*** -4.704** -0.421 -3.463*** -4.739** -0.408 -2.589** -4.262*** -0.032 (1.235) (2.310) (1.416) (1.227) (2.296) (1.411) (1.056) (1.252) (1.382) Previous CEO GA -0.006 0.008 -0.023*** -0.006 0.007 -0.023*** -0.013 -0.003 -0.044** (0.006) (0.011) (0.006) (0.006) (0.011) (0.005) (0.013) (0.023) (0.017) Previous CEO MA 0.053 0.082 0.017 0.051 0.074 0.017 0.041* 0.027 0.039 (0.033) (0.057) (0.032) (0.035) (0.058) (0.032) (0.024) (0.036) (0.037) CEO age -0.001 0.000 -0.000 -0.001 0.000 0.000 0.000 0.001 -0.000 (0.001) (0.001) (0.002) (0.001) (0.001) (0.002) (0.001) (0.002) (0.002) CEO tenure -0.000 -0.000 -0.000 -0.000 -0.000 -0.000 -0.000 -0.000 -0.000 (0.000) (0.000) (0.000) (0.000) (0.000) (0.000) (0.000) (0.000) (0.000) Delta 0.015*** 0.014*** 0.011*** (0.005) (0.005) (0.004) Vega 0.008** 0.009 0.013** 0.009** 0.009 0.012** 0.010*** 0.007 0.014*** (0.004) (0.006) (0.006) (0.004) (0.006) (0.006) (0.004) (0.006) (0.005) Industry fixed effects N N N N N N N N N Year fixed effects Y Y Y Y Y Y Y Y Y Firm fixed effects Y Y Y Y Y Y Y Y Y Obs. 2860 1272 1588 2859 1272 1587 2631 1204 1427 R-squared 0.331 0.420 0.286 0.332 0.422 0.287 0.351 0.483 0.289 Standard errors are in parenthesis *** p<0.01, ** p<0.05, * p<0.1
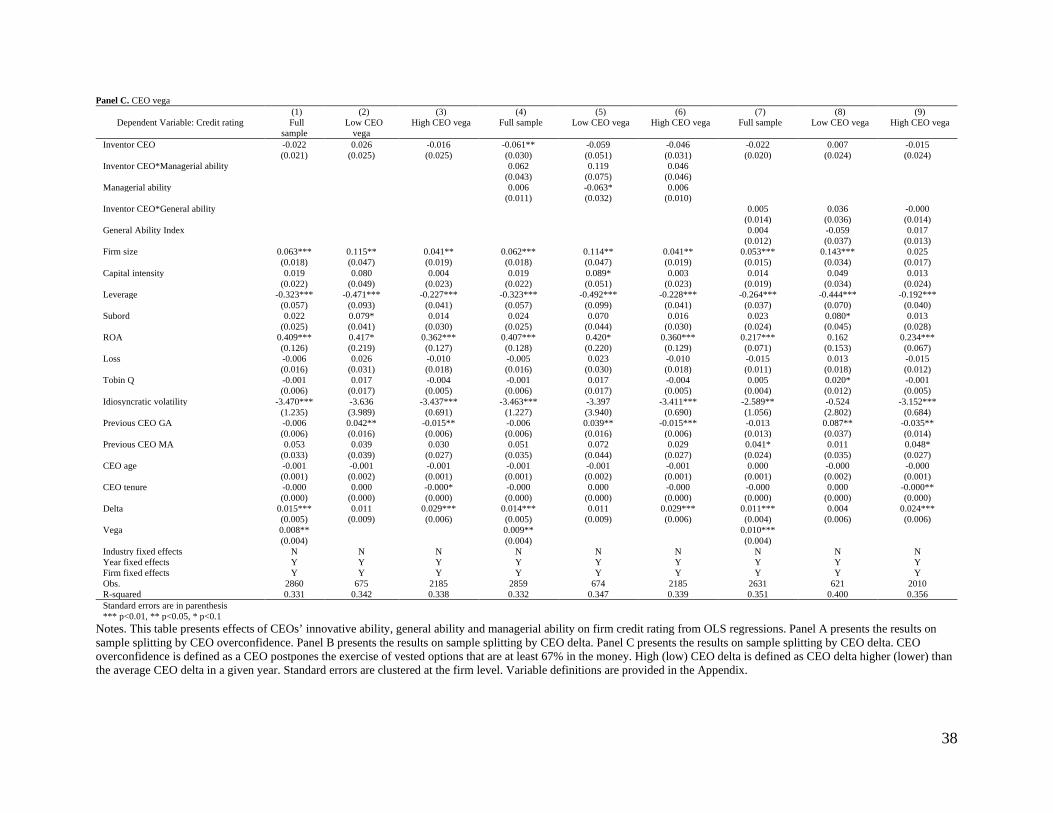
38
Panel C. CEO vega (1) (2) (3) (4) (5) (6) (7) (8) (9)
Dependent Variable: Credit rating Full sample
Low CEO vega
High CEO vega Full sample Low CEO vega High CEO vega Full sample Low CEO vega High CEO vega
Inventor CEO -0.022 0.026 -0.016 -0.061** -0.059 -0.046 -0.022 0.007 -0.015 (0.021) (0.025) (0.025) (0.030) (0.051) (0.031) (0.020) (0.024) (0.024) Inventor CEO*Managerial ability 0.062 0.119 0.046 (0.043) (0.075) (0.046) Managerial ability 0.006 -0.063* 0.006 (0.011) (0.032) (0.010) Inventor CEO*General ability 0.005 0.036 -0.000 (0.014) (0.036) (0.014) General Ability Index 0.004 -0.059 0.017 (0.012) (0.037) (0.013) Firm size 0.063*** 0.115** 0.041** 0.062*** 0.114** 0.041** 0.053*** 0.143*** 0.025 (0.018) (0.047) (0.019) (0.018) (0.047) (0.019) (0.015) (0.034) (0.017) Capital intensity 0.019 0.080 0.004 0.019 0.089* 0.003 0.014 0.049 0.013 (0.022) (0.049) (0.023) (0.022) (0.051) (0.023) (0.019) (0.034) (0.024) Leverage -0.323*** -0.471*** -0.227*** -0.323*** -0.492*** -0.228*** -0.264*** -0.444*** -0.192*** (0.057) (0.093) (0.041) (0.057) (0.099) (0.041) (0.037) (0.070) (0.040) Subord 0.022 0.079* 0.014 0.024 0.070 0.016 0.023 0.080* 0.013 (0.025) (0.041) (0.030) (0.025) (0.044) (0.030) (0.024) (0.045) (0.028) ROA 0.409*** 0.417* 0.362*** 0.407*** 0.420* 0.360*** 0.217*** 0.162 0.234*** (0.126) (0.219) (0.127) (0.128) (0.220) (0.129) (0.071) (0.153) (0.067) Loss -0.006 0.026 -0.010 -0.005 0.023 -0.010 -0.015 0.013 -0.015 (0.016) (0.031) (0.018) (0.016) (0.030) (0.018) (0.011) (0.018) (0.012) Tobin Q -0.001 0.017 -0.004 -0.001 0.017 -0.004 0.005 0.020* -0.001 (0.006) (0.017) (0.005) (0.006) (0.017) (0.005) (0.004) (0.012) (0.005) Idiosyncratic volatility -3.470*** -3.636 -3.437*** -3.463*** -3.397 -3.411*** -2.589** -0.524 -3.152*** (1.235) (3.989) (0.691) (1.227) (3.940) (0.690) (1.056) (2.802) (0.684) Previous CEO GA -0.006 0.042** -0.015** -0.006 0.039** -0.015*** -0.013 0.087** -0.035** (0.006) (0.016) (0.006) (0.006) (0.016) (0.006) (0.013) (0.037) (0.014) Previous CEO MA 0.053 0.039 0.030 0.051 0.072 0.029 0.041* 0.011 0.048* (0.033) (0.039) (0.027) (0.035) (0.044) (0.027) (0.024) (0.035) (0.027) CEO age -0.001 -0.001 -0.001 -0.001 -0.001 -0.001 0.000 -0.000 -0.000 (0.001) (0.002) (0.001) (0.001) (0.002) (0.001) (0.001) (0.002) (0.001) CEO tenure -0.000 0.000 -0.000* -0.000 0.000 -0.000 -0.000 0.000 -0.000** (0.000) (0.000) (0.000) (0.000) (0.000) (0.000) (0.000) (0.000) (0.000) Delta 0.015*** 0.011 0.029*** 0.014*** 0.011 0.029*** 0.011*** 0.004 0.024*** (0.005) (0.009) (0.006) (0.005) (0.009) (0.006) (0.004) (0.006) (0.006) Vega 0.008** 0.009** 0.010*** (0.004) (0.004) (0.004) Industry fixed effects N N N N N N N N N Year fixed effects Y Y Y Y Y Y Y Y Y Firm fixed effects Y Y Y Y Y Y Y Y Y Obs. 2860 675 2185 2859 674 2185 2631 621 2010 R-squared 0.331 0.342 0.338 0.332 0.347 0.339 0.351 0.400 0.356 Standard errors are in parenthesis *** p<0.01, ** p<0.05, * p<0.1
Notes. This table presents effects of CEOs’ innovative ability, general ability and managerial ability on firm credit rating from OLS regressions. Panel A presents the results on sample splitting by CEO overconfidence. Panel B presents the results on sample splitting by CEO delta. Panel C presents the results on sample splitting by CEO delta. CEO overconfidence is defined as a CEO postpones the exercise of vested options that are at least 67% in the money. High (low) CEO delta is defined as CEO delta higher (lower) than the average CEO delta in a given year. Standard errors are clustered at the firm level. Variable definitions are provided in the Appendix.
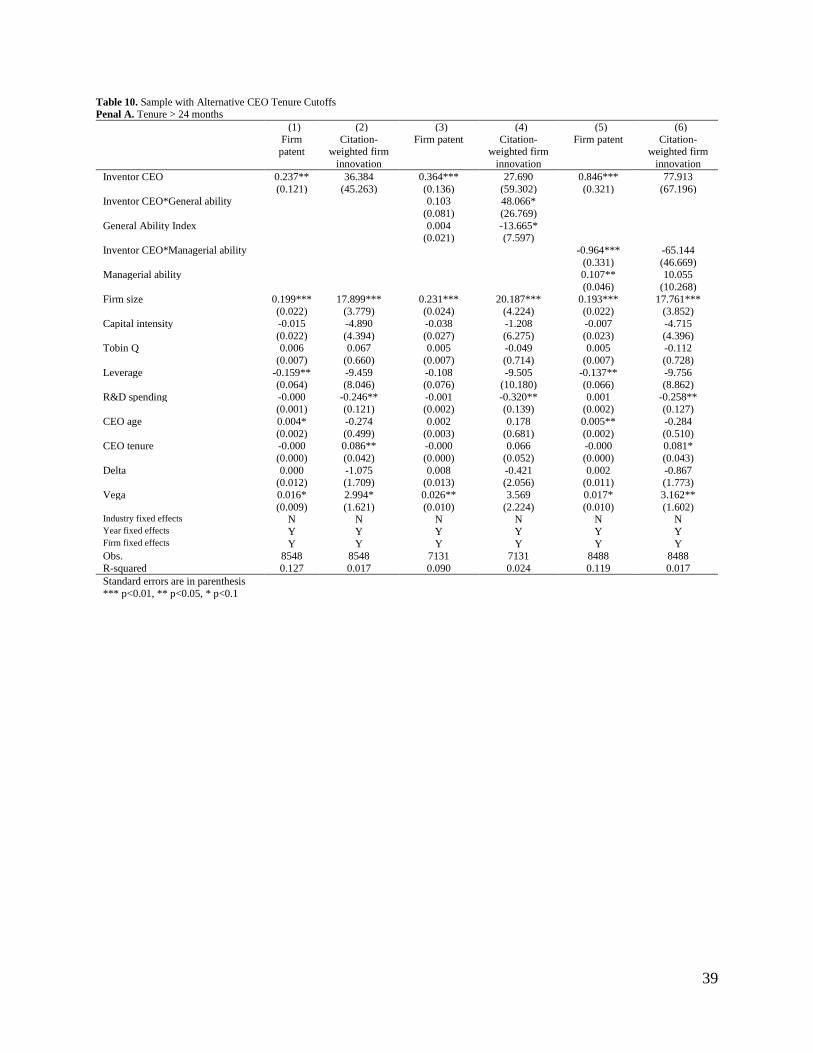
39
Table 10. Sample with Alternative CEO Tenure Cutoffs Penal A. Tenure > 24 months
(1) (2) (3) (4) (5) (6) Firm
patent Citation-
weighted firm innovation
Firm patent Citation-weighted firm
innovation
Firm patent Citation-weighted firm
innovation Inventor CEO 0.237** 36.384 0.364*** 27.690 0.846*** 77.913 (0.121) (45.263) (0.136) (59.302) (0.321) (67.196) Inventor CEO*General ability 0.103 48.066* (0.081) (26.769) General Ability Index 0.004 -13.665* (0.021) (7.597) Inventor CEO*Managerial ability -0.964*** -65.144 (0.331) (46.669) Managerial ability 0.107** 10.055 (0.046) (10.268) Firm size 0.199*** 17.899*** 0.231*** 20.187*** 0.193*** 17.761*** (0.022) (3.779) (0.024) (4.224) (0.022) (3.852) Capital intensity -0.015 -4.890 -0.038 -1.208 -0.007 -4.715 (0.022) (4.394) (0.027) (6.275) (0.023) (4.396) Tobin Q 0.006 0.067 0.005 -0.049 0.005 -0.112 (0.007) (0.660) (0.007) (0.714) (0.007) (0.728) Leverage -0.159** -9.459 -0.108 -9.505 -0.137** -9.756 (0.064) (8.046) (0.076) (10.180) (0.066) (8.862) R&D spending -0.000 -0.246** -0.001 -0.320** 0.001 -0.258** (0.001) (0.121) (0.002) (0.139) (0.002) (0.127) CEO age 0.004* -0.274 0.002 0.178 0.005** -0.284 (0.002) (0.499) (0.003) (0.681) (0.002) (0.510) CEO tenure -0.000 0.086** -0.000 0.066 -0.000 0.081* (0.000) (0.042) (0.000) (0.052) (0.000) (0.043) Delta 0.000 -1.075 0.008 -0.421 0.002 -0.867 (0.012) (1.709) (0.013) (2.056) (0.011) (1.773) Vega 0.016* 2.994* 0.026** 3.569 0.017* 3.162** (0.009) (1.621) (0.010) (2.224) (0.010) (1.602) Industry fixed effects N N N N N N Year fixed effects Y Y Y Y Y Y Firm fixed effects Y Y Y Y Y Y Obs. 8548 8548 7131 7131 8488 8488 R-squared 0.127 0.017 0.090 0.024 0.119 0.017 Standard errors are in parenthesis *** p<0.01, ** p<0.05, * p<0.1
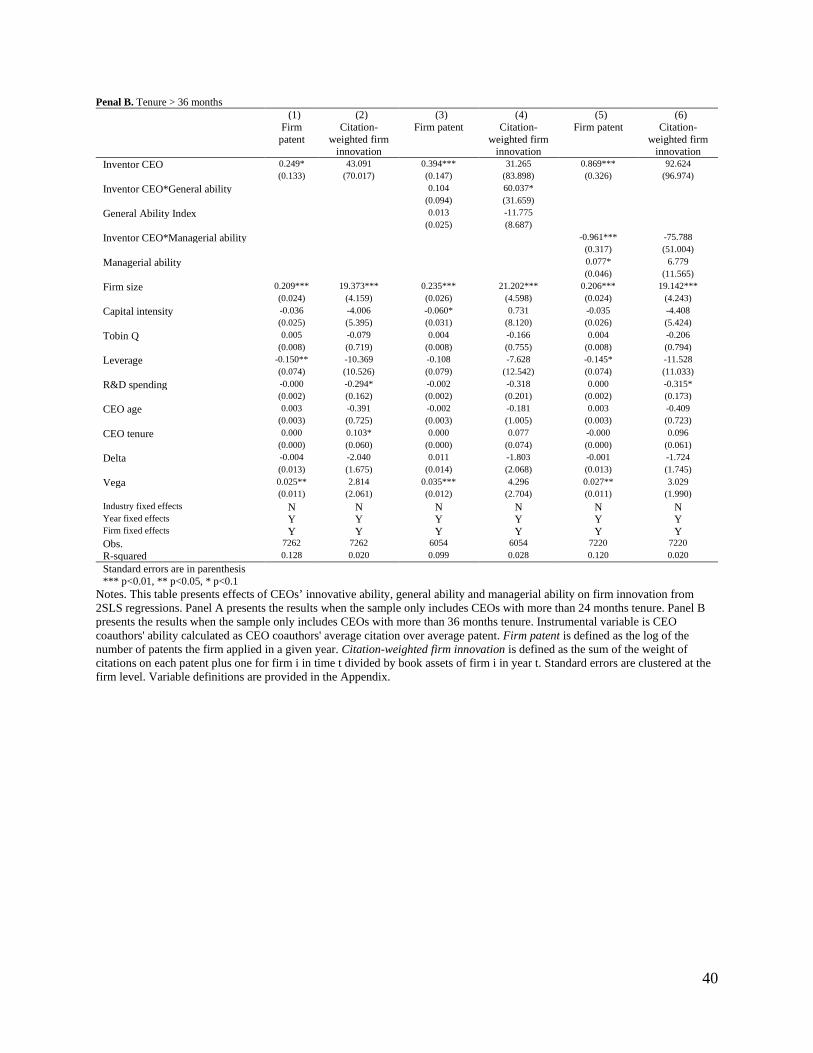
40
Penal B. Tenure > 36 months (1) (2) (3) (4) (5) (6) Firm
patent Citation-
weighted firm innovation
Firm patent Citation-weighted firm
innovation
Firm patent Citation-weighted firm
innovation Inventor CEO 0.249* 43.091 0.394*** 31.265 0.869*** 92.624 (0.133) (70.017) (0.147) (83.898) (0.326) (96.974) Inventor CEO*General ability 0.104 60.037* (0.094) (31.659) General Ability Index 0.013 -11.775 (0.025) (8.687) Inventor CEO*Managerial ability -0.961*** -75.788 (0.317) (51.004) Managerial ability 0.077* 6.779 (0.046) (11.565) Firm size 0.209*** 19.373*** 0.235*** 21.202*** 0.206*** 19.142*** (0.024) (4.159) (0.026) (4.598) (0.024) (4.243) Capital intensity -0.036 -4.006 -0.060* 0.731 -0.035 -4.408 (0.025) (5.395) (0.031) (8.120) (0.026) (5.424) Tobin Q 0.005 -0.079 0.004 -0.166 0.004 -0.206 (0.008) (0.719) (0.008) (0.755) (0.008) (0.794) Leverage -0.150** -10.369 -0.108 -7.628 -0.145* -11.528 (0.074) (10.526) (0.079) (12.542) (0.074) (11.033) R&D spending -0.000 -0.294* -0.002 -0.318 0.000 -0.315* (0.002) (0.162) (0.002) (0.201) (0.002) (0.173) CEO age 0.003 -0.391 -0.002 -0.181 0.003 -0.409 (0.003) (0.725) (0.003) (1.005) (0.003) (0.723) CEO tenure 0.000 0.103* 0.000 0.077 -0.000 0.096 (0.000) (0.060) (0.000) (0.074) (0.000) (0.061) Delta -0.004 -2.040 0.011 -1.803 -0.001 -1.724 (0.013) (1.675) (0.014) (2.068) (0.013) (1.745) Vega 0.025** 2.814 0.035*** 4.296 0.027** 3.029 (0.011) (2.061) (0.012) (2.704) (0.011) (1.990) Industry fixed effects N N N N N N Year fixed effects Y Y Y Y Y Y Firm fixed effects Y Y Y Y Y Y Obs. 7262 7262 6054 6054 7220 7220 R-squared 0.128 0.020 0.099 0.028 0.120 0.020 Standard errors are in parenthesis *** p<0.01, ** p<0.05, * p<0.1
Notes. This table presents effects of CEOs’ innovative ability, general ability and managerial ability on firm innovation from 2SLS regressions. Panel A presents the results when the sample only includes CEOs with more than 24 months tenure. Panel B presents the results when the sample only includes CEOs with more than 36 months tenure. Instrumental variable is CEO coauthors' ability calculated as CEO coauthors' average citation over average patent. Firm patent is defined as the log of the number of patents the firm applied in a given year. Citation-weighted firm innovation is defined as the sum of the weight of citations on each patent plus one for firm i in time t divided by book assets of firm i in year t. Standard errors are clustered at the firm level. Variable definitions are provided in the Appendix.
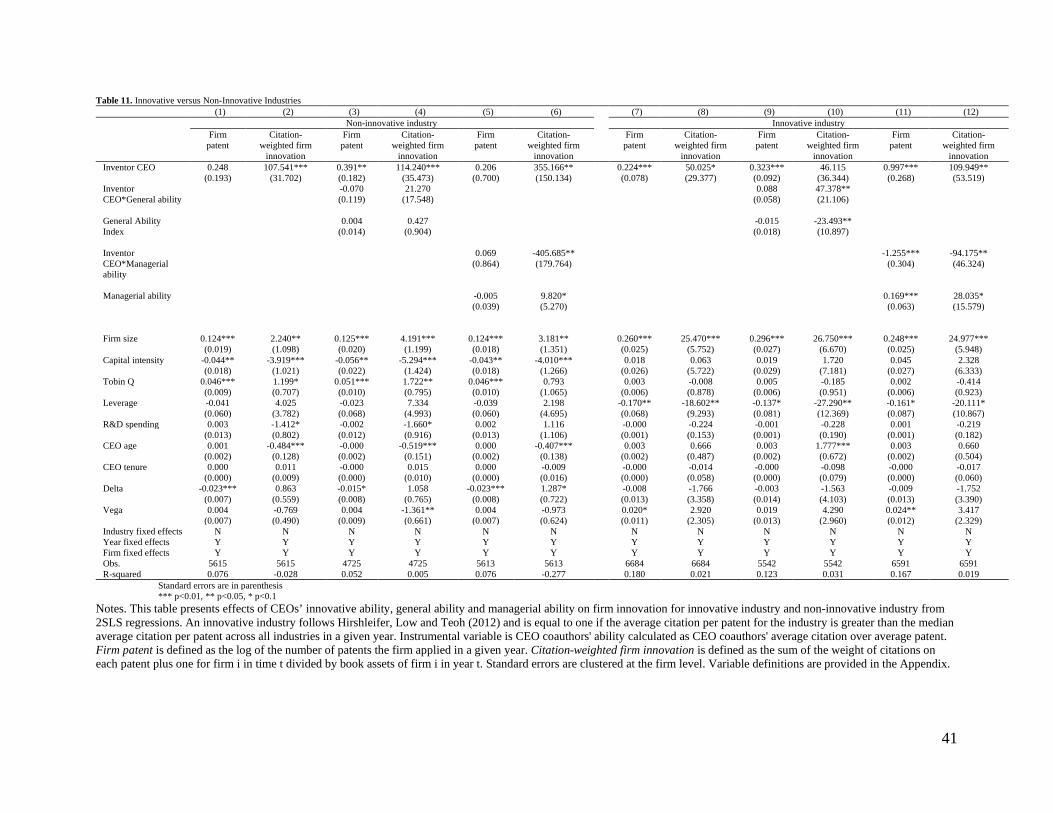
41
Table 11. Innovative versus Non-Innovative Industries (1) (2) (3) (4) (5) (6) (7) (8) (9) (10) (11) (12) Non-innovative industry Innovative industry Firm
patent Citation-
weighted firm innovation
Firm patent
Citation-weighted firm
innovation
Firm patent
Citation-weighted firm
innovation
Firm patent
Citation-weighted firm
innovation
Firm patent
Citation-weighted firm
innovation
Firm patent
Citation-weighted firm
innovation Inventor CEO 0.248 107.541*** 0.391** 114.240*** 0.206 355.166** 0.224*** 50.025* 0.323*** 46.115 0.997*** 109.949** (0.193) (31.702) (0.182) (35.473) (0.700) (150.134) (0.078) (29.377) (0.092) (36.344) (0.268) (53.519) Inventor CEO*General ability
-0.070 21.270 0.088 47.378** (0.119) (17.548) (0.058) (21.106)
General Ability Index
0.004 0.427 -0.015 -23.493** (0.014) (0.904) (0.018) (10.897)
Inventor CEO*Managerial ability
0.069 -405.685** -1.255*** -94.175** (0.864) (179.764) (0.304) (46.324)
Managerial ability -0.005 9.820* 0.169*** 28.035* (0.039) (5.270) (0.063) (15.579) Firm size 0.124*** 2.240** 0.125*** 4.191*** 0.124*** 3.181** 0.260*** 25.470*** 0.296*** 26.750*** 0.248*** 24.977*** (0.019) (1.098) (0.020) (1.199) (0.018) (1.351) (0.025) (5.752) (0.027) (6.670) (0.025) (5.948) Capital intensity -0.044** -3.919*** -0.056** -5.294*** -0.043** -4.010*** 0.018 0.063 0.019 1.720 0.045 2.328 (0.018) (1.021) (0.022) (1.424) (0.018) (1.266) (0.026) (5.722) (0.029) (7.181) (0.027) (6.333) Tobin Q 0.046*** 1.199* 0.051*** 1.722** 0.046*** 0.793 0.003 -0.008 0.005 -0.185 0.002 -0.414 (0.009) (0.707) (0.010) (0.795) (0.010) (1.065) (0.006) (0.878) (0.006) (0.951) (0.006) (0.923) Leverage -0.041 4.025 -0.023 7.334 -0.039 2.198 -0.170** -18.602** -0.137* -27.290** -0.161* -20.111* (0.060) (3.782) (0.068) (4.993) (0.060) (4.695) (0.068) (9.293) (0.081) (12.369) (0.087) (10.867) R&D spending 0.003 -1.412* -0.002 -1.660* 0.002 1.116 -0.000 -0.224 -0.001 -0.228 0.001 -0.219 (0.013) (0.802) (0.012) (0.916) (0.013) (1.106) (0.001) (0.153) (0.001) (0.190) (0.001) (0.182) CEO age 0.001 -0.484*** -0.000 -0.519*** 0.000 -0.407*** 0.003 0.666 0.003 1.777*** 0.003 0.660 (0.002) (0.128) (0.002) (0.151) (0.002) (0.138) (0.002) (0.487) (0.002) (0.672) (0.002) (0.504) CEO tenure 0.000 0.011 -0.000 0.015 0.000 -0.009 -0.000 -0.014 -0.000 -0.098 -0.000 -0.017 (0.000) (0.009) (0.000) (0.010) (0.000) (0.016) (0.000) (0.058) (0.000) (0.079) (0.000) (0.060) Delta -0.023*** 0.863 -0.015* 1.058 -0.023*** 1.287* -0.008 -1.766 -0.003 -1.563 -0.009 -1.752 (0.007) (0.559) (0.008) (0.765) (0.008) (0.722) (0.013) (3.358) (0.014) (4.103) (0.013) (3.390) Vega 0.004 -0.769 0.004 -1.361** 0.004 -0.973 0.020* 2.920 0.019 4.290 0.024** 3.417 (0.007) (0.490) (0.009) (0.661) (0.007) (0.624) (0.011) (2.305) (0.013) (2.960) (0.012) (2.329) Industry fixed effects N N N N N N N N N N N N Year fixed effects Y Y Y Y Y Y Y Y Y Y Y Y Firm fixed effects Y Y Y Y Y Y Y Y Y Y Y Y Obs. 5615 5615 4725 4725 5613 5613 6684 6684 5542 5542 6591 6591 R-squared 0.076 -0.028 0.052 0.005 0.076 -0.277 0.180 0.021 0.123 0.031 0.167 0.019 Standard errors are in parenthesis *** p<0.01, ** p<0.05, * p<0.1
Notes. This table presents effects of CEOs’ innovative ability, general ability and managerial ability on firm innovation for innovative industry and non-innovative industry from 2SLS regressions. An innovative industry follows Hirshleifer, Low and Teoh (2012) and is equal to one if the average citation per patent for the industry is greater than the median average citation per patent across all industries in a given year. Instrumental variable is CEO coauthors' ability calculated as CEO coauthors' average citation over average patent. Firm patent is defined as the log of the number of patents the firm applied in a given year. Citation-weighted firm innovation is defined as the sum of the weight of citations on each patent plus one for firm i in time t divided by book assets of firm i in year t. Standard errors are clustered at the firm level. Variable definitions are provided in the Appendix.
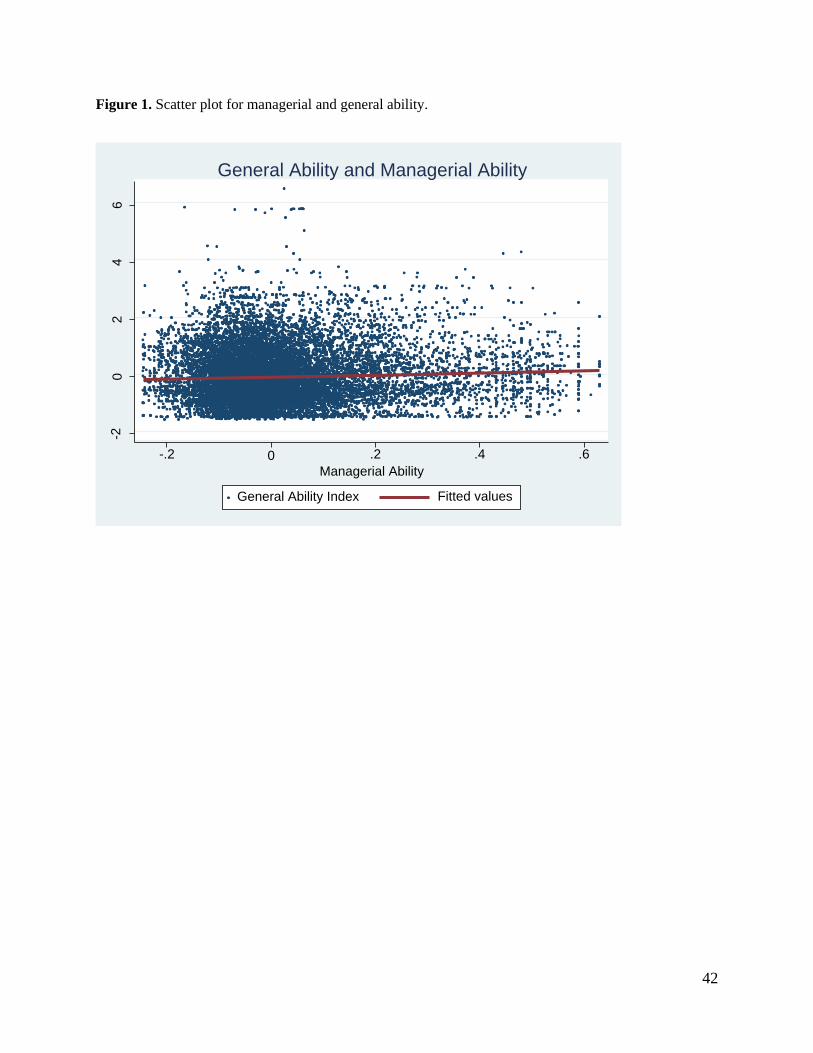
42
Figure 1. Scatter plot for managerial and general ability.
-20
24
6
-.2 0 .2 .4 .6Managerial Ability
General Ability Index Fitted values
General Ability and Managerial Ability
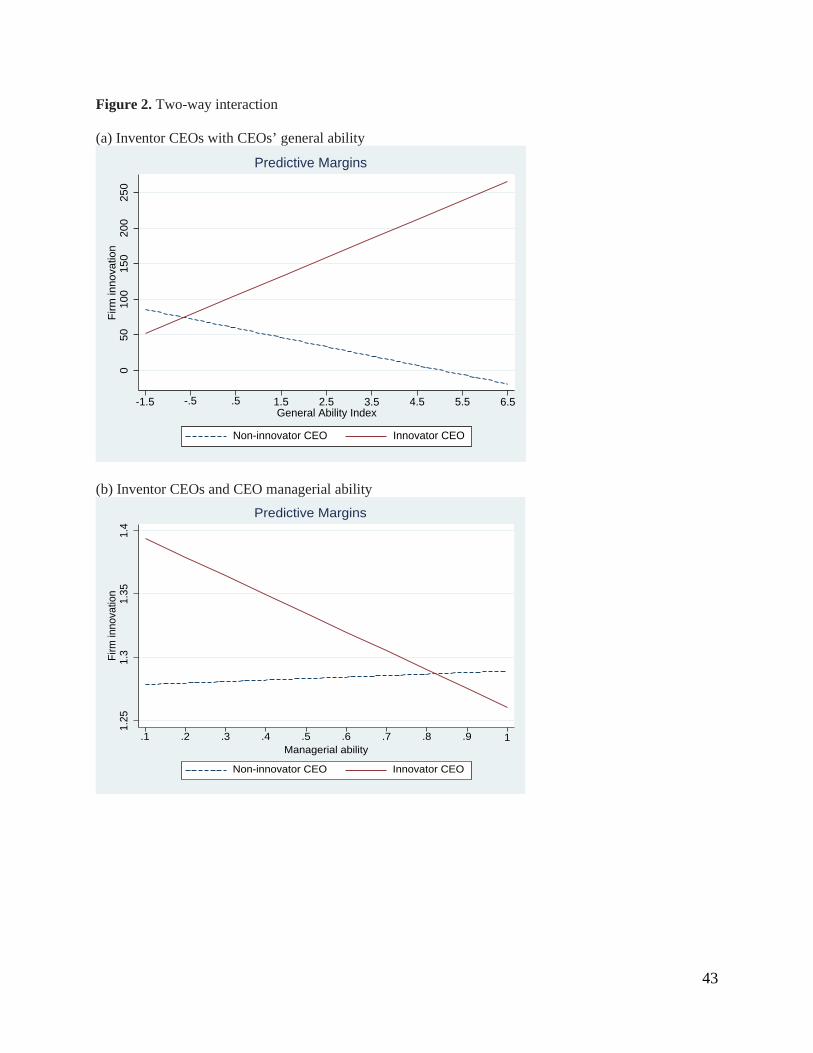
43
Figure 2. Two-way interaction (a) Inventor CEOs with CEOs’ general ability
(b) Inventor CEOs and CEO managerial ability
050
100
150
200
250
Firm
inno
vatio
n
-1.5 -.5 .5 1.5 2.5 3.5 4.5 5.5 6.5General Ability Index
Non-innovator CEO Innovator CEO
Predictive Margins
1.25
1.3
1.35
1.4
Firm
inno
vatio
n
.1 .2 .3 .4 .5 .6 .7 .8 .9 1Managerial ability
Non-innovator CEO Innovator CEO
Predictive Margins
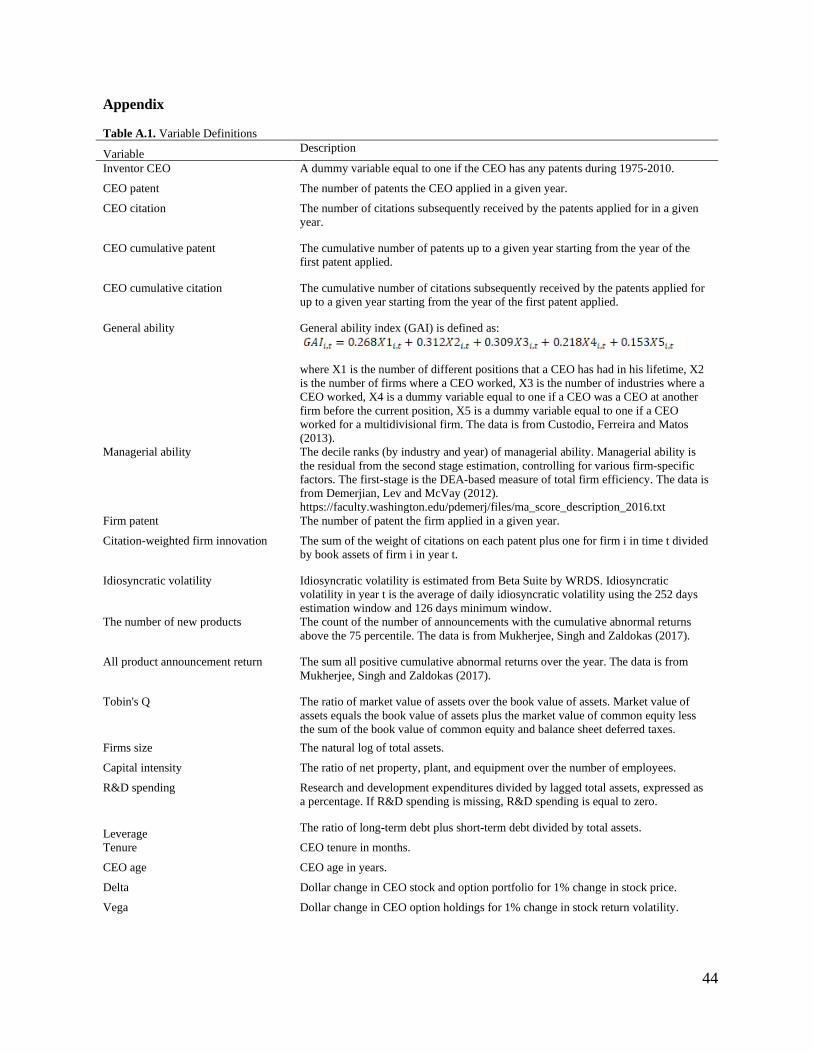
44
Appendix Table A.1. Variable Definitions
Variable Description
Inventor CEO A dummy variable equal to one if the CEO has any patents during 1975-2010.
CEO patent The number of patents the CEO applied in a given year.
CEO citation The number of citations subsequently received by the patents applied for in a given year.
CEO cumulative patent The cumulative number of patents up to a given year starting from the year of the first patent applied.
CEO cumulative citation The cumulative number of citations subsequently received by the patents applied for up to a given year starting from the year of the first patent applied.
General ability General ability index (GAI) is defined as:
where X1 is the number of different positions that a CEO has had in his lifetime, X2 is the number of firms where a CEO worked, X3 is the number of industries where a CEO worked, X4 is a dummy variable equal to one if a CEO was a CEO at another firm before the current position, X5 is a dummy variable equal to one if a CEO worked for a multidivisional firm. The data is from Custodio, Ferreira and Matos (2013).
Managerial ability The decile ranks (by industry and year) of managerial ability. Managerial ability is the residual from the second stage estimation, controlling for various firm-specific factors. The first-stage is the DEA-based measure of total firm efficiency. The data is from Demerjian, Lev and McVay (2012). https://faculty.washington.edu/pdemerj/files/ma_score_description_2016.txt
Firm patent The number of patent the firm applied in a given year.
Citation-weighted firm innovation The sum of the weight of citations on each patent plus one for firm i in time t divided by book assets of firm i in year t.
Idiosyncratic volatility Idiosyncratic volatility is estimated from Beta Suite by WRDS. Idiosyncratic volatility in year t is the average of daily idiosyncratic volatility using the 252 days estimation window and 126 days minimum window.
The number of new products The count of the number of announcements with the cumulative abnormal returns above the 75 percentile. The data is from Mukherjee, Singh and Zaldokas (2017).
All product announcement return The sum all positive cumulative abnormal returns over the year. The data is from Mukherjee, Singh and Zaldokas (2017).
Tobin's Q The ratio of market value of assets over the book value of assets. Market value of assets equals the book value of assets plus the market value of common equity less the sum of the book value of common equity and balance sheet deferred taxes.
Firms size The natural log of total assets.
Capital intensity The ratio of net property, plant, and equipment over the number of employees.
R&D spending Research and development expenditures divided by lagged total assets, expressed as a percentage. If R&D spending is missing, R&D spending is equal to zero.
Leverage The ratio of long-term debt plus short-term debt divided by total assets.
Tenure CEO tenure in months.
CEO age CEO age in years.
Delta Dollar change in CEO stock and option portfolio for 1% change in stock price.
Vega Dollar change in CEO option holdings for 1% change in stock return volatility.
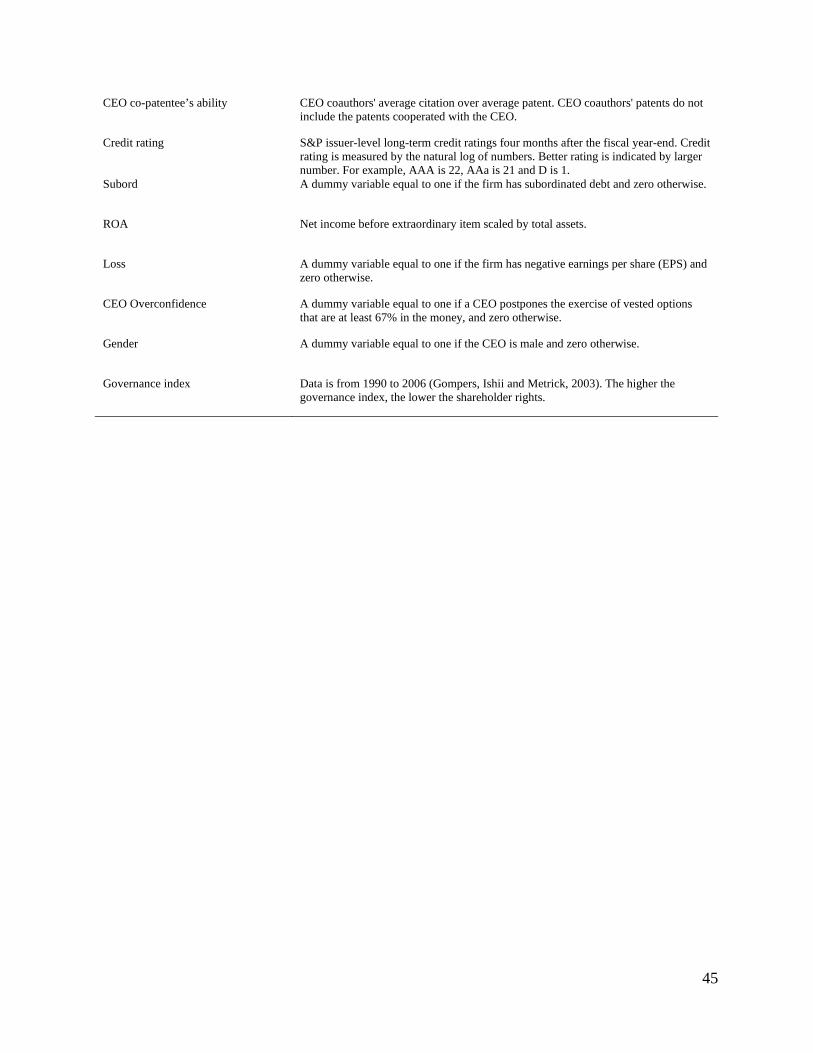
45
CEO co-patentee’s ability CEO coauthors' average citation over average patent. CEO coauthors' patents do not include the patents cooperated with the CEO.
Credit rating S&P issuer-level long-term credit ratings four months after the fiscal year-end. Credit rating is measured by the natural log of numbers. Better rating is indicated by larger number. For example, AAA is 22, AAa is 21 and D is 1.
Subord A dummy variable equal to one if the firm has subordinated debt and zero otherwise.
ROA Net income before extraordinary item scaled by total assets.
Loss A dummy variable equal to one if the firm has negative earnings per share (EPS) and zero otherwise.
CEO Overconfidence A dummy variable equal to one if a CEO postpones the exercise of vested options that are at least 67% in the money, and zero otherwise.
Gender A dummy variable equal to one if the CEO is male and zero otherwise.
Governance index Data is from 1990 to 2006 (Gompers, Ishii and Metrick, 2003). The higher the governance index, the lower the shareholder rights.
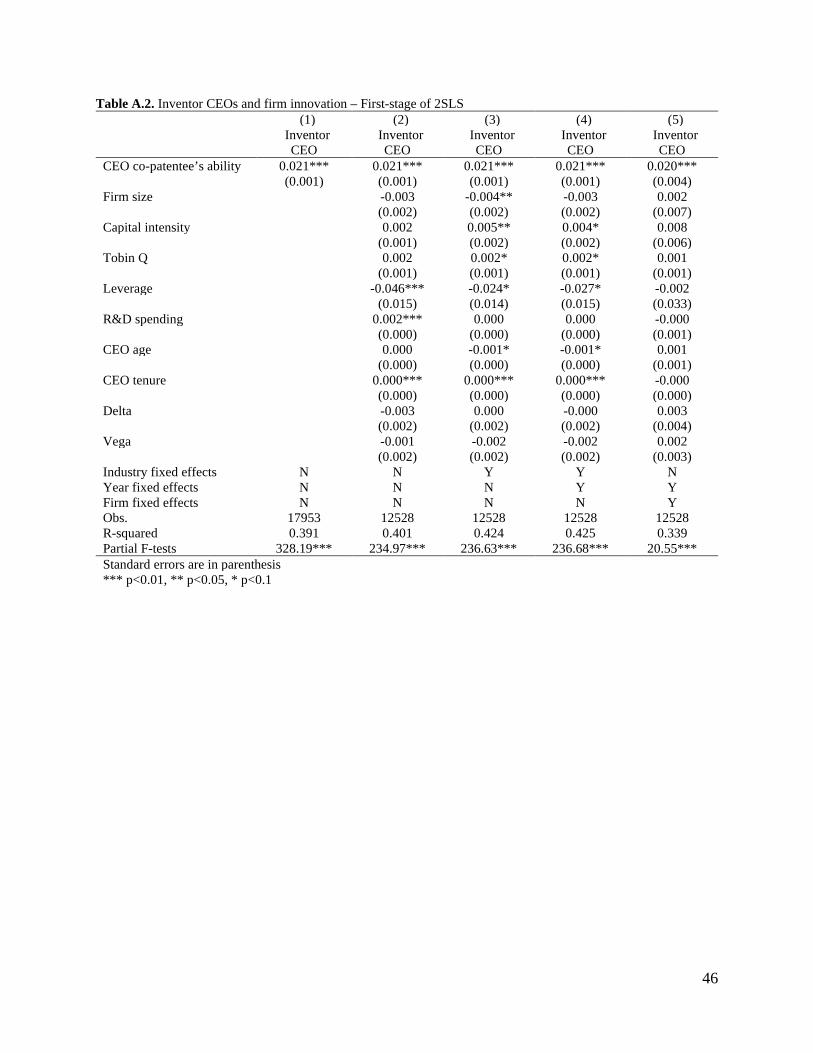
46
Table A.2. Inventor CEOs and firm innovation – First-stage of 2SLS (1) (2) (3) (4) (5) Inventor
CEO Inventor
CEO Inventor
CEO Inventor
CEO Inventor
CEO CEO co-patentee’s ability 0.021*** 0.021*** 0.021*** 0.021*** 0.020*** (0.001) (0.001) (0.001) (0.001) (0.004) Firm size -0.003 -0.004** -0.003 0.002 (0.002) (0.002) (0.002) (0.007) Capital intensity 0.002 0.005** 0.004* 0.008 (0.001) (0.002) (0.002) (0.006) Tobin Q 0.002 0.002* 0.002* 0.001 (0.001) (0.001) (0.001) (0.001) Leverage -0.046*** -0.024* -0.027* -0.002 (0.015) (0.014) (0.015) (0.033) R&D spending 0.002*** 0.000 0.000 -0.000 (0.000) (0.000) (0.000) (0.001) CEO age 0.000 -0.001* -0.001* 0.001 (0.000) (0.000) (0.000) (0.001) CEO tenure 0.000*** 0.000*** 0.000*** -0.000 (0.000) (0.000) (0.000) (0.000) Delta -0.003 0.000 -0.000 0.003 (0.002) (0.002) (0.002) (0.004) Vega -0.001 -0.002 -0.002 0.002 (0.002) (0.002) (0.002) (0.003) Industry fixed effects N N Y Y N Year fixed effects N N N Y Y Firm fixed effects N N N N Y Obs. 17953 12528 12528 12528 12528 R-squared 0.391 0.401 0.424 0.425 0.339 Partial F-tests 328.19*** 234.97*** 236.63*** 236.68*** 20.55*** Standard errors are in parenthesis *** p<0.01, ** p<0.05, * p<0.1