Embed Size (px)
Citation preview

2.4 THE VALUE OF ECOSYSTEM SERVICES FOR RECREATION
330
INTRODUCTIONRecreation is one of the ecosystem services identifi ed by the
UN’s Millennium Ecosystem Assessment (2005), and covers the ‘free services’ of natural capital in providing ‘infrastructure’ for recreational pursuits. It is an important cultural service, but there is little quantitative data on its value in New Zealand.
In recent decades New Zealand has witnessed a rapid expan-sion of participation in outdoor recreation, particularly those forms based on satisfying ‘inner-directed’ needs for activity, adventure and appreciation of the natural environment. This expansion is usually attributed to a combination of interrelated factors, including increasing real incomes, increasing leisure time and the adoption of the holiday habit, increasing personal mobility through rising car ownership and improved roading networks, higher educational attainment creating new appre-ciation of the environment and its potential for recreation, and, some would argue, an increase in everyday stress, prompting more escapism into less complex outdoor surroundings. Whatever the cause, one thing remains certain: the resources available for supply of recreation facilities are limited, as are the time and money available to individuals who use them. All deci-sions on the provision and use of recreation resources contain an economic dimension.
What gets measured gets managed is a familiar modern management mantra, but much recreation is not measured. It occurs informally and falls outside the system of market exchange so it is dispersed and diffi cult to observe. This becomes apparent when recreation sites are threatened by new develop-ments, and there is no ready means to compare the value of the current and future uses of the site for recreation against the more concrete expected benefi ts of the development. In such situations it is possible for decisions to underweigh the recreational value, resulting in ineffi cient resource allocation and use.
The system of ecosystem services expounded by the Millennium Ecosystem Assessment (2003) was specifi cally designed to address the problem of ‘missing markets’1 for the natural environment and provide means of weighing the envi-ronment in economic terms. It gives effect to the idea that the environment is a source of natural capital, a collection of natural assets whose value can be inferred from the stream of benefi cial services it provides to human activity. But putting it into prac-tice depends on knowing what ecosystem services contribute to different activities, how much benefi t and value is derived from ecosystem services, and what is it worth to protect or enhance the natural capital that provides them.
This chapter provides a review of knowledge about recrea-tion in New Zealand and how much value recreation obtains from ecosystem services. It fi rst provides defi nitions of recrea-tion in relation to ecosystem services, and the range of recreation activities that are more or less dependent on such services. It then describes approaches to the economic assessment of recreation and the specifi c methods used to put them into effect. Finally it reviews evidence of the level and value of recreation in New Zealand at present, and considers recent trends and implications for the future.
By international standards New Zealand is a country with a small population and relatively limited resources to put into monitoring and understanding its complex biogeography and interactions with human activities. Reliable data are limited, collected for specifi c purposes, and it is necessary to draw inferences on recreation from secondary sources. The value of recreation varies over time and space according to changes in external circumstances. Recreation operates in local markets so that the value of a particular recreation site will vary according to the conditions in its immediate surroundings, making it diffi -cult to infer nationally relevant values from studies of particular geographic locations. Identifying trends in activity and value of recreation in New Zealand is an exercise in detection and infer-ence from multiple sources.
Defi ning recreation in relation to ecosystem servicesEcosystem services provide the settings in which recreation
takes place, comprising land cover and the stability and resil-ience of biodiversity and its constituent plant communities and watchable wildlife. Also contributing to the value for recreation are some of ecosystems’ regulatory services, such as the shelter from wind or sun provided by a tree canopy or the ecosystem’s effects in moderating river fl ows and maintaining water quality, as well as provisioning services in providing harvestable stocks for extractive recreation like fi shing and hunting, to the extent that they provide people with food for the pot. Even in those cases the economic value of the recreation experience, as expressed in people’s willingness to pay for it, is usually much larger than the value of any produce obtained from it: the value of a day’s fi shing is greater than the value of the equivalent fi sh bought off the slab, as is evident from those who persist in fi shing even after fi shless days.
Recreation is a subset of a broader category of leisure, which is time spent away from business, work and domestic chores, and excluding unavoidable life-supporting pastimes such as
THE VALUE OF ECOSYSTEM SERVICES FOR RECREATIONPeter CloughNew Zealand Institute of Economic Research, PO Box 3479, Wellington 6140, New Zealand
ABSTRACT: Ecosystem services provide the settings for much recreation in New Zealand, but the informal nature of that recreation means the extent of activity, and the value attached to it, are hard to determine. Recreation in natural areas comes under the jurisdiction of several public agencies, but none provides a complete picture of the value of recreation derived from natural ecosystems, or the value at risk when other developments change those ecosystem services. A review of existing estimates of recreation value reveal limitations of data and the assumptions used. There are as yet too few studies to draw robust inference on the value of ecosystem services to recreation or its variation with changing ecological condition.
Key words: economic values, ecosystem services, recreation.
Clough P 2013. The value of ecosystem services for recreation. In Dymond JR ed. Ecosystem services in New Zealand – conditions and trends. Manaaki Whenua Press, Lincoln, New Zealand.
331
THE VALUE OF ECOSYSTEM SERVICES FOR RECREATION 2.4
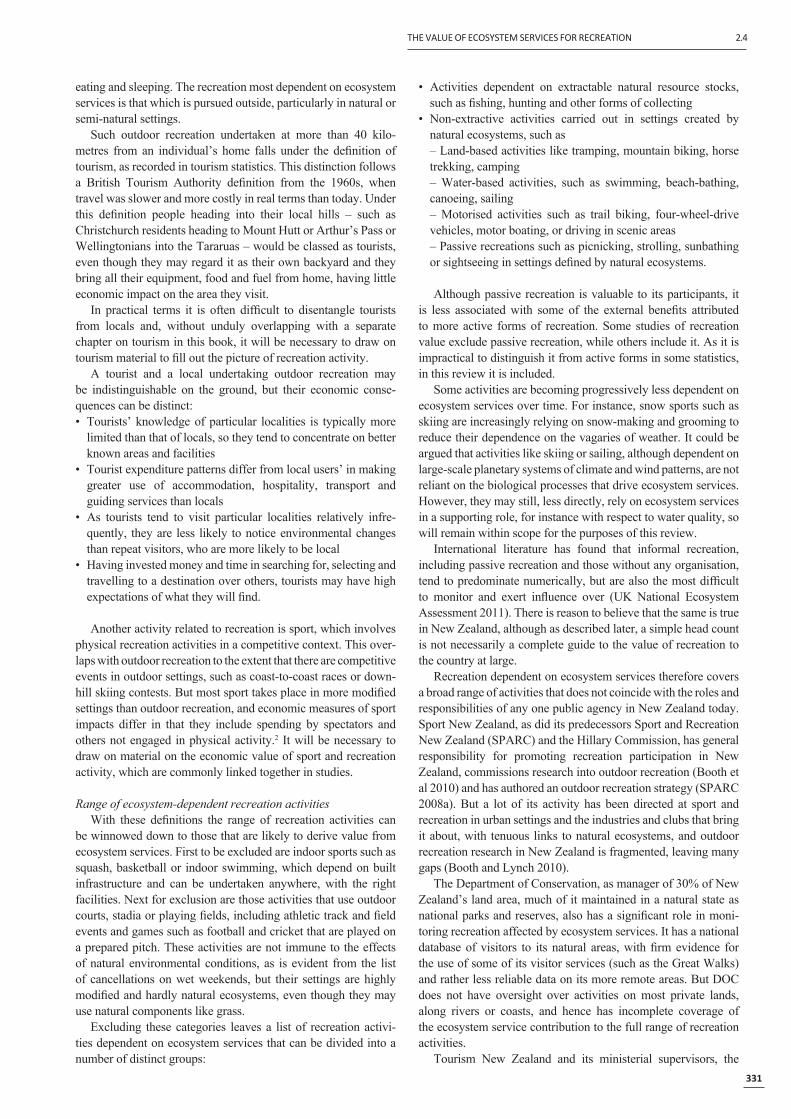
eating and sleeping. The recreation most dependent on ecosystem services is that which is pursued outside, particularly in natural or semi-natural settings.
Such outdoor recreation undertaken at more than 40 kilo-metres from an individual’s home falls under the defi nition of tourism, as recorded in tourism statistics. This distinction follows a British Tourism Authority defi nition from the 1960s, when travel was slower and more costly in real terms than today. Under this defi nition people heading into their local hills – such as Christchurch residents heading to Mount Hutt or Arthur’s Pass or Wellingtonians into the Tararuas – would be classed as tourists, even though they may regard it as their own backyard and they bring all their equipment, food and fuel from home, having little economic impact on the area they visit.
In practical terms it is often diffi cult to disentangle tourists from locals and, without unduly overlapping with a separate chapter on tourism in this book, it will be necessary to draw on tourism material to fi ll out the picture of recreation activity.
A tourist and a local undertaking outdoor recreation may be indistinguishable on the ground, but their economic conse-quences can be distinct: • Tourists’ knowledge of particular localities is typically more
limited than that of locals, so they tend to concentrate on better known areas and facilities
• Tourist expenditure patterns differ from local users’ in making greater use of accommodation, hospitality, transport and guiding services than locals
• As tourists tend to visit particular localities relatively infre-quently, they are less likely to notice environmental changes than repeat visitors, who are more likely to be local
• Having invested money and time in searching for, selecting and travelling to a destination over others, tourists may have high expectations of what they will fi nd.
Another activity related to recreation is sport, which involves physical recreation activities in a competitive context. This over-laps with outdoor recreation to the extent that there are competitive events in outdoor settings, such as coast-to-coast races or down-hill skiing contests. But most sport takes place in more modifi ed settings than outdoor recreation, and economic measures of sport impacts differ in that they include spending by spectators and others not engaged in physical activity.2 It will be necessary to draw on material on the economic value of sport and recreation activity, which are commonly linked together in studies.
Range of ecosystem-dependent recreation activitiesWith these defi nitions the range of recreation activities can
be winnowed down to those that are likely to derive value from ecosystem services. First to be excluded are indoor sports such as squash, basketball or indoor swimming, which depend on built infrastructure and can be undertaken anywhere, with the right facilities. Next for exclusion are those activities that use outdoor courts, stadia or playing fi elds, including athletic track and fi eld events and games such as football and cricket that are played on a prepared pitch. These activities are not immune to the effects of natural environmental conditions, as is evident from the list of cancellations on wet weekends, but their settings are highly modifi ed and hardly natural ecosystems, even though they may use natural components like grass.
Excluding these categories leaves a list of recreation activi-ties dependent on ecosystem services that can be divided into a number of distinct groups:
• Activities dependent on extractable natural resource stocks, such as fi shing, hunting and other forms of collecting
• Non-extractive activities carried out in settings created by natural ecosystems, such as
– Land-based activities like tramping, mountain biking, horse trekking, camping
– Water-based activities, such as swimming, beach-bathing, canoeing, sailing
– Motorised activities such as trail biking, four-wheel-drive vehicles, motor boating, or driving in scenic areas
– Passive recreations such as picnicking, strolling, sunbathing or sightseeing in settings defi ned by natural ecosystems.
Although passive recreation is valuable to its participants, it is less associated with some of the external benefi ts attributed to more active forms of recreation. Some studies of recreation value exclude passive recreation, while others include it. As it is impractical to distinguish it from active forms in some statistics, in this review it is included.
Some activities are becoming progressively less dependent on ecosystem services over time. For instance, snow sports such as skiing are increasingly relying on snow-making and grooming to reduce their dependence on the vagaries of weather. It could be argued that activities like skiing or sailing, although dependent on large-scale planetary systems of climate and wind patterns, are not reliant on the biological processes that drive ecosystem services. However, they may still, less directly, rely on ecosystem services in a supporting role, for instance with respect to water quality, so will remain within scope for the purposes of this review.
International literature has found that informal recreation, including passive recreation and those without any organisation, tend to predominate numerically, but are also the most diffi cult to monitor and exert infl uence over (UK National Ecosystem Assessment 2011). There is reason to believe that the same is true in New Zealand, although as described later, a simple head count is not necessarily a complete guide to the value of recreation to the country at large.
Recreation dependent on ecosystem services therefore covers a broad range of activities that does not coincide with the roles and responsibilities of any one public agency in New Zealand today. Sport New Zealand, as did its predecessors Sport and Recreation New Zealand (SPARC) and the Hillary Commission, has general responsibility for promoting recreation participation in New Zealand, commissions research into outdoor recreation (Booth et al 2010) and has authored an outdoor recreation strategy (SPARC 2008a). But a lot of its activity has been directed at sport and recreation in urban settings and the industries and clubs that bring it about, with tenuous links to natural ecosystems, and outdoor recreation research in New Zealand is fragmented, leaving many gaps (Booth and Lynch 2010).
The Department of Conservation, as manager of 30% of New Zealand’s land area, much of it maintained in a natural state as national parks and reserves, also has a signifi cant role in moni-toring recreation affected by ecosystem services. It has a national database of visitors to its natural areas, with fi rm evidence for the use of some of its visitor services (such as the Great Walks) and rather less reliable data on its more remote areas. But DOC does not have oversight over activities on most private lands, along rivers or coasts, and hence has incomplete coverage of the ecosystem service contribution to the full range of recreation activities.
Tourism New Zealand and its ministerial supervisors, the

2.4 THE VALUE OF ECOSYSTEM SERVICES FOR RECREATION
332
former Ministry of Tourism now embedded within the Ministry of Business, Innovation and Employment, collects information on nature-based tourism, distinguishing between domestic and international tourists, but it will not necessarily pick up on local activities undertaken within a short distance of home. A range of other agencies, such as regional councils, territorial authori-ties, the Mountain Safety Council, New Zealand Fish and Game, the Walking Access Commission and the NZ Conservation Authority, have an interest in recreation affected by natural ecosystems, and some records of activity that add to the picture of recreation. But none of them collect a broad range of information on relevant recreational activity. Such a picture must be inferred from existing sources through a sort of triangulation to defi ne the economic space within which such recreation is likely to lie.
AN APPROACH TO THE VALUE OF RECREATIONThe value of recreation means different things to different
people, but nowadays it appears to be almost universally regarded as positive. At the individual level, recreation is viewed as an important means of relaxation, de-stressing and recharging ener-gies for future challenges. It can also be a means of socialising and sustaining friendships, of learning new skills, and generally raising the quality of life, self-esteem and confi dence. At a collec-tive level it is seen as providing benefi ts to communities through improvements in physical and mental health, building social capital through interpersonal contacts, improving participants’ skill base, providing a symbolic sense of identity (although more for sport, than recreation) and contributing to economic activity through the spending it stimulates. Economists, however, try to condense these diverse views on value to questions of resource use choice, in particular the costs incurred in supplying recreation opportunities and the value obtained from participation.
Changes in ecosystems raise concerns that valuable services may be lost or diminished if ecosystems degrade. This raises the question of how valuable are these services, or put another way, how much worse off would people be if they had less of the natural assets that provide these services? Economic valu-ation attempts to answer these questions, based on the premise that people derive benefi t from the use of ecosystem services, either directly or indirectly, now or in the future, and that they would be willing to trade or exchange other things to maintain these services, even where such services are outside the scope of market exchanges. Valuation attempts to measure all services in monetary terms to provide a common metric for expressing the benefi ts of the variety of services provided, but this does not mean that only services that generate monetary benefi ts are taken into account. Services that are not privately owned, or for which substantial externality3 spillovers exist, are not completely valued through market transactions, requiring some means of assessing the non-market-value components in a consistent manner.
The critical challenge is how to demonstrate the value for recreation of ecosystem services and changes in their level? While there is reasonable knowledge about the costs to government, local authorities and some other public bodies incurred in main-taining the ecosystems that provide these services, less is known about private and charitable expenditures and even less about opportunity costs of forgone developments. These, however, are all measures of costs, and must be compared to the value of benefi t obtained to determine the net value of ecosystem services. It is necessary to look beyond the normal range of studies, either economy-wide studies of economic contribution or studies of the value of specifi c sites, to consider a framework that links both and
provides insight into how changes in ecosystem services affect the value of recreation, and vice versa.
Recreation is a consumption good whose value accrues primarily to the consumer, or participant. Like other goods it is the result of a production process in which inputs of land, labour and capital are used to produce an output of value to its consumers, who expend some of their own resources to acquire the good for consumption. The level of recreation refl ects the interaction of supply and demand, even though some of the input factors and the demand may not be explicitly valued. Modern awareness of the role of ecosystems in supporting production in various ways means that the input factor ‘land’ can be interpreted broadly to include all environmental resources provided by nature, including those of self-sustaining natural ecosystems.
The measure of recreation depends on the number of partici-pants over a defi ned period multiplied by the frequency of their participation, the product of which is the activity level (partici-pant days). An ideal dataset would have number of participant days broken down by activity categories and settings, to which can be attached estimates of economic value as a basis for exam-ining how value varies with changes in setting and condition. Spending generated by an activity provides a basis for measuring the contribution to the economy, but it is the economic surpluses to producers and consumers that is the net economic value of recreation.
In national accounting terms it should be possible to estimate a value for recreation as for any other sector by deducting from the activity’s output value the intermediate consumption of inputs from other sectors necessary to generate its output. This approach does not help much with recreation because there is no recreation sector and no measured value of output, so it needs to be pieced together from bits of other sectors, in similar fashion to the way in which a satellite account is constructed for tourism (Statistics New Zealand 2012). But recreation is further complicated because so much of it is non-priced activity, with no obvious indicator of unit value, and because recreation consumers are also in part its producers, spending their own money and time in various ways to create the recreation experience they enjoy.
Consequently enumerating the economic value of recreation falls back on indirect means. This may involve:• Compiling data on production and employment in recreation-
related industries, allowing for the fact that only part of these industries will be attributable to recreation, as distinct from that which is attributable to, say, indoor sports
– Making allowance for only a portion of annual sales and output being due to consumption activity in the current year, with some current spending being on longer-lived capital items such as equipment
– Also making allowance for the fact that some industry outputs are not related to recreation in New Zealand – for instance the largest physical export items of recreation-related industries are racehorses and superyachts – and hence need to be removed from a value estimate for recreation in New Zealand
• Extending the scope of the estimate to include effects that fl ow from the level of recreation participation in New Zealand, for example indirect expenditure impacts on such things as accom-modation services for recreation undertaken away from home
• Extending the scope to estimate some of the externality effects consequent on recreation activity, such as effects on health (and saved Budget Health costs) and productivity of a more active, fi tter population, and effects on social cohesion and identity from shared interest in recreation.
333
THE VALUE OF ECOSYSTEM SERVICES FOR RECREATION 2.4
Extending the scope of the evaluation becomes progressively more diffi cult with each successive addition of a new layer. Even then the value is not complete, as recreation participants get value from recreation over and above what they actually spend on gear and travel costs to create the experience. The difference between what they actually pay and what they would be willing to pay is a consumer surplus, and is the major reason for the development of techniques of non-market valuation to establish the value of changes in recreational opportunities and sites.
For much outdoor recreation in New Zealand there is no market exchange mechanism due to ‘missing markets’, making it diffi cult to assess the value of the activity and the return to its input factors. In certain respects outdoor recreation displays the economic characteristics of a public good. It is impractical to impose a charge and exclude non-payers from extensive areas such as national parks or the coast because of high transaction costs, and because additional users can be admitted to such areas at near zero marginal cost, until use accumulates to a level where overuse damages the infrastructure or congestion impinges on the recreation experience for others. It would be ineffi cient to intro-duce charges that cost more to collect than the marginal cost of the activity being charged, and to impose prices that deter use that could be accommodated at negligible marginal cost to the environment and other users.
In New Zealand, as in other countries, a two-tier system of recreation management has evolved. The private sector operates intensively used facilities, such as motor camps and attractions, where a combination of relative scarcity and high throughput yields revenues suffi cient to cover costs and a return for the private supplier, while the public sector controls large tracts of less intensively used land, on which facilities are often provided with cross-subsidy, on the expectation that there are positive externalities from enabling recreation in such areas.
Studies on the economic value of recreation list among the benefi ts such items as:• Economic contributon, sometimes expressed as the direct and
indirect (multiplier) impacts arising from investment in the recreation base of parks, trails, facilities, etc.
• Welfare benefi ts, expressed through participants’ willingness to pay for the recreation themselves
• Productivity and health benefi ts associated with a more active population with lower incidence of obesity and associated ill-health, with savings in economic costs from avoidance of medical expenditures, lost productive days at work, etc.
• Education and research benefi ts, in that purposeful recreational activity is associated with improved mental well-being and a boost to learning capabilities, as well as making people more aware of their surroundings and able to contribute to scientifi c understanding of the environment
• Improvements in social capital, with people joining together in social networks for their recreation, and using the skills gained in recreational activities productively in other settings, in work, voluntary activity and at home
• Crime reduction is a benefi t claimed, particularly in deprived urban contexts, for providing outlets for purposeful leisure activities and diverting people from taking up crime.
The last four bullets all have elements of positive externality, although how large is a matter for conjecture. In principle all have economic value from the avoidance of costs that would otherwise be incurred (health costs, protection against crime, etc.) and the potential for enhanced productivity in benefi cial activities due to
more relaxed individuals. Effects of recreation on social capital, education and research,
and crime reduction are all matters for which qualitative evidence exists, but it is diffi cult to translate this into quantitative meas-ures for compiling economic valuations. These matters will be discussed where appropriate but are not immediately capable of precise quantifi cation.
Methods of valuing recreationLiterature on the economic value of recreation falls under
two broad headings: economic impact studies and economic welfare analysis. Economic impact studies focus on the current expenditures associated with recreation. The economic impact of recreational activity is usually assessed by examining how much money recreationists contribute to an economy through spending related to access, equipment, transport, guiding and other goods and services on their recreational trips. Such studies commonly focus on gross expenditures, associated jobs, and incomes (or GDP contribution), and rather less commonly on profi ts and tax contribution to local and central government. Some such studies prepare full satellite accounts for sport and recreation, attrib-uting shares of other sectors’ activity to sport and recreation. For example, in the UK (Cambridge Econometrics 2003) one such study attributed a share of the publishing industry’s output to sport and recreation in proportion to the amount of sports coverage in publications.Tasmania has recently prepared such a satellite account, demonstrating the feasibility of applying it to a smaller economy than the UK (Sport and Recreation Tasmania 2012). Such studies encapsulate the importance of recreational activity in stimulating local business, and they provide a basis for comparison with other economic sectors, but they do not represent net benefi ts to the economy as they do not cover the components of externalities and consumer surplus.
Welfare analysis aims to measure economic surpluses and includes non-market values as well. The non-market value of recreation represents the economic value recreationists place on the natural resources they use, beyond what they have to pay to access these resources. For example, a day of angling often costs the anglers less than their maximum willingness to pay for the experience, and the gap between actual cost and how much it is ‘worth’ is a consumer surplus that contributes to economic well-being. There are other non-market effects not captured by the participants themselves, where recreation is associated with a reduction in costs falling on third parties as externalities.
From a policy perspective the valuation method required depends on the question being asked. To demonstrate that recrea-tion contributes to the economy, an economic impact approach can be useful in identifying direct and indirect effects through the economy, which sectors benefi t from new business and by how much. To demonstrate that spending on recreation provision improves the welfare of the community and makes it better off, a cost–benefi t analysis that focuses on the change in values that arises would be more appropriate. In either case, apportioning part of a broader value for recreation, sport or tourism to recreation dependent on ecosystem services provides a lead in to estimating the value of ecosystem services to recreation.
The economic literature now recognises that ‘Total Economic Value’ (TEV) of natural resources encompasses both market and non-market values (Sharp and Kerr 2005), the components of which can be divided into: • Direct current use values, usually measured in terms of outputs
of commercial commodities or services, but for unpriced

2.4 THE VALUE OF ECOSYSTEM SERVICES FOR RECREATION
334
recreation including non-commercial considerations of how much people pay for their recreation
• Indirect current use (functional) values, mostly referring to environmental services that support or protect economic production, consumption or assets (e.g. fl ood reduction) but in the case of recreation, refl ecting such outcomes as health and productivity gains for participants supporting other economic activities
• Future use values, that is, the benefi t gained from retaining resources for future consumption, particularly where there is a possibility that future technology will increase the usefulness of the resource, including both:
– option value: the value of retaining a resource for own use in future (e.g. recreation tastes change through the family life cycle);
– bequest value: the value of retaining a resource to bequest to future users
• Non-use values (sometimes called passive-use values, but not to be confused with passive activities like picnicking) refl ecting current preferences to preserve the existence of the resource into the future, without prospect of any direct use benefi t for the current holders of this preference.
The direct current use, future use and non-use values will all be refl ected in people’s willingness to pay to retain the opportu-nity for future recreation. Indirect current use value may not be, as it arises from positive externalities giving rise to avoided costs for third parties.
The choice of method for valuing recreation on natural areas is broadly between:• Market values of nature-based goods and services• Cost-based methods that consider avoided costs or the value of
the next best alternative means as obtaining the same service as that provided by ecosystems
• Revealed preference methods that infer a value for recreation opportunity from some associated or ‘surrogate’ market indica-tors, such as travel costs or the variability of house prices with proximity to recreation areas
• Stated preference techniques that directly question a sample of respondents about their willingness to pay to access the recrea-tional opportunity.
In principle it is possible to estimate different layers of value from the different services provided by natural ecosystems. This is the approach that has been tried overseas, resulting in esti-mates that give more of a snapshot of the size and composition of economic contribution than an indication of marginal value of additional recreation (Ghermandi et al. 2009).
For New Zealand’s conservation assets, the most readily quan-tifi able ecosystem services yield market values for commercial operations such as tourism and recreation concessions, loca-tions for fi lming, rentals for transmission facilities and so on. Ecosystem services requiring non-market valuation are services for downstream water use (fl ood moderation), contributions to biodiversity survival and non-priced recreational access. Where trade-offs arise between commercial and non-commercial services, the latter can only be weighed in economic terms with some form of non-market valuation. Development or encroach-ment onto those assets is likely to increase the market value of commercial services obtained from them, but also reduce the non-market values. A critical issue, therefore, is whether the total value of resource under development is greater or less than when
retained for recreation.Because of the complexity and expense of undertaking envi-
ronmental valuation, interest has grown in what is known as ‘benefi t transfer’. This entails applying an economic value esti-mate from one site to a similar project at a different site. The simplest approach is transferring unit values (such as a value per visitor day). Studies have shown, though, that people may have quite different values for different sites (Kerr and Sharp 2004).
An alternative is to estimate a demand function from one site and transfer that to the new site, using local variables appropriate to that site. For example, recreation value could be a function of local population, distance from the site, and the availability of alternative sites. This function can be transferred from one site to the next to refl ect differences in these contextual characteristics.
International literature recognises that benefi t transfer can be useful, but also that it is often not done very well (de Fries and Pagiola 2004). The importance of site context points to the danger of relying on results from international studies to infer value for a local resource in New Zealand. Conditions, tastes and opportunities may be quite different between communities within and between countries. It also means that some of the rules of thumb used in decisions involving the environment are less appropriate for recreation than for other environmental factors. For instance, in the practice of the Resource Management Act 1991 it is common to distinguish effects as of national, regional or local signifi cance, often with the implication that the national carries higher weighting than the local. But from a national perspective there are usually many recreation opportunities and substitute sites, implying low retention value for any particular site. Whereas at a local level alternatives may be scarce so removal of a site can impose much larger costs on local users, implying a high retention value.
One further approach to valuation is deliberative methods such as focus groups or citizen juries, which enable a sample of the public to give a more informed and considered response to resource use choices than in the time-constrained context of a stated preference survey. Overseas these have been used as stand-alone alternatives to stated preference valuations, or sometimes in conjuction with them to verify the results (Spash et al. 2005). This approach has not been used much in New Zealand to date, where focus groups tend to be used as a precursor to stated preference studies or as a means of revealing issues for shaping the questions rather than for validating the results.
Role of non-market valuation techniques There is an extensive literature on environmental valuation in
general, along with reviews of state of the art applications (OECD 1994) and works relating it to economic impact and effi ciency analysis techniques (Peterson et al. 1992). This runs from early recognition of the sources of positive value for unpriced envi-ronmental resources (Krutilla 1967), through consideration of the way in which such values change over time (Fisher et al. 1974) to a range of refi nements in techniques to elicit such values. The process of non-market valuation received wider recognition following the 1989 Exxon Valdez oil spill, as a result of which a so-called NOAA4 panel of experts (including two Nobel laureate economists) provided a set of recommendations for stated prefer-ence valuations suitable for use in judicial settings (Arrow et al. 1993). As stated preference methods are based on hypothetical questions there is doubt over whether responses refl ect what actual behaviour would be, fanned by valuation results that often appear high relative to observable behaviour (Clough 2010). The

335
THE VALUE OF ECOSYSTEM SERVICES FOR RECREATION 2.4
practical usefulness of this endorsement of stated preference methods of valuation divided opinion at the time (Diamond and Hausman 1994; Portney 1994) and continues to do so (Carson 2012; Kling et al. 2012; Haussman 2012).
The basic problem in evaluating a public recreation resource is that the usual yardstick of value, a consumer price, is partially or totally lacking. Non-market valuation techniques have been developed to address that problem and infer an economic value in the absence of clear market prices.
Valuation methods vary by their derivation and scope. Cost-based valuation techniques (such as lost outputs, defen-sive expenditures, replacement costs or ‘shadow’ projects), are readily implementable but largely exclude aspects of consumers surplus. To capture these aspects of value it is necessary to resort to non-market valuation techniques measuring willingness to pay, including revealed preference methods that derive demand curves for unpriced environmental attributes from associated actual expenditures, such as travel cost analysis (TCA) of recreational sites and hedonic pricing methods (HPM) that isolate an amenity value from house prices. But to capture future use or non-use values it is necessary to resort to stated preference techniques such as the contingent valuation method (CVM), which asks respondents directly their willingness to pay for a specifi ed envi-ronmental change; or the related techniques of choice modelling (CM), contingent ranking and conjoint analysis, all variations on a process for eliciting respondents’ preferred package of attrib-utes, as well as a willingness to pay for it.
For outdoor recreation that is informal or outside market transactions, market-based valuations clearly have limited appli-cation. It is possible to examine the price and quantity data for commercial recreation services, like guiding concessions in national parks, but these only capture a portion of total recrea-tional activity. The value of these services is also a poor guide to the value of other ‘similar’ non-commercial recreation as the participant experience is not the same – indeed, the differentia-tion of the concession offering from the do-it-yourself alternative is the basis for concession pricing and generating return for the additional resources required. The daily charge per adult user on guided walk concessions on the Milford and Routeburn tracks is about nine times that on DOC’s freedom walking options on the same tracks, and that differentiation can only be sustained by substantial differences in the service offerings.
Outdoor recreation has a distinctive characteristic in that people travel to specifi c locations to consume it in situ. This is the essence of the travel cost method, the longest established non-market valuation for recreation, which was developed in the USA by Marion Clawson, Jack Knetsch and other economists into a two-stage derivation of a demand curve for visitation to a particular site. Bouma (1976) later reversed the site-specifi c nature of Clawson’s method to envisage a model with a central population area surrounded by a number of separate parks, the use level and value of which was described by a function of travel costs and congestion at each individual park. That approach was later refi ned into the hedonic travel cost method by Brown and Mendelsohn (1984). However, this has not been much used because of formidable data requirements and it has received damming reviews for involving considerable inaccuracy and not providing useful information for many important policy ques-tions (Bockstael and McConnell 1998).
The travel cost method (with numerous modifi cations) has been widely used and has two principal advantages over other valuation methods: it is relatively easy to apply with well-known
data requirements; and it is based on actual expenditures and real behaviour. Its main limitations are that it is only suited to valuing single sites attracting visitation from a suffi ciently wide area to exhibit variation in travel cost between origin and destination.
The basic expression is:Vij = f (Cij, Tij, Ai, Si, Yi …)
Where Vij = visitation rate from origin i to destination j Cij = travel cost from origin i to destination j Tij = round trip travel time (or distance) from origin i to
destination j Ai = some measure for tastes for recreation in origin i
Si = some measure of substitute sites available to origin i Yi = income levels in origin i
It has also in practice not resolved diffi culties in attributing to the site travel costs that are jointly shared with other sites (Clough and Meister 1991), and in handling variables other than basic travel costs. In recent years stated preference techniques have tended to overshadow it, being viewed as more versatile in application to questions of marginal change in conditions. But the travel cost model remains useful for its basic insight about the specifi cs of locality of recreation markets. The value of a given resource varies according to what lies around it, both in terms of the population characteristics that affect demand for recrea-tion, and the supply characteristics of substitutes available for the recreation provided.
CURRENT RECREATIONAL ACTIVITIES IN NEW ZEALANDA snapshot of physical recreation activities is provided by the
periodic Active New Zealand surveys, the most recent of which was published containing data for 2008 (SPARC 2009). It reports results of a survey of adults aged 16 and above and contains information on what activities they have undertaken over the past year, and also over the 4 weeks preceding the survey, to give an indication of frequency of activity. The survey covers 57 different recreational and sporting activities, 23 of which are highly or somewhat dependent on the natural settings provided by ecosystem services. The distinction between the two catego-ries of dependency is unavoidably arbitrary and open to debate, but activities in the ‘somewhat dependent’ category are those that either commonly occur with limited contact with the outside elements (such as motor sports), or those that use highly modifi ed settings (such as golf). Activities such as sailing or surfi ng, in which the most important natural inputs of wind and waves are not driven by biological elements within ecosystems are never-theless rated ‘highly dependent’ because of close contact with water and the signifi cance of water quality.
The results of that survey are summarised in Figure 1. Activities with the highest participation are those which are somewhat dependent, such as walking, gardening, swimming and jogging. The highest of the highly dependent categories is sea fi shing (17%), followed by tramping (9%) and a range of other outdoor pursuits.
Another source of information on recreational activities exposed to ecosystem services are the statistics on nature-based tourism compiled in 2009 by the former Ministry of Tourism (now absorbed within the Ministry of Business, Innovation, and Employment). These statistics, compiled from surveys of domestic and international tourists, identify a number of recrea-tional activities undertaken by tourists, calculate the number of visitors participating in each activity and the propensity, or

2.4 THE VALUE OF ECOSYSTEM SERVICES FOR RECREATION
336
likelihood, of all tourists to take part in an activity.
A Tourism Profi le document issued in 2009 identifi ed the top 30 nature-based activities undertaken by international and domestic tourists in 2008 (Ministry of Tourism 2009). These estimates simply iden-tify if tourists participated in nature-based activity on their stay, not how much of their trip and expenditure was attributable to these activi-ties. Some results from this are summarised in Figure 2.
For domestic tourists, 22 of those top 30 activities are clearly identifi able as recre-ational activities relating to ecosystem services; the others are either passive tourist attractions (e.g. geothermal site visits) or destination-type categories for which the recreational component is not identifi ed (e.g. rivers, lakes, moun-tains). International tourists have rather more of these unspecifi ed categories in their top 30, which includes 13 recreational activities shared with domestic tourists but also a number of wildlife-watching activities that do not register on the domestic tourists’ top 30 list. For most of the shared activities, there are far more domestic tourists recorded than international tourists, but the propensity of tourists to participate in an activity is greater for interna-tional than for domestic tourists for all the activities they share in common. This is a refl ection of there being far more domestic tourist nights than international tourist nights recorded each year, most not having nature-based recreation as a primary motivation.
The SPARC and Ministry of Tourism fi gures are confi ned to participation, not levels of activity like participants’ days engaged, which would give a better indication of resource and time inputs into recreation activity. Another source that addresses this is the Department of Conservation’s National Visitor Database, which for a given year shows the number of visitors to each of over 4000 defi ned areas or track segments across the conservation estate of national parks, forest parks and reserves. These visitor numbers are divided according to the categories of DOC’s recreational opportunity spectrum, on the assumption that the type of visitor and the requirements they seek can be inferred from the types of facility they use. There are six categories: short-stop travel-lers, day visitors, overnighters, back-country comfort seekers
(the typical user of Great Walks and similar serviced tracks), back-country adventurers (conventional trampers and hunters for whom more basic facilities suffi ce), and remoteness seekers (self-reliant wilderness enthusiasts who seek no facilities).
Referring to Southland as an illustration, the raw fi gures from the database show a preponderance of short-stop travellers (Figure 3). On sheer numbers they account for over three-quarters of visits to the DOC estate, which may suggest the bulk of DOC’s resources should be allocated to so-called ‘front-country’ areas, with easy access and close to population centres, rather than facil-ities spread across the less accessible back-country. However, the value attached to each visit will in part be a function of visitors’ time spent on-site, as this is one of the inputs into the production of recreation, which would give a different distribution of visita-tion across the categories.
Figure 4 shows the results of weighting the different visit cate-gories according to the time spent on-site. For this illustration a
0.0% 10.0% 20.0% 30.0% 40.0% 50.0% 60.0% 70.0%
Walking
Gardening
Swimming
Cycling (road)
Jogging/running
Fishing (marine)
Golf
Tramping
Canoeing/kayaking
Cycling (mountain)
Fishing (freshwater)
Sur�ing/bodyboarding
Hunting
Skiing (snow,grass)
Diving/snorkelling
Horse riding
Water skiing
Snowboarding
Sailing/yachting
Motorcycles sport
Multisports
Mountaineering
Motor sports (cars)
Somewhat dependent Highly dependent
FIGURE 1 Percentage of New Zealand adults participating in different recreation activities (data from SPARC 2009).
0.0% 10.0% 20.0% 30.0% 40.0% 50.0% 60.0% 70.0%
Walking
Gardening
Swimming
Cycling (road)
Jogging/running
Fishing (marine)
Golf
Tramping
Canoeing/kayaking
Cycling (mountain)
Fishing (freshwater)
Sur�ing/bodyboarding
Hunting
Skiing (snow,grass)
Diving/snorkelling
Horse riding
Water skiing
Snowboarding
Sailing/yachting
Motorcycles sport
Multisports
Mountaineering
Motor sports (cars)
Somewhat dependent Highly dependent
FIGURE 2 Tourist participation in nature-based activities (data from Ministry of Tourism 2009).

337
THE VALUE OF ECOSYSTEM SERVICES FOR RECREATION 2.4
day visit is given a weighting of 1 standard day, overnighters 2 days, back-country comfort seekers 3 days (most Great Walks can be completed in 3–5 days), back-country adventurers 4 days and remoteness seekers 5 days. Short-stop travellers are given a weighting of 0.1 standard days. The results would give the back-country categories of visitor a slight majority of visitor days, a not unsurprising result as Southland contains the country’s largest but least accessible national park in Fiordland, and also all or part of world-renowned Great Walks such as the Milford, Kepler and Routeburn tracks. The weighting of categories in this illustra-tion, however, is based on an assumption that the more remote the visitor experience, the greater the time required to access it. Improving information on the average times per visitor category, perhaps through surveys of visitors on different types of track, would improve the basis for weighting, but that has its own chal-lenges for collecting information across widely dispersed sites with low individual use levels.
This brief review shows that existing data provide some infor-mation on recreation dependent on ecosystem services, but do not mesh suffi ciently well to provide a complete picture of the patterns of such recreational activity. The two sources provide snapshots of participation levels, though they contain differences that are diffi cult to reconcile. The most comprehensive data on activity levels exist for the conservation estate, but these do not cover recreation on private land, rivers or beaches which other sources indicate these attract a high level of recreation activity. While there may be other sources of data to add to the mix, a complete picture of recreational activity levels across recreation categories, parts of the country and ecosystem types appears to be some way in the future.
ESTIMATES OF VALUE OF CURRENT RECREATIONAL ACTIVITY
If information on the amount of recreation activity is uncer-tain, estimating the value of recreational activity is also going to be fraught with diffi culty. According to Booth (2006), most information on benefi ts of recreation in New Zealand relates to visitors’ satisfaction with on-site experiences. This represents
only one type of benefi t, and to the extent that New Zealand studies have addressed wider consequences of recreation and off-site effects at all, they have been mainly limited to economic benefi ts.
There is a wide range of research on visitors to public conser-vation areas in New Zealand as summarised in Lovelock et al. (2011a, b), although most of this is about visitor profi les, social characteristics, behaviour and biophysical impacts, with little direct reference to economic effects. Where this research has addressed ecosystem services, it has focused on biophysical services, not cultural ones (McAlpine and Wotton 2009).
In New Zealand, valuation of conservation land falls into two broad categories. Government agencies and councils have commissioned a number of economic impact analysis studies of specifi c regions, or attributed a portion of total tourism business to nature-based activities. Academic institutions, however, have tended to focus on applying and developing non-market valuation techniques, often at a more site-specifi c level than the regional impact studies.
Numerous studies have been undertaken on the economic value of visitors to New Zealand, as summarised in the 2009 report for the Ministry of Tourism (Tourism Resource Consultants 2009). Such studies concentrate on measures of economic impact – expenditure, economic value added5 and length of stay, but some also identify costs identifi ed by public agencies at national and local level to identify the yield of different types of tourism. Several such studies have been prepared for the Department of Conservation covering specifi c recreation assets on conserva-tion land, including the Queen Charlotte Track and Abel Tasman National Park (DOC 2005), the West Coast (DOC 2004) and Fiordland (DOC 2006a), as reported in the Value of Conservation (DOC 2006b). A recent study of the value of concessions on conservation areas reviewed some of this earlier work and non-market valuation studies, particularly with respect to the social impacts on ‘gateway’ communities at focal points where people enter or leave conservation land (DOC 2011).
One of the most elaborate of impact studies is one commissioned by SPARC on the value of sport and recreation
S/Stop Travellers
77%
Day Visitors
14%
Overnighters
1%
Back Cntry
Comf Seek
6%
Back Cntry Adventurer
2% Remoteness Seekers
0%
S/Stop Travellers
16%
Day Visitors
29%
Overnighters
3%
Back Cntry Comf Seek
38%
Back Cntry Adventurer
14%
Remoteness Seekers
0%
FIGURE 3 Raw records of visitors to conservation land (data from the Department of Conservation’s National Visitor Database, Southland).
FIGURE 4 Percentage of visitor days spent by different categories of visitor (data from the Department of Conservation’s National Visitor Database, Southland).

2.4 THE VALUE OF ECOSYSTEM SERVICES FOR RECREATION
338
(Dalziel 2011: Table 1). This built on some earlier studies for the Hillary Commission that not only assembled data on the measured production related to sport and recreation in New Zealand, but also included estimates of non-market effects, such as the contribution of volunteers’ input into sport and recreation activity (BERL 2000).
TABLE 1 A multi-level value of sport and recreation
Value of Sport and Recreation of New Zealand 2008/09
Value added$bn
Cumulative$bn
GDP share%
Sport & recreation industries 3.840 3.840 2.1
S&R Infrastructure providers
0.670 4.510 2.4
Volunteers 0.730 5.240 2.8
Productivity & health benefi t
Work productivity 0.281
Improved health outcome 3.947
Personal costs (injuries etc) -3.190
Total 1.038 6.278
Time vaue of participation
Participation 5.338
Volunteering services 0.654
Watching youth sport 0.956
Total 6.948
-1.038 5.910
Total value of sport and recreation 12.188
Source: Dalziel 2011
The 2011 study extends the boundaries further, by providing estimates for successively widening scope of economic effect that can be associated with sport and recreation. The most narrowly defi ned estimate of impact is for 17 sport and recreation related industries, which together produced $3.8 billion value added, equivalent to 2.1% of national GDP for the 2008/09 study year. The list of industries covers sport and recreation instructors, venues and facilities management, manufacture and retailing of recreation goods, nature reserves and conservation parks opera-tion. It also includes boatbuilding and repair services and horse farming, whose large export items – super-yachts and thorough-bred racehorses – boost the estimated value although having little connection to recreation participation in New Zealand.
Extending the scope of the estimate to include sport and recreation infrastructure providers, such as central government expenditure on physical education and local government value added to the construction industry from spending on new sport and recreation facilities, adds another $0.7 billion to the total. The estimate is expanded further to include the contribution of volun-teers, valued at the opportunity cost of volunteers’ time at an assumed wage rate to arrive at a combined value of $5.2 billion, equivalent to 2.8% of GDP.
From here the estimate pushes into new territory, claiming value from improvements in work productivity, health benefi ts and personal injury costs. The work productivity gain is calcu-lated from an Australian study that suggests fewer days off work for the fi t and active proportion of the population, and it may not be unreasonable to assume a similar outcome in New Zealand. It also follows an Australian lead to combine current recorded activity levels and Australian estimates of the risk of prema-ture death from inactivity (Medibank Private 2008; Frontier
Economics 2009) to estimate the cost of inactivity avoided from participation in sport and recreation. This approach provides a dollar fi gure but is certainly an overestimate of benefi ts, as it basically uses the average cost per inactive person as the benefi t (avoided cost) per active person. However, that average cost of the inactive represents a distribution of costs ranging from very high for the most inactive and seriously unwell people, to quite low for those just below the fi ve by 30 minutes of moderate exer-cise per week threshold that divides the active from the inactive. The average cost avoided per active person is closer to the lower end of the inactive cost distribution than to the upper end, or to the mean. It might reasonably be estimated by the cost saved by someone crossing over the threshold from inactive to active status, but that is a marginal value and it is not reasonably esti-mated by the rather higher average cost of all inactive people.
Finally the estimate claims an additional $5.9 billion of value from the opportunity cost of time of participants and volunteers, on the grounds that each participant must value their participation time at least as much as their opportunity cost in earning poten-tial. This is at odds with the accounting framework being used for the study. It gives an estimate closer to a gross output than a value-added one, with no identifi able costs to offset against it other than the value of time which is already serving as a proxy for the benefi t. It cannot be added to or compared with GDP or other economic aggregates without making similar adjustments to all other activities in the economy – like infl ating the value of food production by the opportunity cost of time spent preparing and eating it. This study illustrates the paucity of data with which to compile impact analyses of activities like recreation, and the risks of pushing the framework to incorporate externality effects that it is not designed to measure.
Interest in non-market valuation in New Zealand was pioneered in the agricultural faculties at Lincoln and Massey universi-ties, and has spread to Auckland, Otago and more recently to a growing interest at the University of Waikato. There has also been interest among private economic consultancies, including non-market valuations for biosecurity assessments (Bell et al. 2008; Nimmo-Bell 2011) and in transport applications (Miller and Guria 1991).
Kaval and Yao (2007) reviewed non-market valuation studies and estimated the benefi ts of New Zealand outdoor recreation, building on a Tourism New Zealand estimate (which appears not to have been since updated) of over 4 million international and domestic outdoor recreation participants in 2006, giving rise to an estimated 72.5 million recreation days in the year (18 per participant on average). Kaval and Yao estimated an economic contribution of recreation that year of $3.8 billion attributable to outdoor recreation. That, however, is not the total economic value of outdoor recreation as it excludes non-market values, an omission which they rectify by undertaking a meta-analysis of 19 non-market valuation studies of recreation activity, to derive an average value per recreation day.
They found the average value per person day was $71, which spread across 72.5 million outdoor recreation days implied a total value of $5.17 billion per year – equivalent to about 3% of GDP in 2007. That survey omitted a number of non-market valuation studies so Yao and Kaval (2007) in a wider survey of non-market valuation updated and revised their analysis for recreation. This resulted in a lower estimated value per person-day of $57 and aggregate consumer surplus of $4.1 billion per year (equivalent to 2.5% of GDP).

339
THE VALUE OF ECOSYSTEM SERVICES FOR RECREATION 2.4
Yao and Kaval (2007) report South Island values are on average $131 per visitor day, considerably higher than North Island values ($28 per visitor day) and surmise there may be loca-tion bias due to South Island studies containing more sites with national or international attraction (e.g. Milford Track, Mount Cook) and North Island studies including more sites of local or regional signifi cance. They distinguish tramping (on Great Walks) and climbing as high value activities worth more than $100 per visitor day, fi shing as a moderate value activity, and camping and picnicking as low value activities worth less than $35 per visitor day.
They also report a very wide variation in value of a recrea-tion person-day, from $0.38 to $622, refl ecting the averaging of results from diverse non-market valuation studies undertaken with different techniques and different contexts, and little ability to control for variations in local preferences and demand, avail-ability of substitutes, awareness and accessibility of national and international tourists.
Kaval and Yao’s estimate of $3.8 billion economic contribu-tion of outdoor recreation in 2006 is coincidently the same as Dalziel’s estimate for sport and recreation in 2008. Converted to 2008 dollar terms the 2006 estimate is 6% larger than the 2008 estimate, which is of an ostensibly broader sector. This is a result of differences in assumptions and methods to overcome data limitations. The economic contribution of ecosystem-dependent recreation is probably within the bounds of these estimates, but neither estimate is suffi ciently reliable to determine what that proportion might be.
At time of writing Lincoln University’s New Zealand Non-Market Valuation database contains 43 studies giving results for recreation affected by ecosystem services. Figure 5 shows the most frequent technique applied has been contingent valuation with 20 studies, followed by travel cost analysis (17), benefi t transfer (5) and choice modelling (1). The low frequency of choice modelling is something that can be expected to change: not only have advances in computational techniques made these studies relatively easier to apply than formerly, but also interna-tional studies have shown their ability to reveal variations in value for different attributes that are potentially useful in managing the
mix of features such as open space, forest, and tracks found at sites used for recreation (Hanley et al. 1998). Such detail would also be useful in estimating the economic consequences in marginal changes in ecosystem services provided for recreation.
Figure 6 shows the breakdown of non-market valuation studies applied to different types of recreation. The most frequent appli-cation is to general recreation, which covers the valuation of visits to particular locations without distinguishing activities. In none of these types of recreation is there a large number of studies, indicating that for benefi t transfer purposes there is a small pool to draw from and, as yet, little basis for expecting meta-analysis to comprehensively be able to control for all infl uential variables. One thing the non-market valuations do show is that the highest daily values for recreation come from specialist activities, whose participants invest in training, equipment and time to perfect their craft. Casual recreation like sightseeing has very much lower value, which suggests that simple headcounts of recreationists displaced and new visitors brought in by a new development are not necessarily a good indication of value gained or lost.
In summary, valuation of recreation and tourism in New Zealand to date has concentrated on economic impact and multi-plier analysis, as represented in DOC’s Value of Conservation (2006b), or on non-market valuation of specifi c sites and resources. While the impact studies provide some information on the contribution of nature-based recreation and tourism to the regional and the national economy, they do not cover full effects of externalities. They also are not informative for questions such as what would happen to the net value from nature-based recrea-tion in a region if some of the natural assets were to be modifi ed or transformed by other uses. The non-market valuation studies are dominated by stated preference studies, which raises questions about the values used and their suitability for wider application through the benefi t transfer technique.
An example of what can be achieved in assessing the value of recreation from natural ecosystem services is provided in the UK’s National Ecosystem Assessment Economic Analysis Report (2011). Antara et al. (2011) combine valuation with a GIS framework in their economic assessment of the recreational value of British ecosystems. While noting that specifi c activities, like
General recrea�on, 21
Fishing, 13
Hun�ng, 2
Treks & Mountain Recrea�on, 7
Water Recrea�on, 4
Contingent Valuation, 20
Travel Cost Analysis, 17
Choice Modelling, 1Bene�it Transfer, 5
FIGURE 5 Number of studies applying non-market valuation techniques to recreation in New Zealand (data from Lincoln University (2012) New Zealand Non-Market Valuation Database).
FIGURE 6 Non-market valuation studies of recreation types in New Zealand (data from Lincoln University (2012) New Zealand Non-Market Valuation Database).
2.4 THE VALUE OF ECOSYSTEM SERVICES FOR RECREATION
340
recreational fi shing, can have substantial impacts in their own right that are traceable through analysis of expen-ditures and employment, they see informal recreation activities comprising the bulk of ecosystem-service-related recreation. These are less readily discerned in published statistics, but clearly generate substan-tial recreational value that would be affected by changes in the delivery of those services. They also stress that the outdoor recreation values generated by any given resource are likely to vary substantially depending upon their spatial context, that is, the same type of resource can have very different numbers of visits and values in different areas, depending on their surroundings. To overcome this they develop a novel methodology incorporating:• A site prediction model, to determine the likely location of
potential recreation sites in six scenarios of different future states of the world
• A trip-generation function to model a number of factors deter-mining the number of visits from each UK census area to any given recreational site
• A trip valuation meta-analysis that reanalyses nearly 200 previous estimates of the value of recreational visits, making allowance for the infl uence of environmental characteristics and the different valuation methods used.In short the method uses the site prediction model to predict the
number and distribution of sites under different future scenarios, the trip-generation model to predict visitation rates to each site, and the meta-analysis allows values to be attached to likely visita-tion under these scenarios, with the value per visit varying with the characteristics of each site. It depends on a substantial prior investment in data preparation, including valuation studies, meta-analyses and GIS framing.
TRENDS IN RECREATION AND IMPLICATIONS FOR ECOSYSTEM SERVICES
In the absence of extensive reliable data, there are many different views about the trends and direction of recreation, depending on the perspective of the beholder. Like the parable of the blind man and the elephant, each perceives a different truth, but much energy is expended arguing from partial perspectives in the absence of a complete picture.
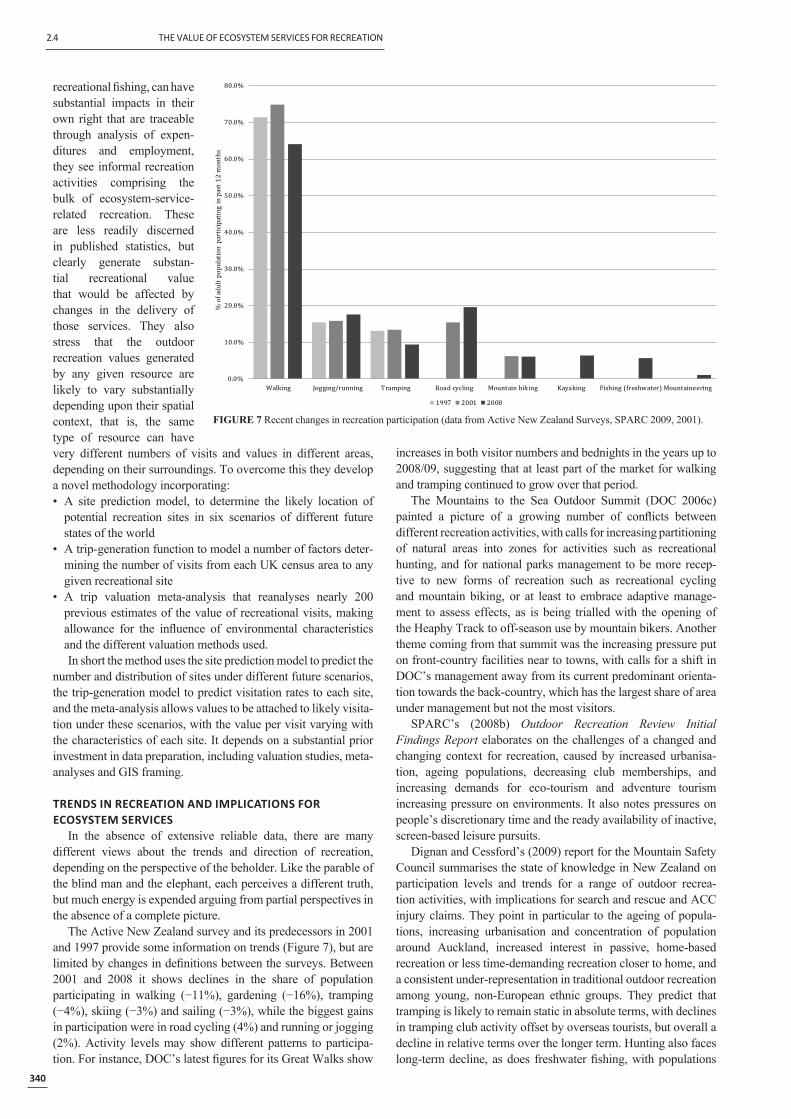
The Active New Zealand survey and its predecessors in 2001 and 1997 provide some information on trends (Figure 7), but are limited by changes in defi nitions between the surveys. Between 2001 and 2008 it shows declines in the share of population participating in walking (−11%), gardening (−16%), tramping (−4%), skiing (−3%) and sailing (−3%), while the biggest gains in participation were in road cycling (4%) and running or jogging (2%). Activity levels may show different patterns to participa-tion. For instance, DOC’s latest fi gures for its Great Walks show
increases in both visitor numbers and bednights in the years up to 2008/09, suggesting that at least part of the market for walking and tramping continued to grow over that period.
The Mountains to the Sea Outdoor Summit (DOC 2006c) painted a picture of a growing number of confl icts between different recreation activities, with calls for increasing partitioning of natural areas into zones for activities such as recreational hunting, and for national parks management to be more recep-tive to new forms of recreation such as recreational cycling and mountain biking, or at least to embrace adaptive manage-ment to assess effects, as is being trialled with the opening of the Heaphy Track to off-season use by mountain bikers. Another theme coming from that summit was the increasing pressure put on front-country facilities near to towns, with calls for a shift in DOC’s management away from its current predominant orienta-tion towards the back-country, which has the largest share of area under management but not the most visitors.
SPARC’s (2008b) Outdoor Recreation Review Initial Findings Report elaborates on the challenges of a changed and changing context for recreation, caused by increased urbanisa-tion, ageing populations, decreasing club memberships, and increasing demands for eco-tourism and adventure tourism increasing pressure on environments. It also notes pressures on people’s discretionary time and the ready availability of inactive, screen-based leisure pursuits.
Dignan and Cessford’s (2009) report for the Mountain Safety Council summarises the state of knowledge in New Zealand on participation levels and trends for a range of outdoor recrea-tion activities, with implications for search and rescue and ACC injury claims. They point in particular to the ageing of popula-tions, increasing urbanisation and concentration of population around Auckland, increased interest in passive, home-based recreation or less time-demanding recreation closer to home, and a consistent under-representation in traditional outdoor recreation among young, non-European ethnic groups. They predict that tramping is likely to remain static in absolute terms, with declines in tramping club activity offset by overseas tourists, but overall a decline in relative terms over the longer term. Hunting also faces long-term decline, as does freshwater fi shing, with populations
0.0%
10.0%
20.0%
30.0%
40.0%
50.0%
60.0%
70.0%
80.0%
Walking Jogging/running Tramping Road cycling Mountain biking Kayaking Fishing (freshwater) Mountaineering
% o
f ad
ult
po
pu
lati
on
par
tici
pat
ing
in p
ast
12
mo
nth
s
1997 2001 2008
FIGURE 7 Recent changes in recreation participation (data from Active New Zealand Surveys, SPARC 2009, 2001).
341
THE VALUE OF ECOSYSTEM SERVICES FOR RECREATION 2.4
concentrating in locations distant from freshwater fi shing resources, but the prospect for saltwater fi shing is more stable, with signifi cant participation by non-European ethnic groups. Mountain biking has grown signifi cantly in recent years and will continue to grow but more slowly, and will diversify into more distinct forms.
Outdoor recreation affected by ecosystem services is undergoing changes, with new pressures and demands placed on the shared infra-structure of natural ecosystems and the services they provide. Management of infrastructure refl ects this, building better walking tracks and larger huts that create some supply-gener-ated demand, reinforcing trends towards self-guided recreation and away from club-generated activity. The challenge for recrea-tion management is in decision-making in a world where tastes change and the supply of information lags behind the demands made on the infrastructure of recreation settings and facilities. Technological changes are shifting behaviours, with the Internet and mobile phones creating new avenues for gathering infor-mation and forming links with like-minded people to engage in shared interests in an informal way that is hard to monitor. At a time when organised sports are becoming more professional, commercial and subject to governance codes, informal recreation is moving in the opposite direction, to less dependence on formal structures like clubs or guides.
In this respect recreation is no different from other consumer goods, which have experienced a proliferation and diversifi ca-tion of forms in recent decades. There is value in heterogeneity of offerings, matching different goods and services to different needs; Henry Ford’s famous dictum that you can have any colour you like as long as it is black no longer gets much support among modern marketing experts. Differentiation of service offerings is important to consumer satisfaction, so expect to see not only a greater diversity of recreation activities being accommodated within natural ecosystems, but also a greater diversity of service delivery to cater to different needs.
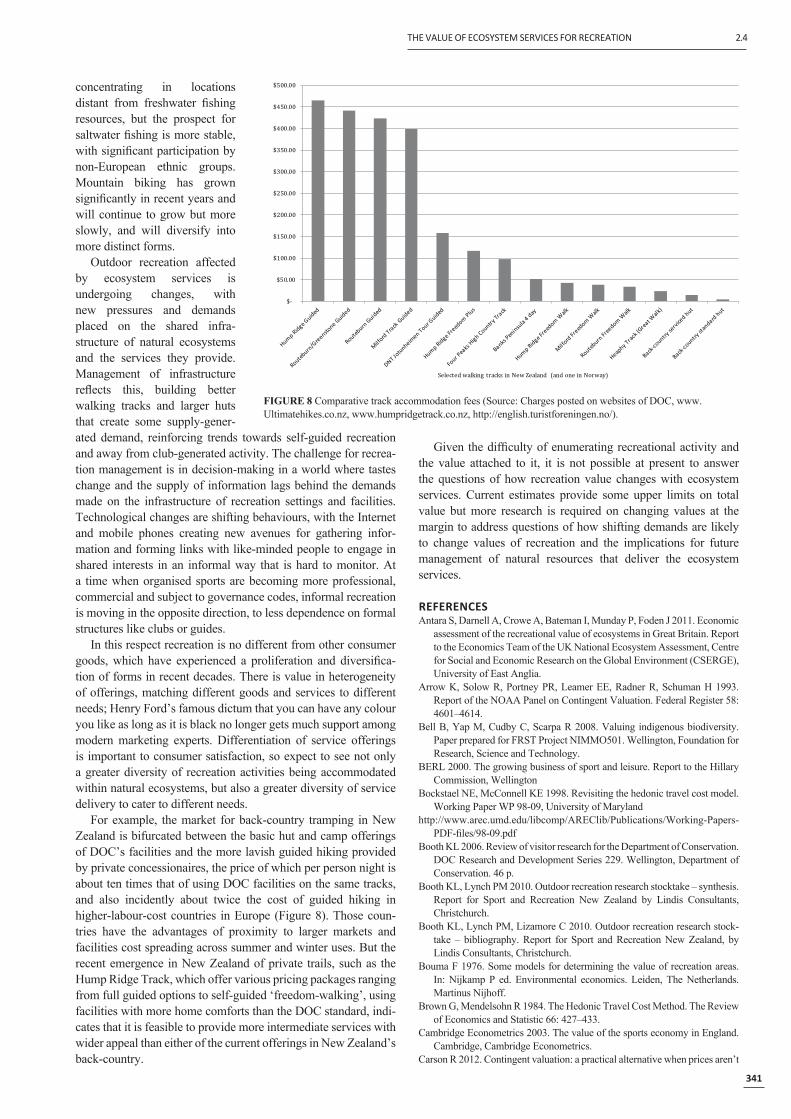
For example, the market for back-country tramping in New Zealand is bifurcated between the basic hut and camp offerings of DOC’s facilities and the more lavish guided hiking provided by private concessionaires, the price of which per person night is about ten times that of using DOC facilities on the same tracks, and also incidently about twice the cost of guided hiking in higher-labour-cost countries in Europe (Figure 8). Those coun-tries have the advantages of proximity to larger markets and facilities cost spreading across summer and winter uses. But the recent emergence in New Zealand of private trails, such as the Hump Ridge Track, which offer various pricing packages ranging from full guided options to self-guided ‘freedom-walking’, using facilities with more home comforts than the DOC standard, indi-cates that it is feasible to provide more intermediate services with wider appeal than either of the current offerings in New Zealand’s back-country.
Given the diffi culty of enumerating recreational activity and the value attached to it, it is not possible at present to answer the questions of how recreation value changes with ecosystem services. Current estimates provide some upper limits on total value but more research is required on changing values at the margin to address questions of how shifting demands are likely to change values of recreation and the implications for future management of natural resources that deliver the ecosystem services.
REFERENCESAntara S, Darnell A, Crowe A, Bateman I, Munday P, Foden J 2011. Economic
assessment of the recreational value of ecosystems in Great Britain. Report to the Economics Team of the UK National Ecosystem Assessment, Centre for Social and Economic Research on the Global Environment (CSERGE), University of East Anglia.
Arrow K, Solow R, Portney PR, Leamer EE, Radner R, Schuman H 1993. Report of the NOAA Panel on Contingent Valuation. Federal Register 58: 4601–4614.
Bell B, Yap M, Cudby C, Scarpa R 2008. Valuing indigenous biodiversity. Paper prepared for FRST Project NIMMO501. Wellington, Foundation for Research, Science and Technology.
BERL 2000. The growing business of sport and leisure. Report to the Hillary Commission, Wellington
Bockstael NE, McConnell KE 1998. Revisiting the hedonic travel cost model. Working Paper WP 98-09, University of Maryland
http://www.arec.umd.edu/libcomp/AREClib/Publications/Working-Papers-PDF-fi les/98-09.pdf
Booth KL 2006. Review of visitor research for the Department of Conservation. DOC Research and Development Series 229. Wellington, Department of Conservation. 46 p.
Booth KL, Lynch PM 2010. Outdoor recreation research stocktake – synthesis. Report for Sport and Recreation New Zealand by Lindis Consultants, Christchurch.
Booth KL, Lynch PM, Lizamore C 2010. Outdoor recreation research stock-take – bibliography. Report for Sport and Recreation New Zealand, by Lindis Consultants, Christchurch.
Bouma F 1976. Some models for determining the value of recreation areas. In: Nijkamp P ed. Environmental economics. Leiden, The Netherlands. Martinus Nijhoff.
Brown G, Mendelsohn R 1984. The Hedonic Travel Cost Method. The Review of Economics and Statistic 66: 427–433.
Cambridge Econometrics 2003. The value of the sports economy in England. Cambridge, Cambridge Econometrics.
Carson R 2012. Contingent valuation: a practical alternative when prices aren’t
FIGURE 8 Comparative track accommodation fees (Source: Charges posted on websites of DOC, www.Ultimatehikes.co.nz, www.humpridgetrack.co.nz, http://english.turistforeningen.no/).
$-
$50.00
$100.00
$150.00
$200.00
$250.00
$300.00
$350.00
$400.00
$450.00
$500.00
Selected walking tracks in New Zealand (and one in Norway)
2.4 THE VALUE OF ECOSYSTEM SERVICES FOR RECREATION
342
available. Journal of Economic Perspectives 26(4): 27–42.Clough P 2010. Realistic valuations of our clean green assets. NZIER Insight
19/2010 http://nzier.org.nz/sites/nzier.live.egressive.com/fi les/NZIER%20insight%2019%20-%20Realistic%20valuations%20of%20our%20clean%20green%20assets.pdf
Clough PWJ, Meister AD 1991. Allowing for multiple-site visitors in travel cost analysis. Journal of Environmental Management (London) 32: 115–125.
Dalziel P 2011. The economic and social value of sport and recreation to New Zealand. Report to Sport and Recreation New Zealand (SPARC). AERU Research Report 322. Lincoln, Lincoln University. http://researcharchive.lincoln.ac.nz/dspace/bitstream/10182/4315/1/aeru_rr_322.pdf
De Fries R, Pagiola S 2004. Analytical approaches for assessing ecosystem condition and human well-being; http://www.maweb.org/documents/document.271.aspx.pdf
Diamond PA, Hausman JA 1994. Contingent valuation: is some number better than no number? Journal of Economic Perspectives 8: 45–64.
Dignan A, Cessford G 2009. Outdoor recreation participation and incidents in New Zealand. Wellington, Mountain Safety Council Research Programme.
http://www.mountainsafety.org.nz/fi les/Participation-and-Incident-GC-Fixed.pdf
DOC 2004. Regional economic impacts of West Coast conservation land. Wellington, Department of Conservation.
DOC 2005. Regional economic impacts of Abel Tasman National Park and Queen Charlotte Track. Wellington, Department of Conservation.
DOC 2006a. Regional economic impacts of Fiordland National Park. Wellington, Department of Conservation.
DOC 2006b. The value of conservation – What does conservation contribute to the economy? Wellington, Department of Conservation.
DOC 2006c. New Zealand Recreation Summit – Mountains to the Sea – strate-gies for the future. Wellington, Department of Conservation.
http://www.doc.govt.nz/documents/getting-involved/consultations/consulta-tions-results/recreation-summit-outcomes.pdf
DOC 2011. Socio-economic effects of concession-based tourism in New Zealand’s National Parks. Wellington, Department of Conservation.
Fisher AC, Krutilla JV, Cicchetti CJ 1974. The economics of environmental preservation: a theoretical and empirical analysis. American Economic Review 65: 605–619.
Frontier Economics 2009. The economic contribution of sport to Australia. Report to the Australian Sport Commission.
Ghermandi A, Nunes P, Portela R, Rao N, Teelucksingh S 2009. Recreational, cultural and aesthetic services from estuarine and coastal ecosystems. Working Paper 121.2009. Milan, Italy, Fondazione Eni Enrico Mattei. www.feem.it
Hanley N, MacMillan D, Wright RE, Bullock C, Simpson I, Parisson D, Crabtree R 1998. Contingent valuation versus choice experiments: esti-mating the benefi ts of Environmentally Sensitive Areas in Scotland. Journal of Agricultural Economics 49: 1–15.
Haussman J 2012. Contingent valuation: from dubious to hopeless. Journal of Economic Perspectives 26: 43–56.
Kaval P, Yao R 2007. New Zealand outdoor recreation benefi ts. Working Paper in Economics 07/14. Hamilton, University of Waikato. http://ideas.repec.org/p/wai/econwp/07-14.html
Kerr GN, Sharp BMH 2004. Benefi t transfer: choice experiment results; Paper to the New Zealand Agricultural and Resource Economics Society Conference (NZARES).
Kling CL, Planeuf DJ, Zhao J 2012. From Exxon to BP: has some number become better than no number? Journal of Economic Perspectives 26: 3–26.
Krutilla J 1967. Conservation reconsidered. American Economic Review 57: 787–796.
Lincoln University 2012. Non-market Valuation Database. http://www2.lincoln.ac.nz/nonmarketvaluation/
Lovelock B, Farminer A, Reis AC 2011a. A synthesis and gap analysis of research on visitors to public conservation areas in New Zealand 1995-2010. Wellington, Department of Conservation.
Lovelock B, Farminer A, Reis AC 2011b. A bibliography of research on visi-tors to public conservation areas in New Zealand 1995–2010. Wellington, Department of Conservation.
McAlpine KG, Wotton DM 2009. Conservation and delivery of ecosystem services. Report to Department of Conservation, Wellington.
Medibank Private 2008. The cost of physical inactivity. http://www.medibank.com.au/Client/Documents/Pdfs/The_Cost_Of_Physical_Inactivity_08.pdf
Millennium Ecosystem Assessment 2003. Concepts of ecosystem valuation.
Chapter 6 in Ecosystems and human well-being: a framework for assess-ment. Washington, DC, Island Press. http://www.maweb.org/documents/document.304.aspx.pdf
Millennium Ecosystem Assessment 2005. Ecosystems and human well-being: synthesis. Washington, DC, Island Press.
Miller ER, Guria J 1991. The value of statistical life in New Zealand. Wellington, Ministry of Transport.
Ministry of Tourism 2009. Tourism sector profi le: nature-based tourism. Wellington, Ministry of Tourism.
Nimmo-Bell 2011. Biodiversity valuation manual. Technical manual. Wellington, Ministry of Agriculture and Fisheries Biosecurity New Zealand.
OECD 1994. Project and policy appraisal: Integrating economics and environ-ment. Paris, OECD.
Peterson GL, Swanson CS, McCollum D, Thomas M 1992. Valuing wildlife resources in Alaska. Boulder, CO, Westview Press.
Portney P 1994. The contingent valuation debate: why economists should care. Journal of Economic Perspectives 8: 3–17.
Sharp B, Kerr G 2005, Option and existence values for the Waitaki catchment. Report to Ministry for the Environment
http://www.mfe.govt.nz/publications/water/waitaki-option-existence-values-jan05/waitaki-option-existence-values-jan05.pdf
Sport and Recreation Tasmania 2012. The value of sport and recreation to Tasmania
http://www.development.tas.gov.au/__data/assets/pdf_file/0016/47122/Summary_-_12_July.PDF
SPARC 2008a. Outdoor recreation strategy 2009–2015. Wellington, Sport and Recreation New Zealand.
SPARC 2008b. Outdoor recreation review initial fi ndings report, Wellington, Sport and Recreation New Zealand. http://www.srknowledge.org.nz/research-completed/sport-nz-outdoor-recreation-review-initial-fi ndings-report-july-2008/
SPARC 2009. Active New Zealand survey 2007–2008; Wellington, Sport and Recreation New Zealand.
Spash C, Stagl S, Getzner M 2005. Exploring alternatives to environmental valuation, In: Getzner M, Spash C, Stagle S eds Alternatives for environ-mental valuation. London, Routledge. Pp. 1–20.
Statistics New Zealand 2012. Tourism Satellite Account: 2012. Wellington, Statistics New Zealand. Available from www.stats.govt.nz.
Tourism Resource Consultants 2009. Economic value of visitors to New Zealand – synthesis of existing research. Report to Ministry of Tourism, Wellington.
UK National Ecosystem Assessment 2011. Synthesis of key fi ndings. http://uknea.unep-wcmc.org/Resources/tabid/82/Default.aspxYao R, Kaval P 2007. Non-market valuation in New Zealand: 1974 through
2005. Working Paper in Economics 07/17. Hamilton, University of Waikato.
ENDNOTES1 A missing market is a form of market failure, caused by absence of condi-
tions for markets to emerge, such as high transaction costs, poorly defi ned property rights, or potential for free-riding behaviour on the services provided by others.
2 Recreation participants may also have ‘fellow travellers’ who accompany them to recreation areas but do not participate in the recreation activity, but the ratio of these to active participants is much smaller than that for spectator sports.
3 An externality is an effect of an action by one party that falls on third parties without invitation or compensation.
4 National Oceanic and Atmospheric Administration, Washington DC, www.noaa.gov/
5 Economic value added (EVA) = (Income – Expenses (including wages and salaries and depreciation) – Tax + Interest)-(Total Capital × Weighted Average Cost of Capital). This differs from the Value Added or GDP contri-bution in which VA = Operating Surplus + Employee Compensation + Fixed Capital Consumption (depreciation) + Net Indirect Taxes. VA identi-fi es the return on factors in production from a national perspective – owner’s equity, labour, fi xed capital and government – whereas EVA takes a private business perspective of income to the business after costs outlaid.