Embed Size (px)
Citation preview
Ecosystem Services: biophysical dimensions of value
SUMMARY
This lecture focuses on the physical ways ecosystem benefits
are produced, used and transferred to beneficiaries.
Improving the efficiency of ecosystem services transfer from
Nature to humans can be an effective adaptation strategy, as
opposed to reducing consumption or finding new ways for
production
Ferdinando Villa, BC3
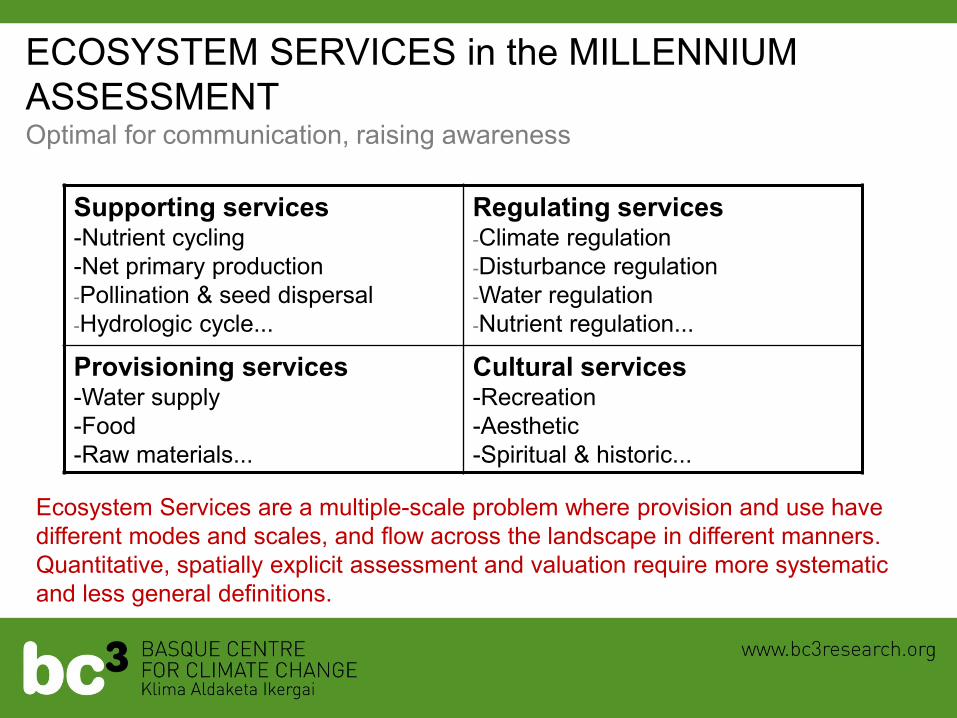
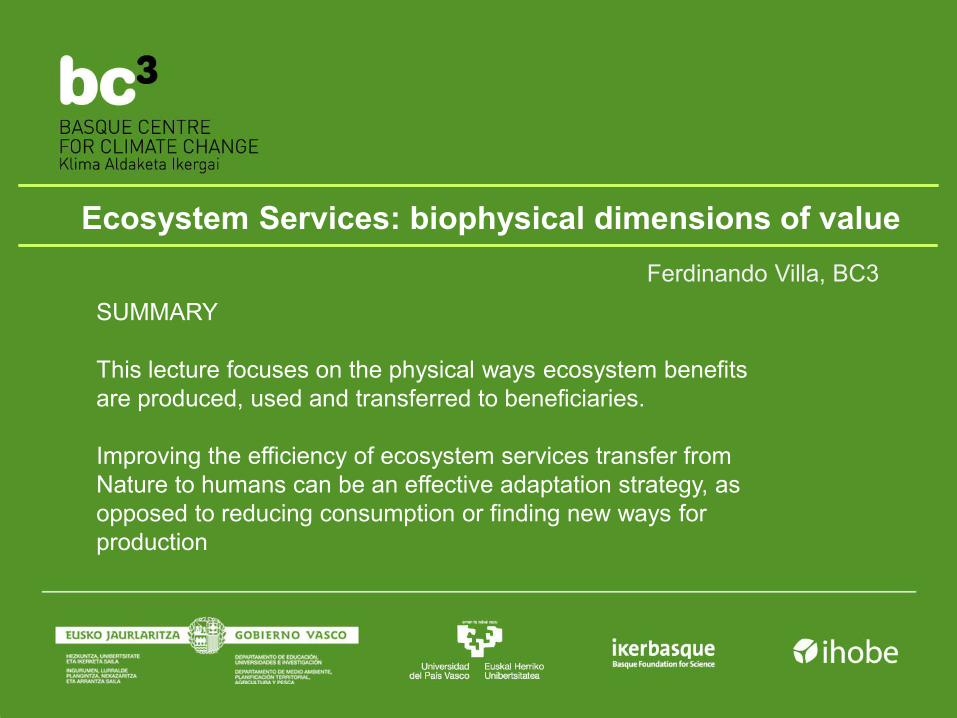
Supporting services -Nutrient cycling
-Net primary production
-Pollination & seed dispersal
-Hydrologic cycle...
Regulating services -Climate regulation
-Disturbance regulation
-Water regulation
-Nutrient regulation...
Provisioning services -Water supply
-Food
-Raw materials...
Cultural services -Recreation
-Aesthetic
-Spiritual & historic...
ECOSYSTEM SERVICES in the MILLENNIUM
ASSESSMENT Optimal for communication, raising awareness
Ecosystem Services are a multiple-scale problem where provision and use have
different modes and scales, and flow across the landscape in different manners.
Quantitative, spatially explicit assessment and valuation require more systematic
and less general definitions.
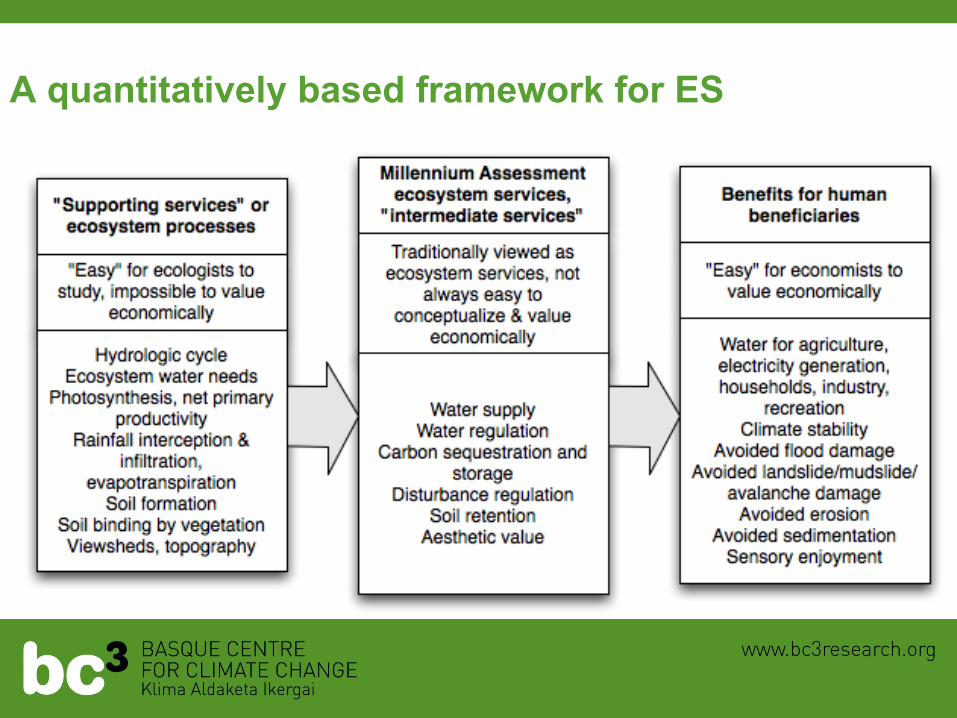
A quantitatively based framework for ES
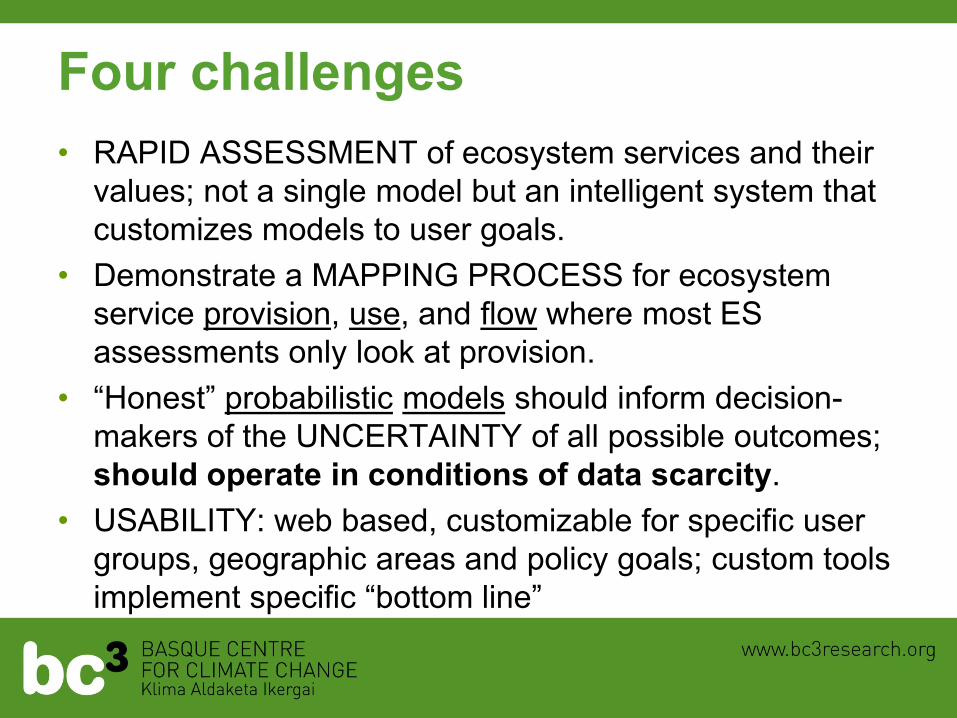
Four challenges
• RAPID ASSESSMENT of ecosystem services and their
values; not a single model but an intelligent system that
customizes models to user goals.
• Demonstrate a MAPPING PROCESS for ecosystem
service provision, use, and flow where most ES
assessments only look at provision.
• “Honest” probabilistic models should inform decision-
makers of the UNCERTAINTY of all possible outcomes;
should operate in conditions of data scarcity.
• USABILITY: web based, customizable for specific user
groups, geographic areas and policy goals; custom tools
implement specific “bottom line”
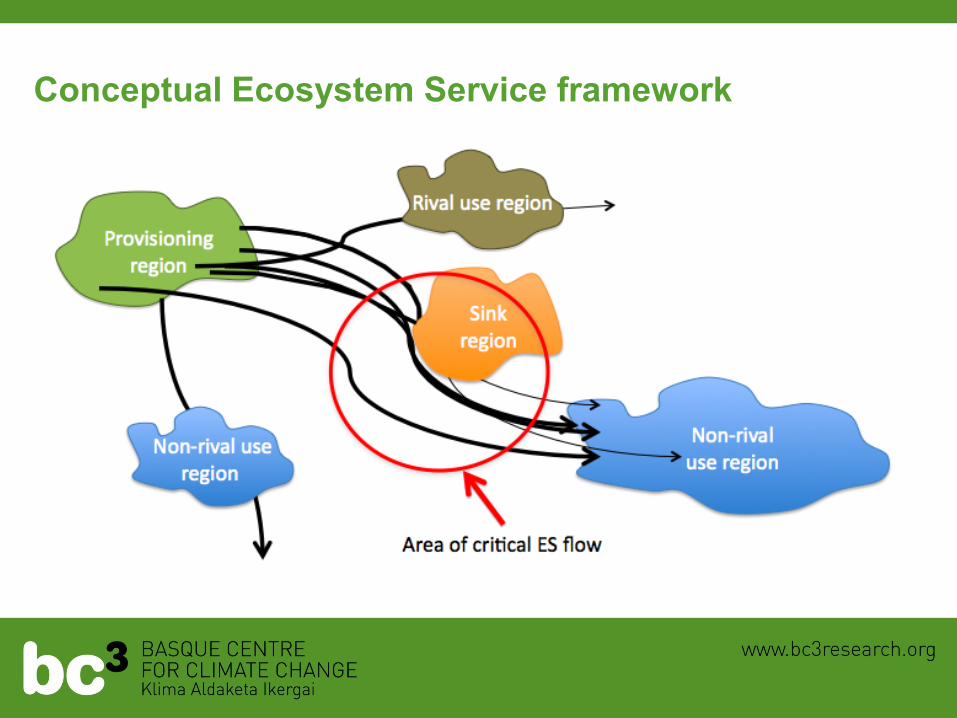
Conceptual Ecosystem Service framework
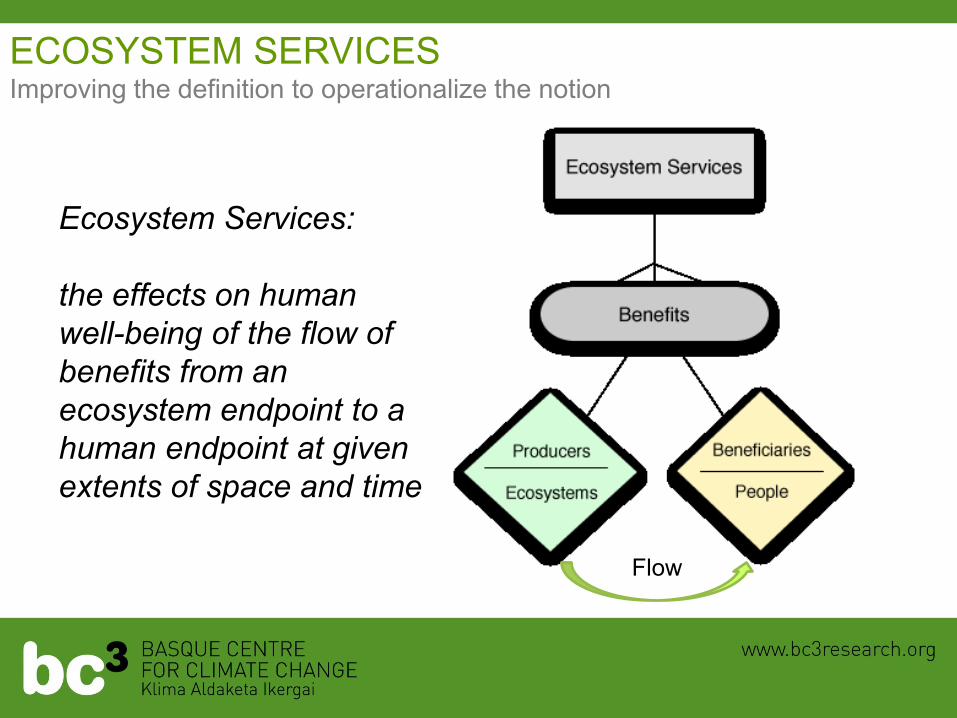
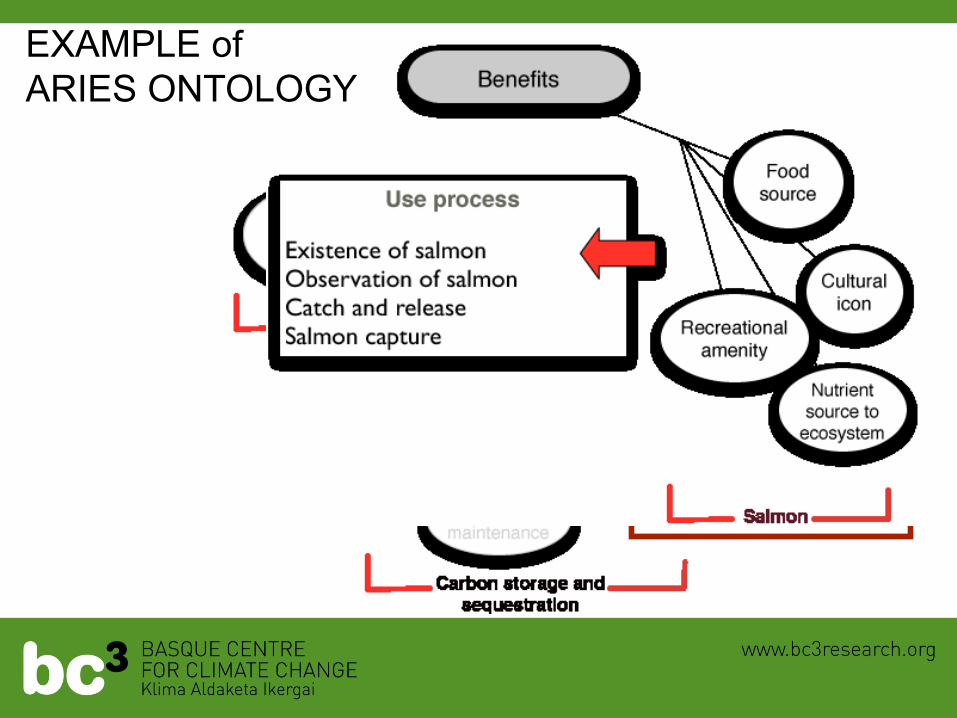
ECOSYSTEM SERVICES Improving the definition to operationalize the notion
Flow
Ecosystem Services:
the effects on human
well-being of the flow of
benefits from an
ecosystem endpoint to a
human endpoint at given
extents of space and time
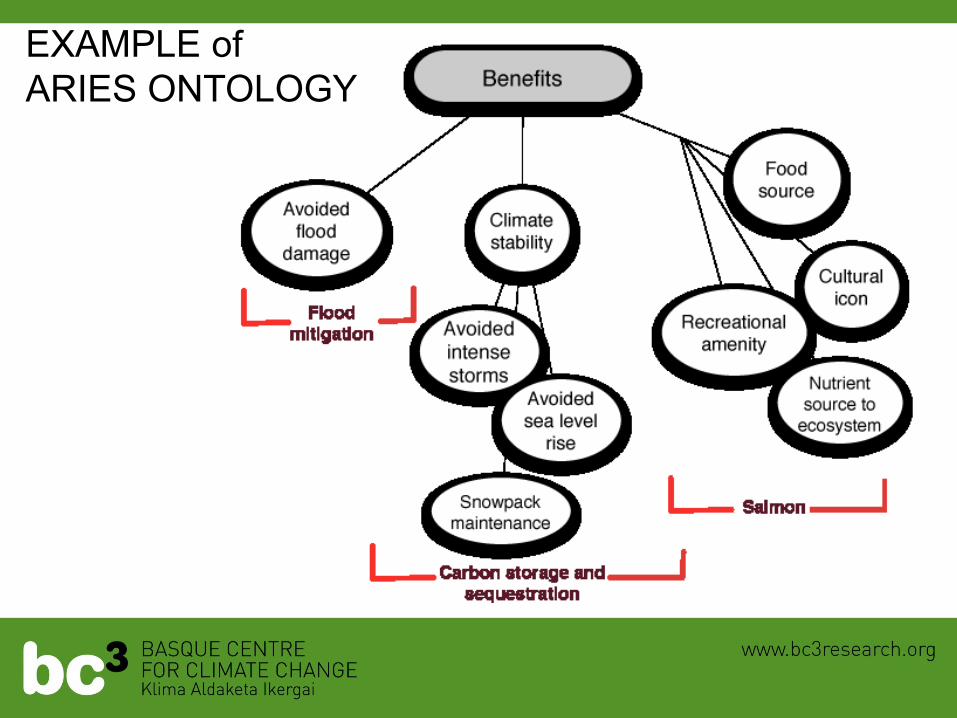
EXAMPLE of
ARIES ONTOLOGY
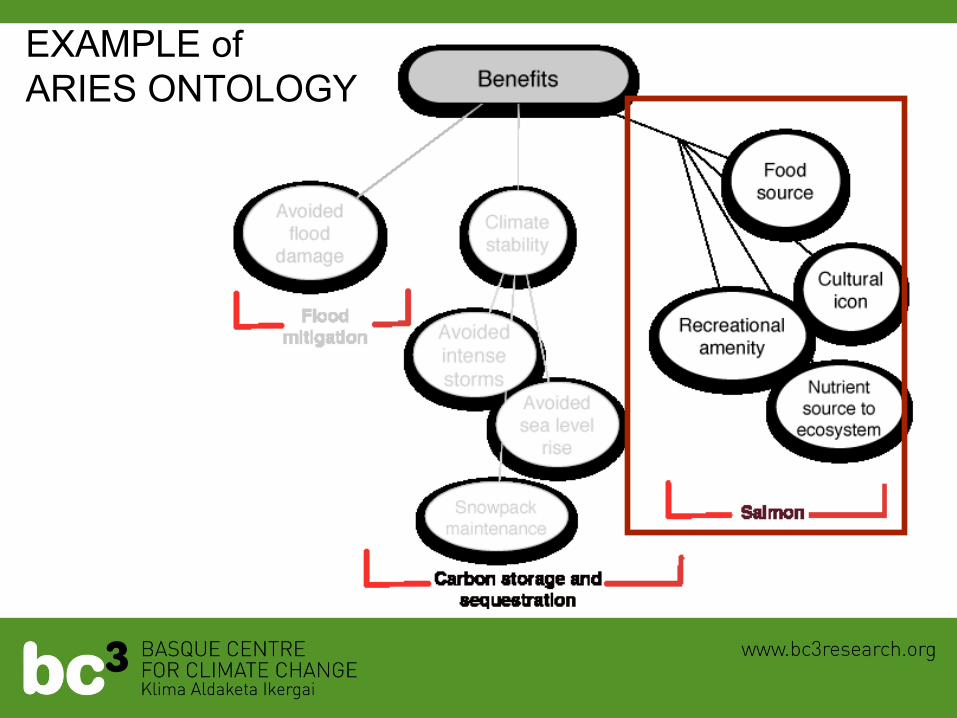
EXAMPLE of
ARIES ONTOLOGY
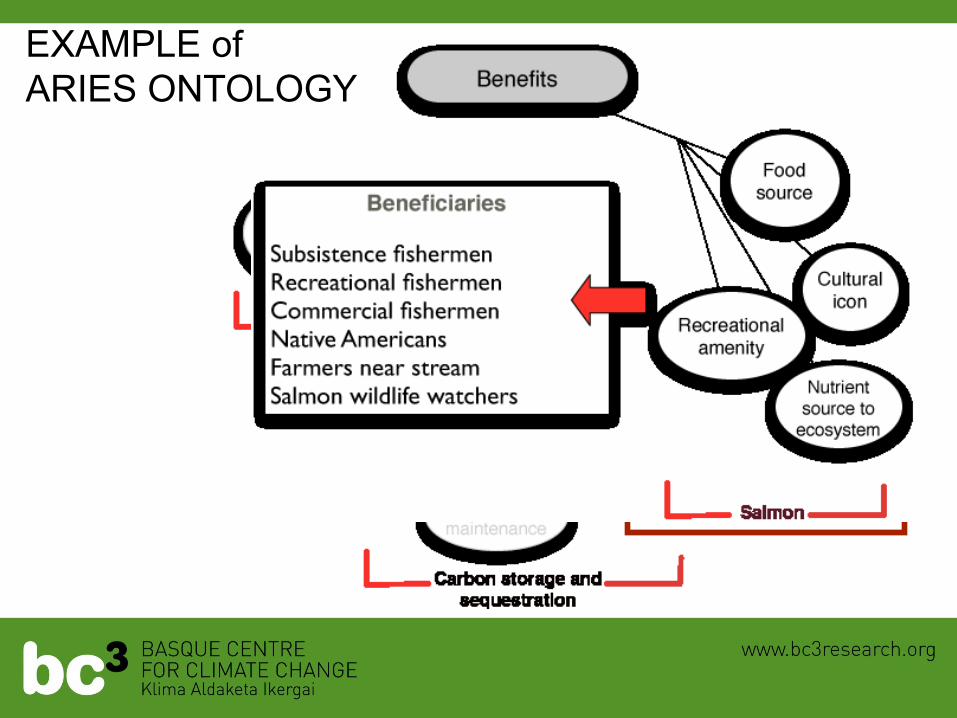
EXAMPLE of
ARIES ONTOLOGY
EXAMPLE of
ARIES ONTOLOGY
12
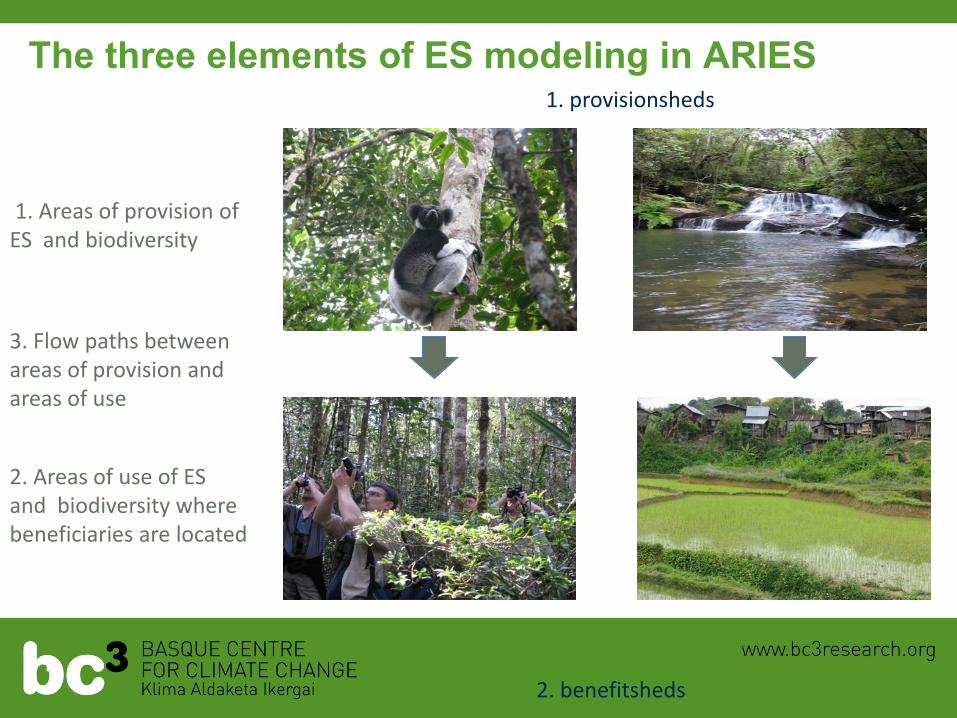
3. Flow paths between areas of provision and areas of use
The three elements of ES modeling in ARIES 1. provisionsheds
2. benefitsheds
1. Areas of provision of ES and biodiversity
2. Areas of use of ES and biodiversity where beneficiaries are located
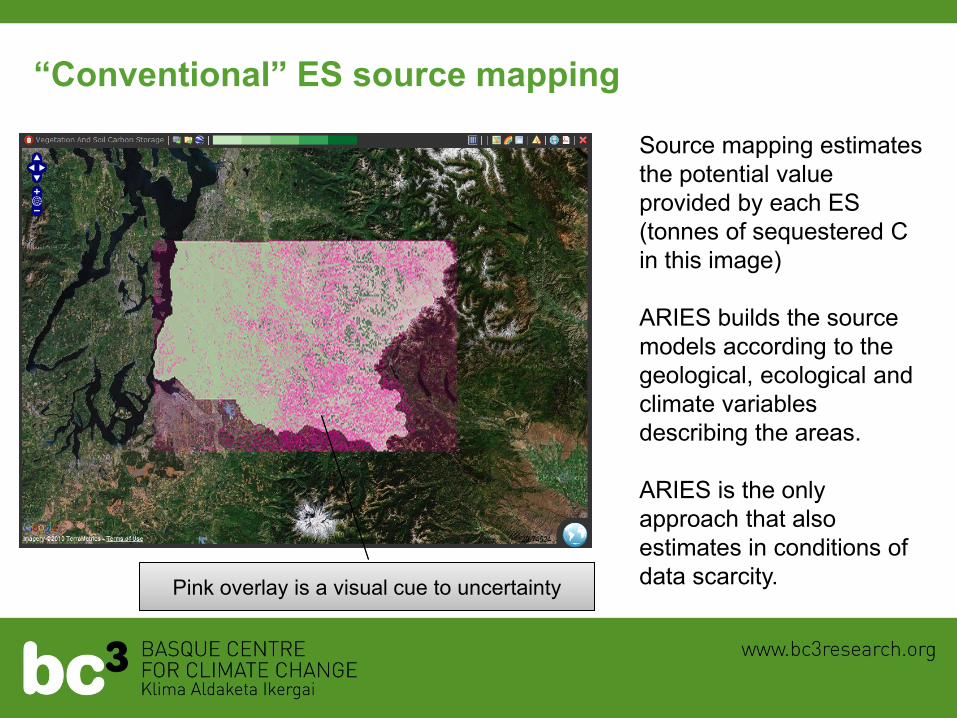
“Conventional” ES source mapping
Source mapping estimates
the potential value
provided by each ES
(tonnes of sequestered C
in this image)
ARIES builds the source
models according to the
geological, ecological and
climate variables
describing the areas.
ARIES is the only
approach that also
estimates in conditions of
data scarcity. Pink overlay is a visual cue to uncertainty Pink overlay is a visual cue to uncertainty
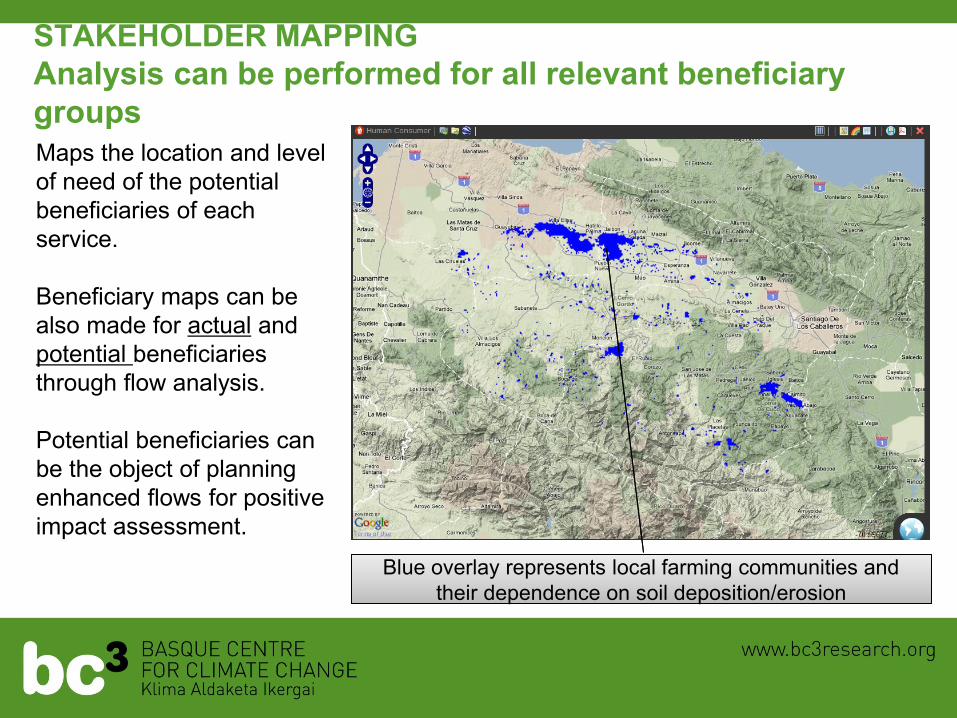
STAKEHOLDER MAPPING
Analysis can be performed for all relevant beneficiary
groups
Maps the location and level
of need of the potential
beneficiaries of each
service.
Beneficiary maps can be
also made for actual and
potential beneficiaries
through flow analysis.
Potential beneficiaries can
be the object of planning
enhanced flows for positive
impact assessment.
Blue overlay represents local farming communities and
their dependence on soil deposition/erosion
Blue overlay represents local farming communities and
their dependence on soil deposition/erosion
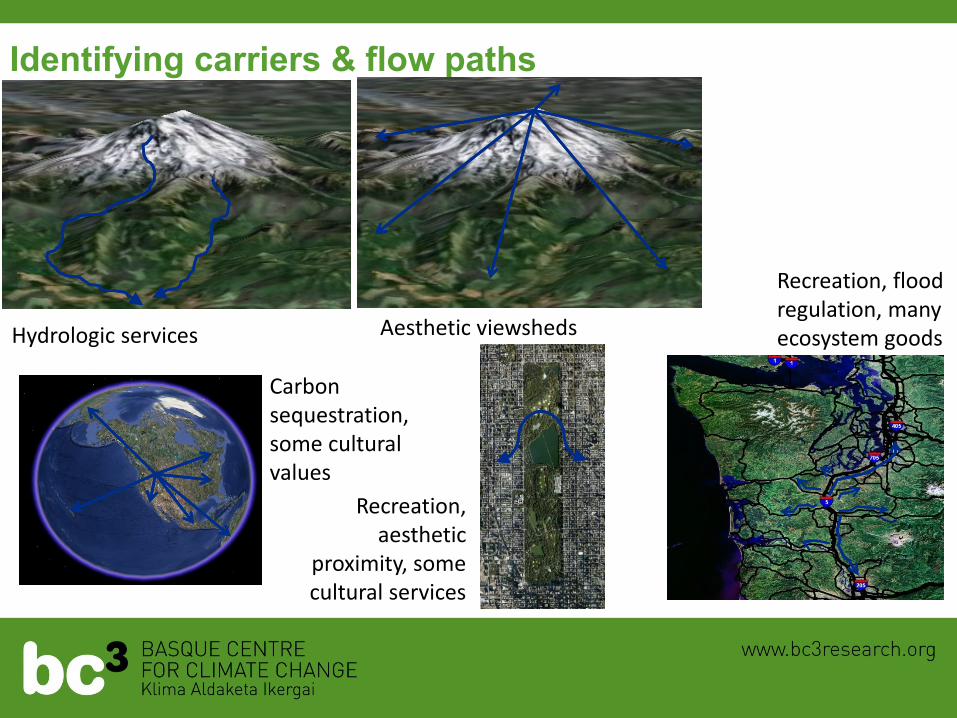
Identifying carriers & flow paths
Hydrologic services Aesthetic viewsheds
Recreation, aesthetic
proximity, some cultural services
Carbon sequestration, some cultural values
Recreation, flood regulation, many ecosystem goods
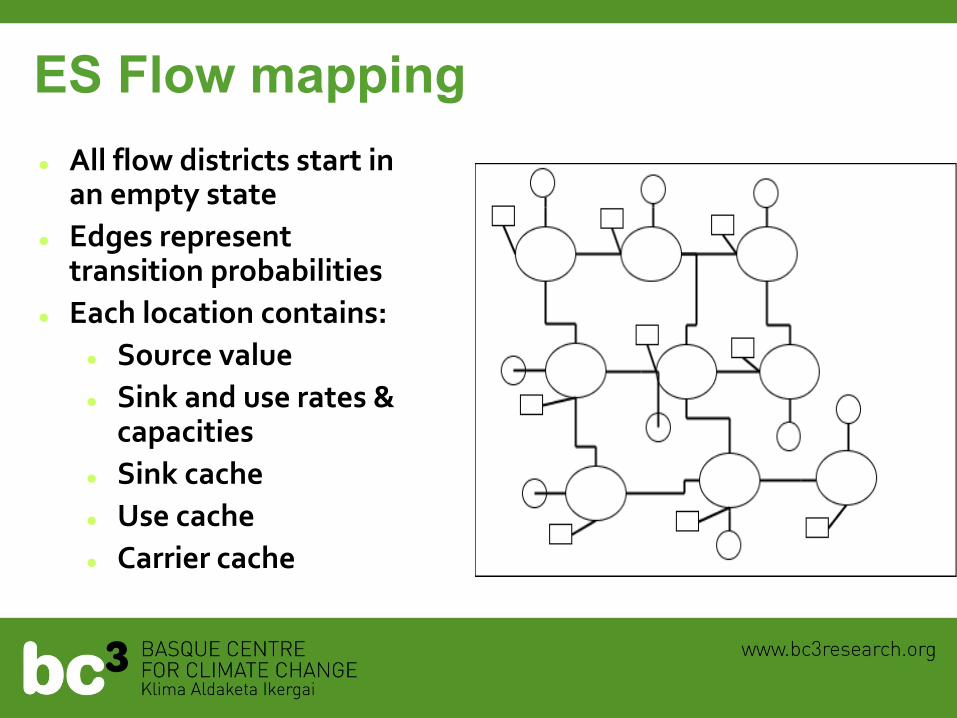
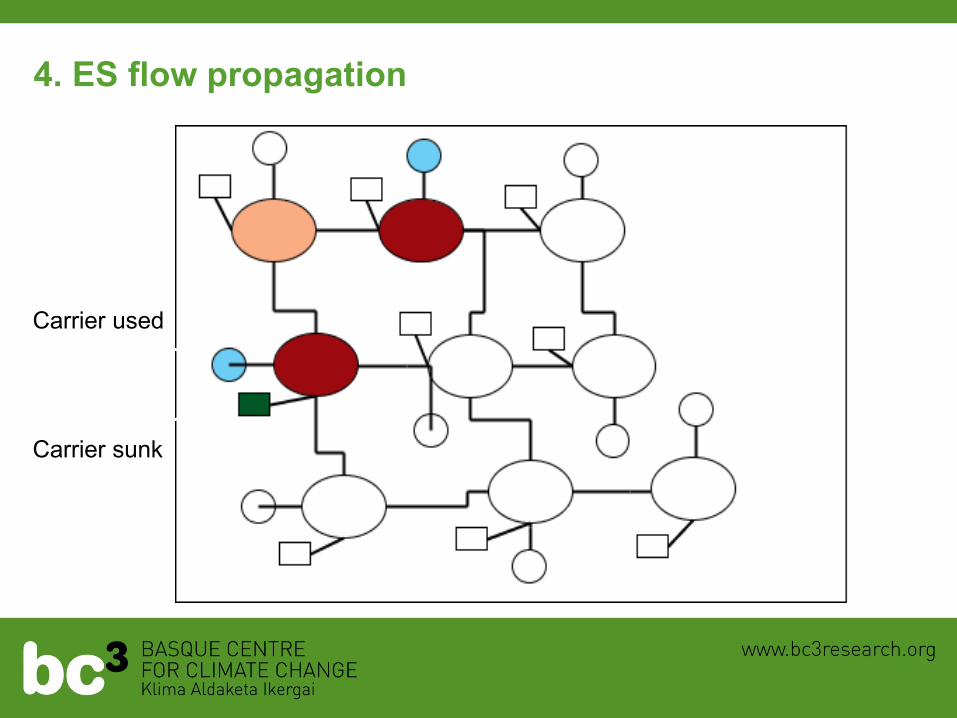
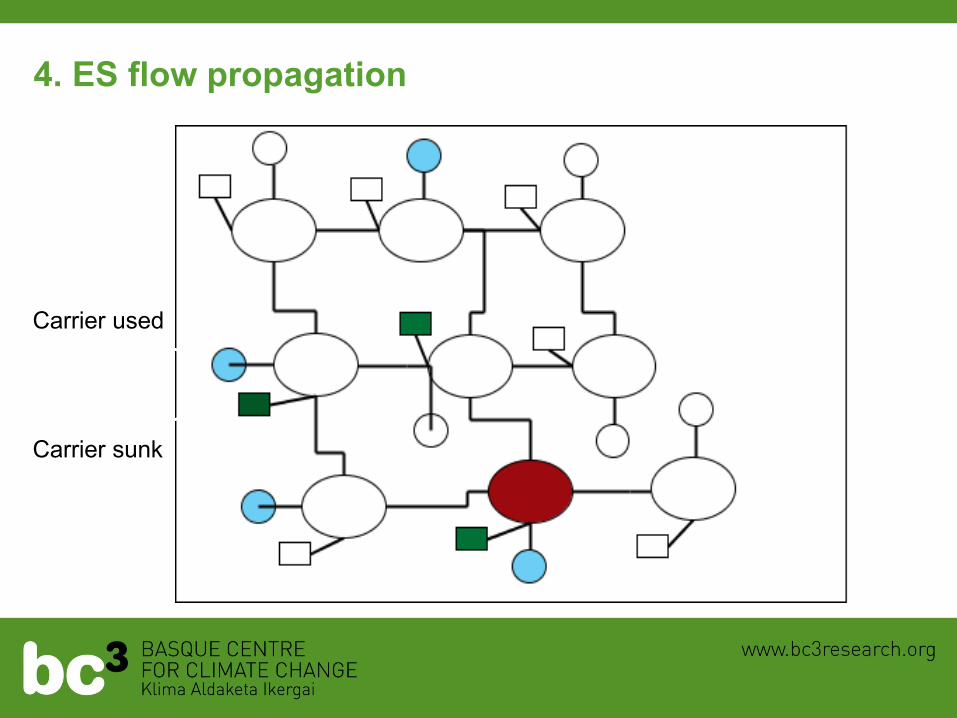
ES Flow mapping
All flow districts start in
an empty state
Edges represent transition probabilities
Each location contains:
Source value
Sink and use rates & capacities
Sink cache
Use cache
Carrier cache
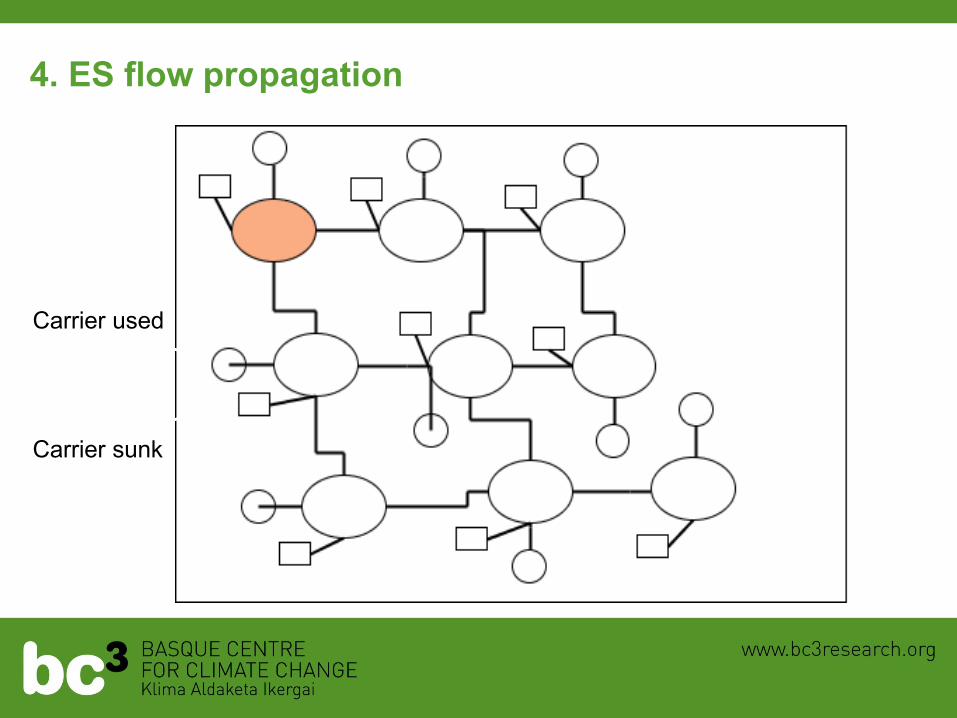
Carrier used
Carrier sunk
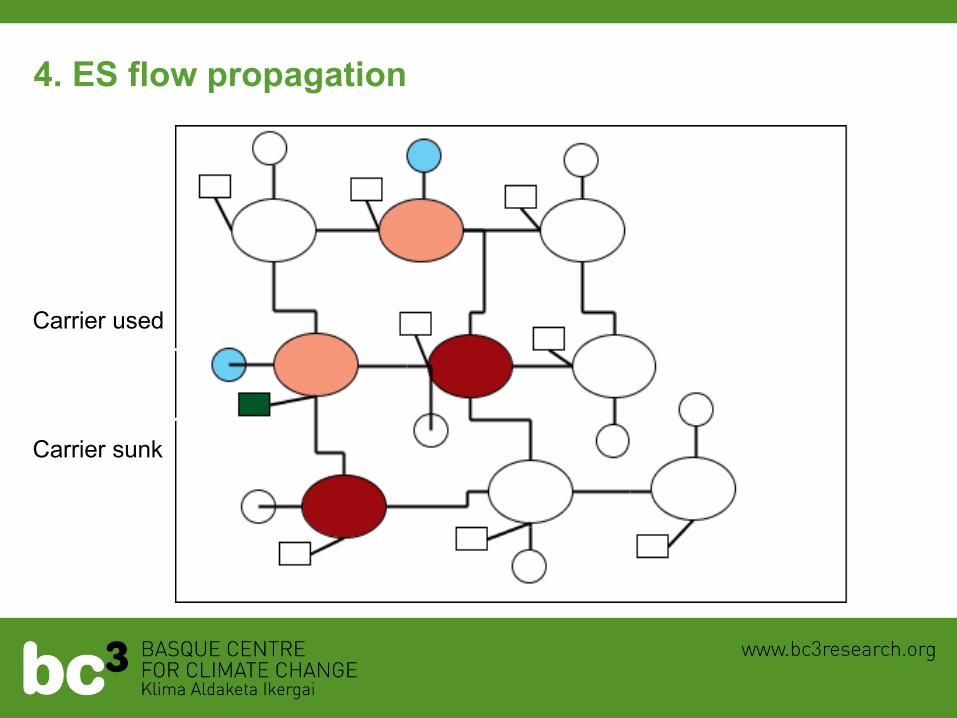
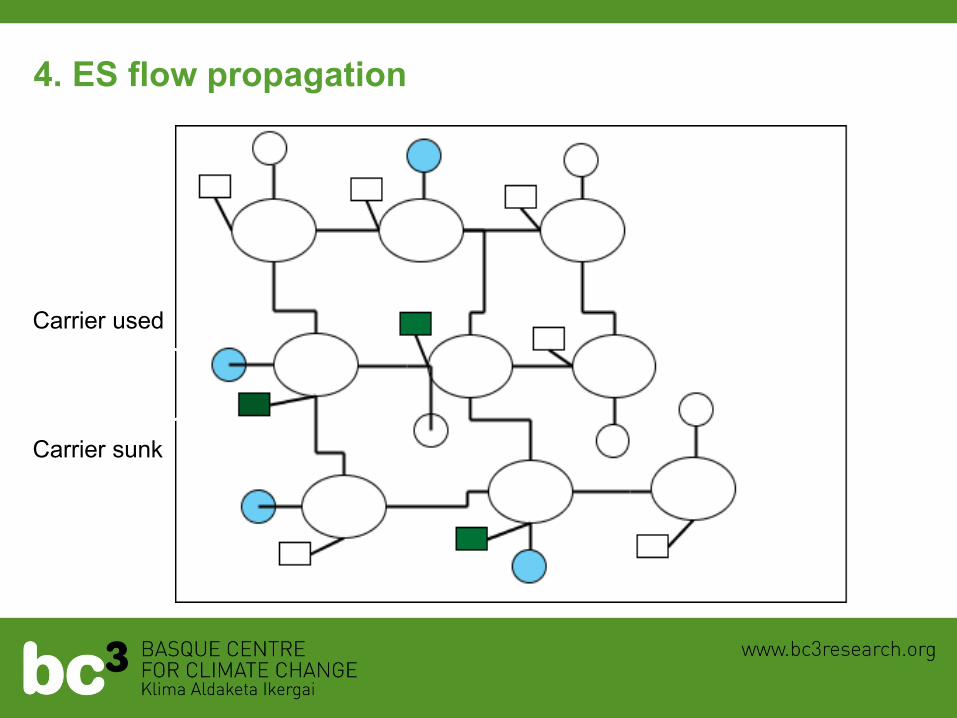
4. ES flow propagation
4. ES flow propagation
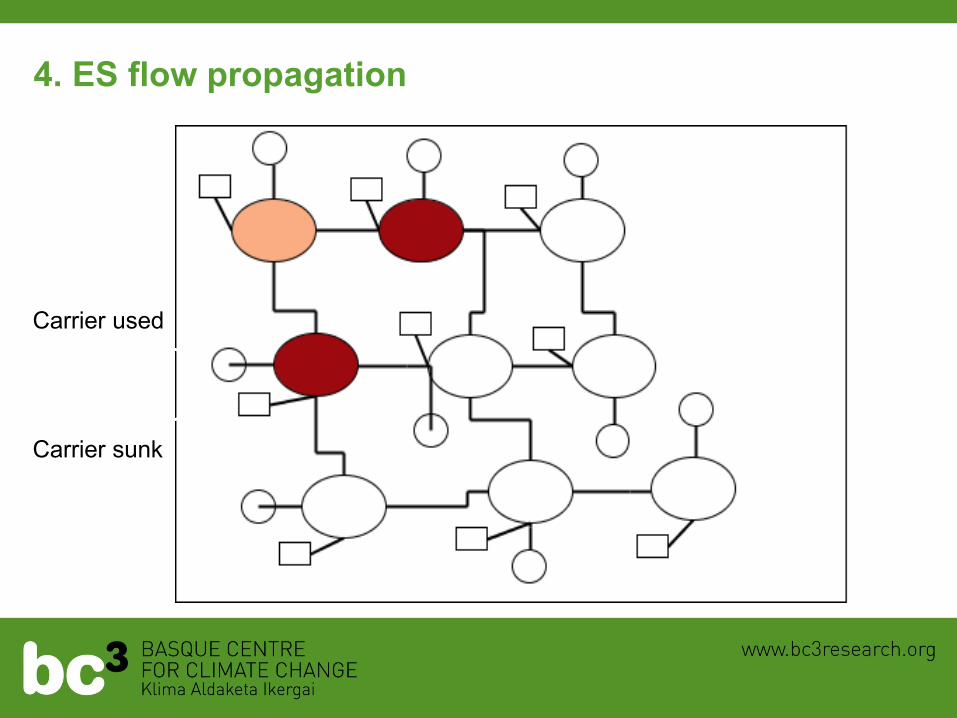
Carrier used
Carrier sunk
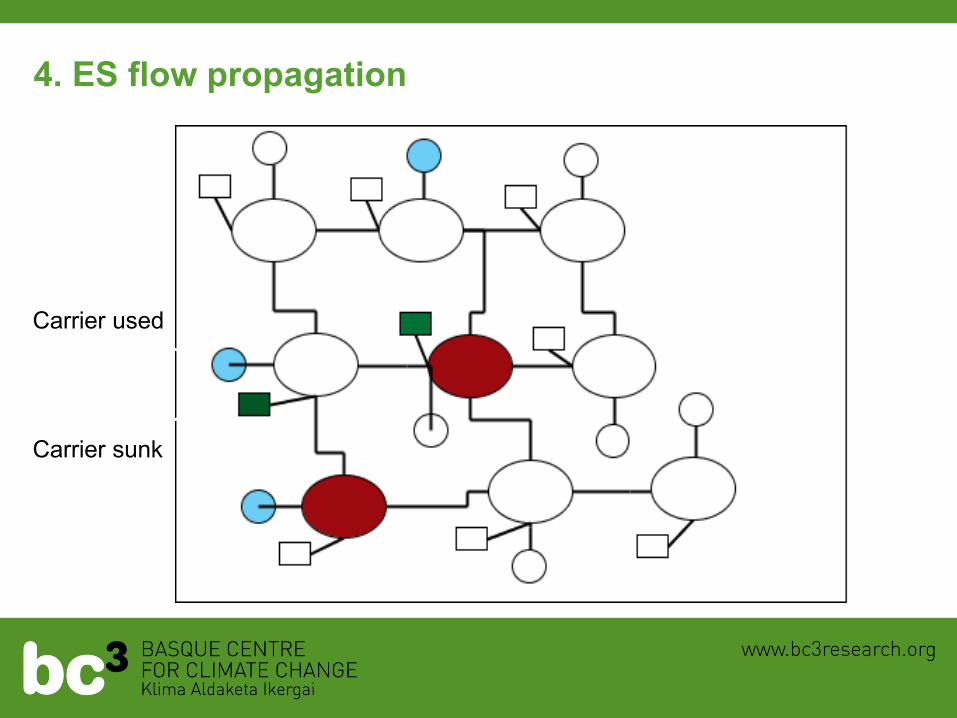
4. ES flow propagation
Carrier used
Carrier sunk
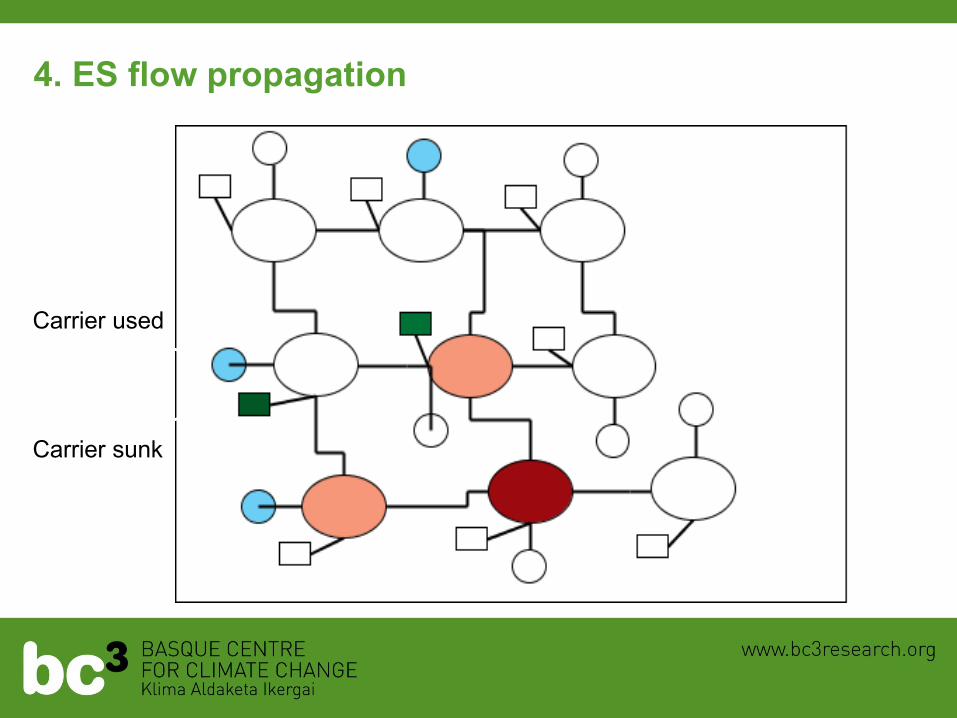
4. ES flow propagation
Carrier used
Carrier sunk
4. ES flow propagation
Carrier used
Carrier sunk
4. ES flow propagation
Carrier used
Carrier sunk
4. ES flow propagation
Carrier used
Carrier sunk
4. ES flow propagation
Carrier used
Carrier sunk
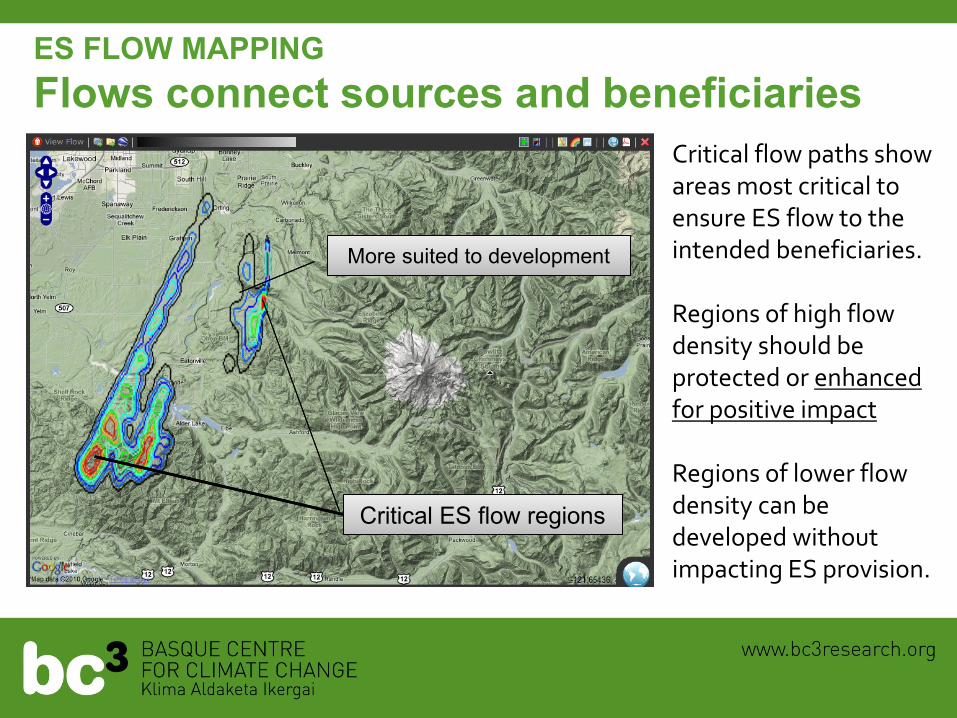
ES FLOW MAPPING
Flows connect sources and beneficiaries
Critical flow paths show areas most critical to ensure ES flow to the intended beneficiaries. Regions of high flow density should be protected or enhanced for positive impact Regions of lower flow density can be developed without impacting ES provision.
Critical ES flow regions Critical ES flow regions
More suited to development More suited to development
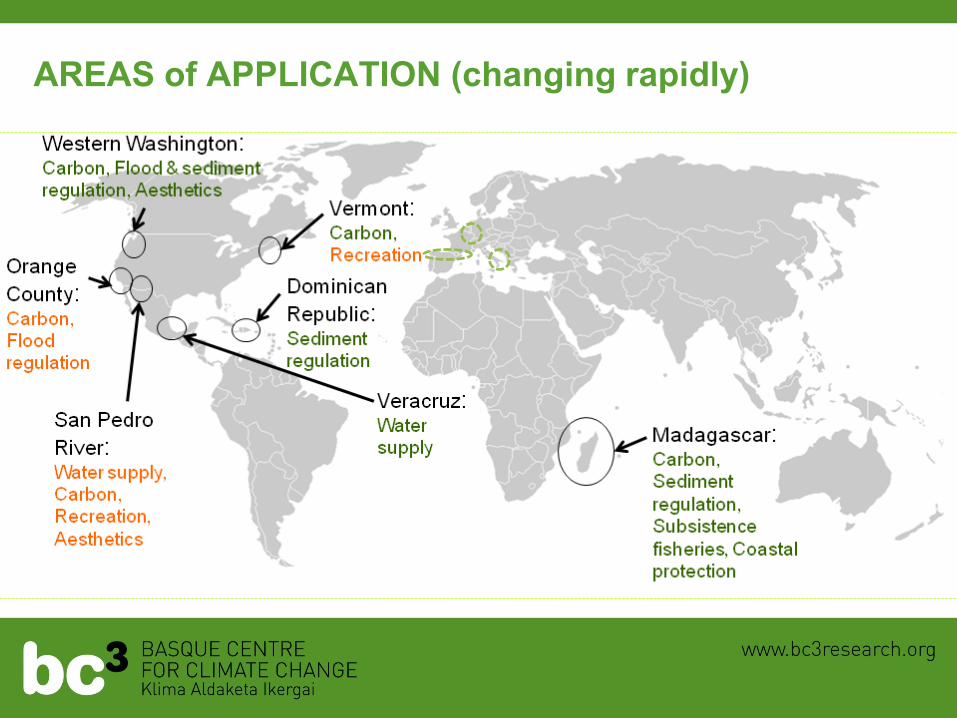
AREAS of APPLICATION (changing rapidly)
27
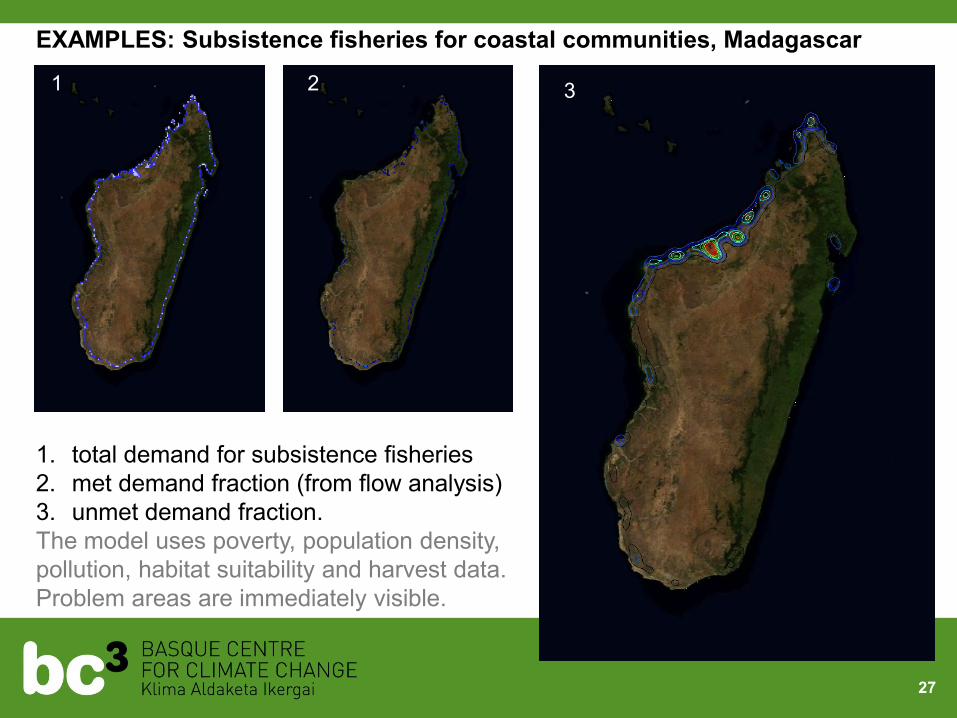
1. total demand for subsistence fisheries
2. met demand fraction (from flow analysis)
3. unmet demand fraction.
The model uses poverty, population density,
pollution, habitat suitability and harvest data.
Problem areas are immediately visible.
1 2 3
EXAMPLES: Subsistence fisheries for coastal communities, Madagascar
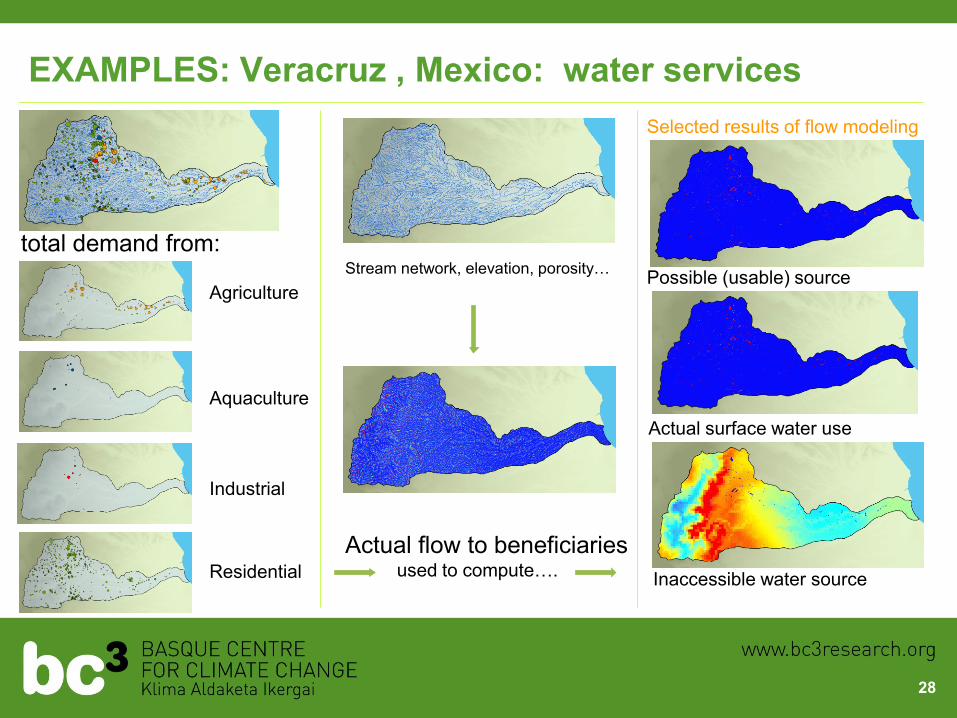
EXAMPLES: Veracruz , Mexico: water services
28
total demand from:
Agriculture
Aquaculture
Industrial
Residential
Actual flow to beneficiaries used to compute….
Stream network, elevation, porosity…
Selected results of flow modeling
Possible (usable) source
Actual surface water use
Inaccessible water source
What about ECONOMIC VALUATION?
ARIES is agnostic about valuation and tries to counteract inaccuracy in the “state of
the art” by incorporating:
• explicit uncertainty
• flexible definition of value
• flexibility and innovation in methods
• validation opportunities.
VALUE can be BASED ON:
ACTUAL or POTENTIAL physical flows or source values
Concordance value with stakeholder priorities
• MCA (Electre3, Prometheus, Evamix)
• AHP
Economic valuation
• Bayesian and Econometric modeling can be easily integrated
• Intelligent benefit transfer methods are in development
29

Josh’s slide with curve, get from Ferd
Natural Capital Stocks
Mar
gina
l Val
ue
Valuable: elastic demand. Elastic demand: Values change
slowly with supply, and change is
reversible
Critical: Perfectly
inelastic demand Marginal valuation no
longer relevant
Important:
inelastic demand Values highly
sensitive to supply
Natural Capital stocks
Marg
inal valu
e
Susta
inabili
ty T
hre
shold
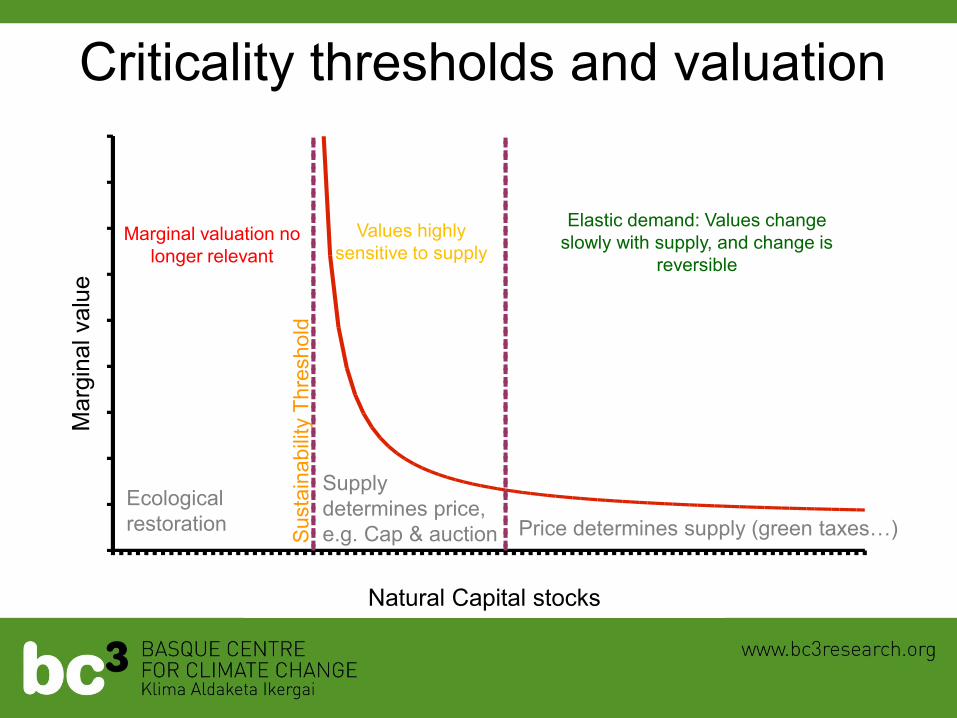
Ecological
restoration
Supply
determines price,
e.g. Cap & auction Price determines supply (green taxes…)
Criticality thresholds and valuation
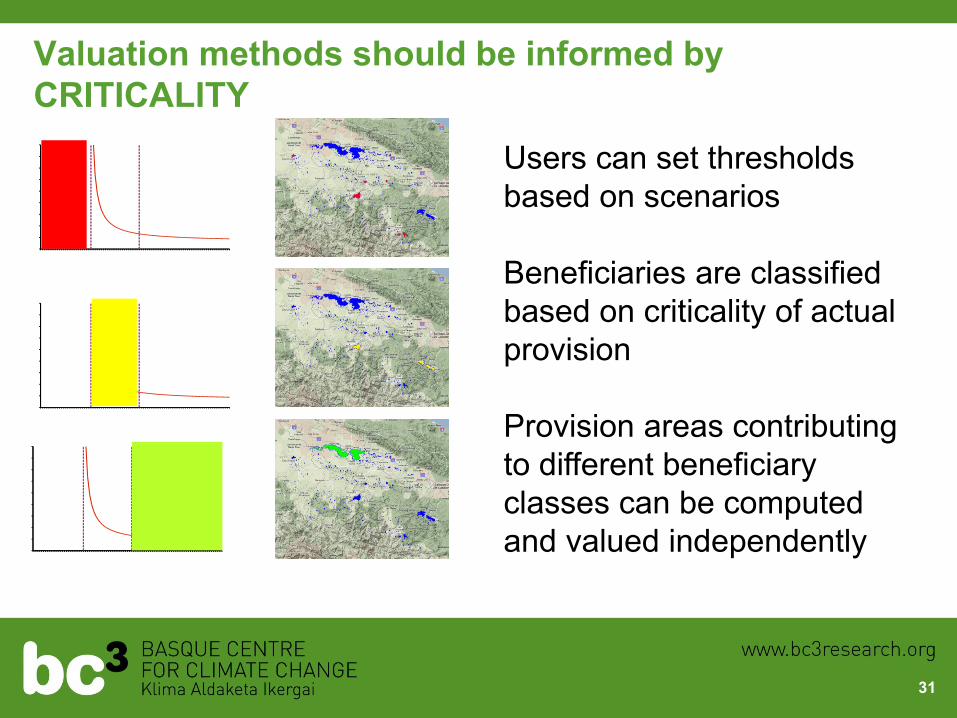
Valuation methods should be informed by
CRITICALITY
31
Natural Capital Stocks
Mar
gina
l Val
ue
Natural Capital Stocks
Mar
gina
l Val
ue
Natural Capital Stocks
Mar
gina
l Val
ue
Users can set thresholds
based on scenarios
Beneficiaries are classified
based on criticality of actual
provision
Provision areas contributing
to different beneficiary
classes can be computed
and valued independently
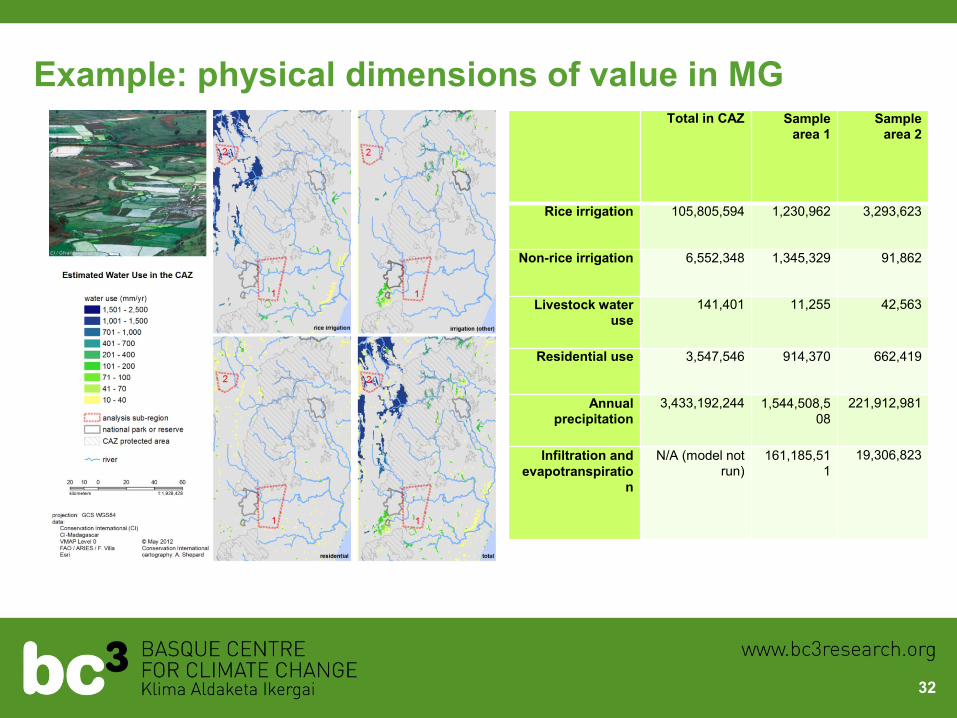
Example: physical dimensions of value in MG
32
Total in CAZ Sample
area 1 Sample
area 2
Rice irrigation 105,805,594 1,230,962 3,293,623
Non-rice irrigation 6,552,348 1,345,329 91,862
Livestock water
use 141,401 11,255 42,563
Residential use 3,547,546 914,370 662,419
Annual
precipitation 3,433,192,244 1,544,508,5
08 221,912,981
Infiltration and
evapotranspiratio
n
N/A (model not
run) 161,185,51
1 19,306,823
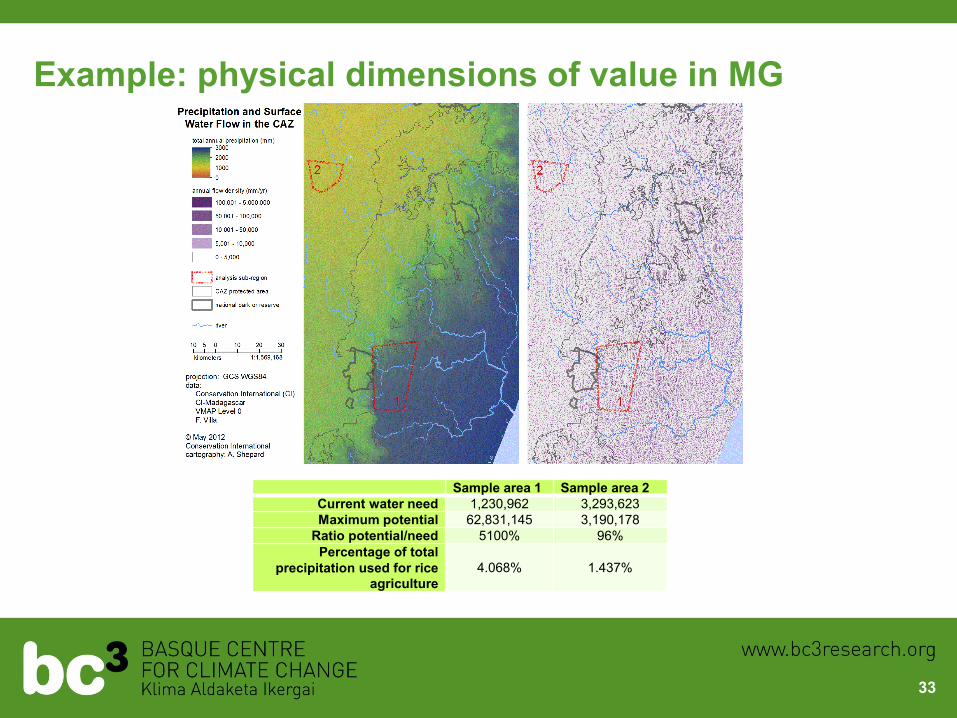
Example: physical dimensions of value in MG
33
Sample area 1 Sample area 2 Current water need 1,230,962 3,293,623 Maximum potential 62,831,145 3,190,178
Ratio potential/need 5100% 96% Percentage of total
precipitation used for rice
agriculture 4.068% 1.437%
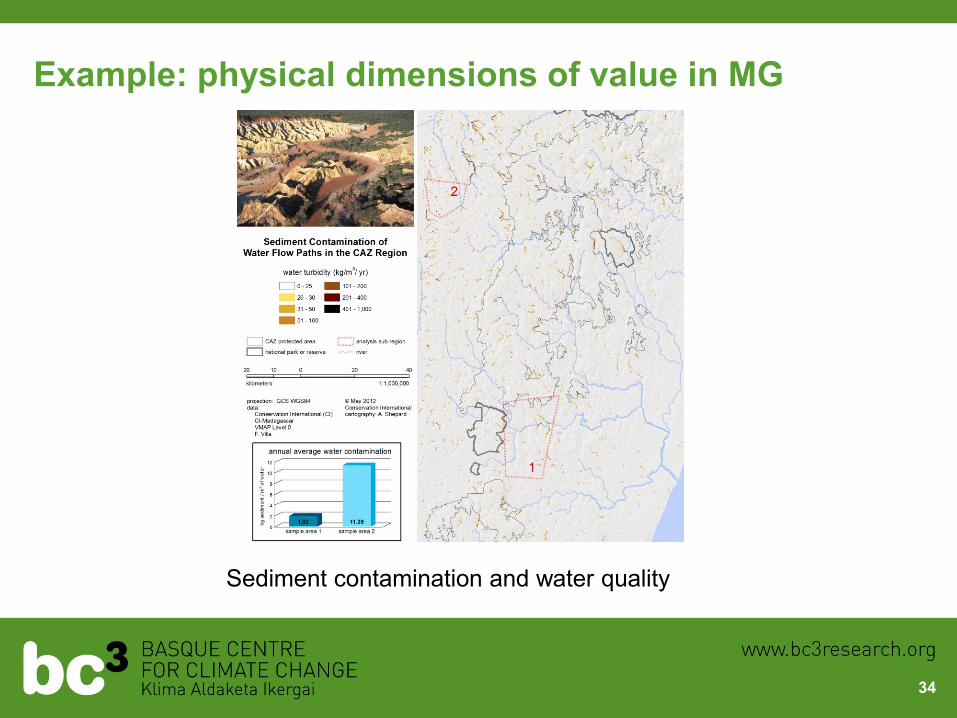
Example: physical dimensions of value in MG
34
Sediment contamination and water quality
Josh’s slide with curve, get from Ferd
Natural Capital Stocks
Mar
gina
l Val
ue
Valuable: elastic demand. Elastic demand: Values change
slowly with supply, and change is
reversible
Critical: Perfectly
inelastic demand Marginal valuation no
longer relevant
Important:
inelastic demand Values highly
sensitive to supply
Natural Capital stocks
Marg
inal valu
e
Susta
inabili
ty T
hre
shold
Ecological
restoration
Supply
determines price,
e.g. Cap & auction Price determines supply (green taxes…)
Criticality thresholds and valuation
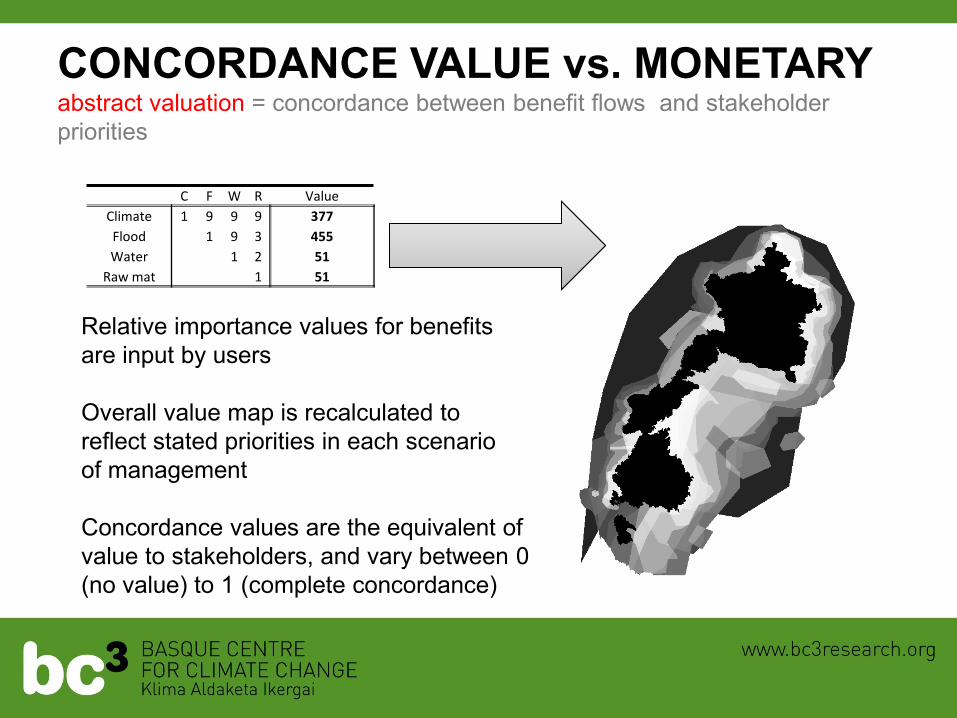
CONCORDANCE VALUE vs. MONETARY abstract valuation = concordance between benefit flows and stakeholder
priorities
C F W R Value
Climate 1 9 9 9 377
Flood 1 9 3 455
Water 1 2 51
Raw mat 1 51
Relative importance values for benefits
are input by users
Overall value map is recalculated to
reflect stated priorities in each scenario
of management
Concordance values are the equivalent of
value to stakeholders, and vary between 0
(no value) to 1 (complete concordance)
Analysis of flows wasn’t available before and computes
source, sink, use and flow profiles.
Flow analysis yields crucial maps to assist decision,
such as critical flow contours, unmet service demand
or unused service production.
Quantification is based on flow strength, actual use and
provision. Policy scenarios can be analyzed by
comparing such contextual information, resulting in more
accurate, beneficiary-dependent, science-based
estimates of values. Uncertainty is preserved in flow
computation and can be visualized.
Novel results from flow analysis
The “magic number”: new indicators
Using information about actual flows, new overall indicators can be computed (with associated uncertainties) for:
EFFICIENCY of provision (actual vs. potential) 0 -1
EFFICIENCY of use (need met or unmet vs. total) 0 -1
EQUITY of distribution (winners and losers) 0 -1
TOTAL: actual use, actual production, unused potential, unmet need
Such indicators can be used as good objective functions in scenario analysis.
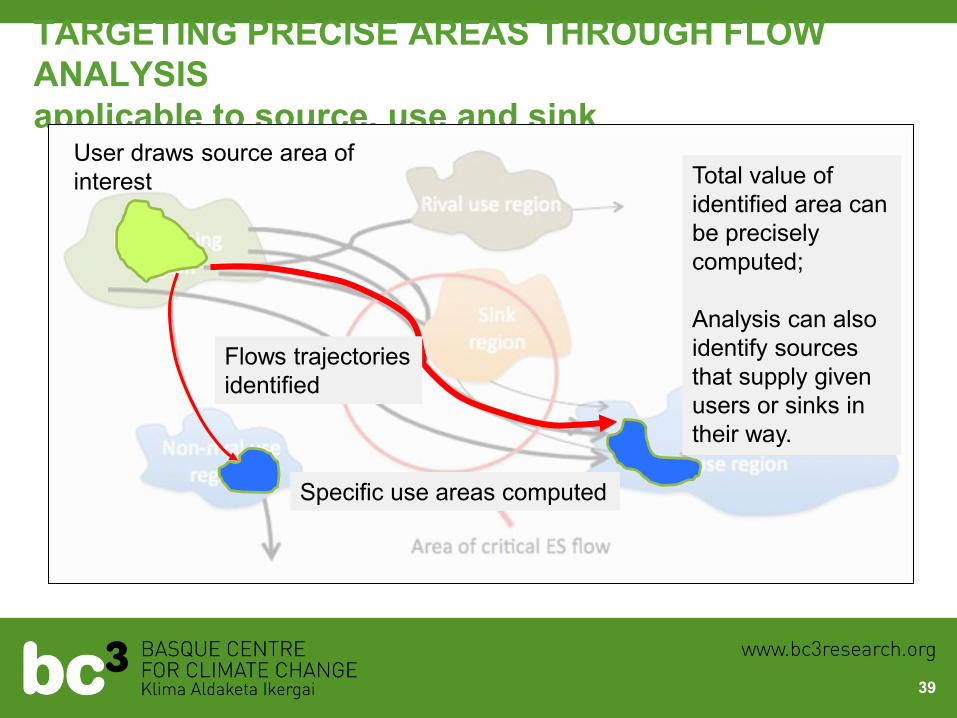
TARGETING PRECISE AREAS THROUGH FLOW
ANALYSIS
applicable to source, use and sink
39
User draws source area of
interest
Flows trajectories
identified
Specific use areas computed
Total value of
identified area can
be precisely
computed;
Analysis can also
identify sources
that supply given
users or sinks in
their way.
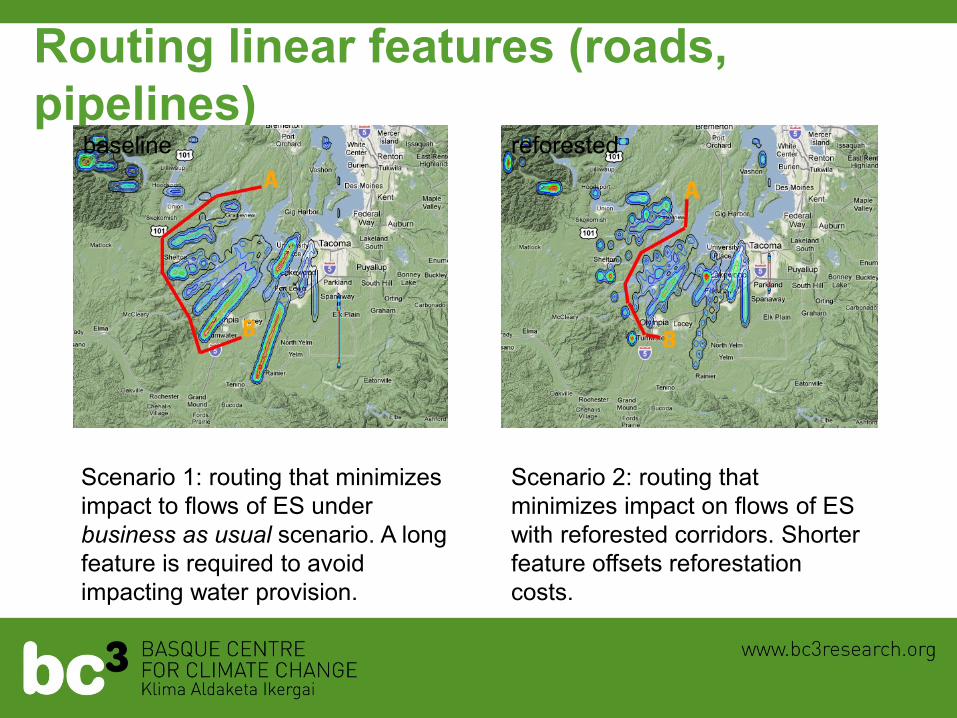
Routing linear features (roads,
pipelines)
Scenario 1: routing that minimizes
impact to flows of ES under
business as usual scenario. A long
feature is required to avoid
impacting water provision.
Scenario 2: routing that
minimizes impact on flows of ES
with reforested corridors. Shorter
feature offsets reforestation
costs.
baseline reforested
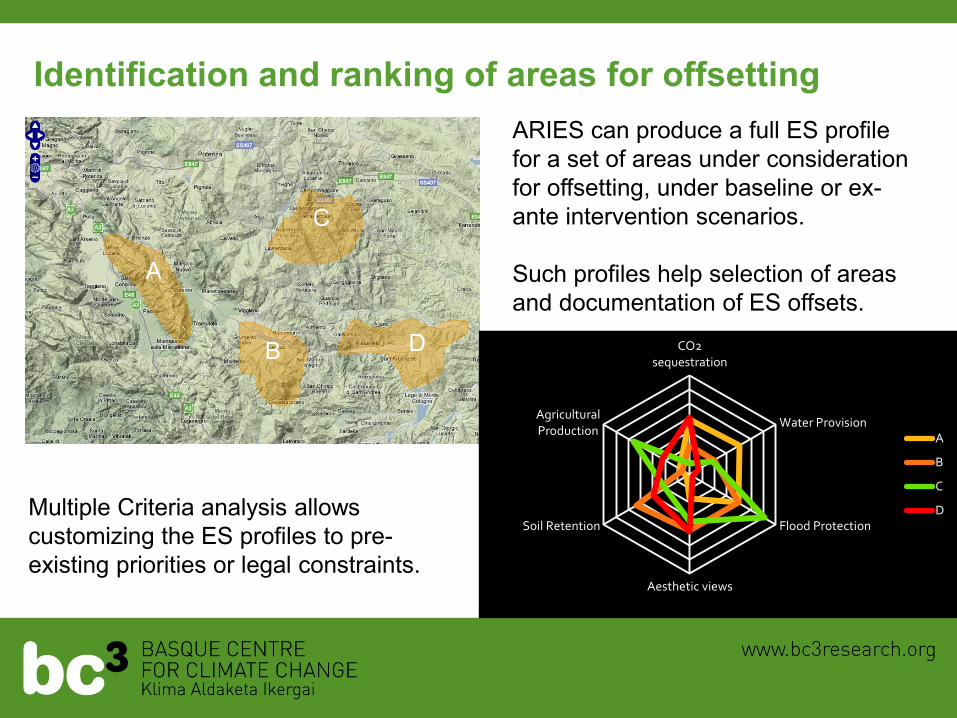
Identification and ranking of areas for offsetting
ARIES can produce a full ES profile
for a set of areas under consideration
for offsetting, under baseline or ex-
ante intervention scenarios.
Such profiles help selection of areas
and documentation of ES offsets.
A
B
C
D
Multiple Criteria analysis allows
customizing the ES profiles to pre-
existing priorities or legal constraints.
CO2sequestration
Water Provision
Flood Protection
Aesthetic views
Soil Retention
AgriculturalProduction
A
B
C
D
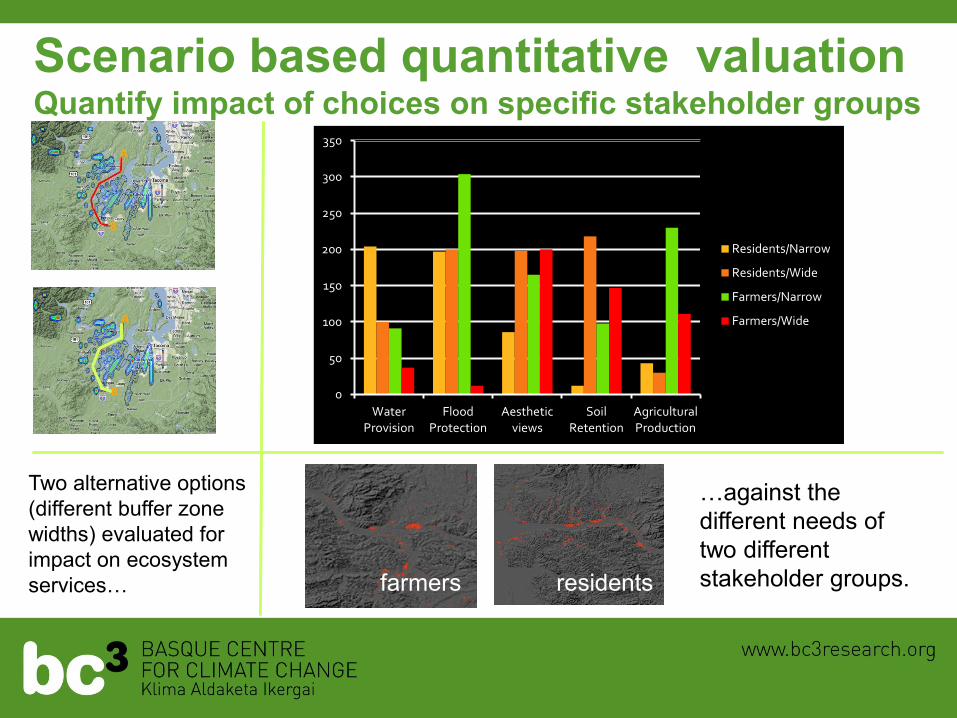
Scenario based quantitative valuation Quantify impact of choices on specific stakeholder groups
Two alternative options
(different buffer zone
widths) evaluated for
impact on ecosystem
services…
…against the
different needs of
two different
stakeholder groups. farmers residents
0
50
100
150
200
250
300
350
WaterProvision
FloodProtection
Aestheticviews
SoilRetention
AgriculturalProduction
Residents/Narrow
Residents/Wide
Farmers/Narrow
Farmers/Wide