Embed Size (px)
Citation preview
The Value of Corporate Citizenship: Protection
Dylan Minor
Working Paper 16-021

Working Paper 16-021
Copyright © 2015 by Dylan Minor
Working papers are in draft form. This working paper is distributed for purposes of comment and discussion only. It may not be reproduced without permission of the copyright holder. Copies of working papers are available from the author.
The Value of Corporate Citizenship: Protection
Dylan Minor Harvard Business School

The Value of Corporate Citizenship: Protection∗
Dylan Minor
Harvard Business School
August 2015
Abstract
We explore the notion that corporate citizenship, as obtained through Corporate
Social Responsibility (CSR), is used by managers to protect firm value, helping their
firm better withstand negative business shocks. We formally explore two parallel mech-
anisms for such protection —one of building moral capital (CSR Contributions) and
another of improving investor posteriors (CSR Investments). We find some theoretical
and empirical support for both of these, but in different settings. In particular, we
find that firms with higher CSR Investments enjoy an average of $1 billion of saved
firm value upon an adverse event. In contrast, CSR Contribution firms lose value (on
average) upon an event, possibly due to disingenuous contributions. Meanwhile, due
to managerial moral hazard, firms with high levels of CSR Contributions face adverse
events more often, whereas those with high levels of CSR Investments face them less
often.
JEL: G30 G32 G39∗Corresponding Author: Dylan Minor [email protected]. The author would like to thank Ernesto Dal
Bo, Rui de Figueiredo, Daniel Diermeier, Bryan Hong, John Morgan, Orie Shelef, Steve Tadelis, andTerry Taylor for their helpful comments. Also thanked are the seminar participants at Northwestern, UCBerkeley, University of Maryland, University of Michigan, and Wharton.
1

Keywords: Corporate Governance, Corporate Social Responsibility, Reputation,
Moral Capital
2
"There is one and only one social responsibility of business —to use its resources
and engage in activities designed to increase its profits..." Milton Friedman
"Corporate social responsibility is best seen as the management of risk, as the
avoidance of damages to the company’s reputation." Financial Times, July 7,
2004.
There are a plethora of past studies examining the relationship of a firm’s financial
performance to its level of corporate social responsibility (CSR). In short, the studies at
best show there is a nominal relation between the two (see Elfenbein (2007) for an extensive
survey). If CSR does not provide any financial benefit, in the spirit of Friedman (1970),
it seems that managers should then spend their time and efforts in other areas that are
expected to actually enhance firm value. Indeed, Institutional Shareholder Services (ISS),
an MSCI brand, admonishes investment managers in their "2011 U.S. Proxy Voting Guide-
lines Summary" to often vote against CSR type initiatives in order to "protect shareholder
value."
Nonetheless, CSR seems increasingly important to at least some investors, as many
companies now report annually on their social performance, and independent organizations
such as KLD Analytics provide regular corporate accountability reporting. CSR also seems
increasingly important to managers; a survey by the Economist magazine1 reports some
56% of managers consider CSR as a "high" or "very high" priority. Further, the Economist
reports 87% of firms now have a formal CSR program in place. Echoing firm sentiment,
some MBA program ranking schemes now include a standalone category for CSR.
This all suggests that there must be some aspects of CSR that are valuable. In this
spirit, the Economist reports that while only some 6.5% of managers report that CSR
increases revenue, most managers claim they instead use CSR to secure a brand and rep-
1January 7th, 2008
3

utation. They summarize it in this way:
“Most of the rhetoric on CSR may be about doing the right thing and
trumping competitors, but much of the reality is plain risk management. It
involves limiting the damage to the brand and the bottom line that can be
inflicted by a bad press and consumer boycotts, as well as dealing with the
threat of legal action.”
Economist, January 7,2008
Thus, in practice, it seems that there is a belief that a primary value of CSR is to
protect a firm’s value. In this paper, we explore this important notion both theoretically
and empirically.
There are at least two leading theories of CSR as protection. Godfrey (2005) develops
an informal model of protection where firms engage in voluntary philanthropic acts to
build a reservoir of goodwill (i.e., "moral capital") from which to draw upon during an
adverse event. An alternative mechanism proposed by Minor and Morgan (2011) is that
protection comes from improving the posteriors of investors. In particular, those firms that
engage in CSR activities related to an adverse event are given more of the benefit of the
doubt concerning their negligence related to the event. For example, if a firm engages in
substantive (positive) environmental CSR, should it become involved in an environmental
disaster, as a result of Bayesian updating, it is less likely the firm is guilty of negligence,
reducing its expected event cost.
We formalize both of these theories to develop sharper and contrasting empirical predic-
tions. While both predict protection of firm value upon an event, there are also important
differences. First, Godfrey (2005) predicts firm protection comes from a firm contributing
to philanthropic activities, which are generally not related to a particular adverse event.
In contrast, Minor and Morgan (2011) argue that protection only comes from engaging in
4

those activities that are related to such an event. Second, after we extend both of these
theories by considering what happens to the incident rate of different types of firms, we
see further differences. In particular, those firms building moral capital should experience
increased incident rates due to moral hazard: being assured of some increased protection
encourages some managers to be less careful in avoiding a disaster. In contrast, protection
as portrayed in Minor and Morgan (2011) is derived from being more conscientious, and
thus incident rates for these protected firms should be lower.
We also complement the extant literature by introducing disingenuous builders of moral
capital. In Godfrey (2005), all actors and activities are transparent. However, in a world
where managers might act strategically, some can choose to free-ride on the positive image
of building moral capital by superficially engaging in CSR. The net result of such firms
is that we should observe diminished protection, if not increased costs, from engaging in
CSR.
The notion of participating in CSR to protect firm value is related to a growing literature
on firm self-regulation. In early work, Maxwell et al. (2000) extend the economic theory
of regulation by adding voluntary actions by firms to reduce pollution under the shadow of
regulation. Maxwell and Decker (2006) show this force also operates in the other direction:
voluntary actions can reduce regulation intensity. This activity helps firms engaging in
voluntary actions by means of reduced regulation and therefore expected cost. Baron
(2010) adds that such self-regulation can also arise from altruistic managers. Whatever
the source of self-regulation, it can increase firm value. In fact, Mackey et al. (2007) argue
that even voluntary actions that are costly in expected value terms can add firm value with
suffi cient investor demand for such actions. Thus, this paper complements this stream of
literature by exploring yet another potential benefit of self-regulation: Those self regulation
activities categorized as CSR can also help protect firm value during adverse events.
5

In terms of empirical work on protection by means of CSR, Godfrey et al. (2009) test
the moral capital idea in Godfrey (2005) by conducting an event study on 178 "oppor-
tunistically drawn" firm events. They find that from the set of firms that they select to
study, those that are engaging in philanthropic focused activities enjoy a reduced loss in
firm value when facing regulatory and legal actions against them. However, firms engaging
in more profit-centric CSR do not enjoy such protection. Similarly, Jacobs et al. (2010)
also find that philanthropic gifts provide positive firm value. In contrast, Hillman and
Keim (2001) find just the opposite: engaging in CSR for primary stakeholders (i.e., profit-
centric CSR) increases firm value whereas engaging in CSR for secondary stakeholders (i.e.,
philanthropic) decrease firm value.
In terms of negative CSR, Capelle-Blancard and Laguna (2010) study stock market
reactions to 64 chemical plant and refinery explosions. They find that those firms with
poor environmental records are punished more harshly. If we count voluntary pollution
abatement as CSR, we find that positive CSR also hurts firm value. Fisher-Vanden and
Thorburn (2011) show that firms that increase participation in voluntary emissions reduc-
tion lose firm value. Similarly, Jacobs et al. (2010) find that self-disclosed increases in
environmental performance yield a reduction in firm value. Lyon et al. (2013) find a nu-
ance in the consequences of positive CSR for firms in China: the penalty for positive CSR
diminishes when firms are state-owned or in high-polluting industries. We complement
these works by formalizing and testing mechanisms that can generate and reconcile these
conflicting findings.
With theoretical predictions in hand, we then explore the CSR activity of large US
public companies from 1991 through 2012. We find that those firms engaged in CSR
related to adverse events enjoy substantial protection– an average of close to $1 billion
of protected firm value– and also lower event rates. In contrast, we observe that firms
6

that engage in philanthropic CSR unrelated to incidences face events more often and do
not enjoy protection from their CSR efforts. In fact, in some cases, they are even further
punished upon an event.
We see this paper’s contribution as twofold: First, it is the first paper to formalize
and contrast possible mechanisms that generate protection from CSR, an important and
primary motivation of managers to engage in CSR. In doing so, we extend the theory by
considering incident rates as a way to distinguish between mechanisms. We also introduce
disingenuous firms within the moral capital framework, which identifies those cases where
moral capital building might fail to protect firms. Second, using a novel dataset covering
22 years, that is to our knowledge the largest of its kind, we document for the first time
the relation of CSR to event incident rates. We are also able to identify those cases where
CSR provides protection and shed some light on when CSR actually can help or hurt firms
upon an event.
The balance of the paper is organized as follows: In the first section we present a
unifying model of CSR as protection, formalizing both Godfrey (2005) and Minor and
Morgan (2011) in a single model. The next section provides an empirical analysis and the
final section provides a concluding discussion. All proofs are relegated to the appendix.
7

1 Protection through Corporate Social Responsibility
Managers choose e, t Nature chooses event/no event(s)
Nature chooses high/low risk state Firms with events are revalued
We begin with a simple model of CSR to illustrate and contrast the two mechanisms of
firm value protection. The first mechanism, which we call CSR Investments, works through
affecting the posteriors of investors, as proposed in Minor and Morgan (2011). The second
mechanism, which we call CSR Contributions, works through the firm building a reservoir
of goodwill from which to draw upon should the firm face an event, as proposed in Godfrey
(2005).
1.1 The Model
Assume managers of each firm type choose their level of CSR activities as well as direct
effort to manage business risk, where risk is the risk of an adverse event. We abstract
away from any agency problems and assume managers maximize firm value. The above
diagram provides the timeline of the game. Managers make two CSR level decisions:
whether or not to invest in operational CSR (i.e., CSR Investments) and whether or not
to contribute to charitable CSR (i.e., CSR Contributions). Formally, we denote these CSR
choices as a vector t = (tC , twe), where tj ∈ {H,L} for j ∈ {C, I}. H (L) denotes a high-
type (low-type) firm.2 We assume that CSR type is reported through CSR reporting and
2 It is straightforward to extend the analysis to more than two types on each CSR dimension. However,we restrict the choice to two types since this is suffi cient to illustrate the forces at work and eases exposition.
8
is thus publicly observed . The element tC (tI) denotes a firm’s binary choice of CSR
Contribution (Investment). While it costs zero for a firm to be a low-type, choosing to be
a high-type costs a firm cj . CSR cost is the realization of a privately observed random
variable having support [0,∞) over an atomless distribution function Fj (·). For simplicity
assume that draws from FC(·) and FI(·) are IID across and within firms.
A manager also chooses a level of effort e ≥ 0, which is unobservable. Manager effort
helps keep a firm from an undesirable outcome, as explained below. Effort costs are increas-
ing and convex. For simplicity, suppose that the cost of e units of effort is C (e) = 12e2.
Thus, whereas cj is a fixed cost to engage in higher CSR, C (e) is the ongoing cost of
responsibility.
The combination of CSR activity and managerial effort determine the business risk
state θ ∈ {h, l} of the firm. If an adverse event occurs while the firm is operating in a high
risk state, it will prove more costly than if it is in a low risk state, as discussed below.
With probability γtIe the low risk state is realized, while the high risk state occurs with
complementary probability. The parameter γtI represents the influence of CSR investment
activity on the business risk state, where 0 < γL < γH . In other words, CSR Investment
reduces the chance of being in the high risk state. Following the state realization, nature
then determines whether an adverse event occurs. With probability pθ an event occurs in
state θ, where 0 < pl < ph. That is, events are less likely to occur if the firm is operating
in the low risk state than in the high risk state. Note CSR Contributions do not affect the
return to effort in keeping a firm out of a high risk state. Hence, a firm with or without
CSR Contributions can have either γL or γH .
Stakeholders (e.g., investors and regulators) only observe whether an event, E, has
occurred and the firm’s level of CSR Investment (i.e., and thus γtI ) and CSR Contribution.
Since a manager’s effort is unobservable, stakeholders must make an assessment of the
9
likelihood that the firm was operating in a high risk state conditional on an event occurring.
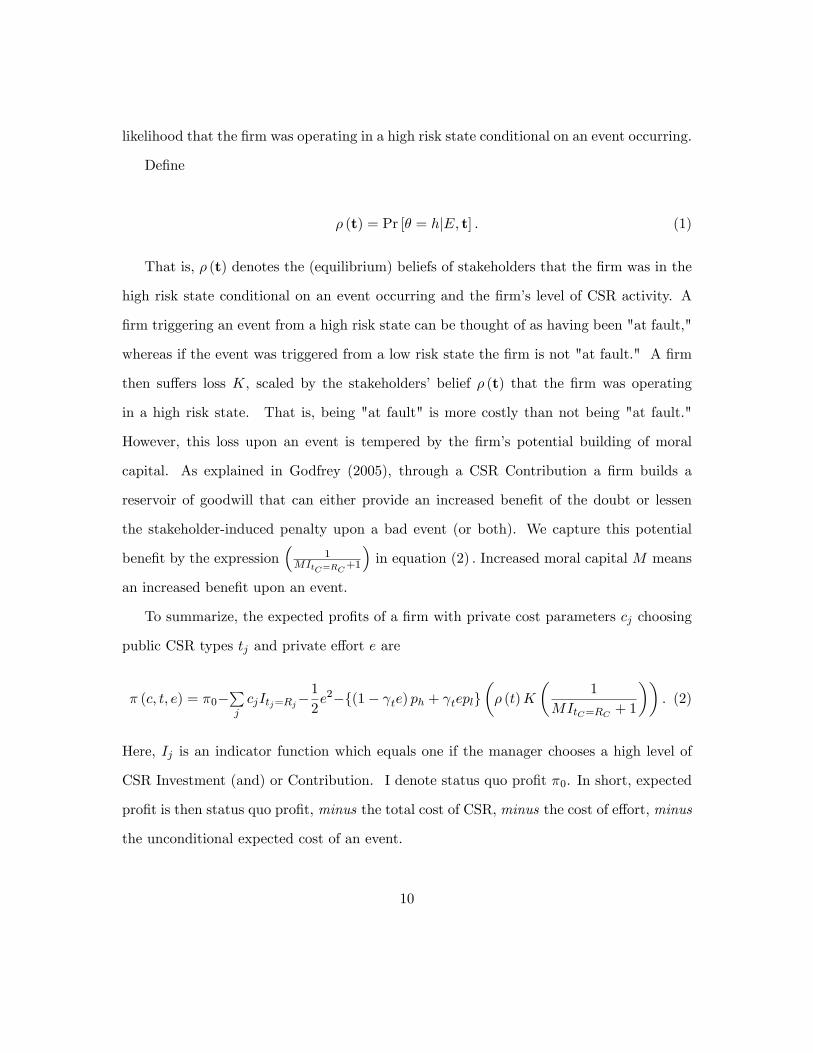
Define
ρ (t) = Pr [θ = h|E, t] . (1)
That is, ρ (t) denotes the (equilibrium) beliefs of stakeholders that the firm was in the
high risk state conditional on an event occurring and the firm’s level of CSR activity. A
firm triggering an event from a high risk state can be thought of as having been "at fault,"
whereas if the event was triggered from a low risk state the firm is not "at fault." A firm
then suffers loss K, scaled by the stakeholders’ belief ρ (t) that the firm was operating
in a high risk state. That is, being "at fault" is more costly than not being "at fault."
However, this loss upon an event is tempered by the firm’s potential building of moral
capital. As explained in Godfrey (2005), through a CSR Contribution a firm builds a
reservoir of goodwill that can either provide an increased benefit of the doubt or lessen
the stakeholder-induced penalty upon a bad event (or both). We capture this potential
benefit by the expression(
1MItC=RC+1
)in equation (2) . Increased moral capital M means
an increased benefit upon an event.
To summarize, the expected profits of a firm with private cost parameters cj choosing
public CSR types tj and private effort e are
π (c, t, e) = π0−∑jcjItj=Rj−
1
2e2−{(1− γte) ph + γtepl}
(ρ (t)K
(1
MItC=RC + 1
)). (2)
Here, Ij is an indicator function which equals one if the manager chooses a high level of
CSR Investment (and) or Contribution. I denote status quo profit π0. In short, expected
profit is then status quo profit, minus the total cost of CSR, minus the cost of effort, minus
the unconditional expected cost of an event.
10

To summarize the various states, Figure 1 provides a schematic for all of the possible
outcomes:
[Figure 1 here]
There exist unique values (e∗L, e∗H) corresponding to the equilibrium effort of a firm. To
see the claim regarding (e∗L, e∗H) , notice that for given a tc, the optimal effort choice for a
manager of firm type t is a globally concave problem having as its solution:
e∗t = γtI (ph − pl)(ρ (t)K
((1
MItC=RC + 1
))). (3)
To close the model, it remains to determine equilibrium beliefs. Recall that stakeholders
know a firm’s type and can thus deduce its equilibrium effort. Hence, from Bayes’rule,
upon an event, stakeholders hold belief
ρ (t) =
(1− γtIe
∗t
)ph(
1− γtIe∗t
)ph + γte
∗tpl
. (4)
Thus, any equilibrium effort levels given tc simultaneously solve
e∗L = γL (ph − pl){
(1− γLe∗L) phK(1− γNe∗L
)ph + γLe∗Lpl
(1
MItC=LC + 1
)}; (5)
e∗H = γH (ph − pl){
(1− γHe∗H) phK(1− γHe∗H
)ph + γHe
∗Hpl
(1
MItC=HC + 1
)}.
The optimal pair of tI and tC chosen is then simply a function of comparing profits from
e∗L and e∗H given each tC ∈ {H,L} . In equilibrium, there exists some c∗I such that when
fixing the choice of tC , we have the same level of profit whether that manager chooses her
firm to be a low (L) or high (H) type
11

π (0, L, e∗L) = π (c∗I , H, e∗R) . (6)
This can readily be seen by noting π (·) is strictly decreasing in cj and π (0, H, e∗R) > 0
while π (cI , H, e∗R) < 0 as cj → +∞. By similar argument, when fixing the choice of tI ,
there is some c∗C such that the manager is indifferent between choosing tC ∈ {H,L}.
This analysis provides the first proposition:
Proposition 1 Fix tC . In equilibrium, managers of high-type (low-type) firms exert effort
e∗H ( e∗L) as given in (5) and face CSR cost cI ≤ c∗I (cI > c∗I),where c∗Isolves equation (6).
We next need a Lemma to prove our propositions concerning changes in firm values
upon an event and incident rate of events.
Lemma 1 Fix tC . In any equilibrium, γLe∗L < γHe∗H .
What this Lemma tells us is that if we compare two firms that are the same on the
dimension of CSR Contribution tC , even though the high-type firm has a greater return to
effort, it will still produce enough effort such that γLe∗L < γHe
∗H . This yields an important
empirical prediction, as this inequality is necessary for the CSR investing firm to be less
likely to have an event, as shown in the next proposition.
Proposition 2 Compared with CSR Investment low-type firms, CSR Investment
high-type firms have events less often and lose less value upon an event.
The intuition of the above proposition is with CSR Investment, the manager essentially
internalizes the cost of an adverse event and increases her effort to reduce it. This increased
effort both reduces the chance of an event and also reduces the change in firm value upon
an event because investors now consider it less likely the event was caused by negligence.
12

This proposition then provides two key predictions that we can test in the data while
holding CSR Contribution level constant: increased CSR investment level both reduces the
event incident rate and reduces the loss of firm value upon an event. The next proposition
considers the parallel case of changes in levels of CSR Contributions, holding a given CSR
Investment level constant.
Proposition 3 Compared with CSR Contribution low-type firms, CSR Contribution
high-type firms have events more often and lose less value upon an event.
The intuition for this proposition is that when a firm is provided a reservoir of goodwill
to draw upon during an adverse event, this induces moral hazard on behalf of the manager.
That is, due to the goodwill protection, she now puts in less effort since an adverse event
will prove less costly. Consequently, the firm’s incident rate is increased. As far as we
are aware, this is a novel finding; the extant literature stresses the protection value of
goodwill building upon on an event. However, there has been no discussion of how this
can induce moral hazard. Nonetheless, even with such moral hazard, the firm still enjoys
a net protection benefit upon an event; as shown in the appendix, the positive effect of the
goodwill reservoir dominates the negative effect of this increased chance of negligence. This
last proposition also reveals that comparing incident rates as a function of the type of CSR
(i.e., Contribution versus Investment) can help us disentangle the sources of protection
from CSR.
2 Empirical examination
2.1 General strategy
The empirical setting is product markets where the event is a product recall. These events
are often seen by the investment committee as a potential shock to a firm’s value and
13

reputation due to their signaling nature (Davidson and Worrell (1992) provide a review of
past product recall literature. See also Hartman (1987) for a hedonic model treatment of
recalls). These types of events are arguably more exogenous than some events studied in
the extant literature, such as choosing to join a CSR organization (e.g., Fisher-Vanden and
Thornburn (2011)) or disclose one’s intention to increase CSR (e.g., Jacobs et al. (2010)).
Our empirical strategy has two facets. First, we will test if firms engaged in CSR
Investment (CSR Contributions) have a lesser (greater) incident rate. Second, we then
test if those firms engaged in each type of CSR experience a lesser loss in firm value upon
an event. I begin by reviewing the data characteristics and then turn to the event study
methodology and regression model.
2.2 Data
The Data consist of three components. The first part is the abnormal returns of various
firms during our product recalls, which we describe in detail in the next section. The event
returns are then merged with Compustat, the second set of data. For firm control data
of the S&P 500 firms we have: annual sales ("Sales (net)"), asset value ("Assets-total"),
market value ("common shares outstanding"×"price-calender year-closing"), and percent
of profits per share ("EPS (Basic) - Exclude Extra. Items "÷"price-calender year-closing").
Actual product recall events were obtained by hand collection of product recall events of
S&P 500 firms as indexed by the Wall Street journal from 1991 through 2012. Although
this categorization of product recalls is certainly not perfect, it is the primary source used
by past product recall literature. Further, we wanted to have an ex-ante fixed criteria of
selecting recalls to prevent subjective inclusion or exclusion on the part of the researcher.
We do note that recalls included in the Wall Street Journal press announcements are biased
towards larger event recalls. However, the theory predicts that it is these large scale recalls
14

where we will see the effects, if any exist.
Occasionally some firms had more than one event announcement in a year, most often
a later press announcement related to the same event. For the data collection, we simply
summed the abnormal returns together, following the methodology as shown below, by
summing abnormal returns over event window days. Having more than one event in a
year for a given firm occurred for only 25 of the firm/ event years, and these were almost
exclusively for automobile companies.
The final component of data is corporate accountability reporting from KLD Analytics,
owned my MSCI. KLD is a main source of CSR research for socially responsible investing
firms. Nelson Information’s Directory of Investment Managers reports that these types of
investing firms hold approximately 11% of all managed assets. KLD’s data have been
commonly used in past related academic studies (see Chatterji et al. (2007) for a review).
KLD conducts proprietary research to assign annual CSR ratings to publicly held firms
across various dimensions, including product markets. Their CSR ratings began in 1991,
making it one of the oldest corporate accountability reporting sources. We use data from
1991 though 2012.
To match our theoretical predictions, we need to use a measure of CSR that is related
to the event and another CSR activity that is not. In this spirit, we use CSR ratings on the
dimensions of product markets and community reputation to respectively represent these
activities. The former then captures the notion of investment in issue-related CSR (i.e.,
CSR Investments) and the latter proxies for the contribution of moral capital (i.e., CSR
Contributions).
CSR reputation in product markets (i.e.,CSR Investments) can be thought of as a
firm’s superior reputation earned from the conscientious creation, marketing, and distri-
bution of its products. "Good”CSR will mean that a firm typically embraces superior
15

quality assurance procedures in the development and production of its products, conducts
ethical marketing campaigns, provides products with extra social value, provides products
to disadvantaged demographic groups, and generally faces product recalls voluntarily. In
contrast, "Bad" CSR means that firms are usually involved in regulation fights, suffer
safety violations, accept lower product safety standards, and conduct limited due diligence
on their supply chain.
Community CSR (i.e., CSR Contributions) can be thought of as the extent to which
a firm positively impacts its surrounding communities. Examples of "Good" community
CSR are giving a meaningful portion of income to charity, maintaining an exceptional
employee volunteer program, or supporting local housing and education needs. Examples
of "Bad" community CSR might include being involved in projects considered to have a
negative economic impact on the local community, not respecting local indigenous people
in the firm’s operation decisions, or being involved in major local tax disputes.
For both kinds of CSR, we categorize firms into three types, as follows. The lowest
type, which we will call "Low" types, are involved in "Bad" things for the given type of
CSR. The next type, "Medium" types, are not involved with "Bad" things, but neither are
they involved in "Good" things– they are simply responsible corporate citizens. Finally,
there are some exceptional firms that not only avoid being involved in "Bad" things, but
are also participating in some extra "Good" things. We dub these "High" types. We
include a full summary of "Good" and "Bad" types of CSR used by KLD in the appendix.
Table 1 reports the summary statistics for our primary variables. As can be seen,
roughly 7% (13%) of firm-years a firm will earn a High Product (Community) reputation.
Meanwhile, some 74% (80%) of firm-years fall in the middle of being classified as high
on the dimension of Product (Community) CSR. The balance of firm-years are considered
"Low" types. Now we consider our first primary theoretical prediction concerning event
16

rates.
[Table 1 about here]
2.3 The Risk of Incident
Recall, our propositions predict that firms with high Product CSR should have lesser event
incidence rates, whereas those firms with high Community CSR should have greater event
incidence rates. To test these predictions, since possible outcomes are only zero or one, we
use a logit random-effects panel regression.3 We specify our full regression as
Pr (yit = 1|Xit−1,γ, β, αi) = Λ(αi +i +βCSRit−1 +X′it−1γ +Y′tδ,
)(7)
where αi ∼ N(0, σ2α
). The variable CSRi,t−1 contains CSR ratings for firm i based on
the previously defined CSR typologies. The vector Xi,t−1 contains financial controls, as
outlined in the section (2.2) , and also industry controls. Finally, the vector Yt contains
year dummies.
With this regression, we can ask a simple question: is it the case that CSR reputation
—either in terms of CSR Investments or CSR Contributions —is related to incident rates
as theory predicts? Table 2 reports the results of this regression. Column (1) provides
the baseline regression, which includes year fixed effects but not financial and industry.
We find, as predicted by theory, high-type firms involved in building moral capital through
Community CSR are more likely to have an adverse event. For Product CSR, as consistent
with theory, high-type firms are less likely to have an adverse event. Even after including
3Note that it is not feasible to utilize a conditional fixed-effect logit model since identification requiresdropping all firms that never experience an event (i.e., 93.5 % of all observations are dropped).
17

all of our discussed controls, the coeffi cient estimates for either high-type of firm are still
significant at the 1% or 5% level.
If we extend our main theory to medium-type firms, these firms should have the same
direction of estimated effect as high-type firms, but the effects should be attenuated. For
Community CSR, high-type Community CSR firms have greater estimated coeffi cients. A
Wald test of equality of the high- and medium-type Community CSR coeffi cients yields a
χ2 = 24.83 (p-value= .0000). We note that medium-type firms have estimated coeffi cients
statistically no different from low-type firms.
For Product CSR, medium-type firms are less likely than low-type to have an event.
However, the magnitude of the estimates are no different statistically from the high-type
firms: a Wald test yields χ2 = .22 (i.e.,p-value= .649). In short, our empirical results
are consistent with our theoretical predictions; however, we cannot empirically distinguish
medium- and low-type community firms from one another and we cannot distinguish high
and medium-type Product CSR firms from one another. That is, if we relabeled medium-
type Product CSR firms as high-type and relabeled medium-type Community CSR firms
as low-types, the empirical results would perfectly align with the baseline theory results
that explore binary CSR types.
[Table 2 about here]
We also ran a Probit random-effects model, the results of which are nearly identical and
can be found in Table 3.We now turn to our second primary prediction– the protection
value of CSR. To do so, we utilize a financial event study.
18
2.4 Financial Event Study
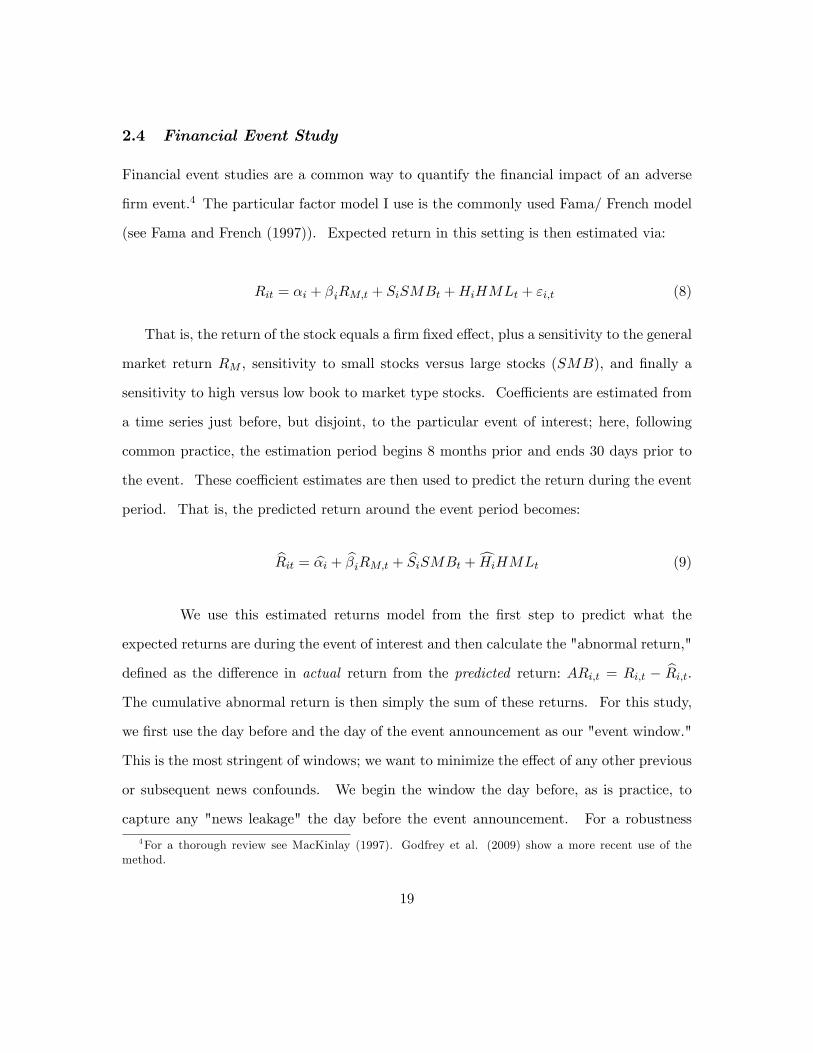
Financial event studies are a common way to quantify the financial impact of an adverse
firm event.4 The particular factor model I use is the commonly used Fama/ French model
(see Fama and French (1997)). Expected return in this setting is then estimated via:
Rit = αi + βiRM,t + SiSMBt +HiHMLt + εi,t (8)
That is, the return of the stock equals a firm fixed effect, plus a sensitivity to the general
market return RM , sensitivity to small stocks versus large stocks (SMB), and finally a
sensitivity to high versus low book to market type stocks. Coeffi cients are estimated from
a time series just before, but disjoint, to the particular event of interest; here, following
common practice, the estimation period begins 8 months prior and ends 30 days prior to
the event. These coeffi cient estimates are then used to predict the return during the event
period. That is, the predicted return around the event period becomes:
Rit = αi + βiRM,t + SiSMBt + HiHMLt (9)
We use this estimated returns model from the first step to predict what the
expected returns are during the event of interest and then calculate the "abnormal return,"
defined as the difference in actual return from the predicted return: ARi,t = Ri,t − Ri,t.
The cumulative abnormal return is then simply the sum of these returns. For this study,
we first use the day before and the day of the event announcement as our "event window."
This is the most stringent of windows; we want to minimize the effect of any other previous
or subsequent news confounds. We begin the window the day before, as is practice, to
capture any "news leakage" the day before the event announcement. For a robustness4For a thorough review see MacKinlay (1997). Godfrey et al. (2009) show a more recent use of the
method.
19

check, we also include 3-day and 4-day windows, where we again begin the day before
the event, but then extend the window an additional 2 or 3 days from the event day,
respectively. Thus our primary cumulative abnormal return is then simply:
CARi =0∑
t=−1ARi,t (10)
where 0 is the event day.
2.5 The Impact of Incident
Once we calculate our cumulative abnormal returns (CAR) through a financial event study
on every firm facing an adverse event, our final step is to examine any relationship between
the product CSR level and the respective CAR via a cross sectional regression. In partic-
ular, we specify the following:
CARi = α+ βCSRi +Xiγ +Ytδ + εi (11)
CARi is the cumulative abnormal return for firm i as calculated in the previous section.
The coeffi cients of interest are again in the vector β, our CSR ratings.
Now we include industry controls using NAICS codes. Ideally, we would like to control
at the 3-digit level. However, we only have 192 to 242 observations, depending on the
specification. Hence, using 3-digit level fixed effect estimation requires close to as many
coeffi cient estimates as observations, yielding a rather imprecise regression. Thus, for
comparison, we also include analysis at the 2-digit level.
Table 4 reports these regression results using event windows of just one day, as explained
in section (2.4) :
[Table 4 about here]
20

As predicted by our theory, high-types in Product CSR save a substantial amount
of abnormal firm value upon an event– some 2.5-3.2%. This effect is also economically
significant, as it amounts to an average saved firm value of close to $1 billion for the
average firm experiencing an event.5 Medium-type Product CSR firms save about half
of the value of a high-type firm, though the estimates are not significant at conventional
levels. In contrast, high-type Community CSR firms do not seem to enjoy any protection,
as predicted by theory. Interestingly, point estimates are negative, suggesting these firms
are actually punished upon an event. Meanwhile, medium-type Community firms do, in
fact, experience statistically significant negative abnormal returns upon an event. This is
consistent with Luo et al. (2012) that find the same for the setting of oil spills: moral
capital built through goodwill can cause increased damage to a firm upon a negative event.
In all, this suggests our theory is missing something. How could investing in moral capital
cause a reduction in firm value? It turns out that if we allow for some strategic moral-
capital-building firms, these results can rationalized, which we explore in the next section.
2.5.1 Greenwashing
Let us now allow that there could also be some firms that make disingenuous CSR Contri-
butions in hopes of enhancing short-term firm value. In terms of environmental CSR, this
is often called greenwashing (see Lyon and Maxwell (2011) for an extended explanation).
In this paper, we refer to greenwashing to mean making disingenuous CSR Contributions
as opposed to disingenuous environmental CSR.
Assume that stakeholders cannot determine if CSR Contributions are genuine until
after an event occurs. After an event does occur, investigations lead to information that
was not publicly available before such an event. Thus, after an event, firms that have
5This is calculated as 3% of the average value of a firm experiencing an event, which is roughly $37billion (i.e., .03 ∗ 37 = 1. 11).
21

been greenwashing are penalized (e.g., Lyon and Maxwell (2011)). This conceptualiza-
tion of greenwashing can be captured in our setting by simply assuming that upon an
event, greenwashing firms experience M < 0. That is, they are penalized for having been
discovered greenwashing.
Thus, we have two types of firms that make CSR Contributions: true firms and green-
wash firms, denoted as T and G, respectively. The former are those that we have modelled
thus far: they enjoy reduced event cost from MT > 0, as before. In contrast, greenwash
firms have reduced moral capital upon an event: MG < 0. That is, if discovered, such
a firm would have been better off not greenwashing. Recall that a firm that makes no
Contribution (i.e., a low-type Contribution firm) receives M = 0.
It is then straightforward to show that upon an event, given enough greenwashing firms,
those firms that invest in moral capital have on average a greater loss in firm value than
those that do not invest in moral capital. That is, genuine moral capital building firms still
enjoy protection, but a suffi cient number of penalized greenwash firms cause the average
of all firms to be negative. Further, as can be shown, as long as there are not too many
greenwash firms, investing in CSR Contributions can still produce positive net present
value for both greenwash and genuine CSR Contribution firms. This means that we can
still witness CSR Contributions in equilibrium.
In terms of event rates, greenwash firms will have lower incident rates than genuine
Contribution firms. This is because greenwash firms anticipate that if they do have an event
it will be more costly, thus increasing the firm’s incentive and effort to limit the chances of
an event. If we assume that greenwash firms are more likely to reside in medium- rather
than high-type firm categories, then we would expect to observe our empirical results:
medium-type firms CSR Contribution firms should be less likely to have an event and
should have a more negative event return. These two predictions are true empirically
22

when comparing coeffi cient estimates via a Wald test for coeffi cient estimates reported in
column (4) in Table 2 and Table 4, respectively: p-values of approximately .0000 and .06,
respectively. Now we consider some alternative explanations for our baseline results.
2.5.2 Additional Considerations
One concern in estimating these firm value effects is that abnormal return may simply be
the expected direct cost (e.g., the cost of replacing faulty automobile tires) of the product
recall. If the CSR level is related with actual event cost, this in itself would be interesting,
as it indicates that CSR predicts the magnitudes of firms’direct event costs. In this case,
there is less room for our CSR protection story where the financial market prices a company
upon an event as a function of uncertainty over the degree of negligence. Unfortunately,
the expected direct cost of a product recall is seldom made public (nor is it commonly
disclosed ex-post). However, for our sample, roughly 10% of the announcements were
accompanied by estimates of the direct event costs. For this subsample, the direct costs
explain roughly 16% of the variation in CAR. Further, when a loss is sustained by a firm
(i.e., a negative CAR), the direct costs represent 38% of the total loss on average. In
absolute value terms (because occasionally a firm has a positive CAR during an event),
direct costs represent 26% of the value of CAR. Thus, while this sub-sample is only a small
portion of the events6, it suggests that it is not the expected direct cost of an event driving
differences in CAR. Further, the direct costs have a small difference in cost, whereas
the change in abnormal firm value varies widely, suggesting there is much more than just
product recall direct cost embedded in the CAR. Our theory suggests that the CAR should
be a combination of direct recall loss and (expected) financial loss.
Another concern is that CSR ratings might simply serve as a proxy for a firm’s product
6There was also no statistical difference between the observables of firms having direct costs reportedand those that did not.
23

quality and safety and thus the ratings do not really capture any notion of corporate
citizenship. That is, product CSR is highly (positively) correlated with a firm’s reputation
for product safety. It could be that investors simply update the expected cost of the firm’s
event based on how safe the company’s products are: the safer the products, the more likely
the final cost will be less for a firm. To explore this possibility we disaggregate the regressors
to include each of the eight KLD rating areas with all of the controls used in column 4
from Table 2. We find one standalone subcategory that marginally explains the differential
CARs: market practices. The point estimate is −.03 with a p-value of 11%. Thus, if a firm
is involved in some illegal or unethical market-practice dispute (e.g., predatory pricing or
collusion), it loses an additional 3% of abnormal firm value. Meanwhile, KLD’s measure of
"product safety" reputation is not significant (p-value of 57%). In all, this suggests, just
as KLD claims, that their ratings have something to do with corporate citizenship and not
only product safety.
For estimating the value of protection of firm value, we have used 1-day event windows.
This is the strictest specification, as it minimizes the chances that a really important
additional piece of news on a later day somehow contaminated the event effect. To explore
this possibility, I redid all of the analysis that yielded Table 4 using a 3-day window and
also a 4-day window. That is, I calculated the abnormal return as occurring from the
day before until 2 and 3 days after the event day, respectively. These results are reported
in Table 5 and Table 6, and as expected, are consistent with those presented in Table 4.
This suggests that any new news or orthogonal shocks experienced in the immediate days
following the event are not enough to (abnormally) change the value of the firm.
[Tables 5 and 6 about here]
One can also estimate what a firm should pay for such conscientiousness to see if the
above estimates are reasonable. In terms of benefit, a firm moving from low-type to high-
24

type via CSR Investment saves some $1 billion of firm value conditional on an event, as
shown in section (2.5). With an incident rate of .9%, this means a risk neutral firm should
be willing to pay up to $9 million per annum more to be a higher rather than low CSR
type.7 It would be useful to compare this figure with what firms actually spend on these
efforts. Unfortunately, this level of expense figures is rarely made public. However, for one
example, Merck reported its 2010 annual report total spending on CSR related activities
of $9.8 million. Although this is only data from a single SP500 firm, this provides an
instance in which the above estimates are reasonable. Hopefully, public disclosure of its
CSR expenses will become more common, allowing us to identify actual CSR expenditures
by firms in the future.
3 Concluding discussion
We found an explanation to the puzzle of why managers invest in CSR when it has no
apparent effect on profits: Managers use CSR as a means to protect firm value. However,
there are two different mechanisms scholars have proposed, which we formalized in this
paper. The first and most common one is the notion that managers use CSR to build
moral capital, which we termed CSR Contributions. This reservoir of goodwill can then be
drawn upon should the firm face an adverse event. However, a consequence of this, which
is not identified in the extant literature, is that managers will engage in moral hazard and
actually increase the chances of adverse events. To the extent increased incident rates are
the result of reduced managerial effort, we found this moral hazard result to be true in the
data. Meanwhile, we found that if some firms are strategic and engage in greenwashing
to artificially inflate valuations, such moral capital building might actually cause increased
7That is, since there is only a .9% chance the average $1 billion benefit will be realized in a given year,this sugests an annual benefit of $9 million.
25

losses in firm value upon an event. We found some suggestive empirical evidence of this,
as well.
In contrast to CSR Contributions, the other proposed mechanism consists of managers
investing in CSR related to a potential adverse event. For this setting, in equilibrium,
those firms with higher levels of CSR related to the issue over which they face an adverse
event are less likely to have been negligent. Thus, these kinds of firms both have events
less often and are punished less severely upon an event. We found the data to support
both of these predictions of so-called CSR Investments.
In conclusion, both of these mechanisms seem to be operating, although CSR Contribu-
tions seems to be operating in some unanticipated ways compared to the extant literature.
Consequently, it is only CSR through the second mechanism that seems to provide protec-
tion, on average.
26

References
[1] Baron, D.P. and D. Diermeier. (2007). Strategic Activism and Nonmarket Strategy.
Journal of Economics & Management Strategy 16 (3), 599—634
[2] Baron, D. P. (2010). Morally motivated self-regulation. The American Economic Re-
view, 100(4), 1299-1329.
[3] Capelle-Blancard, G. and Laguna, M-A. (2010) How Does the Stock Market Respond
to Chemical Disasters?, Journal of Environmental Economics and Management, 59,
192—205.
[4] Chatterji, A. K., Levine, D. I., & Toffel, M. W. (2009). How well do social ratings ac-
tually measure corporate social responsibility? Journal of Economics & Management
Strategy, 18(1), 125-169.
[5] Davidson, W. and D.L. Worrell. (1992). The Effect of Product Recall Announcements
on Shareholder Wealth. Strategic Management Journal, 13 (6), 467-473.
[6] Elfenbein, D. W., Fisman, R., & McManus, B. (2012). Charity as a substitute for
reputation: Evidence from an online marketplace. The Review of Economic Studies,
79(4), 1441-1468.
[7] Fama, E. F., & French, K. R. (1997). Industry costs of equity. Journal of financial
economics, 43(2), 153-193.
[8] Fisher-Vanden, K. and Thorburn, K. (2011) Voluntary Corporate Environmental Ini-
tiatives and Shareholder Wealth, Journal of Environmental Economics and Manage-
ment, 62, 430-445.
27
[9] Fisman, R., G. Heal, and V.B. Nair. (2007). A Model of Corporate Philanthropy.
Working Paper. Columbia University.
[10] Friedman, M. (1970). "The Social Responsibility of Business is to Increase its Profits."
The New York Times Magazine, September 13, 1970
[11] Godfrey, P. C. (2005). The relationship between corporate philanthropy and share-
holder wealth: A risk management perspective. Academy of Management Review,
30(4), 777-798.
[12] Godfrey, P.C., C.B. Merrill, and J.M. Hansen. (2009). The Relationship between Cor-
porate Social Responsibility and Shareholder Value: An Empirical Test of the Risk
Management Hypothesis, Strategic Management Journal, 30, 425—445
[13] Goyal, A. (2006). "Corporate Social Responsibility as a Signalling Device for Foreign
Direct Investment." International Journal of the Economics of Business 13(1): 145-
163
[14] Hartman,R .S. (1987). "Product Quality and Market Effi ciency The Effect of Product
Recalls on Resale Prices and Firm Valuation." Review of Economics and Statistics, 6
(9), 367-72
[15] Hermalin, B. (2008). Firm value and corporate governance: Does the former determine
the latter? Available at SSRN 1080090.
[16] Hillman, A. J., & Keim, G. D. (2001). Shareholder value, stakeholder management,
and social issues: what’s the bottom line?. Strategic Management Journal, 22(2), 125-
139.
28

[17] Jacobs, B.W., Singhal, V.R. and Subramanian, R. (2010). An Empirical Investiga-
tion of Environmental Performance and the Market Value of the Firm, Journal of
Operations Management, 28, 430-441.
[18] Kotchen, M. J., & Moon, J. J. (2011). Corporate social responsibility for irresponsi-
bility (No. w17254). National Bureau of Economic Research.
[19] Luo, J., Meier, S., & Oberholzer-Gee, F. (2012). No News is Good News CSR Strategy
and Newspaper Coverage of Negative Firm Events. Harvard Business School Working
Paper 12-091.
[20] Lyon, T. P., & Maxwell, J. W. (2011). Greenwash: Corporate environmental disclosure
under threat of audit. Journal of Economics & Management Strategy, 20(1), 3-41.
[21] Lyon, Thomas P., Yao Lu, Xinzheng Shi, and Qie Yin. (2013). How Do Sharehold-
ers Respond to Sustainability Awards?: Evidence from China, Ecological Economics,
2013, 94: 1-8.
[22] Mackey, A., Mackey, T. B., & Barney, J. B. (2007). Corporate social responsibil-
ity and firm performance: Investor preferences and corporate strategies. Academy of
Management Review, 32(3), 817-835.
[23] MacKinlay, C.A.. (1997). Event Studies in Economics and Finance. Journal of Eco-
nomic Literature 35, 13-39.
[24] Margolis, J. D., Elfenbein, H. A., & Walsh, J. P. (2007).Does it pay to be good? A
meta-analysis and redirection of research on the relationship between corporate social
and financial performance. Ann Arbor, 1001, 48109-1234.
[25] Maxwell, J.W. and C.S. Decker. (2006). Voluntary Environmental Investment and
Responsive Regulation, Environmental and Resource Economics, 33, 425-439.
29

[26] Maxwell, J.W., T.P. Lyon and S.C. Hackett. (2000). Self-Regulation and Social Wel-
fare: The Political Economy of Corporate Environmentalism, Journal of Law and
Economics, 43, 583-618.
[27] Minor, D.B. and J. Morgan. (2011). CSR as Reputation Insurance: Primum Non
Nocere. California Management Review, 53(3), 1-20
[28] Peloza, J. (2005). Corporate Social Responsibility as Reputation Insurance. Working
Paper. UC Berkeley.
[29] Ramanna, K. (2012). A Framework for Research on Corporate Accountability Report-
ing. HARVARD BUSINESS SCHOOL WORKING PAPER, NO. 12-021
[30] Richter, B. (2011). ‘Good’and ‘Evil’: The Relationship Between Corporate Social
Responsibility and Corporate Political Activity. working paper available at SSRN
1750368.
[31] Vogel, D. (2005). The Market for Virtue. Washington D.C.: Brookings.
30

4 Appendix: Proofs from the Text
Lemma 1 Fix tC . In any equilibrium, γLe∗L < γHe∗H .
Proof. We proceed by means of contradiction: suppose to the contrary that γLe∗L ≥ γHe∗H .
Equivalently, γLe∗L/γHe
∗H ≥ 1. Using equation (3) we can write
γLe∗L
γHe∗H
=
(γLγH
)2 ρ (L)K(
1MItC=LC+1
)ρ (H)K
(1
MItC=HC+1
)and after substituting with equation (4) , we obtain
γLe∗L
γHe∗H
=
(γLγH
)2(1−γLe∗L)ph
(1−γLe∗L)ph+γLe∗Lpl(1−γHe∗H)ph
(1−γHe∗H)ph+γHe∗Hpl
. (12)
Next, notice that the function
φ (x) =(1− x) ph
(1− x) ph + xpl
is strictly decreasing in x. Therefore, the value of the expression in the curly brackets in
equation (12) is at most one. Since γLγH
< 1, it then follows that the RHS equation (12) is
fractional, which contradicts the hypothesis that γLe∗L/γHe
∗H ≥ 1.
Proposition 2 Compared with CSR Investment low-type firms, CSR Investment
high-type firms have events less often and lose less value upon an event.
Proof. To ease notation, define Pr(E | t) ≡(1− γtIet
)ph + γtIetpl and E[C | t] ≡
ρ (t)K(
1MItC=HC+1
).Though we could solve for e∗t explicitly using the quadratic formula,
it is much simpler to use the fact that we always have e∗LγL < e∗HγH in equilibrium (Lemma
1). Indeed, this inequality implies that the CSR investing firm is less likely to have an
31
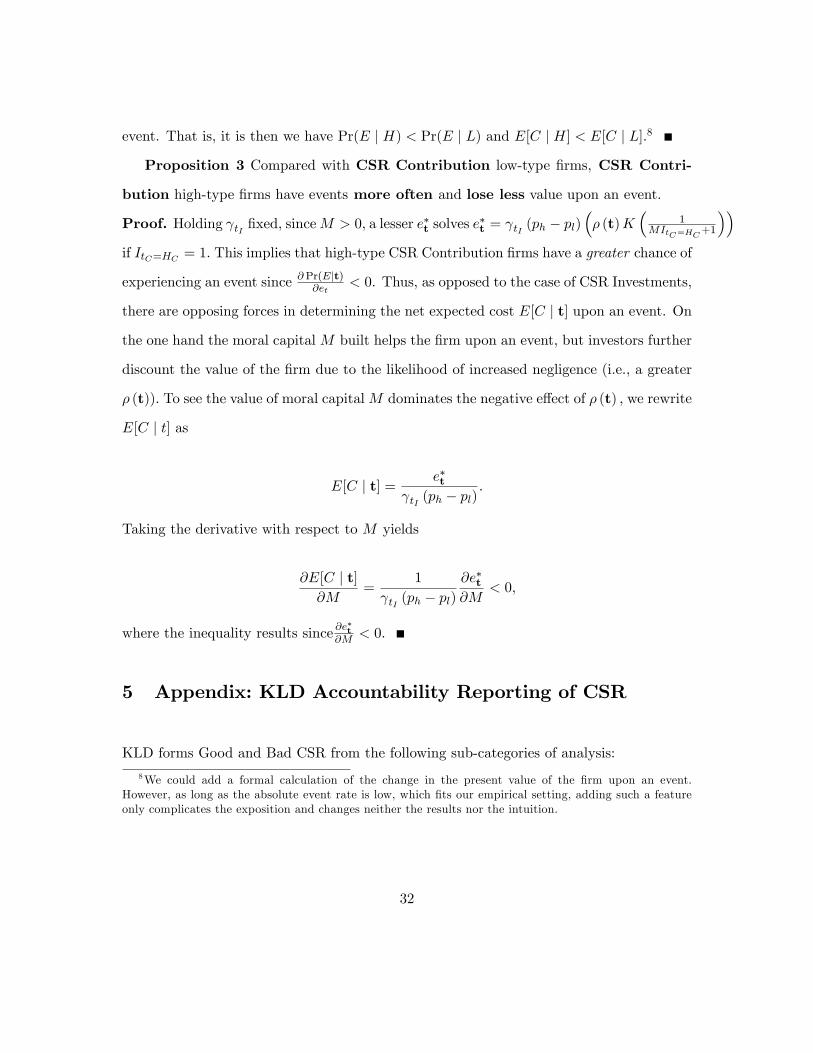
event. That is, it is then we have Pr(E | H) < Pr(E | L) and E[C | H] < E[C | L].8
Proposition 3 Compared with CSR Contribution low-type firms, CSR Contri-
bution high-type firms have events more often and lose less value upon an event.
Proof. Holding γtI fixed, sinceM > 0, a lesser e∗t solves e∗t = γtI (ph − pl)
(ρ (t)K
(1
MItC=HC+1
))if ItC=HC = 1. This implies that high-type CSR Contribution firms have a greater chance of
experiencing an event since ∂ Pr(E|t)∂et< 0. Thus, as opposed to the case of CSR Investments,
there are opposing forces in determining the net expected cost E[C | t] upon an event. On
the one hand the moral capital M built helps the firm upon an event, but investors further
discount the value of the firm due to the likelihood of increased negligence (i.e., a greater
ρ (t)). To see the value of moral capitalM dominates the negative effect of ρ (t) , we rewrite
E[C | t] as
E[C | t] =e∗t
γtI (ph − pl).
Taking the derivative with respect to M yields
∂E[C | t]∂M
=1
γtI (ph − pl)∂e∗t∂M
< 0,
where the inequality results since ∂e∗t
∂M < 0.
5 Appendix: KLD Accountability Reporting of CSR
KLD forms Good and Bad CSR from the following sub-categories of analysis:
8We could add a formal calculation of the change in the present value of the firm upon an event.However, as long as the absolute event rate is low, which fits our empirical setting, adding such a featureonly complicates the exposition and changes neither the results nor the intuition.
32

5.0.3 Product Market CSR
Good CSR Quality: The company has a long-term, well-developed, company-wide qual-
ity program, or it has a quality program recognized as exceptional in U.S. industry.
R&D/Innovation: The company is a leader in its industry for research and development
(R&D), particularly by bringing notably innovative products to market.
Benefits to Economically Disadvantaged: The company has as part of its basic mission
the provision of products or services for the economically disadvantaged.
Other Strengths: The company’s products have notable social benefits that are highly
unusual or unique for its industry.
Bad CSR Product Safety: The company has recently paid substantial fines or civil
penalties, or is involved in major recent controversies or regulatory actions, relating to the
safety of its products and services.
Marketing/Contracting Concern: The company has recently been involved in major
marketing or contracting controversies, or has paid substantial fines or civil penalties re-
lating to advertising practices, consumer fraud, or government contracting. (Formerly:
Marketing/Contracting Controversy)
Antitrust: The company has recently paid substantial fines or civil penalties for an-
titrust violations such as price fixing, collusion, or predatory pricing, or is involved in recent
major controversies or regulatory actions relating to antitrust allegations.
Other Concerns: The company has major controversies with its franchises, is an elec-
tric utility with nuclear safety problems, defective product issues, or is involved in other
product-related controversies not covered by other KLD ratings.
33

5.0.4 Community Reputation CSR
Good CSR Charitable Giving: The company has consistently given over 1.5% of trailing
three-year net earnings before taxes (NEBT) to charity, or has otherwise been notably
generous in its giving. In 2002, KLD renamed the Generous Giving Strength as Charitable
Giving.
Innovative Giving: The company has a notably innovative giving program that supports
nonprofit organizations, particularly those promoting self-suffi ciency among the econom-
ically disadvantaged. Companies that permit nontraditional federated charitable giving
drives in the workplace are often noted in this section as well.
Non-US Charitable Giving: The company has made a substantial effort to make char-
itable contributions abroad, as well as in the U.S. To qualify, a company must make at
least 20% of its giving, or have taken notably innovative initiatives in its giving program,
outside the U.S.
Support for Housing: The company is a prominent participant in public/private part-
nerships that support housing initiatives for the economically disadvantaged, e.g., the Na-
tional Equity Fund or the Enterprise Foundation.
Support for Education: The company has either been notably innovative in its support
for primary or secondary school education, particularly for those programs that benefit
the economically disadvantaged, or the company has prominently supported job-training
programs for youth. In 1994, KLD added the Support for Education Strength.
Indigenous Peoples Relations: The company has established relations with indigenous
peoples in the areas of its proposed or current operations that respect the sovereignty,
land, culture, human rights, and intellectual property of the indigenous peoples. KLD
began assigning this strength in 2000. In 2002 KLD moved this strength rating into the
Human Rights area.
34
Volunteer Programs: The company has an exceptionally strong volunteer program. In
2005, KLD added the Volunteer Programs Strength.
Other Strengths: The company has either an exceptionally strong in-kind giving pro-
gram or engages in other notably positive community activities.
Bad CSR Investment Controversies: The company is a financial institution whose lend-
ing or investment practices have led to controversies, particularly ones related to the Com-
munity Reinvestment Act.
Negative Economic Impact: The company’s actions have resulted in major controversies
concerning its economic impact on the community. These controversies can include issues
related to environmental contamination, water rights disputes, plant closings, "put-or-pay"
contracts with trash incinerators, or other company actions that adversely affect the quality
of life, tax base, or property values in the community.
Indigenous Peoples Relations: The company has been involved in serious controversies
with indigenous peoples that indicate the company has not respected the sovereignty, land,
culture, human rights, and intellectual property of indigenous peoples. KLD began assign-
ing this concern in 2000. In 2002 KLD moved this strength rating into the Human Rights
area.
Tax Disputes: The company has recently been involved in major tax disputes involving
Federal, state, local or non-U.S. government authorities, or is involved in controversies over
its tax obligations to the community. In 2005, KLD moved Tax Disputes from Corporate
Governance to Community.
Other Concern: The company is involved with a controversy that has mobilized com-
munity opposition, or is engaged in other noteworthy community controversies.
35

Table 1: Summary Statistics
Variable Obs Mean Std. Dev. Min Max
Cumulative Abnormal Return (CAR) 242 -0.007 0.066 -0.369 0.492
Event (Indicator) 26585 0.009 0.095 0.000 1.000
High Product CSR 26586 0.070 0.256 0.000 1.000
High Community CSR 26586 0.132 0.339 0.000 1.000
Medium Product CSR 26586 0.738 0.440 0.000 1.000
Medium Community CSR 26586 0.796 0.403 0.000 1.000
Market Value (millions) 26498 6501.489 23239.860 0.000 626550.400
Market to Book 26458 2.135 1.471 1.000 27.716
Leverage 25689 0.209 0.195 -0.010 4.910
Year 26586 1991 2012

Table 2: Event Rates and levels of CSR (Logit)
Dependent Variable: Event(1) (2) (3) (4)
High Product CSR -1.0447*** -0.9153*** -0.9994*** -0.8696**(-3.18) (-2.77) (-2.90) (-2.53)
High Community CSR 0.7313** 0.8345*** 0.9670*** 0.8742**-2.46 -2.73 -2.77 -2.51
Medium Product CSR -1.3278*** -1.1978*** -1.1519*** -1.0268***(-6.30) (-5.51) (-5.01) (-4.51)
Medium Community CSR -0.4427 -0.3501 -0.3076 -0.2791(-1.51) (-1.15) (-0.88) (-0.80)
Observations 26581 25620 25498 25498Log Likelihood -909.2426 -844.7997 -685.9662 -656.6200
Year Fixed Effects Yes Yes Yes YesFinancial Controls No Yes Yes YesIndustry Controls (NAICS) No No 2 digit 3 digit
t statistics in parentheses * p<0.10 ** p<0.05 *** p<.01

Table 3: Event Rates and Levels of CSR (Probit)
Dependent Variable: Event(1) (2) (3) (4)
High Product CSR -0.4856*** -0.4547*** -0.4931*** -0.4346***(-3.20) (-2.93) (-3.10) (-2.71)
High Community CSR 0.3816*** 0.4299*** 0.4966*** 0.4483***(2.65) (2.91) (2.97) (2.67)
Medium Product CSR -0.6267*** -0.5673*** -0.5606*** -0.5020***(-6.45) (-5.63) (-5.29) (-4.73)
Medium Community CSR -0.1769 -0.1295 -0.0893 -0.0830(-1.26) (-0.89) (-0.54) (-0.50)
Observations 26581 25620 25498 25498Log Likelihood -906.4960 -840.3725 -679.8645 -651.6976
Year Fixed Effects Yes Yes Yes YesFinancial Controls No Yes Yes YesIndustry Controls (NAICS) No No 2 digit 3 digit
t statistics in parentheses * p<0.10 ** p<0.05 *** p<.01

Table 4: Magnitude of Firm Value Protection and Levels of CSR (1 day window)
Dependent Variable: Event(1) (2) (3) (4)
High Product CSR 0.0244** 0.0311*** 0.0324** 0.0249*(2.49) (2.70) (2.50) (1.91)
High Community CSR -0.0130 -0.0242* -0.0250 -0.0245(-0.93) (-1.75) (-1.29) (-1.22)
Medium Product CSR 0.0097 0.0157 0.0155 0.0128(1.10) (1.38) (1.22) (0.93)
Medium Community CSR -0.0260* -0.0352** -0.0454** -0.0461**(-1.69) (-2.32) (-2.08) (-2.20)
Observations 242 228 192 192R Squared 0.092 0.169 0.215 0.291
Year Fixed Effects Yes Yes Yes YesFinancial Controls No Yes Yes YesIndustry Controls (NAICS) No No 2 digit 3 digit
t statistics in parentheses * p<0.10 ** p<0.05 *** p<.01
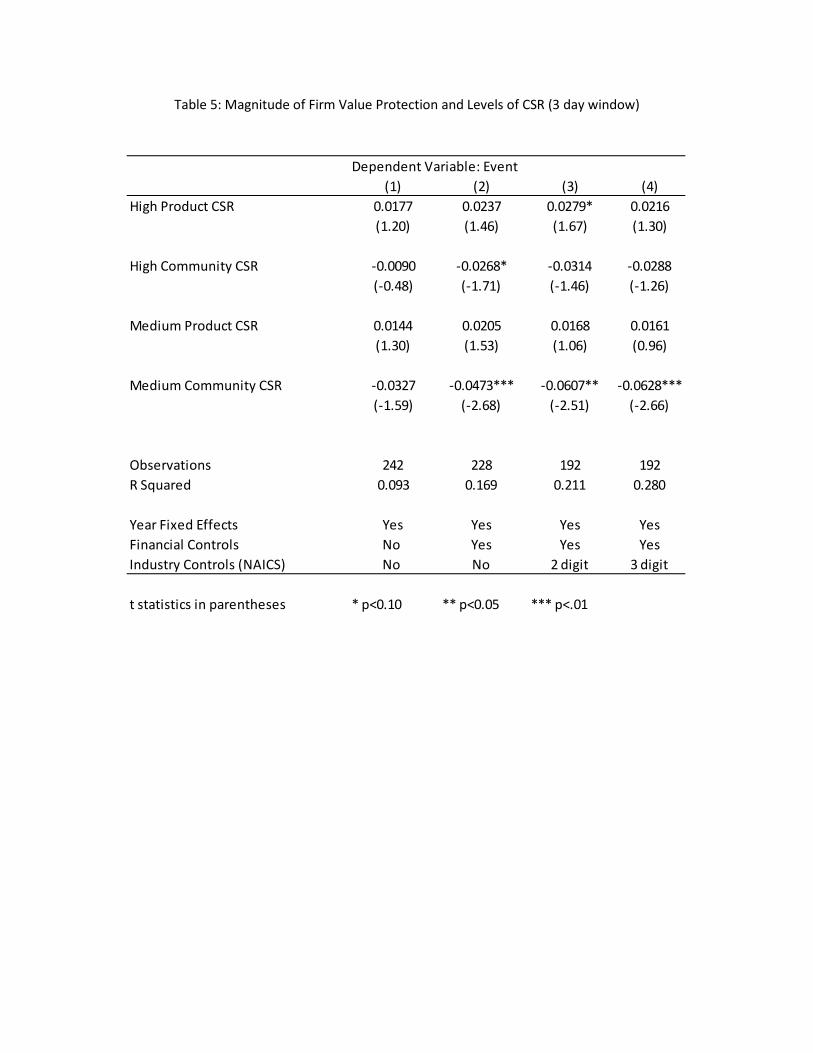
Table 5: Magnitude of Firm Value Protection and Levels of CSR (3 day window)
Dependent Variable: Event(1) (2) (3) (4)
High Product CSR 0.0177 0.0237 0.0279* 0.0216(1.20) (1.46) (1.67) (1.30)
High Community CSR -0.0090 -0.0268* -0.0314 -0.0288(-0.48) (-1.71) (-1.46) (-1.26)
Medium Product CSR 0.0144 0.0205 0.0168 0.0161(1.30) (1.53) (1.06) (0.96)
Medium Community CSR -0.0327 -0.0473*** -0.0607** -0.0628***(-1.59) (-2.68) (-2.51) (-2.66)
Observations 242 228 192 192R Squared 0.093 0.169 0.211 0.280
Year Fixed Effects Yes Yes Yes YesFinancial Controls No Yes Yes YesIndustry Controls (NAICS) No No 2 digit 3 digit
t statistics in parentheses * p<0.10 ** p<0.05 *** p<.01

Table 6: Magnitude of Firm Value Protection and Levels of CSR (4 day window)
Dependent Variable: Event(1) (2) (3) (4)
High Product CSR 0.0257** 0.0322** 0.0314** 0.0270*(2.14) (2.37) (2.11) (1.91)
High Community CSR -0.0149 -0.0297* -0.0307 -0.0287(-0.88) (-1.93) (-1.48) (-1.30)
Medium Product CSR 0.0107 0.0163 0.0156 0.0144(1.10) (1.33) (1.09) (0.97)
Medium Community CSR -0.0358** -0.0489*** -0.0622*** -0.0642***(-1.97) (-2.99) (-2.71) (-2.83)
Observations 242 228 192 192R Squared 0.072 0.162 0.210 0.268
Year Fixed Effects Yes Yes Yes YesFinancial Controls No Yes Yes YesIndustry Controls (NAICS) No No 2 digit 3 digit
t statistics in parentheses * p<0.10 ** p<0.05 *** p<.01

Figure 1: A Probability Tree for the Likelihood of Firm Events
Firm effort is 𝑒𝑒, firm type is 𝛾𝛾, and 𝑝𝑝ℎ and 𝑝𝑝𝑙𝑙 are the probability of the firm in a high and low risk state experiencing an event, respectively.