Embed Size (px)
Citation preview
The Validation of Macro and Micro Observations of Parent–Child Dynamics Using the Relationship Affect Coding System in Early Childhood
Thomas J. Dishion1,5, Chung Jung Mun1, Jenn-Yun Tein1, Hanjoe Kim1, Daniel S. Shaw2, Frances Gardner3, Melvin N. Wilson4, and Jenene Peterson5
1Department of Psychology, Arizona State University, P.O. Box 876005, Tempe, AZ 85287-6005, USA
2Department of Psychology, University of Pittsburgh, Pittsburgh, PA, USA
3Department of Social Policy and Intervention, University of Oxford, Oxford, UK
4School of Medicine, University of Virginia, Charlottesville, VA, USA
5Oregon Research Institute, Eugene, OR, USA
Abstract
This study examined the validity of micro social observations and macro ratings of parent–child
interaction in early to middle childhood. Seven hundred and thirty-one families representing
multiple ethnic groups were recruited and screened as at risk in the context of Women, Infant, and
Children (WIC) Nutritional Supplement service settings. Families were randomly assigned to the
Family Checkup (FCU) intervention or the control condition at age 2 and videotaped in structured
interactions in the home at ages 2, 3, 4, and 5. Parent–child interaction videotapes were
microcoded using the Relationship Affect Coding System (RACS) that captures the duration of
two mutual dyadic states: positive engagement and coercion. Macro ratings of parenting skills
were collected after coding the videotapes to assess parent use of positive behavior support and
limit setting skills (or lack thereof). Confirmatory factor analyses revealed that the measurement
model of macro ratings of limit setting and positive behavior support was not supported by the
data, and thus, were excluded from further analyses. However, there was moderate stability in the
families’ micro social dynamics across early childhood and it showed significant improvements as
a function of random assignment to the FCU. Moreover, parent–child dynamics were predictive of
chronic behavior problems as rated by parents in middle childhood, but not emotional problems.
We conclude with a discussion of the validity of the RACS and on methodological advantages of
Correspondence to: Thomas J. Dishion.
Electronic supplementary material The online version of this article (doi:10.1007/s11121-016-0697-5) contains supplementary material, which is available to authorized users.
Compliance with Ethical Standards
Conflict of Interest The authors declare that they have no conflict of interest.
Ethical Approval All procedures performed in studies involving human participants were in accordance with the ethical standards of the institutional and/or national research committee and with the 1964 Helsinki Declaration and its later amendments or comparable ethical standards. This article does not contain any studies with animals performed by any of the authors.
Informed Consent Informed consent was obtained from all individual participants included in the study.
HHS Public AccessAuthor manuscriptPrev Sci. Author manuscript; available in PMC 2018 May 02.
Published in final edited form as:Prev Sci. 2017 April ; 18(3): 268–280. doi:10.1007/s11121-016-0697-5.
Author M
anuscriptA
uthor Manuscript
Author M
anuscriptA
uthor Manuscript
brought to you by COREView metadata, citation and similar papers at core.ac.uk
provided by University of Houston Institutional Repository (UHIR)
micro social coding over the statistical limitations of macro rating observations. Future directions
are discussed for observation research in prevention science.
Keywords
Early childhood; Parent; child interaction; Parenting skills; Problem behavior; Middle childhood
Introduction
Observations of Parenting
Early research on parent–child interactions prognostic of future delinquency relied on
narrative case notes that were later transcribed into parenting dimensions (e.g., Glueck and
Glueck 1950). Decades later, independent students would sift through the case notes and
create construct scores. These labor-intensive methods yielded constructs such as harsh
discipline or lax supervision and were among the strongest predictors of delinquent behavior
in adolescence (for a review, see Loeber and Dishion 1984). Thus, the field of home
observation was born.
During a rapid period of innovation of behavioral interventions, it became apparent that
parenting practices themselves could be the target of intervention (see O’Dell 1974).
Behavior therapy focused on teaching parents to use contingent positive reinforcement of
children’s positive behavior to replace problem behavior and introducing limit-setting
practices such as time out and response cost (see Patterson 1974a, b). Central to these
innovations was an intensive focus on measurement. Structured, in vivo, direct observation
procedures were common to all behavioral interventions (e.g., Reid 1978). Using a time
sampling procedure, the frequency of aversive behaviors would be divided by the
observation time to create a total aversive behavior (TAB) score reflecting the child’s
coercive behavior during the observation session (see Patterson 1974a, b). The TAB score
was collected at baseline, during an intervention phase, and often when the intervention was
removed (i.e., ABA designs). From a behavioral perspective, evidence of a change in the
TAB score was sufficient to conclude that the intervention was working.
The vast majority of behavior observation systems that assessed parent–child interaction
focused on the frequency of events (Gardner 2000; Reid 1978). However, it became apparent
that some parent–child interactions endured into extended interactive chains (Patterson and
Moore 1979). Coding systems, such as the Family Process Code, were designed that
measured the duration and emotional valence of the behavior e.g., Dishion et al. (1983) The
Family Process Code: A multidimensional system for observing family interaction,
Unpublished report. As a result, statistical frameworks that utilized duration information
were articulated (Griffin and Gardner 1989). Despite advancements in coding of duration of
parent–child interaction and the refinement of relevant statistical models, the use of duration
to assess time-sensitive dynamics was wanting.
Dishion et al. Page 2
Prev Sci. Author manuscript; available in PMC 2018 May 02.
Author M
anuscriptA
uthor Manuscript
Author M
anuscriptA
uthor Manuscript
A Dynamic Systems Framework
A dynamic systems framework became useful for the analysis and visualization of duration
of events between the parent and the child (e.g., Granic and Patterson 2006; Hollenstein and
Lewis 2006; Lewis 2000). The ongoing interaction between a parent and child could be
captured and visualized within a “state space” grid (see Hollenstein 2013). The target child’s
(TC) behavior could be simplified from a variety of content and affect codes into specific
states, including positive (POS), neutral (NEU), directive (DIR), negative (NEG), not talking
(NTK), and ignoring (IGN), using the Relationship Affect Code Peterson et al. (2008) m
Relationship Affect Coding System, Unpublished coding manual. Similarly, parent behavior
could be captured in the same states. As both parent and child are measured at every time
point during the observation, it is possible to visually depict the ongoing interaction in the
state space diagram, as shown in Fig. 1.
Introducing another level of simplification, Dishion et al. (2012) examined mutual dyadic
states, such as (1) the duration parents and adolescents remained in neutral-positive (positive
engagement) during a problem-solving discussion, referred to as dyadic positive engagement
(DPE), and (2) the duration parents and adolescents remained in negative states, labeled
dyadic coercion (DC). Dyadic states are as the grist of the mill in socialization, in that both
family members are engaged in a reciprocal process with potential short and long-term
effects (see Bell 1979; Patterson 1982; Shaw and Bell 1993).
Conceptually, DPE and DC map onto two broad domains of parenting that often serve as
targets in family intervention research. Positive behavior support describes a set of parent
skills that prompt, evoke, and reinforce positive behavior in children and adolescents in the
service of positive social and emotional development. DPE fits within this domain of
parenting, as an observed tendency to engage children in extended interactions and
discussions that involve periodic positive behavior, reinforcement, and prompting for
continued interaction. The child’s responsiveness to parent leadership may, in part, be a
reflection of the parent’s sensitivity and skill. Children’s development of competence and
self-regulation emerges from repeated participation in interactions that are verbal,
encouraging, and engaging (Eisenberg et al. 2005; Gardner et al. 1999; Hart and Risley
1995).
Limit setting on children’s behavior is a critical parenting skill relevant to the development
of several forms of problem behavior (Patterson 1982). Skillful limit setting requires kind
but firm structured guidance to improve self-regulation, as well as to benefit the daily lives
of others. Direct observations of DC are indicative of the parent’s lack of skill in limit
setting, which is reflected in the average duration of both the parent and child’s engagement
in various forms of negative behavior. DC falls squarely into limit setting, as it captures the
parent’s emotional and aversive reactions to the child’s problem behavior, as well as the
child’s tendency to be emotionally reactive to adult limits. The duration of “conflict” is the
cornerstone of coercion theory (Patterson 1982; Snyder et al. 1994) and provides a venue for
negative reinforcement of relatively minor problem behaviors, which may evolve into more
serious forms of problem behavior at home and school (Loeber and Dishion 1984).
Dishion et al. Page 3
Prev Sci. Author manuscript; available in PMC 2018 May 02.
Author M
anuscriptA
uthor Manuscript
Author M
anuscriptA
uthor Manuscript
In both early childhood and adolescence, the Relationship Affect Coding System (RACS)
dyadic states (e.g., proportion of time) were shown to predict concurrent problem behavior.
For example, Dishion et al. (2012) found that DPE and DC fluctuated across interactive
tasks, nonetheless predicted antisocial behavior from age 16 to 18 based on 8 min of
videotaped discussion. Most recently, Sitnick et al. (2014) found that DC and DPE correlate
across time with parent’s report of oppositional and aggressive behavior from age 2 to 5,
with DPE predicting later DC (but not the converse) at adjacent years in cross-lagged
analysis.
Macro Ratings Parent–Child Interaction
Initially, global ratings were introduced to capture patterns of family interaction that could
be missed in micro social coding of behavioral exchanges (see Weinrott et al. 1981). Such
global ratings were less rigorous with respect to training in reliability. It was surprising that
the global ratings of family interaction were predictive, despite the lack of training involved
in collecting the data (Patterson 1986). Some methodological problems, however, became
clear with macro coding of family interaction, when applied to multi-agent and multi-
method structural equation models (Dwyer 1983). We initially referred to the inability to
confirm separate constructs from global ratings as the “glop” problem (Bank et al. 1990).
Briefly, the glop problem refers to mono-method bias because of the inability of coders to
distinguish anything but one general parenting dimension, much like an evaluative
dimension such as a “good–bad” factor (see Osgood 1962). The good–bad evaluative factor
embedded within-coder macro ratings leads to high correlations among parenting constructs
when testing measurement models.
Bias in macro ratings of parenting is also troubling if considering the use of direct
observation for evaluating parenting skills in families across diverse cultures and races.
Behavioral measurements of parenting in the early phases of the behavioral revolution were
very specific to reinforcement contingencies and the like. However, as the field became more
developmental, more complex constructs emerged such as monitoring and problem solving
that require fuller appreciation of their developmental and cultural context on the part of the
observer (Patterson et al. 1992). Gonzales et al. (1995) studied the micro social coding of
African-American and Asian American families and found important caveats to the use of
universal coding systems for families of diverse ethnicities. Extending this work to global
ratings of parenting practices, Yasui and Dishion (2008) introduced a naïve versus trained
condition for macro ratings of parenting practices and found that when coders were
untrained and gave impressionistic ratings, bias emerged in the direction of lower ratings for
African-American families. However, these studies suggested that bias could be eliminated
with appropriate training to assure raters met conventional standards of reliability.
Presently, the area of prevention science utilizes direct observation of parent–child dynamics
and macro ratings of parenting practices to evaluate the effectiveness of interventions and to
understand the development of psychopathology. Observations of family interaction using
videotapes are crucial for the study of intervention effects because these allow the
measurement of outcomes using trained raters blind to the intervention status. Indeed, the
majority of empirically supported intervention programs for child problem behavior were
Dishion et al. Page 4
Prev Sci. Author manuscript; available in PMC 2018 May 02.
Author M
anuscriptA
uthor Manuscript
Author M
anuscriptA
uthor Manuscript
developed in using direct observations of parent–child interaction to evaluate effectiveness
(e.g., Forgatch and Patterson 2010; Webster-Stratton and Reid 2010). However, to date, there
is little work on formally comparing direct observation coding systems such as the RACS
with less costly macro ratings of parenting skills with respect to convergent and predictive
validity and retest stability, as well as sensitivity to change to family-centered interventions.
Present Study
The goal of the present study is to test the relative utility of RACS parent–child dynamics
compared to the macro ratings of parenting skills. First, we use confirmatory factor analysis
to examine the convergent validity of the RACS parent–child dynamics latent variable
indicated by DPE and DC, with the macro ratings of parenting skills indicated by positive
behavior support (PBS) and coercive limit setting (CLS). Next, we examine the stability of
micro observation and macro ratings of parenting skills, respectively, over a 3-year interval
and sensitivity to change to family intervention over the same interval. Finally, we examine
the predictive validity of the two observation methods to future externalizing and
internalizing problems of the youth during middle childhood, based on parent report.
Method
Participants
Parents of 2 year olds were recruited from WIC programs in Pittsburgh, PA; Eugene, OR;
and Charlottesville, VA between 2002 and 2003. The WIC program provides nutritional
assistance for impoverished families (see Shaw et al. 2006). Families were invited to
participate in our study based on the following criteria: (a) families had a child whose age is
between 2 years old and (b) caregivers reporting risk. Specifically, families were included in
the study if they reported one standard deviation above the mean in two of the three
following domains: (1) family disruption (i.e., maternal depression, daily parenting
challenges, substance use problems, teen parent status), (2) child adjustment (i.e., conduct
problems and high-conflict relationships with adults), and (3) socio-demographic stress (i.e.,
low education and income level relevant to WIC criterion).
A total of 1666 families initially approached for inclusion in the study. Among them, 879
families met the eligibility requirements and 731 families consented to participate in the
study with 272 (37 %) families recruited in Pittsburgh, 271 (37 %) in Eugene, and 188
(26 %) in Charlottesville. These families were randomly assigned to either the intervention
(367 families) or the control (364 families) group after the first assessment at age 2 years. In
two parent families, parents were deemed either the primary caregiver (PC) or the alternative
caregiver (AC). The target child (TC) was the 2-year-old in the family. At the initial
assessment, the children (49 % female) had a mean age of 29.9 months (SD = 3.2). The PC
self-identified ethnicity is described as 46.6 % European-American, 27.6 % African-
American, 13.4 % Hispanic, 9.8 % biracial, and 2.4 % other. More than two thirds of the
families had an annual income of less than $20,000, and the average number of family
members per household was 4.5 (SD = 1.63). For primary caregiver, 23.6 % had less than a
high school education, 41 % had a high school diploma or general education diploma, and
Dishion et al. Page 5
Prev Sci. Author manuscript; available in PMC 2018 May 02.
Author M
anuscriptA
uthor Manuscript
Author M
anuscriptA
uthor Manuscript
35.4 % had post-high school training. Most of the families (78.4 %) were retained at the age
10 follow-up assessment.
Procedure
Assessments were completed in the home and included videotaped parent–child activities
and an array of questionnaires for the PC and AC to complete. The structured activities that
comprised the observation task included: the TC was involved in a free-play task (15 min);
the PC and TC engaged in a cleanup task (5 min), a delay of gratification task (5 min), and
four teaching tasks (3 min each). Then, TC was involved in a second free-play task (4 min)
and TC and PC participated in a second cleanup task (4 min). Finally, there was the
presentation of inhibition-inducing toys (2 min) followed by a meal preparation/lunch task
(20 min). All assessments were conducted with a PC and a TC. When available, the AC was
included in the home assessment. From ages 2 to 5, the same home assessment procedures
were repeated for both the control and the intervention groups. For later coding, all PC–TC
interactions were videotaped during assessment sessions with coders blinded to the
intervention status (see Dishion et al. 2008, for detailed description).
Financial incentives were provided for families participating in the project. Prior to the
study, written consents were obtained from all caregivers and ethical clearance was obtained
from the institutional review boards at three universities. Those in the control condition were
paid only for assessments and otherwise received WIC services as usual. In addition, all
control and intervention participants received a list of local mental health and developmental
disability services.
Random Assignment—Following the first assessment in the home, families’ random
assignment was revealed to the caregivers. Assessment staff was given an envelope with the
random assignment results. Assessment staff opened the envelope in the presence of the
caregiver and revealed their experimental status. Families who were randomized to the
intervention group were invited to receive feedback from the assessment, which is the first
step in the Family Checkup model described below.
The Family Checkup—The FCU is a three-session program offered annually to the
families assigned to the intervention group. It is designed to assess the need for follow-up
evidence-based parenting support services on the basis of the everyday parenting curriculum
(Dishion et al. 2011). The brief intervention includes the following: (a) a home-based,
observational assessment session that is multi-informant and ecological, (b) an initial intake
session, and (c) a feedback session (see Dishion and Stormshak 2007, for a more detailed
information). For this research, families first completed the observation session (prior to
random assignment) and then were invited into the initial interview. The initial interview
session was conducted with parent consultants trained by the first author and colleagues in
the FCU model. They examined caregivers’ concerns, specifically about children’s behavior
and well-being. Parent consultants summarized the assessment results into a feedback form
often referred to as the “rainbow sheet,” which organizes information into domains of family
functioning, with an indication of strengths and areas that need attention. Motivational
interviewing (Miller and Rollnick 2002) is used within the feedback session. Specific
Dishion et al. Page 6
Prev Sci. Author manuscript; available in PMC 2018 May 02.
Author M
anuscriptA
uthor Manuscript
Author M
anuscriptA
uthor Manuscript
sessions focusing on parent management strategies (Dishion et al. 2011) were motivated
within the feedback session. Levels of engagement in the FCU, parent management, and
observations of parent consultant fidelity were reported by Smith et al. (2014).
Measures
Observed Dyadic Positive Engagement and Coercion—The Relationship Affect
Coding System (RACS; Peterson et al. 2008) was used to code the videotaped PC–TC task
interactions at ages 2 to 5. RACS is a micro social coding system that measures the
topography (e.g., hit, talk, comply) and the affective quality of the PC–TC interactions (e.g.,
anger, happy, neutral). The RACS captures three simultaneous dimensions of behavior—
verbal, physical, and affect—for both TC and PC. Each participant’s behavioral cues—facial
expressions, tone of voice, and non-verbal cues (e.g., body posture and/or orientation)—
were used for coding. Each dimension of behavior was then aggregated into three clusters:
positive, negative, and neutral.
Noldus Observer XT, Version 11.0 (Noldus Information Technology 2012) was used for
RACS coding. The software allows for continuous coding of interactions between the TC
and the PC, simultaneously. The RACS system includes content codes (e.g., Positive Verbal,
Directive, Negative Verbal, Neutral Physical, etc.) and affect codes (e.g., Positive Affect,
Distress, Anger, Neutral Affect, etc.), which are rendered into the following six behavior
clusters: positive, neutral, directives, negative, no talk, and ignore. Decision rules on how to
combine the content and affect codes into clusters followed the principle that negative affect
or content trumped all neutral and positive codes in the formation of the negative cluster. For
example, a positive verbal in angry affect functions as an aversive event and therefore was
included in the negative cluster. The positive behavior cluster included behaviors such as
positive verbal, structure, affect or physical, and validation. The negative behavior cluster
included behaviors that are associated with anger and disgust, negative verbal statements,
and negative physical interaction. Decision rules for determining which behavior stream
wins out in the event that two different behavior streams were present simultaneously were
developed and the order of trumping is as follows: (1) ignore, (2) negative, (3) positive, (4)
directive, (5) no talk, and (6) neutral behavior. For example, if a PC made a negative verbal
statement and showed signs of positive affect to the TC simultaneously, this would be coded
as negative behavior. Based on the six behavior clusters, dyadic states were derived by
coding both the PC and the TC’s states on a continuous timeline of the videotaped
observation. Thus, the durations of behavior clusters were calculated for the PC and TC,
respectively, and the durations of dyadic states and interaction dynamics within families
(both PC and TC) were also calculated.
The duration of five different PC and TC’s interaction states was derived as follows: dyadic positive engagement (DPE), dyadic coercion (DC), parent coercion, child coercion, and
dyadic non-engagement. DPE is a summary score that reflects the duration of positive (POS)
and neutral (NEU) behavior engagement between the PC and the TC. As shown in Fig. 1,
the DPE included four out of 36 possible cells on the grid. Twelve out 36 cells on the grid
represents the DC states. Similarly, a summary score was created for parent coercion, child coercion, and dyadic non-engagement. However, these were not used in the present study. A
Dishion et al. Page 7
Prev Sci. Author manuscript; available in PMC 2018 May 02.
Author M
anuscriptA
uthor Manuscript
Author M
anuscriptA
uthor Manuscript
duration–proportion score was then calculated for the five dyadic states by dividing the total
duration of each PC–TC dyad observed in the region by the overall session time. The
cleanup, joint play, inhibition, and meal tasks were coded for all ages. Over the course of 3
years, 46 mostly undergraduate students were trained to use the RACS code. Inter-rater
reliability coefficients based on the duration and sequencing of coded behavior were
computed on 20 % of all videotapes and were found to be in good to excellent range, with an
overall kappa score of 0.93 at each age and coder agreement of 93, 94, 93, and 94 % at ages
2, 3, 4, and 5, respectively.
Coder Impression Inventory—Coders of videotapes completed the Coder Impressions
Inventory COIMP; Dishion et al. (2004) The Coder Impressions Inventory, Unpublished
coding manual for the videotaped interactions between PC and TC at ages 2, 3, 4, and 5. The
COIMP measures various dimensions of family management processes including
relationship quality and family problem-solving skills. Coders rated each COIMP item on a
nine-point response scale (e.g., 1 = not at all, 9 = very much). Based on percent agreement
(within 1 point scored as agreement), a reliability analysis based on 20 % of randomly
selected videotapes showed that percent agreement ranged from 87 to 88 % from age 2
through age 5.
We used expert ratings to select items from COIMP as indicators of positive behavior
support (PBS) and limit setting. Because many of the items relevant to limit setting were
actually coercive strategies, we labeled this construct coercive limit setting (CLS). Experts
were presented with written definitions of PBS and CLS. Experts included established
researchers in child and family therapy familiar with social learning based models of parent
interventions. Eighteen experts in this field of research rated each of the COIMP items on a
scale of 1 to 9 (1 = not at all, 5 = somewhat, and 9 = very likely) as to what extent the
COIMP items could be used to describe one of the two constructs. Based upon the ratings,
we carefully selected a total of five items from COIMP to present PBS (e.g., “Does the
parent encourage positive child behavior with praise and/or incentives?”) and 10 items to
present CLS (e.g., “Does the parent threaten the child with any sort of punishment to gain
compliance?”). Cronbach’s alphas for the PBS at age 2 and 5 were 0.84 and 0.72,
respectively, and for the CLS, 0.85 and 0.86, respectively.
Child Behavior Checklist—Child Behavior Checklist (CBCL) is a well-validated
measure of parent report of behavioral and emotional problems in children ages between 4 to
18 years old (Achenbach and Edelbrock 1983). Annual parent report of a child’s behavior
from ages 7.5 to 10.5 was used in the present study. The PC rated how each item was of the
TC’s usual behavior in the previous 6 months on a three-point Likert scale (0 = not true, 1 =
somewhat or sometimes true, and 2 = very true or often true). The two major behavioral
problem subscales, internalizing and externalizing, were used for the present study.
Cronbach’s alphas ranged from 0.93 to 0.95 for the externalizing and 0.87 to 0.89 for the
internalizing subscale.
Dishion et al. Page 8
Prev Sci. Author manuscript; available in PMC 2018 May 02.
Author M
anuscriptA
uthor Manuscript
Author M
anuscriptA
uthor Manuscript
Analytic Strategy
Descriptive statistics and outlier analyses using Cook’s (1977) distance as criterion were
first conducted for all study variables. Second, a confirmatory factor analyses (CFA) was
used to test how the COIMP items that were selected by experts’ ratings represent the two
theoretical constructs (i.e., positive behavior support and coercive limit setting) in the
present study. The hypothesized measurement model for the parent–child dynamics (formed
by DPE and DC of RACS variables) and the macro ratings of parenting skills (constructed
by COIMP measures of PBS and CLS) was tested by CFA, examining the covariation
among the latent constructs as well as fit to the data. Contingent on the findings from the
measurement model, the stability of the latent constructs was examined across age 2
(baseline) to 5 following procedures suggested by Pitts et al. (1996).
After testing the measurement model, the sensitivity to the FCU was examined for the
parent–child dynamics and parenting skills constructs. Specifically, analysis of covariance
(ANCOVA) was used to examine the intervention effects on each of these constructs at age
5, controlling for the same construct measured at age 2.
Finally, the predictive validity of the two parenting constructs at age 5 was tested to the
trajectories of youth externalizing and internalizing problems during middle childhood (i.e.,
from age 7.5 to 10.5). Growth mixture modeling (GMM) was used to identify distinct
longitudinal trajectories of children’s externalizing and internalizing problems, separately.
The analytic procedure for GMM followed the three-step approach (see Bolck et al. 2004).
In the first step, the number of trajectory classes and the shape of the growth trajectories was
identified based upon the outline suggested by Ram and Grimm (2009), without adding any
covariates. Second, contingent on entropy (>0.8) the most likely classification membership
was exported from the GMM analyses. Previous studies suggest that when the entropy is
higher than 0.8 and the sample size is larger than 500, the 3-step approach that uses the most
likely classification membership does not introduce significant bias (Asparouhov and
Muthén 2013; Clark and Muthen 2009; Muthén and Muthén 2012a, b).1 In the third step,
logistic regression was employed to examine the predictive validity to the externalizing and
internalizing class membership. Gender, ethnicity (two dummy codes: African-American vs.
European-American and ethnic minorities vs. European-American; European-American
group was set as a reference group), and intervention status were included as covariates in
the third step.
Mplus version 7.3 (Muthén and Muthén 2012a, b) was used for testing the hypothesized
models. The full information maximum likelihood (FIML) estimation was used to handle
missing data. The goodness of fit indices for CFA and path models were evaluated by using
the comparative fit index (CFI), root mean square error of approximation (RMSEA), and the
standardized root mean squared residual (SRMR) (see Hu and Bentler 1999). For selecting
the best fitting model in the GMM, Bayesian information criterion (BIC; Schwarz 1978), the
adjusted BIC (Sclove 1987), Vuong-Lo-Mendell-Rubin likelihood ratio test (VLMR; Lo et
1Note that the recently developed three-step approach (Asparouhov and Muthén 2013) was not feasible in this study because the main predictor variable was a latent variable. It is not yet possible to include a latent variable in the auxiliary variable command in the new three-step approach.
Dishion et al. Page 9
Prev Sci. Author manuscript; available in PMC 2018 May 02.
Author M
anuscriptA
uthor Manuscript
Author M
anuscriptA
uthor Manuscript
al. 2001), bootstrap likelihood ratio test (BLRT; McLachlan and Peel 2000), and entropy
(Ramaswamy et al. 1993) were used as criteria (see Tein et al. 2013).
Results
Preliminary Analyses
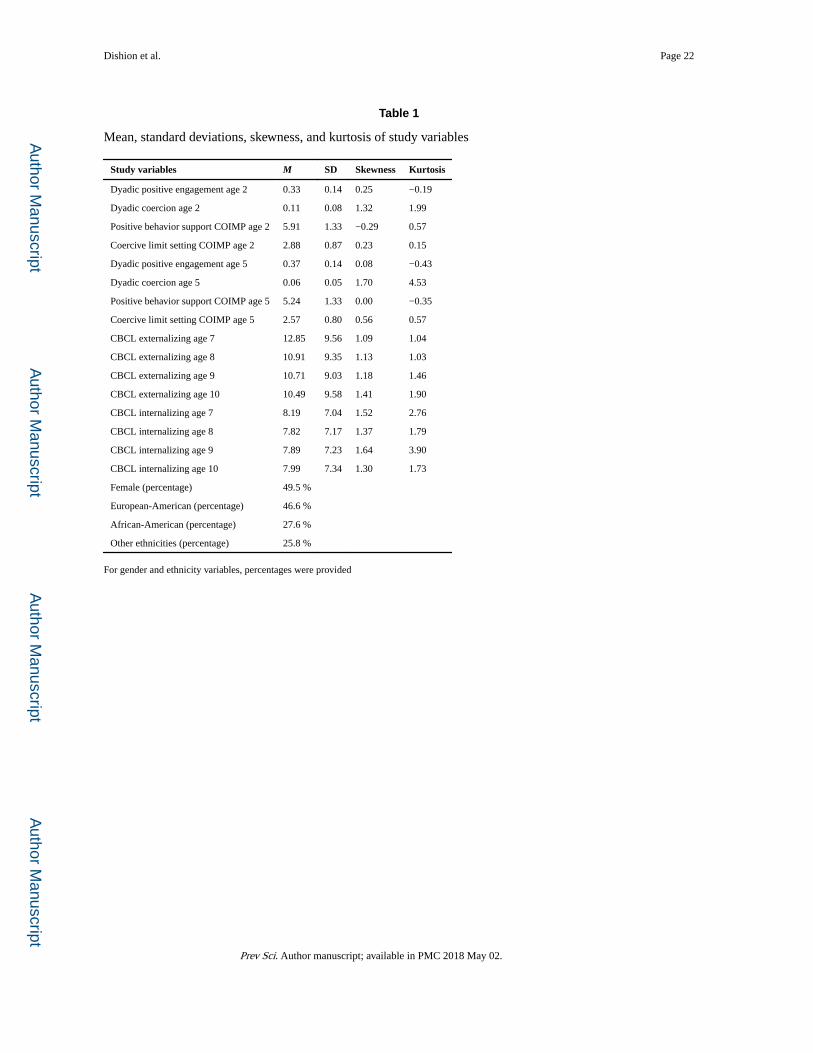
The descriptive statistics for all study variables are summarized in Table 1, including
baseline variables. Skewness and kurtosis of all variables fell within the acceptable range
(West et al.1995). Multivariate outlier analyses identified no influential cases. A correlation
table of the study variables is available as the online supplement.
Confirmatory Factor Analyses
Measurement Model of Macro Ratings of Parenting Skills—To confirm whether
the selected COIMP items by experts represented the two theoretical latent constructs (i.e.,
positive behavior support and coercive limit setting), a CFA was conducted. The
measurement model of macro ratings of parenting skills at age 2 (baseline) showed poor
model fit to the present data, χ2 (89) = 1342.36, p < .001, RMSEA = 0.14, CFI = 0.75, and
SRMR = 0.09.2 The modification indices of the Mplus output suggested that there were
many crossover factor loadings between the two latent constructs. Multiple indicators were
correlated based upon the modification indices, but the additional correlations did not
significantly improve model fit. The findings of the exploratory factor (EFA) analysis were
consistent with CFA. The two factor model with oblimin rotation showed overall poor model
fit. Lastly, based upon the previous findings, suggesting a pervasive underlying good–bad
factor to coder macro ratings (Bank et al. 1990; Osgood 1962), a bi-factor model was tested.
The bi-factor model failed to converge. Based on these findings, we conclude that a
measurement model based on macro ratings of limit setting and positive behavior support
was not supported by the data and is excluded from further analyses.
Stability of Parent–Child Dynamics from Age 2 to 5 Years—We examined that the
stability of the parent–child micro of this latent variable remained stable across age 2 to 5.
Following Pitts et al. (1996) proposed guideline, we compared a model without parameter
constraints and a model constraining factor loadings to be equal across age 2 to 5. The
model without constraints fit the data adequately, χ2 (4) = 19.66, p < .001, RMSEA = 0.07,
CFI = 0.99, and SRMR = 0.02 (see Fig. 2) as did the constrained model, χ2 (8) = 29.85, p < .001, RMSEA = 0.06, CFI = 0.99, and SRMR = 0.03. Although the chi-square difference
test between the two models was significant [Δχ2 (4) = 10.19, p = .04], all other fit indices
did not change significantly. Following Chen’s (2007) criteria (e.g., ΔCFI ≤ 0.01, ΔRMSEA
≤ 0.015, and ΔSRMR ≤ 0.03 indicating invariance), the longitudinal measurement invariance
of the factor loadings (i.e., the relation between DPE and DC of RACS variables) was
accepted for the micro ratings of parent–child dynamics. In addition, it was found that the
parent–child dynamics across age 2 to 5 were moderately inter-correlated, suggesting test–
retest stability in these observed indicators of parent–child interaction dynamics.
2The CFA result of this model at age 5 also had a poor fit of the data, χ2 (89) = 1296.19, p < .001, RMSEA = 0.16, CFI = 0.70, and SRMR = 0.14
Dishion et al. Page 10
Prev Sci. Author manuscript; available in PMC 2018 May 02.
Author M
anuscriptA
uthor Manuscript
Author M
anuscriptA
uthor Manuscript
Sensitivity to Change by FCU Intervention—Figure 3 shows the result of analysis of
covariance for RACS parent–child dynamics construct at age 5. Consistent with previous
findings (Sitnick et al. 2014), families randomly assigned to the FCU intervention showed
improvement in these RACS indicators of parent–child dynamics (B = 0.09, SE = 0.04, p < .
05).3
Predictive Validity for RACS Parent–Child Dynamics—Table 2 shows the results of
the model fitting processes for problem behaviors. We identified the two-class model that
freely estimates factor means as the best fitting model. Although the two-class model that
freely estimates residual variances, covariances, and means was run without improper
solution, the value of entropy was low. The two-class model that freely estimates factor
means included a group of young children showing high and increasing problem behavior
(13.5 %) and a group exhibiting low and decreasing levels of problem behavior (86.6 %).
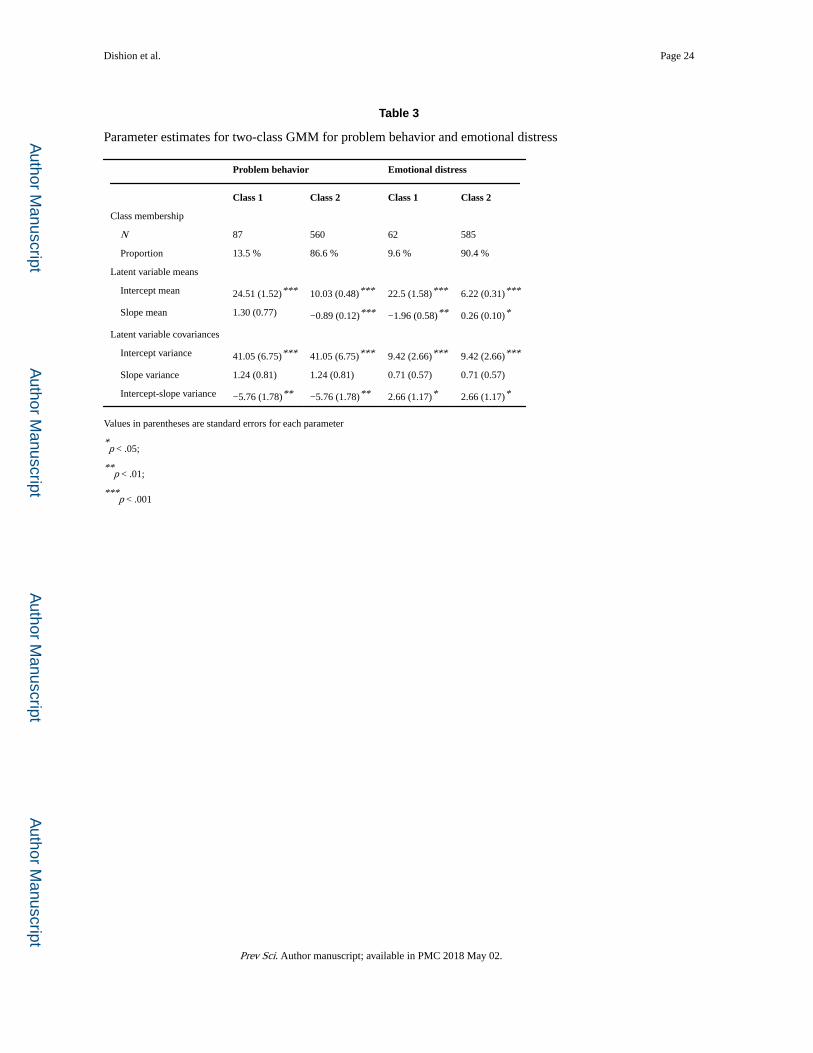
Table 3 represents the parameter estimates of this two-class model, and Fig. 4a shows the
estimated mean trajectories for classes 1 and 2.
Table 2 also displays the findings of the systematic model fitting process for the GMM for
internalizing problems in middle childhood. We chose the two-class model with freely
estimated factor means as the best fitting model based the same procedures as externalizing
problems. The two trajectories included a group of young children showing high levels of
internalizing problems that showed a decreasing trend (9.6 %) and a group exhibiting
consistently low and increasing levels of internalizing (90.4 %). Table 3 provides the
parameter estimates for this two-class model and Fig. 4b, as well as the estimated mean
trajectories for classes 1 and 2.
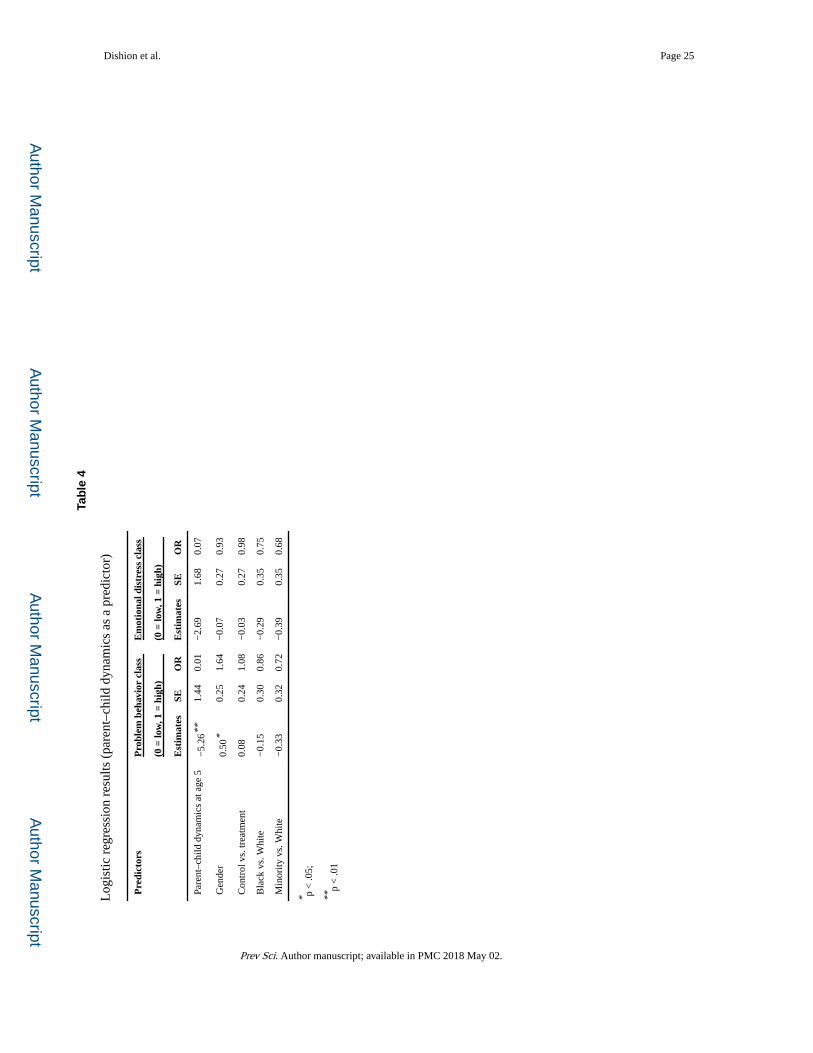
We tested the predictive validity of RACS parent–child dynamics at age 5 separately on
trajectory patterns of problem behavior and emotional distress while controlling for gender,
ethnicity, and intervention status. Children who had higher scores on parent–child dynamics
(i.e., higher levels of DPE and lower levels of DC) had lower odds of belonging to high and
increasing problem behavior (i.e., externalizing) group (B = −5.26, SE = 1.44, odds ratio
[OR] = 0.01, p < .001). However, parent–child dynamics were not predictive of persistent
emotional distress (i.e., internalizing) in middle childhood. Among the covariates, male
children had higher odds of belonging to the group of children perceived by parents as
having externalizing problems in middle childhood (B = 0.50, SE = 0.25, OR = 1.64, p < .
05). The results of odds ratio statistics for the parent–child dynamics as a predictor are
reported in Table 4.
Discussion
This study examined the convergent and predictive validity of the RACS family interaction
coding system for assessing parent–child interaction in early childhood. Importantly, we
focused on comparing the validity of this micro coding approach to that of using macro
ratings of parenting skill. In the dynamic coding, behavior of the child and parent is coded
3Additionally, we tested FCU intervention effects on parent–child dynamics at age 3 and 4, respectively. There was a significant intervention effect on parent–child dynamics at age 3 but not at age 4.
Dishion et al. Page 11
Prev Sci. Author manuscript; available in PMC 2018 May 02.
Author M
anuscriptA
uthor Manuscript
Author M
anuscriptA
uthor Manuscript
separately and simultaneously. From a dynamic systems framework, this level of coding
introduces the need to consider the ongoing dyadic state and to de-emphasize the behavior of
each individual. Parent–child dyadic positive engagement (DPE) and dyadic coercion (DC)
were moderately correlated and formed well within a larger latent construct of parent– child
dynamics. The finding that random assignment was associated with improved parent–child
interaction suggests that these dyadic states are, in part, driven by parenting skills.
Although macro ratings of parenting practices in structured interaction tasks are relatively
easy to collect and often provide meaningful descriptions of interaction processes, they are
not without their psychometric problems when analyzed from a latent variable perspective.
In previous research, we identified the glop problem for macro ratings, which is a variation
on mono method bias (Bank et al. 1990; Cook and Campbell 1979). Despite an effort to
rigorously identify macro ratings that described positive behavior support and coercive limit
setting, the measurement model was not supported by the data, and the two parenting
dimensions were indistinguishable. For the purpose of this study, we excluded these ratings
from further analyses. However, this finding does suggest the need for further measurement
development of macro ratings of relationship dynamics.
The analysis of longitudinal stability and change confirmed previous research with this
sample and other studies that focus on changing parent–child interaction through supporting
parenting skill (e.g., Patterson 1974a, b; Forgatch and DeGarmo 1999). Despite the fact that
the latent constructs were moderately stable from age 2 to 5, the parent–child dynamics
construct was sensitive to change in the context of a randomized prevention trial using the
FCU. Moreover, as expected, the parent–child dynamics construct predicted long-term
pervasive problem behavior through middle childhood.
These findings support the perspective articulated by Fiske (1986) on the need for behavioral
sciences to directly measure behavior. Measures that are specific and targeted to events as
they occur in real time are more likely to improve our understanding of behavior compared
to those based on participants’ reports and/or macro ratings of the interaction. Indeed, great
strides in the field of intervention research occurred as a result of the direct measurement of
targeted behaviors. Moreover, we are now becoming more sophisticated in the measurement
of family interaction by capturing the duration of interaction between the parent and the
child and not arbitrarily censoring either the parent (as in the TAB score) or the child, as is
typical in many direct observations of parenting practices. As shown in the present study, it
is not surprising that the more objective and specific measurements of the parent–child
dynamics were more sensitive to change within a prevention trial that emphasized yearly
FCUs. Previous studies also revealed modest improvements in long-term improvements in
the child’s problem behavior, and most recently, in teachers’ ratings of the child’s problem
behavior in elementary school (Dishion et al. 2014).
Although we focused on validating the larger construct of parent–child dynamics, it is worth
noting that when one examines dyadic positive engagement and dyadic coercion, previous
research suggests that the former is more readily changed in the context of a preventive
intervention than the latter (Sitnick et al. 2014). Moreover, we found that videotaped
feedback is often necessary to help parents change their parenting when they are revealed to
Dishion et al. Page 12
Prev Sci. Author manuscript; available in PMC 2018 May 02.
Author M
anuscriptA
uthor Manuscript
Author M
anuscriptA
uthor Manuscript
have high levels of dyadic coercion (Smith et al. 2014). Coercive interaction patterns are
often emotionally driven and occur outside of parents’ awareness (Patterson 1982). Thus, it
may often be the case that the parents may not be able to accurately report on their own
tendency to engage in coercive bouts with their young child until they actually see the
interactions on videotapes in the context of a supportive therapist. Direct observation is
useful as a measurement tool, which can also be used as a support for motivating change in
basic, unconscious interaction dynamics.
Future research should continue to contribute to the science of behavior, in general, and to
family health, in particular, by clarifying the types of tasks that evoke the behavior of
interest and the measurement systems that accurately capture the specificity of the parenting
skill and the parent–child dynamic. We see that both developmental and intervention science
would benefit from a clear methodology for studying “dynamic mediation” for growth in
competence and decrease in maladaptation in the context of intervention science. Advances
in multi-level modeling enable the study of linkage between hundreds of micro social events
and long-term behavioral outcomes (see Stoolmiller and Snyder 2006).
Limitations and Conclusions
This study had three limitations. First, the tasks selected to evoke parent–child interaction
changed because of children’s evolving developmental status from age 2 through age 5 and
to conduct these analyses, we were able to only use those tasks consistently used at all ages.
Thus, the observations were based on relatively brief samples of behavior at each age.
Despite the limitation, it is surprising that we were able to find good retest stability and
predictive validity. Second, the families of the present study were at risk and they
represented a wide variety of cultures, races, and ethnicities. It is possible that these direct
observation methods require additional adjustment or trainings for coders to assure
measurement equivalence and to reduce bias. Lastly, the focus on duration of events
generally is only a first step in understanding the temporal dynamics of family interaction.
The specific analysis of duration is a growing area of observation research, and new analytic
tools such as multi-level survival models are being applied to understanding the covariates of
duration and rigidity (Stoolmiller and Snyder 2006; Hollenstein 2013). However, these
findings suggest the importance of analysis of temporal patterns of DC as well as DPE.
In general, the field of direct observation is growing in both cost efficiency and scientific
validity and will remain as a critical tool for prevention science in the near and distant
future. As a clinical tool, we have found videotaped parent–child interactions to be
acceptable to families of diverse ethnicities and cultures, including families with less
education. In contrast, questionnaires and interviews are often embedded with academic
terms and language that can be off-putting to parents and youth. Despite the scientific and
clinical appeal, direct observation is expensive in time and costs to the researchers.
Technological strategies for reducing costs are emerging, such as robotic coding of
videotapes for facial affect (Cohn and De la Torre 2015) and remote videotaping of families
using the Internet and guidance from research or clinical staff. Based on the growth in
videotaping and audiotaping in the general population, it is likely that it will become
Dishion et al. Page 13
Prev Sci. Author manuscript; available in PMC 2018 May 02.
Author M
anuscriptA
uthor Manuscript
Author M
anuscriptA
uthor Manuscript
increasingly viable to include direct observation in many intervention studies that propose to
change behavior.
Supplementary Material
Refer to Web version on PubMed Central for supplementary material.
Acknowledgments
Funding Funding for this research was provided by National Institute on Drug Abuse grant R01 DA036832-01A1 awarded to Daniel Shaw.
References
Achenbach, TM., Edelbrock, CS. Manual for the Child Behavior Checklist and revised behavior profile. Burlington: University of Vermont Department of Psychiatry; 1983.
Asparouhov, T., Muthén, B. Auxiliary variables in mixture modeling: A 3-step approach using Mplus. 2013. Online, http://statmodel.com/examples/webnotes/Aux-Mixture_submitted_corrected_webnote.pdf
Bank, L., Dishion, TJ., Skinner, M., Patterson, GR. Method variance in structural equation modeling: Living with “glop”. In: Patterson, GR., editor. Aggression and depression in family interactions. Hillsdale: Erlbaum; 1990. p. 247-280.
Bell RQ. Parent, child, and reciprocal influences. American Psychologist. 1979; 34:821.
Bolck A, Croon MA, Hagenaars JA. Estimating latent structure models with categorical variables: One-step versus three-step estimators. Political Analysis. 2004; 12:3–27. DOI: 10.1093/pan/mph001
Chen FF. Sensitivity of goodness of fit indexes to lack of measurement invariance. Structural Equation Modeling. 2007; 14:464–504.
Clark, S., Muthen, B. Relating latent class analysis results to variables not included in the analysis. 2009. Online, https://www.statmodel.com/download/relatinglca.pdf
Cohn, JF., De la Torre, F. Automated face analysis for affective computing. In: Calvo, RA.D’Mello, SK.Gratch, J., Kappas, A., editors. Handbook of affective computing. New York: Oxford; 2015. p. 131-150.
Cook RD. Detection of influential observation in linear regression. Technometrics. 1977; 19:15–18. DOI: 10.2307/1268249
Cook, TD., Campbell, DT. Quasi-experimentation: Design & analysis issues for field settings. Boston: Houghton Mifflin Co; 1979.
Dishion, TJ., Stormshak, EA. Intervening in children’s lives: An ecological, family-centered approach to mental health care. Washington, DC: American Psychological Association; 2007.
Dishion TJ, Brennan LM, Shaw DS, McEachern AD, Wilson MN, Jo B. Prevention of problem behavior through annual family check-ups in early childhood: Intervention effects from the home to early elementary school. Journal of Abnormal Child Psychology. 2014; 42:343–354. DOI: 10.1007/s10802-013-9768-2 [PubMed: 24022677]
Dishion TJ, Forgatch MS, Van Ryzin MJ, Winter C. The nonlinear dynamics of family problem solving in adolescence: The predictive validity of a peaceful resolution attractor. Nonlinear Dynamics, Psychology, and Life Sciences. 2012; 16:331–352.
Dishion TJ, Shaw DS, Connell A, Gardner FEM, Weaver C, Wilson M. The family check-up with high-risk indigent families: Preventing problem behavior by increasing parents’ positive behavior support in early childhood. Child Development. 2008; 79:1395–1414. DOI: 10.1111/j.1467-8624.2008.01195.x [PubMed: 18826532]
Dishion, TJ., Stormshak, EA., Kavanagh, K. Everyday parenting: A therapist’s guide for supporting family management practices. Champaign: Research Press; 2011.
Dwyer, JH. Statistical models for the social and behavioral sciences. New York: Oxford University Press; 1983.
Dishion et al. Page 14
Prev Sci. Author manuscript; available in PMC 2018 May 02.
Author M
anuscriptA
uthor Manuscript
Author M
anuscriptA
uthor Manuscript
Eisenberg N, Zhou Q, Spinrad TL, Valiente C, Fabes RA, Liew J. Relations among positive parenting, children’s effortful control, and externalizing problems: A three-wave longitudinal study. Child Development. 2005; 76:1055–1071. [PubMed: 16150002]
Fiske, DW. Specificity of method and knowledge in social science. In: Fiske, DW., Shweder, RA., editors. Metatheory in social science: Pluralisms and subjectivities. Chicago: University of Chicago Press; 1986. p. 61-82.
Forgatch MS, DeGarmo DS. Parenting through change: An effective prevention program for single mothers. Journal of Consulting and Clinical Psychology. 1999; 67:711–724. [PubMed: 10535238]
Forgatch, MS., Patterson, GR. Parent management training-Oregon model: An intervention for antisocial behavior in children and adolescents. In: Weisz, JR., Kazdin, AE., editors. Evidence-based psychotherapies for children and adolescents. New York: Guilford Press; 2010. p. 159-178.
Gardner F. Methodological issues in the use of observational methods for measuring parent child interaction. Clinical Child and Family Psychology Review. 2000; 3:185–198. [PubMed: 11225753]
Gardner F, Sonuga-Barke E, Sayal K. Parents anticipating misbehaviour: An observational study of strategies parents use to prevent conflict with behaviour problem children. Journal of Child Psychology and Psychiatry. 1999; 40:1185–1196. [PubMed: 10604397]
Glueck, S., Glueck, E. Unraveling juvenile delinquency. New York: Commonwealth Fund; 1950.
Gonzales, NA., Hiraga, Y., Cauce, AM. Observing mother-daughter interaction in African-American and Asian-American families. In: McCubbin, HI.Thompson, EA.Thompson, AI., Fromer, JE., editors. Resiliency in African-American families. Vol. 3. Thousand Oaks: SAGE; 1995. p. 259-285.
Granic I, Patterson GR. Toward a comprehensive model of antisocial development: A dynamic systems approach. Psychological Review. 2006; 113:101–131. DOI: 10.1037/0033-295X.113.1.101 [PubMed: 16478303]
Griffin WA, Gardner W. Analysis of behavioral durations in observational studies of social interaction. Psychological Bulletin. 1989; 106:497–502. DOI: 10.1037/0033-2909.106.3.497 [PubMed: 2813653]
Hart, B., Risley, TR. Meaningful differences in the everyday experiences of young American children. Baltimore: Brookes Publishing Co; 1995.
Hollenstein, T. State space grids: Depicting dynamics across development. New York: Springer; 2013.
Hollenstein T, Lewis MD. A state space analysis of emotion and flexibility in parent-child interactions. Emotion. 2006; 6:656–662. DOI: 10.1037/1528-3542.6.4.656 [PubMed: 17144756]
Hu LT, Bentler PM. Cutoff criteria for fit indexes in covariance structure analysis: Conventional criteria versus new alternatives. Structural Equation Modeling. 1999; 6:1–55. DOI: 10.1080/10705519909540118
Lewis MD. The promise of dynamic systems approaches for an integrated account of human development. Child Development. 2000; 71:36–43. DOI: 10.1111/1467-8624.00116 [PubMed: 10836556]
Lo Y, Mendell N, Rubin D. Testing the number of components in a normal mixture. Biometrika. 2001; 88(3):767–778. DOI: 10.1093/biomet/88.3.767
Loeber R, Dishion TJ. Boys who fight at home and school: Family conditions influencing cross-setting consistency. Journal of Consulting and Clinical Psychology. 1984; 52(5):759. [PubMed: 6501661]
McLachlan, G., Peel, D. Finite mixture models. New York: Wiley; 2000.
Miller, WR., Rollnick, S. Motivational interviewing. New York: The Guilford Press; 2002.
Muthén, LK., Muthén, BO. Mplus (version 7.1). Los Angeles: Muthén & Muthén; 2012a.
Muthén, LK., Muthén, BO. Latent variable modeling using Mplus: Day 2. 2012. https://www.google.com/url?sa=t&rct=j&q=&esrc=s&source=web&cd=1&ved=0ahUKEwj-3f3I9r7LAhUJ9mMKHYsHDnsQFggeMAA&url=http%3A%2F%2Fstatmodel2.com%2Fdownload%2Fhandouts%2FBeijing2012-Day2.pdf&usg=AFQjCNGLMmzxUzV9wMIFt9aa2bCj6iSDGw&bvm=bv.116636494,d.eWE&cad=rja
Technology, N. I.. The Observer XT reference manual 11.0. Wageningen; Author: 2012.
Dishion et al. Page 15
Prev Sci. Author manuscript; available in PMC 2018 May 02.
Author M
anuscriptA
uthor Manuscript
Author M
anuscriptA
uthor Manuscript
O’Dell S. Training parents in behavior modification: A review. Psychological Bulletin. 1974; 81:418–433. DOI: 10.1037/h0036545 [PubMed: 4607302]
Osgood CE. Studies on the generality of affective meaning systems. American Psychologist. 1962; 17:10–28. DOI: 10.1037/h0045146
Patterson GR. A basis for identifying stimuli which control behaviors in natural settings. Child Development. 1974a; 45:900–911. DOI: 10.2307/1128075 [PubMed: 4143880]
Patterson GR. Interventions for boys with conduct problems: Multiple settings, treatments, and criteria. Journal of Consulting and Clinical Psychology. 1974b; 42:471–481. DOI: 10.1037/h0036731 [PubMed: 4847255]
Patterson, GR. A social learning approach: III Coercive family process. Eugene, OR: Castalia; 1982.
Patterson GR. Performance models for antisocial boys. American Psychologist. 1986; 41:432–444. DOI: 10.1037/0003-066x.41.4.432 [PubMed: 3717751]
Patterson, GR., Moore, DR. Interactive patterns of units of behavior. In: Lamb, ME.Suomi, SJ., Stevenson, GR., editors. Social interaction analysis: Methodological issues. Madison: University of Wisconsin Press; 1979.
Patterson, GR., Reid, JB., Dishion, TJ. Antisocial boys. Eugene: Castalia; 1992.
Pitts SC, West SG, Tein JY. Longitudinal measurement models in evaluation research: Examining stability and change. Evaluation and Program Planning. 1996; 19:333–350.
Ram N, Grimm KJ. Growth mixture modeling: A method for identifying differences in longitudinal change among unobserved groups. International Journal of Behavioral Development. 2009; 33:565–576. DOI: 10.1177/0165025409343765 [PubMed: 23885133]
Ramaswamy V, DeSarbo W, Reibstein D, Robinson W. An empirical pooling approach for estimating marketing mix elasticities with PIMS data. Marketing Science. 1993; 12:103–124. DOI: 10.1287/mksc.12.1.103
Reid, JB. The development of specialized observation systems. In: Reid, JB., editor. A social learning approach to family intervention II Observation in home settings. Eugene: Castalia; 1978. p. 43-49.
Schwarz G. Estimating the dimension of a model. Annals of Statistics. 1978; 6:461–464. DOI: 10.1214/aos/1176344136
Sclove L. Application of model-selection criteria to some problems in multivariate analysis. Psychometrika. 1987; 52:333–343. DOI: 10.1007/bf02294360
Shaw DS, Bell RQ. Developmental theories of parental contributors to antisocial behavior. Journal of Abnormal Child Psychology. 1993; 21:493–518. [PubMed: 8294650]
Shaw DS, Dishion TJ, Supplee L, Gardner F, Arnds K. Randomized trial of a family-centered approach to the prevention of early conduct problems: 2-year effects of the Family Check-Up in early childhood. Journal of Consulting and Clinical Psychology. 2006; 74:1–9. DOI: 10.1037/0022-006x.74.1.1 [PubMed: 16551138]
Sitnick SL, Shaw DS, Gill A, Dishion T, Winter C, Waller R, Gardner F, Wilson M. Parenting and the Family Check-Up: Changes in observed parent–child interaction following early childhood intervention. Journal of Clinical Child and Adolescent Psychology. 2014; 44:970–984. DOI: 10.1080/15374416.2014.940623 [PubMed: 25133754]
Smith JD, Dishion TJ, Shaw DS, Wilson MN, Winter CC, Patterson GR. Coercive family process and early-onset conduct problems from age 2 to school entry. Development and Psychopathology. 2014; 26:917–932. DOI: 10.1017/s0954579414000169 [PubMed: 24690305]
Snyder J, Edwards P, McGraw K, Kilgore K, Holton A. Escalation and reinforcement in mother–child conflict: Social processes associated with the development of physical aggression. Development and Psychopathology. 1994; 6:305–321. DOI: 10.1017/s0954579400004600
Stoolmiller M, Snyder J. Modeling heterogeneity in social interaction processes using multilevel survival analysis. Psychological Methods. 2006; 11:164–177. DOI: 10.1037/1082-989x.11.2.164 [PubMed: 16784336]
Tein JY, Coxe S, Cham H. Statistical power to detect the correct number of classes in latent profile analysis. Structural equation modeling. 2013; 20:640–657. NIHMS359239. DOI: 10.1080/10705511.2013.824781 [PubMed: 24489457]
Webster-Stratton, C., Reid, MJ. The incredible years parents, teachers, and children training series: A multifacted treatment approach for children with conduct problems. In: Weisz, JR., Kazdin, AE.,
Dishion et al. Page 16
Prev Sci. Author manuscript; available in PMC 2018 May 02.
Author M
anuscriptA
uthor Manuscript
Author M
anuscriptA
uthor Manuscript
editors. Evidence-based psychotherapies for children and adolescents. New York: Guilford Press; 2010. p. 194-210.
Weinrott MR, Reid JB, Bauske BW, Brummett B. Supplementing naturalistic observations with observer impressions. Behavioral Assessment. 1981; 3:151–159.
West, S., Finch, J., Curran, P. Structural equation models with nonnormal variables: Problems and remedies. In: Hoyle, RH., editor. Structural equation modeling: Concepts, issues and applications. Thousand Oaks: Sage; 1995. p. 56-75.
Yasui M, Dishion TJ. Direct observation of family management: Validity and reliability as a function of coder ethnicity and training. Behavior Therapy. 2008; 39:336–347. DOI: 10.1016/j.beth.2007.10.001 [PubMed: 19027430]
Dishion et al. Page 17
Prev Sci. Author manuscript; available in PMC 2018 May 02.
Author M
anuscriptA
uthor Manuscript
Author M
anuscriptA
uthor Manuscript
Fig. 1. Space grid of RACS coding. Pos postive engagement, Neu neutral engagement, Dir directive, Neg negative engagement, Ntk no talk, Ign ignore
Dishion et al. Page 18
Prev Sci. Author manuscript; available in PMC 2018 May 02.
Author M
anuscriptA
uthor Manuscript
Author M
anuscriptA
uthor Manuscript
Fig. 2. Micro ratings of parent–child dynamics from age 2 to 5. Note. PCD parent–child dynamics,
DPE dyadic positive engagement, DC dyadic coercion. Standardized path coefficients are
presented here. ***p < .001
Dishion et al. Page 19
Prev Sci. Author manuscript; available in PMC 2018 May 02.
Author M
anuscriptA
uthor Manuscript
Author M
anuscriptA
uthor Manuscript
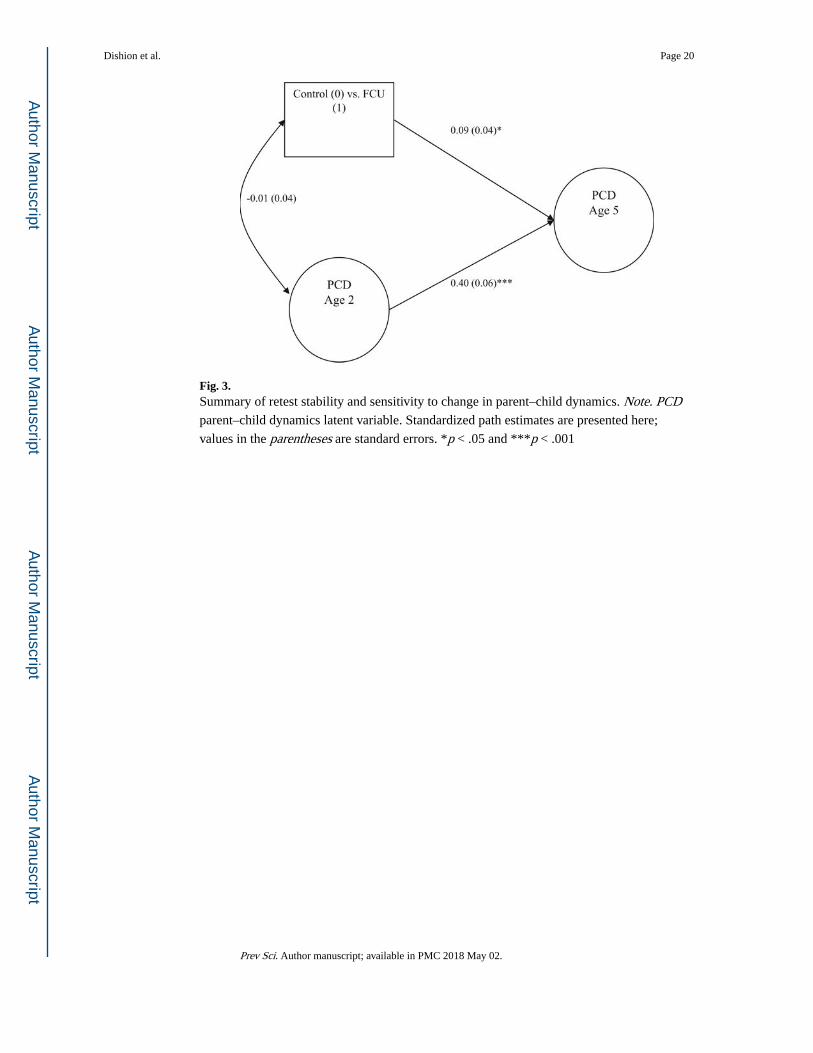
Fig. 3. Summary of retest stability and sensitivity to change in parent–child dynamics. Note. PCD parent–child dynamics latent variable. Standardized path estimates are presented here;
values in the parentheses are standard errors. *p < .05 and ***p < .001
Dishion et al. Page 20
Prev Sci. Author manuscript; available in PMC 2018 May 02.
Author M
anuscriptA
uthor Manuscript
Author M
anuscriptA
uthor Manuscript
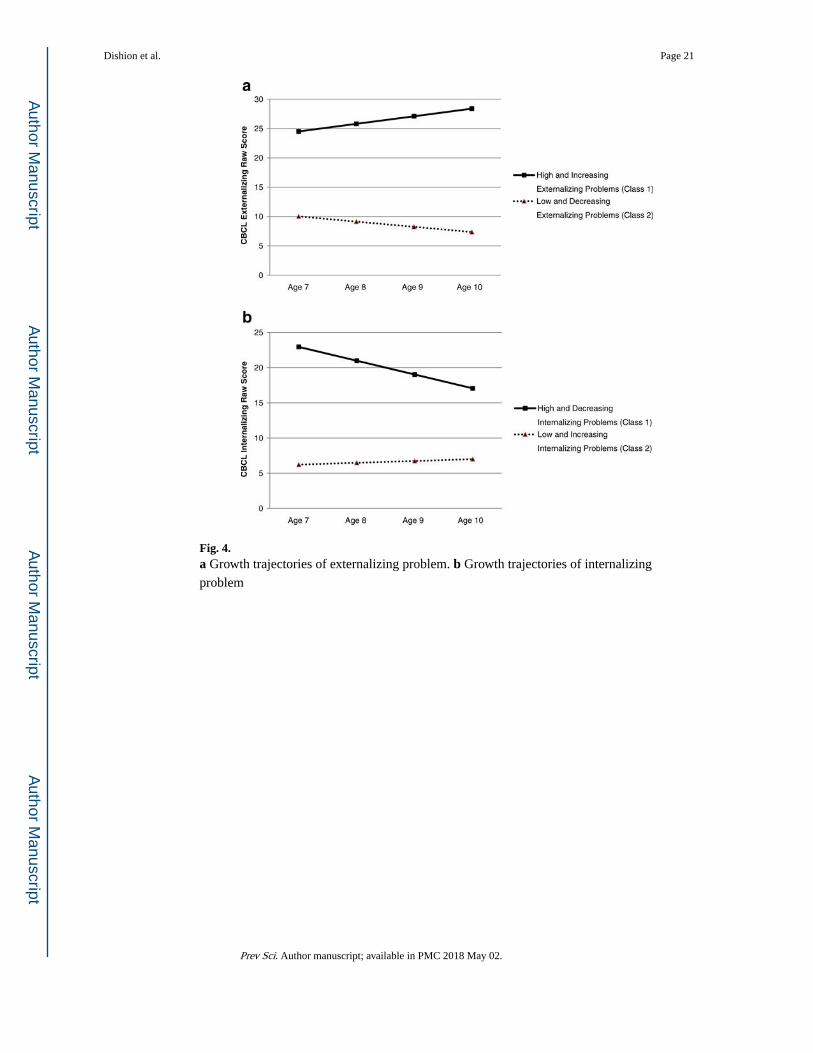
Fig. 4. a Growth trajectories of externalizing problem. b Growth trajectories of internalizing
problem
Dishion et al. Page 21
Prev Sci. Author manuscript; available in PMC 2018 May 02.
Author M
anuscriptA
uthor Manuscript
Author M
anuscriptA
uthor Manuscript
Author M
anuscriptA
uthor Manuscript
Author M
anuscriptA
uthor Manuscript
Dishion et al. Page 22
Table 1
Mean, standard deviations, skewness, and kurtosis of study variables
Study variables M SD Skewness Kurtosis
Dyadic positive engagement age 2 0.33 0.14 0.25 −0.19
Dyadic coercion age 2 0.11 0.08 1.32 1.99
Positive behavior support COIMP age 2 5.91 1.33 −0.29 0.57
Coercive limit setting COIMP age 2 2.88 0.87 0.23 0.15
Dyadic positive engagement age 5 0.37 0.14 0.08 −0.43
Dyadic coercion age 5 0.06 0.05 1.70 4.53
Positive behavior support COIMP age 5 5.24 1.33 0.00 −0.35
Coercive limit setting COIMP age 5 2.57 0.80 0.56 0.57
CBCL externalizing age 7 12.85 9.56 1.09 1.04
CBCL externalizing age 8 10.91 9.35 1.13 1.03
CBCL externalizing age 9 10.71 9.03 1.18 1.46
CBCL externalizing age 10 10.49 9.58 1.41 1.90
CBCL internalizing age 7 8.19 7.04 1.52 2.76
CBCL internalizing age 8 7.82 7.17 1.37 1.79
CBCL internalizing age 9 7.89 7.23 1.64 3.90
CBCL internalizing age 10 7.99 7.34 1.30 1.73
Female (percentage) 49.5 %
European-American (percentage) 46.6 %
African-American (percentage) 27.6 %
Other ethnicities (percentage) 25.8 %
For gender and ethnicity variables, percentages were provided
Prev Sci. Author manuscript; available in PMC 2018 May 02.
Author M
anuscriptA
uthor Manuscript
Author M
anuscriptA
uthor Manuscript
Dishion et al. Page 23
Tab
le 2
Mod
el f
it in
form
atio
n fo
r cl
ass
dete
rmin
atio
n of
ext
erna
lizin
g an
d in
tern
aliz
ing
prob
lem
s G
MM
mod
els
Mod
elB
ICA
djus
ted
BIC
VL
MR
BL
RT
Ent
ropy
Ext
erna
lizin
g pr
oble
ms:
1
Cla
ss14
,838
.350
14,8
09.7
75N
/AN
/AN
/A
2
Cla
ss (
free
mea
n)14
,691
.386
14,6
53.2
87p
= .0
003
p =
.000
00.
880
2
Cla
ss (
free
mea
n, c
ovar
ianc
es)a
14,5
31.4
9714
,483
.873
p =
.000
0p
= .0
000
0.63
8
2
Cla
ss (
free
mea
n, c
ovar
ianc
es, r
esid
uals
)14
,316
.085
14,2
55.7
60p
= .0
000
p =
.000
00.
677
3
Cla
ss (
free
mea
n)a
14,6
33.5
8514
,585
.961
p =
.093
9p
= 1
.000
00.
865
4
Cla
ss (
free
mea
n)a
14,6
10.8
5514
,553
.706
p =
.053
8p
= 1
.000
00.
860
Inte
rnal
izin
g pr
oble
ms:
1
Cla
ss13
,948
.105
13,9
19.5
31N
/AN
/AN
/A
2
Cla
ss (
free
mea
n)13
,806
.057
13,7
67.9
58p
= .0
001
p =
.000
00.
898
2
Cla
ss (
free
mea
n, c
ovar
ianc
es)a
13,6
26.6
9013
,579
.065
p =
.000
2p
= .0
000
0.61
3
2
Cla
ss (
free
mea
n, c
ovar
ianc
es, r
esid
uals
)13
,279
.987
13,2
19.6
63p
= .0
000
p =
.000
00.
736
3
Cla
ss (
free
mea
n)a
13,7
52.7
6513
,705
.141
p =
.078
3p
= 1
.000
00.
879
4
Cla
ss (
free
mea
n)a
13,7
18.6
0513
,661
.456
p =
.131
7p
= 1
.000
00.
867
a Impr
oper
sol
utio
n w
ith n
egat
ive
vari
ance
/res
idua
l var
ianc
e fo
r a
late
nt v
aria
ble
Prev Sci. Author manuscript; available in PMC 2018 May 02.
Author M
anuscriptA
uthor Manuscript
Author M
anuscriptA
uthor Manuscript
Dishion et al. Page 24
Table 3
Parameter estimates for two-class GMM for problem behavior and emotional distress
Problem behavior Emotional distress
Class 1 Class 2 Class 1 Class 2
Class membership
N 87 560 62 585
Proportion 13.5 % 86.6 % 9.6 % 90.4 %
Latent variable means
Intercept mean 24.51 (1.52)*** 10.03 (0.48)*** 22.5 (1.58)*** 6.22 (0.31)***
Slope mean 1.30 (0.77) −0.89 (0.12)*** −1.96 (0.58)** 0.26 (0.10)*
Latent variable covariances
Intercept variance 41.05 (6.75)*** 41.05 (6.75)*** 9.42 (2.66)*** 9.42 (2.66)***
Slope variance 1.24 (0.81) 1.24 (0.81) 0.71 (0.57) 0.71 (0.57)
Intercept-slope variance −5.76 (1.78)** −5.76 (1.78)** 2.66 (1.17)* 2.66 (1.17)*
Values in parentheses are standard errors for each parameter
*p < .05;
**p < .01;
***p < .001
Prev Sci. Author manuscript; available in PMC 2018 May 02.
Author M
anuscriptA
uthor Manuscript
Author M
anuscriptA
uthor Manuscript
Dishion et al. Page 25
Tab
le 4
Log
istic
reg
ress
ion
resu
lts (
pare
nt–c
hild
dyn
amic
s as
a p
redi
ctor
)
Pre
dict
ors
Pro
blem
beh
avio
r cl
ass
Em
otio
nal d
istr
ess
clas
s
(0 =
low
, 1 =
hig
h)(0
= lo
w, 1
= h
igh)
Est
imat
esSE
OR
Est
imat
esSE
OR
Pare
nt–c
hild
dyn
amic
s at
age
5−
5.26
**1.
440.
01−
2.69
1.68
0.07
Gen
der
0.50
*0.
251.
64−
0.07
0.27
0.93
Con
trol
vs.
trea
tmen
t0.
080.
241.
08−
0.03
0.27
0.98
Bla
ck v
s. W
hite
−0.
150.
300.
86−
0.29
0.35
0.75
Min
ority
vs.
Whi
te−
0.33
0.32
0.72
−0.
390.
350.
68
* p <
.05;
**p
< .0
1
Prev Sci. Author manuscript; available in PMC 2018 May 02.

![Lidar validation of SAGE II aerosol measurements after the 1991 … · lidar observations to supplement the SAGE II data. [3] The most extensive SAGE II validation program carried](https://img.pdfslide.us/doc/110x75/5f41798902e99a14dc7fb1ba/lidar-validation-of-sage-ii-aerosol-measurements-after-the-1991-lidar-observations.jpg)