Embed Size (px)
Citation preview
Research Bulletin 789 May 1957
The utilization of APPLE and GRAPE JUICE CONCENTRATES and BlENDS
e H. D. Brown
e Richard Barton
e Melvin A. Van Camp
OHIO AGRICULTURAL EXPERIMENT STATION
Wooster, Ohio
ACKNOWLEDGMENTS
The authors gratefully acknowledge the cooperation of Edward Spiegel of Fischer-Spiegel Inc. of Geneva, Ohio and Mr. Lephart of Harris Mineral Wells Inc. of Worthington, Ohio. The grape concentrate and esters were supplied gratis by Fischer-Spiegel Inc., and the beverages for consumer evaluations were bottled by the employees of Harris Mineral Wells. Both firms also offered valuable suggestions and reviewed the manuscript.
THE UTILIZATION OF APPLE AND GRAPE JUICE CONCENTRATES
AND BLENDS
H. D. BROWN, RICHARD BARTON and MELVIN A. VAN CAMP
The Production Marketing Administration (now Agricultural Stabilization and Conservation Administration) purchased surplus apples in Ohio during 14 of the 18 years from 1933 to 1950. This is in spite of a greatly curtailed production. For example the average production during the 1927-1936 period was 6,905,000 bushels. This had dropped to 5,374,000 bushels during the 1934-1939 period and to 3,875,000 bushels during the 1938-1947 period (2). In 1949 a large share of the 5,446,000 bushel crop was not marketed. Production in 1952 and 1953 was approximately 2,600,000 bushels. In 1954 it was 3,240,000 bushels.
This surplus is due in some measure to the reduced per capita consumption of fresh apples. The per capita consumption dropped from 61.3 pounds in 1909 to less than 21.1 pounds in 195 2 ( 8). A part of this apparent decrease in consumption is due to the fact that after 1934 the data include only apples from commercial areas sold and used in farm households.
Grapes were in surplus supply in Ohio for many years prior to the accelerated production of unfermented grape juice. Since 1938 grape juice has been canned (or bottled) in the United States at an average rate of more than 2,500,000 cases per year. During this interval the manufactured unfermented grape juice pack varied from 1,555,000 cases in 1943 to 5,000,000 cases in 1951, ( 4,500,000 cases in 1953 and in 1954). (7).
Prior to 1938 many vineyards were abandoned. Now new vineyards are being planted and it is anticipated that grapes will be in surplus supply in the near future. The 1951 grape crop for the United States was the largest on record. (3,389,800 tons). (U.S.D.A. AMA data).
In an effort to find new uses for surplus and anticipated surpluses of apples and grapes a cooperative project was started in 1949 between the Ohio Agricultural Experiment Station, Fischer-Spiegel, Inc., at Geneva, Ohio and the Harris Mineral Wells, Inc., at Worthington, Ohio.
3
The primary purpose of this project was to develop natural juice beverages that had con5umer acceptance equal to or better than that accorded synthetic soft drinks. It was hoped that a frmt beverage similar to the slightly carbonated beverages of Europe could be compounded.
The: study consisted of:
1. Taste panel evaluations of sixty-three fruit juice blends including the addition of different amounts of carbonated water at Columbus, Ohio in 194 7 and 1948.
2. Taste panel evaluations of apple and grape concentrates with and without added esters and carbonated water.
3. A consumer evaluation of a carbonated grape juice beverage and a synthetic grape beverage.
Literature Review
Excellent summaries of techniques involved in producing and preserving natural grape and apple juices are given by Tressler and Joslyn ( 7). This publication also includes recent developments in volatile flavor recovery, vacuum concentration and fruit juice beverages. For a recent review of an analysis of foods by sensory differences and for the chemistry of fruit and vegetable flavors the reader is referred to Volume 2 of Advances in Food Research ( 4). For information on flavonoid compounds and the color problems in foods see Volume 5 of the same series of publications.
The research summarized in the foregoing publications indicates in gene-ral that:
1. Esters are an important part of the attribute which imparts desirable flavors to fruits and fruit products. They are easily volatilized by heat and by vacuum. Commercial methods are available for ester recovery and it is now common practice to strip the esters from fruit juices prior to processing. These 100 to 150 fold concentrates of esters are then re-combined with the processed (usually concentrated) juices to impart a portion at least of the original flavor.
4
2. Heat, i.e., temperatures much in excess of 100° F. impart an undesirable cooked taste to some fruit juices. This is especially true of apple and orange juice. Heated grape juice has a flavor which is generally acceptable.
There is some evidence to indicate that localized heating ( i. e., heat exchanger surfaces) is responsible for the cooked flavor. Thus the flavor may be produced even though the over-all temperature of the product remains below a temperature of 100° F.
3. The triangular taste test technique is now commonly used whenever possible. It involves the identification of the two samples in a set of three which are identical as well as an expression by the trained tasters as to which sample or samples they prefer. This technique was used in this research whenever possible.
4. The flavonoids though essential for certain color and flavor characteristics are effective substrates for certain undesirable enzymatic reactions. The presence of these flavonoids in fruit juices makes it imperative in certain instances to inactivate enzymes in order to avoid undesirable changes in color and flavor.
Procedures
Fruit juice blends were evaluated in the laboratories of the Horticultural Products Division, Department of Horticulture, Ohio State University, Columbus, Ohio, in 1947 and 1948. This work preceded the cooperative work with Fischer-Spiegel Inc., and the Harris Mineral Wells Inc.
The following juices were employed in one or more of the 63 combinations:
(a) Jonathan, Stayman, Winesap and Delicious Apple (b) Delaware and Herbert grape (c) Unknown varrety of strawberry (d) Logan (black) and Latham (red) raspberry (e) Montmorency cherry (f) Red Lake currant
Apple and grape concentrates were produced by Fischer-Spiegel, Inc., Geneva, Ohio, with a Buflovak installed vacuum pan and ester recovery systems. Esters were recovered essentially as described by
5
Mtlleville and Eskew ( 3) . A temperature in excess of 120° F. was used to prepare the 1949 concentrate as it was to be used for jelly in which flavors developed by high temperatures were not objectionable. However, the 1950 concentrates were prepared at temperatures of less than 100° F. in order to eliminate cooked flavors. Fischer-Spiegal, Inc found it necessary to install a second steam jet condenser in order to se<-ure these low temperatures.
Peelings were added to whole apples in 1949 to make cider, but whole apples only were used in 1950.
Carbonation of fruit juices was accomplished by dilution with sparkling water (a carbonated water, 60 pounds pressure at 38° F. containing sodium citrate and sodium bicarbonate) in the Horticultural Products Laboratory and by means of Burns Master Fillers at the Harri'> Mineral Wells, Inc. With this filler it is possible to carbonate at pressures of from 15 to 75 pounds.
The carbonated grape juice was made and evaluated during 1955 with grape concentrates made in 1954.
In order to avoid confusion certain details of procedure are listed at the start of some pa1ag1aphs under results.
Results BLENDS
Sixty-three combinations of fruit juices were tried, all of which were considered superior to cider in color. Ten were considered by the members of the ta<;te panels as bemg superior to cider in flavor as well as color. Three were evaluated as extra good.
The most acceptable combination consisted of Delaware grape juice 10 parts; Herbert grape juice 10 parts; Latham red raspberry juice 1 part; sparkling water 24 parts. This sample had a Brix of 9. 7 and an acidity expressed as citric of .34 gms. per 1 00 ml.
Another superior blend consisted of apple cider 1 part (made from 7 parts Jonathan, 2 parts Stayman and 1 part Delicious apples) ; cherry juice 1 part (Montmorency sweetened to 40° Brix) ; and water 2 parts. This combination had a Brix of 10.5 and an acidity of .91.
In general, blends were considered superior to unblended juices. The raspberry color and flavor was especially well liked. However, the apple-currant blend was not acceptable. The flavor of Herbert grape juice was preferred to Delaware grape juice when sparkling water was used in the blends. An unusual amount of sediment formed in both the filtered and unfiltered apple-cherry juice blends.
6

An attempt was made to increa'le acceptability of bland blends by addition of citnc acid. The data in Table 1 show the number of gms. of c1tric acid per 100 mi. in the blend<; before and after the addition of citric acid. Various amounts of citric acid were added to the~e blend&.
TABLE 1.-Acidities of Apple~Strawberry Juice Blends, Used for Taste Panel Evaluations, as Adjusted by Additions of Various
Amounts of Citric Acid
Ratio
Apple Strawberry
14 14 14 65 65 65 9 9 9
1
4 4 4
Bnx Degrees
12 12 12 13 13 13 15 15 15
Gms. citr1c ac1d per 100 mi.
Before After ac1dif1eation acidification
72 .82 72 .89 72 .96 74 83 74 .91 74 .98 75 .85 75 .92 75 99
Preferences were scattered. Some chose the Brix of 12 with a total acidity of . 72; others preferred the blend with a Brix of 13 and a total acidity of .91; still others liked the blend with a Brix of 15 and a total acidity of .99. It appears that the products with the higher acidities were acceptable if the acidity was associated with a rather high sugar content.
The pH values of juices from freshly picked Montmorency cherries, Herbert grapes, Latham red raspberries and strawberry (variety unknown) were all 3.2 (see Table 2.) However, upon the additwn of N/10 NaOH, greatly different pH changes were noted. For example, the addition of 10 mi. of N/10 NaOH to 10 mi. of apple juice produced a pH of 10.4, but for cherry juice the same amount of alkali produced a pH of 5.4. Detailed figures for apple, cherry, grape, raspberry, currant, strawberry, and cranberry juices are given in Table 2. From the data presented it is apparent that currant, cranberry, raspberry, and cherry juices are highly buffered, though apple and grape juices are not highly buffered.
APPLE CONCENTRATES
The apple concentrate made at Geneva in 1949 at a temperature in excess of 120° F. (approximately 130° F.) was diluted to a Brix of 14° F. and tested by a taste panel of forty, on November 30, 1949. The
7
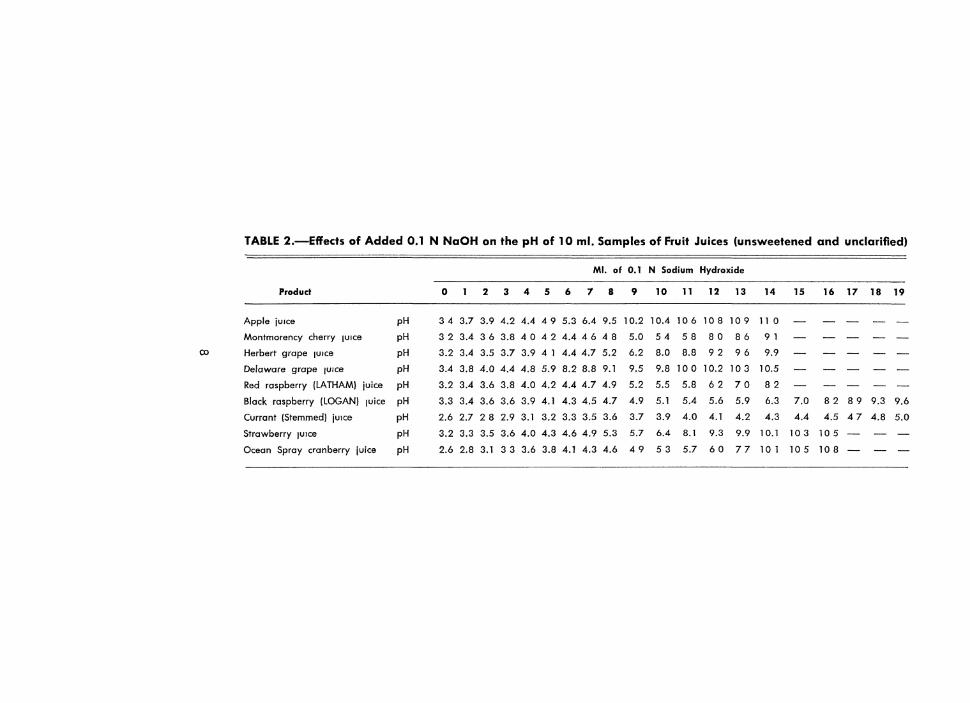
TABLE 2.-Effects of Added 0.1 N NaOH on the pH of 10 mi. Samples of Fruit Juices (unsweetened and uncia rifled)
MI. of 0.1 N Sodium Hydroxide
Product 0 1 2 3 4 5 6 7 8 9 10 11 12 13 14 15 16 17 18 19
Apple ju1ce pH 3 4 3.7 3.9 4.2 4.4 4 9 5.3 6.4 9.5 10.2 10.4 10 6 10 8 10 9 11 0
Montmorency cherry fUice pH 3 2 3.4 3 6 3.8 4 0 4 2 4.4 4 6 4 8 5.0 54 58 80 86 9 1
CX> Herbert grape fUice pH 3.2 3.4 3.5 3.7 3.9 4 1 4.4 4.7 5.2 6.2 8.0 8.8 9 2 96 9.9
Delaware grape jUICe pH 3.4 3.8 4.0 4.4 4.8 5.9 8.2 8.8 9.1 9.5 9.8 10 0 10.2 10 3 10.5
Red raspberry (LATHAM! juice pH 3.2 3.4 3.6 3.8 4.0 4.2 4.4 4.7 4.9 5.2 5.5 5.8 62 70 82
Black raspberry (LOGAN} juice pH 3.3 3.4 3.6 3.6 3. 9 4. J 4.3 4.5 4.7 4.9 5.1 5.4 5.6 5.9 6.3 7.0 82 89 9.3 9.6
Currant (Stemmed) ju1ce pH 2.6 2.7 2 8 2.9 3. J 3.2 3.3 3.5 3.6 3.7 3.9 4.0 4.1 4.2 4.3 4.4 4.5 4 7 4.8 5.0
Strawberry JUice pH 3.2 3.3 3.5 3.6 4.0 4.3 4.6 4.9 5.3 5.7 6.4 8.1 9.3 9.9 10.1 10 3 10 5
Ocean Spray cranberry juice pH 2.6 2.8 3.1 3 3 3.6 3.8 4.1 4.3 4.6 49 53 5.7 60 77 10 1 10 5 10 8
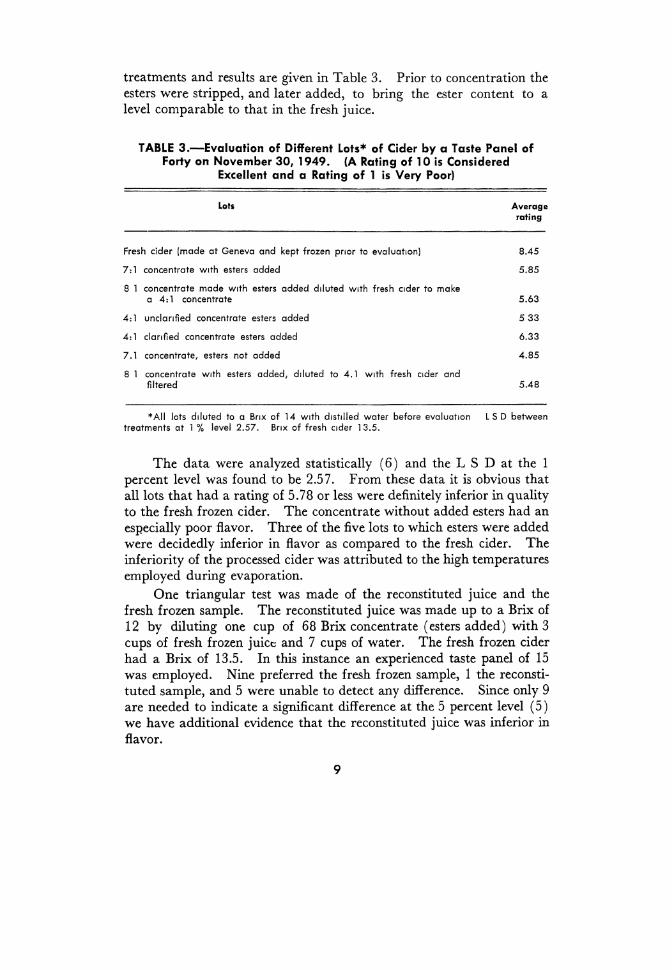
treatments and results are given in Table 3. Prior to concentration the esters were stripped, and later added, to bring the ester content to a level comparable to that in the fresh juice.
TABLE 3.-Evaluation of Different Lots* of Cider by a Taste Panel of Forty on November 30, 1949. (A Rating of 1 0 is Considered
Excellent and a Rating of 1 is Very Poor)
Lots Average rating
Fresh cider (made at Geneva and kept frozen pnor to evaluation) 8.45
7:1 concentrate With esters added 5.85
8 1 concentrate made With esters added diluted With fresh cider to make a 4:1 concentrate 5.63
4:1 unclanfied concentrate esters added 5 33
4:1 clanfied concentrate esters added 6.33
7.1 concentrate, esters not added 4.85
8 1 concentrate With esters added, diluted to 4.1 With fresh Cider and filtered 5.48
*All lots diluted to a Bnx of 14 With distilled water before evaluation l S D between treatments at 1 % level 2.57. Bnx of fresh cider 13.5.
The data were analyzed statistically ( 6) and the L S D at the 1 percent level was found to be 2.5 7. From these data it is obvious that all lots that had a rating of 5.78 or less were definitely inferior in quality to the fresh frozen cider. The concentrate without added esters had an especially poor flavor. Three of the five lots to which esters were added were decidedly inferior in flavor as compared to the fresh cider. The inferiority of the processed cider was attributed to the high temperatures employed during evaporation.
One triangular test was made of the reconstituted juice and the fresh frozen sample. The reconstituted juice was made up to a Brix of 12 by diluting one cup of 68 Brix concentrate (esters added) with 3 cups of fresh frozen juice and 7 cups of water. The fresh frozen cider had a Brix of 13.5. In this instance an experienced taste panel of 15 was employed. Nine preferred the fresh frozen sample, 1 the reconstituted sample, and 5 were unable to detect any difference. Since only 9 are needed to indicate a significant difference at the 5 percent level ( 5) we have additional evidence that the reconstituted juice was inferior in flavor.
9

In order to see how much the Brix affected the evaluations, tests were made on samples in which the reconstituted juice was made to a Brix of 14. This juice was compared to a fresh frozen juice, with a Brix of 13 in a triangular test. In this instance there were 18 experienced member5 in the panel. Of these, 5 favored the recon5tituted cider, 6 preferred the fresh frozen cider, and 7 were unable to detect the difference. Since 10 judgments are needed for a 5 percent degree of significance it can be concluded that the raising of the Brix (largely sweetness) of the diluted concentrate by one degree and the lowering of the fresh frozen juice by one-half degree was sufficient to bring the diluted concentrate up to a flavor which was not readily distinguished from the fresh frozen cider. Th1s tends to confirm the previous observation to the effect that a higher Brix is preferred provided it is accompanied by a correspondingly higher acidity.
A comparison was made between dist1lled water and tap water as the diluting agent. The data are presented in Table 4.
TABLE 4.-0rganoleptic Evaluation of Concentrates Diluted With Distilled Water and Tap Water. All Lots Diluted to
14° Brix. Five in Panel. 1950
Lot No. Treatment Mean values
2
3
4
Fresh frozen c1der
68° Bnx c1der diluted w1th tap water
68° Bnx c1der diluted w1th d1stilled water
68 ° Bnx c1der brought back to 42 ° Bnx w1th fresh c1der diluted w1th tap water
84
7 8
78
74
Obviously there was no difference due to Columbus tap water or distilled water.
In an effort to determine the effect of temperature on the quality of the concentrate an experimental batch was concentrated in the Wooster laboratory at 29.5 inches vacuum to an 8 to 1 concentration. At no time was this cider subjected to a temperature of over 80° F. This concentrate was diluted to 14° Brix and compared to a fresh sample. Three preferred the diluted concentrate, five the fresh and two were unable to distinguish a difference. Since seven would have been needed to indicate a difference at the 5 percent level, it was concluded that the high temperature in the commercial evaporator in Geneva was possibly responsible for the inferior flavor of the diluted concentrate previously tested.
10

Since the concentrate prepared in the laboratory at 29.5 inches vacuum came from filtered juice the diluted samples were lighter in color than the fresh frozen samples. In order to eliminate any possible psychological effect on the judges another triangular test was prepared in which all samples were colored by adding 1 cc. of 80-Ponceau 3 R to each gallon of juice to be tested. In this test 8 out of 11 testers preferred the diluted concentrate at a Brix of 14° over the fresh frozen sample at 14° Brix. One tester preferred the fresh and 2 were unable to detect any difference. Since 8 out of 11 chose the diluted concentrate it must be concluded that in reality the diluted concentrate was preferred to the fresh frozen ( 8 selection:. out of 11 are significant at the 1 percent level) and that the light color of the diluted concentrate was having an adverse psychological effect on the tasters. This confirms the conclusion that apple juice concentrated at a low temperature ( approximately 80° F.), when diluted to an equal B1ix, was as good as the original juice.
Prior to the 1950 season an additional steam jet condemer was installed at the Fi:.cher-Spiegel plant so that concentrate:, could be prepared at temperatures lower than 100° F. Fresh juices prepared in 1950 were inferior to those prepared in 1949. This wa:. due in part to seasonal differences and in part to the use in 1949 of peelings from the apple cause line. As previously indicated the:,e peelings were run through the hammer mill along with whole apples in 1949. In 1950 the apple sauce operations were temporarily discontinued, so the whole apples were used exclusively. The Brix of the fresh cider produced in 1949 was 13° to 14°, though that produced in 1950 was &omewhat less than 12°. The same varieties were used both years. Stayman wa:o. the predominating variety followed in de:.cending order of importance with Rome and Golden Delicious. Small amounts of Greening, Jonathan, Grimes, Mcintosh, and Red Delicious were included both years.
The following lots were organoleptically evaluated with mean scores as shown.
As in the previous tests (see Table 3) a rating of 10 indicates a superior flavor, and 1 a very inferior flavor. The statistical analyses indicated that a difference of 1.37 was necessary in order to have a significant difference between fresh frozen cider and that prepared by diluting concentrates made from unfiltered juices. Though there is a significant difference between the diluted concentrates made from the unfiltered as compared to the filtered concentrates we cannot be sure that this difference is due to flavor alone. It might well be that the differences were due to the psychological reaction to color differences, as previously noted. Differences may also conceivably arise from a lack
1 1
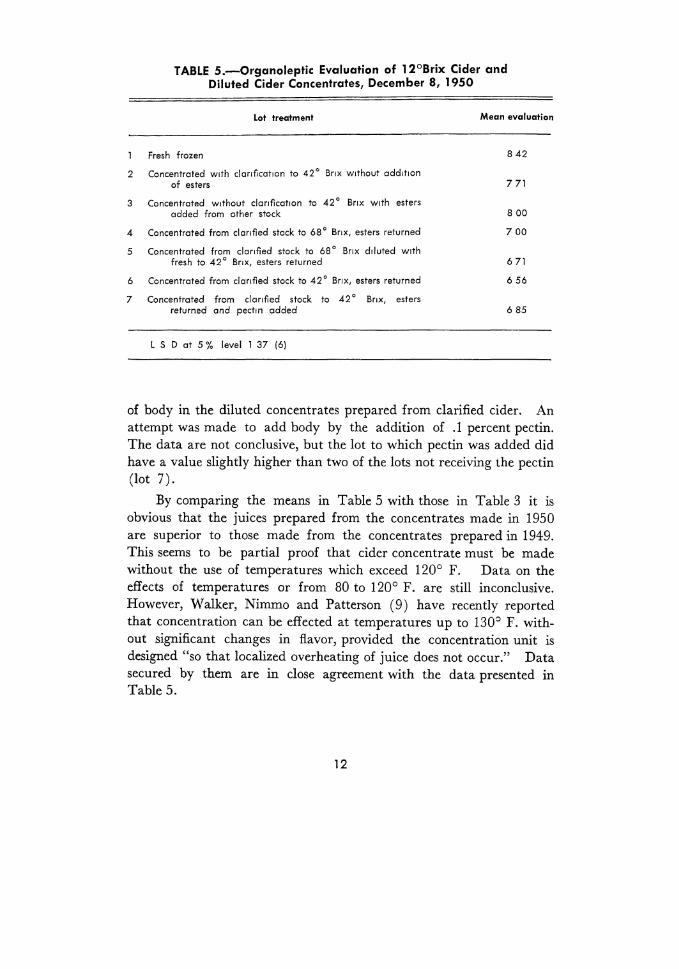
TABLE 5.-0rganoleptic Evaluation of 12°Brix Cider and Diluted Cider Concentrates, December 8, 1950
Lot treatment
Fresh frozen
2 Concentrated With clanfication to 42 ° Bnx Without add ilion of esters
3 Concentrated Without clanfication to 42 ° Bnx With esters added from other stock
4 Concentrated from clan fled stock to 68 ° Bnx, esters returned
5 Concentrated from clan fled stock to 68 ° Bnx diluted with fresh to 42° Bnx, esters returned
6 Concentrated from clan fled stock to 42 ° Bnx, esters returned
7 Concentrated from clanfied stock to 42° Bnx, esters returned and pectm added
L S D at 5% level 1 37 (6}
Mean evaluation
8 42
7 71
8 00
7 00
6 71
6 56
6 85
of body in the diluted concentrates prepared from clarified cider. An attempt was made to add body by the addition of .1 percent pectin. The data are not conclusive, but the lot to which pectin was added did have a value slightly higher than two of the lots not receiving the pectin (lot 7).
By comparing the means in Table 5 with those in Table 3 it is obvious that the juices prepared from the concentrates made in 1950 are superior to those made from the concentrates prepared in 1949. This seems to be partial proof that cider concentrate must be made without the use of temperatures which exceed 120° F. Data on the effects of temperatures or from 80 to 120° F. are still inconclusive. However, Walker, Nimmo and Patterson (9) have recently reported that concentration can be effected at temperatures up to 130':) F. with~ out significant changes in flavor, provided the concentration unit is designed "so that localized overheating of juice does not occur." Data secured by them are in close agreement with the data presented in Table 5.
12

One additional attempt was made to evaluate the effect of body by the addition of pulp to the diluted concentrates as :;hown in Table 6.
TABLE 6.-0rganoleptic Evaluation of a 60° Brix Apple Concentrate Diluted to 12° B With and Without the Addition of
Sample
2
3
4
5
Apple Pulp. Panel of 12 Persons
MI. of concentrate
200
200
200
200
MI. of fresh juice
200
192
184
176
Fresh frozen 1u 1ce
MI. of plup
8
16
24
Ave. evaluation
63
67
62
68
67
There were no significant differences and it can be concluded that the addition of apple pulp at a rate of from 2 to 6 percent did not appreciably affect the flavor.
CARBONATION OF APPLE CIDER CONCENTRATE
The 68° Brix apple concentrate was used at the rate of 2~ oz. in 12 oz. bottles for carbonation tests. This concentration was dec1ded upon after several preliminary tests. Benzoate of soda was added to all carbonated samples as a preservative.
It was extremely difficult to evaluate, organoleptically, samples of cider with different degrees of carbonation. After repeated attempts, a procedure was adopted in which very clean beakers (clean beakers essential to minimize catalytic evolution of bubbles) were cooled to 0° F. in the freezer storage were employed. The carbonated juice, cooled to 32° F. was poured without agitation from the bottles to the beakers and sampled as quickly as possible. Even under those conditions a considerable portion of the carbon dioxide from the highly carbonated samples escaped by bubbling before the samples could be tasted.
A triangular taste test was made between cider carbonated to 15 and to 60 pounds pressure as indicated by the test meter used at the Harris Mineral Wells, Inc. There were 16 in the panel; 7 correctly identified samples 2 and 3 as identical, 4 thought samples 1 and 2 were identical, and 5 thought samples 1 and 3 were identical. Since 10
13
correct identifications of duplicate samples are necessary at the 5 percent level for significance it is obvious that the rate of carbonation of apple juice was very difficult to evaluate. Subsequent tests by smaller groups which had been especially trained for the evaluation of differences in carbonation, gave slightly better identification of duplicate <>amples.
The same panel was asked to give a preference rating. Four favored the slightly carbonated ( 15 lbs.) sample, 2 favored the highly carbonated ( 60 lbs.) samples, and 10 expressed preferences which included both rates of carbonation. Since it was impossible for this panel to distinguish between the slightly and highly carbonated samples, it is not surprising that they did not reach any agreement on a pteference.
An informal questioning revealed that nearly all agteed that the beverage was too filling. This suggested a greated dilution. Such dilutions were tried in preparing the carbonated grape beverages. A little over two years after the apple juice was carbonated the remaining bottles were opened. None had undergone appreciable secondary fermentations although duplicate samples carbonated at 45 pounds pressure had lost all but 2 to 3 pounds pressure.
CARBONATED GRAPE JUICE
Grape juice made from Concord grapes is an accepted beverage. A taste panel was given a triangular test to see if they could detect the difference between a canned sample of grape juice and a reconstituted juice of the same Brix made from the 68° Brix concentrate produced by Fischer-Speigel, Inc. Ten of the 18 members of the panel were unable to detect the difference. Since this figure is significant at the 5 percent level it may be conduded that an acceptable grape juice can be made from the concentrated juice.
Members of another panel tasted some carbonated juice made by adding 1 )12 ounces of 68° Brix concentrate to a 7 -ounce bottle and carbonating as previously described. All carbonations were entirely too acid.
A second lot of concentrate of 68° Brix was mixed with three volumes of 60 Brix syrup. This mixture was used at the rate of 1 )12 ounces per 7-ounce bottle to make carbonated grape juice. This product at all carbonations-15, 30, and 45 pounds was a very acceptable beverage. It was very difficult for the members of the taste panels to distinguish between the different degrees of carbonation for the reasons given previously. The 30-pound carbonation had slightly more votes than the other two. However, the differences were not statistically significant.-
14

Since this drink has definite commercial possibilities, a consumer acceptance test was made.
A 68° Brix grape juice concentrate with esters added was used to make the carbonated beverage for taste panel evaluation. The following proportions were employed:-
Eight gallons 60° Brix sucrose 5yrup plus 345.6 fluid oz. ( 2. 7 gal.) 68° Brix depectinized, detartrated concentrate.
The 68° Brix concentrate was very viscous-nearly a jelly. However, after being agitated with a mechanical mixer the syrup mixture became very homogenous and although much thicker than the synthetic syrup it flowed freely by gravity so that it is felt that each bottle received the predetermined 112 fluid ounces.
Special 7-ounce unlabeled green bottles were used for bottling the fruit juice concentrate beverage and the synthetic grape beverage. After 7 cases had been carbonated the bottles began to break and it wacs necessary to adjust the Burns Master filler. However, after about 40 minutes, operations were resumed and a total of 31 ca5es, i.e., 31 X 24 is 744 ( 7 oz.) bottles of grape juice beverage were carbonated at 30 pounds pressure. Benzoate of soda at the rate of .1% was added as a preservative. A total of 8. 7 gallons ( 1114 fluid ouncec;) of syrup were used for the 744 bottles.
Thus 1114 fluid ounces rather than the calculated 116 fluid ounces were used as the fruit base for 744 bottles of grape juice beverage. This is an almost unbelievable degree of accuracy.
All but one case of this carbonated grape beverage was held for one week in the laboratory at Ohio State University and then transferred to 32° F. storage when some "in-bottle" fermentation was suspected. One case was held at room temperatures which varied from approximately 58° F. to 100° F. for four months. For comparative purposes a similar lot of synthetic grape juice beverage was carbonated at 30 pounds pressure.
The beverages were evaluated by the Columbus consumer panel organized by Dr. W. A. Gould and by a panel consisting of fruit growers and frie-nds that visited the Agricultural Experimental Plots on Orchard Day, August 18, 1955.
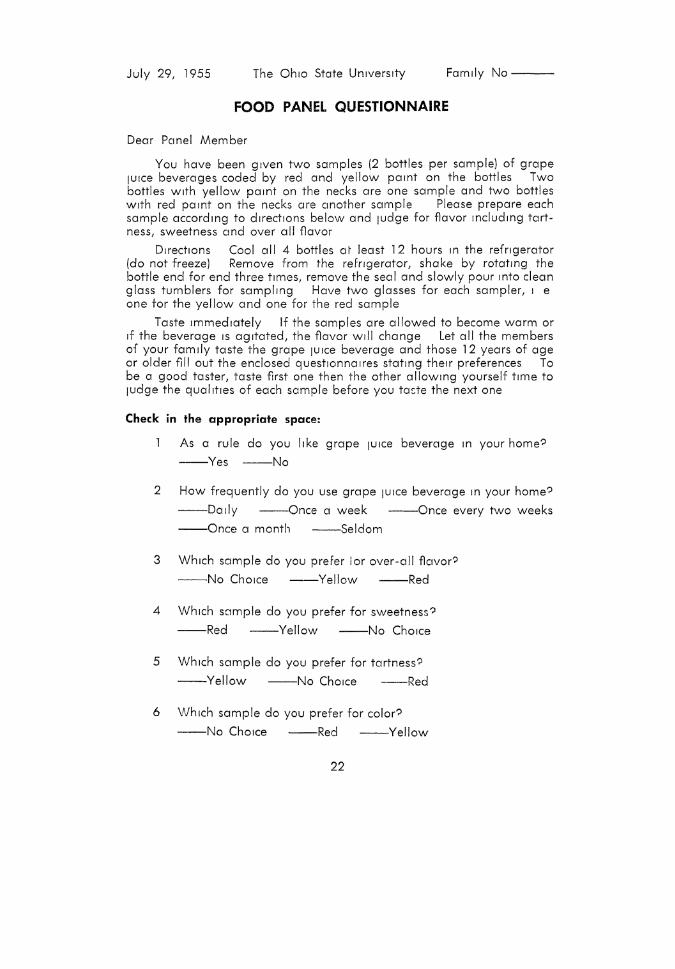
The questionnaire is reproduced in the appendix. The results of the consumer panels are shown in Table 7. For ease in calculations the figure indicating no choice (N.C.)
were disregarded. Chi square formulae (6) were used to determine statistical significance in this instance.
15
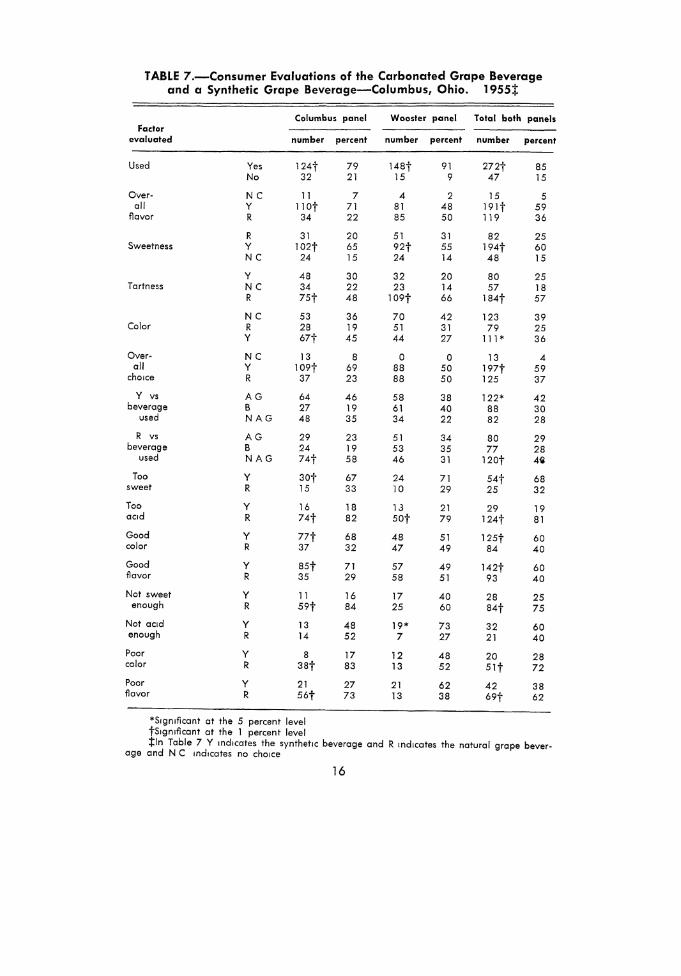
TABLE 7.-Consumer Evaluations of the Carbonated Grape Beverage and a Synthetic Grape Beverage-Columbus, Ohio. 1955:j:
Columbus panel Wooster panel Total both panels Factor
evaluated number percent number percent number percent
Used Yes 124t 79 148t 91 272t 85 No 32 21 15 9 47 15
Over- NC 11 7 4 2 15 5 all y llOt 71 81 48 191t 59
flavor R 34 22 85 50 119 36
R 31 20 51 31 82 25 Sweetness y l02t 65 92t 55 194t 60
NC 24 15 24 14 48 15
y 48 30 32 20 80 25 Tartness NC 34 22 23 14 57 18
R 75t 48 109t 66 184t 57
NC 53 36 70 42 123 39 Color R 28 19 51 31 79 25
y 67t 45 44 27 111 * 36
Over- NC 13 8 0 0 13 4 all y l09t 69 88 50 197t 59
cho1ce R 37 23 88 50 125 37
y vs AG 64 46 58 38 122* 42 beverage B 27 19 61 40 88 30
used NAG 48 35 34 22 82 28
R vs AG 29 23 51 34 80 29 beverage B 24 19 53 35 77 28
used NAG 74t 58 46 31 120t 4<;1
Too y 30t 67 24 71 54t 68 sweet R 15 33 10 29 25 32
Too y 16 18 1.3 21 29 19 ac1d R 74t 82 sot 79 124t 81
Good y 77t 68 48 51 12st 60 color R 37 32 47 49 84 40
Good y sst 71 57 49 142t 60 flavor R 35 29 58 51 93 40 Not sweet y 11 16 17 40 28 25
enough R 59t 84 25 60 B4t 75
Not ac1d y 13 48 19* 73 32 60 enough R 14 52 7 27 21 40
Poor y 8 17 12 48 20 28 color R 38t 83 13 52 Slt 72 Poor y 21 27 21 62 42 38 flavor R 56t 73 13 38 69t 62
*S1gmficant at the 5 percent level ts,gnlflcant at the 1 percent level :j:ln Table 7 Y indicates the synthetic beverage and R md1cates the natural grape bever-
age and N C indicates no cho1ce
16

The data clearly show: 1. That the Wooster panel differed somewhat from the Columbus panel. Possible reasons for this difference will be discussed later; 2. There was general agreement by both panels that, a) the sweetness of the synthetic (yellow) beverage was preferred, and b) that the grape beverage (red) was decidedly more tart and that excess tartne&s wa& undesirable.
The combined figures (last two columns to right) indicate the following over-all preferences: 1. The synthetic beverage (yellow) was preferred because of better flavor, &weeter taste, and better color; 2. The natural grape beverage was not sweet enough, and too acid; 3. The synthetic beverage was too sweet.
Of added interest is the fact that the ~>ynthetic beverage was considered better than the grape beverage commonly used (significant at the 5 percent level) , though the natural beverage was not as good as that commonly used. It is also of interest to note that 85 percent of all participants used grape juice or synthetic grape beverages.
Data not included in the table indicate that 10 percent of the panel used these beverages daily, 15 percent weekly, 23 percent every two weeks, and 24 percent used grape beverages once per month. Twentyeight percent used them but seldom.
EFFERVESCENCE AND ACCEPT ABILITY OF PRODUCT
As the samples were evaluated by the student taste panels it was noted that the natural beverage efferve1lced more than the synthetic beverage. Since the carbonation was identical in both cases, i. e., 30 pounds, this effervescence was thought by some to be due to "in-bottle" fermentation. In Table 8 data are presented to indicate the total pressure at 40° F. and the refract1ve indices of the natural and synthetic beverage held in the refrigerator as compared to the natural beverage held in a garage in Worthington, Ohio at summer temperatures (45-105° F.) from July 28, 1955 to November 30, 1955.
The data clearly indicate that the pressure increased ( 18.7 pounds to 50.5 pounds) in the samples held four months at summer temperatures. At the same time a portion of the sugars disappeared as indicated by an average reduction of specific gravity from 11.1 to 10.0. Had the pressures been taken at room temperature these differences would have been greater. However, the readings were made at 40° F. to eliminate possible explosions. The differences between the specific gravities for the refrigerated synthetic ( 10.8) and natural grape samples ( 11.1 ) are not significant.
17
It i:;, doubtful if the small differences in pressure, i.e., 15.6 pounds for the synthetic, and 18.7 pounds for the natural grape beverage could account for the difference in effervescence. It is believed, though no evidence i:;, presented, that the excessive effervescence of the natural beverage is due to the catalytic action of the grape colloids.
Four members of a trained taste panel preferred the synthetic beverage, three preferred the grape juice beverage held in cold :;,torage, and none preferred the "in-bottle" fermented juice. This indicates a dislike to "in-bottle" carbonation of this type.
It should be noted that the excessive bubbling was held to a minimum during the Wooster sampling by cooling all samples in tubs of ice and ice water. The average temperature of the samples at Wooster was thus under 40° F., whereas it was doubtless higher for the samples evaluated by the Columbus tasters who held the samples in refrigerators above freezing prior to sampling. This may account in part for the differences in the evaluations secured from these two panel:;,. As can be noted from Table 7, the Wooster panel members were equally divided in their over-all choice, i.e., 88 favored the synthetic beverage and 88 favored the grape beverage. This is in striking contrast to the preferences indicated by the Columbus panel, where 69 percent favored the synthetic beverage.
It is of course possible that other factors entered into these evaluations. It is pure speculation but it is conceivable that the Wooster samplers, consisting largely of fruit growers, were more familiar with the aroma and taste of the natural grape product, while the Columbus tasters had become educated through usage to accept the synthetic beverage.
DISCUSSION
The research reported herein was started largely to see if a fruit juice beverage could be compounded which might eventually gain an acceptance similar to that accorded the slightly carbonated, sweetened fruit juice blends which are so widely accepted in some European countries (one author's observation.) To compete economically with synthetic beverages it was obvious from the start that the fruit juice base would have to be supplemented either with a rather cheap and abundant source of fruit juice, or by a sweetened sucrose or similar base syrup.
18
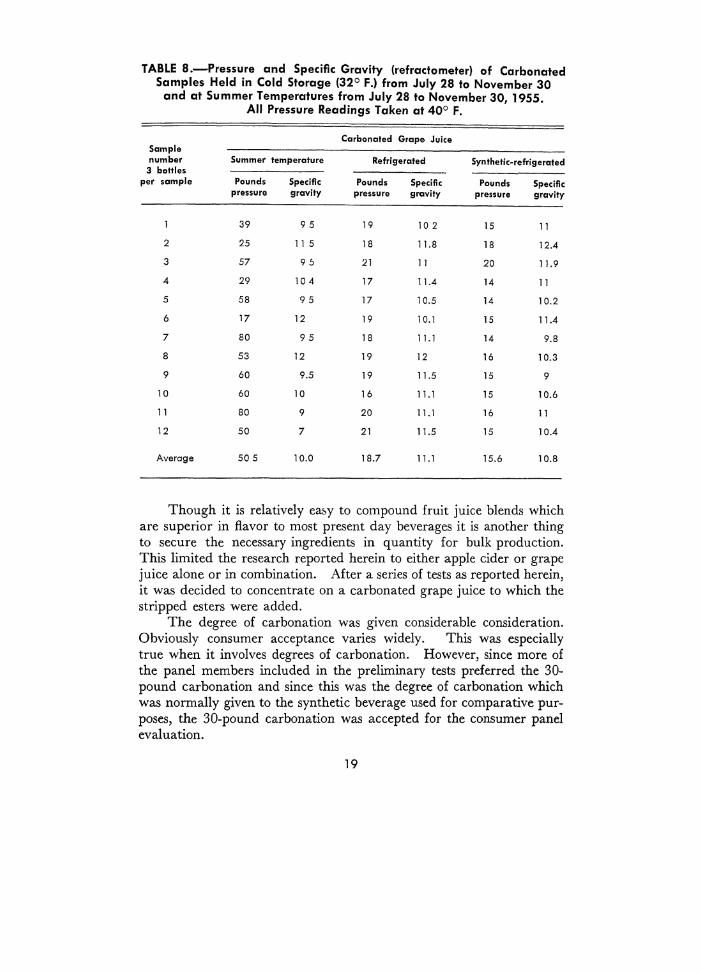
TABLE B.-Pressure and Specific Gravity (refractometer) of Carbonated Samples Held in Cold Storage (32° F.) from July 28 to November 30
and at Summer Temperatures from July 28 to November 30, 1955. All Pressure Readings Taken at 40° F.
Carbonated Grape Juice Sample number Summer temperature Refrigerated Synthetic-refrigerated
3 bottles per sample Pounds Specific Pounds Specific Pounds Specific
pressuro gravity pressure gravity pressure gravity
39 95 19 10 2 15 11
2 25 11 5 18 1 1.8 18 12.4
3 57 95 21 11 20 11.9
4 29 10 4 17 11.4 14 11
5 58 9 5 17 10.5 14 10.2
6 17 12 19 10.1 15 11.4
7 80 95 18 1 1.1 14 9.8
8 53 12 19 12 16 10.3
9 60 9.5 19 11.5 15 9
10 60 10 16 11.1 15 10.6
11 80 9 20 11.1 16 11
12 50 7 21 11.5 15 10.4
Average 50 5 10.0 18.7 11.1 15.6 10.8
Though it is relatively ea~y to compound fruit juice blends which are superior in flavor to most present day beverages it is another thing to secure the necessary ingredients in quantity for bulk production. This limited the research reported herein to either apple cider or grape juice alone or in combination. After a series of tests as reported herein, it was decided to concentrate on a carbonated grape juice to which the stripped esters were added.
The degree of carbonation was given considerable consideration. Obviously consumer acceptance varies widely. This was especially true when it involves degrees of carbonation. However, since more of the panel members included in the preliminary tests preferred the 30-pound carbonation and since this was the degree of carbonation which was normally given to the synthetic beverage used for comparative purposes, the 30-pound carbonation was accepted for the consumer panel evaluation.
19

The results of the panel evaluations indicate a preference for the synthetic beverage over the carbonate grape juice. It is not altogether surprising that the natural fruit juice base did not meet up to expectations. New product development is an extremely fascinating endeavor. In spite of the best of plans the chances of marked success are limited. The mere fact that success was not achieved in this instance does not mean that it is impossible to compound a natural grape juice beverage which would achieve wide consumer acceptance. It is still more likely that a blend of juices would stand a still better chance of meeting consumer acceptance. The red raspberry grape juice combination reported herein or a red raspberry apple juice combination used so widely in Holland are still distinct possibilities. However, since the red raspberry is not an important commercial crop in Ohio it was not felt that this juice should be included in the consumer evaluation.
Though ester recovery is now a well established procedure some newer techniques ( 7) discovered since the installation of the equipment by Fischer-Spiegel Inc., make it possible to capture more of this essential taste principle. It is even possible that a grape fruit base with more of the esters recaptured would change the results of the tests reported herein.
Furthermore, more research should be devoted to an evaluation of the consumer acceptance of beverages of different Brix/ acid ratios. Though the data indicates a wide variation in panel acceptability of beverages according to their Brix and acidity it surely would be possible to discover a Brix/ acid ratio which would be acceptable to a large percentage of consumers. The data in this paper indicate that the acidity of the grape beverage was too high. Some means of reducing this acidity should be investigated.
Finally, it is possible that the newer dehydro·freeze techniques reviewed by Tressler and Joslyn ( 7) would provide an even better method for producing a base for carbonated or non-carbonated fruit juice beverages. The possibilities in this field were indicated by Barton ( 1) in 1951 when he made a superior grape juice dessert from freeze dried grape juice.
SUMMARY
Sixty-three combinations of fruit juices were compounded which were considered superior to cider in color. Ten were considered superior to cider in both flavor and color.
Especially flavorful juice combinations included (a) a red raspberry-grape combination, (b) an apple-cherry combination and (c) an apple-cherry-strawberry combination.
20
A carbonated grape juice base with esters added was considered too acid by the consumer taste panels.
Although no entirely satisfactory beverage wa~ produced the data indicate possible future research which might yield a product of which would be accorded wider consumer acceptance.
Although benzoate of soda at the rate of .1 percent was added to the carbonated grape juice beverage the pressure of gases increased from an average of 18.7 pounds to 50.5 pounds (measured at temperature of 40° F.) after four months storage at summer temperatures. After this secondary fermentation four members of a trained ta~te panel of seven favored the synthetic, three favored the refrigerated nonfermented grape beverage and none found the "in-qottle" fermented product. Obviously some method of preventing this secondary fermentation would be essential for the success of any program involving the sale of carbonated natural fruit juice beverages.
LITERATURE CITED
1. Barton, R. R. Dehydrated grape juice makes a satisfactory gelatine desser1. Oh1o Farm and Home Res. Vol. 36, No. 272. 1951.
2. Cravens, M. E. and Bere, R. I. Trends in the Ohio apple industry. Oh1o Agr. Exp. Sta. Res. Bul. 756. 1955.
3. Mdleville, Howard Paul and Eskew, Roderick K. Recovery and utilization of natural apple flavors. AIC-63, Sept. 1944.
4. Mark, E. M. and Stewart, George F. Advances in food research. Vol. 2, 1949 and Vol. 4, 1954. Academic Press Inc.
5. Roessler, E. B., Warren, J., and Guymon, J. F. Significance in triangular taste tests. Food Res. Vol. 13, 503-505, 1948.
6. Snedecor, George W. Statistical methods. The Iowa State College Press 4th Ed. 1955.
7. Tressler, Donald K. and Joslyn, Maynard A. The chemistry and tech-nology of fruit and vegetable juice production. Av1. Pub. Co. 1954.
8. United States Dept. of Agr. BAE Handbook #62-Consumption of food 1n the Un1ted States, 1953.
9. Walker, L. H., Nimmo, C. C., and Patterson, D. C. Preparation of frozen apple juice concentrate. Food Tech. Vol. 5, 148-151, 1951.
21
July 29, 1955 The Oh1o State Un1vers1ty Family No---
FOOD PANEL QUESTIONNAIRE
Dear Panel Member
You have been g1ven two samples (2 bottles per sample) of grape JUICe beverages coded by red and yellow pamt on the bottles Two bottles w1th yellow pamt on the necks are one sample and two bottles w1th red pamt on the necks are cmother sample Please prepare each sample accordmg to d1rect1ons below and judge for flavor mcludmg tartness, sweetness ctnd over all flavor
D1rect1ons Cool all 4 bottles at leost 12 hours m the refngerator (do not freeze) Remove from the refngerator, shake by rotatmg the bottle end for end three t1mes, remove the seal and slowly pour mto clean glass tumblers for samplmg Have two glasses for each sampler, 1 e one for the yellow and one for the red sample
Taste 1mmed1ately If the samples are allowed to become warm or 1f the beverage 1s ag1tated, the flavor will change Let all the members of your family taste the grape JUice beverage and those 12 years of age or older fill out the enclosed quest1onna1res statmg the1r preferences To be a good taster, taste first one then the other a llowmg yourself t1me to judge the qual1t1es of each sample before you taste the next one
Check in the appropriate space:
As a rule do you like grape JUice beverage m your home?
--Yes --No
2 How frequently do you use grape JUice beverage m your home?
--Daily --Once a week --Once every two weeks
--Once a month --Seldom
3 Wh1ch sample do you prefer lor over-all flavor?
--No Cho1ce --Yellow --Red
4 Wh1ch sample do you prefer for sweetness?
--Red --Yellow --No Cho1ce
5 Wh1ch sample do you prefer for tartness?
---Yellow --No Cho1ce --Red
6 Wh1ch sample do you prefer for color?
--No Cho1ce --Red --Yellow
22
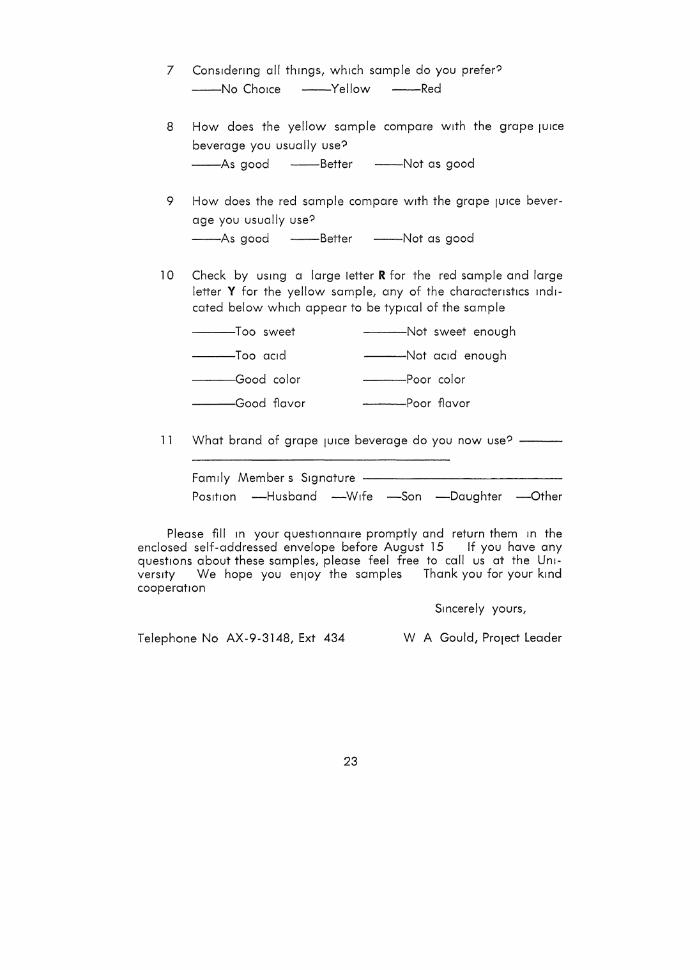
7 Cons1denng all thmgs, wh1ch sample do you prefer?
--No Cho1ce --Yellow --Red
8 How does the yellow sample compare w1th the grape 1u1ce
beverage you usually use?
--As good --Better --Not as good
9 How does the red sample compare w1th the grape 1u1ce bever
oge you usually use?
--As good --Better --Not as good
1 0 Check by usmg a large letter R for the red sample and large letter Y for the yellow sample, any of the charactenst1cs Indicated below wh1ch appear to be typ1cal of the sample
---Too sweet ---Not sweet enough
---Too ac1d ---Not ac1d enough
---'Good color ---Poor color
---'Good fiavor ---Poor fiavor
11 What brand of grape 1u1ce beverage do you now use? ---
Family Members S1gnature
Pos1t1on -Husband -W1fe -Son -Daughter -Other
Please fill m your quest1onna1re promptly and return them m the enclosed self-addressed envelope before August 15 If you have any quest1ons about these samples, please feel free to call us at the Un1-vers1ty We hope you en1oy the samples Thank you for your kmd cooperation
Smcerely yours,
Telephone No AX-9-3148, Ext 434 W A Gould, Pro1ect Leader
23