Embed Size (px)
Citation preview
The Use of Molecular Scatology to Study
River Otter (Lontra canadensis) Genetics
By
Barbara McElwee
A Thesis Submitted to the Faculty
of the
ROCHESTER INSTITUTE OF TECHNOLOGY
In partial fulfillment of the requirements for the
Bachelors of Science / Masters of Science
of
Environmental Science in the College of Science
By
___________________________________
April 24, 2008
Approved: ______________________________________________ Professor Lei Lani Stelle ______________________________________________ Professor Larry Buckley ______________________________________________ David Hamilton

i
Table of Contents Acknowledgements…………………………………………………………… i Abstract……………………………………………………………………….. vii Introduction............................................................................................. 1 River Otter Basic Biology................................................................ 1 Management................................................................................... 3 Scatology and Alternatives............................................................. 5 My Project....................................................................................... 7 Implications..................................................................................... 8 References...................................................................................... 10 Chapter 1: Methodology.......................................................................... 13 Introduction...................................................................................... 13 Methods and Materials.................................................................... 13 Collection Process ............................................................... 13 Extraction of DNA................................................................. 14 Proteinase K.............................................................. 14 Guanidine Thiocyanate.............................................. 15 QIAGEN Mini Stool Kit............................................... 16 QIAGEN Mini Stool Kit Modified Procedure............... 18 Results............................................................................................ 18 Discussion....................................................................................... 19 References...................................................................................... 22 Appendix......................................................................................... 23 Chapter 2: Mitochondrial DNA................................................................ 26 Introduction...................................................................................... 26 Methods and Materials.................................................................... 27 Results............................................................................................ 29 Discussion....................................................................................... 30 References...................................................................................... 35 Appendix......................................................................................... 36 Chapter 3: Microsatellite DNA................................................................ 37 Introduction..................................................................................... 37 Methods and Materials.................................................................... 38 Results............................................................................................ 39 Discussion....................................................................................... 42 References...................................................................................... 48 Appendix......................................................................................... 50

ii
Acknowledgements
I would like to thank my advisor Dr. Lei Lani Stelle for providing me with
this opportunity and guiding me through this process. I would also like to thank
the rest of my committee Dr. Larry Buckley and David Hamilton for their advice
on genetics and river otters. I would like to thank Dr. George Kollias from Cornell
University for providing the otter tissues samples as positive controls. I would like
to thank the RIT river otter lab for collecting lots of scat (although not all of it river
otter). I would like to thank Shelly Morgan for assisting me in the lab and
providing the raccoon tissue samples. I would like to thank the Seneca Park Zoo
for providing us with fresh river otter scat and hours of enjoyment watching the
river otters play. I would like to thank RIT College of Science, the Undergraduate
Research Fellowship, and the Research Scholars Program for providing support.
I would like to thank my family and friends, in particular Lars for their support and
forcing me to get this completed.

iii
List of Tables and Figures
Chapter1:
Figure 1………………………………………………………………………….. 23 Map of Genesee study area in Monroe County, New York. Maroon line represents the Genesee River, red line represents Oatka Creek, yellow line represents Black Creek, and pink line represents Honeoye Creek. Green and yellow stars represent locations where we have collected scat and located potential otter latrine sites.
Figure 2………………………………………………………………………….. 24
Within the red circles are the general locations where scat was collected in the Thousand Islands, NY. The lower left hand circle is around the Picton Island. The upper right hand circle is around some ponds and swamps that were created due to beaver dams. Both are locations where river otters have been observed by the RIT river otter group.
Figure 3………………………………………………………………………….. 25
The red circles are the general locations where scat was collected from Rivers Inlet, British Columbia, Canada. The locations are places where otters were observed and known to frequent. Two of the locations are ports for fishermen – Duncanby Landing and Goose Bay.
Chapter 2:
Table 1…………………………………………………………………………… 30 Summary of species sequenced and the percentage of that species sequenced compared to the total number of samples sequenced (scat only – otter and raccoon tissue samples not included).
Table 2…………………………………………………………………………… 36 Table of successfully sequenced samples, including sample number, date collected, location collected, and species identification (based on BLAST). *Note: scat samples sequenced as a species of fish are most likely from an otter.
iv
Chapter 3:
Table 1…………………………………………………………………………… 38 Raccoon and Otter sample data: includes the sample name, where it was collected from and date (when available) when collected.
Table 2…………………………………………………………………………… 43 Microsatellite effectiveness of primers RIO 11- RIO 20 on river otters (Lontra canadensis) and raccoons (Procyon lotor).
Table 3…………………………………………………………………………… 45 From Beheler et al. (2005), “Number of alleles found within appropriate size during cross-amplificaiton of 10 North American river otter microsatellite loci in five species of Mustelidae…Primers were not optimized for species other than Lontra Canadensis.”
Figure 1…………………………………………………………………………… 50
Image of primer RIO 11 gel. In each lane is a sample with the RIO 11 microsatellite primers used (when reading from left to right) – in lane 1) otter tissue, 2) otter scat, 3) otter scat, 4) raccoon scat, 5) raccoon scat, 6) raccoon scat, 7) negative control, 8) nothing, 9) ladder, and 10) ladder. As you can see the fragment sizes appear to be the same size, and when sequenced we indeed the same fragment.
Figure 2…………………………………………………………………………… 51
Image of RIO 12 gel. When reading from left to right in the first four lanes there are samples with the RIO 12 microsatellite primers used. They read as follows: 1) raccoon scat, 2) raccoon scat, and 3) otter scat. The farthest lane to the right is the ladder. As you can see the three samples have amplified at the same fragment size, although I was not able to sequence the amplified samples, it is possible that the fragments are from the same microsatellite region.
Figure 3…………………………………………………………………………… 52
Image of RIO 13 gel. From right to left the lanes with microsatellite primer RIO 13 read as follows: 1) ladder, 6) otter tissue, 7) otter scat, 8) raccoon scat. This is not the best example, with the raccoon scat sample having multiple bands, but the sequences were the same, and one of the bands is almost exactly lined up with the otter samples.
v
Figure 4…………………………………………………………………………… 53 Image of RIO 14 gel. From right to left the lanes all contain samples with the microsatellite primer RIO 14; they read as follows: 1) nothing, 2) nothing, 3) otter tissue, 4) otter scat, 5) otter scat, well 6) raccoon scat, 7) raccoon scat, 8) raccoon scat, 9) negative control, 10) ladder. As you can see the fragments appear to be the same size, although I was not able to sequence the samples, it is possible that they are from the same microsatellite region.
Figure 5…………………………………………………………………………… 54
Image of primer RIO 15 gel. When reading from left to right, the first four lanes are with primer RIO 14, the fifth lane contains the ladder, and to the left of the ladder are four samples with RIO 15 that read as follows: 6) river otter tissue, 7) river otter scat, 8) raccoon scat, 9) unrelated sample. As you can see the fragments are approximately the same length, with some multi banding, but that agrees with the sequences, that RIO 15 works with raccoons as well as otters.
Figure 6…………………………………………………………………………… 55
Image of RIO 16 gel. All the lanes utilize microsatellite primer RIO 16. When readings from left to right the lanes are as follows: 1) nothing, 2) otter tissue, 3) otter scat, 4) otter scat, 5) ladder, 6) raccoon scat, 7) raccoon scat, 8) raccoon scat, 9) negative control, 10) nothing. As you can see the raccoon samples are not the same sizes as the otter samples, which makes it seem that the amplified fragments were not the same. I was unable to sequence the raccoon samples so it can not be said for sure.
Figure 7…………………………………………………………………………… 56
Image of primer RIO 17 gel. From right to left lane 1: ladder, lane 2: RIO 17 with otter tissue, lane 3: RIO 17 with otter scat, lane 4: RIO 17 with raccoon scat. Although the gel makes it appear that the microsatellites would be the same, when sequenced they were different. Instead, it was a microsatellite that was the same as the Eurasian badger (Meles meles).
Figure 8…………………………………………………………………………… 57
Image of RIO 18 gel. When reading from left to right the first 6 lanes are samples with the primer RIO 16. The starting at lane 7, the samples have RIO 18 and are as follows: 7) raccoon scat, 8) raccoon scat, 9) raccoon scat, 10) otter scat, 11) negative control, 12) ladder. Even though the fragments seem like they would be the same, when sequenced they are not the same microsatellite.
Figure 9…………………………………………………………………………… 58
Image of RIO 19 gel. When reading from left to right the lanes all contain samples with the following. In lane: 1) nothing, 2) otter tissue, 3) otter scat, 4) otter scat, 5) raccoon scat, 6) raccoon scat, 7) raccoon scat, 8) negative control, 9) ladder 10) nothing. As you can see the fragments all appear to be the same based on size. When sequenced they were indeed the same microsatellite region.

vi
Figure 10…………………………………………………………………………… 59
Image of RIO 20 gel. When reading from right to left the lanes with samples containing the RIO 20 are as follows: 1) otter tissue, 2) otter scat, 3) otter scat, 4) raccoon scat, 5) raccoon scat, 6) raccoon scat, 7) negative control, 8) nothing, 9) nothing, 10) ladder. Although the raccoon sample in lane 6 is considerably larger than the raccoon sample in lane 4), displaying somewhat inconclusive results, the fragments, when sequenced are from the same microsatellite.

vii
Abstract
North American river otters (Lontra canadensis) were extirpated throughout all of Western New York due to habitat loss, pollution, and trapping. Between 1995 and 2000, 279 river otters were released throughout Western New York, 31 of which were released in the Genesee river watershed. Since their release there have been no follow-up studies on the river otters until the RIT River Otter Lab was formed in 2004. Researchers surveyed three local creeks to record data on toilet site locations and collect otter feces in order to perform dietary and genetic analyses. Through the use of molecular scatology I extracted DNA from feces in order to determine the amount of genetic diversity of the reintroduced river otter population. I also utilized otter scat samples from British Columbia and the Thousand Islands. Using a QIAGEN QIAamp Stool Mini Kit I attempted to extract mitochondrial cytochrome b DNA from 177 samples, roughly 16% of which were successfully amplified and sequenced. From the sequenced scat samples I identified two otter, 14 raccoon, one beaver, one coyote, and three fish: common carp, golden redhorse, and shorthead redhorse from the Genesee watershed. I have also sequenced one sample as otter and one sample as pink salmon from British Columbia and five samples as bullhead catfish from the Thousand Islands. It is believed that the samples that were sequenced as fish were likely from otters. I then utilized microsatellites, and I included a raccoon sample as well. To my surprise the raccoon sample worked with the river otter microsatellite primer, despite a 25% divergence between the two species’ cytochrome b sequences. I determined that out of ten river otter microsatellite primers: three river otter primers do not work with raccoons, five primers produced identical or nearly identical sequence, and two primers need more research to determine if they work with raccoons. These results stress the importance of confirming species identification from fecal samples using mitochondrial DNA prior to the use of microsatellites to avoid misleading results.
1
Introduction River Otter Basic Biology
North American river otters (Lontra canadensis) can be found throughout most of
the United States, Canada, and Alaska, excluding the Southwest United States
(Whitaker, 2002). River otters prefer to live along rivers, ponds, and lakes in wooded
areas (Whitaker, 2002), although they have been observed in urbanized areas such as
golf courses (Mech, 2002). They generally utilize dens burrowed into the bank, creating
both above and below water entrances, but will also inhabit root overhangs, hollow logs,
burrows of other animals, or beaver lodges which are often used for multiple years
(Whitaker and Hamilton, 1998; Whitaker, 2002). River otters have been known to travel
long distances over land during the winter to areas where the water does not freeze
over for better feeding areas (Whitaker and Hamilton, 1998).
River otters are opportunistic feeders, preying on fish, crayfish, frogs, and aquatic
insects (Knudsen and Hale, 1968, Hamilton, 1961). River otters are frequently blamed
for declining populations of sport fish although otters are not commonly known to eat
sports fish (Knudsen and Hale, 1968). They appear to prefer slower moving fish and fish
that swim in schools that are easier to catch (Whitaker, 2002). Although in a recent
captive study it was discovered that otters prefer trout, a faster moving sport fish, to
sunfish, a slower fish, because of greater energetic gains (Schreck, 2007). Plants such
as blueberries and rose hips have also been recorded in otter diets (Whitaker and
Hamilton, 1998); however I am skeptical of these statements, because there was no
mention of how the feces were confirmed as otter. In addition, scientists performing
dietary analyses from in both otter stomach content studies and scatology studies, have

2
only found grass, wood splinters and other similar vegetation in the stomach of river
otters during their studies, and it was believed that due to the low quantity the ingestion
of the litter was incidental (Knudsen 1968; Manning 1990; Taylor 2003).
River otters are most active during dawn and dusk (Whitaker and Hamilton,
1998). It appears that river otters are most social when there is an abundance of food,
such as schools of fish, and will work cooperatively in order to obtain more food that
may have a higher amount of energy (Blundell, 2002). Cooperative foraging has also
been observed between mothers and pups; to train the pups how to hunt (Serfass,
1995). There is also evidence that when food is not abundant, river otters tend to be
more solitary (Ben-David et al., 2005). Although otters may be social when foraging,
during the breeding season they tend to become independent and will compete for
territories and mates (Whitaker, 2002). During the summer, adult male river otters have
larger home ranges than female river otters and territories overlap while during winter,
male otter territories shrink and overlap less with female river otters in Alberta, Canada
(Reid et al 1994). Spinola (2003) found that once river otters were released during a
reintroduction project, they spread a mean of 21.1 km. There was a difference in the
dispersal rate between male and female otters; female river otters dispersed a mean of
8.7 km greater than males.
River otters mate in the spring, but due to delayed implantation, the gestation
period lasts 8 to 9 1/2 months, and they do not give birth until March or April (Whitaker,
2002). Shortly after birth, otters have been known to mate again, although in Alabama
and Georgia it appears that females mate every other year (Whitaker and Hamilton,
1998). Female otters reach reproductive maturity at two years of age (Whitaker and
3
Hamilton, 1998). Males do not mate until they are five to seven years old when they
establish their own territory (Whitaker and Hamilton, 1998). It is believed that male river
otters may mate with more than one female in his territory (Whitaker, 2002). Litter sizes
range from 1-6 pups, but normally there are 2 – 4 (Whitaker, 2002). The pups are born
blind, weaned after four months and generally leave their mother shortly before she
gives birth again the following year (Whitaker and Hamilton, 1998; Whitaker, 2002).
River otters may live up to 25 years in captivity, but in the wild they only live on average
about 10 years (Chanin, 1985 cited by Baitchman, 2000). Some reasons that may
account for the shorter lifespan for river otters in the wild are road kill, disease, and
trapping for fur. For example, of the 28 river otters that Spinola (2003) tagged and
released, three died from automobiles and two from unknown causes within two years
of their release.
River otter populations have declined in most of their natural range largely due to
trapping (Whitaker, 2002). Otter fur is durable, thick and beautiful, which lead to high
trapping rates and the otter’s decline (Whitaker, 2002). Water and air pollution, habitat
destruction, and human encroachment have also contributed to river otter population
decline (Whitaker, 2002).
Management Prior to 1936, river otters were trapped without any regulations, which contributed
to the extirpation of many otter populations. Between 1936 and 1945, there was a
period where it was illegal to trap river otters throughout the United States. In some
areas, the populations were able to recover by 1945. In these select areas otters could
be hunted again (NYROP Homepage), however, there were limitations regarding
4
seasons, locations and catch limits in order to prevent the decline of the river otter
(NYROP homepage). In 1976, reintroduction projects began throughout the United
States. However, many of these reintroductions did not include any follow-up studies to
ensure that the river otter populations were stable and reproducing (Raesly, 2001).
In 1995, the New York River Otter Project (NYROP) was initiated in order to
reintroduce river otters into their native habitat in Western New York. At the project’s
completion in 2000, 279 river otters had been reintroduced from the Adirondacks and
Catskills to Western New York (NYROP homepage). Thirty-one of the river otters were
released near Black and Honeoye Creeks, which are tributaries of the Genesee River
(personal communication, Bruce Penrod). Even though there were many medical tests
preformed on the river otters to ensure their health, blood was collected only at the
Seneca Park Zoo, however, no genetic analysis was performed (personal
communication, Dr. Kollias & David Hamilton).
Spinola (2003) worked with the NYROP and surgically implanted
radiotransmitters into 28 of the river otters that were released at Letchworth Park. The
river otters were monitored for a total of two years. Out of the 28 river otters, 21
established a territory within the study area, five established a home range on the
Genesee River and 16 established a home range throughout tributaries of the Genesee.
Other than Spinola’s PhD dissertation and the sighting reports sent by local residents to
the NYROP website, there had been no monitoring of the river otters, until Dr. Lei Lani
Stelle formed the Rochester Institute of Technology (RIT) river otter research lab in
early 2004. In the four years that the lab has performed research, we have rarely
observed an otter ourselves due to their elusive nature; instead we rely on evidence of

5
their presence (e.g. scatology) to study the river otters.
Scatology and Alternatives Scatology is the study or examination of feces in order to obtain biological
information, such as viruses or diseases and diet (Kohn, 1997; Deagle, 2005;
Baltrünaité, 2006; Casper, 2007;). In addition, in recent years scat has been used for
genetic analysis (Cronin et al., 1996; Reed et al., 1997; Serfass et al., 1998; Ernest et
al., 2000). There are alternatives to scatology for studying river otters, such as trapping
and implanting radio transmitters or using remote cameras to monitor behavior.
Trapping and Transmitters
Tracking otters equipped with radio transmitters is very informative, because it
provides a great deal of information on their home range, territory, and how much they
interact with other otters (Blundell, 2000; Spinola, 2003). Unfortunately, the process can
be very expensive, time-consuming, and invasive. The NYROP worked together with
local trappers in the Adirondacks and Catskills to live trap river otters (NYROP
homepage). After the otters were trapped they were sent to a veterinary hospital and
once their health was evaluated, radiotransmitters were surgically implanted into the
abdomen (Hernandez-Drivers, 2001). The transmitters needed to be implanted because
river otters weave in and out of debris and an external collar or tag would most likely get
caught on debris and could result in the otter’s death. After surgery the otters were
monitored to ensure their health. The radio tags lasted an average of 422 days although
they had a life expectancy of only 10 months. There was no known mortality rate
associated with the implanting of the radio transmitters. The process of trapping,
transporting, and reintroducing otters is likely extremely stressful on the animals. We

6
speculate that trapping may have even changed the river otter's behavior and made the
otters more wary of humans, however, this has not been proven.
Remote Cameras and Video Monitoring
The use of remote cameras is a cutting edge approach to monitor the behavior of
animals in the wild. The main problem with the use of remote cameras is that they are
expensive; although units can be purchased for a few hundred dollars the highest
quality designs can cost up to $50,000 or more. Another problem is that the camera has
to be positioned at the right place at the right time. For example, in order to capture an
image of a river otter one needs to know where they are most likely to be next, the best
place to put the camera, and how sensitive the camera must be set for determining
movement. There are many other factors to consider when using remote cameras, such
as battery power and reliability, which can makes them extremely difficult to work with.
However, despite all of the downfalls, video monitoring is the only alternative to
personal observation where you can get accurate behavioral data. Furthermore, video
monitoring is a reliable data source because you can watch the film over and over again
to analyze behavioral patterns and movements. For example, Stevens (2005) utilized
video cameras to determine that sliding can be a play behavior as well as a form of
locomotion for North American river otters.
Scatology Background
Molecular scatology utilizes the epithelial cells that slough off the intestinal lining
when the animal defecates. DNA can then be extracted from the scat in order to identify
the species that defecated and even tell individuals apart. Several researchers have
successfully extracted DNA from river otter feces. A University of New Mexico website
7
described how a professor has identified a southwestern river otter DNA from feces; this
was especially impressive since the southwestern river otter was presumably extinct
from New Mexico for 50 years (Carr, 2005). In Virginia, Brandhagen (2003) extracted
DNA from river otter feces to determine the status of the otter on the United States
Marine Corps Base at Quantico.
There are three main methods of extracting DNA from feces: 1) proteinase K and
phenol/chloroform extraction method, 2) guanidine thiocyanate, and 3) a manufacturer’s
kit. For example, Qiu-Hong Wan et al. (2003) used a proteinase K method to extract
DNA from tiger feces. Wilson et al. (2003) used a modified Boom et al. (1990) method
to successfully extract DNA from badger feces utilizing guanidine thiocyanate.
Brandhagen (2003) used the BIO101 Fast-DNA Spin Kit (for soil) to extract DNA from
river otter feces.
My Project
Genetics analyses through extraction of DNA from fecal samples are extremely
informative. Information about river otters can be determined by looking at DNA
sequences. I have utilized mitochondrial DNA sequencing and microsatellite DNA
sequencing to study river otters.
I extracted DNA from fecal samples collected in three study areas: the Genesee
watershed, NY; 1000 Islands, NY; and the south-central coast of British Columbia (see
figures 1,2, & 3). The Genesee watershed was the primary study area, while the other
locations served as secondary study areas where known river otter scat samples were
collected. I used molecular scatology to study river otters because I believe this
approach has the smallest impact on the river otter’s natural behavior since it is

8
relatively non-invasive. By using molecular scatology I can determine if the scat
belonged to an otter, identify what otter it came from, how related the otters are, and if
there is any inbreeding.
Through the course of my study I discovered a large percentage of the collected
scat came from raccoons. Since river otter and raccoon scat look similar, I decided to
determine if there were genetic similarities between the two species as well. More
specifically, I performed a comparison of river otter and raccoon microsatellite
sequences.
The goals of the genetic analyses were to: 1) to perfect a methodology to extract
DNA from river otter scat, 2) determine possible visual cues that may differentiate otter
scat from raccoon scat, and 3) compare river otter microsatellite primers on raccoon
(Procyon lotor) scat and tissue samples, to determine if raccoons have the same
microsatellite sequences as river otters.
Implications This research will help scientists to differentiate between river otter and raccoon
feces by identifying defining characteristics. This will assist river otter and raccoon
researchers alike by reducing possible errors from collecting scat of the wrong species.
This comparison of methodologies will also assist researchers in determining the ideal
way to extract DNA from river otter feces. The research will help determine whether or
not more river otters need to be reintroduced into the Genesee watershed in order to
maintain a genetically diverse population. Finally, this study serves as a warning, in that
presumably species specific microsatellite primers may work with other species,
including those not found in the target species family; thus, potentially causing

9
erroneous results.

10
References: Boom, R, C.J. Sol, M.M. Salimans, C.L. Jansen, P.M. Wertheim-van Dillen and J. van
der Noordaa. 1990. Rapid and simple method of purification of nucleic acids. Journal of Clinical Microbiology 28 (3) 495-503.
Baitchman, Eric J and George V. Kollias. 2000. Clinical anatomy of the North American
river otter (Lontra canadensis). Journal of Zoology and Wildlife Medicine 31 (4) 473-483.
Baltrünaité, Laima. 2006. Seasonal diet of the otter (Lutra lutra L.) in natural river
ecosystems of south-eastern Lithuania. Acta zoologica Lituanica 16 (2) 107-114. Ben-David, Merav; Gail M. Blundell; John W. Kern; Julie A.K. Maier; Evelyn D. Brown; Stephen C. Jewett. 2005. Communication in river otters: creation of variable
resource sheds for terrestrial communities. Ecology 85 (5) 1331-1345. Blundell, Gail M., R. Terry Bowyer, Merav Be-David, Thomas A. Dean, Stephen C.
Jewett. 2000. Effects of food resources on spacing behaviour of river otters: does forage abundance control home-range size? Biotelemetry 15: Proceedings of the 15th International Symposium on Biotelemetry, Juneau Alaska, USA (eds Eiler, JH, Alcorn, DJ, Neuman, MR), 325-333. International Society on Biotelemetry, Wageningen, The Netherlands.
Blundell, Gail M., Merav Ben-David, R. Terry Bowyer. 2002. Sociality in river otters: cooperative foraging or reproductive strategies? Behavioral Ecology 13 (1) 134- 141. Brandhagen, M.D. 2003. Monitoring of the North American river otter (Lontra
canadensis) using molecular analysis of scat: a noninvasive technique and its potential application to otter management and conservation. PhD dissertation. George Mason University.
Carr, S. 2005. UNM researchers discover evidence of river otter thought to be extinct at Navajo Lake State Park in northwest New Mexico. UNM Today. <http://www.unmalumni.com/mirage/index.htm?connections.htm~below> (accessed February 23, 2006)
Casper, Ruth M., Simon N. Jarman, Bruce E. Deagle, Nicholas J. Gales, Mark A.
Hindell. 2007. Detecting prey from DNA in predator scats: a comparison with morphologicial analysis, using Actocephalus seals fed a known diet. Journal of Experimental Marine Biology and Ecology 347 144-154.
Chanin, P. 1985. The natural history of otters. Facts on file Publ., New York, New York.
11
Cronin, Matthew A., James Bodkin, Brenda Ballachey, James Estes, and John C. Patton. 1996. Mitochondrial-DNA variation among subspecies and populations of sea otters (Enhydra lutis). Journal of Mammology 77 (2) 546-557.
Deagle, B.E., D.J. Tollit, S.N. Jarman, M.A. Hindell, A.W. Trites, N.J. Gales. 2005.
Molecular scatology as a tool to study diet: analysis of prey DNA in scats from captive Steller sea lions. Molecular Ecology 14 1831-1842.
Ernest, H.B., M.C.T. Penedo, B.P. May, M. Syvanen, W.M. Boyce. 2000. Molecular
tracking of mountain lions in the Yosemite Valley region in California: genetic analysis using microsatellites and faecal DNA. Molecular Ecology 9 433-441.
Hamilton, W.J., Jr. 1961. Late fall, winter and early spring foods of 141 otters from New
York. New York Fish and Game Journal 8 (2): 106-109. Knudsen, George J. and Hale, James B. 1968. Food habits of otters in the Great Lakes region. Journal of Wildlife Management 32 (1) 89-93. Kohn, Michael H. and Robert K. Wayne. 1997. Facts from feces revisited. TREE 12 (6):
223-227. Manning, Tom. 1990. Summer feeding habits of river otter (Lutra canadensis) on the Mendocino national forest, California. Northwestern Naturalist 71 38-42. Mech, David L. 2002. Incidence of mink, Mustela vision, and river otter, lutra
canadensis, in a highly urbanized area. The Canadian Field-Naturalist: Notes 117 115-116.
New York River Otter Project Homepage. Fearless Computing.
<http://www.nyotter.org/pages/homepage.html> (accessed February 23, 2006) Reed, J.Z.. D.J. Tollit, P.M. Thompson, W. Amos. 1997. Molecular scatology: the use of
molecular genetic analysis to assign species, sex and individual identity to seal faeces. Molecular Ecology 6 225-234.
Reid, D.G.; T.E. Code; A.C.H. Reid; S.M. Herrero. 1994. Spacing, movements, and
habitat selection of the river otter in boreal Alberta. Canadian Journal of Zoology 72 1314-1324.
Schreck, Leslie. May 2007. Prey Preference of the North American River Otter (Lontra
canadensis). Research Scholars Program Final Report. Rochester Institute of Technology.

12
Serfass, Thomas L., Robert P. Brooks, James M. Novak, Paul E. Johns, and Olin E. Rhodes, Jr. 1998. Genetic variation among populations of river otters in North America: considerations for reintroduction projects. Journal of Mammology 79 (3) 736-746.
Spinola. 2003. Spatio-temporal ecology of River Otters translocated to western New
York. PhD dissertation. Pennsylvania State University. Taylor, Mary; Jessica E. Rettig; Geoffrey R. Smith. 2003. Diet of re-introduced river
otters, Lontra canadensis, in North-Central Arizona. Journal of Freshwater Ecology 18 (2): 337-338.
Wan, Qiu-Hong; Sheng-Guo Fang; Guo-Fu Chen; Zhang-Ming Wang; Ping Ding; Mu-
Yuan Zhu; Kong-Shou Chen; Jiu-Hua Yu; Yue-Ping Zhao. 2003. Use of oligonucleotide fingerprinting and faecal DNA in identifying the distribution of the Chinese tiger (Pantera tigris amoyensis Hilzheimer). Biodiversity and Conservation 12 1641-1648.
Williams, G.J.; A.C. Frantz; L.C. Pope; T.J. Roper; T.A. Burke; C.L. Cheeseman; R.J.
Delahay. 2003. Estimation of badge abundance using faecal DNA typing. Journal of Applied Ecology 40 658-666.
13
Chapter 1: Methodology Introduction
Waits and Paetkau (2005) noted that there is no consistent method for
performing DNA extractions from scat. For every species, they believe that the method
of extraction may even vary with geographic region, likely because different geographic
regions have different effects on weathering. Waits and Paetkau (2005) believe that it is
important to perform a pilot study to determine the optimal method of extraction.
There are five main methods that are commonly used in order to extract DNA
from feces: 1) chelex protocols, 2) phenol chloroform, 3) diatomaceous earth/guanidine
thiocyanate, 4) magnetic beads, and 5) prepared kits from a manufacturer (Waits and
Paetkau, 2005). The most common method to extract DNA from either hair or fecal
samples is using an extraction kit, specifically QIAGEN (Waits and Paetkau, 2005). I
compared three of these five methods: 1) phenol chloroform, 2) guanidine thiocyanate,
and 3) QIAGEN Mini Stool Kit; in addition, I also performed a modification of the
QIAGEN Mini Stool Kit.
Methods and Materials Collection Process
The RIT river otter lab collected the scat in all seasons, between 2004-2007 on
Oatka Creek (Lat: 43.00, Long: -77.80), Black Creek (Lat: 43.07, Long: -77.80), and
Honeoye Creek (Lat: 42.97, Long: -77.71), which are all tributaries of the Genesee
River (see Figure 1). Each creek was visited on a weekly or every other week basis.
Only a portion of the scat was collected in a Ziploc bag so not to deter the otter from
returning to that same location. The surrounding area was observed and the following
parameters recorded: slope of the bank, flow of the water, amount of human

14
disturbance, amount of human activity, tree cover, pollution, and Global Positioning
System (GPS) coordinates. Scat samples were kept in a Frigidaire Commercial chest
freezer at –25°C. Samples were also collected from the Thousand Islands, NY (see
Figure 2) and River’s Inlet, British Columbia (see Figure 3) that were known river otter
scat samples.
Extraction of DNA
I attempted four methods to extract DNA from feces: 1) proteinase K and phenol-
chloroform, 2) guanidine thiocyanate, 3) QIAGEN QIAamp Stool Mini Kit, and 4) a
modification of the QIAGEN protocol as described by Wasser et al. (2004).
Proteinase K
Proteinase K works by breaking the polypeptide bonds in cellular proteins, which
inhibit Polymerase Chain Reaction (PCR). Proteinase K does have some limitations; for
example, it only digests unmodified polypeptide bonds. It also is not useful for the
degradation of partially degraded polypeptides (i.e. tissues fixed in formalin) or non-
proteinaceous components of feces such as bilirubin and bile. Also, it will not degrade
any cellular debris that is non-proteinaceous. The technique used to extract DNA with
proteinase K is as follows:
Proteinase K Technique
Day 1: I weighed out 1-2 g of scat, placed the scat into a labeled centrifuge tube
and added 10-15 mL of DNA extraction buffer to each tube. I Vortexed until the
scat was broken apart, added 1:20 (500 µL: 10 mL) volume of SDS, and placed
the tube on a shaker for 30 minutes. I then added proteinase K to a concentration
of 200 µg/mL in each tube (100 µL to each tube for every 10 ml in volume) and

15
placed it in a 55°C water bath overnight.
Day 2: I added 300 µL of NaCl to each tube along with an equal volume of
phenol and placed the tube on a shaker for one hour. I spun the tube for 10
minutes at 3000 RPM and repeated if necessary (typically 3 replicates). I added
an equal volume of Phenol: Chloroform: Isoamyl (PCI) to each tube and shook
the tube for 30 minutes. I spun the tube for 10 minutes at 3000 RPM then added
RNAse to a final concentration of 100 µg/mL (100 µL per 10 mL of volume) and
incubated the sample for one hour at 37°C. I added proteinase K (100 µL per 10
mL) and incubated at 55°C overnight.
Day 3: I added an equal volume of PCI to each tube and shook the tube for one
hour. I balanced the tube with CI and centrifuged it for 10 minutes at 3000 RPM. I
pipetted the top layer and placed it in a labeled empty tube. I added an equal
volume of CI and shook the tube for 30 minutes. I balanced the tubes with CI and
centrifuged them for 10 minutes at 3000 RPM. I added 2.5 times the volume of
cold ETOH to each sample, shook them vigorously and placed them in a -20°C
freezer overnight.
Day 4: I removed the samples from freezer, balanced the tubes and centrifuged
them at 3500 RPM for 15 minutes to pellet DNA in bottom of tube – additional
centrifuging was occasionally necessary. I poured off the ETOH into a beaker,
careful to leave the DNA in the bottom of the tube and placed the tube in a
drawer for the weekend to let air-dry.
Guanidine thiocyanate Guanidine thiocyanate works similar to proteinase K in that it breaks up proteins
that may inhibit PCR. However guanidine thiocyanate is a more aggressive protein

16
denaturant than proteinase K and will break damaged or modified peptides bonds. This
procedure was originally developed by Boom et al. (1990), although their method is
outdated and is normally modified.
Guanidine thiocyanate Technique The guanidine thiocyanate procedure was taken from Reed et al. (1997). I
weighed out 150 mg of scat and suspend it in 900 µL of extraction buffer (5 M GuSCN,
0.1 M Tris-HCl pH 6.4 0.02 M EDTA pH 8.0 and 1.3% Triton X-100) then incubated the
sample at room temperature on a shaker for 10 minutes. I centrifuged the samples,
added 20 µL of glass milk to the supernatant and incubated the solution at room
temperature on a shaker for 10 minutes. I washed the glass milk twice with 500 µL of
washing buffer (5 M GuSCN, 0.1 M Tris-HCl pH 6.4, 0.02 M EDTA pH 8.0). I then
washed the glass milk twice with ethanol washing buffer (10 mM Tris-HCl pH 7.5, 100
mM NaCl, 1 mM EDTA and 50% ethanol). I dried out the sample at 37°C for 15-20
minutes and eluted the DNA with 100 µL of TE at 55°C for 10 minutes.
QIAGEN Stool Mini Kit
There are many kits made by different manufacturers that use a modified version
of the proteinase K or guanidine thiocyanate methods. However, kits such as the
QIAGEN Stool Mini Kit have a special component called InhibitEX that binds to
impurities so they can then be removed before the proteinase K is even added;
therefore increasing the likelihood of extracting DNA that has few impurities and can be
amplified.

17
QIAGEN Stool Mini Kit Technique To prepare the reagents, I added 25 mL of ethanol (96-100%) to Buffer AW1 and
20 mL of ethanol (96-100%) to Buffer AW2, as indicated. All centrifuging occurred at 15-
25°C at 20,000 g.
I weighed out 180-220 mg of scat in a 2 mL microcentrifuge tube, making sure
that frozen scat did not thaw before Buffer ASL was added. I added 1.6 mL of Buffer
ASL to the sample, vortexed it for 1 minute or until the sample was completely
homogenized. I centrifuged the sample for 1 minute, pipetted 1.4 mL of supernatant into
a new 2 mL microcentrifuge tube and discarded the pellet. I added one InhibitEX tablet
to each sample, vortexing immediately and continuously for 1 minute or until the tablet
was completely suspended. I incubated the sample for 1 minute at room temperature
then centrifuged for 6 minutes (as directed by 2005 GIAGEN handout). Immediately
after the centrifuge stopped, I pipetted the supernatant into a new 1.5 mL
microcentrifuge tube and centrifuged again for 3 minutes. I pipetted 25 µL of proteinase
K into a new 2 mL microcentrifuge tube, added 600 µL of supernatant into the tube
containing proteinase K, and added 600 µL of Buffer Al and vortexed it for 15 seconds. I
then incubated the sample at 70°C for 10 minutes. After the incubation I added 600 µL
of ethanol (96-100%) to the lysate and vortexed. I labeled the QIAamp spin columns
and placed them in a 2 mL collection tube. I carefully applied 600 µL of lysate to the
column and centrifuged the sample for 1 minute. I placed the column in a new collection
tube and repeated the process until there was no remaining lysate. I added 500 µL
Buffer AW1 and centrifuged for 1 minute. I placed the column into a new collection tube
and added 500 µL of Buffer AW2 and centrifuged for 3 minutes. Then placed the spin
18
column in a 1.5 mL microcentrifuge tube. To elute the DNA, I added 200 µL of Buffer
AE, incubated for 1 minute in room temperature then centrifuged for 1 minute.
QIAGEN Stool Mini Kit Modification Wasser et al. (2004) describes using the QIAGEN QIAamp Stool Mini Kit for scat
extractions. However, they modified QIAGEN's procedure in order to get a higher
percentage of samples to amplify and greater yield of DNA. Their modifications are as
follows: 1) after adding the 1600 µL of buffer ASL, vortex, and incubate for one hour at
70°C also 2) after the proteinase K was added, instead of incubating at 70°C for 10
minutes, incubate for one hour.
Results I attempted to extract DNA from one scat sample collected from the Genesee
watershed with Proteinase K. However, when a PCR was performed, the extracted DNA
was unable to amplify. I then attempted to extract DNA from three scat samples
collected from the Genesee watershed utilizing the guanidine thiocyanate method.
However the three extractions did not successfully amplify the DNA when a PCR was
performed. I attempted to extract DNA from 86 wild scat samples over 123 times
utilizing the QIAGEN QIAamp Stool Mini Kit, of which 22 sequenced, resulting in a
success rate of 18%. I then adopted the extraction method described by Wasser et al.
(2004). With the modified method, I performed 50 extractions from 43 samples
amplifying from 9 samples, 8 of which were successfully sequenced, resulting in a
success rate of 16%. In order to test the efficiency of the new method I took two
samples that did not work in the past, using just the QIAGEN Stool Mini Kit normal
procedure. One of the samples I had attempted to extract 3 times and the other I had
19
attempted to extract once, but none of the extractions were able to amplify. I extracted
the samples again, utilizing the modified QIAGEN method, and both of the samples
amplified in a PCR and were successfully sequenced in the first attempt with the new
methodology.
Discussion Proteinase K appeared to be the least effective method for extracting DNA from
feces, due to requiring four days to perform a single extraction, whereas the QIAGEN kit
and guanadine thiocyanate take only a few hours. Proteinase K also only digests
unmodified polypeptide bonds and is not useful for the degradation of partially degraded
polypeptides or non-proteinaceous components of feces such as bilirubin and bile.
Because fecal samples possess an inordinately high percentage of these compounds
compared to other sources of DNA, proteinase K alone did not appear to be an optimal
method to extract DNA from feces.
Guanidine thiocyanate works similar to proteinase K in that it breaks up proteins
that may inhibit PCR. Although guanidine thiocyanate is more efficient than proteinase
K, it was still not effective enough to extract DNA out of otter feces. This is likely due to
the high amount of impurities, all of which may not have been completely removed from
the sample. The problems of impurities remaining in the extracted sample are that if
there are any impurities it will inhibit the PCR reaction and the DNA will not amplify.
The best methodology to extract DNA from feces utilizes the QIAGEN QIAamp
Stool Mini Kit. Although the QIAGEN kit uses proteinase K, the difference between the
proteinase K method and the QIAGEN kit method is the InhibitEX tablet. The InhibitEx
tablet binds to impurities before the proteinase K is added, resulting in a two-step
20
method of removing impurities, thus allowing the proteinase K to work more effectively.
When looking at percentages, the modification of the QIAGEN kit does not seem
to be the most effective way of extracting the DNA, with a 16% successful extraction
rate compared to an 18% successful extraction rate for the normal procedure. However,
when comparing individual samples, the modification of the QIAGEN kit gave
amplifiable DNA from samples, which previously did not work with the normal QIAGEN
kit procedure. This is most likely because the first additional time in the water bath
allows the scat to homogenize more than if it were only vortexed like in the original
instructions. Also, the second extended time in the water bath gives the proteinase K a
longer digestion period, allowing it to break apart more impurities that might otherwise
inhibit the PCR.
Improvements
Although I was able to extract DNA from river otter scat, my success rate was
quite low, especially in comparison with other studies. Wasser et al. (2004) studied
grizzly bears and had successful extraction rates of 65% for mitochondrial DNA and
40% for microsatellite DNA, whereas my extraction rate is 16-18% for mitochondrial
DNA. In order to increase the successful extraction rate, it would be ideal to collect the
scat on the day that it was defecated. When looking at the condition of our samples it
appears that most of our samples are collected several days after they were defecated.
The longer the samples are out in the elements, the more the DNA will degrade. Having
samples that have been exposed to sunlight, warm temperatures, and potential
contamination likely reduced the amount of DNA in the sample and thus reduce the
ability to extract DNA that can be amplified. In order to improve the extraction rate, more

21
vigorous sampling must occur and ideally sites should be visited once a day, although
that may not be feasible.
22
References Boom, R, C.J. Sol, M.M. Salimans, C.L. Jansen, P.M. Wertheim-van Dillen and J. van
der Noordaa. 1990. Rapid and simple method of purification of nucleic acids. Journal of Clinical Microbiology 28 (3) 495-503.
Koepfli, K.P., R.K. Wayne. NCBI: Lontra canadensis cytochrome b (cytb) gene.
3/4/1998. <http://www.ncbi.nlm.nih.gov/entrez/viewer.fcgi?db=nucleotide&val=3511097>
New York River Otter Project Homepage. Fearless Computing.
<http://www.nyotter.org/pages/homepage.html> (accessed February 23, 2006)
Reed, J.Z., D.J. Tollit, P.M. Thompson, and W. Amos. 1997. Molecular scatology: the use of molecular genetic analysis to assign species, sex and individual identify to seal faeces. Molecular Ecology, 6, 225-234.
QIAGEN. 2002. DyeEx Handbook. Valencia, CA, QIAGEN, 8-9. QIAGEN. 2001. QIAamp DNA stool mini kit handbook: for DNA purification from
stool samples. Valencia, CA, QIAGEN, 22-24. QIAGEN. 2002. QIAquick spin handbook. Valencia, CA, QIAGEN, 18. Waits, Lisette P. and David Paetkau. 2005. Noninvasive genetic sampling tools for
wildlife biologists: a review of applications and recommendations for accurate data collection. Journal of Wildlife Management 69 (4): 1419-1433.
Wasser, Samuel K., Barbara Davenport, Elizabeth R. Ramage, Kathleen E. Hunt,
Margaret Parker, Christine Clarke, and Gordon Stenhouse. 2004. Scat detection dogs in wildlife research and Management: application to grizzly and black bears in the Yellowhead ecosystem, Alberta, Canada. Canadian Journal of Zoology, 82, 475-492.

23
Appendix: Figure 1: Map of Genesee study area in Monroe County, New York. Maroon line represents the Genesee River, red line represents Oatka Creek, yellow line represents Black Creek, and pink line represents Honeoye Creek. Green and yellow stars represent locations where we have collected scat and located potential otter latrine sites.

24
Figure 2: Within the red circles are the general locations where scat was collected in the Thousand Islands, NY. The lower left hand circle is around the Picton Island. The upper right hand circle is around some ponds and swamps that were created due to beaver dams. Both are locations where river otters have been observed by the RIT river otter group.

25
Figure 3: The red circles are the general locations where scat was collected from Rivers Inlet, British Columbia, Canada. The locations are places where otters were observed and known to frequent. Two of the locations are ports for fishermen – Duncanby Landing and Goose Bay.

26
Chapter 2: Mitochondrial DNA Introduction Mitochondrial DNA Mitochondrial DNA is usually passed from mother to offspring because the
mother’s egg contains a large number of mitochondria; while sperm does contain
mitochondria, these are not usually transferred to the egg during fertilization. Since
mitochondrial DNA is inherited maternally, it can be used to identify different populations
and to identify species. Koepfli and Wayne (2003) determined the mitochondrial DNA
cytochrome b sequence for the North American river otter (Lontra canadensis). I
compared local otter DNA sequences to their published records to ensure that the scat
we collected was from a river otter as opposed to other small carnivores.
Choice of Mitochondrial Cytochrome b Locus
Mitochondrial DNA is ideal for the identification at the species level, because with
the cytochrome b locus one can use the same primers, but the amplified sequence will
be different for most every type of vertebrate animal. I compared my amplified sequence
to known sequences in GENBANK (an on-line database) in order to identify the species.
I used the L14841 and H15149 primers, yielding a fragment of 308 base pairs (bp). I
chose a very small segment because the larger the fragment the more difficult it is to
amplify (Deagle, 2006) and it is unlikely that I could amplify a large fragment due to the
dilute and degraded nature of the DNA from the fecal samples. The cytochrome b locus
possesses enough variation in its sequence to distinguish otter DNA from other species
that might be extracted in the processing of the fecal samples.
27
Materials and Methods After the extraction was performed as described in Chapter 1, the quality of the
extracted DNA was observed using a Nanodrop ND-1000 Spectrophotometer and the
software ND-1000 v 3.2.1. A sample of deionized water was placed in the Nanodrop to
zero the spectrophotometer. The Nanodrop was cleaned with a chemwipe and zeroed
again with buffer AE (the buffer the DNA is suspended in). The Nanodrop was cleaned
with another chemwipe and 1 µL of the DNA was placed on the Nanodrop and the
program was run. The Nanodrop gave a reading of the amount of DNA in the sample in
ng/µL and the 260/280 measurements. The 260/280 was used to determine how much
double stranded DNA there was compared to single stranded DNA. In other words, it
determined how many impurities and what kind of impurities there are in the sample. If
the range is between 0-1.8 then there are too many impurities that are inhibiting the
DNA. If the range is between 1.8-2.0 it is an ideal sample. If the sample is above 2.0
then there is too much RNA in the sample. If the readout had a 260/280 between 1.80
and 2.00, the sample was then used in a PCR. However, if the sample was not between
1.80 and 2.00, the sample was re-extracted. If, after two extractions (using the QIAGEN
kit, modified procedure) the appropriate 260/280 was not achieved, the sample was
determined to be too degraded and thus unable to provide DNA. The amount of DNA
used during the PCR varied based on the amount of DNA that was extracted, but the
following procedure was the general process.
The extracted sample underwent a PCR in order to amplify the desired segment
of the sequence. For mitochondrial sequences, the reaction was mixed on ice, and was
28
a 20 µL solution consisting of 4 µl of 5x buffer, 2 µl of dNTP, 1 µl of the desired L primer,
1 µl of the desired H primer, 2 µl of MgCl, 0.2 µl of GoTAQ, 7.8 µl of distilled water, 1.0
µl of BSA, and 1 µl of the DNA. For these reactions a positive control (otter tissue
sample obtained from Dr. George Kollias of Cornell University) and a negative control
(water – did not contain any DNA) were utilized to ensure that the reaction worked
properly and without contamination. The PCR reaction was run on a Perkin Elmer
Geneamp PCR 2400 System Thermocycler. The reaction went through 1 cycle at 94°C
for 2 minutes followed by, 35 cycles at 94°C for 1 minute to denature, 50°C for 1 minute
for annealing, 72C for 0.5 minutes for extension, then 72°C for 5 minutes for the
terminal extension, and the reaction remained at 4°C until it was stopped.
The PCR product was run out on a check gel (1% agarose ad LB Buffer) to
determine if the PCR worked properly. Three µL of PCR product was added to 3 µL of
loading dye and run alongside 2 µL Promega Benchtop™ Marker ladder. The gel was
run at 300 volts for about half an hour. To stain the gel, it was placed in a refrigerated
solution of LB buffer and ethidium bromide for an hour or until the bands were visualized
under ultraviolet light. If the bands were visible then a photograph was taken using a
BioDocIt. If no band was found, the extraction may not have contained DNA or
contained DNA with impurities. If this were the case then another PCR would be
attempted, but if no band was visualized the second time, the sample would be put
aside and, time allotting, would be extracted again. If DNA was successfully extracted
and a band appeared on the gel, it would continue to sequencing.
Once the DNA was extracted successfully, a PCR cleanup was performed using
a QIAGEN QIAquick PCR Purification Kit following the QIAGEN protocol (QIAGEN
29
QIAquick, 2002), and a sequencing reaction was run. For every 200 base pairs (bp) of
desired sequence 20.0 ng of DNA is required. The Nanodrop was used again to ensure
there was enough DNA to run a sequencing reaction. The sequencing reaction went
into the thermocycler, but at a different set of temperatures: 96°C for 1 second then a
series of 25 cycles at 96°C for 10 seconds then 50°C for 5 seconds, followed by 60°C
for 4 minutes and the reaction is continued at 4°C indefinitely until stopped.
The QIAGEN DyeEx 2.0 Spin Kit was then utilized, using the DyeEx 2.0 spin
protocol for dye-terminator removal (QIAGEN DyeEx Handbook, 2002). This reaction
prepared the samples to go into the ABI Prism 310 Genetic Analyzer sequencer, using
the 310 Data Collection software v 3.0.0. The QIAGEN kit adds fluorescent dye to the
sequenced DNA so they can be read, printed out and saved by the sequencer. The
product from the sequencing reaction was then sent to the University of Rochester's
Medical Center: Functional Genomics Center to be read. The mitochondrial sequences
were then compared to known sequences on PubMed to determine the species.
Results Sequencing Out of the 33 samples that I was able to successfully sequence, I identified a total
of 14 raccoons (scat samples from the Genesee watershed), seven otters (two from zoo
scat samples, two tissue samples obtained from Cornell University, one scat sample
from British Columbia, and two scat samples from the Genesee watershed), one coyote
(Canis latrans) from the Genesee watershed, one beaver (Castor canadensis) from the
Genesee watershed, one Iguana (due to contamination from the lab), and nine fish (one
pink salmon (Oncorhynchus gorbuscha)– from British Columbia, one common carp

30
(Cyprinus carpio) – from the Genesee watershed, one shorthead redhorse (Moxostoma
macrolepidotum) – from the Genesee watershed, one golden redhorse (Moxostoma
erythrurm) – from the Genesee watershed, and five bullhead catfish (Ameiurus melas)–
all from the Thousand Islands) (Table 1).
Table 1: Summary of species sequenced and the percentage of that species sequenced compared to the total number of samples sequenced (scat only – otter and raccoon tissue samples not included).
Species Sequenced Percentage
Fish 32%
Raccoon 50%
River Otter 11%
Beaver 3.5%
Coyote 3.5%
Physical Composition At least nine of the14 fecal samples sequenced as raccoon had little evidence to
show that they were not from an otter. These nine samples were composed of primarily
feces with some crayfish exoskeleton. The five remaining raccoon scat samples had
berries or corn as the primary element in the composition, which made it more obvious
that they did not come from an otter. None of the raccoon samples were primarily
composed of fish.
Discussion Collection
Some people claim that river otter feces are easy to distinguish from other
species due to a strong smell and location of latrine sites (Hansen, 2000). Because they

31
believe it is easy to identify river otter scat from other species, they do not perform
mitochondrial analyses to ensure that the scat is from a river otter. While others have
found that typically otter scat appears like a splatter of feces, river otter scat may also
be tube-shaped (Greer, 1955). From our own experiences as a lab, where 50% of the
scat sequenced was from a raccoon, it is clear that there is some confusion in what river
otter scat looks like, in particular when compared to raccoon scat. It is known that both
raccoons and river otter diet can both contain fish or crayfish that may cause confusion
in scat identification. Particularly during the summer when it appears that river otters
may have a preference for crayfish rather than fish (Noordhuis, 2002 cited by Hansen,
2002). This can make the physical appearance of the scats look similar and thus difficult
to identify between the two species. Through our field studies it as also been observed
that otter scat does not always have the same pungent scent that can make it easily
distinguishable. This is likely due to the age of the scat when we collect it: the older the
scat, the fainter the scent.
Prey DNA was amplified in 32% of the scat samples because the scat samples in
which prey DNA was amplified consisted primarily of fish scales and there was little
other fecal material. The mitochondrial cytochrome b primers that I utilized were chosen
because they worked on many species and it was a small fragment that can be easily
amplified. This became problematic with samples in which prey DNA likely
overwhelmed the predator DNA, such as in scat samples that had mostly fish scales
and little other fecal matter that may have contained sloughed off epithelial cells. This
could be corrected by utilizing otter specific primers. It is likely that the scat samples
containing primarily fish scales were that of an otter because out of the 14 raccoon

32
samples that were amplified, none obviously contained fish scales. In addition, six of the
samples that sequenced as fish were known otter scat samples, five bullhead catfish
scat samples from the Thousand Islands and one pink salmon sample from British
Columbia. The three remaining scat samples that are likely otter came from the Mill
Creek/Black Creek area. However, a full dietary analysis should be performed on the
raccoon scat samples to determine if it contained any fish.
Most researchers should conduct mitochondrial analyses before they continue on
with further studies to ensure that there are no errors in the studies. This includes
genetic confirmation before performing any dietary analyses from hard parts alone,
unless the source of the scat can be confirmed through observation.
The Reintroduction
The results of the genetic analysis in relationship to the reintroduction are
misleading. I was only able to get otter DNA from two scat samples, that are possibly
even from the same river otter, from a single toilet site on Black Creek. However, when
talking to fishermen, they have often seen river otters on Oatka Creek. It is unlikely that
they are talking about the same river otters; since the creeks are approximately 7.5 Km
apart and they both have ample food and denning sites (personal observations). There
have also been times where more than two otters have been directly observed on Black
Creek, proving that there are more than two otters on Black Creek. Also the
aforementioned observations occurred in a different location of Black Creek, possibly
meaning that the river otter that I sequenced is not even included in the observations. In
summation, there are more otters in the Genesee watershed than we have been able to
collect scat from. This may occur because in the wintertime when it is easiest to locate

33
scat, the river otters may travel to areas where they have better access to food, which
may not be included in our study area. Otters are known to scat in the water and it is
also possible that we are not looking in the right areas or are just passing by otter toilet
sites.
Improvements It would also be ideal to have separate areas to perform each step; extractions,
amplification, and sequencing and to also have separate pipettes for each step. This
would limit the potential for contamination and thus the potential for false positives. It
has become common practice in most laboratories, when performing an extraction to
run a blank extraction as well to ensure that the extraction process itself is not
contaminated in any way (Waits and Paetkau, 2005). The blank extraction sample is
then run in the PCR, in addition to the regular PCR blank, in order to ensure that there
was no contamination from the start. This would reduce potential errors based off
contaminated reagents in the extraction process.
Future Experiments My low success rate is most likely attributable to exposure to the elements. It
would be interesting to conduct studies with scat samples collected from the zoo to
determine how long it takes for the scat samples to become unusable. The zoo scats
that I collected were all fresh, collected less than 24 hours after the otter defecated and
were some of the most reliable scat samples for extraction. Also it would be interesting
to store parts of the same scat sample with different methods to determine which is the
most effective method of storing otter scat. The main ways of storing scat are either: 1)
placing it in ethanol, 2) place it in DMSO, EDTA, Tris and salt buffer, (Waits and
34
Paetkau, 2005) or 3) store it in a freezer in no buffer. Waits and Paetkau (2005)
recommend that a pilot study be performed to determine the optimal way of storing scat
to ensure that there is no difference.
Another future experiment is to use the samples that are known to be from a river
otter, and try to extract the DNA of any prey that may be included. Studies have been
performed in which prey-specific primers were utilized in order to determine what prey
was consumed in captive Steller sea lions (Eumetopias jubatus) (Deagle et al, 2005)
and Arctocephalus seals; (Casper et al 2007). This would be useful in order to
determine what species of prey the otter is eating, which otherwise may be difficult to
determine using scat analysis of the hard parts, especially when there are few scales.

35
References Casper, Ruth M., Simon N. Jarman, Bruce E. Deagle, Nicholas J. Gales, Mark A.
Hindell. 2007. Detecting prey from DNA in predator scats: a comparison with morphologicial analysis, using Actocephalus seals fed a known diet. Journal of Experimental Marine Biology and Ecology 347 144-154.
Deagle, B.E., D.J. Tollit, S.N. Jarman, M.A. Hindell, A.W. Trites, N.J. Gales. 2005.
Molecular scatology as a tool to study diet: anlysis of prey DNA in scats from captive Steller sea lions. Molecular Ecology 14 1831-1842.
Deagle, Bruce E.; J. Paige Eveson; Simon N. Jarman. 2006. Quantification of damage
in DNA recovered from highly degraded samples – a case study on DNA in faeces. Frontiers in Zoology 3: 11. [Online] http://www.frontiersinzoology.com/content/3/1/11
Hansen, Heidi. 2003. Food Habits of the North American river otter (Lontra canadensis).
Graduate program, Department of Zoology and Physiology, University of Wyoming. Laramie, Wyoming.
Hansen, Heidi. 2004. Extraction technique and microsatellite primers on genotyping
success and error rates of river otter (Lontra canadensis) faecal DNA. Masters of Science Department of Zoology and University of Wyoming. Laramie, Wyoming.
Noordhuis, R. 2002. The river otter (Lontra canadensis) in Clarke County (Georgia,
USA): survery, food habits and environmental factors. IUCN Otter Specialist Group Bulletin 19 (2) 75-86. Cited by Heidi Hansen 2003.
QIAGEN. 2002. DyeEx Handbook. Valencia, CA, QIAGEN, 8-9. QIAGEN. 2001. QIAamp DNA stool mini kit handbook: for DNA purification from stool samples. Valencia, CA, QIAGEN, 22-24. QIAGEN. 2002. QIAquick spin handbook. Valencia, CA, QIAGEN, 18. Waits, Lisette P. and David Paetkau. 2005. Noninvasive genetic sampling tools for
wildlife biologists: a review of applications and recommendations for accurate data collection. Journal of Wildlife Management 69(4): 1419-1433.

36
Appendix: Table 2: Table of successfully sequenced samples, including sample number, date collected, location collected, and species identification (based on BLAST). *Note: scat samples sequenced as a species of fish are most likely from an otter. ***Note: Likely due to contamination
Sequenced Sample Number Date Location
Otter 6 BC 09/22/04 British Colombia – Duncan Bay Otter 2 01/25/07 Black Creek Otter 3 01/25/07 Black Creek Otter Admiral Seneca Park Zoo Otter Nosey Seneca Park Zoo Otter 1 Tissue 0.20 George Kollias Otter 2 Tissue 0.23 George Kollias Fish – Bullhead Catfish* 2 10/07/06 1000 Islands Lost Swamp Fish – Bullhead Catfish* 3 10/07/06 Pickin... Fish – Bullhead Catfish* 10/07/06 Pickn...
Fish – Bullhead Catfish* 1 1000 Islands Second Swamp Pond
Fish – Bullhead Catfish* 3 1000 Islands Lost Swamp Fish – Cyprinus carpio* 3 04/01/06 Mill/Black Creek Fish – Golden Redhorse* 1 01/25/07 Black Creek Fish – Pink Salmon* 20 05/08/04 British Colombia Fish – Shorthead Redhorse* 4 04/01/06 Mill/Black Creek Raccoon 40 A (?) 10/08/04 Raccoon 72 A 10/09/04 Raccoon 1 – B 11/12/04 Oatka Creek Dam Raccoon 8 – A 11/26/04 Oatka Raccoon 5 Casey 06/14/05 Lake Honeoye Raccoon 5 01/03/07 Black Creek Raccoon 1 01/11/06 Black Creek Raccoon 57 C 10/01/04 Raccoon II 02/05/06 Oatka Raccoon 4 03/22/06 Honeoye Raccoon II 05/02/06 Raccoon II 05/16/06 Raccoon 2 06/06/06 Black Creek Raccoon 72 A 07/17/06 Honeoye Beaver 1 03/24/05 Honeoye Coyote 1 06/21/06 Black Creek Iguana*** 16 05/08/04 British Colombia – Big Springs Not Readable 3 1000 Islands Second Swamp
37
Chapter 3: Microsatellite DNA
Introduction Microsatellite DNA Microsatellite DNA is located on chromosomes within the nucleus of the cell.
Microsatellite loci are donated by both the sperm and the egg during fertilization so each
individual possesses two copies of each locus. Microsatellite locus variation should be
higher than that of mitochondrial markers such as cytochrome b, which are usually
maternally inherited. This should enable identification of individuals from microsatellites,
but may not necessarily enable determination of species. Typically, microsatellite loci
are only assayed for their presence or absence and are not sequenced fully like the
cytochrome b locus; this is displayed as a single peak or two peaks representing either
a homozygote or heterozygote individual. However I chose to fully sequence the
microsatellite loci, because I believed it would be a more accurate demonstration of how
effective the microsatellites worked with raccoons, and if it were the exact same
sequence or a different microsatellite in the same primer region.
The Experiment The original goal of my thesis was to utilize microsatellite DNA to identify
individual otters and determine relatedness between the otters. However, I was only
able to sequence one river otter from British Columbia and two river otters from the
Genesee watershed (see Table 2), which is not enough to determine genetic diversity.
Even though I only obtained two known otters from the Genesee watershed, I decided
to run a PCR with the microsatellite RIO 11 to determine if it worked. Since I had so

38
many samples that were raccoons, I also used a known raccoon sample in the PCR.
When the samples were run out on a check gel, the raccoon DNA worked and had the
same band size as the river otters. I then decided to run three raccoon samples and
three river otter samples for each of the ten microsatellite loci to confirm that it was not
the result of error, and sequence the samples whenever possible.
Methods and Materials I used microsatellite primer sets RIO 11 – RIO 20 as described by Beheler et al.
(2005) to determine if the microsatellites designed for North American river otters would
work for raccoons as well. The PCR cycles were the same as designated by Beheler et
al. (2005), although some primers were more effective when the annealing temperature
was changed. These differences are noted in the results section. The list of the raccoon
and otter samples used can be found in Table 1.
Table 1: Raccoon and Otter sample data: includes the sample name, where it was collected from and date (when available) when collected.
Raccoon Otter Raccoon Tissue – Monroe County
raccoon carcass – provided by Shelly Morgan
Otter Tissue – Provided by George Kollias of Cornell University – from two reintroduced otters killed by cars
Scat (sample 72 A), collected on 7-17-07, from Honeoye
Scat (male otter)– collected from the Seneca Park Zoo
Scat (sample 8 A), collected on 11-26-04, from Oatka
Scat (sample 3, way point 95), collected on 1-25-07, from Black Creek
Scat (sample 5), collected on 1-3-07, from Black Creek

39
Results RIO 11 For primer RIO 11, I was able to sequence three otters and three raccoons. The
microsatellite regions for both otter and raccoon were nearly identical, with only a single
AC repeat difference. RIO 11 worked with an annealing temperature between 55 and
57°C, but worked best at 55°C. I was able to amplify the otter tissue on seven different
occasions. I was able to amplify from wild and zoo otter scat samples three times. I was
able to amplify a single band from three raccoon scat samples and once with raccoon
tissue.
The river otter tissue amplification was replicated to act as a positive control. In
addition, both the otter and the raccoon were amplified multiple times to ensure that the
microsatellite was amplified in its entirety.
RIO 12 I was able to sequence a small fragment of the microsatellite region for a raccoon
sample. However, I was not able to sequence the RIO 12 microsatellite with river otters.
RIO 12 worked best between the temperatures 55-57°C. Despite only to sequencing a
small fragment, I was able to amplify three otter tissue, three wild otter scat, two zoo
scat, and five raccoon scat samples. When the samples were compared on a gel, the
raccoon sequence that I was able to obtain was not the same size as the river otter
samples.
RIO 13 I sequenced two otters and one raccoon and the three sequences were identical.
RIO 13 worked with annealing temperatures between 53°C and 58°C, but worked best

40
around 55-57°C. I was able to amplify a total of eight otter tissue, two raccoon tissue,
two otter scat, and three raccoon scat.
RIO 14 I was only able to sequence two river otters with the RIO 14 microsatellite primer.
The primer worked with annealing temperatures between 53°C and 57°C, but worked
best at 55°C. I was able to amplify the otter tissue seven times and otter scat three
times; I amplified raccoon scat four times.
RIO 15 I sequenced one otter and one raccoon and the sequences were nearly identical.
The primer worked with annealing temperatures between 53°C and 57°C, working best
with 55°C. I was able to amplify the otter tissue four times and the raccoon tissue once,
as well as the otter scat samples four times and the raccoon scat samples four times.
RIO 16 I was only able to sequence one otter with the RIO 16 microsatellite primers. RIO
16 worked with the largest range of annealing temperatures, 48°C to 60°C. The raccoon
scat amplified best with an annealing temperature of 48°C (50% of successful trials, the
other temperatures being 53°C – 33% – and 55°C – 17%). However, the raccoon tissue
was able to amplify with an annealing temperature of 60°C. The otter samples ranged
between 53°C and 55°C. I was able to amplify the otter tissue samples four times and
the raccoon tissue samples twice. I amplified the three raccoon scat samples seven
times and the two otter scat samples three times.
RIO 17 I sequenced three otters and one raccoon. The raccoon appeared to have the
41
same microsatellite, when looking at the gel. However, it was not the same sequence as
the otter. When blasted, the raccoon sequence was 91.8% match (101/110 bp) similar
to Meles meles or Eurasian Badger microsatellite. I was able to amplify RIO 17 with
annealing temperatures ranging from 51°C to 57°C. I amplified the otter tissue sample
four times, however, I was unable to amplify the raccoon tissue sample without multiple
banding or smearing. I was able to amplify the two known otter scat samples three
times and the three known raccoon samples six times.
RIO 18 I sequenced two otters and one raccoon. The raccoon sequence was different
from the otter. The annealing temperatures for RIO 18 were either 55°C or 56°C. I was
able to amplify the otter tissue three times and the raccoon tissue once. I amplified
known otter scat samples four times and known raccoon scat samples three times.
RIO 19 I sequenced three otters and two raccoons. The raccoon sequences were
identical to the otter. RIO 19 had ranging annealing temperatures from 55°C to 58°C. I
was able to amplify the otter tissue sample seven times and the raccoon tissue sample
once. I amplified raccoon scat sample three times and otter scat samples twice.
RIO 20 I sequenced one otter and one raccoon. The sequence of the raccoon was nearly
identical to that of the otter. RIO 20 used annealing temperatures ranging from 53°C to
60°C, with the raccoon tissue working best at 60°C. I amplified the otter tissue sample
three times and the raccoon tissue sample once. I amplified known otter scat samples
three times and known raccoon samples three times.

42
Discussion Overall Out of the ten river otter microsatellites, I have confirmed that seven of the
microsatellite primers work with both otters and raccoons. Five of the primers: RIO 11,
RIO 13, RIO 15, RIO 19, and RIO 20 all had the same sequence for raccoons and
otters. RIO 17 and RIO 18 have similar fragment sizes, although they do not amplify the
same microsatellite. Although, samples RIO 12 and RIO 14 were not sequenced, it is
possible that the microsatellites are the same, because they have similar fragment
sizes, although it does not necessarily prove to be true, as RIO 17 had the same
fragment size and it turned out to be a different sequence. From the check gels I have
run it looks doubtful that RIO 16 is the same microsatellite for both raccoons and otters
because the band fragment sizes are different between the two species (see table 2 for
overall summary).

43
Table 2: Microsatellite effectiveness of primers RIO 11- RIO 20 on river otters (Lontra canadensis) and raccoons (Procyon lotor).
Primer Able to
sequence otters? (Y/N)
Able to sequence raccoons?
(Y/N)
Approximate average otter fragment size
Approximate average raccoon
fragment size
Were the sequences the
same? (Y/N)
RIO 11 Y Y 180 180 Y RIO 12 N N 220 220 Possible RIO 13 Y Y 270 260 Y RIO 14 Y N 300 300 Possible RIO 15 Y Y 240 240 Y RIO 16 Y N 300 1000 Unlikely RIO 17 Y Y 180 180 N RIO 18 Y Y 150 180 N RIO 19 Y Y 350 350 Y RIO 20 Y Y 240 240 Y
It is interesting that five of the microsatellites would work on both river otters and
raccoons with identical sequences; since river otter and raccoon cytochrome b, a coding
loci, are approximately 25% divergent, and the microsatellites – which are non-coding,
and therefore presumably more divergent – would have the same sequence.
Other studies have found that microsatellite primers created for one species can
work across families. The Eurasian badger, Meles meles, microsatellite primers work
with Eurasian otter (Lutra lutra) with 5/12 loci amplified/tested, Stoat (Mustela erminea)
11/17 loci amplified/tested, Cat (Felis catus) 2/17 loci amplified/tested, and wolf (Canis
lupus) 3/17 loci amplified/tested (Carpenter et al., 2003).
Effectiveness Dallas et al. (2003) observed that the proportion of river otter (Lontra

44
Canadensis) scats collected that were able to genotype was 2-10%. My total extraction
to sequencing rate was approximately 16-18% and out of those samples, only 10.7%
were positively identified as river otters, yielding an over all success rate of sequencing
otters of approximately 1.7%. An additional 32% were from fish, which is believed to
come from river otters. I then selected the scat samples confirmed to be otter and had
the best 260/280, meaning that they had the lowest amount of impurities and thus, the
highest probability of amplifying, for the microsatellite analysis. I used the same criteria
for the raccoon samples. Since the selected scat samples worked on the first attempt, I
did not experiment with all known otters and raccoon samples, so I did not determine a
successful genotype rate.
Dallas et al. (2003) discovered that there is no significant difference between the
genotyping results between scat and carcasses, that means microsatellites were
efficient at measuring the genotypes without any difference between tissue samples and
scat samples.
Implications` It has been previously observed that microsatellite primers can successfully
amplify different species, and even from different families (Dallas, 1998). It has already
been recognized that the microsatelltie primers RIO 11 – RIO 20 designed for North
American river otters work with fishers (Martes pennanti), stone martins (Mustela
frenata), ermine and American Mink (Behler, 2005), which are all members of the
Mustelid family and closely related to North American river otters. The primers also
worked with long-tailed weasels (Martes fiona), but were not polymorphic (see table
below); meaning they did not amplify more than one allele at a given locus.

45
Monomorphic loci cannot be used to identify individuals because genetically, they all
look the same. If raccoons were monomorphic with river otter primers, then they would
not be useful microsatellites to determine genetic diversity. Dallas and Piertney (1998)
also developed microsatellite primers for the European river otter (Lutra lutra). Those
primers were polymorphic at multiple loci with multiple species of otters and other
mustelids, such as the pine martin (Martes martes), American mink (Mustela vision),
and wolverine (Gulo gulo). The primers were even ploymorphic for one loci with other
mustelids (the european badger, Meles meles) and the spotted hyena (Crocuta crocuta)
(see table 3) (Dallas, 1998).
Table 3: From Beheler et al. (2005), “Number of alleles found within appropriate size during cross-amlificaiton of 10 North American river otter microsatellite loci in five species of Mustelidae…Primers were not optimized for species other than Lontra Canadensis.”
My study has demonstrated the importance of checking mitochondrial DNA to
ensure species identity before microsatellites are used. Many researchers today do
check to ensure that the species is the targeted species; for example, Adams (2007)
with red wolf feces, Reed (1997) with seal feces, Smith (2006) with kit fox feces, and
Wasser (2004) with grizzly and black bear feces. However, not all studies check
mitochondrial DNA to ensure that their scat sample belongs to the species that they

46
believe it does (e.g. Wilson, G.J. 2003; Bremner-Harrison 2006; Piggott 2006).
Future Work It would be ideal to sequence every microsatellite primer for at least three
raccoons and three river otters, but due to lack of success in multiple attempts, that
could not be completed. Also, there are ten more primers designed by Beheler et al.
(2004) for North American river otters, RIO 01 – RIO 10, those primers should be
sequenced for three river otters and three raccoons as well. It would be interesting to
see if the microsatellite primers that were developed for the European otter, Lutra lutra,
that have been shown to work with the North American river otter (Dallas, 1998) would
work with raccoons as well. Also, major prey species should be tested with the river
otter microsatellite primers, to ensure that there are no false positives. Before any
scatology study is conducted, in particular microsatellite only, a study should be
performed to see if the microsatellites work with other species whose scat may be
confused as the target species, even if they are not closely related. This could prevent
any possible erroneous results and possibly expand any use of microsatellites that have
already been discovered across different species.
The Reintroduction
The importance for reintroduction projects to have genetic analyses prior to the
release of the animals, ensuring that the individuals are not closely related, must be
stressed. The New York River Otter Project did no such testing, meaning that the river
otters that were released at one location may be genetically similar, which can have dire
consequences such as inbreeding depression and extinction in Western New York once
again. Inbreeding depression results when closely related organisms mate and

47
recessive deleterious alleles are expressed, causing defects with the next generation
that can potentially cause the population to go extinct. Different populations breeding
together, also known as gene flow, can curb inbreeding depression. But since the prey
and habitat are abundant for the river otters in the Genesee watershed, I feel that it is
unlikely that the otters would disperse into different populations, promoting gene flow. I
feel that the reintroduced river otters are highly at risk for inbreeding depression. There
are ways to solve the inbreeding problem by reintroducing more river otters, ones that
preferably have been tested to ensure that they are genetically diverse. Alternatively,
gene flow could be improved by building corridors between different populations.

48
References Adams, Jennifer R. and Lisette P. Waits. 2007. An efficient method for screening faecal
DNA genotypes and detecting new individuals and hybrids in the red wolf (Canis rufus) experimental population area. Conservation Genetics 8: 123-131.
Beheler, Amanda, S.; Jennifer A. Fike; Guha Dharmarajan; Olin E. Rhodes, Jr.; Thomas
L Serfass. 2005. Ten new polymorphic microsatellite loci for North American river otters (Lontra canadensis) and their utility in related mustelids. Molecular Ecology Notes 5 602-604.
Bremner-Harrison, Samantha; Stephen W.R. Harrison; Brian L. Cypher; James D.
Murdoch; Jesus Maldanado; Safi K. Darden. 2006. Development of a single-sampling noninvasive hair snare. Wildlife Society Bulletin 34(2): 456-461.
Carpenter, Petra J., Deborah A. Dawson, Caroyn Greig, Andrew Parham, Chris L.
Cheeseman, and Terry Burke. 2003. Isolation of 39 polymorphic microsatellite loci and the development of a fluorescently labeled marker set for the Eurasian badge (Meles meles) (Carnivora: Mustelidae). Molecular Ecology Notes 3, 610-615.
Dallas, J.F. and S.B. Piertney. 1998. Microsatellite primers for the Eurasian otter.
Molecular Ecology Primer Notes 7 1247-1263. Dallas, John F.; Karen E. Coxon; Tim Sykes; Paul R.F. Chanin; Freda Marshall; David
N. Carss; Philip J. Bacon; Stuart B. Piertney; Paul A. Racey. 2003. Similar estimates of population genetic composition and sex ratio derived from carcasses and feces of Eurasian otter Lutra lutra. Molecular Ecology 12: 275-282.
Piggott, M.P.; S.C. Banks; N. Stone; C. Banffy; A.C. Taylor. 2006. Estimating population
size of endangered brush-tailed rock-wallaby (Petrogale penicillata) colonies using faecal DNA. Molecular Ecology 15: 81-91.
Reed, J.Z.; D.J. Tollit; P.M. Thompson; W. Amos. 1997. Molecular scatology: the use of
molecular genetic analysis to assign species, sex and individual identity to seal faeces. Molecular Ecology 6: 225-234.
Smith, D.A.; K. Ralls; A. Hurt; B. Adams; M. Parker; J.E. Maldonados. 2006. Assessing
reliability of microsatellite genotypes from kit fox faecal samples using genetic and GIS analyses. Molecular Ecology 15: 387-406.
Wasser, Samuel K., Barbara Davenport, Elizabeth R. Ramage, Kathleen E. Hunt,
Margaret Parker, Christine Clarke, and Gordon Stenhouse. 2004. Scat detection dogs in wildlife research and Management: application to grizzly and black bears in the Yellowhead ecosystem, Alberta, Canada. Canadian Journal of Zoology, 82, 475-492.

49
Williams, G.J.; A.C. Frantz; L.C. Pope; T.J. Roper; T.A. Burke; C.L. Cheeseman; R.J.
Delahay. 2003. Estimation of badge abundance using faecal DNA typing. Journal of Applied Ecology 40: 658-666.

50
Appendix: Figure 1: Image of primer RIO 11 gel. In each lane is a sample with the RIO 11 microsatellite primers used (when reading from left to right) – in lane 1) otter tissue, 2) otter scat, 3) otter scat, 4) raccoon scat, 5) raccoon scat, 6) raccoon scat, 7) negative control, 8) nothing, 9) ladder, and 10) ladder. As you can see the fragment sizes appear to be the same size, and when sequenced we indeed the same fragment.
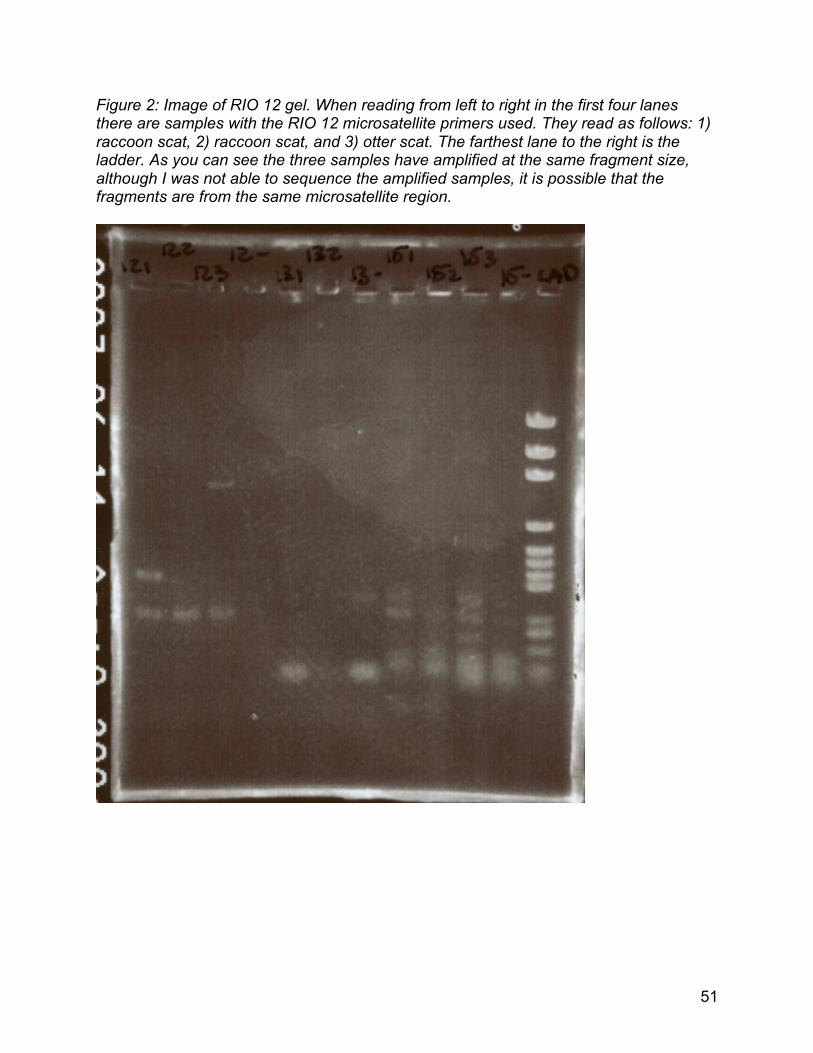
51
Figure 2: Image of RIO 12 gel. When reading from left to right in the first four lanes there are samples with the RIO 12 microsatellite primers used. They read as follows: 1) raccoon scat, 2) raccoon scat, and 3) otter scat. The farthest lane to the right is the ladder. As you can see the three samples have amplified at the same fragment size, although I was not able to sequence the amplified samples, it is possible that the fragments are from the same microsatellite region.

52
Figure 3: Image of RIO 13 gel. From right to left the lanes with microsatellite primer RIO 13 read as follows: 1) ladder, 6) otter tissue, 7) otter scat, 8) raccoon scat. This is not the best example, with the raccoon scat sample having multiple bands, but the sequences were the same, and one of the bands is almost exactly lined up with the otter samples.
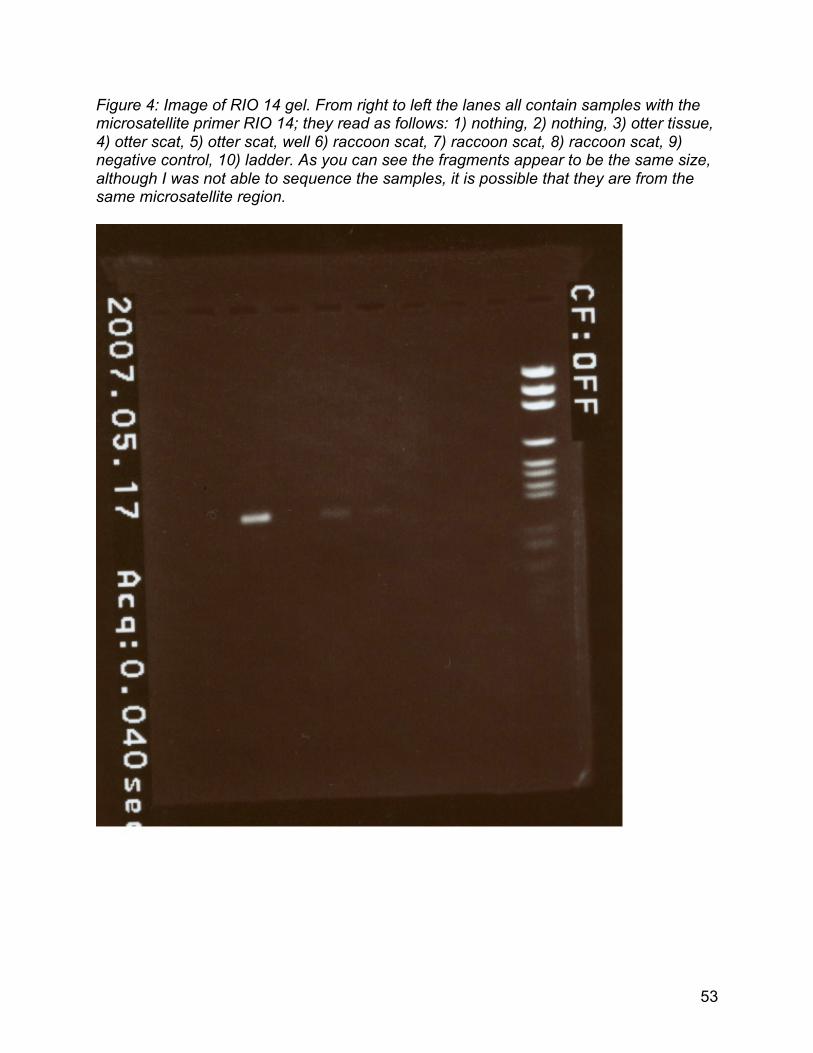
53
Figure 4: Image of RIO 14 gel. From right to left the lanes all contain samples with the microsatellite primer RIO 14; they read as follows: 1) nothing, 2) nothing, 3) otter tissue, 4) otter scat, 5) otter scat, well 6) raccoon scat, 7) raccoon scat, 8) raccoon scat, 9) negative control, 10) ladder. As you can see the fragments appear to be the same size, although I was not able to sequence the samples, it is possible that they are from the same microsatellite region.
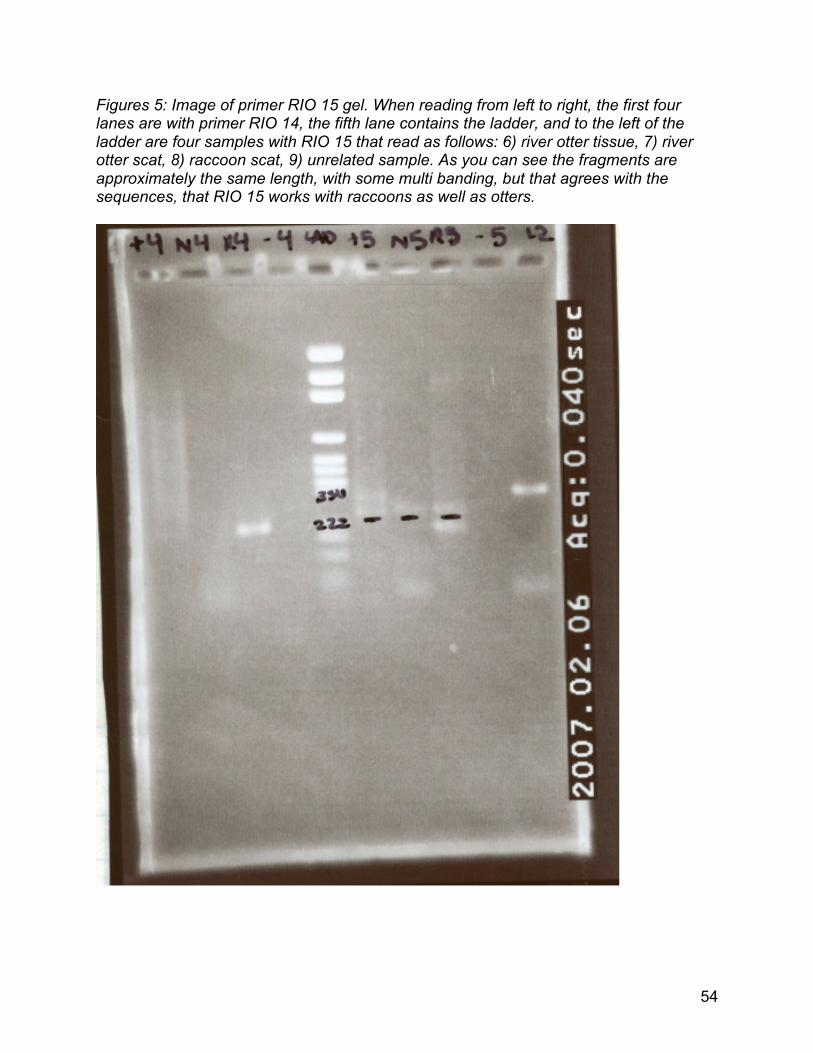
54
Figures 5: Image of primer RIO 15 gel. When reading from left to right, the first four lanes are with primer RIO 14, the fifth lane contains the ladder, and to the left of the ladder are four samples with RIO 15 that read as follows: 6) river otter tissue, 7) river otter scat, 8) raccoon scat, 9) unrelated sample. As you can see the fragments are approximately the same length, with some multi banding, but that agrees with the sequences, that RIO 15 works with raccoons as well as otters.
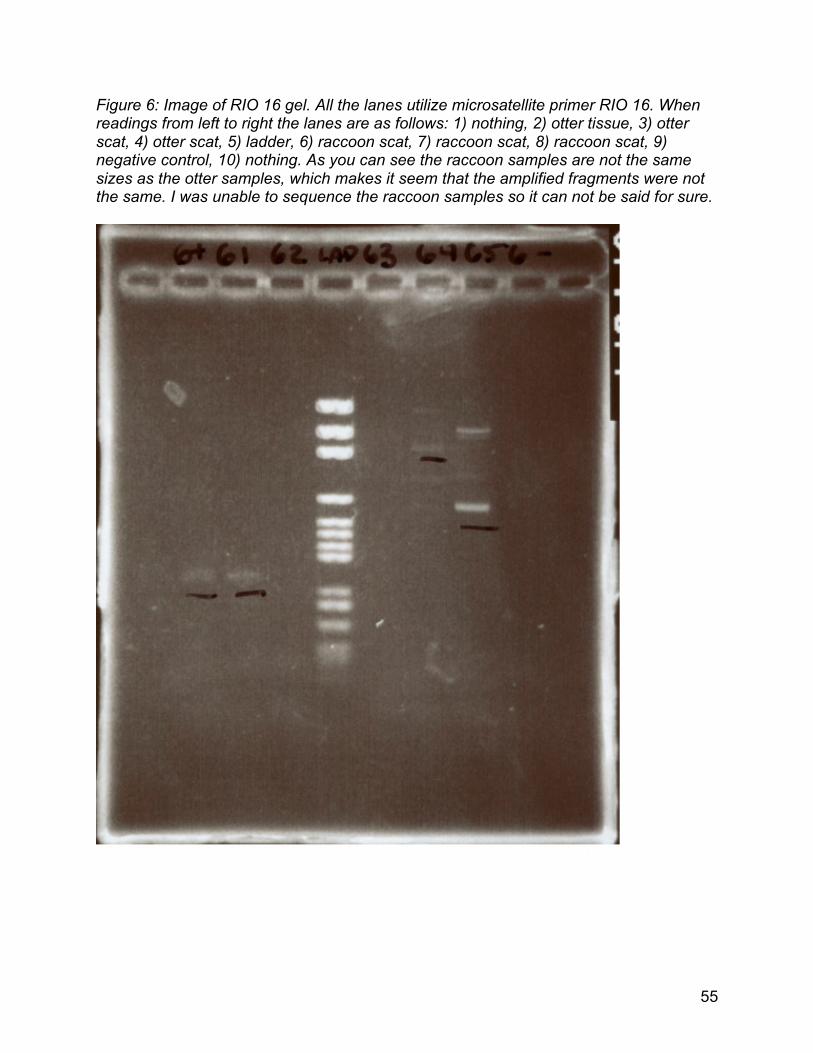
55
Figure 6: Image of RIO 16 gel. All the lanes utilize microsatellite primer RIO 16. When readings from left to right the lanes are as follows: 1) nothing, 2) otter tissue, 3) otter scat, 4) otter scat, 5) ladder, 6) raccoon scat, 7) raccoon scat, 8) raccoon scat, 9) negative control, 10) nothing. As you can see the raccoon samples are not the same sizes as the otter samples, which makes it seem that the amplified fragments were not the same. I was unable to sequence the raccoon samples so it can not be said for sure.
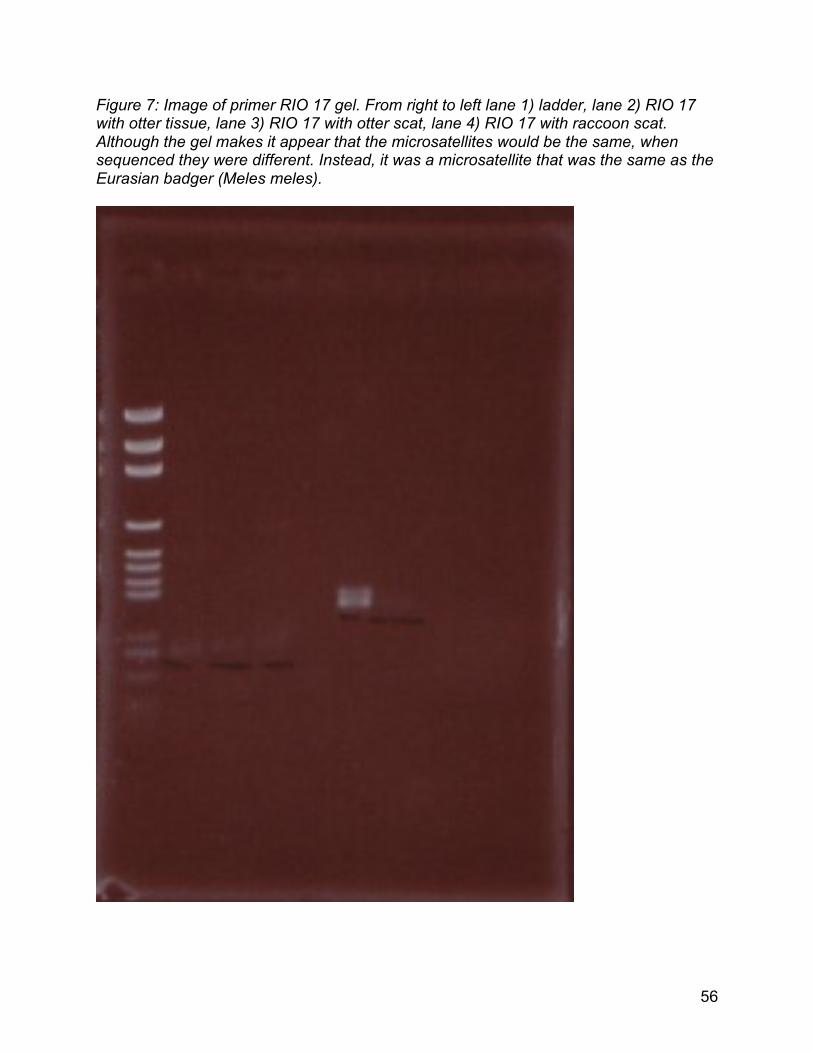
56
Figure 7: Image of primer RIO 17 gel. From right to left lane 1) ladder, lane 2) RIO 17 with otter tissue, lane 3) RIO 17 with otter scat, lane 4) RIO 17 with raccoon scat. Although the gel makes it appear that the microsatellites would be the same, when sequenced they were different. Instead, it was a microsatellite that was the same as the Eurasian badger (Meles meles).

57
Figure 8: Image of RIO 18 gel. When reading from left to right the first 6 lanes are samples with the primer RIO 16. The starting at lane 7, the samples have RIO 18 and are as follows: 7) raccoon scat, 8) raccoon scat, 9) raccoon scat, 10) otter scat, 11) negative control, 12) ladder. Even though the fragments seem like they would be the same, when sequenced they are not the same microsatellite.

58
Figure 19: Image of RIO 19 gel. When reading from left to right the lanes all contain samples with the following. In lane: 1) nothing, 2) otter tissue, 3) otter scat, 4) otter scat, 5) raccoon scat, 6) raccoon scat, 7) raccoon scat, 8) negative control, 9) ladder 10) nothing. As you can see the fragments all appear to be the same based on size. When sequenced they were indeed the same microsatellite region.

59
Figure 10: Image of RIO 20 gel. When reading from right to left the lanes with samples containing the RIO 20 are as follows: 1) otter tissue, 2) otter scat, 3) otter scat, 4) raccoon scat, 5) raccoon scat, 6) raccoon scat, 7) negative control, 8) nothing, 9) nothing, 10) ladder. Although the raccoon sample in lane 6 is considerably larger than the raccoon sample in lane 4), displaying somewhat inconclusive results, the fragments, when sequenced are from the same microsatellite.