Embed Size (px)
Citation preview
MONTANA AIR QUALITY PERMIT APPLICATION
OTTER CREEK MINE
OTTER CREEK COAL, LLC
Prepared for:
Otter Creek Coal, LLC P.O. Box 7152
Billings, MT 59108-7152
Prepared by:
Bison Engineering, Inc. 1400 11th Avenue Helena, MT 59601
(406) 442-5768 www.bison-eng.com
Submitted: November 6, 2014
Otter Creek Coal Mine Page ii MAQP Application OCC212408
TABLE OF CONTENTS
1.0 INTRODUCTION .................................................................................................. 1 1.1 Background ....................................................................................................... 1 1.2 Current Action ................................................................................................... 3
2.0 PROJECT DESCRIPTION ................................................................................... 4
2.1 Tract 2 ............................................................................................................... 6 2.2 Process Description .......................................................................................... 8
3.0 EMISSION INVENTORY .................................................................................... 13
3.1 Criteria Pollutant Emission Inventory .............................................................. 16 3.1.1 Emission Point 1a Topsoil Removal .......................................................... 19 3.1.2 Emission Point 1b Topsoil Dumping .......................................................... 20 3.1.3 Emission Point 2 Overburden Drilling ........................................................ 22 3.1.4 Emission Point 3A Overburden Blasting .................................................... 23 3.1.5 Emission Point 3B Overburden Blasting – Cast Blasting ........................... 25 3.1.6 Emission Point 4a Overburden Removal by Dragline ................................ 26 3.1.7 Emission Point 4b Overburden Removal by Truck and Shovel ................. 28 3.1.8 Emission Point 4c Overburden Dumping from Truck ................................. 30 3.1.9 Emission Point 4d Overburden Handling by Dozer ................................... 31 3.1.10 Emission Point 5a Permanent Haul Roads - Travel .................................. 33 3.1.11 Emission Point 5b Temporary Haul Roads - Travel ................................... 34 3.1.12 Emission Point 5c Graders - Travel ........................................................... 36 3.1.13 Emission Point 6 Access Roads - Unpaved .............................................. 37 3.1.14 Emission Point 7 Coal Drilling ................................................................... 38 3.1.15 Emission Point 8 Coal Blasting .................................................................. 40 3.1.16 Emission Point 9 Coal Removal ................................................................ 41 3.1.17 Emission Point 10 Coal Dumping – Truck Dump ....................................... 44 3.1.18 Emission Point 11 Primary Crusher ........................................................... 46 3.1.19 Emission Point 12 Secondary Crusher ...................................................... 47 3.1.20 Emission Point 13 Conveyors.................................................................... 48 3.1.21 Emission Point 14a Diesel-fired Mobile, Portable and Stationary
Equipment ................................................................................................. 51 3.1.22 Emission Point 14b Gasoline-fired Mobile, Portable and Stationary
Equipment ................................................................................................. 53 3.1.23 Emission Point 15 Explosives.................................................................... 56 3.1.24 Emission Point 16 Train Loadout ............................................................... 57 3.1.25 Emission Point 17a Disturbed Acres – Pits, Peaks, and Soil
Stripping .................................................................................................... 59 3.1.26 Emission Point 17b Disturbed Acres – Partially Disturbed (<1 Year) ........ 60 3.1.27 Emission Point 17c Disturbed Acres – Partially Disturbed (>1 Year) ........ 61 3.1.28 Emission Point 17d Disturbed Acres – Complete (>2 Years) .................... 62 3.1.29 Emission Point 18 Locomotive Emissions ................................................. 63
Otter Creek Coal Mine Page iii MAQP Application OCC212408
3.2 Hazardous Pollutant Emission Inventory ........................................................ 66 3.2.1 Emission Point 14a Diesel-fired Mobile, Portable and Stationary
Equipment ................................................................................................. 68 3.2.2 Emission Point 18 Locomotive Emissions ................................................. 68
4.0 REGULATORY ANALYSIS ................................................................................ 70
4.1 General Provisions .......................................................................................... 70 4.2 Ambient Air Quality Standards ........................................................................ 71 4.3 Emission Standards ........................................................................................ 71 4.3.1 Opacity ...................................................................................................... 71
4.3.2 Particulate Matter, Fuel Burning Equipment .............................................. 71 4.3.3 Particulate Matter, Industrial Processes .................................................... 71
4.4 New Source Performance Standards (40 CFR 60, Stationary Sources) ......... 72 4.4.1 NSPS – Subpart Y – Standards of Performance for Coal Preparation
Plants ........................................................................................................ 72 4.5 Emission Standards for Hazardous Air Pollutants for Source Categories
(NESHAP – 40 CFR 63) ................................................................................. 72 4.5.1 NESHAP – Subpart A ................................................................................ 72 4.5.2 NESHAP – Subpart ZZZZ ......................................................................... 73
4.6 Air Quality Permit Application, Operation, and Open Burning Fees ................ 73 4.7 Outdoor Burning.............................................................................................. 73 4.8 Permit, Construction and Operation of Air Contaminant Sources ................... 73 4.9 Best Available Control Technology (BACT) .................................................... 73 4.10 New Source Review (NSR) and Prevention of Significant Deterioration
(PSD) .............................................................................................................. 74 4.11 Operating Permit Program (Title V) ................................................................. 75 4.12 Greenhouse Gas (GHG) Tailoring Rule .......................................................... 75 4.13 Greenhouse Gas Mandatory Reporting Rule .................................................. 75
5.0 BACT ANALYSES .............................................................................................. 76
5.1 Sources Undergoing BACT Analysis .............................................................. 76 5.2 BACT Analyses for Sources with Add-On Control Technology ....................... 77
5.2.1 BACT Analysis Methodology for Sources with Add-on Control Technology ................................................................................................ 77
5.2.2 BACT for Particulate (PM, PM10, and PM2.5) Emissions from Crushing, Conveyor Transferring, Silo Storage, and Railcar Loading of Coal ....................................................................................................... 78
5.2.3 BACT for Particulate (PM, PM10, PM2.5) Emissions from Overburden and Coal Drilling ........................................................................................ 88
5.3 BACT Analyses for Sources Using Operational Standards, Work Practices, or Best Operating Practices ........................................................... 91
5.3.1 BACT for Gaseous (NO2, SO2, and CO) and Particulate (PM, PM10, PM2.5) Emissions from Explosives Detonation/Blasting ............................. 91
5.3.2 BACT for Particulate (PM, PM10, PM2.5) Emissions from Mine Activity– Material Handling and Removal .................................................. 93
Otter Creek Coal Mine Page iv MAQP Application OCC212408
5.3.3 BACT for Particulate (PM, PM10, PM2.5) Emissions from Disturbed Acreage Wind Erosion ............................................................................... 94
5.3.4 BACT for Fugitive Particulate (PM, PM10, PM2.5) Emissions from Roadways ................................................................................................. 95
5.3.5 BACT for Gaseous (NO2, SO2, and CO) and Particulate (PM, PM10, PM2.5) Emissions from Portable and Mobile Engine Equipment ................ 98
6.0 AIR QUALITY IMPACT DEMONSTRATION .................................................... 100
6.1 Introduction ................................................................................................... 100 6.2 Compliance with Short-Term Standards ....................................................... 101
6.2.1 Background and Rationale ...................................................................... 101 6.2.2 Technical Approach - Ambient Monitoring Data ...................................... 102
6.2.3 Ambient Particulate Data Analysis .......................................................... 104 6.2.4 Ambient NO2 Data Analysis .................................................................... 110
6.3 Compliance with Short and Long-Term Standards-Dispersion Modeling ...... 113 6.3.1 Model Selection ....................................................................................... 113 6.3.2 General Analysis Methodology ................................................................ 113 6.3.3 Meteorological Data ................................................................................ 114 6.3.4 Elevation Determination .......................................................................... 121 6.3.5 Boundary Determination .......................................................................... 122 6.3.6 Receptors ................................................................................................ 122 6.3.7 NOx to NO2 Conversion .......................................................................... 123 6.3.8 Dry Particle Deposition ............................................................................ 123 6.3.9 Location Coordinate Determinations ....................................................... 123 6.3.10 Operating Scenario to be Modeled .......................................................... 123 6.3.11 Modeled Source Parameters ................................................................... 124 6.3.12 Significant Impacts .................................................................................. 128
6.4 NAAQS/MAAQS Modeling Results ............................................................... 130
LIST OF TABLES Table 2-1: Projected Annual Production ......................................................................... 8 Table 3-1: Mine Production Rates to Achieve 35 Million TPY ...................................... 13 Table 3-2: OCC Proposed Emitting Sources ................................................................ 14 Table 3-3: Tract 2 Potential Emissions ......................................................................... 17 Table 3-4: Tract 2 Potential HAP Emissions ................................................................ 67 Table 4-1: Potentially Applicable Rules ........................................................................ 70 Table 5-1: Available Particulate Control Technologies ................................................. 79 Table 5-2: Control Technology Effectiveness Estimates .............................................. 81 Table 5-3: Available Particulate Control Technologies for Drilling ................................ 88 Table 5-4: Control Technology Effectiveness Estimates for Drilling ............................. 89 Table 5-5: Available Particulate Control Technologies for Roadway Fugitive Emissions ................................................................................................... 96 Table 6-1: Comparison of Projected Otter Creek Coal Mine Activities Versus Other Comparable Facilities/Groups ........................................................ 104
Otter Creek Coal Mine Page v MAQP Application OCC212408
Table 6-2: Montana Coal Mines: Decker/Spring Creek Complex Production and Historical Ambient Data ..................................................................... 105 Table 6-3: Rosebud Mine (WECO) – Historical Monitoring ........................................ 107 Table 6-4: Summary of Particulate Data for Representative Coal Mining Facilities ... 110 Table 6-5: Montana Ambient NO2 Data ...................................................................... 112 Table 6-6: On-Site Meteorological Station Monitoring Parameters ............................ 118 Table 6-7: On-Site Meteorological Station Monitoring Instruments ............................ 118 Table 6-8: On-Site Meteorological Data Completeness ............................................. 119 Table 6-9: Input Parameters for Particle Deposition Calculations .............................. 123 Table 6-10: List of Modeled Emission Sources .......................................................... 125 Table 6-11: Years 7-8 Modeled Sources Physical Parameters .................................. 126 Table 6-12: Years 16-18 Modeled Sources Physical Parameters .............................. 126 Table 6-13: Years 7-8 Significant Impact Modeling Results ....................................... 129 Table 6-14: Years 16-17 Significant Impact Modeling Results ................................... 129 Table 6-15: MDEQ Established Background Concentrations ..................................... 131 Table 6-16: Years 7-8 Otter Creek NAAQS/MAAQS Impacts Modeling Results ........ 131 Table 6-17: Years 16-17 Otter Creek NAAQS/MAAQS Impacts Modeling Results .... 132
LIST OF FIGURES Figure 1. Powder River Basin and Proposed Project Location ....................................... 2 Figure 2. Mine Sequence Map by Tract and Year .......................................................... 5 Figure 3. Tract 2 Mine Plan ............................................................................................ 7 Figure 4. Typical Mining Sequence .............................................................................. 10 Figure 5. Coal Processing System ............................................................................... 12
Otter Creek Coal Mine Page 1 MAQP Application OCC212408
1.0 INTRODUCTION Otter Creek Coal, LLC (OCC), is proposing the development of coal reserves at Otter Creek, Powder River County, Montana. OCC is filing this application with the Montana Department of Environmental Quality (MDEQ) for a Montana Air Quality Permit (MAQP) to construct and operate a coal mine in the area that comprises the major portion of Otter Creek Tract 2. Some adjacent areas will also be used for supporting mine facilities.
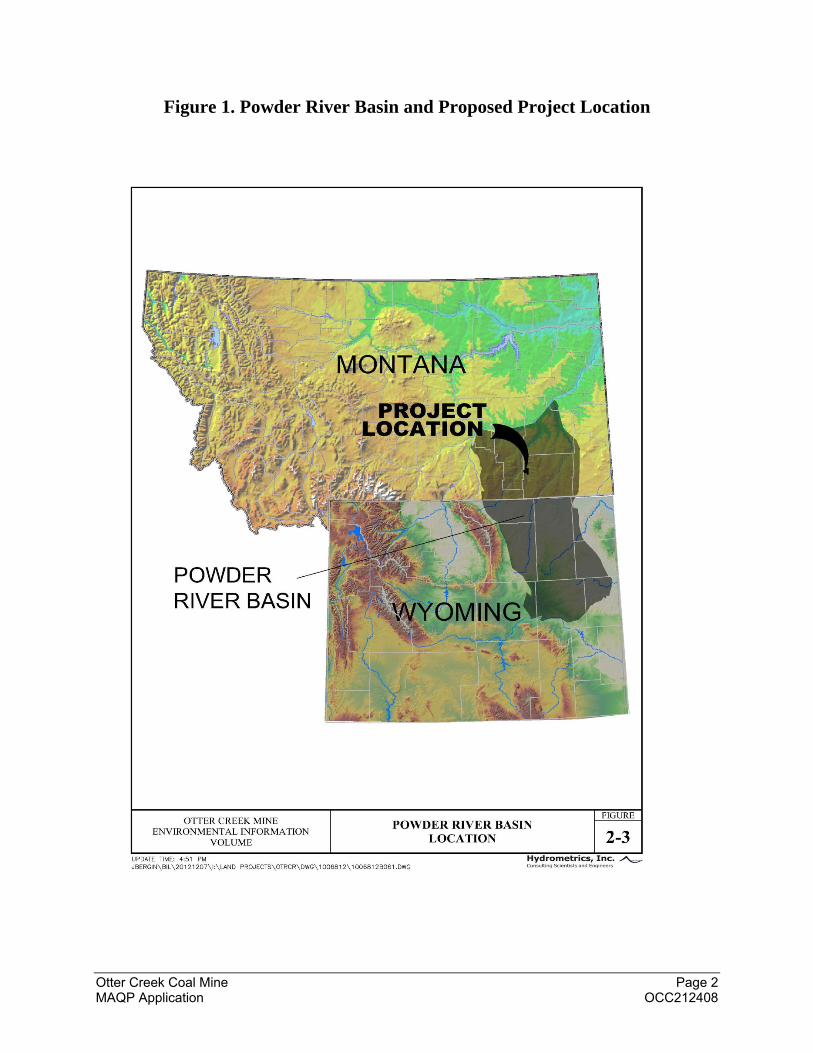
1.1 Background Interest in development of coal reserves at Otter Creek, in the northern Powder River Basin, dates back to the early 1970s. (See Figure 1.) The area of the Otter Creek Coal tracts is within the “checkerboard” land ownership pattern which resulted from railroad land grants in the late 1800s. Alternate sections were transferred by the United States to the Northern Pacific Railroad within a wide corridor along the railroad alignment as a construction incentive. The intervening sections remaining in federal ownership were, for the most part, settled under a series of Homestead Acts, with the coal rights retained by the United States. Much of the railroad surface was sold also, with the coal rights retained. Surface and coal formerly in railroad ownership is now owned by Great Northern Properties LP (GNP). Numerous exploration holes have been drilled by various entities, most notably the US Geological Survey and the Montana Bureau of Mines and Geology. On May 28, 2002, coal rights within the tracts were transferred by the United States to the State of Montana, as compensation for the economic opportunity foregone with the abandonment of the Crown Butte gold project north of Yellowstone National Park in 1996. The general result is that coal rights on even-numbered sections within the tracts are owned by the State of Montana. (Sections 16 and 36 of each township have been in state ownership since statehood as “school” lands.) Coal in odd-numbered sections is owned by GNP, which also retains significant surface rights in the area. With the exception of “school” sections, surface areas overlying state-owned coal are mostly privately owned; several tracts remain in federal ownership and are administered by the Bureau of Land Management (BLM). In November, 2009, Ark Land Company entered into a coal lease agreement with GNP covering its privately owned coal resources on the Otter Creek Coal tracts. In March 2010, Ark Land Company was the successful bidder for the State of Montana’s coal interests in the even-numbered sections, and leases were issued April 20, 2010. These combined coal lease interests comprise approximately 17,900 contiguous acres, containing an estimated 1.5 billion tons of surface-mineable coal.
Otter Creek Coal Mine Page 2 MAQP Application OCC212408
Figure 1. Powder River Basin and Proposed Project Location
Otter Creek Coal Mine Page 3 MAQP Application OCC212408
1.2 Current Action The OCC mine will be classified as a minor stationary source of air pollutant emissions for the purposes of the New Source Review - Prevention of Significant Deterioration (NSR-PSD) regulations. OCC is submitting this application for a minor source MAQP. This application is intended to satisfy the requirements of the Administrative Rules of Montana (ARM) 17.8 Subchapter 7 by providing the following information:
• A description of the proposed facility and planned operations (Section 2).
• An analysis of potential pollutant emission rates from fugitive and point sources (Section 3). Detailed emissions calculations are also provided in Appendix C.
• An analysis of state and federal air quality regulations that will potentially apply to the facility and its operations (Section 4).
• An evaluation and identification of best available control technologies (BACT) for applicable emissions sources and pollutants (Section 5).
• An analysis of potential impacts of the proposed facility and operations on local ambient air quality (Section 6).
• Completed MAQP application forms (Appendix A) including: o A certification of truth, accuracy, and completeness signed by a responsible
official of the applicant company. o Proof of public notice as required by ARM 17.8.748(7).
• Maps and proposed mining plan diagram (Appendix B).
• Emission Inventory (Appendix C)
• PM10 and PM2.5 Background Concentration Data (Appendix D)
• Emission Modeling Electronic Files (Appendix E)
• Air quality permit application fee in the amount prescribed by ARM 17.8.504.

Otter Creek Coal Mine Page 4 MAQP Application OCC212408
2.0 PROJECT DESCRIPTION OCC intends to develop Tracts 1, 2, and 3 as shown in the Mine Sequence map, Figure 2. OCC will develop Tract 2 for (approximately) the first 17-19 years and Tract 3 during years 19 to 40-41. Tract 1 development is proposed from (approximately) year 40 to year 55. It will be necessary to conduct baseline studies and develop detailed mining and reclamation plans for Tract 3 and Tract 1 to obtain permits prior to mining these tracts in the future. The current MAQP application is for development and operation of Tract 2 to produce up to 35 million tons of coal per year. Figure 2 depicts the proposed mine sequence by both tract and year.

Otter Creek Coal Mine Page 5 MAQP Application OCC212408
This page is reserved for foldout of mine sequence map referenced above as Figure 2. File name: Layout Name sequence: MAP 1 Title: Mine Sequence

Otter Creek Coal Mine Page 6 MAQP Application OCC212408
2.1 Tract 2 OCC proposes to initiate development of the tracts by mining in Tract 2. (See Figure 3 Tract 2 Mine Plan.) The mine is designed with an anticipated average production rate of 21 million tons per year from the Knobloch coal seam for the life of the operation. Total production from Tract 2 is projected at 313 million tons over 19 years. As the pit advance approaches high overburden areas and the Custer National Forest boundary to the east in years 18-19, mining in Tract 2 will cease.

Otter Creek Coal Mine Page 7 MAQP Application OCC212408
This page is reserved for foldout of mine sequence map referenced above as Figure 3. File name: Layout Name sequence: MAP 8 Mine Plan Title: Mine Plan
Otter Creek Coal Mine Page 8 MAQP Application OCC212408
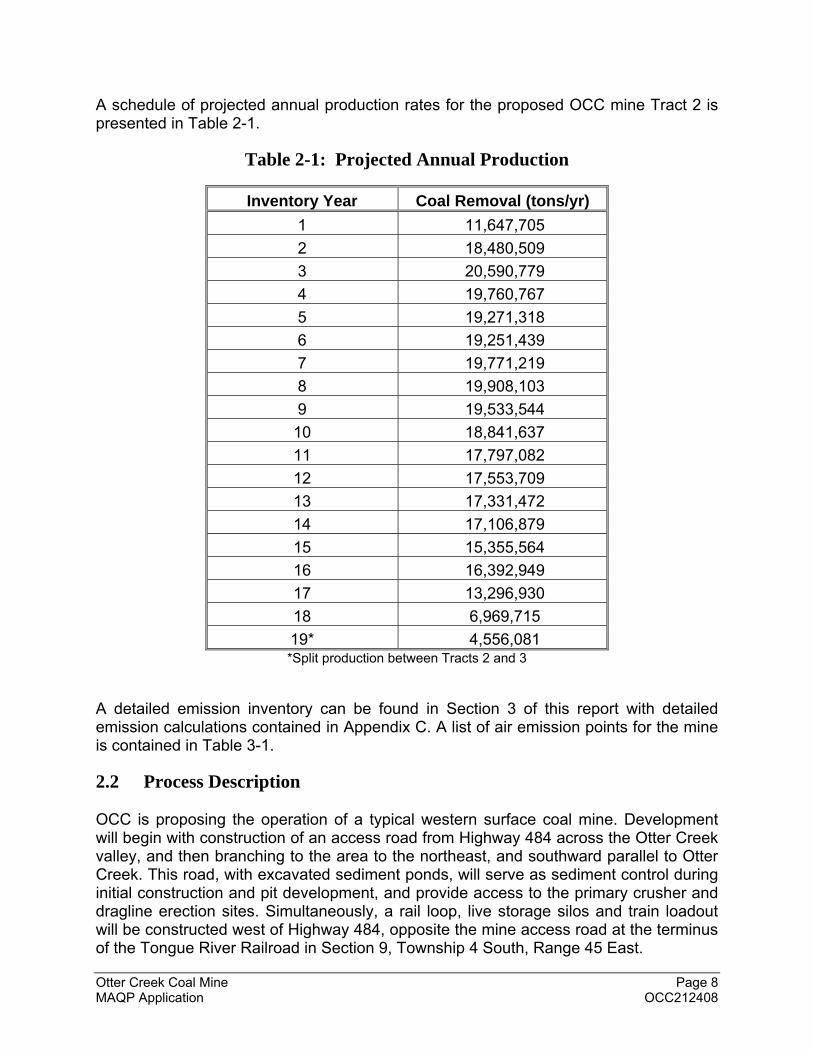
A schedule of projected annual production rates for the proposed OCC mine Tract 2 is presented in Table 2-1.
Table 2-1: Projected Annual Production
Inventory Year Coal Removal (tons/yr)
1 11,647,705
2 18,480,509
3 20,590,779
4 19,760,767
5 19,271,318
6 19,251,439
7 19,771,219
8 19,908,103
9 19,533,544
10 18,841,637
11 17,797,082
12 17,553,709
13 17,331,472
14 17,106,879
15 15,355,564
16 16,392,949
17 13,296,930
18 6,969,715
19* 4,556,081 *Split production between Tracts 2 and 3
A detailed emission inventory can be found in Section 3 of this report with detailed emission calculations contained in Appendix C. A list of air emission points for the mine is contained in Table 3-1.
2.2 Process Description OCC is proposing the operation of a typical western surface coal mine. Development will begin with construction of an access road from Highway 484 across the Otter Creek valley, and then branching to the area to the northeast, and southward parallel to Otter Creek. This road, with excavated sediment ponds, will serve as sediment control during initial construction and pit development, and provide access to the primary crusher and dragline erection sites. Simultaneously, a rail loop, live storage silos and train loadout will be constructed west of Highway 484, opposite the mine access road at the terminus of the Tongue River Railroad in Section 9, Township 4 South, Range 45 East.
Otter Creek Coal Mine Page 9 MAQP Application OCC212408
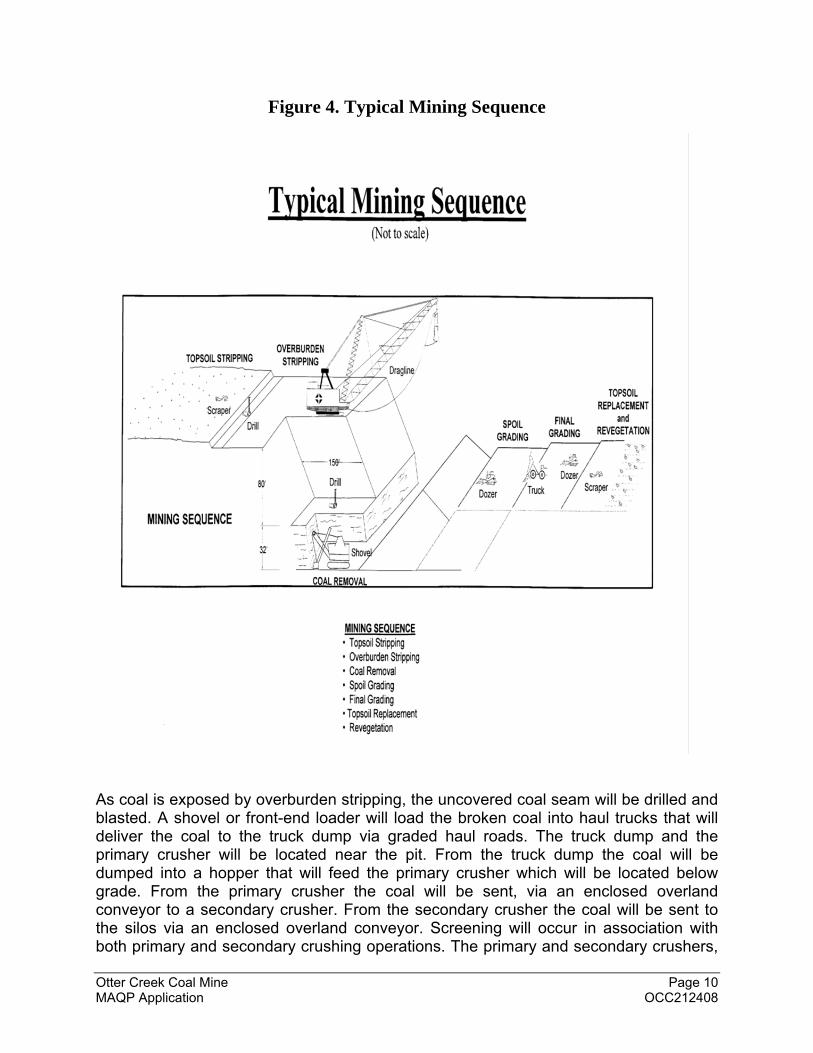
The following paragraphs discuss the sequence of surface coal mining to be used by OCC, and Figure 4 illustrates a typical mining sequence. Soil will be salvaged and placed in stockpiles for use in reclamation. Initial development activity will focus on construction of the access roads, rail loop, silos and train loadout, crushing and conveying system, and shops and office facilities. As the transportation and coal handling systems near completion, box cut development will initiate at mid-pit and, at the same time, dragline erection will begin in the same area. The box cut will be developed using mobile equipment – trucks and a shovel. Initially, box cut spoil will be placed in stockpiles in the northwest portion of the mine plan area where the coal has been mined out. When the box cut is established, it will cut off all drainage to Otter Creek from up-gradient areas to the east. As the box cut is backfilled by the dragline, spoil volume will not completely fill the pit due to the width of the box cut and volume of coal removed. Primary sediment control for the mining area will be established as incised ponds in the box cut footprint. These ponds will be sized sufficiently to accommodate pit dewatering, in addition to rainfall and snowmelt runoff, and their location adjacent to the main haul road will facilitate their use for dust control on haul roads. When the dragline is operational, it will begin stripping overburden in the south pit, casting spoil into the empty box cut, and advancing to the east. When there is a sufficient area of dragline spoil in the south, the north box cut will be excavated, with box cut spoil placed over dragline spoil in this low overburden area. The dragline will then move to the north, advancing the pit to align with the south pit (estimated to occur in approximately Year 5 of the mine plan). Salvaged soil will be redistributed and revegetated according to the reclamation plan. There will be no permanent storage or disposal of spoil; all spoil material will be utilized to restore to pre-mining topography. Soil remaining in stockpiles will be used for reclamation of the final pit. The final pit will be reclaimed by a combination of highwall borrow, pre-strip from active stripping areas, and fill from spoil stockpiles.
Otter Creek Coal Mine Page 10 MAQP Application OCC212408
Figure 4. Typical Mining Sequence
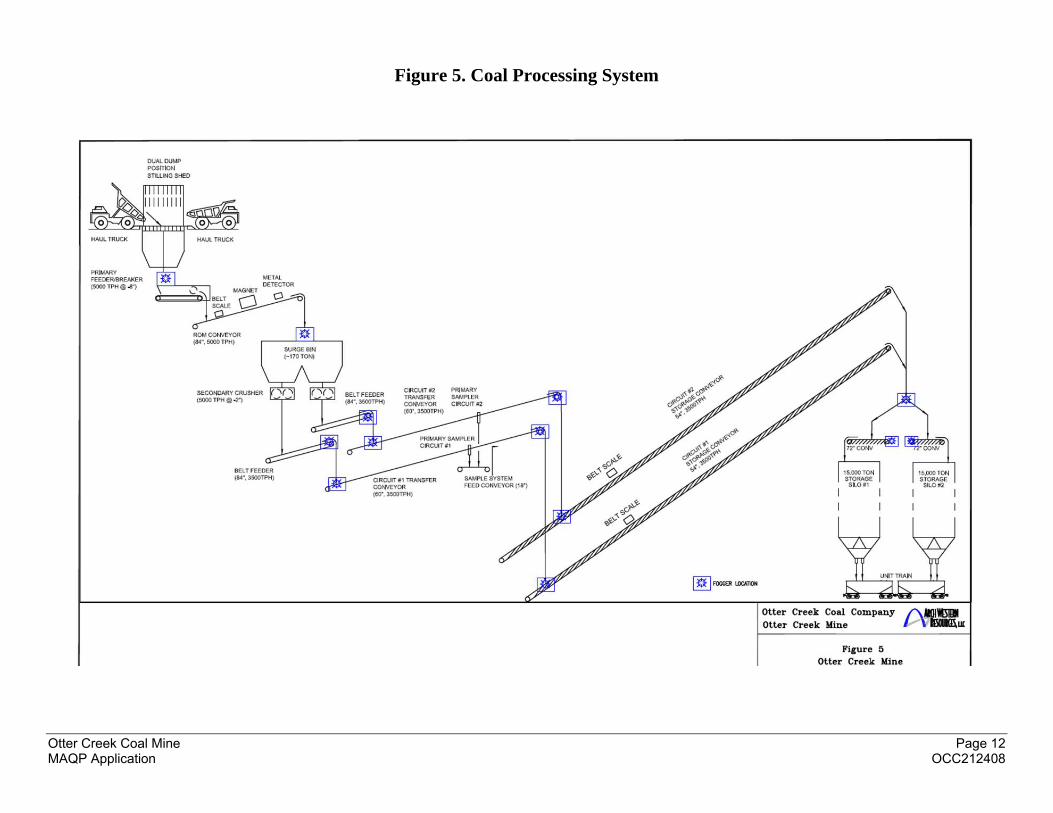
As coal is exposed by overburden stripping, the uncovered coal seam will be drilled and blasted. A shovel or front-end loader will load the broken coal into haul trucks that will deliver the coal to the truck dump via graded haul roads. The truck dump and the primary crusher will be located near the pit. From the truck dump the coal will be dumped into a hopper that will feed the primary crusher which will be located below grade. From the primary crusher the coal will be sent, via an enclosed overland conveyor to a secondary crusher. From the secondary crusher the coal will be sent to the silos via an enclosed overland conveyor. Screening will occur in association with both primary and secondary crushing operations. The primary and secondary crushers,

Otter Creek Coal Mine Page 11 MAQP Application OCC212408
screens, and conveyors will be controlled by a fogging dust suppression system. From the silos the coal will be loaded into railcars for shipment to market. (See Figure 5. Coal Processing System.)
Otter Creek Coal Mine Page 12 MAQP Application OCC212408
Figure 5. Coal Processing System
Otter Creek Coal Mine Page 13 MAQP Application OCC212408
3.0 EMISSION INVENTORY
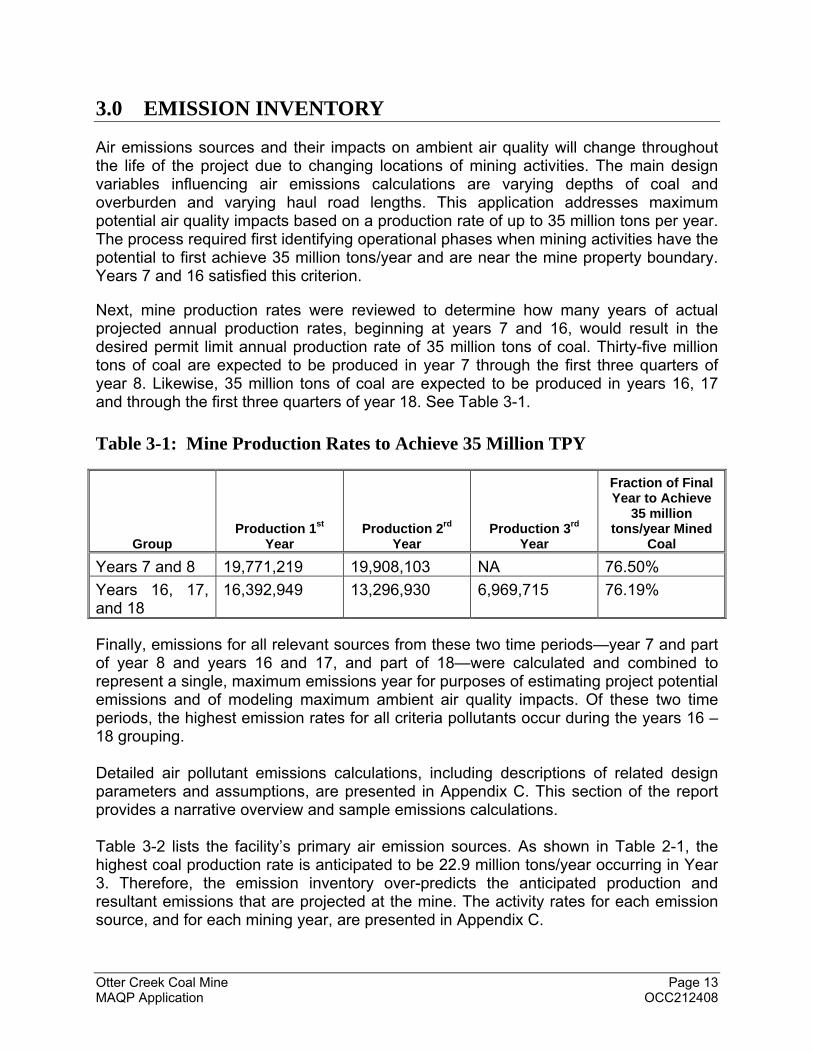
Air emissions sources and their impacts on ambient air quality will change throughout the life of the project due to changing locations of mining activities. The main design variables influencing air emissions calculations are varying depths of coal and overburden and varying haul road lengths. This application addresses maximum potential air quality impacts based on a production rate of up to 35 million tons per year. The process required first identifying operational phases when mining activities have the potential to first achieve 35 million tons/year and are near the mine property boundary. Years 7 and 16 satisfied this criterion.
Next, mine production rates were reviewed to determine how many years of actual projected annual production rates, beginning at years 7 and 16, would result in the desired permit limit annual production rate of 35 million tons of coal. Thirty-five million tons of coal are expected to be produced in year 7 through the first three quarters of year 8. Likewise, 35 million tons of coal are expected to be produced in years 16, 17 and through the first three quarters of year 18. See Table 3-1. Table 3-1: Mine Production Rates to Achieve 35 Million TPY
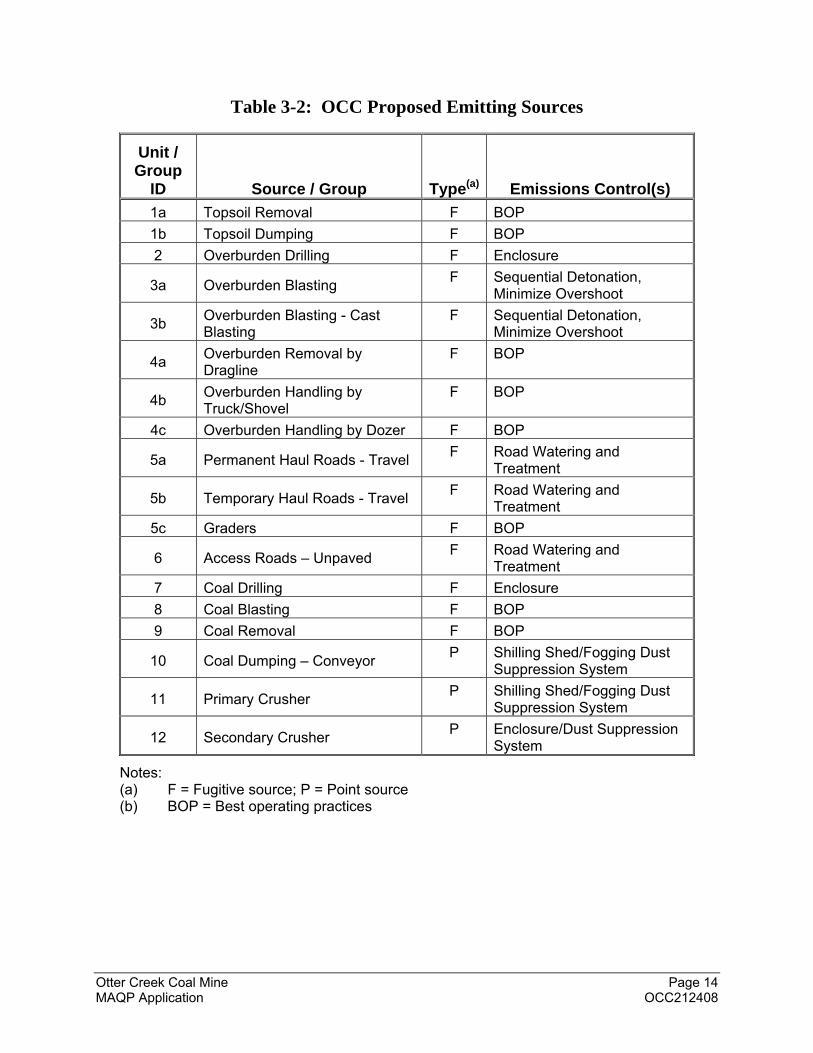
Finally, emissions for all relevant sources from these two time periods—year 7 and part of year 8 and years 16 and 17, and part of 18—were calculated and combined to represent a single, maximum emissions year for purposes of estimating project potential emissions and of modeling maximum ambient air quality impacts. Of these two time periods, the highest emission rates for all criteria pollutants occur during the years 16 – 18 grouping. Detailed air pollutant emissions calculations, including descriptions of related design parameters and assumptions, are presented in Appendix C. This section of the report provides a narrative overview and sample emissions calculations. Table 3-2 lists the facility’s primary air emission sources. As shown in Table 2-1, the highest coal production rate is anticipated to be 22.9 million tons/year occurring in Year 3. Therefore, the emission inventory over-predicts the anticipated production and resultant emissions that are projected at the mine. The activity rates for each emission source, and for each mining year, are presented in Appendix C.
Group Production 1st
Year Production 2rd
Year Production 3rd
Year
Fraction of Final Year to Achieve
35 million tons/year Mined
Coal
Years 7 and 8 19,771,219 19,908,103 NA 76.50%
Years 16, 17, and 18
16,392,949 13,296,930 6,969,715 76.19%
Otter Creek Coal Mine Page 14 MAQP Application OCC212408
Table 3-2: OCC Proposed Emitting Sources
Unit / Group
ID Source / Group Type(a) Emissions Control(s)
1a Topsoil Removal F BOP
1b Topsoil Dumping F BOP
2 Overburden Drilling F Enclosure
3a Overburden Blasting F Sequential Detonation,
Minimize Overshoot
3b Overburden Blasting - Cast Blasting
F Sequential Detonation, Minimize Overshoot
4a Overburden Removal by Dragline
F BOP
4b Overburden Handling by Truck/Shovel
F BOP
4c Overburden Handling by Dozer F BOP
5a Permanent Haul Roads - Travel F Road Watering and
Treatment
5b Temporary Haul Roads - Travel F Road Watering and
Treatment
5c Graders F BOP
6 Access Roads – Unpaved F Road Watering and
Treatment
7 Coal Drilling F Enclosure
8 Coal Blasting F BOP
9 Coal Removal F BOP
10 Coal Dumping – Conveyor P Shilling Shed/Fogging Dust
Suppression System
11 Primary Crusher P Shilling Shed/Fogging Dust
Suppression System
12 Secondary Crusher P Enclosure/Dust Suppression
System
Notes: (a) F = Fugitive source; P = Point source (b) BOP = Best operating practices
Otter Creek Coal Mine Page 15 MAQP Application OCC212408
Table 3-2: OCC Proposed Emitting Sources (Continued)
Unit / Group
ID Source / Group Type(a) Emissions Control(s)
13 Coal Conveyors P Enclosure/Dust Suppression
System
14a Mobile/Portable/Stationary– Diesel Engines
F EPA Tier 4 Engines and Low Sulfur Fuel
14b Mobile/Portable/Stationary– Gasoline Engines
F NSPS Subpart JJJJ
15 Explosives F BOP
16 Train Loadout F Enclosure/Dust Suppression
System
17a Disturbed Acres - Pits, Peaks, Soil Stripping
F Natural Moisture/Material Crusting
17b Disturbed Acres - Partial (<1 Yr) F Natural Moisture/Material
Crusting
17c Disturbed Acres - Partial (>1 Yr) F Revegetation
17d Disturbed Acres - Complete (>2 Yr)
F Revegetation
18 Locomotives F None
Notes: (c) F = Fugitive source; P = Point source (d) BOP = Best operating practices
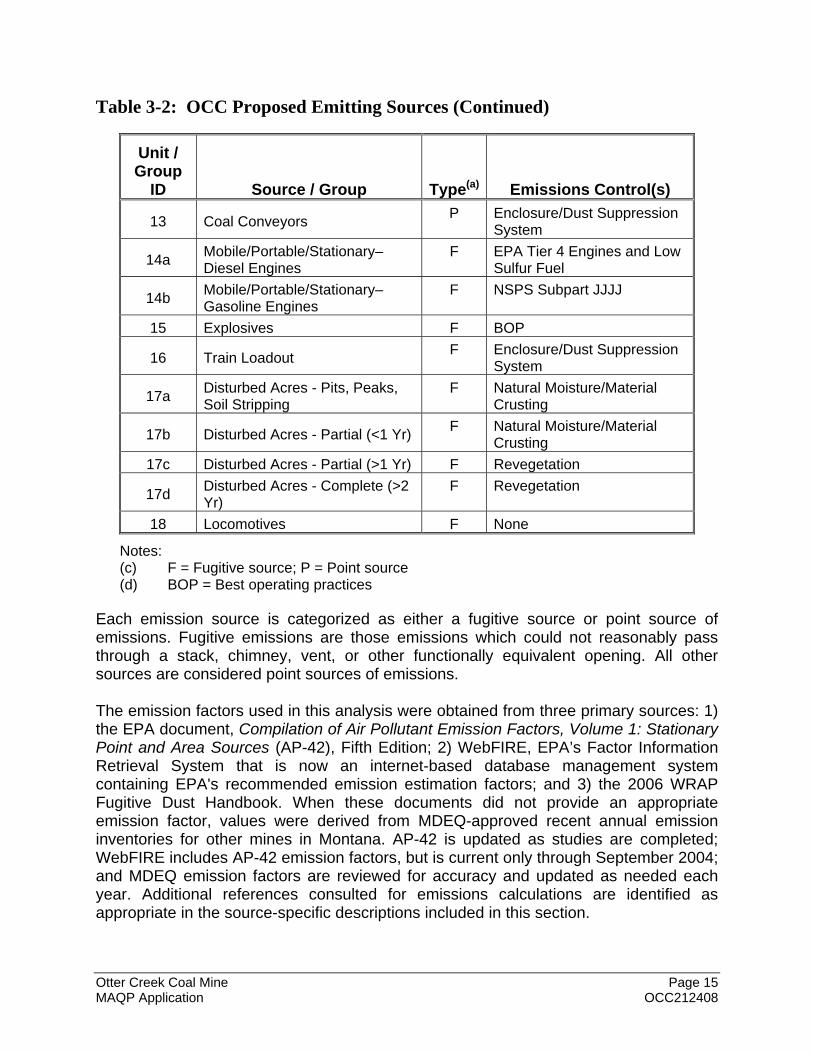
Each emission source is categorized as either a fugitive source or point source of emissions. Fugitive emissions are those emissions which could not reasonably pass through a stack, chimney, vent, or other functionally equivalent opening. All other sources are considered point sources of emissions. The emission factors used in this analysis were obtained from three primary sources: 1) the EPA document, Compilation of Air Pollutant Emission Factors, Volume 1: Stationary Point and Area Sources (AP-42), Fifth Edition; 2) WebFIRE, EPA’s Factor Information Retrieval System that is now an internet-based database management system containing EPA's recommended emission estimation factors; and 3) the 2006 WRAP Fugitive Dust Handbook. When these documents did not provide an appropriate emission factor, values were derived from MDEQ-approved recent annual emission inventories for other mines in Montana. AP-42 is updated as studies are completed; WebFIRE includes AP-42 emission factors, but is current only through September 2004; and MDEQ emission factors are reviewed for accuracy and updated as needed each year. Additional references consulted for emissions calculations are identified as appropriate in the source-specific descriptions included in this section.
Otter Creek Coal Mine Page 16 MAQP Application OCC212408
3.1 Criteria Pollutant Emission Inventory
The criteria air pollutants to be emitted from the OCC mine are: Nitrogen oxides (NOx), Particulate matter with an aerodynamic diameter less than 10 microns (PM10), Particulate matter with an aerodynamic diameter less than 2.5 microns (PM2.5), Sulfur dioxide (SO2), Volatile organic compounds (VOCs), and Carbon monoxide (CO).
OCC has also calculated potential emissions of particulate matter (PM) and greenhouse gases expressed as carbon dioxide equivalent (CO2e).
Table 3-3 summarizes the maximum potential emission rates resulting from a facility-wide production rate of 35 million tons/year.
Otter Creek Coal Mine Page 17 MAQP Application OCC212408
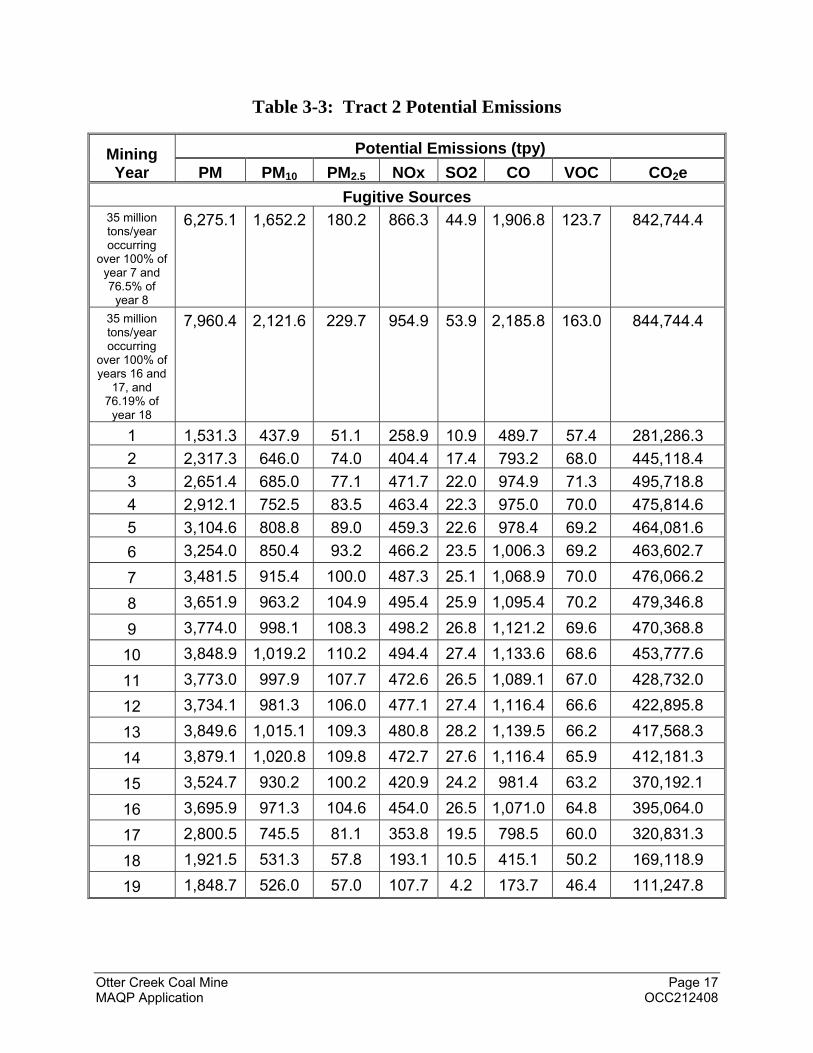
Table 3-3: Tract 2 Potential Emissions
Mining Year
Potential Emissions (tpy)
PM PM10 PM2.5 NOx SO2 CO VOC CO2e
Fugitive Sources 35 million tons/year occurring
over 100% of year 7 and 76.5% of
year 8
6,275.1 1,652.2 180.2 866.3 44.9 1,906.8 123.7 842,744.4
35 million tons/year occurring
over 100% of years 16 and
17, and 76.19% of
year 18
7,960.4 2,121.6 229.7 954.9 53.9 2,185.8 163.0 844,744.4
1 1,531.3 437.9 51.1 258.9 10.9 489.7 57.4 281,286.3
2 2,317.3 646.0 74.0 404.4 17.4 793.2 68.0 445,118.4
3 2,651.4 685.0 77.1 471.7 22.0 974.9 71.3 495,718.8
4 2,912.1 752.5 83.5 463.4 22.3 975.0 70.0 475,814.6
5 3,104.6 808.8 89.0 459.3 22.6 978.4 69.2 464,081.6
6 3,254.0 850.4 93.2 466.2 23.5 1,006.3 69.2 463,602.7
7 3,481.5 915.4 100.0 487.3 25.1 1,068.9 70.0 476,066.2
8 3,651.9 963.2 104.9 495.4 25.9 1,095.4 70.2 479,346.8
9 3,774.0 998.1 108.3 498.2 26.8 1,121.2 69.6 470,368.8
10 3,848.9 1,019.2 110.2 494.4 27.4 1,133.6 68.6 453,777.6
11 3,773.0 997.9 107.7 472.6 26.5 1,089.1 67.0 428,732.0
12 3,734.1 981.3 106.0 477.1 27.4 1,116.4 66.6 422,895.8
13 3,849.6 1,015.1 109.3 480.8 28.2 1,139.5 66.2 417,568.3
14 3,879.1 1,020.8 109.8 472.7 27.6 1,116.4 65.9 412,181.3
15 3,524.7 930.2 100.2 420.9 24.2 981.4 63.2 370,192.1
16 3,695.9 971.3 104.6 454.0 26.5 1,071.0 64.8 395,064.0
17 2,800.5 745.5 81.1 353.8 19.5 798.5 60.0 320,831.3
18 1,921.5 531.3 57.8 193.1 10.5 415.1 50.2 169,118.9
19 1,848.7 526.0 57.0 107.7 4.2 173.7 46.4 111,247.8
Otter Creek Coal Mine Page 18 MAQP Application OCC212408
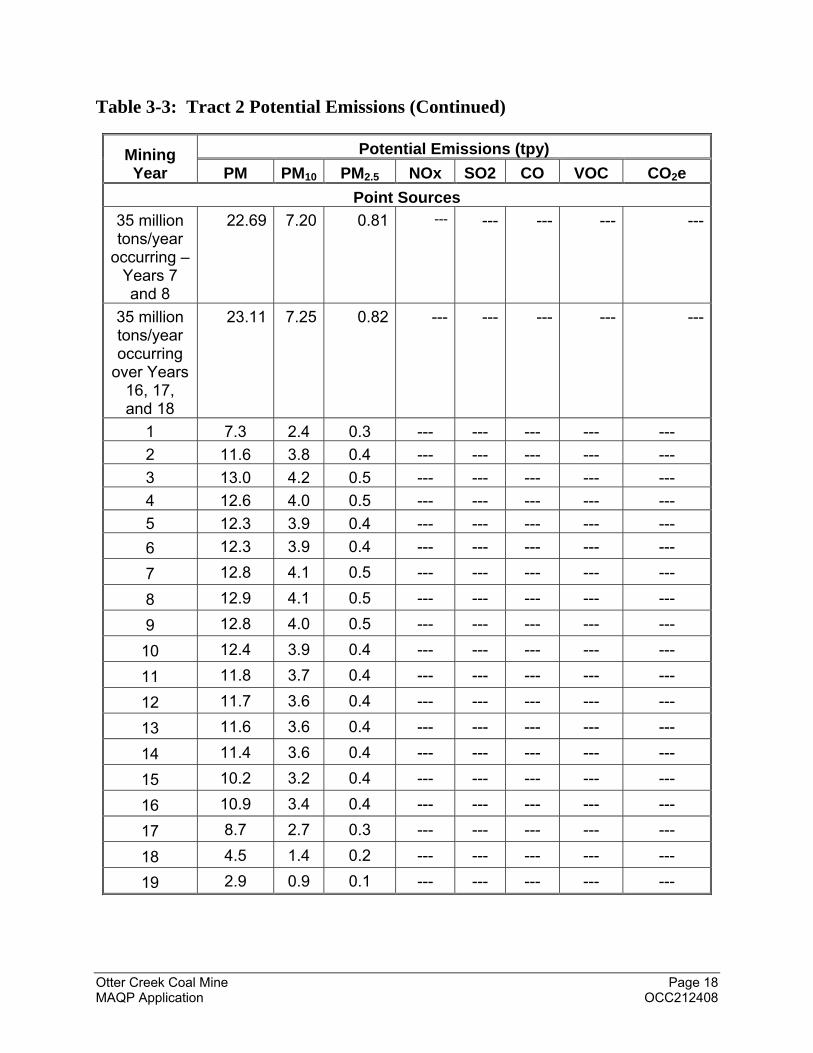
Table 3-3: Tract 2 Potential Emissions (Continued)
Mining Year
Potential Emissions (tpy)
PM PM10 PM2.5 NOx SO2 CO VOC CO2e
Point Sources
35 million tons/year
occurring – Years 7 and 8
22.69 7.20 0.81 --- --- --- --- ---
35 million tons/year occurring
over Years 16, 17, and 18
23.11 7.25 0.82 --- --- --- --- ---
1 7.3 2.4 0.3 --- --- --- --- ---
2 11.6 3.8 0.4 --- --- --- --- ---
3 13.0 4.2 0.5 --- --- --- --- ---
4 12.6 4.0 0.5 --- --- --- --- ---
5 12.3 3.9 0.4 --- --- --- --- ---
6 12.3 3.9 0.4 --- --- --- --- ---
7 12.8 4.1 0.5 --- --- --- --- ---
8 12.9 4.1 0.5 --- --- --- --- ---
9 12.8 4.0 0.5 --- --- --- --- ---
10 12.4 3.9 0.4 --- --- --- --- ---
11 11.8 3.7 0.4 --- --- --- --- ---
12 11.7 3.6 0.4 --- --- --- --- ---
13 11.6 3.6 0.4 --- --- --- --- ---
14 11.4 3.6 0.4 --- --- --- --- ---
15 10.2 3.2 0.4 --- --- --- --- ---
16 10.9 3.4 0.4 --- --- --- --- ---
17 8.7 2.7 0.3 --- --- --- --- ---
18 4.5 1.4 0.2 --- --- --- --- ---
19 2.9 0.9 0.1 --- --- --- --- ---
Otter Creek Coal Mine Page 19 MAQP Application OCC212408
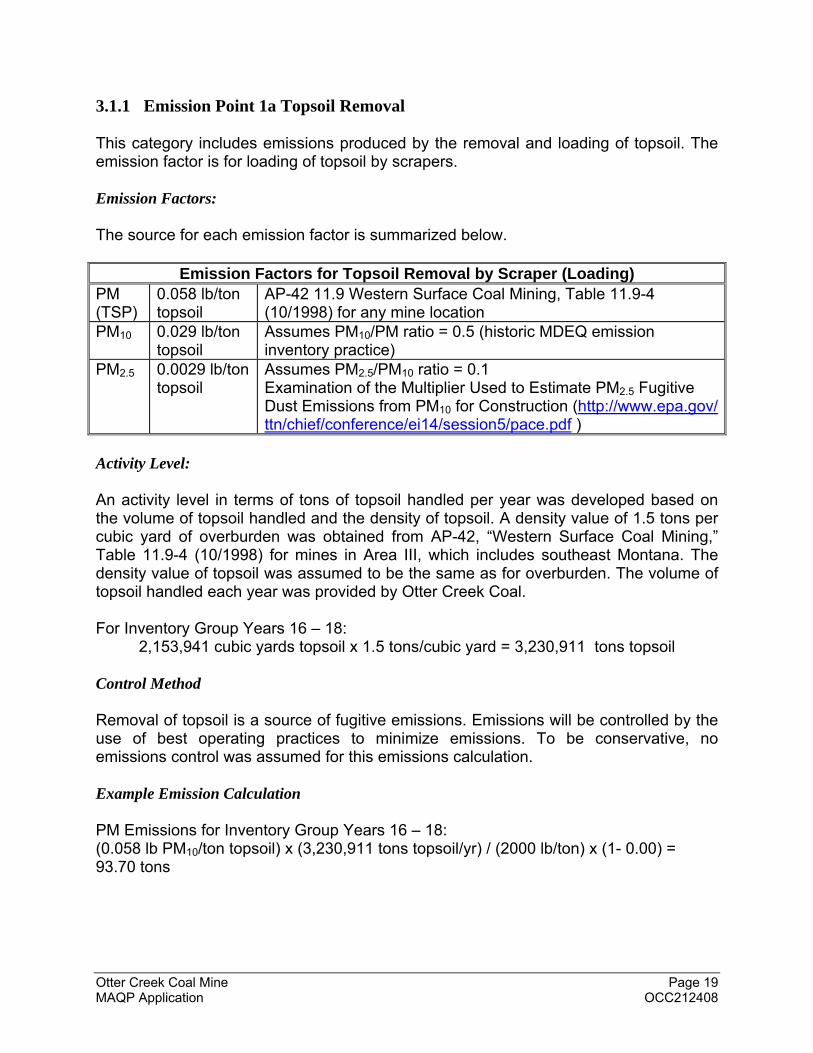
3.1.1 Emission Point 1a Topsoil Removal This category includes emissions produced by the removal and loading of topsoil. The emission factor is for loading of topsoil by scrapers. Emission Factors: The source for each emission factor is summarized below.
Emission Factors for Topsoil Removal by Scraper (Loading) PM (TSP)
0.058 lb/ton topsoil
AP-42 11.9 Western Surface Coal Mining, Table 11.9-4 (10/1998) for any mine location
PM10 0.029 lb/ton topsoil
Assumes PM10/PM ratio = 0.5 (historic MDEQ emission inventory practice)
PM2.5 0.0029 lb/ton topsoil
Assumes PM2.5/PM10 ratio = 0.1 Examination of the Multiplier Used to Estimate PM2.5 Fugitive Dust Emissions from PM10 for Construction (http://www.epa.gov/ ttn/chief/conference/ei14/session5/pace.pdf )
Activity Level: An activity level in terms of tons of topsoil handled per year was developed based on the volume of topsoil handled and the density of topsoil. A density value of 1.5 tons per cubic yard of overburden was obtained from AP-42, “Western Surface Coal Mining,” Table 11.9-4 (10/1998) for mines in Area III, which includes southeast Montana. The density value of topsoil was assumed to be the same as for overburden. The volume of topsoil handled each year was provided by Otter Creek Coal. For Inventory Group Years 16 – 18:
2,153,941 cubic yards topsoil x 1.5 tons/cubic yard = 3,230,911 tons topsoil
Control Method Removal of topsoil is a source of fugitive emissions. Emissions will be controlled by the use of best operating practices to minimize emissions. To be conservative, no emissions control was assumed for this emissions calculation. Example Emission Calculation PM Emissions for Inventory Group Years 16 – 18: (0.058 lb PM10/ton topsoil) x (3,230,911 tons topsoil/yr) / (2000 lb/ton) x (1- 0.00) = 93.70 tons
Otter Creek Coal Mine Page 20 MAQP Application OCC212408
PM10 Emissions for Inventory Group Years 16 – 18: (0.029 lb PM10/ton topsoil) x (3,230,911 tons topsoil) / (2000 lb/ton) x (1- 0.00) = 46.85 tons
PM2.5 Emissions for Inventory Group Years 16 – 18: (0.0029 lb PM2.5/ton topsoil) x (3,230,911 tons topsoil/yr) / (2000 lb/ton) x (1- 0.00) = 4.68 ton/yr
3.1.2 Emission Point 1b Topsoil Dumping This category includes emissions produced by the redistribution of topsoil in storage piles or placed on reclamation. The emission factor is for unloading of topsoil by scrapers. Emission Factors: As recommended in AP-42 on page 11.9.4, “Western Surface Coal Mining (10/98),” the emission factor is calculated using equation 13.2.4(1) of AP-42, “Aggregate Handling and Storage Piles (11/06),” which is shown below. Emission Factor = (k)(0.0032)(U/5)1.3/(M/2)1.4 lb/ton of material handled
Where: k = particle size multiplier
= 0.74 for PM (<30 g/m3) = 0.35 for PM10 = 0.053 for PM2.5
U = mean wind speed (miles per hour) = 7.7 miles per hour, mean for OCC 2012 onsite meteorological data
M = material moisture content, % = 3.4% per AP-42 Table 13.2.4-1 (Western Surface Coal Mining – Exposed Ground) Emission Factor for PM (<30 g/m3) = (0.74)(0.0032)(7.7/5)1.3/(3.4/2)1.4 = 0.00197 lb/ton Emission Factor for PM10 = (0.35)(0.0032)(7.7/5)1.3/(3.4/2)1.4 = 0.00093 lb/ton Emission Factor for PM2.5 = (0.053)(0.0032)(7.7/5)1.3/(3.4/2)1.4 = 0.00014 lb/ton
Otter Creek Coal Mine Page 21 MAQP Application OCC212408
Emission Factors for Topsoil Scraper Unloading (Redistribution) PM (TSP)
0.00197 lb/ton topsoil
AP-42 13.2.4 Aggregate Handling and Storage Piles (11/06) as recommended in AP-42 on page 11.9.4 Western Surface Coal Mining (10/98)
PM10 0.00093 lb/ton topsoil
AP-42 13.2.4 Aggregate Handling and Storage Piles (11/06) as recommended in AP-42 on page 11.9.4 Western Surface Coal Mining (10/98)
PM2.5 0.00014 lb/ton topsoil
AP-42 13.2.4 Aggregate Handling and Storage Piles (11/06) as recommended in AP-42 on page 11.9.4 Western Surface Coal Mining (10/98)
Activity Level: An activity level in terms of tons of topsoil handled per year was developed based on the volume of topsoil handled and the density of that topsoil. A density value of 1.5 tons per cubic yard of overburden was obtained from AP-42 Western Surface Coal Mining, Table 11.9-4 (10/1998) for mines in Area III, which includes southeast Montana. The density value of topsoil was assumed to be the same as for overburden. The volume of topsoil handled each year was provided by Otter Creek Coal. For Inventory Group Years 16 – 18
2,153,941 cubic yards topsoil x 1.5 tons/cubic yard = 3,230,911 tons topsoil
Control Method The dumping of topsoil is a fugitive source of emissions. Emission controls will include the use of best operating practices to minimize emissions. To be conservative, no emissions control was assumed for the emissions calculation. Example Emission Calculation PM Emissions for Inventory Group Years 16 – 18: (0.00197 lb PM/ton topsoil) x (3,230,911 tons topsoil) / (2000 lb/ton) x (1- 0.00) = 3.19 tons PM10 Emissions for Inventory Group Years 16 - 18: (0.00093 lb PM10/ton topsoil) x (3,230,911 tons topsoil) / (2000 lb/ton) x (1- 0.00) = 1.51 ton/yr
PM2.5 Emissions for Inventory Group Years 16 - 18: (0.00014 lb PM2.5/ton topsoil) x (3,230,911 tons topsoil / (2000 lb/ton) x (1- 0.00) = 0.23 ton/yr
Otter Creek Coal Mine Page 22 MAQP Application OCC212408
3.1.3 Emission Point 2 Overburden Drilling This category includes emissions produced by drilling holes into the overburden in preparation for blasting. Emission Factors: The source for each emission factor is summarized below.
Emission Factors for Overburden Drilling
PM (TSP)
1.30 lb/hole
AP-42 11.9 Western Surface Coal Mining, Table 11.9-4 (10/1998)
PM10 0.16 lb/hole
WebFIRE (2004) - This factor was present in AIRS Facility Subsystem Source Classification Codes and Emission Factor Listing for Criteria Air Pollutants, March 1990, EPA 450/4-90-003
PM2.5 0.016 lb/hole
Assumes PM2.5/PM10 ratio = 0.1
Examination of the Multiplier Used to Estimate PM2.5 Fugitive Dust Emissions from PM10 for Construction (http://www.epa.gov/ttn/chief/conference/ei14/session5/pace.pdf)
Activity Level: An activity level in terms of number of overburden holes drilled per year was provided by Otter Creek Coal. For Group Years 16 – 18, the value is 28,604 holes drilled. Control Method: The drilling of overburden holes is a fugitive source of emissions. Emissions are controlled by using a drilling enclosure. Because the drilling enclosure is not fully enclosed, its control efficiency can be estimated based on the reduction of wind speed achieved. An enclosure has the dual effect of preventing emissions from being released and preventing wind from dispersing the emissions. A 90% control efficiency can be supported by examining the transfer emissions equation in AP-42, Chapter 13.2.4, and the relationship it provides between particulate emission rate and wind speed. The equation is as follows: Emission Factor = (k)(0.0032)(U/5)1.3/(M/2)1.4 lb/ton of material handled.
Where: K = particle size multiplier
= 0.74 for PM (<30 g/m3) = 0.35 for PM10 = 0.053 for PM2.5
Otter Creek Coal Mine Page 23 MAQP Application OCC212408
U = mean wind speed (miles per hour) M = material moisture content, %
For constant particle size and material moisture content, the equation can be simplified using a new constant value ‘c’: Emission factor = c(U/5)1.3
This empirical equation is reported to be valid for wind speed conditions within a range of 1.3 to 15 mph. The average outdoor wind speed for the project area, as represented by data from the OCC meteorological station, is 7.7 mph. Assuming that the average wind speed within an enclosure is equal to the minimum wind speed for which the equation is valid, the enclosure efficiency relative to the unenclosed case is calculated as follows: Efficiency = [(7.7/5)1.3 - (1.3/5)1.3]/(7.7/5)1.3 * 100 = 90%
This equation yields a control efficiency value of 90% from enclosing the drilling particulate emission source. Example Emission Calculation: PM Emissions for Inventory Group Years 16 – 18: (1.30 lb PM/hole) x (286,804 holes) / (2000 lb/ton) x (1- 0.90) = 1.74 tons PM10 Emissions for Inventory Group Years 16 – 18: (0.16 lb PM2.5/hole) x (26,804 holes) / (2000 lb/ton) x (1- 0.90) = 0.21 ton
PM2.5 Emissions for Inventory Group Years 16 – 18: (0.0016 lb PM2.5/hole) x (26,804 holes) / (2000 lb/ton) x (1- 0.90) = 0.02 ton
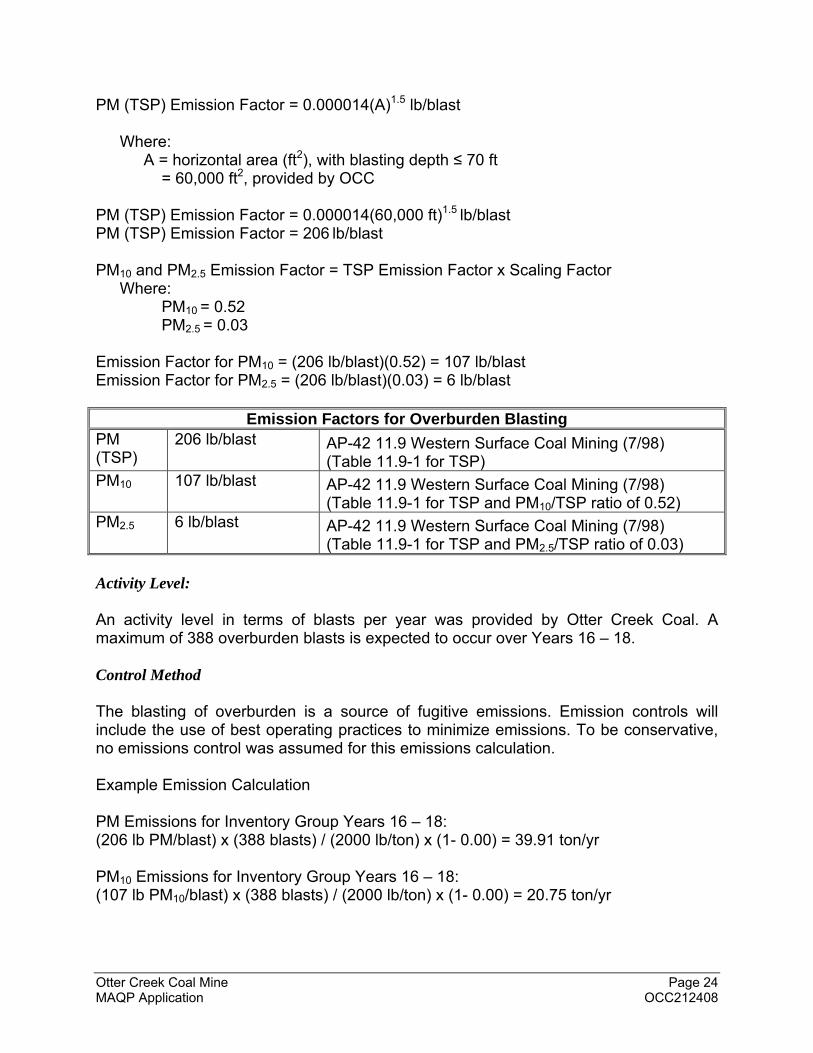
3.1.4 Emission Point 3A Overburden Blasting This category includes emissions produced by the blasting of overburden. Emission Factors: The emission factor for overburden blasting is calculated based on an equation found in AP-42, Table 11.9-1 Western Surface Coal Mining (10/98). The equation is used to calculate a TSP emission factor, and also includes scaling factors for PM10 and PM2.5.
The scaling factors should be multiplied by the TSP result to determine the PM10 and PM2.5 emissions.
Otter Creek Coal Mine Page 24 MAQP Application OCC212408
PM (TSP) Emission Factor = 0.000014(A)1.5 lb/blast
Where: A = horizontal area (ft2), with blasting depth ≤ 70 ft
= 60,000 ft2, provided by OCC
PM (TSP) Emission Factor = 0.000014(60,000 ft)1.5 lb/blast PM (TSP) Emission Factor = 206 lb/blast PM10 and PM2.5 Emission Factor = TSP Emission Factor x Scaling Factor
Where: PM10 = 0.52 PM2.5 = 0.03
Emission Factor for PM10 = (206 lb/blast)(0.52) = 107 lb/blast Emission Factor for PM2.5 = (206 lb/blast)(0.03) = 6 lb/blast
Emission Factors for Overburden Blasting PM (TSP)
206 lb/blast AP-42 11.9 Western Surface Coal Mining (7/98) (Table 11.9-1 for TSP)
PM10 107 lb/blast AP-42 11.9 Western Surface Coal Mining (7/98) (Table 11.9-1 for TSP and PM10/TSP ratio of 0.52)
PM2.5 6 lb/blast AP-42 11.9 Western Surface Coal Mining (7/98) (Table 11.9-1 for TSP and PM2.5/TSP ratio of 0.03)
Activity Level: An activity level in terms of blasts per year was provided by Otter Creek Coal. A maximum of 388 overburden blasts is expected to occur over Years 16 – 18. Control Method The blasting of overburden is a source of fugitive emissions. Emission controls will include the use of best operating practices to minimize emissions. To be conservative, no emissions control was assumed for this emissions calculation. Example Emission Calculation PM Emissions for Inventory Group Years 16 – 18: (206 lb PM/blast) x (388 blasts) / (2000 lb/ton) x (1- 0.00) = 39.91 ton/yr PM10 Emissions for Inventory Group Years 16 – 18: (107 lb PM10/blast) x (388 blasts) / (2000 lb/ton) x (1- 0.00) = 20.75 ton/yr
Otter Creek Coal Mine Page 25 MAQP Application OCC212408
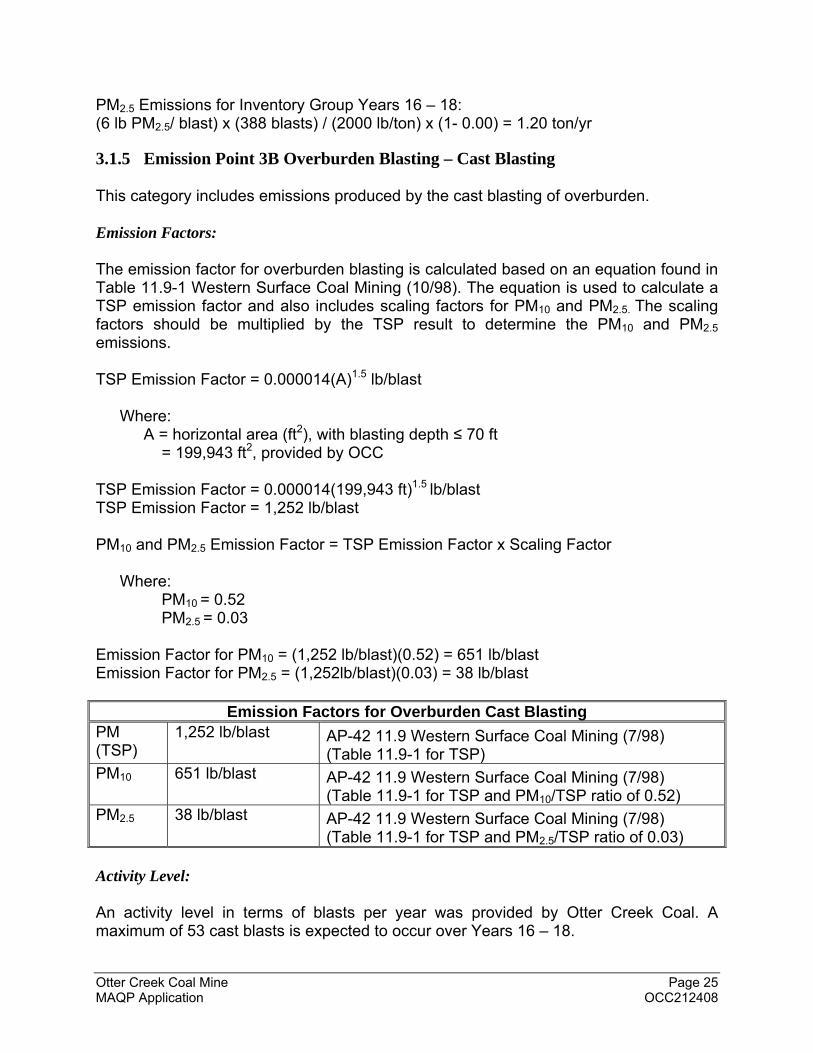
PM2.5 Emissions for Inventory Group Years 16 – 18: (6 lb PM2.5/ blast) x (388 blasts) / (2000 lb/ton) x (1- 0.00) = 1.20 ton/yr
3.1.5 Emission Point 3B Overburden Blasting – Cast Blasting This category includes emissions produced by the cast blasting of overburden. Emission Factors: The emission factor for overburden blasting is calculated based on an equation found in Table 11.9-1 Western Surface Coal Mining (10/98). The equation is used to calculate a TSP emission factor and also includes scaling factors for PM10 and PM2.5. The scaling factors should be multiplied by the TSP result to determine the PM10 and PM2.5
emissions. TSP Emission Factor = 0.000014(A)1.5 lb/blast
Where: A = horizontal area (ft2), with blasting depth ≤ 70 ft
= 199,943 ft2, provided by OCC
TSP Emission Factor = 0.000014(199,943 ft)1.5 lb/blast TSP Emission Factor = 1,252 lb/blast PM10 and PM2.5 Emission Factor = TSP Emission Factor x Scaling Factor
Where: PM10 = 0.52 PM2.5 = 0.03
Emission Factor for PM10 = (1,252 lb/blast)(0.52) = 651 lb/blast Emission Factor for PM2.5 = (1,252lb/blast)(0.03) = 38 lb/blast
Emission Factors for Overburden Cast Blasting PM (TSP)
1,252 lb/blast AP-42 11.9 Western Surface Coal Mining (7/98) (Table 11.9-1 for TSP)
PM10 651 lb/blast AP-42 11.9 Western Surface Coal Mining (7/98) (Table 11.9-1 for TSP and PM10/TSP ratio of 0.52)
PM2.5 38 lb/blast AP-42 11.9 Western Surface Coal Mining (7/98) (Table 11.9-1 for TSP and PM2.5/TSP ratio of 0.03)
Activity Level: An activity level in terms of blasts per year was provided by Otter Creek Coal. A maximum of 53 cast blasts is expected to occur over Years 16 – 18.
Otter Creek Coal Mine Page 26 MAQP Application OCC212408
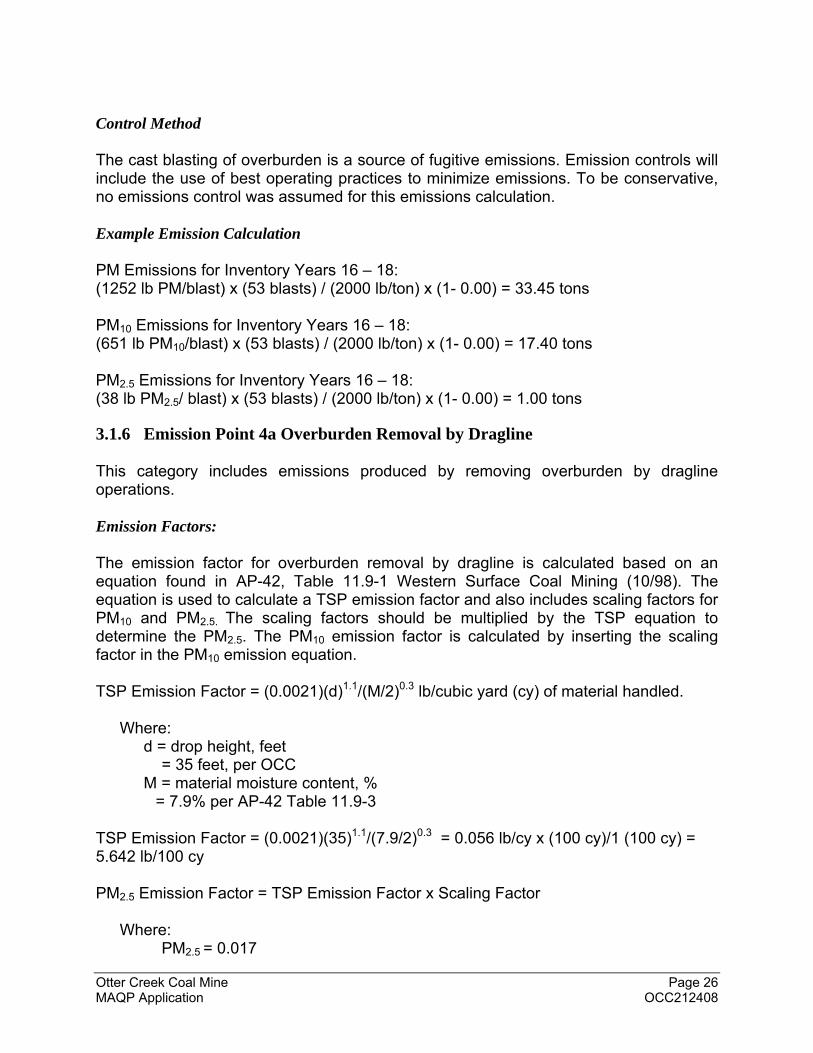
Control Method The cast blasting of overburden is a source of fugitive emissions. Emission controls will include the use of best operating practices to minimize emissions. To be conservative, no emissions control was assumed for this emissions calculation. Example Emission Calculation PM Emissions for Inventory Years 16 – 18: (1252 lb PM/blast) x (53 blasts) / (2000 lb/ton) x (1- 0.00) = 33.45 tons PM10 Emissions for Inventory Years 16 – 18: (651 lb PM10/blast) x (53 blasts) / (2000 lb/ton) x (1- 0.00) = 17.40 tons
PM2.5 Emissions for Inventory Years 16 – 18: (38 lb PM2.5/ blast) x (53 blasts) / (2000 lb/ton) x (1- 0.00) = 1.00 tons
3.1.6 Emission Point 4a Overburden Removal by Dragline This category includes emissions produced by removing overburden by dragline operations. Emission Factors: The emission factor for overburden removal by dragline is calculated based on an equation found in AP-42, Table 11.9-1 Western Surface Coal Mining (10/98). The equation is used to calculate a TSP emission factor and also includes scaling factors for PM10 and PM2.5. The scaling factors should be multiplied by the TSP equation to determine the PM2.5. The PM10 emission factor is calculated by inserting the scaling factor in the PM10 emission equation. TSP Emission Factor = (0.0021)(d)1.1/(M/2)0.3 lb/cubic yard (cy) of material handled.
Where: d = drop height, feet
= 35 feet, per OCC M = material moisture content, %
= 7.9% per AP-42 Table 11.9-3 TSP Emission Factor = (0.0021)(35)1.1/(7.9/2)0.3 = 0.056 lb/cy x (100 cy)/1 (100 cy) = 5.642 lb/100 cy PM2.5 Emission Factor = TSP Emission Factor x Scaling Factor
Where: PM2.5 = 0.017
Otter Creek Coal Mine Page 27 MAQP Application OCC212408
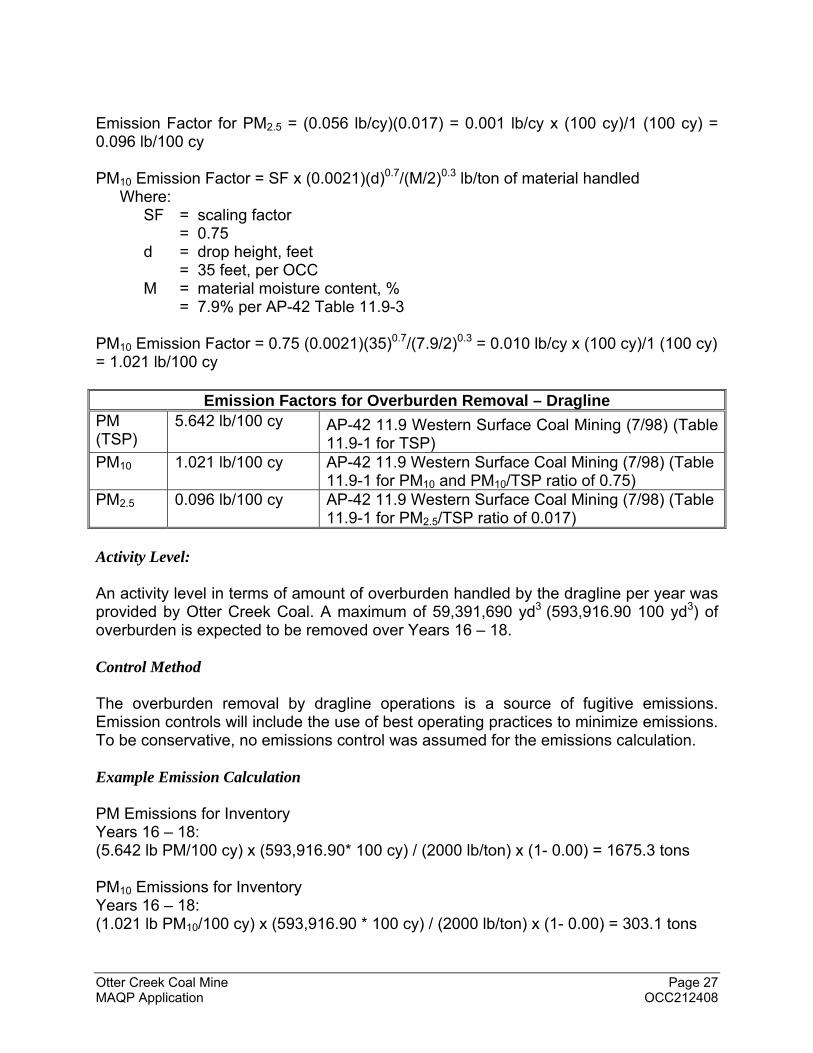
Emission Factor for PM2.5 = (0.056 lb/cy)(0.017) = 0.001 lb/cy x (100 cy)/1 (100 cy) = 0.096 lb/100 cy PM10 Emission Factor = SF x (0.0021)(d)0.7/(M/2)0.3 lb/ton of material handled
Where: SF = scaling factor
= 0.75 d = drop height, feet
= 35 feet, per OCC M = material moisture content, %
= 7.9% per AP-42 Table 11.9-3 PM10 Emission Factor = 0.75 (0.0021)(35)0.7/(7.9/2)0.3 = 0.010 lb/cy x (100 cy)/1 (100 cy) = 1.021 lb/100 cy
Emission Factors for Overburden Removal – Dragline PM (TSP)
5.642 lb/100 cy AP-42 11.9 Western Surface Coal Mining (7/98) (Table 11.9-1 for TSP)
PM10 1.021 lb/100 cy AP-42 11.9 Western Surface Coal Mining (7/98) (Table 11.9-1 for PM10 and PM10/TSP ratio of 0.75)
PM2.5 0.096 lb/100 cy AP-42 11.9 Western Surface Coal Mining (7/98) (Table 11.9-1 for PM2.5/TSP ratio of 0.017)
Activity Level: An activity level in terms of amount of overburden handled by the dragline per year was provided by Otter Creek Coal. A maximum of 59,391,690 yd3 (593,916.90 100 yd3) of overburden is expected to be removed over Years 16 – 18. Control Method The overburden removal by dragline operations is a source of fugitive emissions. Emission controls will include the use of best operating practices to minimize emissions. To be conservative, no emissions control was assumed for the emissions calculation. Example Emission Calculation PM Emissions for Inventory Years 16 – 18: (5.642 lb PM/100 cy) x (593,916.90* 100 cy) / (2000 lb/ton) x (1- 0.00) = 1675.3 tons PM10 Emissions for Inventory Years 16 – 18: (1.021 lb PM10/100 cy) x (593,916.90 * 100 cy) / (2000 lb/ton) x (1- 0.00) = 303.1 tons
Otter Creek Coal Mine Page 28 MAQP Application OCC212408
PM2.5 Emissions for Inventory Years 16 – 18: (0.096 lb PM2.5/100 cy) x (593,916.90 * 100 cy) / (2000 lb/ton) x (1- 0.00) = 28.5 tons
3.1.7 Emission Point 4b Overburden Removal by Truck and Shovel This category includes emissions produced by removing overburden using truck and shovel operations. Emission Factors: As recommended in AP-42 on page 11.9.4 Western Surface Coal Mining (10/98), the emission factor is calculated using equation 13.2.4(1) of AP-42 13.2.4 Aggregate Handling and Storage Piles (11/06) which is shown below. Emission Factor = (k)(0.0032)(U/5)1.3/(M/2)1.4 lb/ton of material handled
Where: k = particle size multiplier
= 0.74 for PM (<30 g/m3) = 0.35 for PM10 = 0.053 for PM2.5
U = mean wind speed (miles per hour) = 7.7 miles per hour, mean for OCC onsite data 2012
M = material moisture content, % = 4.8% per equation maximum value (Per AP-42, Table 11.9-3, the average
moisture of overburden is 7.9%, but the moisture content used in the calculation was limited to the equation maximum value.)
Emission Factor for PM (<30 g/m3) = (0.74)(0.0032)(7.7/5)1.3/(4.8/2)1.4 = 0.00122 lb/ton Emission Factor for PM10 = (0.35)(0.0032)(7.7/5)1.3/(4.8/2)1.4 = 0.00058 lb/ton Emission Factor for PM2.5 = (0.053)(0.0032)(7.7/5)1.3/(4.8/2)1.4 = 0.00009 lb/ton
Otter Creek Coal Mine Page 29 MAQP Application OCC212408
Emission Factors for Overburden Removal – Truck/Shovel Operations
PM (TSP)
0.00122 lb/ton overburden handled
AP-42 13.2.4 Aggregate Handling and Storage Piles (11/06) as recommended in AP-42 on page 11.9.4 Western Surface Coal Mining (10/98)
PM10 0.00058 lb/ton overburden handled
AP-42 13.2.4 Aggregate Handling and Storage Piles (11/06) as recommended in AP-42 on page 11.9.4 Western Surface Coal Mining (10/98)
PM2.5 0.00009 lb/ton overburden handled
AP-42 13.2.4 Aggregate Handling and Storage Piles (11/06) as recommended in AP-42 on page 11.9.4 Western Surface Coal Mining (10/98)
Activity Level: An activity level in terms of tons of overburden handled by truck and shovel operations per year was developed based on the volume of overburden handled and the density of that overburden. A density value of 1.5 tons per cubic yard of overburden was obtained from AP-42 Western Surface Coal Mining, Table 11.9-4 (10/1998) for mines in Area III, which includes southeast Montana. The volume of overburden handled each year was provided by Otter Creek Coal. A maximum of 46,992,404 yd3 of overburden is expected to be removed over Years 16 – 18. For Inventory Years 16 – 18: 46,992,404 cubic yards overburden/yr x 1.5 tons/cubic yard = 68,544,162 tons of overburden handled
Control Method Removing overburden by truck and shovel is a source of fugitive emissions. Emission controls will include the use of best operating practices to minimize emissions. To be conservative, no emissions control was assumed for the emissions calculation. Example Emission Calculation PM Emissions for Inventory Years 16 – 18: (0.00122 lb PM/ton overburden handled) x (68,544,162 ton/yr) / (2000 lb/ton) x (1- 0.00) = 41.76 tons PM10 Emissions for Inventory Years 16 – 18: (0.00058 lb PM10/ton overburden handled) x (68,544,162 ton/yr) / (2000 lb/ton) x (1- 0.00) = 19.75 tons
PM2.5 Emissions for Inventory Years 16 – 18: (0.00009 lb PM2.5/ton overburden handled) x (68,544,162 ton/yr) / (2000 lb/ton) x (1- 0.00) = 2.99 tons
Otter Creek Coal Mine Page 30 MAQP Application OCC212408
3.1.8 Emission Point 4c Overburden Dumping from Truck
This category includes emissions produced by dumping overburden using a truck. Emission Factors: As recommended in AP-42 on page 11.9.4 Western Surface Coal Mining (10/98), the emission factor is calculated using equation 13.2.4(1) of AP-42 13.2.4 Aggregate Handling and Storage Piles (11/06) which is shown below. Emission Factor = (k)(0.0032)(U/5)1.3/(M/2)1.4 lb/ton of material handled
Where: k = particle size multiplier
= 0.74 for PM (<30 g/m3) = 0.35 for PM10 = 0.053 for PM2.5
U = mean wind speed (miles per hour) = 7.7 miles per hour, mean for OCC onsite data 2012
M = material moisture content, % = 7.9% Per AP-42, Table 11.9-3, the average moisture of overburden is 7.9% Emission Factor for PM (<30 g/m3) = (0.74)(0.0032)(7.7/5)1.3/(7.9/2)1.4 = 0.00061 lb/ton Emission Factor for PM10 = (0.35)(0.0032)(7.7/5)1.3/(7.9/2)1.4 = 0.00029 lb/ton Emission Factor for PM2.5 = (0.053)(0.0032)(7.7/5)1.3/(7.9/2)1.4 = 0.00004 lb/ton
Emission Factors for Overburden Removal – Truck/Shovel Operations PM (TSP)
0.00061 lb/ton overburden handled
AP-42 13.2.4 Aggregate Handling and Storage Piles (11/06) as recommended in AP-42 on page 11.9.4 Western Surface Coal Mining (10/98)
PM10 0.00029 lb/ton overburden handled
AP-42 13.2.4 Aggregate Handling and Storage Piles (11/06) as recommended in AP-42 on page 11.9.4 Western Surface Coal Mining (10/98)
PM2.5 0.00004 lb/ton overburden handled
AP-42 13.2.4 Aggregate Handling and Storage Piles (11/06) as recommended in AP-42 on page 11.9.4 Western Surface Coal Mining (10/98)
Activity Level: An activity level in terms of tons of overburden handled by truck and shovel operations per year was developed based on the volume of overburden handled and the density of that overburden. A density value of 1.5 tons per cubic yard of overburden was obtained from AP-42 Western Surface Coal Mining, Table 11.9-4 (10/1998) for mines in Area III, which includes southeast Montana. The volume of overburden handled each year was
Otter Creek Coal Mine Page 31 MAQP Application OCC212408
provided by Otter Creek Coal. A maximum of 46,992,404 yd3 of overburden is expected to be removed over Years 16 – 18. For Inventory Years 16 – 18: 46,992,404 cubic yards overburden/yr x 1.5 tons/cubic yard = 68,544,162 tons of overburden handled
Control Method Removing overburden by truck and shovel is a source of fugitive emissions. Emission controls will include the use of best operating practices to minimize emissions. To be conservative, no emissions control was assumed for the emissions calculation. Example Emission Calculation PM Emissions for Inventory Years 16 – 18: (0.00061 lb PM/ton overburden handled) x (68,544,162 ton/yr) / (2000 lb/ton) x (1- 0.00) = 20.79 tons PM10 Emissions for Inventory Years 16 – 18: (0.00029 lb PM10/ton overburden handled) x (68,544,162 ton/yr) / (2000 lb/ton) x (1- 0.00) = 9.83 tons PM2.5 Emissions for Inventory Years 16 – 18: (0.00004 lb PM2.5/ton overburden handled) x (68,544,162 ton/yr) / (2000 lb/ton) x (1- 0.00) = 1.49 tons
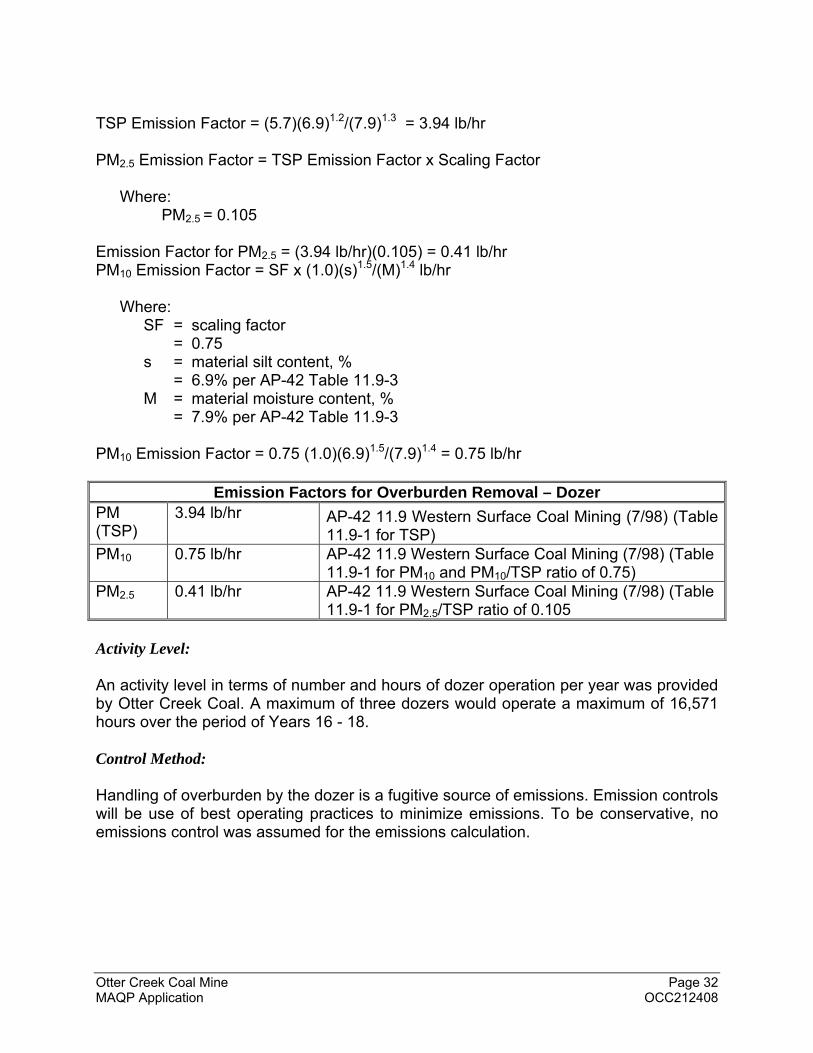
3.1.9 Emission Point 4d Overburden Handling by Dozer This category includes emissions produced by handling overburden using a dozer. Emission Factors: The emission factor for overburden handling by dozer is calculated based on an equation found in AP-42 Table 11.9-1 Western Surface Coal Mining (10/98). The equation is used to calculate a TSP emission factor and also includes scaling factors for PM10 and PM2.5. The scaling factors should be multiplied by the TSP equation to determine the PM2.5. The PM10 emission factor is calculated by inserting the scaling factor in the PM10 emission equation. TSP Emission Factor = (5.7)(s)1.2/(M)1.3 lb/hr
Where: s = material silt content, %
= 6.9% per AP-42 Table 11.9-3 M = material moisture content, %
= 7.9% per AP-42 Table 11.9-3
Otter Creek Coal Mine Page 32 MAQP Application OCC212408
TSP Emission Factor = (5.7)(6.9)1.2/(7.9)1.3 = 3.94 lb/hr PM2.5 Emission Factor = TSP Emission Factor x Scaling Factor
Where: PM2.5 = 0.105
Emission Factor for PM2.5 = (3.94 lb/hr)(0.105) = 0.41 lb/hr PM10 Emission Factor = SF x (1.0)(s)1.5/(M)1.4 lb/hr
Where: SF = scaling factor
= 0.75 s = material silt content, %
= 6.9% per AP-42 Table 11.9-3 M = material moisture content, %
= 7.9% per AP-42 Table 11.9-3 PM10 Emission Factor = 0.75 (1.0)(6.9)1.5/(7.9)1.4 = 0.75 lb/hr
Emission Factors for Overburden Removal – Dozer PM (TSP)
3.94 lb/hr AP-42 11.9 Western Surface Coal Mining (7/98) (Table 11.9-1 for TSP)
PM10 0.75 lb/hr AP-42 11.9 Western Surface Coal Mining (7/98) (Table 11.9-1 for PM10 and PM10/TSP ratio of 0.75)
PM2.5 0.41 lb/hr AP-42 11.9 Western Surface Coal Mining (7/98) (Table 11.9-1 for PM2.5/TSP ratio of 0.105
Activity Level: An activity level in terms of number and hours of dozer operation per year was provided by Otter Creek Coal. A maximum of three dozers would operate a maximum of 16,571 hours over the period of Years 16 - 18. Control Method: Handling of overburden by the dozer is a fugitive source of emissions. Emission controls will be use of best operating practices to minimize emissions. To be conservative, no emissions control was assumed for the emissions calculation.
Otter Creek Coal Mine Page 33 MAQP Application OCC212408
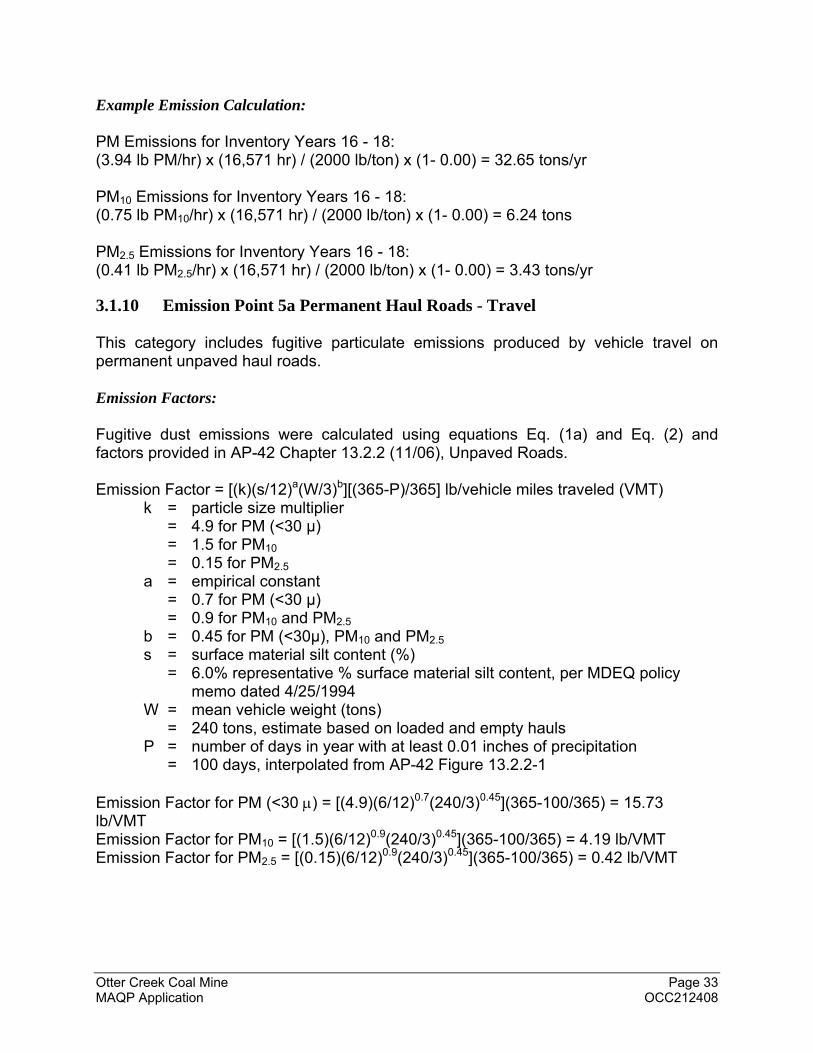
Example Emission Calculation: PM Emissions for Inventory Years 16 - 18: (3.94 lb PM/hr) x (16,571 hr) / (2000 lb/ton) x (1- 0.00) = 32.65 tons/yr PM10 Emissions for Inventory Years 16 - 18: (0.75 lb PM10/hr) x (16,571 hr) / (2000 lb/ton) x (1- 0.00) = 6.24 tons
PM2.5 Emissions for Inventory Years 16 - 18: (0.41 lb PM2.5/hr) x (16,571 hr) / (2000 lb/ton) x (1- 0.00) = 3.43 tons/yr
3.1.10 Emission Point 5a Permanent Haul Roads - Travel This category includes fugitive particulate emissions produced by vehicle travel on permanent unpaved haul roads. Emission Factors: Fugitive dust emissions were calculated using equations Eq. (1a) and Eq. (2) and factors provided in AP-42 Chapter 13.2.2 (11/06), Unpaved Roads. Emission Factor = [(k)(s/12)a(W/3)b][(365-P)/365] lb/vehicle miles traveled (VMT)
k = particle size multiplier = 4.9 for PM (<30 µ) = 1.5 for PM10 = 0.15 for PM2.5
a = empirical constant = 0.7 for PM (<30 µ) = 0.9 for PM10 and PM2.5
b = 0.45 for PM (<30µ), PM10 and PM2.5 s = surface material silt content (%)
= 6.0% representative % surface material silt content, per MDEQ policy memo dated 4/25/1994
W = mean vehicle weight (tons) = 240 tons, estimate based on loaded and empty hauls
P = number of days in year with at least 0.01 inches of precipitation = 100 days, interpolated from AP-42 Figure 13.2.2-1
Emission Factor for PM (<30 ) = [(4.9)(6/12)0.7(240/3)0.45](365-100/365) = 15.73 lb/VMT Emission Factor for PM10 = [(1.5)(6/12)0.9(240/3)0.45](365-100/365) = 4.19 lb/VMT Emission Factor for PM2.5 = [(0.15)(6/12)0.9(240/3)0.45](365-100/365) = 0.42 lb/VMT
Otter Creek Coal Mine Page 34 MAQP Application OCC212408
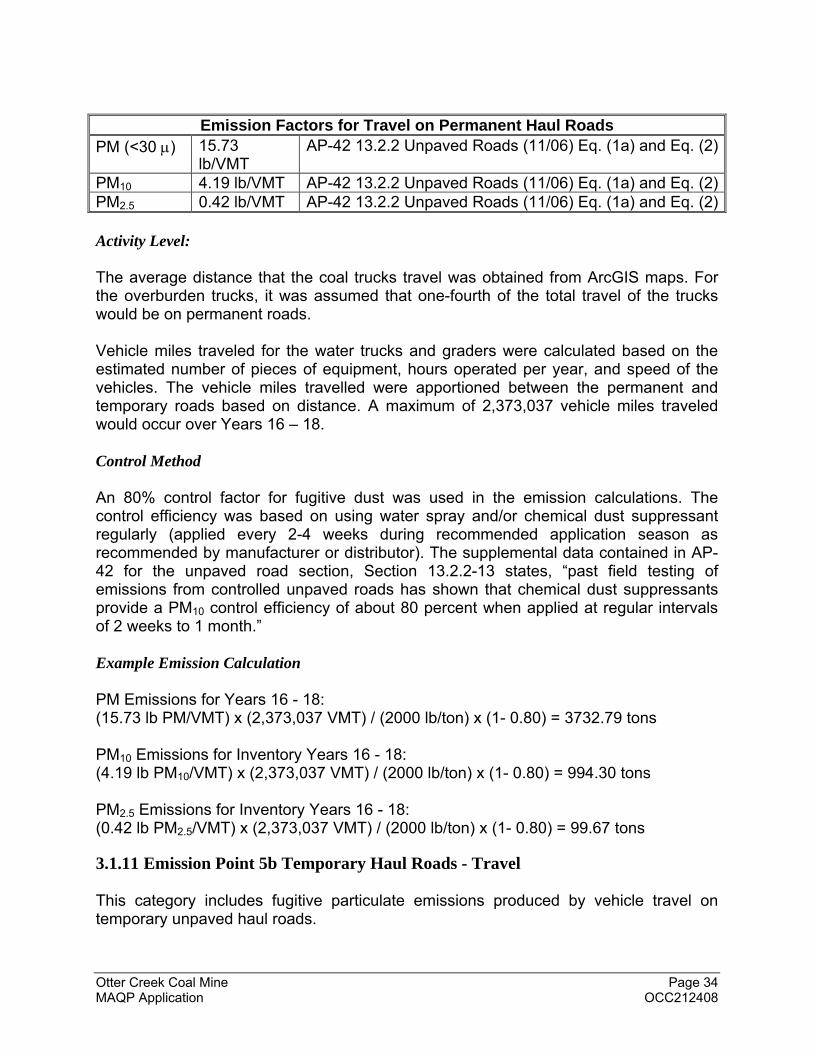
Emission Factors for Travel on Permanent Haul Roads
PM (<30 ) 15.73 lb/VMT
AP-42 13.2.2 Unpaved Roads (11/06) Eq. (1a) and Eq. (2)
PM10 4.19 lb/VMT AP-42 13.2.2 Unpaved Roads (11/06) Eq. (1a) and Eq. (2)PM2.5 0.42 lb/VMT AP-42 13.2.2 Unpaved Roads (11/06) Eq. (1a) and Eq. (2) Activity Level: The average distance that the coal trucks travel was obtained from ArcGIS maps. For the overburden trucks, it was assumed that one-fourth of the total travel of the trucks would be on permanent roads. Vehicle miles traveled for the water trucks and graders were calculated based on the estimated number of pieces of equipment, hours operated per year, and speed of the vehicles. The vehicle miles travelled were apportioned between the permanent and temporary roads based on distance. A maximum of 2,373,037 vehicle miles traveled would occur over Years 16 – 18. Control Method An 80% control factor for fugitive dust was used in the emission calculations. The control efficiency was based on using water spray and/or chemical dust suppressant regularly (applied every 2-4 weeks during recommended application season as recommended by manufacturer or distributor). The supplemental data contained in AP-42 for the unpaved road section, Section 13.2.2-13 states, “past field testing of emissions from controlled unpaved roads has shown that chemical dust suppressants provide a PM10 control efficiency of about 80 percent when applied at regular intervals of 2 weeks to 1 month.” Example Emission Calculation PM Emissions for Years 16 - 18: (15.73 lb PM/VMT) x (2,373,037 VMT) / (2000 lb/ton) x (1- 0.80) = 3732.79 tons PM10 Emissions for Inventory Years 16 - 18: (4.19 lb PM10/VMT) x (2,373,037 VMT) / (2000 lb/ton) x (1- 0.80) = 994.30 tons
PM2.5 Emissions for Inventory Years 16 - 18: (0.42 lb PM2.5/VMT) x (2,373,037 VMT) / (2000 lb/ton) x (1- 0.80) = 99.67 tons
3.1.11 Emission Point 5b Temporary Haul Roads - Travel This category includes fugitive particulate emissions produced by vehicle travel on temporary unpaved haul roads.
Otter Creek Coal Mine Page 35 MAQP Application OCC212408
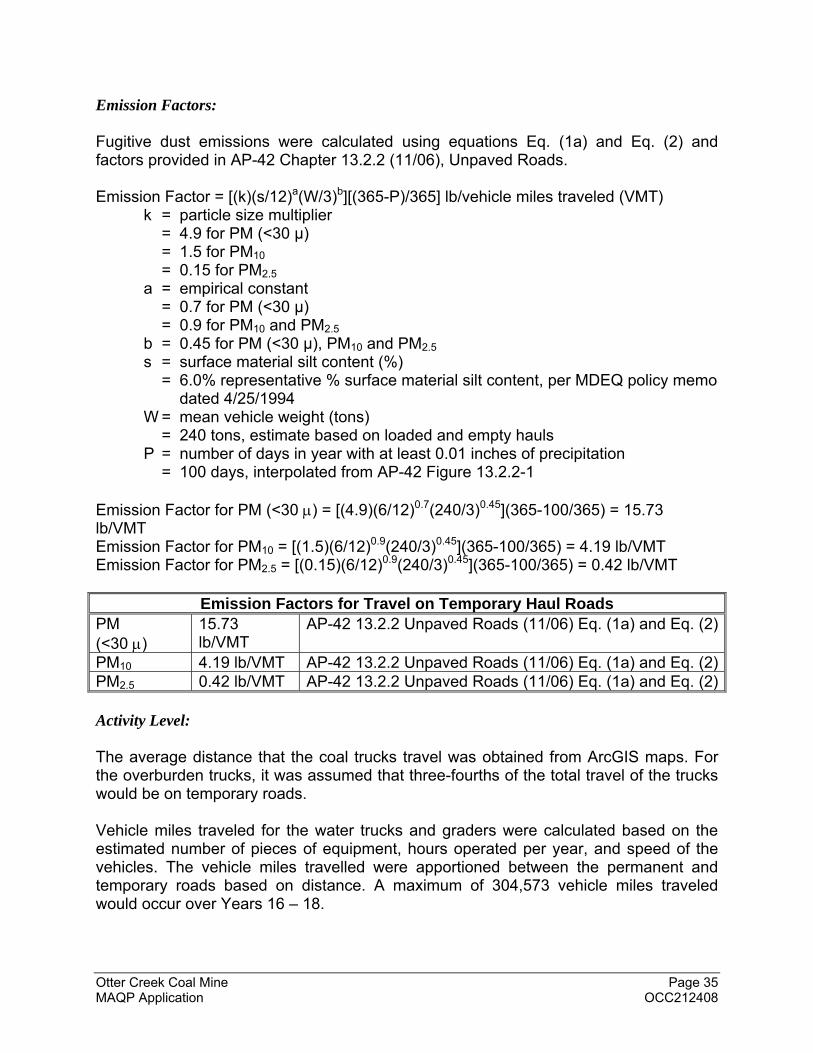
Emission Factors: Fugitive dust emissions were calculated using equations Eq. (1a) and Eq. (2) and factors provided in AP-42 Chapter 13.2.2 (11/06), Unpaved Roads. Emission Factor = [(k)(s/12)a(W/3)b][(365-P)/365] lb/vehicle miles traveled (VMT)
k = particle size multiplier = 4.9 for PM (<30 µ) = 1.5 for PM10 = 0.15 for PM2.5
a = empirical constant = 0.7 for PM (<30 µ) = 0.9 for PM10 and PM2.5
b = 0.45 for PM (<30 µ), PM10 and PM2.5 s = surface material silt content (%)
= 6.0% representative % surface material silt content, per MDEQ policy memo dated 4/25/1994
W = mean vehicle weight (tons) = 240 tons, estimate based on loaded and empty hauls
P = number of days in year with at least 0.01 inches of precipitation = 100 days, interpolated from AP-42 Figure 13.2.2-1
Emission Factor for PM (<30 ) = [(4.9)(6/12)0.7(240/3)0.45](365-100/365) = 15.73 lb/VMT Emission Factor for PM10 = [(1.5)(6/12)0.9(240/3)0.45](365-100/365) = 4.19 lb/VMT Emission Factor for PM2.5 = [(0.15)(6/12)0.9(240/3)0.45](365-100/365) = 0.42 lb/VMT
Emission Factors for Travel on Temporary Haul Roads
PM (<30 )
15.73 lb/VMT
AP-42 13.2.2 Unpaved Roads (11/06) Eq. (1a) and Eq. (2)
PM10 4.19 lb/VMT AP-42 13.2.2 Unpaved Roads (11/06) Eq. (1a) and Eq. (2)PM2.5 0.42 lb/VMT AP-42 13.2.2 Unpaved Roads (11/06) Eq. (1a) and Eq. (2) Activity Level: The average distance that the coal trucks travel was obtained from ArcGIS maps. For the overburden trucks, it was assumed that three-fourths of the total travel of the trucks would be on temporary roads. Vehicle miles traveled for the water trucks and graders were calculated based on the estimated number of pieces of equipment, hours operated per year, and speed of the vehicles. The vehicle miles travelled were apportioned between the permanent and temporary roads based on distance. A maximum of 304,573 vehicle miles traveled would occur over Years 16 – 18.
Otter Creek Coal Mine Page 36 MAQP Application OCC212408
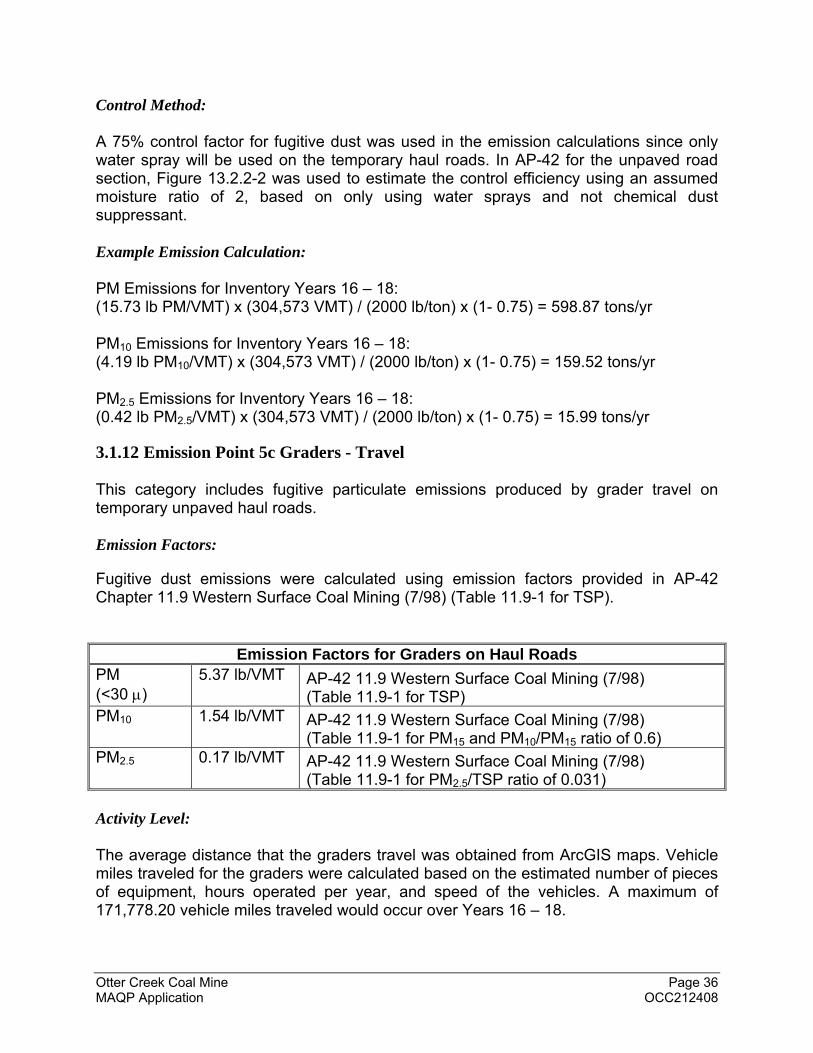
Control Method: A 75% control factor for fugitive dust was used in the emission calculations since only water spray will be used on the temporary haul roads. In AP-42 for the unpaved road section, Figure 13.2.2-2 was used to estimate the control efficiency using an assumed moisture ratio of 2, based on only using water sprays and not chemical dust suppressant. Example Emission Calculation: PM Emissions for Inventory Years 16 – 18: (15.73 lb PM/VMT) x (304,573 VMT) / (2000 lb/ton) x (1- 0.75) = 598.87 tons/yr PM10 Emissions for Inventory Years 16 – 18: (4.19 lb PM10/VMT) x (304,573 VMT) / (2000 lb/ton) x (1- 0.75) = 159.52 tons/yr
PM2.5 Emissions for Inventory Years 16 – 18: (0.42 lb PM2.5/VMT) x (304,573 VMT) / (2000 lb/ton) x (1- 0.75) = 15.99 tons/yr
3.1.12 Emission Point 5c Graders - Travel This category includes fugitive particulate emissions produced by grader travel on temporary unpaved haul roads. Emission Factors:
Fugitive dust emissions were calculated using emission factors provided in AP-42 Chapter 11.9 Western Surface Coal Mining (7/98) (Table 11.9-1 for TSP).
Emission Factors for Graders on Haul Roads
PM (<30 )
5.37 lb/VMT AP-42 11.9 Western Surface Coal Mining (7/98) (Table 11.9-1 for TSP)
PM10 1.54 lb/VMT AP-42 11.9 Western Surface Coal Mining (7/98) (Table 11.9-1 for PM15 and PM10/PM15 ratio of 0.6)
PM2.5 0.17 lb/VMT AP-42 11.9 Western Surface Coal Mining (7/98) (Table 11.9-1 for PM2.5/TSP ratio of 0.031)
Activity Level: The average distance that the graders travel was obtained from ArcGIS maps. Vehicle miles traveled for the graders were calculated based on the estimated number of pieces of equipment, hours operated per year, and speed of the vehicles. A maximum of 171,778.20 vehicle miles traveled would occur over Years 16 – 18.
Otter Creek Coal Mine Page 37 MAQP Application OCC212408
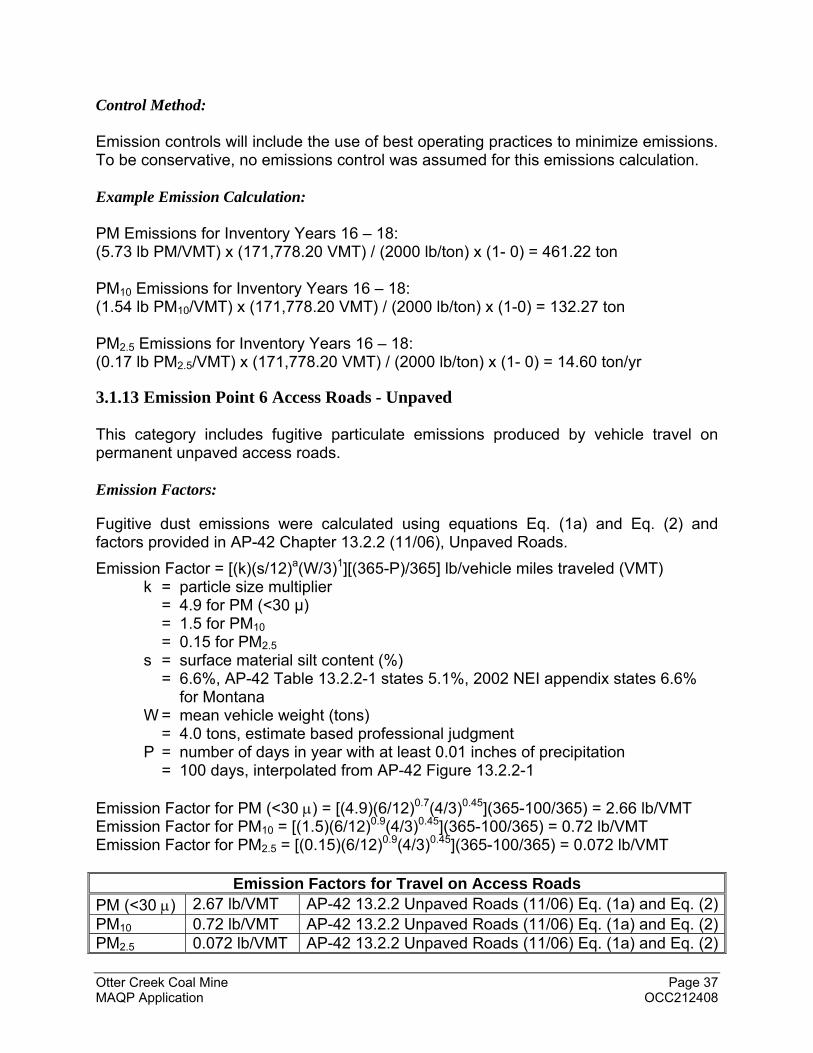
Control Method: Emission controls will include the use of best operating practices to minimize emissions. To be conservative, no emissions control was assumed for this emissions calculation. Example Emission Calculation: PM Emissions for Inventory Years 16 – 18: (5.73 lb PM/VMT) x (171,778.20 VMT) / (2000 lb/ton) x (1- 0) = 461.22 ton PM10 Emissions for Inventory Years 16 – 18: (1.54 lb PM10/VMT) x (171,778.20 VMT) / (2000 lb/ton) x (1-0) = 132.27 ton
PM2.5 Emissions for Inventory Years 16 – 18: (0.17 lb PM2.5/VMT) x (171,778.20 VMT) / (2000 lb/ton) x (1- 0) = 14.60 ton/yr
3.1.13 Emission Point 6 Access Roads - Unpaved This category includes fugitive particulate emissions produced by vehicle travel on permanent unpaved access roads. Emission Factors:
Fugitive dust emissions were calculated using equations Eq. (1a) and Eq. (2) and factors provided in AP-42 Chapter 13.2.2 (11/06), Unpaved Roads.
Emission Factor = [(k)(s/12)a(W/3)1][(365-P)/365] lb/vehicle miles traveled (VMT) k = particle size multiplier
= 4.9 for PM (<30 µ) = 1.5 for PM10 = 0.15 for PM2.5
s = surface material silt content (%) = 6.6%, AP-42 Table 13.2.2-1 states 5.1%, 2002 NEI appendix states 6.6%
for Montana W = mean vehicle weight (tons)
= 4.0 tons, estimate based professional judgment P = number of days in year with at least 0.01 inches of precipitation
= 100 days, interpolated from AP-42 Figure 13.2.2-1
Emission Factor for PM (<30 ) = [(4.9)(6/12)0.7(4/3)0.45](365-100/365) = 2.66 lb/VMT Emission Factor for PM10 = [(1.5)(6/12)0.9(4/3)0.45](365-100/365) = 0.72 lb/VMT Emission Factor for PM2.5 = [(0.15)(6/12)0.9(4/3)0.45](365-100/365) = 0.072 lb/VMT
Emission Factors for Travel on Access Roads
PM (<30 ) 2.67 lb/VMT AP-42 13.2.2 Unpaved Roads (11/06) Eq. (1a) and Eq. (2)PM10 0.72 lb/VMT AP-42 13.2.2 Unpaved Roads (11/06) Eq. (1a) and Eq. (2)PM2.5 0.072 lb/VMT AP-42 13.2.2 Unpaved Roads (11/06) Eq. (1a) and Eq. (2)
Otter Creek Coal Mine Page 38 MAQP Application OCC212408
Activity Level: An activity level in terms of vehicle miles traveled per year was calculated based on an estimated average number of vehicles per day and the estimated average distance traveled. A maximum of 2,787,363 vehicle miles traveled is expected to occur over Years 16 – 18. Control Method A 75% control factor for fugitive dust was used in the emission calculations, since only water spray will be used on the temporary haul roads. For the unpaved road section, Figure 13.2.2-2 from AP-42 was used to estimate the control efficiency using an assumed moisture ratio of 2 based on only using water sprays and not chemical dust suppressant. Example Emission Calculation PM Emissions for Inventory Years 16 - 18: (2.67 lb PM/VMT) x (2,787,363 VMT) / (2000 lb/ton) x (1- 0.75) = 928.54 tons/yr PM10 Emissions for Inventory Years 16 - 18: (0.72 lb PM10/VMT) x (2,787,363 VMT) / (2000 lb/ton) x (1- 0.75) = 252.26 tons/yr
PM2.5 Emissions for Inventory Year 16 - 18: (0.072 lb PM10/VMT) x (2,787,363 VMT) / (2000 lb/ton) x (1- 0.75) = 25.09 tons/yr
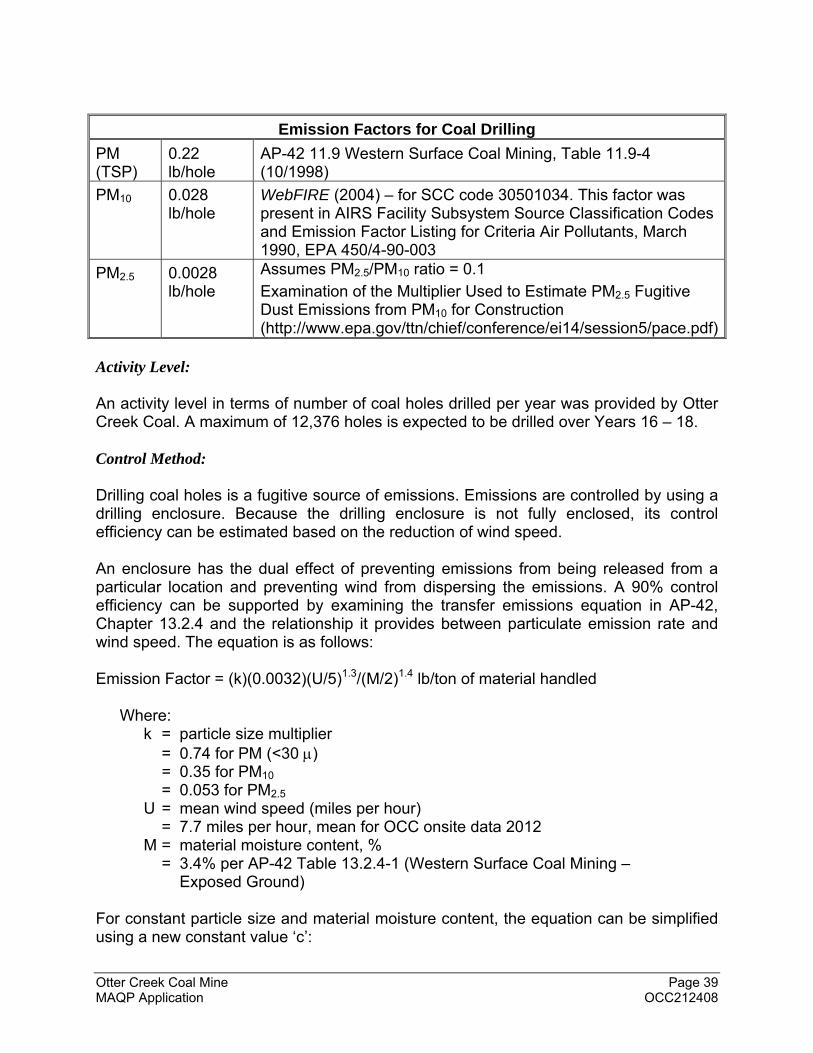
3.1.14 Emission Point 7 Coal Drilling This category includes emissions produced from drilling holes into the coal seam in preparation for blasting. Emission Factors: The source for each emission factor is summarized below.
Otter Creek Coal Mine Page 39 MAQP Application OCC212408
Emission Factors for Coal Drilling
PM (TSP)
0.22 lb/hole
AP-42 11.9 Western Surface Coal Mining, Table 11.9-4 (10/1998)
PM10 0.028 lb/hole
WebFIRE (2004) – for SCC code 30501034. This factor was present in AIRS Facility Subsystem Source Classification Codes and Emission Factor Listing for Criteria Air Pollutants, March 1990, EPA 450/4-90-003
PM2.5 0.0028 lb/hole
Assumes PM2.5/PM10 ratio = 0.1 Examination of the Multiplier Used to Estimate PM2.5 Fugitive Dust Emissions from PM10 for Construction (http://www.epa.gov/ttn/chief/conference/ei14/session5/pace.pdf)
Activity Level: An activity level in terms of number of coal holes drilled per year was provided by Otter Creek Coal. A maximum of 12,376 holes is expected to be drilled over Years 16 – 18. Control Method: Drilling coal holes is a fugitive source of emissions. Emissions are controlled by using a drilling enclosure. Because the drilling enclosure is not fully enclosed, its control efficiency can be estimated based on the reduction of wind speed. An enclosure has the dual effect of preventing emissions from being released from a particular location and preventing wind from dispersing the emissions. A 90% control efficiency can be supported by examining the transfer emissions equation in AP-42, Chapter 13.2.4 and the relationship it provides between particulate emission rate and wind speed. The equation is as follows: Emission Factor = (k)(0.0032)(U/5)1.3/(M/2)1.4 lb/ton of material handled
Where: k = particle size multiplier
= 0.74 for PM (<30 ) = 0.35 for PM10 = 0.053 for PM2.5
U = mean wind speed (miles per hour) = 7.7 miles per hour, mean for OCC onsite data 2012
M = material moisture content, % = 3.4% per AP-42 Table 13.2.4-1 (Western Surface Coal Mining – Exposed Ground) For constant particle size and material moisture content, the equation can be simplified using a new constant value ‘c’:
Otter Creek Coal Mine Page 40 MAQP Application OCC212408
Emission factor = c(U/5)1.3
This empirical equation is reported to be valid for wind speed conditions within a range of 1.3 to 15 mph. The average outdoor wind speed for the project area, as represented by data from the OCC meteorological station, is 7.7 mph. Assuming average wind speed within an enclosure is equal to wind speed for which the equation is valid, the enclosure efficiency relative to the unenclosed case is calculated as follows: Efficiency = [(7.7/5)1.3 - (1.3/5)1.3]/(7.7/5)1.3 *100 = 90%
This equation yields a control efficiency value of 90% resulting from enclosing the particulate emission source. Example Emission Calculation PM Emissions for Inventory Years 16 -18: (0.22 lb PM/hole) x (12,376 holes) / (2000 lb/ton) x (1- 0.90) = 0.14 ton PM10 Emissions for Inventory Years 16 -18: (0.028 lb PM10/hole) x (12,376 holes) / (2000 lb/ton) x (1- 0.90) = 0.02 ton
PM2.5 Emissions for Inventory Years 16 -18: (0.0028 lb PM2.5/hole) x (12,376 holes) / (2000 lb/ton) x (1- 0.90) = 0.002 ton
3.1.15 Emission Point 8 Coal Blasting This category includes emissions produced by the blasting of coal to be subsequently removed. Emission Factors: The emission factor for coal blasting is calculated based on an equation found in Table 11.9-1 Western Surface Coal Mining (10/98). The equation is used to calculate a TSP emission factor and also includes scaling factors for PM10 and PM2.5. The scaling factors should be multiplied by the TSP equation to determine the PM10 and PM2.5 emissions. PM (TSP) Emission Factor = 0.000014(A)1.5 lb/blast
Where: A = horizontal area (ft2), with blasting depth ≤ 70 ft
= 40,470 ft2, provided by OCC
PM (TSP) Emission Factor = 0.000014(40,470 ft)1.5 lb/blast PM (TSP) Emission Factor = 114 lb/blast
Otter Creek Coal Mine Page 41 MAQP Application OCC212408
PM10 and PM2.5 Emission Factor = TSP Emission Factor x Scaling Factor
Where: PM10 = 0.52 PM2.5 = 0.03
Emission Factor for PM10 = (114 lb/blast)(0.52) = 59 lb/blast Emission Factor for PM2.5 = (114 lb/blast)(0.03) = 3 lb/blast
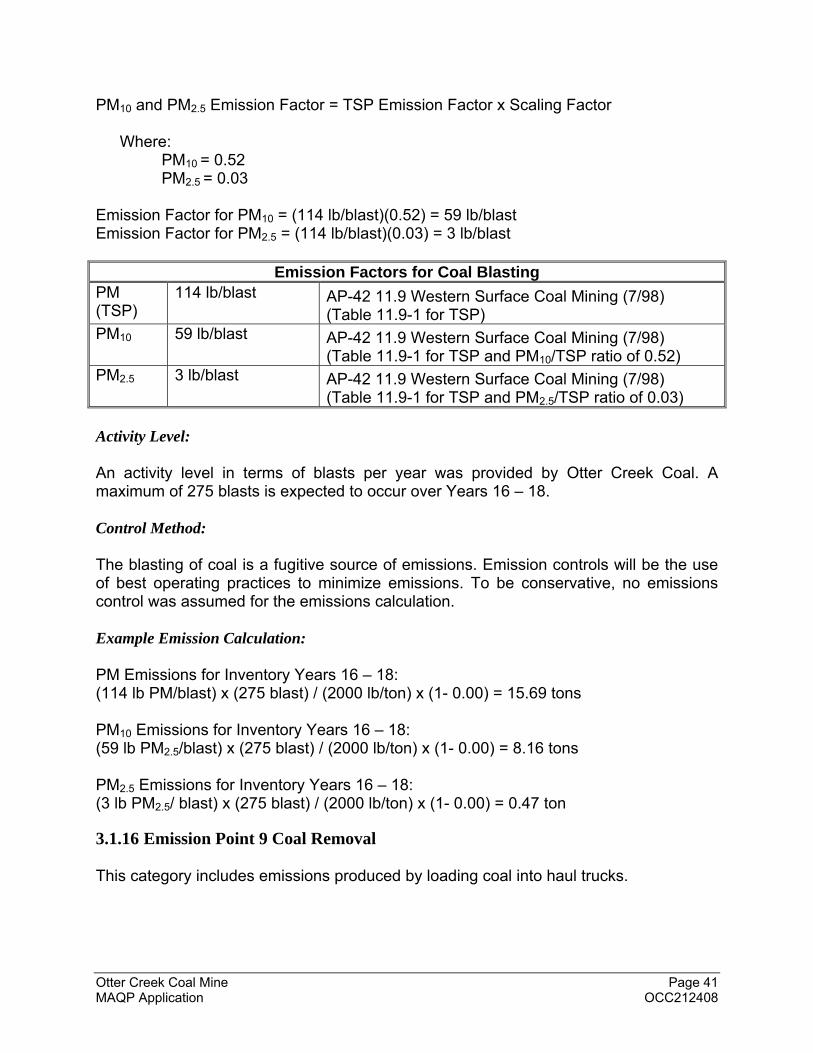
Emission Factors for Coal Blasting PM (TSP)
114 lb/blast AP-42 11.9 Western Surface Coal Mining (7/98) (Table 11.9-1 for TSP)
PM10 59 lb/blast AP-42 11.9 Western Surface Coal Mining (7/98) (Table 11.9-1 for TSP and PM10/TSP ratio of 0.52)
PM2.5 3 lb/blast AP-42 11.9 Western Surface Coal Mining (7/98) (Table 11.9-1 for TSP and PM2.5/TSP ratio of 0.03)
Activity Level: An activity level in terms of blasts per year was provided by Otter Creek Coal. A maximum of 275 blasts is expected to occur over Years 16 – 18. Control Method: The blasting of coal is a fugitive source of emissions. Emission controls will be the use of best operating practices to minimize emissions. To be conservative, no emissions control was assumed for the emissions calculation. Example Emission Calculation: PM Emissions for Inventory Years 16 – 18: (114 lb PM/blast) x (275 blast) / (2000 lb/ton) x (1- 0.00) = 15.69 tons PM10 Emissions for Inventory Years 16 – 18: (59 lb PM2.5/blast) x (275 blast) / (2000 lb/ton) x (1- 0.00) = 8.16 tons
PM2.5 Emissions for Inventory Years 16 – 18: (3 lb PM2.5/ blast) x (275 blast) / (2000 lb/ton) x (1- 0.00) = 0.47 ton
3.1.16 Emission Point 9 Coal Removal This category includes emissions produced by loading coal into haul trucks.
Otter Creek Coal Mine Page 42 MAQP Application OCC212408
Emission Factors: As recommended in AP-42 on page 11.9.4, Western Surface Coal Mining (10/98), the emission factors for particulate matter are calculated using equation 13.2.4(1) of AP-42 13.2.4 Aggregate Handling and Storage Piles (11/06) which is shown below. Emission Factor = (k)(0.0032)(U/5)1.3/(M/2)1.4 lb/ton of material handled
Where: k = particle size multiplier
= 0.74 for PM (<30 ) = 0.35 for PM10 = 0.053 for PM2.5
U = mean wind speed (miles per hour) = 1.13 miles per hour, minimum value for which the equation applies. Since
activity is occurring in the pit, the wind speeds should be minimal. M = material moisture content, %
= 4.8% per equation maximum value (Per AP-42 Table 11.9-3, the average free moisture content of Otter Creek Coal is 12%, but the moisture content used in the calculation was limited to the equation maximum value.)
Emission Factor for PM (<30 ) = (0.74)(0.0032)(1.13/5)1.3/(4.8/2)1.4 = 0.000101 lb/ton Emission Factor for PM10 = (0.35)(0.0032)(1.13/5)1.3/(4.8/2)1.4 = 0.000048 lb/ton Emission Factor for PM2.5 = (0.053)(0.0032)(1.13/5)1.3/(4.8/2)1.4 = 0.000007 lb/ton The emission factor for releases of methane from coal (40 ft3 methane/ton coal) was obtained from the Inventory of Greenhouse Gas Emissions and Sinks: 1990-2004 (April 2006); Annex 3.3 Methodology for Estimating CH4 Emissions from Coal Mining. Using a density of 0.042300 lb/ft3 at 60oF and 1 atm from 40 CFR 98.323(a), the emission factor was converted from 40 ft3 methane/ton coal to 1.69 lbs methane/ton coal. A 100 year global warming potential (GWP) of 25 was applied based on data in Table TS.2 - 2 IPCC Fourth Assessment Report (AR4), 2007. Climate Change 2007: The Physical Science Basis. Contribution of Working Group I to the Fourth Assessment Report of the Intergovernmental Panel on Climate Change.
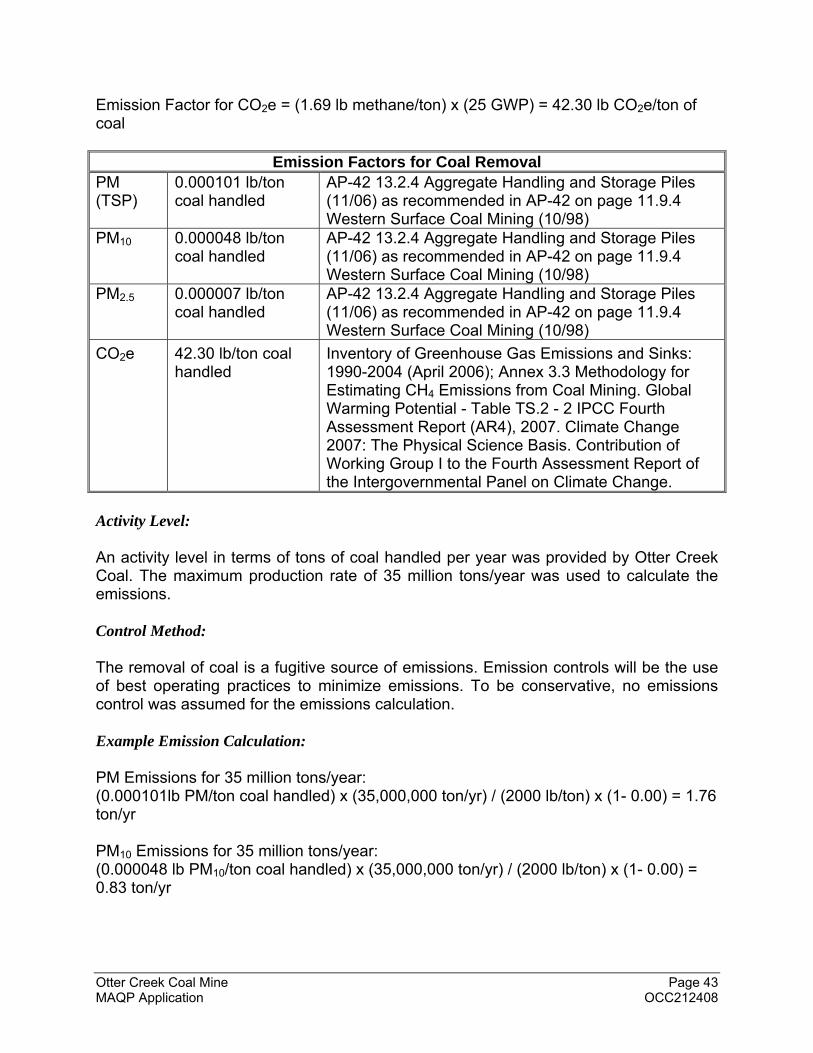
Otter Creek Coal Mine Page 43 MAQP Application OCC212408
Emission Factor for CO2e = (1.69 lb methane/ton) x (25 GWP) = 42.30 lb CO2e/ton of coal
Emission Factors for Coal Removal PM (TSP)
0.000101 lb/ton coal handled
AP-42 13.2.4 Aggregate Handling and Storage Piles (11/06) as recommended in AP-42 on page 11.9.4 Western Surface Coal Mining (10/98)
PM10 0.000048 lb/ton coal handled
AP-42 13.2.4 Aggregate Handling and Storage Piles (11/06) as recommended in AP-42 on page 11.9.4 Western Surface Coal Mining (10/98)
PM2.5 0.000007 lb/ton coal handled
AP-42 13.2.4 Aggregate Handling and Storage Piles (11/06) as recommended in AP-42 on page 11.9.4 Western Surface Coal Mining (10/98)
CO2e 42.30 lb/ton coal handled
Inventory of Greenhouse Gas Emissions and Sinks: 1990-2004 (April 2006); Annex 3.3 Methodology for Estimating CH4 Emissions from Coal Mining. Global Warming Potential - Table TS.2 - 2 IPCC Fourth Assessment Report (AR4), 2007. Climate Change 2007: The Physical Science Basis. Contribution of Working Group I to the Fourth Assessment Report of the Intergovernmental Panel on Climate Change.
Activity Level: An activity level in terms of tons of coal handled per year was provided by Otter Creek Coal. The maximum production rate of 35 million tons/year was used to calculate the emissions. Control Method: The removal of coal is a fugitive source of emissions. Emission controls will be the use of best operating practices to minimize emissions. To be conservative, no emissions control was assumed for the emissions calculation. Example Emission Calculation: PM Emissions for 35 million tons/year: (0.000101lb PM/ton coal handled) x (35,000,000 ton/yr) / (2000 lb/ton) x (1- 0.00) = 1.76 ton/yr PM10 Emissions for 35 million tons/year: (0.000048 lb PM10/ton coal handled) x (35,000,000 ton/yr) / (2000 lb/ton) x (1- 0.00) = 0.83 ton/yr
Otter Creek Coal Mine Page 44 MAQP Application OCC212408
PM2.5 Emissions for 35 million tons/year: (0.000007 lb PM2.5/ton coal handled) x (35,000,000 ton/yr) / (2000 lb/ton) x (1- 0.00) = 0.13 ton/yr CO2e Emissions for 35 million tons/year: (42.30 lb CO2e/ton coal handled) x (35,000,000 ton/yr) / (2000 lb/ton) x (1- 0.00) = 740,250.00 ton/yr
3.1.17 Emission Point 10 Coal Dumping – Truck Dump This category includes emissions produced by dumping coal into the primary crusher. Emission Factors: As recommended in AP-42 on page 11.9.4, Western Surface Coal Mining (10/98), the emission factor is calculated using equation 13.2.4(1) of AP-42, 13.2.4 Aggregate Handling and Storage Piles (11/06) which is shown below. Emission Factor = (k)(0.0032)(U/5)1.3/(M/2)1.4 lb/ton of material handled
Where: k = particle size multiplier
= 0.74 for PM (<30 ) = 0.35 for PM10 = 0.053 for PM2.5
U = mean wind speed (miles per hour) = 7.7 miles per hour, mean for OCC onsite data 2012
M = material moisture content, % = 4.8% per equation maximum value (Per AP-42 Table 11.9-3, the average
free moisture content of Otter Creek Coal is 12%, but the moisture content used in the calculation was limited to the equation maximum value.)
Emission Factor for PM (<30 g/m3) = (0.74)(0.0032)(7.7/5)1.3/(4.8/2)1.4 = 0.001219 lb/ton Emission Factor for PM10 = (0.35)(0.0032)(7.7/5)1.3/(4.8/2)1.4 = 0.000576 lb/ton Emission Factor for PM2.5 = (0.053)(0.0032)(7.7/5)1.3/(4.8/2)1.4 = 0.000087 lb/ton
Otter Creek Coal Mine Page 45 MAQP Application OCC212408
Emission Factors for Coal Dumping – Truck Dump
PM (TSP)
0.001219 lb/ton coal
AP-42 13.2.4 Aggregate Handling and Storage Piles (11/06) as recommended in AP-42 on page 11.9.4 Western Surface Coal Mining (10/98)
PM10 0.000576 lb/ton coal
AP-42 13.2.4 Aggregate Handling and Storage Piles (11/06) as recommended in AP-42 on page 11.9.4 Western Surface Coal Mining (10/98)
PM2.5 0.000087 lb/ton coal handled
AP-42 13.2.4 Aggregate Handling and Storage Piles (11/06) as recommended in AP-42 on page 11.9.4 Western Surface Coal Mining (10/98)
Activity Level: An activity level in terms of tons of coal unloaded at the truck dump was provided by Otter Creek Coal. The emissions were calculated based on the maximum throughput of 35 million tons of coal mined a year. Control Method: The unloading of coal is a point source of emissions. Emission controls include using a stilling system and a fogging dust suppression system. The fogging dust suppression system is the primary emissions control technique. The stilling shed enhances control, and although not completely enclosed, it is assumed to have a control efficiency based on the reduction of wind speed as described below. An enclosure has the dual effect of preventing emissions from being released from a particular location and preventing wind from dispersing the emissions. A 90% control efficiency can be supported by examining the transfer emissions equation in AP-42, Chapter 13.2.4 and the relationship it provides between particulate emission rate and wind speed. The equation is as follows: Emission Factor = (k)(0.0032)(U/5)1.3/(M/2)1.4 lb/ton of material handled
Where: k = particle size multiplier
= 0.74 for PM (<30 ) = 0.35 for PM10 = 0.053 for PM2.5
U = mean wind speed (miles per hour) M = material moisture content, %
For constant particle size and material moisture content, the equation can be simplified using a new constant value ‘c’: Emission factor = c(U/5)1.3
Otter Creek Coal Mine Page 46 MAQP Application OCC212408
This empirical equation is reported to be valid for wind speed conditions within a range of 1.3 to 15 mph. The average outdoor wind speed for the project area, as represented by data from the OCC meteorological station, is 7.7 mph. Assuming average wind speed within an enclosure is equal to the minimum wind speed for which the equation is valid, the enclosure efficiency is calculated as follows: Efficiency = [(7.7/5)1.3 - (1.3/5)1.3]/(7.7/5)1.3 = 90%
This equation yields a control efficiency value of 90% based on partially enclosing a particulate emission source. For the fogging dust suppression system, a control efficiency of 97.5% was used based on information provided in Section 5.0. As the primary dust control system, the emissions control efficiency for the fogging dust suppression was assumed for the emissions calculation. No credit was claimed for partial enclosure, although it undoubtedly enhances control of emissions. Example Emission Calculation PM Emissions for Group Years 16 - 18: (0.001219 lb PM/ton coal) x (35,000,000 ton/yr) / (2000 lb/ton) x (1- 0.975) = 0.53 ton/yr PM10 Emissions for Group Years 16 - 18: (0.000576 lb PM10/ton coal) x (35,000,000 ton/yr) / (2000 lb/ton) x (1- 0.975) = 0.25ton/yr PM2.5 Emissions for Group Years 16 - 18: (0.000087 lb PM2.5 /ton coal) x (35,000,000 ton/yr) / (2000 lb/ton) x (1- 0.975) = 0.04ton/yr
3.1.18 Emission Point 11 Primary Crusher This category includes emissions produced using the primary crusher. Emission Factors: The source for each emission factor is summarized below.
Otter Creek Coal Mine Page 47 MAQP Application OCC212408
Emission Factors for Primary Crushing
PM (TSP)
0.02 lb/ton of coal crushed
WebFIRE (SCC 30501010) Coal Mining, Cleaning, and Material Handling: Crushing
PM10 0.006 lb/ton of coal crushed
WebFIRE (SCC 30501010) Coal Mining, Cleaning, and Material Handling: Crushing
PM2.5 0.0006 lb/ton of coal crushed
Assumes PM2.5/PM10 ratio = 0.1 Examination of the Multiplier Used to Estimate PM2.5 Fugitive Dust Emissions from PM10 for Construction (http://www.epa.gov/ttn/chief/conference/ei14/session5/pace.pdf)
Activity Level: An activity level in terms of tons of coal crushed was provided by Otter Creek Coal. The emissions were calculated based on the maximum throughput of 35 million tons of coal mined a year. Control Method The primary crushing of coal is a point source of emissions. Emission controls include using a fogging dust suppression system with a control efficiency of 97.5%. Example Emission Calculation PM Emissions for Group Years 16 - 18: (0.02 lb PM/ton coal) x (35,000.000 ton/yr) / (2000 lb/ton) x (1- 0.975) = 8.75 tons/yr PM10 Emissions for Group Years 16 - 18: (0.006 lb PM10/ton coal) x (35,000.000 ton/yr) / (2000 lb/ton) x (1- 0.975) = 2.63 tons/yr PM2.5 Emissions for Group Years 16 - 18: (0.0006 lb PM2.5 /ton coal) x (35,000.000 ton/yr) / (2000 lb/ton) x (1- 0.975) = 0.26 ton/yr
3.1.19 Emission Point 12 Secondary Crusher This category includes emissions produced from the secondary crusher. Emission Factors: The source for each emission factor is summarized below.
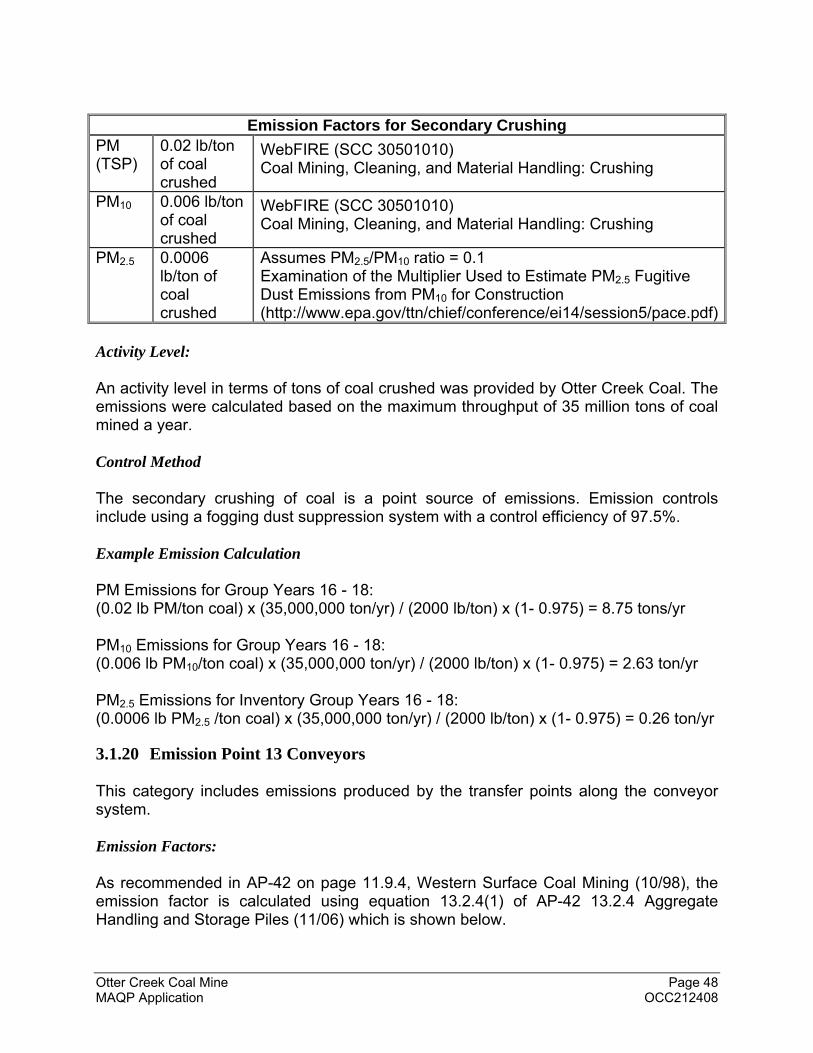
Otter Creek Coal Mine Page 48 MAQP Application OCC212408
Emission Factors for Secondary Crushing
PM (TSP)
0.02 lb/ton of coal crushed
WebFIRE (SCC 30501010) Coal Mining, Cleaning, and Material Handling: Crushing
PM10 0.006 lb/ton of coal crushed
WebFIRE (SCC 30501010) Coal Mining, Cleaning, and Material Handling: Crushing
PM2.5 0.0006 lb/ton of coal crushed
Assumes PM2.5/PM10 ratio = 0.1 Examination of the Multiplier Used to Estimate PM2.5 Fugitive Dust Emissions from PM10 for Construction (http://www.epa.gov/ttn/chief/conference/ei14/session5/pace.pdf)
Activity Level: An activity level in terms of tons of coal crushed was provided by Otter Creek Coal. The emissions were calculated based on the maximum throughput of 35 million tons of coal mined a year. Control Method The secondary crushing of coal is a point source of emissions. Emission controls include using a fogging dust suppression system with a control efficiency of 97.5%. Example Emission Calculation PM Emissions for Group Years 16 - 18: (0.02 lb PM/ton coal) x (35,000,000 ton/yr) / (2000 lb/ton) x (1- 0.975) = 8.75 tons/yr PM10 Emissions for Group Years 16 - 18: (0.006 lb PM10/ton coal) x (35,000,000 ton/yr) / (2000 lb/ton) x (1- 0.975) = 2.63 ton/yr PM2.5 Emissions for Inventory Group Years 16 - 18: (0.0006 lb PM2.5 /ton coal) x (35,000,000 ton/yr) / (2000 lb/ton) x (1- 0.975) = 0.26 ton/yr
3.1.20 Emission Point 13 Conveyors This category includes emissions produced by the transfer points along the conveyor system. Emission Factors: As recommended in AP-42 on page 11.9.4, Western Surface Coal Mining (10/98), the emission factor is calculated using equation 13.2.4(1) of AP-42 13.2.4 Aggregate Handling and Storage Piles (11/06) which is shown below.
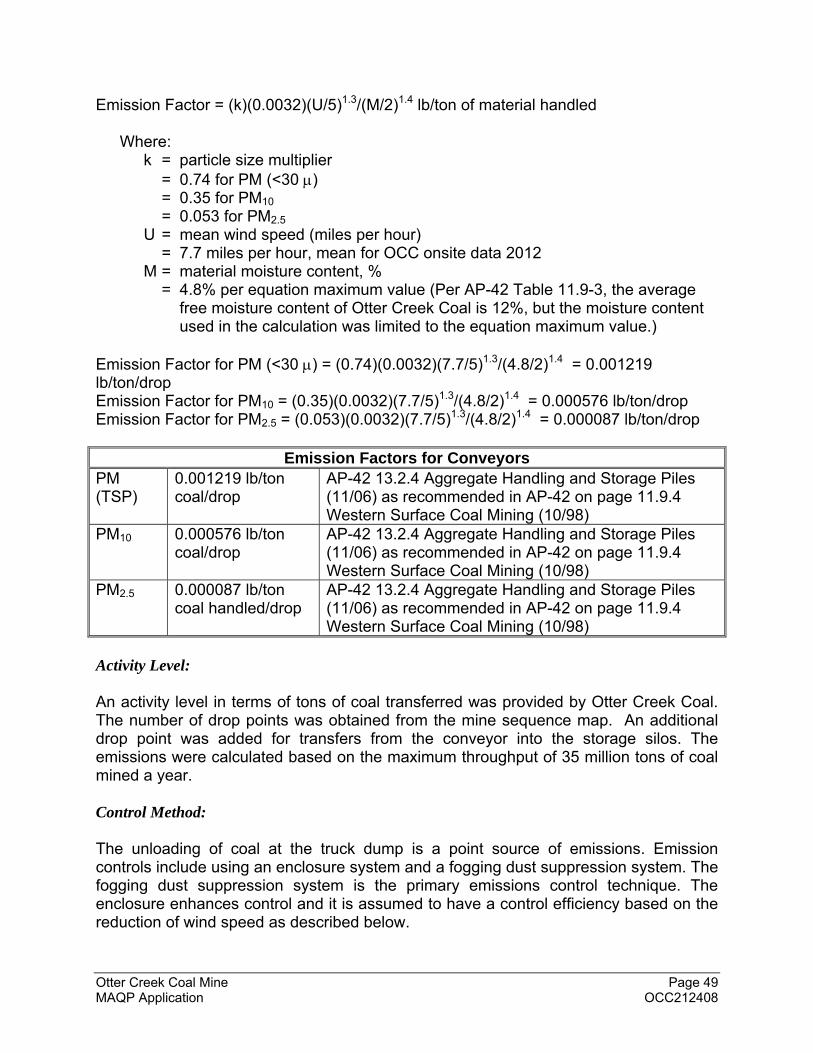
Otter Creek Coal Mine Page 49 MAQP Application OCC212408
Emission Factor = (k)(0.0032)(U/5)1.3/(M/2)1.4 lb/ton of material handled
Where: k = particle size multiplier
= 0.74 for PM (<30 ) = 0.35 for PM10 = 0.053 for PM2.5
U = mean wind speed (miles per hour) = 7.7 miles per hour, mean for OCC onsite data 2012
M = material moisture content, % = 4.8% per equation maximum value (Per AP-42 Table 11.9-3, the average
free moisture content of Otter Creek Coal is 12%, but the moisture content used in the calculation was limited to the equation maximum value.)
Emission Factor for PM (<30 ) = (0.74)(0.0032)(7.7/5)1.3/(4.8/2)1.4 = 0.001219 lb/ton/drop Emission Factor for PM10 = (0.35)(0.0032)(7.7/5)1.3/(4.8/2)1.4 = 0.000576 lb/ton/drop Emission Factor for PM2.5 = (0.053)(0.0032)(7.7/5)1.3/(4.8/2)1.4 = 0.000087 lb/ton/drop
Emission Factors for Conveyors PM (TSP)
0.001219 lb/ton coal/drop
AP-42 13.2.4 Aggregate Handling and Storage Piles (11/06) as recommended in AP-42 on page 11.9.4 Western Surface Coal Mining (10/98)
PM10 0.000576 lb/ton coal/drop
AP-42 13.2.4 Aggregate Handling and Storage Piles (11/06) as recommended in AP-42 on page 11.9.4 Western Surface Coal Mining (10/98)
PM2.5 0.000087 lb/ton coal handled/drop
AP-42 13.2.4 Aggregate Handling and Storage Piles (11/06) as recommended in AP-42 on page 11.9.4 Western Surface Coal Mining (10/98)
Activity Level: An activity level in terms of tons of coal transferred was provided by Otter Creek Coal. The number of drop points was obtained from the mine sequence map. An additional drop point was added for transfers from the conveyor into the storage silos. The emissions were calculated based on the maximum throughput of 35 million tons of coal mined a year. Control Method: The unloading of coal at the truck dump is a point source of emissions. Emission controls include using an enclosure system and a fogging dust suppression system. The fogging dust suppression system is the primary emissions control technique. The enclosure enhances control and it is assumed to have a control efficiency based on the reduction of wind speed as described below.
Otter Creek Coal Mine Page 50 MAQP Application OCC212408
An enclosure has the dual effect of preventing emissions from being released from a particular location and preventing wind from dispersing the emissions. A 90% control efficiency can be supported by examining the transfer emissions equation in AP-42, Chapter 13.2.4 and the relationship it provides between particulate emission rate and wind speed. The equation is as follows: Emission Factor = (k)(0.0032)(U/5)1.3/(M/2)1.4 lb/ton of material handled
Where: k = particle size multiplier
= 0.74 for PM (<30 ) = 0.35 for PM10 = 0.053 for PM2.5
U = mean wind speed (miles per hour) M = material moisture content, %
For constant particle size and material moisture content, the equation can be simplified using a new constant value ‘c’: Emission factor = c(U/5)1.3
This empirical equation is reported to be valid for wind speed conditions within a range of 1.3 to 15 mph. The average outdoor wind speed for the project area, as represented by data from the OCC meteorological station, is 7.7 mph. Assuming that the average wind speed within an enclosure is equal to the minimum wind speed for which the equation is valid, the enclosure efficiency relative to the unenclosed case is calculated as follows: Efficiency = [(7.7/5)1.3 - (1.3/5)1.3]/(7.7/5)1.3 = 90%
This equation yields a control efficiency value of 90% resulting from enclosing a particulate emission source. For the fogging dust suppression system, a control efficiency of 97.5% was used based on information provided in Section 5.0. As the primary dust control system, the emissions control efficiency for the fogging dust suppression was assumed for the emissions calculation. No credit was claimed for enclosure, although it undoubtedly enhances control of emissions. Example Emission Calculation: PM Emissions for 35,000,000 tons of coal mined a year: (0.001219 lb PM/ton coal/drop) x (6 drops) x (35,000,000 ton/yr) / (2000 lb/ton) x (1- 0.975) = 3.20 ton/yr
Otter Creek Coal Mine Page 51 MAQP Application OCC212408
PM10 Emissions for 35,000,000 tons of coal mined a year: (0.000576 lb PM10/ton coal) x (6 drops) x (35,000,000 ton/yr) / (2000 lb/ton) x (1- 0.975) = 1.51 ton/yr PM2.5 Emissions for 35,000,000 tons of coal mined a year: (0.000087 lb PM2.5 /ton coal) x (6 drops) x (35,000,000 ton/yr) / (2000 lb/ton) x (1- 0.975) = 0.23 ton/yr
3.1.21 Emission Point 14a Diesel-fired Equipment This category includes emissions produced by diesel-fired mobile, portable and stationary equipment. Emission Factors: The emission factors for the equipment were based on using non-road diesel engines that comply with Tier 4 standards of 40 CFR 1039, Control of Emissions From New and In-Use Nonroad Compression-Ignition Engines. The Tier 4 emission standards are promulgated for PM, NOx, CO, and non-methane hydrocarbons. Emission factors for SO2 and CO2 were obtained from AP-42, Chapter 3.4 for Large Stationary Diesel and All Stationary Dual-fuel Engines. The Tier 4 emission standards were converted from a gram/brake horsepower-hour basis to a lb/gallon basis using a fuel consumption estimate of 7000 Btu/hp-hr from AP-42, Chapter 3.4-1 and a diesel heat content of 137,000 Btu/gal found in AP-42, Appendix A. Tier 4 Emission factors (lb/gal) = (emission factor, g/bhp-hr) / (fuel consumption, Btu/hp-hr) / (453.59 g/lb) x (diesel heat content, Btu/gal) Emission Factor for PM (<30 ) = (0.075 g/bhp-hr)/(7000 Btu/hp-hr)/(453.59 g/lb) x (137,000 Btu/gal) = 0.0032 lb/gal Emission Factor for PM10 = (0.075 g/bhp-hr)/(7000 Btu/hp-hr)/(453.59 g/lb) x (137,000 Btu/gal) = 0.0032 lb/gal Emission Factor for PM2.5 = (0.075 g/bhp-hr)/(7000 Btu/hp-hr)/(453.59 g/lb) x (137,000 Btu/gal) = 0.0032 lb/gal Emission Factor for CO = (2.6 g/bhp-hr)/(7000 Btu/hp-hr)/(453.59 g/lb) x (137,000 Btu/gal) = 0.1122 lb/gal Emission Factor for NO2 (NOx) = (2.6 g/bhp-hr)/(7000 Btu/hp-hr)/(453.59 g/lb) x (137,000 Btu/gal) = 0.1122 lb/gal
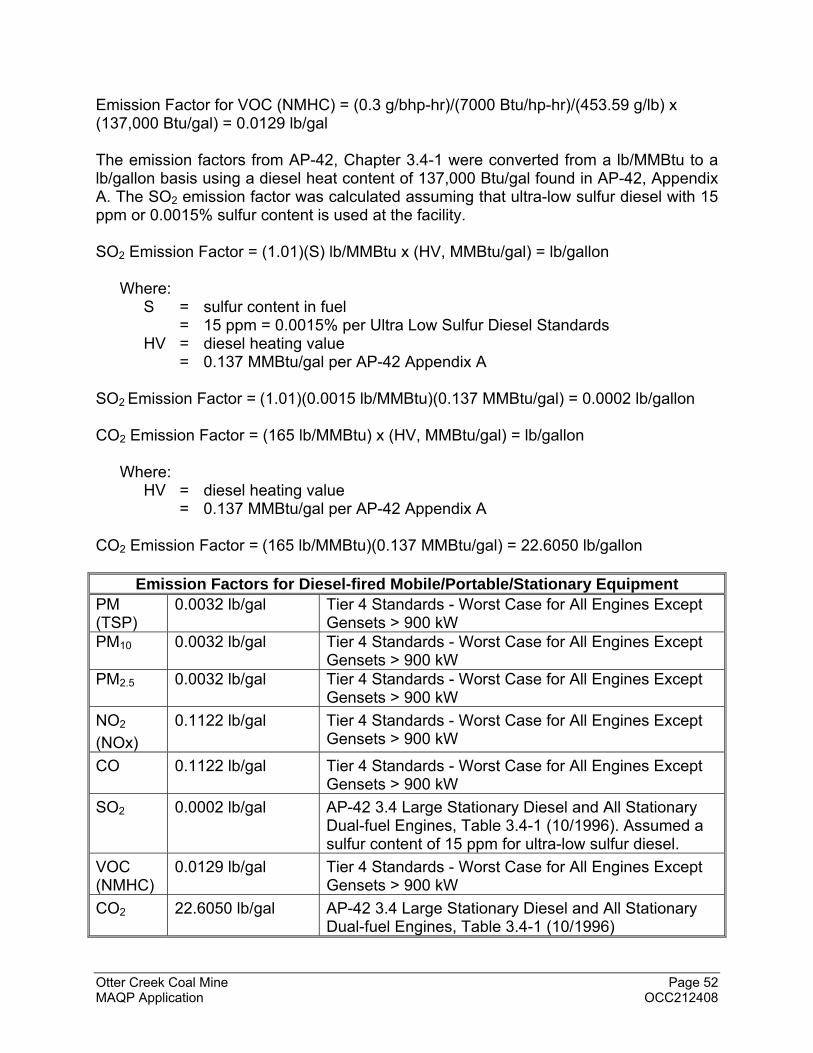
Otter Creek Coal Mine Page 52 MAQP Application OCC212408
Emission Factor for VOC (NMHC) = (0.3 g/bhp-hr)/(7000 Btu/hp-hr)/(453.59 g/lb) x (137,000 Btu/gal) = 0.0129 lb/gal The emission factors from AP-42, Chapter 3.4-1 were converted from a lb/MMBtu to a lb/gallon basis using a diesel heat content of 137,000 Btu/gal found in AP-42, Appendix A. The SO2 emission factor was calculated assuming that ultra-low sulfur diesel with 15 ppm or 0.0015% sulfur content is used at the facility. SO2 Emission Factor = (1.01)(S) lb/MMBtu x (HV, MMBtu/gal) = lb/gallon
Where: S = sulfur content in fuel
= 15 ppm = 0.0015% per Ultra Low Sulfur Diesel Standards HV = diesel heating value
= 0.137 MMBtu/gal per AP-42 Appendix A
SO2 Emission Factor = (1.01)(0.0015 lb/MMBtu)(0.137 MMBtu/gal) = 0.0002 lb/gallon CO2 Emission Factor = (165 lb/MMBtu) x (HV, MMBtu/gal) = lb/gallon
Where: HV = diesel heating value
= 0.137 MMBtu/gal per AP-42 Appendix A CO2 Emission Factor = (165 lb/MMBtu)(0.137 MMBtu/gal) = 22.6050 lb/gallon
Emission Factors for Diesel-fired Mobile/Portable/Stationary Equipment PM (TSP)
0.0032 lb/gal Tier 4 Standards - Worst Case for All Engines Except Gensets > 900 kW
PM10 0.0032 lb/gal Tier 4 Standards - Worst Case for All Engines Except Gensets > 900 kW
PM2.5 0.0032 lb/gal Tier 4 Standards - Worst Case for All Engines Except Gensets > 900 kW
NO2
(NOx)
0.1122 lb/gal Tier 4 Standards - Worst Case for All Engines Except Gensets > 900 kW
CO 0.1122 lb/gal Tier 4 Standards - Worst Case for All Engines Except Gensets > 900 kW
SO2 0.0002 lb/gal AP-42 3.4 Large Stationary Diesel and All Stationary Dual-fuel Engines, Table 3.4-1 (10/1996). Assumed a sulfur content of 15 ppm for ultra-low sulfur diesel.
VOC (NMHC)
0.0129 lb/gal Tier 4 Standards - Worst Case for All Engines Except Gensets > 900 kW
CO2 22.6050 lb/gal AP-42 3.4 Large Stationary Diesel and All Stationary Dual-fuel Engines, Table 3.4-1 (10/1996)
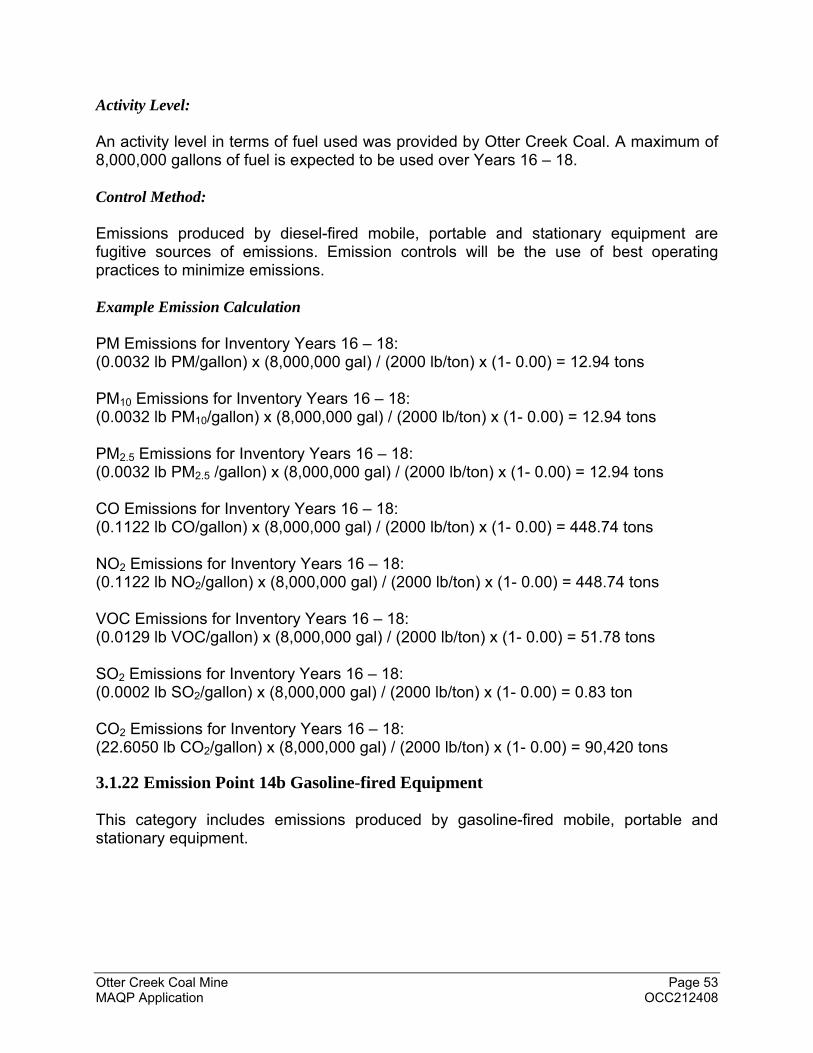
Otter Creek Coal Mine Page 53 MAQP Application OCC212408
Activity Level: An activity level in terms of fuel used was provided by Otter Creek Coal. A maximum of 8,000,000 gallons of fuel is expected to be used over Years 16 – 18. Control Method: Emissions produced by diesel-fired mobile, portable and stationary equipment are fugitive sources of emissions. Emission controls will be the use of best operating practices to minimize emissions. Example Emission Calculation PM Emissions for Inventory Years 16 – 18: (0.0032 lb PM/gallon) x (8,000,000 gal) / (2000 lb/ton) x (1- 0.00) = 12.94 tons PM10 Emissions for Inventory Years 16 – 18: (0.0032 lb PM10/gallon) x (8,000,000 gal) / (2000 lb/ton) x (1- 0.00) = 12.94 tons PM2.5 Emissions for Inventory Years 16 – 18: (0.0032 lb PM2.5 /gallon) x (8,000,000 gal) / (2000 lb/ton) x (1- 0.00) = 12.94 tons CO Emissions for Inventory Years 16 – 18: (0.1122 lb CO/gallon) x (8,000,000 gal) / (2000 lb/ton) x (1- 0.00) = 448.74 tons NO2 Emissions for Inventory Years 16 – 18: (0.1122 lb NO2/gallon) x (8,000,000 gal) / (2000 lb/ton) x (1- 0.00) = 448.74 tons VOC Emissions for Inventory Years 16 – 18: (0.0129 lb VOC/gallon) x (8,000,000 gal) / (2000 lb/ton) x (1- 0.00) = 51.78 tons SO2 Emissions for Inventory Years 16 – 18: (0.0002 lb SO2/gallon) x (8,000,000 gal) / (2000 lb/ton) x (1- 0.00) = 0.83 ton CO2 Emissions for Inventory Years 16 – 18: (22.6050 lb CO2/gallon) x (8,000,000 gal) / (2000 lb/ton) x (1- 0.00) = 90,420 tons
3.1.22 Emission Point 14b Gasoline-fired Equipment This category includes emissions produced by gasoline-fired mobile, portable and stationary equipment.
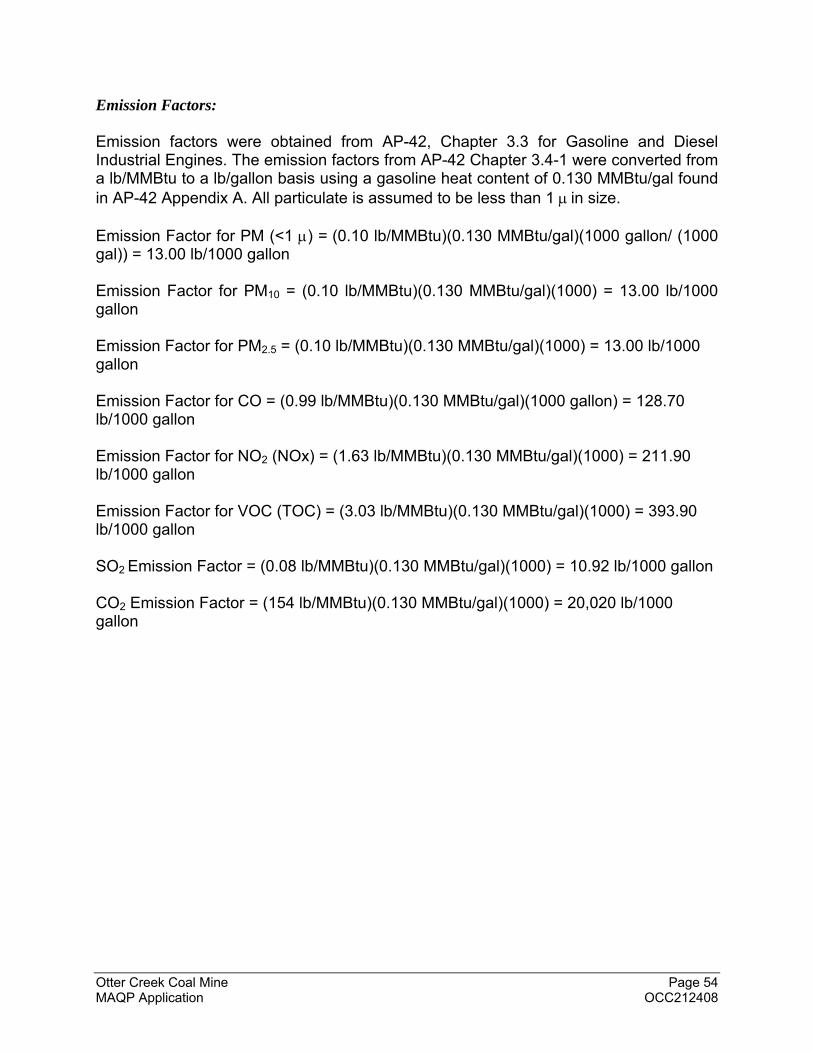
Otter Creek Coal Mine Page 54 MAQP Application OCC212408
Emission Factors: Emission factors were obtained from AP-42, Chapter 3.3 for Gasoline and Diesel Industrial Engines. The emission factors from AP-42 Chapter 3.4-1 were converted from a lb/MMBtu to a lb/gallon basis using a gasoline heat content of 0.130 MMBtu/gal found in AP-42 Appendix A. All particulate is assumed to be less than 1 in size. Emission Factor for PM (<1 ) = (0.10 lb/MMBtu)(0.130 MMBtu/gal)(1000 gallon/ (1000 gal)) = 13.00 lb/1000 gallon Emission Factor for PM10 = (0.10 lb/MMBtu)(0.130 MMBtu/gal)(1000) = 13.00 lb/1000 gallon Emission Factor for PM2.5 = (0.10 lb/MMBtu)(0.130 MMBtu/gal)(1000) = 13.00 lb/1000 gallon Emission Factor for CO = (0.99 lb/MMBtu)(0.130 MMBtu/gal)(1000 gallon) = 128.70 lb/1000 gallon Emission Factor for NO2 (NOx) = (1.63 lb/MMBtu)(0.130 MMBtu/gal)(1000) = 211.90 lb/1000 gallon Emission Factor for VOC (TOC) = (3.03 lb/MMBtu)(0.130 MMBtu/gal)(1000) = 393.90 lb/1000 gallon SO2 Emission Factor = (0.08 lb/MMBtu)(0.130 MMBtu/gal)(1000) = 10.92 lb/1000 gallon CO2 Emission Factor = (154 lb/MMBtu)(0.130 MMBtu/gal)(1000) = 20,020 lb/1000 gallon
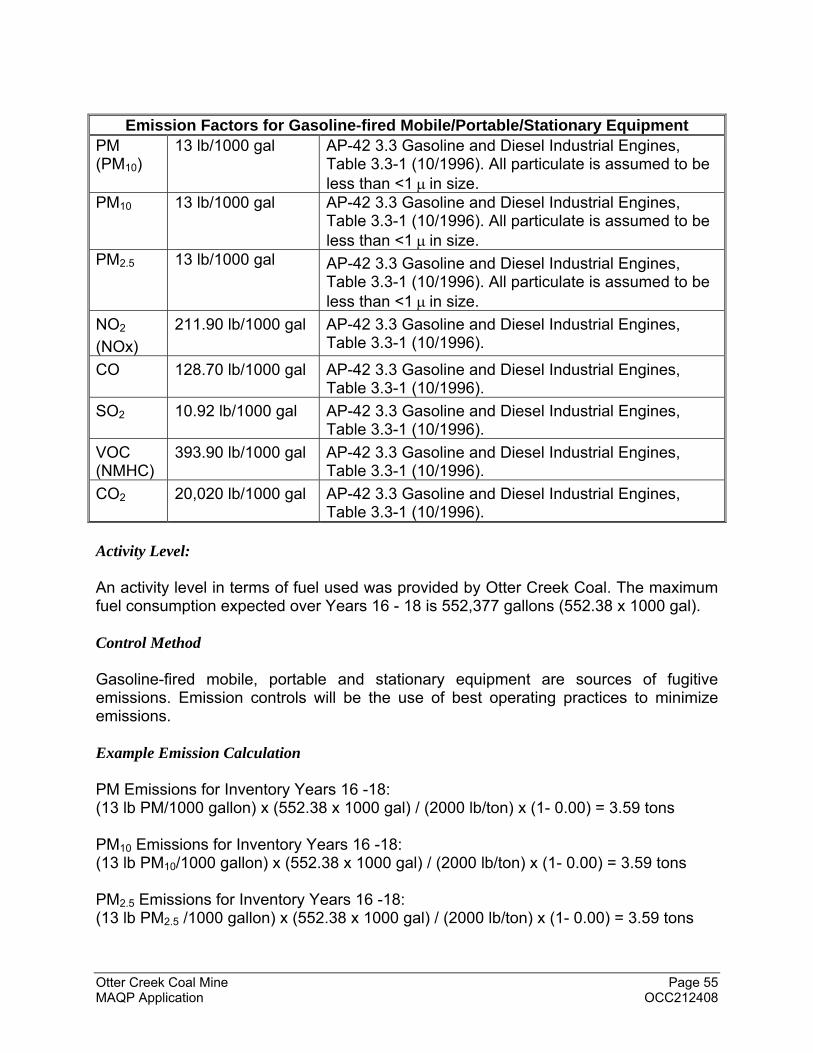
Otter Creek Coal Mine Page 55 MAQP Application OCC212408
Emission Factors for Gasoline-fired Mobile/Portable/Stationary Equipment
PM (PM10)
13 lb/1000 gal AP-42 3.3 Gasoline and Diesel Industrial Engines, Table 3.3-1 (10/1996). All particulate is assumed to be less than <1 in size.
PM10 13 lb/1000 gal AP-42 3.3 Gasoline and Diesel Industrial Engines, Table 3.3-1 (10/1996). All particulate is assumed to be less than <1 in size.
PM2.5 13 lb/1000 gal AP-42 3.3 Gasoline and Diesel Industrial Engines, Table 3.3-1 (10/1996). All particulate is assumed to be less than <1 in size.
NO2
(NOx)
211.90 lb/1000 gal AP-42 3.3 Gasoline and Diesel Industrial Engines, Table 3.3-1 (10/1996).
CO 128.70 lb/1000 gal AP-42 3.3 Gasoline and Diesel Industrial Engines, Table 3.3-1 (10/1996).
SO2 10.92 lb/1000 gal AP-42 3.3 Gasoline and Diesel Industrial Engines, Table 3.3-1 (10/1996).
VOC (NMHC)
393.90 lb/1000 gal AP-42 3.3 Gasoline and Diesel Industrial Engines, Table 3.3-1 (10/1996).
CO2 20,020 lb/1000 gal AP-42 3.3 Gasoline and Diesel Industrial Engines, Table 3.3-1 (10/1996).
Activity Level: An activity level in terms of fuel used was provided by Otter Creek Coal. The maximum fuel consumption expected over Years 16 - 18 is 552,377 gallons (552.38 x 1000 gal). Control Method Gasoline-fired mobile, portable and stationary equipment are sources of fugitive emissions. Emission controls will be the use of best operating practices to minimize emissions. Example Emission Calculation PM Emissions for Inventory Years 16 -18: (13 lb PM/1000 gallon) x (552.38 x 1000 gal) / (2000 lb/ton) x (1- 0.00) = 3.59 tons PM10 Emissions for Inventory Years 16 -18: (13 lb PM10/1000 gallon) x (552.38 x 1000 gal) / (2000 lb/ton) x (1- 0.00) = 3.59 tons PM2.5 Emissions for Inventory Years 16 -18: (13 lb PM2.5 /1000 gallon) x (552.38 x 1000 gal) / (2000 lb/ton) x (1- 0.00) = 3.59 tons
Otter Creek Coal Mine Page 56 MAQP Application OCC212408
CO Emissions for Inventory Years 16 -18: (128.7 lb CO/1000 gallon) x (552.38 x 1000 gal) / (2000 lb/ton) x (1- 0.00) = 35.55 tons NO2 Emissions for Inventory Years 16 -18: (211.9lb NO2/1000 gallon) x (552.38 x 1000 gal) / (2000 lb/ton) x (1- 0.00) = 58.52 tons VOC Emissions for Inventory Years 16 -18: (393.90 lb VOC/1000 gallon) x (552.38 x 1000 gal) / (2000 lb/ton) x (1- 0.00) = 108.79 tons SO2 Emissions for Inventory Years 16 -18: (10.92 lb SO2/1000 gallon) x (552.38 x 1000 gal) / (2000 lb/ton) x (1- 0.00) = 3.02 tons CO2 Emissions for Inventory Years 16 -18: (20,020 lb CO2/1000 gallon) x (552.38 x 1000 gal) / (2000 lb/ton) x (1- 0.00) = 5,529.3 ton/yr
3.1.23 Emission Point 15 Explosives This category includes emissions produced by explosives used for the mining operation. Emission Factors: The source for each emission factor is summarized below. Emission Factors for Explosives NO2 17 lb/ton explosive AP-42 13.3 Explosives Detonation, Table 13.3-1 (2/1980)
for ANFO (ammonium nitrate with 5.8-8% fuel oil) CO 67 lb/ton explosive AP-42 13.3 Explosives Detonation, Table 13.3-1 (2/1980)
for ANFO (ammonium nitrate with 5.8-8% fuel oil) SO2 2 lb/ton explosive AP-42 13.3 Explosives Detonation, Table 13.3-1 (2/1980)
for ANFO (ammonium nitrate with 5.8-8% fuel oil) Activity Level: An activity level in terms of tons of explosives used per year was provided by Otter Creek Coal. A maximum of 50,016 tons of explosives is expected to be used over Years 16 – 18. Control Method Explosive use is a fugitive source of emissions. Emission controls will be the use of best operating practices to minimize emissions. To be conservative, no emissions control was assumed for emissions calculation.
Otter Creek Coal Mine Page 57 MAQP Application OCC212408
Example Emission Calculation NO2 Emissions for Years 16 – 18: (17 lb NO2 /ton explosives) x (50,016 ton explosives) / (2000 lb/ton) x (1- 0.00) = 425.13 tons CO Emissions for Years 16 – 18: (67 lb CO/ton explosives) x (50,016 ton explosives) / (2000 lb/ton) x (1- 0.00) = 1675.53 ton/yr SO2 Emissions for Years 16 – 18: (2 lb SO2/ton explosives) x (50,016 ton explosives) / (2000 lb/ton) x (1- 0.00) = 50.02 ton/yr
3.1.24 Emission Point 16 Train Loadout This category includes emissions produced by unloading coal into railcars. Emission Factors: As recommended in AP-42, on page 11.9.4 Western Surface Coal Mining (10/98), the emission factor is calculated using equation 13.2.4(1) of AP-42, 13.2.4 Aggregate Handling and Storage Piles (11/06) which is shown below. Emission Factor = (k)(0.0032)(U/5)1.3/(M/2)1.4 lb/ton of material handled
Where: k = particle size multiplier
= 0.74 for PM = 0.35 for PM10 = 0.053 for PM2.5
U = mean wind speed (miles per hour) = 7.7 miles per hour, mean for OCC onsite data 2012
M = material moisture content, % = 4.8% per equation maximum value (Per AP-42 Table 11.9-3, the average
free moisture content of Otter Creek Coal is 12%, but the moisture content used in the calculation was limited to the equation maximum value.)
Emission Factor for PM = (0.74)(0.0032)(7.7/5)1.3/(4.8/2)1.4 = 0.001219 lb/ton Emission Factor for PM10 = (0.35)(0.0032)(7.7/5)1.3/(4.8/2)1.4 = 0.000576 lb/ton Emission Factor for PM2.5 = (0.053)(0.0032)(7.7/5)1.3/(4.8/2)1.4 = 0.000087 lb/ton
Otter Creek Coal Mine Page 58 MAQP Application OCC212408
Emission Factors for Train Loadouts
PM (TSP)
0.001219 lb/ton coal
AP-42 13.2.4 Aggregate Handling and Storage Piles (11/06) as recommended in AP-42 on page 11.9.4 Western Surface Coal Mining (10/98)
PM10 0.000576 lb/ton coal
AP-42 13.2.4 Aggregate Handling and Storage Piles (11/06) as recommended in AP-42 on page 11.9.4 Western Surface Coal Mining (10/98)
PM2.5 0.000087 lb/ton coal handled
AP-42 13.2.4 Aggregate Handling and Storage Piles (11/06) as recommended in AP-42 on page 11.9.4 Western Surface Coal Mining (10/98)
Activity Level: An activity level in terms of tons of coal loaded into railcars per year was provided by Otter Creek Coal. The emissions were calculated based on the maximum throughput of 35 million tons of coal mined a year. Control Method The unloading of coal into railcars is a point source of emissions. Emission controls include using a fogging dust suppression system and enclosed chutes. The fogging dust suppression system is the primary emissions control technique. The enclosure enhances control, and it is assumed to have a control efficiency based on the reduction of wind speed as described below. An enclosure has the dual effect of preventing emissions from being released and preventing wind from dispersing the emissions. A 90% control efficiency can be supported by examining the transfer emissions equation in AP-42, Chapter 13.2.4 and the relationship it provides between particulate emission rate and wind speed. The equation is as follows: Emission Factor = (k)(0.0032)(U/5)1.3/(M/2)1.4 lb/ton of material handled
Where: k = particle size multiplier
= 0.74 for PM = 0.35 for PM10 = 0.053 for PM2.5
U = mean wind speed (miles per hour) M = material moisture content, %
For constant particle size and material moisture content, the equation can be simplified using a new constant value ‘c’: Emission factor = c(U/5)1.3
Otter Creek Coal Mine Page 59 MAQP Application OCC212408
This empirical equation is reported to be valid for wind speed conditions within a range of 1.3 to 15 mph. The average outdoor wind speed for the project area, as represented by data from the OCC meteorological station, is 7.7 mph. Assuming average wind speed within an enclosure is no more than the minimum wind speed for which the equation is valid, the enclosure efficiency relative to the unenclosed case is calculated as follows: Efficiency = [(7.7/5)1.3 - (1.3/5)1.3]/(7.7/5)1.3 = 90%
This equation yields a control efficiency value of 90% resulting from enclosing a particulate emission source. For the fogging dust suppression system, a control efficiency of 97.5% was used based on information provided in Section 5.0. As the primary dust control system, the emissions control efficiency for the fogging dust suppression was assumed for the emissions calculation. No credit was claimed for enclosure, although it undoubtedly enhances control of emissions. Example Emission Calculation PM Emissions: (0.001219 lb PM/ton coal) x (35,000,000 ton/yr) / (2000 lb/ton) x (1- 0.975) = 0.53 ton/yr PM10 Emissions: (0.000576 lb PM10/ton coal) x (35,000,000 ton/yr) / (2000 lb/ton) x (1- 0.975) = 0.25 ton/yr PM2.5 Emissions: (0.000087 lb PM2.5 /ton coal) x (35,000,000 ton/yr) / (2000 lb/ton) x (1- 0.975) = 0.04 ton
3.1.25 Emission Point 17a Disturbed Acres – Pits, Peaks, and Soil Stripping This category includes emissions produced by wind erosion of pits, peaks and stripped soils areas.
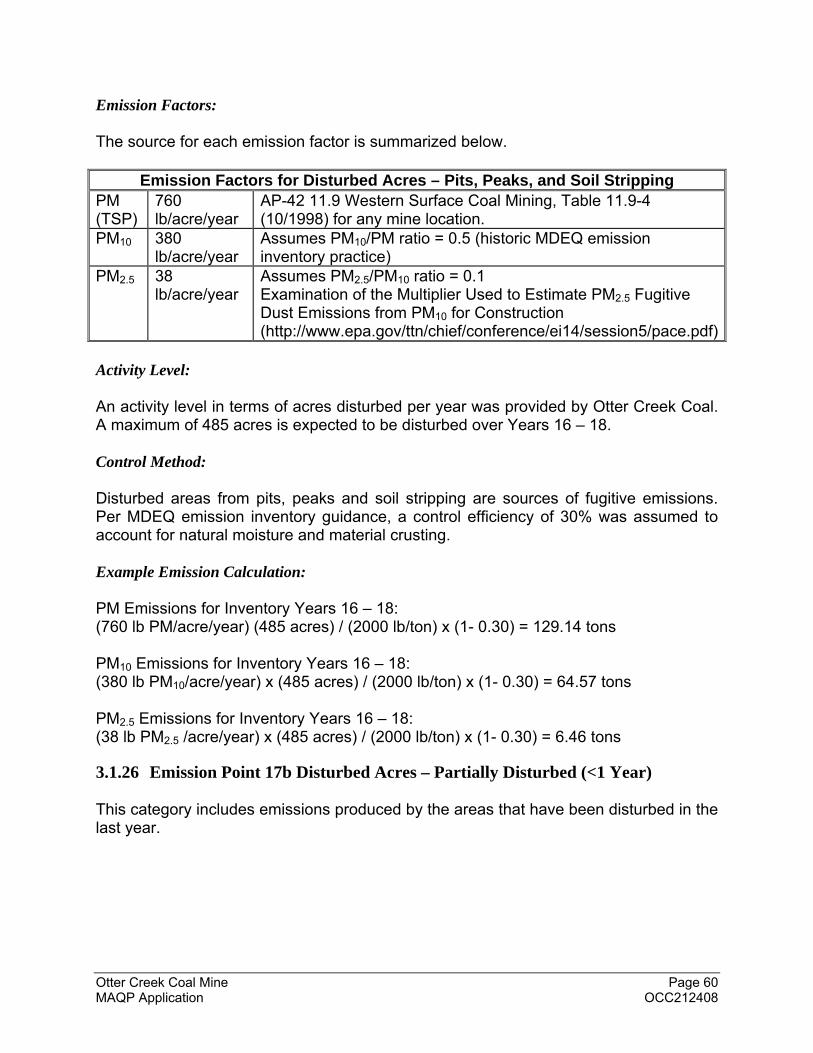
Otter Creek Coal Mine Page 60 MAQP Application OCC212408
Emission Factors: The source for each emission factor is summarized below.
Emission Factors for Disturbed Acres – Pits, Peaks, and Soil Stripping PM (TSP)
760 lb/acre/year
AP-42 11.9 Western Surface Coal Mining, Table 11.9-4 (10/1998) for any mine location.
PM10 380 lb/acre/year
Assumes PM10/PM ratio = 0.5 (historic MDEQ emission inventory practice)
PM2.5 38 lb/acre/year
Assumes PM2.5/PM10 ratio = 0.1 Examination of the Multiplier Used to Estimate PM2.5 Fugitive Dust Emissions from PM10 for Construction (http://www.epa.gov/ttn/chief/conference/ei14/session5/pace.pdf)
Activity Level: An activity level in terms of acres disturbed per year was provided by Otter Creek Coal. A maximum of 485 acres is expected to be disturbed over Years 16 – 18. Control Method: Disturbed areas from pits, peaks and soil stripping are sources of fugitive emissions. Per MDEQ emission inventory guidance, a control efficiency of 30% was assumed to account for natural moisture and material crusting. Example Emission Calculation: PM Emissions for Inventory Years 16 – 18: (760 lb PM/acre/year) (485 acres) / (2000 lb/ton) x (1- 0.30) = 129.14 tons PM10 Emissions for Inventory Years 16 – 18: (380 lb PM10/acre/year) x (485 acres) / (2000 lb/ton) x (1- 0.30) = 64.57 tons PM2.5 Emissions for Inventory Years 16 – 18: (38 lb PM2.5 /acre/year) x (485 acres) / (2000 lb/ton) x (1- 0.30) = 6.46 tons
3.1.26 Emission Point 17b Disturbed Acres – Partially Disturbed (<1 Year) This category includes emissions produced by the areas that have been disturbed in the last year.
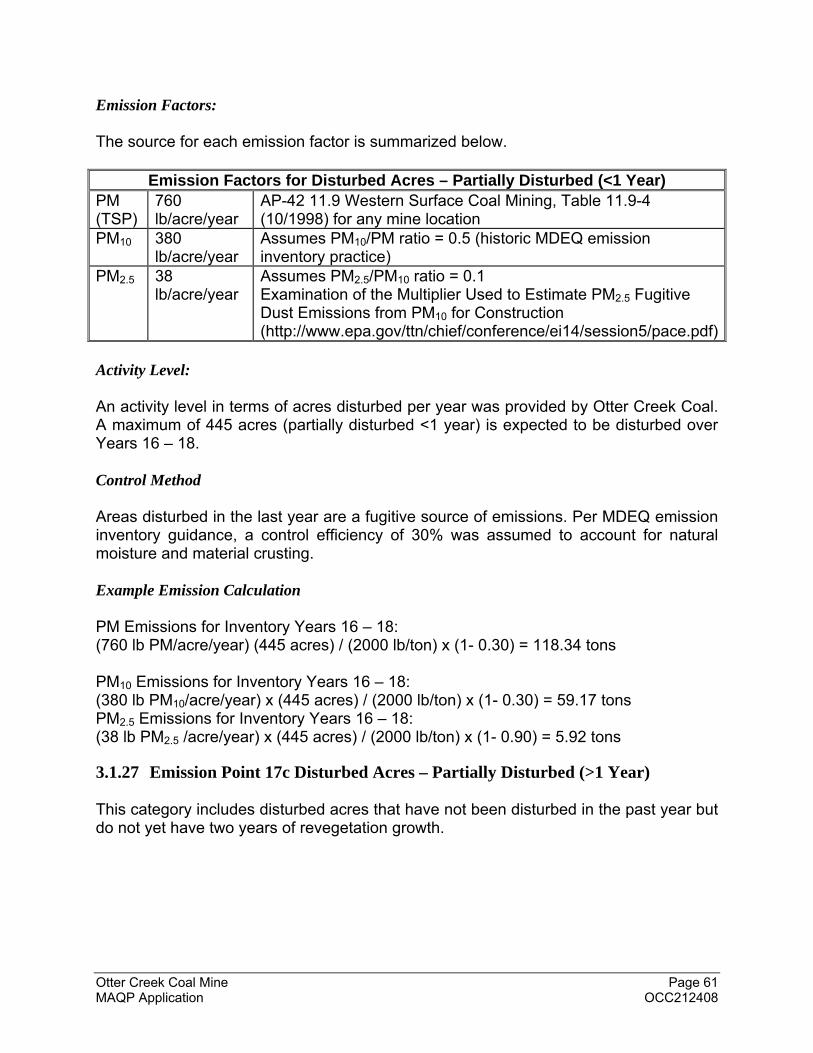
Otter Creek Coal Mine Page 61 MAQP Application OCC212408
Emission Factors: The source for each emission factor is summarized below.
Emission Factors for Disturbed Acres – Partially Disturbed (<1 Year) PM (TSP)
760 lb/acre/year
AP-42 11.9 Western Surface Coal Mining, Table 11.9-4 (10/1998) for any mine location
PM10 380 lb/acre/year
Assumes PM10/PM ratio = 0.5 (historic MDEQ emission inventory practice)
PM2.5 38 lb/acre/year
Assumes PM2.5/PM10 ratio = 0.1 Examination of the Multiplier Used to Estimate PM2.5 Fugitive Dust Emissions from PM10 for Construction (http://www.epa.gov/ttn/chief/conference/ei14/session5/pace.pdf)
Activity Level: An activity level in terms of acres disturbed per year was provided by Otter Creek Coal. A maximum of 445 acres (partially disturbed <1 year) is expected to be disturbed over Years 16 – 18. Control Method Areas disturbed in the last year are a fugitive source of emissions. Per MDEQ emission inventory guidance, a control efficiency of 30% was assumed to account for natural moisture and material crusting. Example Emission Calculation PM Emissions for Inventory Years 16 – 18: (760 lb PM/acre/year) (445 acres) / (2000 lb/ton) x (1- 0.30) = 118.34 tons PM10 Emissions for Inventory Years 16 – 18: (380 lb PM10/acre/year) x (445 acres) / (2000 lb/ton) x (1- 0.30) = 59.17 tons PM2.5 Emissions for Inventory Years 16 – 18: (38 lb PM2.5 /acre/year) x (445 acres) / (2000 lb/ton) x (1- 0.90) = 5.92 tons
3.1.27 Emission Point 17c Disturbed Acres – Partially Disturbed (>1 Year) This category includes disturbed acres that have not been disturbed in the past year but do not yet have two years of revegetation growth.
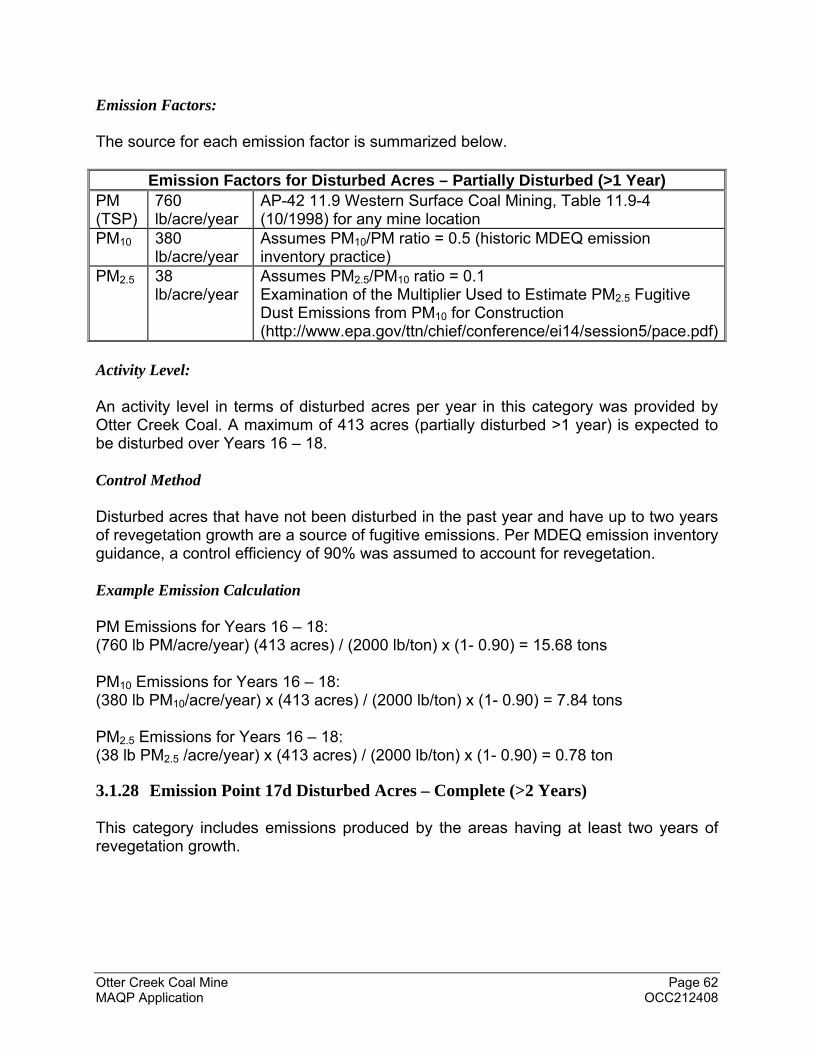
Otter Creek Coal Mine Page 62 MAQP Application OCC212408
Emission Factors: The source for each emission factor is summarized below.
Emission Factors for Disturbed Acres – Partially Disturbed (>1 Year) PM (TSP)
760 lb/acre/year
AP-42 11.9 Western Surface Coal Mining, Table 11.9-4 (10/1998) for any mine location
PM10 380 lb/acre/year
Assumes PM10/PM ratio = 0.5 (historic MDEQ emission inventory practice)
PM2.5 38 lb/acre/year
Assumes PM2.5/PM10 ratio = 0.1 Examination of the Multiplier Used to Estimate PM2.5 Fugitive Dust Emissions from PM10 for Construction (http://www.epa.gov/ttn/chief/conference/ei14/session5/pace.pdf)
Activity Level: An activity level in terms of disturbed acres per year in this category was provided by Otter Creek Coal. A maximum of 413 acres (partially disturbed >1 year) is expected to be disturbed over Years 16 – 18. Control Method Disturbed acres that have not been disturbed in the past year and have up to two years of revegetation growth are a source of fugitive emissions. Per MDEQ emission inventory guidance, a control efficiency of 90% was assumed to account for revegetation. Example Emission Calculation PM Emissions for Years 16 – 18: (760 lb PM/acre/year) (413 acres) / (2000 lb/ton) x (1- 0.90) = 15.68 tons PM10 Emissions for Years 16 – 18: (380 lb PM10/acre/year) x (413 acres) / (2000 lb/ton) x (1- 0.90) = 7.84 tons PM2.5 Emissions for Years 16 – 18: (38 lb PM2.5 /acre/year) x (413 acres) / (2000 lb/ton) x (1- 0.90) = 0.78 ton
3.1.28 Emission Point 17d Disturbed Acres – Complete (>2 Years) This category includes emissions produced by the areas having at least two years of revegetation growth.
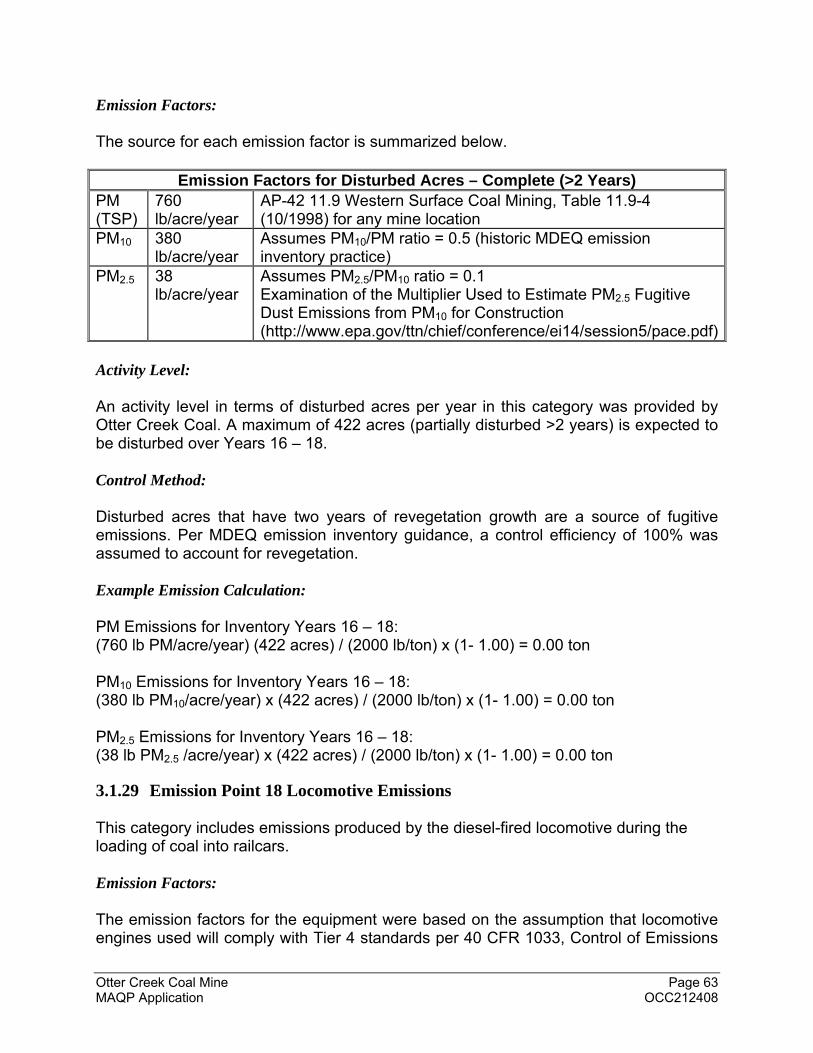
Otter Creek Coal Mine Page 63 MAQP Application OCC212408
Emission Factors: The source for each emission factor is summarized below.
Emission Factors for Disturbed Acres – Complete (>2 Years) PM (TSP)
760 lb/acre/year
AP-42 11.9 Western Surface Coal Mining, Table 11.9-4 (10/1998) for any mine location
PM10 380 lb/acre/year
Assumes PM10/PM ratio = 0.5 (historic MDEQ emission inventory practice)
PM2.5 38 lb/acre/year
Assumes PM2.5/PM10 ratio = 0.1 Examination of the Multiplier Used to Estimate PM2.5 Fugitive Dust Emissions from PM10 for Construction (http://www.epa.gov/ttn/chief/conference/ei14/session5/pace.pdf)
Activity Level: An activity level in terms of disturbed acres per year in this category was provided by Otter Creek Coal. A maximum of 422 acres (partially disturbed >2 years) is expected to be disturbed over Years 16 – 18. Control Method: Disturbed acres that have two years of revegetation growth are a source of fugitive emissions. Per MDEQ emission inventory guidance, a control efficiency of 100% was assumed to account for revegetation. Example Emission Calculation: PM Emissions for Inventory Years 16 – 18: (760 lb PM/acre/year) (422 acres) / (2000 lb/ton) x (1- 1.00) = 0.00 ton PM10 Emissions for Inventory Years 16 – 18: (380 lb PM10/acre/year) x (422 acres) / (2000 lb/ton) x (1- 1.00) = 0.00 ton PM2.5 Emissions for Inventory Years 16 – 18: (38 lb PM2.5 /acre/year) x (422 acres) / (2000 lb/ton) x (1- 1.00) = 0.00 ton
3.1.29 Emission Point 18 Locomotive Emissions This category includes emissions produced by the diesel-fired locomotive during the loading of coal into railcars. Emission Factors: The emission factors for the equipment were based on the assumption that locomotive engines used will comply with Tier 4 standards per 40 CFR 1033, Control of Emissions
Otter Creek Coal Mine Page 64 MAQP Application OCC212408
from Locomotives. The Tier 4 emission standards address PM, NOx, CO, and hydrocarbons. Emission factors for SO2 and CO2 were obtained from AP-42, Chapter 3.4 for Large Stationary Diesel and All Stationary Dual-fuel Engines. The Tier 4 emission standards were converted from a gram/brake horsepower-hour basis to a lb/gallon basis using a conversion factor of 20.8 Btu/hp-hr estimate from the EPA’s Technical Highlights for Emission Factors for Locomotives (4/09) (http://www.epa.gov/nonroad/locomotv/420f09025.pdf). Tier 4 Emission Factors (lb/gal) = (Emission Factor, g/bhp-hr) x (Conversion Factor, hp-hr/gallon) / (453.59 g/lb) Emission Factor for PM = (0.03 g/bhp-hr)(20.8 Btu/hp-hr)/(453.59 g/lb) = 0.0014 lb/gal Emission Factor for PM10 = (0.03 g/bhp-hr)(20.8 Btu/hp-hr)/(453.59 g/lb) = 0.0014 lb/gal Emission Factor for PM2.5 = (0.03 g/bhp-hr)(20.8 Btu/hp-hr)/(453.59 g/lb) = 0.0014 lb/gal Emission Factor for CO = (1.5 g/bhp-hr)(20.8 Btu/hp-hr)/(453.59 g/lb) = 0.0688 lb/gal Emission Factor for NO2 (NOx) = (1.3 g/bhp-hr)(20.8 Btu/hp-hr)/(453.59 g/lb) = 0.0596 lb/gal Emission Factor for VOC (HC) = (0.14 g/bhp-hr)/(20.8 bhp-hr/gal)/(453.59 g/lb) = 0.0064 lb/gal The emission factors from AP-42 Chapter 3.4-1 were converted from a lb/MMBtu to a lb/gallon basis using a diesel heat content of 0.137 MMBtu/gal found in AP-42 Appendix A. The SO2 emission factor was calculated assuming that ultra-low sulfur diesel with 15 ppm or 0.0015% sulfur content is used at the facility. SO2 Emission Factor = (1.01)(S) lb/MMBtu x (HV, MMBtu/gal) = lb/gallon
Where: S = sulfur content in fuel
= 15 ppm = 0.0015% per Ultra Low Sulfur Diesel Standards HV = diesel heating value
= 0.137 MMBtu/gal per AP-42 Appendix A
SO2 Emission Factor = (1.01)(0.0015 lb/MMBtu)(0.137 MMBtu/gal) = 0.0002 lb/gallon CO2 Emission Factor = (165 lb/MMBtu)(0.137 MMBtu/gal) = 22.6050 lb/gallon
Otter Creek Coal Mine Page 65 MAQP Application OCC212408
Emission Factors for Diesel-fired Locomotives PM (TSP) 0.0014 lb/gal Tier 4 Standards - Table 1 to 40 CFR 1033.101 PM10 0.0014 lb/gal Tier 4 Standards - Table 1 to 40 CFR 1033.101 PM2.5 0.0014 lb/gal Tier 4 Standards - Table 1 to 40 CFR 1033.101
NO2 (NOx) 0.0596 lb/gal Tier 4 Standards - Table 1 to 40 CFR 1033.101
CO 0.0688 lb/gal Tier 4 Standards - Table 1 to 40 CFR 1033.101
SO2 0.0002 lb/gal AP-42 3.4 Large Stationary Diesel and All Stationary Dual-fuel Engines, Table 3.4-1 (10/1996). Assumed a sulfur content of 15 ppm for ultra-low sulfur diesel.
VOC (NMHC)
0.0064 lb/gal Tier 4 Standards - Table 1 to 40 CFR 1033.101
CO2 22.6050 lb/gal AP-42 3.4 Large Stationary Diesel and All Stationary Dual-fuel Engines, Table 3.4-1 (10/1996)
Activity Level: An activity level in terms of fuel used by the locomotive during loading of a trainload of coal was provided by Otter Creek Coal. A maximum of 755,582 gallons of fuel is expected to be used over Years 16 – 18. Control Method: Emissions produced by diesel-fired locomotives are fugitive sources of emissions. No additional control beyond use of a Tier 4 locomotive engine was included in the calculation of emissions. Example Emission Calculation: PM Emissions for Years 16 – 18: (0.0014 lb PM/gallon) x (755,582 gal) / (2000 lb/ton) x (1- 0.00) = 0.52 ton PM10 Emissions for Years 16 – 18: (0.0014 lb PM10/gallon) x (755,582 gal) / (2000 lb/ton) x (1- 0.00) = 0.52 ton PM2.5 Emissions for Years 16 – 18: (0.0014 lb PM2.5 /gallon) x (755,582 gal) / (2000 lb/ton) x (1- 0.00) = 0.52 ton CO Emissions for Years 16 – 18: (0.0688 lb CO/gallon) x (755,582 gal) / (2000 lb/ton) x (1- 0.00) = 25.99 tons NO2 Emissions for Years 16 – 18: (0.05996 lb NO2/gallon) x (755,582 gal) / (2000 lb/ton) x (1- 0.00) = 25.52 tons SO2 Emissions for Years 16 – 18: (0.0002 lb SO2/gallon) x (755,582 gal) / (2000 lb/ton) x (1- 0.00) = 0.08 ton
Otter Creek Coal Mine Page 66 MAQP Application OCC212408
VOC Emissions for Years 16 – 18: (0.0064 lb VOC/gallon) x (755,582 gal) / (2000 lb/ton) x (1- 0.00) = 2.43 tons CO2 Emissions for Years 16 – 18: (22.6050 lb CO2/gallon) x (755,582 gal) / (2000 lb/ton) x (1- 0.00) = 8,540 tons
3.2 Hazardous Pollutant Emission Inventory Total hazardous air pollutant (HAP) emissions for diesel fuel combustion equipment were estimated using data from AP-42 Chapter 3.4. Detailed air pollutant emissions calculations, including descriptions of related design parameters and assumptions, are presented in Appendix C. This section of the report provides a narrative overview and sample emissions calculations. Table 3-4 summarizes the potential HAP emission rates associated with each inventory year.
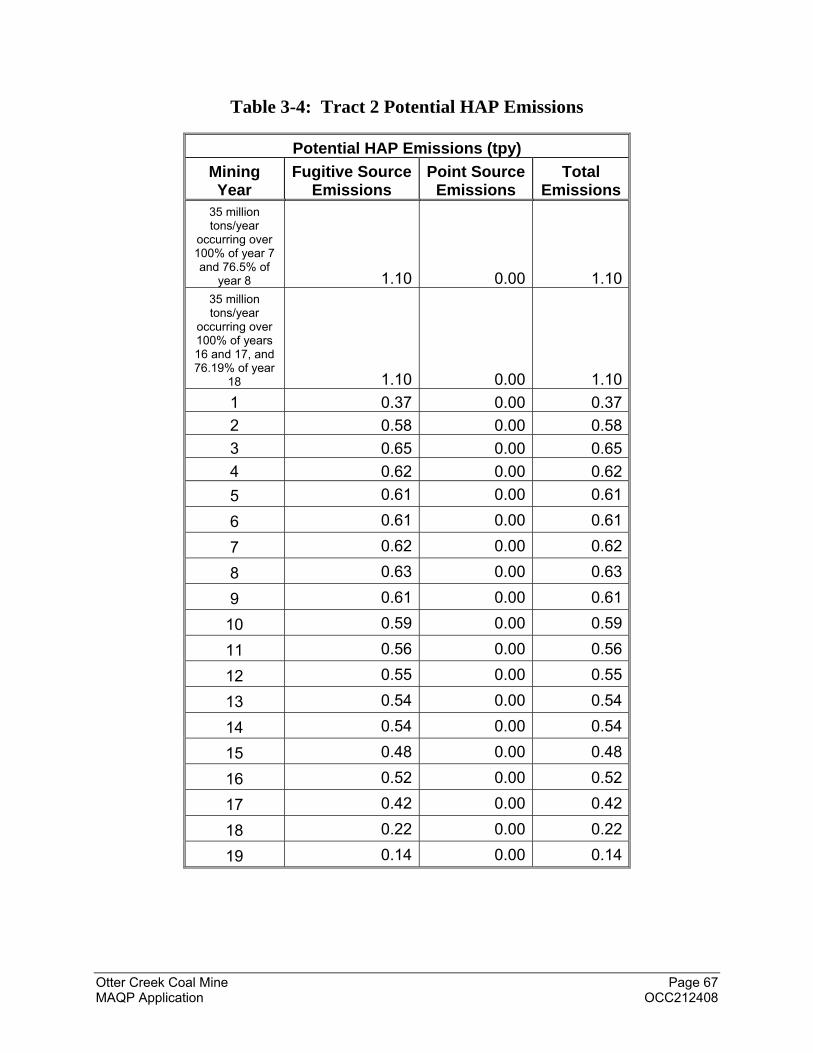
Otter Creek Coal Mine Page 67 MAQP Application OCC212408
Table 3-4: Tract 2 Potential HAP Emissions
Potential HAP Emissions (tpy)
Mining Year
Fugitive Source Emissions
Point Source Emissions
Total Emissions
35 million tons/year
occurring over 100% of year 7 and 76.5% of
year 8 1.10 0.00 1.10 35 million tons/year
occurring over 100% of years 16 and 17, and 76.19% of year
18 1.10 0.00 1.10
1 0.37 0.00 0.37
2 0.58 0.00 0.58
3 0.65 0.00 0.65
4 0.62 0.00 0.62
5 0.61 0.00 0.61
6 0.61 0.00 0.61
7 0.62 0.00 0.62
8 0.63 0.00 0.63
9 0.61 0.00 0.61
10 0.59 0.00 0.59
11 0.56 0.00 0.56
12 0.55 0.00 0.55
13 0.54 0.00 0.54
14 0.54 0.00 0.54
15 0.48 0.00 0.48
16 0.52 0.00 0.52
17 0.42 0.00 0.42
18 0.22 0.00 0.22
19 0.14 0.00 0.14
Otter Creek Coal Mine Page 68 MAQP Application OCC212408
3.2.1 Emission Point 14a Diesel-fired Equipment This category includes HAP emissions produced by diesel-fired mobile, portable and stationary equipment. Emission Factors: Emission factors for HAPs were obtained from AP-42, Chapter 3.4 for Large Stationary Diesel and All Stationary Dual-fuel Engines. The emission factors for each HAP pollutant are provided in Appendix C.
Emission Factors for Diesel-fired Mobile/Portable/Stationary Equipment
Total HAPS
1.83 E-03 lb/MMBtu
AP-42 3.4 Large Stationary Diesel and All Stationary Dual-fuel Engines, Table 3.4-1 (10/1996)
Activity Level: An activity level in terms of fuel used was provided by Otter Creek Coal. The amount of fuel used each year was converted from a gal/yr basis to an MMBtu/yr basis using a diesel heat content of 0.137 MMBtu/gal found in AP-42, Appendix A. Fuel Usage Years 16 - 18 (MMBtu/yr) = 8,000,000 gal x (0.137 MMBtu/gal) = 1,096,000 MMBtu Control Method: Emissions produced by diesel-fired mobile, portable and stationary equipment are considered fugitive sources of emissions. No additional control is assumed for this source. Example Emission Calculation: HAPs Emissions for Years 16 - 18: (0.00183 lb HAPS/MMBtu) x (1,096,000 MMBtu) / (2000 lb/ton) x (1- 0.00) = 1.00 ton
3.2.2 Emission Point 18 Locomotive Emissions This category includes HAP emissions produced by the diesel-fired locomotive during the loading of coal into railcars. Emission Factors: Emission factors for HAPs were obtained from AP-42, Chapter 3.4 for Large Stationary Diesel and All Stationary Dual-fuel Engines. The emission factors for each HAP pollutant are provided in Appendix C.
Otter Creek Coal Mine Page 69 MAQP Application OCC212408
Emission Factors for Diesel-fired Mobile/Portable/Stationary Equipment
Total HAPs
1.83 E-03 lb/MMBtu
AP-42 3.4 Large Stationary Diesel and All Stationary Dual-fuel Engines, Table 3.4-1 (10/1996)
Activity Level: An activity level in terms of fuel used per trainload was provided by Otter Creek Coal. The amount of fuel used each year based on the amount of coal shipped was converted from a gal/yr basis to an MMBtu/yr basis using a diesel heat content of 0.137 MMBtu/gal found in AP-42, Appendix A. Fuel Usage Years 16 -18 (MMBtu/yr) = 755,582 gal x (0.137 MMBtu/gal) = 103,515 MMBtu Control Method Emissions produced by diesel-fired locomotives are considered fugitive sources of emissions. No additional control is assumed for this source. Example Emission Calculation HAP Emissions for Inventory Years 16 - 18: (0.00183 lb HAPs/MMBtu) x (103,515 MMBtu) / (2000 lb/ton) x (1- 0.00) = 0.09 ton/yr
Otter Creek Coal Mine Page 70 MAQP Application OCC212408
4.0 REGULATORY ANALYSIS
This section evaluates potentially applicable regulatory requirements for OCC under both Montana and federal air quality regulations. Table 4-1 lists requirements that may apply to the proposed project. Analyses of each of the listed regulations follow.
Table 4-1: Potentially Applicable Rules
Rule Citation Description Report Section
ARM 17.8 Subchapter 1
General Provisions 4.1
ARM 17.8 Subchapter 2
Ambient Air Quality Standards 4.2
ARM 17.8.304 Emission Standards - Visible Air Contaminants 4.3
ARM 17.8.340 New Source Performance Standards (40 CFR 60, Stationary Sources)
4.4
ARM 17.8.342 Emission Standards for Hazardous Air Pollutants for Source Categories (MACT – 40 CFR 63)
4.5
ARM 17.8 Subchapter 5
Air Quality Permit Application, Operation, and Open Burning Fees 4.6
ARM 17.8 Subchapter 6
Outdoor Burning 4.7
ARM 17.8 Subchapter 7
Permit, Construction and Operation of Air Contaminant Sources 4.8
ARM 17.8.752 Best Available Control Technology (BACT) 4.9
ARM 17.8 Subchapter 8
Prevention of Significant Deterioration-New Source Review 4.10
ARM 17.8 Subchapter 12
Operating Permit Program 4.11
40 CFR Parts 51, 52, 70, et al.
Greenhouse Gas Tailoring Rule 4.12
40 CFR 98, Subpart C
Greenhouse Gas Mandatory Reporting Rule 4.13
4.1 General Provisions
ARM 17.8 Subchapter 1 contains general rules that apply to the air quality program including definitions, testing requirements, malfunction notification requirements, and prohibitions against dilution or the creation of a public nuisance. OCC will comply with all applicable requirements and general provisions in ARM 17.8 Subchapter 1. OCC will not circumvent any air quality regulation.
Otter Creek Coal Mine Page 71 MAQP Application OCC212408
4.2 Ambient Air Quality Standards
The air quality of the area is classified as "Better than National Standards" or unclassifiable/attainment of the National Ambient Air Quality Standards (NAAQS) for criteria pollutants (40 CFR 81.327).
OCC conducted on-site baseline ambient air quality monitoring for particulate matter less than 10 microns in diameter (PM10) and particulate matter less than 2.5 microns in diameter (PM2.5) starting in April 2011. On-site meteorological monitoring began in January 2011, and continues as of the date of this application. The monitoring data has been previously submitted and is on file with the Department. An analysis of the background PM10 and PM2.5 concentrations is presented in Appendix D.
Section 6.0 of this permit application presents the results of an analysis of potential impacts of the proposed OCC mine on local ambient air quality.
4.3 Emission Standards
4.3.1 Opacity
ARM 17.8 Sections 304 and 308 limit the opacity of source emissions to no more than 20% averaged over a six-minute period. OCC will comply with the requirements of ARM 17.8.304 and ARM 17.8.308 by using control technologies discussed in more detail in Section 5.0 of this application.
4.3.2 Particulate Matter, Fuel Burning Equipment
ARM 17.8.309 states that no new fuel burning equipment shall emit PM in excess of the amount that results from the following equation:
E = 1.026*H
-0.233
where: E = Particulate Emission Rate (lbs/MMBtu) H = Heat Input Capacity (MMBtu/hr)
OCC will ensure that all affected equipment complies with this limit.
4.3.3 Particulate Matter, Industrial Processes
ARM 17.8.310 limits PM emissions from industrial processes to the value calculated using the following formula.
E = 4.10 * P 0.67 (process rates up to and including 30 ton/hr)
E = 55* P 0.11- 40 (process rates greater than 30 ton/hr)
Otter Creek Coal Mine Page 72 MAQP Application OCC212408
where: P = Process Rate (ton/hr) E = Particulate matter emissions rate (pounds per hour)
OCC will ensure that all affected equipment complies with this limit.
4.4 New Source Performance Standards (40 CFR 60, Stationary Sources)
ARM 17.8.340 incorporates by reference the New Source Performance Standards (NSPS) of 40 CFR 60. OCC has identified two of these standards as potentially applying to its operations.
4.4.1 NSPS – Subpart Y – Standards of Performance for Coal Preparation Plants
Title 40 CFR 60, Subpart Y, Standards of Performance for Coal Preparation Plants, applies to all coal dryers, coal cleaning equipment, conveyors, crushers, storage and loading systems. OCC has identified the following proposed stationary equipment as subject to this regulation:
Coal crushing and screening equipment; Coal conveying equipment; Coal storage facilities Coal transfer and loading equipment.
4.4.2 NSPS – Subpart IIII – Standards of Performance for Stationary Compression Ignition Internal Combustion Engines
Title 40 CFR 60, Subpart IIII, Standards of Performance for Stationary Compression Ignition Internal Combustion Engines, applies to affected equipment at major and area sources of HAPs. OCC will have diesel-fired portable equipment that is potentially subject to Subpart IIII. OCC will comply with applicable requirements for this equipment.
4.5 Emission Standards for Hazardous Air Pollutants for Source Categories (NESHAP – 40 CFR 63)
ARM 17.8.342 incorporates by reference the National Emission Standards for Hazardous Air Pollutants (NESHAP) listed in 40 CFR Part 63 that apply to stationary sources. OCC has identified two of these standards as potentially applying to its operations.
4.5.1 NESHAP – Subpart A
This subpart applies to all equipment or facilities subject to a specific Part 63 subpart.
Otter Creek Coal Mine Page 73 MAQP Application OCC212408
4.5.2 NESHAP – Subpart ZZZZ
Title 40 CFR 63, Subpart ZZZZ (National Emission Standards for Hazardous Air Pollutants from Stationary Reciprocating Internal Combustion Engines) applies to affected equipment at major and area sources of HAPs. The proposed OCC mine will include gasoline- and/or diesel-fired portable/mobile equipment that is potentially subject to Subpart ZZZZ. Based on the emissions estimates presented in Section 3.0, the OCC mine qualifies as an area source of emissions.
4.6 Air Quality Permit Application, Operation, and Open Burning Fees
OCC will submit the required permit application and operation fees per ARM 17.8 Subchapter 5. No outdoor burning is expected at the OCC mine, so open burning fees will not apply.
4.7 Outdoor Burning
No outdoor burning is expected at the OCC mine. If OCC conducts any outdoor burning, all conditions in ARM 17.8, Subchapter 6 will be followed.
4.8 Permit, Construction and Operation of Air Contaminant Sources
According to ARM 17.8.743 and 744, the proposed project qualifies as a new stationary source for which an application for an air quality permit is required. This report, including completed permit application forms and other supporting information, constitutes OCC’s application for an MAQP.
One of the permit application requirements is that the applicant notifies the public of its application by means of a newspaper of general circulation in the area affected by the facility modification (ARM 17.8.748). Such public notification will be served by advertisement in the Powder River Examiner and the Billings Gazette within ten days of filing the complete permit application. An affidavit of publication will be delivered to MDEQ upon receipt by OCC.
4.9 Best Available Control Technology (BACT)
ARM 17.8.752 requires that any new or altered source requiring an air quality permit install the maximum air pollution control capability that is technically practical and economically feasible and that BACT must be utilized. Section 5.0 of this permit application analyzes available alternative control technologies and identifies BACT for each applicable emissions source and pollutant combination. To comply with this rule, OCC proposes to utilize the control technologies determined through those analyses to qualify as BACT.
Otter Creek Coal Mine Page 74 MAQP Application OCC212408
4.10 New Source Review (NSR) and Prevention of Significant Deterioration (PSD)
NSR/PSD regulations apply to new and modified major stationary sources. A major stationary source is one that:
Is listed in ARM 17.8.801(22)(a)(i) and has the potential to emit more than 100 tons per year (tpy) of any pollutant subject to regulation under the Federal Clean Air Act for PSD review; or
Is not listed but has the potential to emit (from a stationary, non-fugitive source) more than 250 tpy of any regulated pollutant.
The OCC mine is a new source, is not a listed source, and does not have the potential to emit more than 250 tpy of a regulated pollutant from a stationary, non-fugitive source (see Section 3.0 of the application for a breakdown of fugitive and point source emissions). Therefore, the project is not a major stationary source and does not trigger the need for NSR/PSD permitting. Because the proposed project is not subject to NSR/PSD permitting regulations, an analysis of project impacts on PSD increments is not required under ARM 17.8.820. However, a minor source, such as the OCC mine, may also be required to conduct a PSD increment analysis in certain instances. OCC has further investigated their responsibility for an analysis of increment as follows:
The requirement to conduct an increment analysis as a minor emissions source hinges on the triggering of a “minor source baseline date” in a specific “baseline area.”
ARM 17.8.801(21)(b) defines the minor source baseline date as “the earliest date after the trigger date on which a major stationary source or a major modification subject to 40 CFR 52.21 or to regulations approved pursuant to 40 CFR 51.166 submits a complete application under the relevant regulation.”
ARM 17.8.801(3) defines baseline area as “any intrastate area (and every part thereof) designated as attainment or unclassifiable in 40 CFR 81.327 in which the major source or major modification establishing the minor source baseline date would construct or would have an air quality impact equal to or greater than one microgram per cubic meter (μg/m3) (annual average) of the pollutant for which the minor source baseline date is established, except baseline areas for PM-2.5 are designated when a major source or major modification establishing the minor source baseline date would construct or would have an air quality impact equal to or greater than 0.3 μg/m3 as an annual average for PM-2.5.” MDEQ, by policy, has used county boundaries to define baseline areas.
OCC is proposing to construct and operate a facility in Powder River County. No major stationary source applications have been submitted to MDEQ for Powder River County, nor has the “baseline area” of the county been triggered by any actions in the surrounding counties. Therefore, we conclude the OCC mine is not subject to a minor source baseline increment analysis.
Otter Creek Coal Mine Page 75 MAQP Application OCC212408
4.11 Operating Permit Program (Title V)
Title V of the Federal Clean Air Act amendments of 1990 sets forth operating permit requirements that apply to major sources as defined within the statute. Montana administers the statute in accordance with rules codified at ARM 17.8 Subchapter 12. Several alternative criteria establish major source status, but the primary criteria that most often trigger applicability are:
The facility’s potential to emit any pollutant from a stationary point source is greater than 100 tpy.
The facility’s potential to emit any single listed hazardous air pollutant (HAP) is greater than 10 tpy, or its potential to emit all HAPs combined is greater than 25 tpy.
The proposed OCC mine does not trigger these emissions thresholds and will not be a Title V major source according to these and all other criteria. Consequently, Title V operating permit program rules will not apply to the proposed project.
4.12 Greenhouse Gas (GHG) Tailoring Rule
In general, the GHG Tailoring Rule triggers NSR/PSD applicability for stationary sources that emit greater than 100,000 tons CO2 equivalent (CO2e), or those that are already major sources and modify their facility with a resulting emissions increase greater than 75,000 tons CO2e per year. A permitting threshold of 100,000 tons CO2e from a stationary source triggers the need for a Title V Operating Permit. As shown in the detailed emission calculations in Appendix C, the OCC mine’s potential GHG emissions from stationary sources will not exceed the applicable thresholds.
4.13 Greenhouse Gas Mandatory Reporting Rule
Title 40 CFR Part 98, Subpart C requires reporting of greenhouse gas emissions from listed facilities and suppliers, as well as facilities with stationary sources that emit over 25,000 metric tons CO2e in a calendar year. Surface coal mines are not listed as mandatory sources for reporting purposes. If the proposed facility’s actual annual GHG emissions due to stationary source fuel combustion surpass the applicability threshold, it will be subject to this rule. This is unlikely for the OCC mine given that, except for a few insignificant stationary sources, all of the facility’s combustion sources will be mobile sources.
Otter Creek Coal Mine Page 76 MAQP Application OCC212408
5.0 BACT ANALYSES
ARM 17.8.752 requires the owner or operator of a new or altered source to implement the maximum degree of air pollution reduction that is technically and economically available and feasible. This level of emissions reduction is referred to as “best available control technology” (BACT), and is a case-by-case decision that considers energy, environment, and economic impacts.
BACT can constitute either add-on control equipment or modifications to production processes depending on the emissions source. It may be a process design, work practice, operational standard, or addition of control equipment if imposition of an emissions standard is infeasible.
There is no universally accepted method for determining BACT, particularly for non-major sources of emissions. Thus, various methods can be applied in determining control technology to be used as BACT. Control technology was selected for OCC using the following BACT analyses.
Point sources and fugitive sources that have available add-on control technology options were examined with a top-down, five-step BACT approach (see Section 5.2). These sources include emission control for coal crushing, conveyor transferring, silo storage, railcar loading, and the drilling of overburden and coal.
Other sources are evaluated through a review of operational standards, work practices, or the use of best operating practices (BOPs). Sources subjected to this type of BACT analysis include explosives detonation, material handling processes within the mine, fugitive dust from roadways, and wind erosion from disturbed areas (all fugitive sources).
The proposed portable diesel and gasoline powered engines are compliant with Tier 4 emissions standards issued by EPA and 40 CFR Part 60 Subpart JJJJ standards.
A comprehensive list of emission sources and source groups that have been evaluated for BACT are listed in Section 5.1.
5.1 Sources Undergoing BACT Analysis
The following sources proposed by this permit application have been evaluated for application of BACT:
Crushing, Conveyor Transferring, Silo Storage, and Railcar Loading of Coal Overburden and Coal Drilling Explosives Detonations Mine Activity – Material Handling and Removal Disturbed Acreage Wind Erosion
Otter Creek Coal Mine Page 77 MAQP Application OCC212408
Roadway Fugitive Dust Portable and Mobile Engine Equipment
5.2 BACT Analyses for Sources with Add-On Control Technology
The following analyses determine BACT for OCC point and fugitive sources that have available add-on control technology options.
5.2.1 BACT Analysis Methodology for Sources with Add-on Control Technology
Guideline procedures outlined in the document “New Source Review Workshop Manual, Office of Air Quality Planning and Standards, US EPA, Draft - October 1990” were followed for sources with potential add-on control technology. The methodology consists of the following five basic steps: Step 1 - Identify all control options; Step 2 - Eliminate technically infeasible options; Step 3 - Rank remaining options by control effectiveness; Step 4 - Evaluate the most effective controls and document results; and Step 5 - Select BACT.
The New Source Review Workshop Manual is a draft guideline document although it provides a uniform and commonly used approach to BACT decision-making. Each step in the BACT analysis process is outlined below.
Step 1 - Identify All Control Options
In a top-down BACT analysis, the first step is to identify all available control options for the emissions unit in question. Available control options are defined as air pollution control technologies or techniques that have a practical and potential application to emissions units and pollutants being evaluated.
Step 2 - Eliminate Technically Infeasible Options
The second step of a top-down analysis accounts for source-specific factors by evaluating the technical feasibility of individual control options identified in Step 1. Determinations of technical infeasibility should clearly demonstrate how physical, chemical, and/or engineering principles would preclude the successful use of a control option on the emissions unit under review. Technically infeasible control options are eliminated from further consideration. Step 3 - Rank Remaining Options by Control Effectiveness
Available control technology options deemed technically feasible from Step 2 are ranked in order of pollutant removal effectiveness. The control option that results in the highest pollutant removal value is considered the top control alternative.
Otter Creek Coal Mine Page 78 MAQP Application OCC212408
Step 4 - Evaluate Most Effective Controls and Document Results
The fourth step considers direct energy, environmental, and economic impacts associated with the most effective control option defined in Step 3. Both beneficial and adverse impacts are discussed and quantified when possible.
Energy impact analyses estimate direct energy impacts of the control alternatives in units of energy consumption. Environmental impact analyses consider effects of unregulated air pollutants or non-air impacts such as liquid, solid, or hazardous waste disposal and whether they would justify selection of an alternative control option. Economic impact analyses assess costs associated with installation and operation of the various control options.
If energy, environmental, or economic impacts disqualify the top BACT candidate then the next most effective alternative becomes the best control option and is then similarly evaluated. This process continues until the top technology under consideration cannot be eliminated due to any source-specific energy, environmental, or economic impact(s).
Step 5 - Select BACT
The last step in evaluating BACT is to propose the most effective control option that remains after eliminating all non-viable options in Step 4. This step includes the proposal of a BACT-level emissions limit, or limits, if appropriate.
5.2.2 BACT for Particulate (PM, PM10, and PM2.5) Emissions from Crushing, Conveyor Transferring, Silo Storage, and Railcar Loading of Coal
Fragmented coal is hauled from the mine pit to the truck dump and is reduced in size by the mine’s primary crusher. Crushed coal is then transferred through a series of conveyors and a secondary crushing unit until properly sized coal is deposited within storage silos. The coal is stored within the silos until it is eventually transferred into railcars for shipment by rail. Potential sources of particulate emissions can occur from the following sources within the coal handling, transferring, and crushing processes:
Coal Haul Truck Dump Primary and Secondary Crushing Units Conveyors and Transfers Silo Storage and Transfer into the Storage Silo Railcar Coal Loading
Analogous control methods are utilized to reduce particulate emissions from all coal processing, transferring, storage, and loading sources. The BACT analysis is subsequently defined for the particulate control of each source.
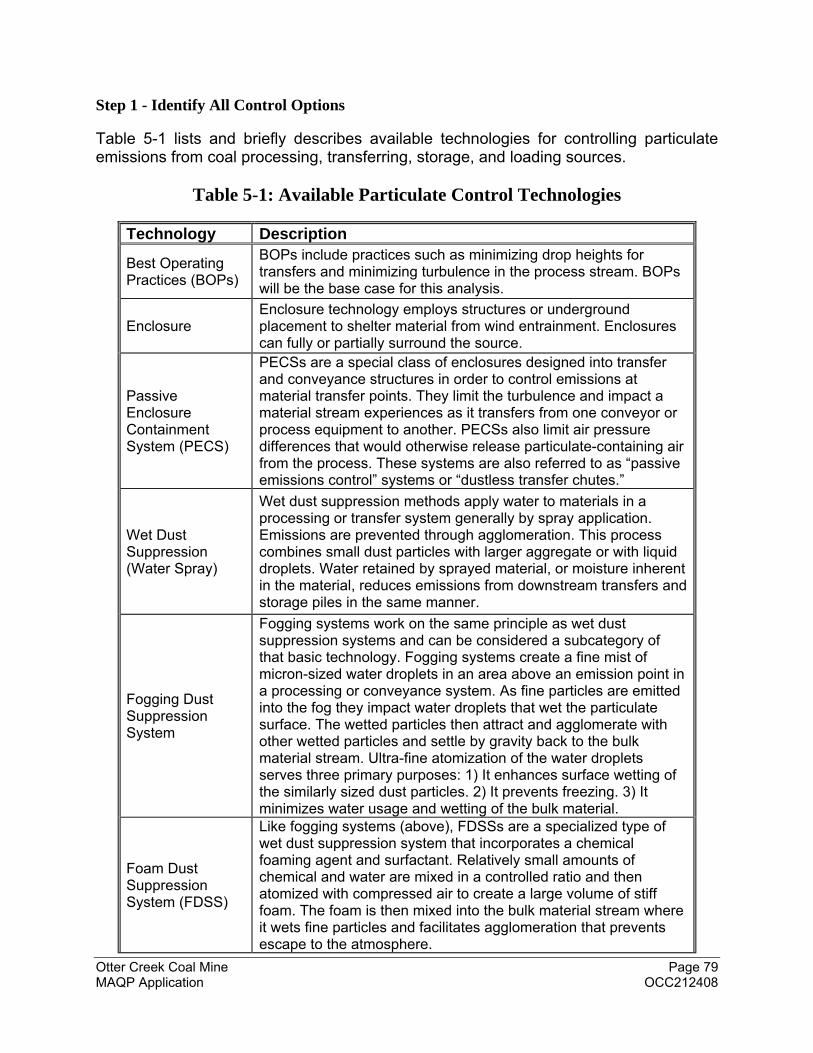
Otter Creek Coal Mine Page 79 MAQP Application OCC212408
Step 1 - Identify All Control Options Table 5-1 lists and briefly describes available technologies for controlling particulate emissions from coal processing, transferring, storage, and loading sources.
Table 5-1: Available Particulate Control Technologies
Technology Description
Best Operating Practices (BOPs)
BOPs include practices such as minimizing drop heights for transfers and minimizing turbulence in the process stream. BOPs will be the base case for this analysis.
Enclosure Enclosure technology employs structures or underground placement to shelter material from wind entrainment. Enclosures can fully or partially surround the source.
Passive Enclosure Containment System (PECS)
PECSs are a special class of enclosures designed into transfer and conveyance structures in order to control emissions at material transfer points. They limit the turbulence and impact a material stream experiences as it transfers from one conveyor or process equipment to another. PECSs also limit air pressure differences that would otherwise release particulate-containing air from the process. These systems are also referred to as “passive emissions control” systems or “dustless transfer chutes.”
Wet Dust Suppression (Water Spray)
Wet dust suppression methods apply water to materials in a processing or transfer system generally by spray application. Emissions are prevented through agglomeration. This process combines small dust particles with larger aggregate or with liquid droplets. Water retained by sprayed material, or moisture inherent in the material, reduces emissions from downstream transfers and storage piles in the same manner.
Fogging Dust Suppression System
Fogging systems work on the same principle as wet dust suppression systems and can be considered a subcategory of that basic technology. Fogging systems create a fine mist of micron-sized water droplets in an area above an emission point in a processing or conveyance system. As fine particles are emitted into the fog they impact water droplets that wet the particulate surface. The wetted particles then attract and agglomerate with other wetted particles and settle by gravity back to the bulk material stream. Ultra-fine atomization of the water droplets serves three primary purposes: 1) It enhances surface wetting of the similarly sized dust particles. 2) It prevents freezing. 3) It minimizes water usage and wetting of the bulk material.
Foam Dust Suppression System (FDSS)
Like fogging systems (above), FDSSs are a specialized type of wet dust suppression system that incorporates a chemical foaming agent and surfactant. Relatively small amounts of chemical and water are mixed in a controlled ratio and then atomized with compressed air to create a large volume of stiff foam. The foam is then mixed into the bulk material stream where it wets fine particles and facilitates agglomeration that prevents escape to the atmosphere.
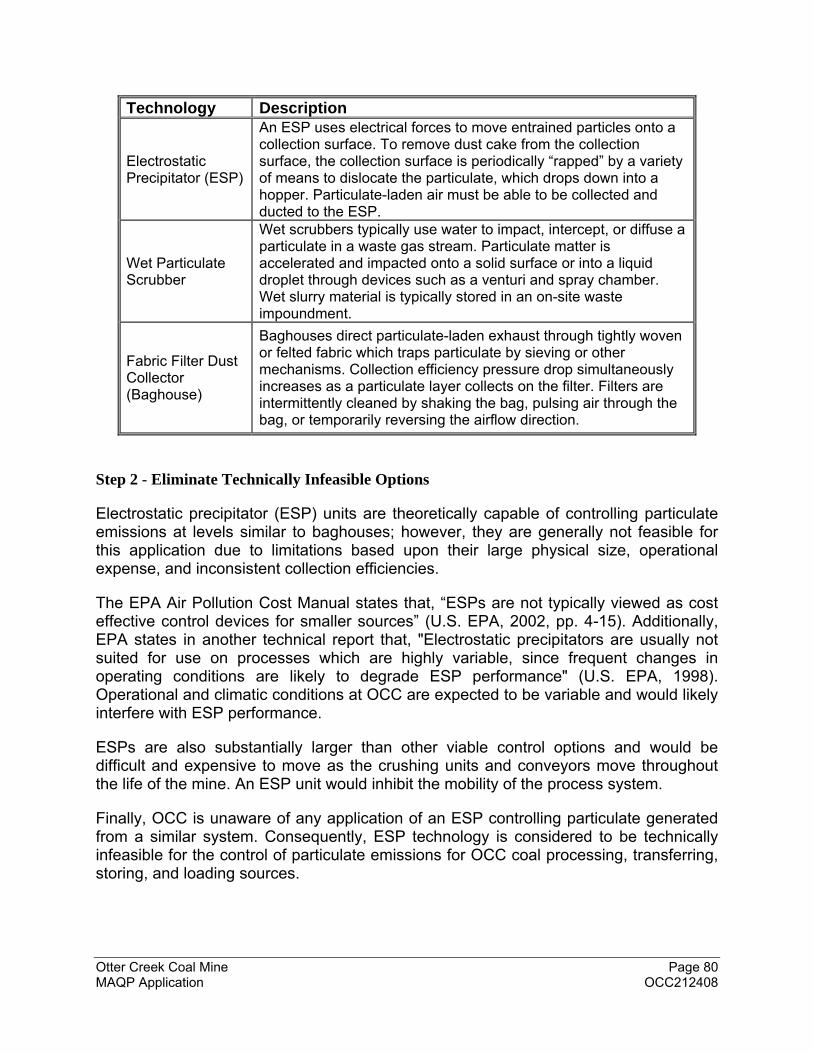
Otter Creek Coal Mine Page 80 MAQP Application OCC212408
Technology Description
Electrostatic Precipitator (ESP)
An ESP uses electrical forces to move entrained particles onto a collection surface. To remove dust cake from the collection surface, the collection surface is periodically “rapped” by a variety of means to dislocate the particulate, which drops down into a hopper. Particulate-laden air must be able to be collected and ducted to the ESP.
Wet Particulate Scrubber
Wet scrubbers typically use water to impact, intercept, or diffuse a particulate in a waste gas stream. Particulate matter is accelerated and impacted onto a solid surface or into a liquid droplet through devices such as a venturi and spray chamber. Wet slurry material is typically stored in an on-site waste impoundment.
Fabric Filter Dust Collector (Baghouse)
Baghouses direct particulate-laden exhaust through tightly woven or felted fabric which traps particulate by sieving or other mechanisms. Collection efficiency pressure drop simultaneously increases as a particulate layer collects on the filter. Filters are intermittently cleaned by shaking the bag, pulsing air through the bag, or temporarily reversing the airflow direction.
Step 2 - Eliminate Technically Infeasible Options
Electrostatic precipitator (ESP) units are theoretically capable of controlling particulate emissions at levels similar to baghouses; however, they are generally not feasible for this application due to limitations based upon their large physical size, operational expense, and inconsistent collection efficiencies.
The EPA Air Pollution Cost Manual states that, “ESPs are not typically viewed as cost effective control devices for smaller sources” (U.S. EPA, 2002, pp. 4-15). Additionally, EPA states in another technical report that, "Electrostatic precipitators are usually not suited for use on processes which are highly variable, since frequent changes in operating conditions are likely to degrade ESP performance" (U.S. EPA, 1998). Operational and climatic conditions at OCC are expected to be variable and would likely interfere with ESP performance.
ESPs are also substantially larger than other viable control options and would be difficult and expensive to move as the crushing units and conveyors move throughout the life of the mine. An ESP unit would inhibit the mobility of the process system.
Finally, OCC is unaware of any application of an ESP controlling particulate generated from a similar system. Consequently, ESP technology is considered to be technically infeasible for the control of particulate emissions for OCC coal processing, transferring, storing, and loading sources.
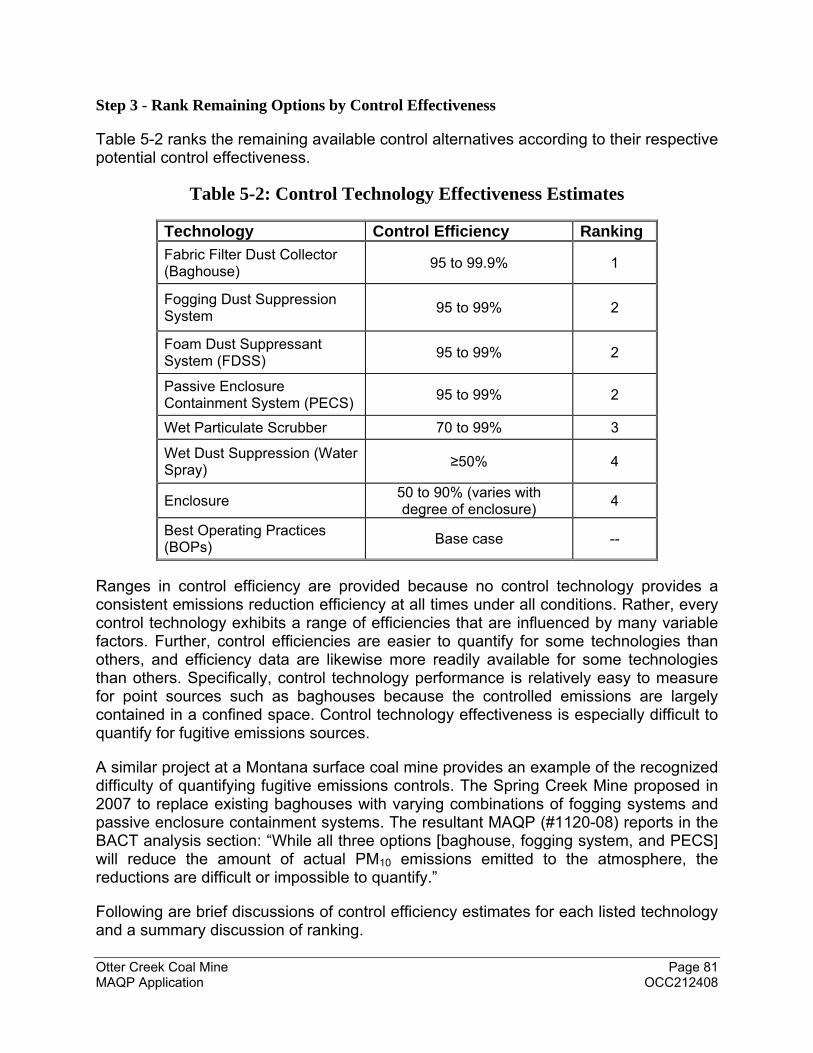
Otter Creek Coal Mine Page 81 MAQP Application OCC212408
Step 3 - Rank Remaining Options by Control Effectiveness
Table 5-2 ranks the remaining available control alternatives according to their respective potential control effectiveness.
Table 5-2: Control Technology Effectiveness Estimates
Technology Control Efficiency Ranking
Fabric Filter Dust Collector (Baghouse)
95 to 99.9% 1
Fogging Dust Suppression System
95 to 99% 2
Foam Dust Suppressant System (FDSS)
95 to 99% 2
Passive Enclosure Containment System (PECS)
95 to 99% 2
Wet Particulate Scrubber 70 to 99% 3
Wet Dust Suppression (Water Spray)
≥50% 4
Enclosure 50 to 90% (varies with degree of enclosure)
4
Best Operating Practices (BOPs)
Base case --
Ranges in control efficiency are provided because no control technology provides a consistent emissions reduction efficiency at all times under all conditions. Rather, every control technology exhibits a range of efficiencies that are influenced by many variable factors. Further, control efficiencies are easier to quantify for some technologies than others, and efficiency data are likewise more readily available for some technologies than others. Specifically, control technology performance is relatively easy to measure for point sources such as baghouses because the controlled emissions are largely contained in a confined space. Control technology effectiveness is especially difficult to quantify for fugitive emissions sources.
A similar project at a Montana surface coal mine provides an example of the recognized difficulty of quantifying fugitive emissions controls. The Spring Creek Mine proposed in 2007 to replace existing baghouses with varying combinations of fogging systems and passive enclosure containment systems. The resultant MAQP (#1120-08) reports in the BACT analysis section: “While all three options [baghouse, fogging system, and PECS] will reduce the amount of actual PM10 emissions emitted to the atmosphere, the reductions are difficult or impossible to quantify.”
Following are brief discussions of control efficiency estimates for each listed technology and a summary discussion of ranking.
Otter Creek Coal Mine Page 82 MAQP Application OCC212408
Fabric Filter Dust Collector – Under ideal circumstances, baghouses can reduce particulate emissions by 99.9 percent. EPA has estimated that actual operating baghouse removal efficiencies can range from 95 to 99.9 percent (U.S. EPA, 2003). A recent permit issued by the Department for a hard rock mine estimated baghouse removal efficiency at 98 percent.1
Fogging Dust Suppression System – OCC was only able to find a single reference to an expected control efficiency for fogging dust suppression. The Spring Creek coal mine air quality permit (MAQP #1120-09 and subsequent revisions) indicates that this control technology provides 99 percent particulate emissions reduction.
Foam Dust Suppressant System (FDSS) –OCC estimated and ranked the expected emissions reduction performance for this technology based upon the analysis in the Western Energy Company permit modification, MAQP#1570-08, which is currently awaiting final department determination.
Passive Enclosure Containment System (PECS) – OCC was unable to find a reference to an expected control efficiency or range of control efficiencies for PECSs. The only quantitative reference uncovered was a control efficiency for a system utilizing a PECS plus a fogging dust suppression for certain coal handling processes at the Spring Creek coal mine in Montana. MAQP #1120-09 (and subsequent revisions) indicates that this combination of control technologies provides 99 percent particulate emissions reduction.
Wet Particulate Scrubber – EPA reports that spray scrubbers can provide 70 to greater than 99 percent particulate emissions removal efficiency. A recent permit issued by MDEQ for a hard rock mine estimated scrubber removal efficiency at 99 percent.1
Wet Dust Suppression (Water Spray) – MDEQ has in the past recognized a default control efficiency of 50 percent for water spray used at hard rock mining and sand and gravel operations.1 AP-42 Chapter 11.19.2 (8/04) for crushed stone and pulverized mineral processing provides a calculated range of wet suppression control efficiencies from approximately 78% to 96% (U.S. EPA, 1995, p. 11.19.2-13). AP-42 Chapter 11.19.1 (11/95) for sand and gravel processing reports control efficiencies estimates for wet suppression techniques of 70 to 90 percent (U.S. EPA, 1995, p. 11.19.1-5).
Enclosure – Emissions reduction efficiencies provided by enclosures vary significantly depending primarily on the configuration of the enclosure—most importantly, the degree to which the structure leaves the source exposed to the atmosphere. Comparing emission factors derived from AP-42 Chapter 13.2.4, Equation 1 at different wind speeds helps quantify enclosure efficiency. Reducing mean wind speeds from the local average (10 mi/hr)2 to the minimum wind speed for which the equation is valid (1.3 mi/hr) yields a 93% reduction in the emission factor. A control efficiency of 50% is assumed for partial enclosure.
1 See the analysis section of Golden Sunlight Mine MAQP #1689-08, Department Decision issued July 24, 2014. 2 From Miles City National Weather Service data. Average value for 2013 per wunderground.com.
Otter Creek Coal Mine Page 83 MAQP Application OCC212408
Step 4 - Evaluate Most Effective Controls and Document Results
As discussed, the most effective controls for limiting fugitive particulate emissions from coal processing and handling processes consists of a set of five alternative technologies:
Fabric filter baghouses
Fogging suppression systems
Foam dust suppressant systems
Wet extraction (wet scrubber) systems
Passive enclosure control systems
As each of the five options is a contending control technology, any one of them satisfies the requirement to apply BACT. Each control technology is subsequently evaluated for application at the Otter Creek mine.
Fabric Filter Dust Collector (Baghouse)
Fabric filter dust collectors (baghouses) capture particulate emissions by forcing an airstream through filter bags. Dust-laden air is directed through an intake and the velocity is initially reduced to drop out larger particles. The remaining particles are filtered by passing the air through a fabric bag. Separation occurs by the particles colliding and attaching to the filter fabric and subsequently building upon themselves.
Baghouse designs have high collection efficiencies for particulate emissions and are generally deemed technically and economically feasible for many proposed material transfers and conveyors. Additionally, baghouses are capable of collecting particles with sizes ranging from submicron to several hundred microns in diameter, and gas temperatures up to 500°F can be accommodated routinely in certain design configurations.
In contrast, baghouse systems are not always a practical control alternative. Baghouse control methods can be limited by gas characteristics (temperature and corrosivity) and particle characteristics (primarily stickiness). These characteristics can affect the fabric material and operation of the filter. Cold weather can also impact the operation of a baghouse. Cold temperatures at the mine site could present potential problems with proper baghouse operation.
Most importantly, baghouse control of coal and coke handling processes must be conscientiously designed and selected due to safety concerns. High concentrations of fine coal dust can be explosive and environments where sparking can occur (such as inside baghouses) pose a significant safety hazard. Baghouses and coal are known to create environments that lead to potential dust explosions. Sequeira (2013) discusses the necessary components that can create a dust explosion. Necessary components include the suspension of a combustible dust (coal dust), an oxidant (oxygen), an
Otter Creek Coal Mine Page 84 MAQP Application OCC212408
ignition source (friction or a spark), and an enclosed area (baghouse).3 Therefore, baghouse particulate control for coal handling and processing can result in dangerous and potentially lethal consequences.
The Chemical Safety and Hazard Investigation Board (CSB) issued a report in November 2006 on the hazards of combustible coal dust. The report concluded that, between 1980 and 2005, 281 combustible dust incidents killed 119 people and injured 718 workers. Baghouses were involved in 18% of these incidences and deaths (Dr. Peltier, 2010).4 OCC has deemed fabric filter control technology as technically feasible; however, safety concerns must be taken into account prior to making a final BACT determination.
Fogging Dust Suppression System
A common method of dust control at mineral processing operations is the use of wet spray systems or fogging dust suppression systems (DHHS Handbook).5 Moisture introduced into the material stream dampens fine particles and increases the weight of each dust particle. As groups of particles become heavier it becomes more difficult for the surrounding air to suspend the particles. Resultantly, the ability of the dampened particulate to become airborne is decreased. The technology is based upon the principles of agglomeration and nucleation. Particles and droplets of similar size either collide to form larger and heavier particles or water vapor condenses on a very small particle and forms a water droplet. The effects of agglomeration and nucleation cause the increase in particle weight and the resultant decrease in potential for particle suspension.
Fogging dust suppression systems introduce a lower amount of moisture to material than traditional water spray systems yet achieve comparable control efficiencies. Lower moisture added to the material through fogging systems is beneficial for processes where high water content can inhibit the flow of material within the process. Traditional water sprays can obstruct material flow through screens or reduce the effectiveness of crushers due to introducing too much moisture into the material. Fogging dust suppression systems diminish these potential circumstances due to the low amount of moisture required for effective control. Additionally, fogging dust suppression systems located in upstream facility processes introduce moisture that is retained throughout downstream processes and creates compounding emission control.
In contrast, fogging dust suppression systems are not always a practical control alternative. In some cases water may not be readily available and piping water to the site may be cost-prohibitive.
3 Sequeira, B. (2013). Introduction to Combustible Dust Explosions Common to Baghouses. Retrieved from http://www.baghouse.com/2013/10/15/introduction-to-combustible-dust-explosions-common-to-baghouses/. 4 Dr. Peltier. R. (2010). Use dry fog to control coal dust hazards. Power Magazine. July 2010. 5 Department of Health and Human Services Dust Control Handbook for Industrial Minerals Mining and Processing (pg. 61)
Otter Creek Coal Mine Page 85 MAQP Application OCC212408
Fogging dust suppression systems have been deemed technically and economically feasible for controlling particulate emissions from proposed coal processing, transferring, storage, and loading sources at OCC. The control technology will reduce particulate emissions within the system through direct application to the material and through moisture retained in the material from fogging upstream in the process. The use of a fogging system at OCC is not expected to interfere with processing equipment and water will be readily available for use in the system.
Foam Dust Suppressant System
Foam dust suppressant systems (FDSS) are a specialized type of wet dust suppression that incorporates a chemical foaming agent and surfactant into a product material rather than an emissions reduction through a fogging spray or mist. Relatively small amounts of chemical and water are mixed in a controlled ratio and then atomized with compressed air to create a large volume of stiff foam. The foam is mixed into the bulk material stream where it wets fine particles and facilitates agglomeration that prevents particle escape to the atmosphere.
FDSSs are beneficial in areas where water is scarce because the control technology requires a very small amount of water to create a large volume of foam. Additionally, FDSSs do not create an ancillary waste stream since the foaming agent is contained within the material through crushing, handling, and transferring processes.
Foam dust suppression acts more like an intrinsic, pollution-prevention control than an add-on control like a baghouse. Once the foaming agent is mixed into the bulk stream, dust emissions are prevented rather than removed, and a single application can prevent dust emissions from several downstream processes. Consequently, foam dust suppression systems have been deemed technically and economically feasible for controlling particulate emissions from proposed coal processing, transferring, storage, and loading sources at OCC.
Wet Particulate Scrubber
A benefit of wet scrubbers is their ability to perform in conditions of varied temperature and moisture. They can collect flammable and explosive dusts safely, absorb gaseous pollutants, and collect mists. Additionally, the control technology is particularly advantageous when handling hot, saturated gases.
In contrast, wet particulate scrubbers require the disposal of a significant amount of water which contains the collected particulate. The contaminated water requires further treatment in a settling pond or sewage system, and the disposal process lowers the particulate collection efficiency while increasing operational costs. Potential environmental issues can also occur from discharging the contaminated water. Furthermore, scrubbers also have a potential for corrosion and freezing because of the large amount of water required to effectively operate the control system.
Otter Creek Coal Mine Page 86 MAQP Application OCC212408
Wet particulate scrubbers may be valuable when controlling sources that emit emissions such as hot, saturated gases; however, those benefits are irrelevant in controlling the type of particulate emissions produced by OCC’s coal handling and processing operations. Additionally, the large amount of water required to effectively operate a scrubber would not be reasonably attainable at the OCC mine due to the climate of the proposed location. OCC on-site meteorological data reveals that the average daily temperature is at or below freezing at least four months of the year. Average daily temperatures exceed 50°F over just five months of the year. Therefore, additional operational and engineering efforts would be required to prevent freezing within the scrubber throughout the winter months. Furthermore, contaminated discharge water could propose an environmental threat to the surrounding area. As a result, OCC has determined wet particulate scrubber control as infeasible due to the economic issues surrounding the use of significant amounts of water in a cold climate and the environmental concerns involving the treatment of contaminated discharge water.
Passive Enclosure Systems
Using enclosures or underground placement to shelter material from wind entrainment is often an effective means to control PM, PM10, and PM2.5 emissions. Enclosures can either fully or partially enclose the source, and the control efficiency depends on the level of enclosure. Enclosures have been deemed technically and economically feasible for the processing, transferring, storage, and loading of coal at OCC. Enclosures at OCC will only be used in conjunction with other higher rated control equipment.
Step 5 - Select BACT
OCC proposes the use of fogging dust suppression systems as BACT to control PM, PM10, and PM2.5 emissions from coal processing, transferring, storage, and loading sources. Best operating practices and the use of enclosures will also support the control of emissions.
EPA finalized an update to the new source performance standard for coal preparation and processing plants, 40 CFR 60 NSPS Subpart Y.6 The update established revised emissions standards, including opacity standards, based on what they determined to be the “Best Demonstrated Technology” (BDT). BDT is defined as the “degree of emission limitation achievable through application of the best system of emissions reductions which (taking into consideration the cost of achieving such emissions reductions, any non-air quality health and environmental impact and energy requirements) the Administrator determines has been adequately demonstrated.” After reviewing data from coal preparation and processing plants across the country, EPA determined that, for processing and handling of sub-bituminous and lignite coals, BDT is fabric filter baghouses, PECS, fogging systems, and wet extraction scrubbers. EPA further states:
“Depending on the plant-specific circumstances, all four of these technologies – fabric filters, PECS, fogging systems, and wet extraction scrubbers – can control
6 74 FR 51950 ff. October 8, 2009.
Otter Creek Coal Mine Page 87 MAQP Application OCC212408
PM emissions equally well. They all provide equivalent levels of emissions reductions; in addition, fogging systems, PECS, and the wet extraction systems often have lower costs than baghouses.” (U.S. EPA, 2009)
It does not appear that EPA specifically considered FDSSs in their review of BDT, but this statement confirms that, for regulatory purposes, baghouses and fogging suppression systems are both capable of controlling fugitive dust from coal processing and handling operations to an equivalent degree.
As previously stated, the baghouse control of coal dust poses safety hazards that can be mitigated but not eliminated. Fine coal dust suspended in a baghouse can result in combustion and explosion creating a dangerous working environment. In consideration of these safety issues, OCC proposes to select a fogging dust suppression system over baghouse control as the highest rated control equipment given their equivalent BDT determination by EPA.
Fogging dust suppression control technology can produce up to 99% control efficiency in controlling particulate emissions.7 However, OCC utilized a more conservative control efficiency of 97.5% for purposes of the emissions calculations in Section 3.0. OCC plans to utilize efficient fogging dust suppression systems that use very little water and do not increase the overall moisture content of the coal by more than a few hundredths of a percent.
Similar systems utilizing fogging controls and enclosures are currently in use at other coal mines that operate near the proposed OCC mine site. The implementation and use of the system at these mines supports the BDT determination discussed above. For example, the Black Thunder Mine in Wyoming is located approximately 130 miles southeast of the proposed OCC mine site and was issued a permit modification in 2003 to replace eleven baghouses with a progressive fogging wet dust suppression system.8 The system replaced baghouse systems that were controlling particulate emissions from the mine’s truck dump, primary and secondary crushers, slot storage areas, silo storage, and train and batch loadouts.
Additionally, the Spring Creek mine near Decker, Montana, is located approximately 50 miles southwest of the proposed OCC mine site and utilizes a similar fogging wet dust suppression spray system. In 2007, Spring Creek mine requested a permit modification from MDEQ to modify their BACT determination – replacing baghouses with a fogging dust suppression spray system. The fogging system proposed in the Spring Creek permit modification would replace the baghouse requirements at the overland conveyor in-pit crusher and at a conveyor transfer point. The modification request was granted by MDEQ and was accounted for in MAQP #1120-08. The system has since been installed and operated at the Spring Creek mine.
7 99.2% control efficiency determined by a report conducted by Division Andina, 1996. 8 The Black Thunder Mine is located in Wyoming and their permit modification was approved by the Wyoming Department of Environmental Quality (WDEQ).
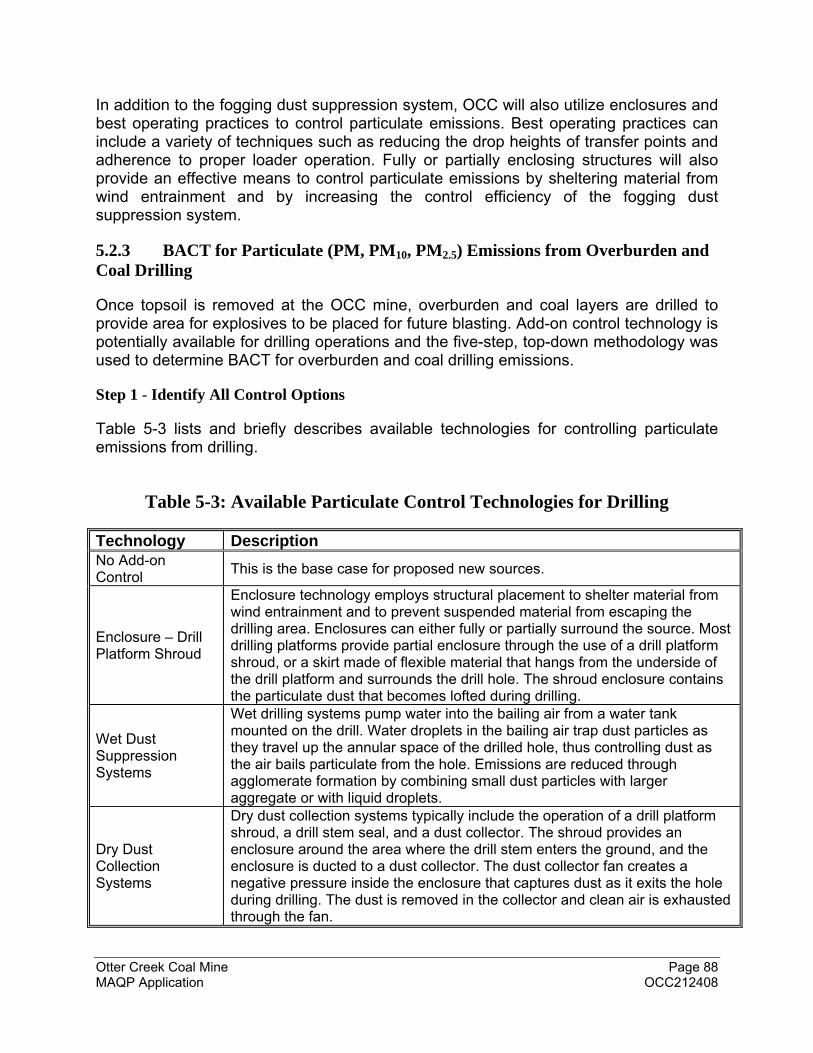
Otter Creek Coal Mine Page 88 MAQP Application OCC212408
In addition to the fogging dust suppression system, OCC will also utilize enclosures and best operating practices to control particulate emissions. Best operating practices can include a variety of techniques such as reducing the drop heights of transfer points and adherence to proper loader operation. Fully or partially enclosing structures will also provide an effective means to control particulate emissions by sheltering material from wind entrainment and by increasing the control efficiency of the fogging dust suppression system.
5.2.3 BACT for Particulate (PM, PM10, PM2.5) Emissions from Overburden and Coal Drilling
Once topsoil is removed at the OCC mine, overburden and coal layers are drilled to provide area for explosives to be placed for future blasting. Add-on control technology is potentially available for drilling operations and the five-step, top-down methodology was used to determine BACT for overburden and coal drilling emissions.
Step 1 - Identify All Control Options
Table 5-3 lists and briefly describes available technologies for controlling particulate emissions from drilling.
Table 5-3: Available Particulate Control Technologies for Drilling
Technology Description No Add-on Control
This is the base case for proposed new sources.
Enclosure – Drill Platform Shroud
Enclosure technology employs structural placement to shelter material from wind entrainment and to prevent suspended material from escaping the drilling area. Enclosures can either fully or partially surround the source. Most drilling platforms provide partial enclosure through the use of a drill platform shroud, or a skirt made of flexible material that hangs from the underside of the drill platform and surrounds the drill hole. The shroud enclosure contains the particulate dust that becomes lofted during drilling.
Wet Dust Suppression Systems
Wet drilling systems pump water into the bailing air from a water tank mounted on the drill. Water droplets in the bailing air trap dust particles as they travel up the annular space of the drilled hole, thus controlling dust as the air bails particulate from the hole. Emissions are reduced through agglomerate formation by combining small dust particles with larger aggregate or with liquid droplets.
Dry Dust Collection Systems
Dry dust collection systems typically include the operation of a drill platform shroud, a drill stem seal, and a dust collector. The shroud provides an enclosure around the area where the drill stem enters the ground, and the enclosure is ducted to a dust collector. The dust collector fan creates a negative pressure inside the enclosure that captures dust as it exits the hole during drilling. The dust is removed in the collector and clean air is exhausted through the fan.
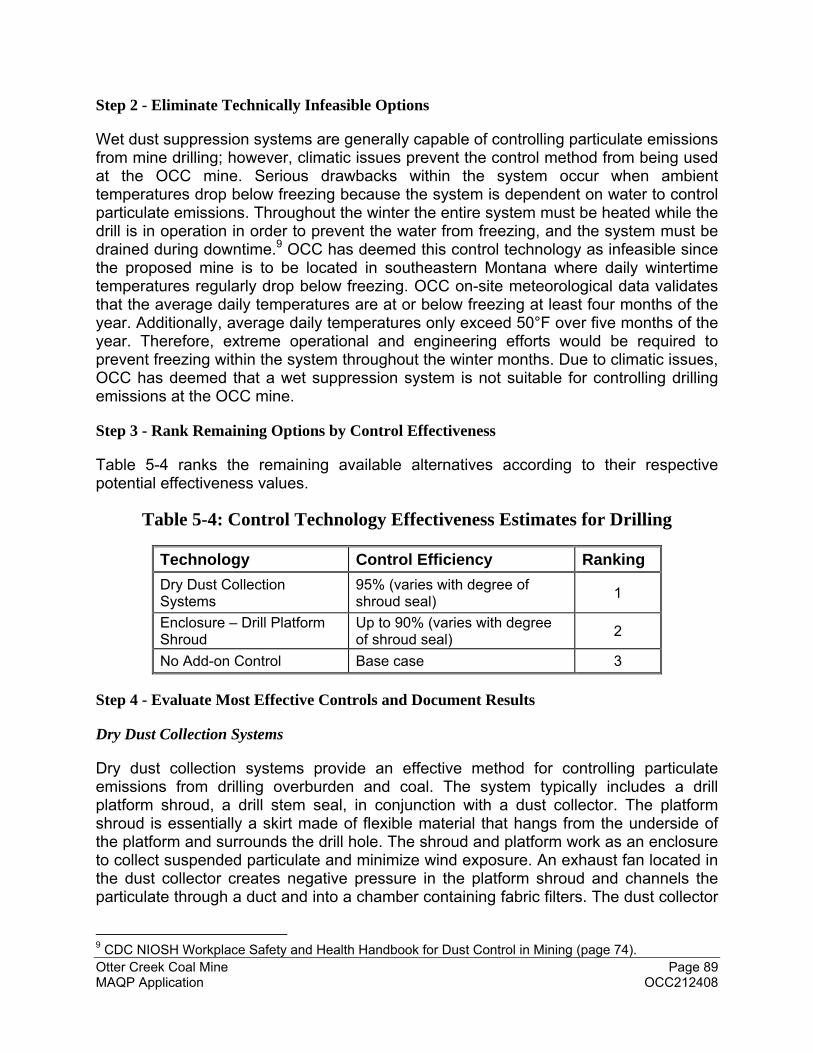
Otter Creek Coal Mine Page 89 MAQP Application OCC212408
Step 2 - Eliminate Technically Infeasible Options
Wet dust suppression systems are generally capable of controlling particulate emissions from mine drilling; however, climatic issues prevent the control method from being used at the OCC mine. Serious drawbacks within the system occur when ambient temperatures drop below freezing because the system is dependent on water to control particulate emissions. Throughout the winter the entire system must be heated while the drill is in operation in order to prevent the water from freezing, and the system must be drained during downtime.9 OCC has deemed this control technology as infeasible since the proposed mine is to be located in southeastern Montana where daily wintertime temperatures regularly drop below freezing. OCC on-site meteorological data validates that the average daily temperatures are at or below freezing at least four months of the year. Additionally, average daily temperatures only exceed 50°F over five months of the year. Therefore, extreme operational and engineering efforts would be required to prevent freezing within the system throughout the winter months. Due to climatic issues, OCC has deemed that a wet suppression system is not suitable for controlling drilling emissions at the OCC mine.
Step 3 - Rank Remaining Options by Control Effectiveness
Table 5-4 ranks the remaining available alternatives according to their respective potential effectiveness values.
Table 5-4: Control Technology Effectiveness Estimates for Drilling
Technology Control Efficiency Ranking
Dry Dust Collection Systems
95% (varies with degree of shroud seal)
1
Enclosure – Drill Platform Shroud
Up to 90% (varies with degree of shroud seal)
2
No Add-on Control Base case 3
Step 4 - Evaluate Most Effective Controls and Document Results
Dry Dust Collection Systems
Dry dust collection systems provide an effective method for controlling particulate emissions from drilling overburden and coal. The system typically includes a drill platform shroud, a drill stem seal, in conjunction with a dust collector. The platform shroud is essentially a skirt made of flexible material that hangs from the underside of the platform and surrounds the drill hole. The shroud and platform work as an enclosure to collect suspended particulate and minimize wind exposure. An exhaust fan located in the dust collector creates negative pressure in the platform shroud and channels the particulate through a duct and into a chamber containing fabric filters. The dust collector
9 CDC NIOSH Workplace Safety and Health Handbook for Dust Control in Mining (page 74).
Otter Creek Coal Mine Page 90 MAQP Application OCC212408
collects filtered particulate while clean air is exhausted through the fan. Additionally, the drill stem seal is a flexible collar placed around the drill stem where it passes through the drill platform. It prevents particulate emissions from passing through the drill platform.
An advantage to the dry dust collection system is that it does not require the use of any expendable material such as water or chemical surfactant. Consequently, the control technology can be operated at any outside temperature since there is no risk of an expendable material reacting to temperature variations – such as water freezing within the system. Test data have concluded that dry dust collection systems are capable of achieving 95% control efficiency although this control efficiency may not always be reproducible in practice.10
In contrast, dry dust collection systems are expensive to install and maintain. They require a conscious effort by the operator to ensure a high efficiency, and a field survey conducted by Organiscak and Page concluded that proper maintenance is crucial to the overall performance of dry collection systems. Dry dust collection systems additionally require supplemental energy from a diesel generator or an electrical source in order to power the fan and dust collection system. The addition of a supplementary energy source to the drills would result in additional emissions sources at OCC.
Most importantly, collection of dry coal dust creates a serious safety hazard as discussed in Section 5.2.2. The dry collection system creates an environment susceptible to potential coal dust explosions due to the combination of oxygen, an ignition source, and concentrated coal dust in an enclosed area. The dry dust collection systems are located on the drilling platform in close proximity to the drilling operator, and resultantly place the operator in direct danger from potential explosions or fires. Resultantly, OCC has determined that dry dust collection systems are unsuitable for controlling particulate emissions from drilling operations.
Enclosure – Drill Platform Shroud
Drill platform shroud enclosures provide an effective solution for controlling PM, PM10, and PM2.5 emissions from the drilling of overburden and coal. The platform is a structure that is used to shelter material from wind entrainment by partially enclosing the source.
A drill platform shroud is essentially a skirt made of a flexible material (usually rubber) that hangs from the underside of the drill platform and surrounds the drill hole. The shroud enclosure contains the dust that comes out of the drill hole. The control efficiency depends on the level of enclosure; therefore, the shroud height or the distance between the ground and the bottom of the shroud should be kept as low as possible in order to achieve maximum control efficiency.
10 “CDC NIOSH Workplace Safety and Health Handbook for Dust Control in Mining” (page 76) Organiscak and Page, 1999. “Methods for controlling respirable coal mine dust from overburden drilling at surface coal mines” (page 279) Zimmer and Lueck 1986.
Otter Creek Coal Mine Page 91 MAQP Application OCC212408
A Zirnmer and Lueck study found that although results differ with various drills, the control efficiency generally decreases as the shroud height increases.11 The same study reported that, for the two drills tested, control efficiencies varied from 99% to 41% over the 0- to 27-in. height range. Maintaining a consistent shroud height around uneven surfaces is not always possible; therefore, OCC utilized a more conservative control efficiency of 90% for purposes of the emissions calculations in Section 3.0.
Drill platform shroud enclosures have been deemed technically and economically feasible for controlling particulate emissions from drilling operations at OCC.
Step 5 - Select BACT
OCC proposes BACT for the drilling of overburden and coal to be the use of a drill platform shroud enclosure for the control of PM, PM10, and PM2.5 emissions. Drill platform shrouds will be utilized to shelter material from wind entrainment and to prevent suspended material from escaping the drilling area. OCC will utilize proper shroud height placement and operation in order to achieve maximum possible control efficiency.
5.3 BACT Analyses for Sources Using Operational Standards, Work Practices, or Best Operating Practices
The following sections analyze BACT for OCC point and fugitive sources through the assessment of operational standards, work practices, and use of best operating practices (BOPs).
5.3.1 BACT for Gaseous (NO2, SO2, and CO) and Particulate (PM, PM10, PM2.5) Emissions from Explosives Detonation/Blasting
Explosives will be used for the blasting of overburden and coal within the OCC mine and will result in the release of gaseous (NO2, SO2, and CO) and particulate (PM, PM10, and PM2.5) emissions.
Explosives
OCC will use two types of explosives for the blasting of overburden and coal – emulsion and a mixture of ammonium nitrate and fuel oil (ANFO). ANFO is a common bulk industrial explosive mixture that accounts for roughly 80% of explosives used annually in North America. The mixture provides a reliable explosive that is relatively easy to use, highly stable until detonation, and low cost.
In contrast, ammonium nitrate is water soluble and absorbed water interferes with the explosive function of ANFO. Therefore, emulsion may be preferred in wet mining areas since it is more water resistant than ANFO. If only ANFO is used, efforts to dewater boreholes will enhance the effectiveness of the explosive and thereby limit potential air 11 Methods for Controlling Respirable Coal Mine Dust from Overburden Drilling at Surface Coal Mines (page 278).
Otter Creek Coal Mine Page 92 MAQP Application OCC212408
emissions. Also, ammonium nitrate readily absorbs water from the atmosphere, so care will be taken when ANFO is stored.
OCC plans to use a combination of 70% ANFO and 30% emulsion for blasting processes. These ratios were utilized in emissions calculations listed in Section 3.0 and dispersion modeling detailed in Section 6.0. OCC will employ various operational controls for mine blasting operations because of an absence of add-on controls for explosives detonations.
Blasting Techniques
Various blasting techniques will be utilized at OCC and will depend on the material and preferred movement of debris and flyrock. Gaseous emissions will result from the detonation of the chemical compounds within the explosives. Particulate emissions will result from the blasting and loosening of compacted coal and overburden material. While blasting seemingly generates large amounts of dust, the operation occurs infrequently enough that it is not considered to be a significant contributor to PM10 emissions [EPA 1991; Richards and Brozell 2001].12 Nonetheless, best operational practices and blasting techniques will be utilized for reducing gaseous and particulate emissions from the blasting of both overburden material and coal.
Overburden Blasting
After topsoil has been removed from an excavation area, overburden is drilled and blasted in order to loosen the material for future handling and removal.
Two types of blasting will occur at the OCC mine. One method, conventional overburden blasting, will minimize the travel of debris from blasts in order to facilitate organized removal by truck and shovel. The minimized travel distance produced by conventional overburden blasting also aids in reducing suspended particulate emissions. This method employs sequential detonation and will be designed to minimize flyrock.
The second method, overburden cast blasting, will use the same control techniques although discharges will be designed to blast the overburden material into a previously excavated and mined area. Cast blasting will also utilize sequential detonation and blasts will be designed to direct the overburden into adjacent vacant pit areas while minimizing flyrock.
Coal Blasting
Once the overburden is blasted and removed, coal extraction can take place through further blasting and coal removal techniques.
Detonations within the coal layer will be designed to minimize the travel of debris from blasts in order to reduce suspended particulate emissions and to facilitate organized
12 DHHS CDC NIOSH Dust Control Handbook for Industrial Minerals Mining and Processing (page 101).
Otter Creek Coal Mine Page 93 MAQP Application OCC212408
removal by truck and shovel. This method will employ sequential detonation and will be designed to minimize flyrock. Coal blasting methods will also ensure that blasting holes are drilled to a diameter that allows for proper fragmentation during blasting.
Proposed Operational Controls
The use of common Best Operating Practices (BOPs) is the industry standard method for minimizing blasting emissions. OCC will use the following blasting BOPs:
Optimize drill-hole size. Optimizing drill-hole size will result in effective blasting and reduce the number of blasts needed to achieve the desired effect.
Optimize drill hole placement and utilization of sequential detonation. Optimizing drill hole placement will ensure that all material is successfully detonated and additional explosives are not needed in order to achieve complete fragmentation.
Optimize usage of explosive. Proper usage of explosive prevents the detonation of unnecessary, excess explosive and resulting excess emissions.
Mine planning will result in blasting that is conducted in a manner that prevents overshooting and minimizes the area to be blasted.
Minimized retention time between loading blasting holes with emulsion and detonation will increase the efficiency of the explosive.
Select BACT
Section 3.0 estimates potential pollutant emission rates that will result from blasting and describes the basis for those estimations. The estimated values are sufficient for use in ambient impacts demonstrations and in regulatory applicability analyses. It would not be appropriate to assign these values as a permit limit due to uncontrollable variables inherent in the blasting process and the technical infeasibility of measuring the emission rates for compliance demonstration. Because the imposition of an emission standard is infeasible in this instance, OCC proposes that BACT for reducing blasting emissions is a work practice condition to use proper blasting techniques, proper explosive selection, optimized application of explosives, and the utilization of best operating practices. These work practice conditions collectively reduce the amount of gaseous and particulate emissions resulting from explosives detonation.
5.3.2 BACT for Particulate (PM, PM10, PM2.5) Emissions from Mine Activity– Material Handling and Removal
Earthen materials at the OCC mine will generally be removed in a three-stage process, sequentially removing topsoil, overburden, and coal. BACT determinations for mine activity material handling and removal are equivalent for all material types.
Topsoil is the first material removed in the process of surface coal extraction. It is removed, hauled, and either replaced in a reclaimed area for immediate re-vegetative
Otter Creek Coal Mine Page 94 MAQP Application OCC212408
growth, or stored in a pile for future reclamation. During the removal and dumping processes the topsoil is loaded into a scraper for removal. The scraper hauls the topsoil to its predetermined location.
After topsoil has been removed from an excavation area, overburden is drilled and blasted (as previously discussed) in order to loosen the material for future handling and removal. After blasting, OCC will handle and remove overburden material through the usage of dozers, trucks and shovels, and draglines. Once the overburden is blasted and removed, coal extraction can take place through further blasting and coal removal techniques. OCC will handle and remove loosened coal using shovels and haul trucks.
Overall, OCC proposes BACT for road grading, material handling and removal processes to be accomplished by the use of BOPs such that these sources are in compliance with ARM.17.8.304 and ARM 17.8.308. BOPs are to be utilized in order to reduce particulate emissions for all road grading, material removal, hauling, and dumping processes of topsoil, overburden, and coal. BOPs generally include minimizing material handling steps through careful mine planning and using processes that minimize fall distance on all material handling activities. Scraper and truck haul roads will be controlled by water spray and are further detailed in Section 5.3.4.
5.3.3 BACT for Particulate (PM, PM10, PM2.5) Emissions from Disturbed Acreage Wind Erosion Mine reclamation will occur throughout the life of the mine and will consist of spoil grading, topsoil placement and re-vegetation methods. As the topsoil and overburden is being removed in a new section of the mine, it is later hauled and refilled in an already excavated and mined section. Topsoil and overburden are thus strategically moved throughout the mine, so as to either 1) immediately replace a previously mined and graded area or 2) be stored for future reclamation use. All disturbed areas are potentially subject to wind erosion from the time an area is disturbed until the new vegetation emerges or control measures are employed. OCC proposes adherence to the elements described below as BACT for reducing particulate emissions from disturbed acreage and material storage. MDEQ has typically considered these types of control methods as BACT for fugitive dust sources in Montana. Disturbed Acreage (within a year of reuse) – Pits, Peaks, Graded Spoil and Topsoil Placement OCC will follow traditional mine reclamation processes by reclaiming sections of the mine with topsoil and overburden in accordance with a scheduled and strategized mining plan. This will optimize material hauling and transferring and will serve to limit disturbed areas subject to wind erosion.
Otter Creek Coal Mine Page 95 MAQP Application OCC212408
Further, due to the inherent moisture within the local material, a crust will form around the outer layer of material when left undisturbed. The crust acts as a natural barrier and reduces the influence of wind erosion on storage stockpiles. In order to ensure control efficiency, storage piles and graded areas will remain undisturbed until the area is ready for final reclamation activities. Best operating practices will be implemented and may include efficient storing and piling of material (to allow proper crusting), the piling of storage piles to a reasonable height, and orienting stockpiles to offer minimal cross-sectional area to prevailing winds. OCC will also add water, as necessary, to control emissions from wind erosion. Re-vegetation of disturbed areas will occur beyond a year of reuse and is described in the next section. Disturbed Acreage (beyond a year of reuse) – Areas Topsoiled and Seeded for Vegetation Growth
Once overburden and topsoil are relocated for final reclamation use, the overburden piles are smoothed and contoured, topsoil is placed on the graded areas, and the land is prepared for re-vegetation by furrowing, mulching, and other methods. OCC will utilize soil preparation and seeding to accomplish re-vegetation and final reclamation of mined areas. Fugitive particulate control efficiency will increase as more vegetation returns to the area over time, and the natural control method will eventually eliminate particulate emissions from the reclaimed land. Guidance provided by MDEQ posits that re-vegetation to rehabilitated land with one to two years of vegetative growth provides a 90% control efficiency of fugitive particulate emissions. Additionally, MDEQ provides 100% control efficiency for reclaimed land that has greater than two years of vegetative growth. OCC will utilize established land reclamation and re-vegetative growth as BACT for control of fugitive dust emissions on disturbed acreage in order to maintain compliance with ARM.17.8.304 and ARM 17.8.308.
5.3.4 BACT for Fugitive Particulate (PM, PM10, PM2.5) Emissions from Roadways
Particulate emissions from fugitive road dust will result from vehicle and equipment travel on roadways within the OCC mine site. OCC roads have been categorized into three types for the purposes of calculating potential emissions and determining BACT. OCC roadway categories include permanent haul roads, temporary haul roads, and mine access roads. Each type of road serves a unique purpose throughout the OCC property and requires varying degrees of control due to usage, permanence, and environmental impact. Table 5-5 lists particulate control technologies available for reducing roadway fugitive emissions.
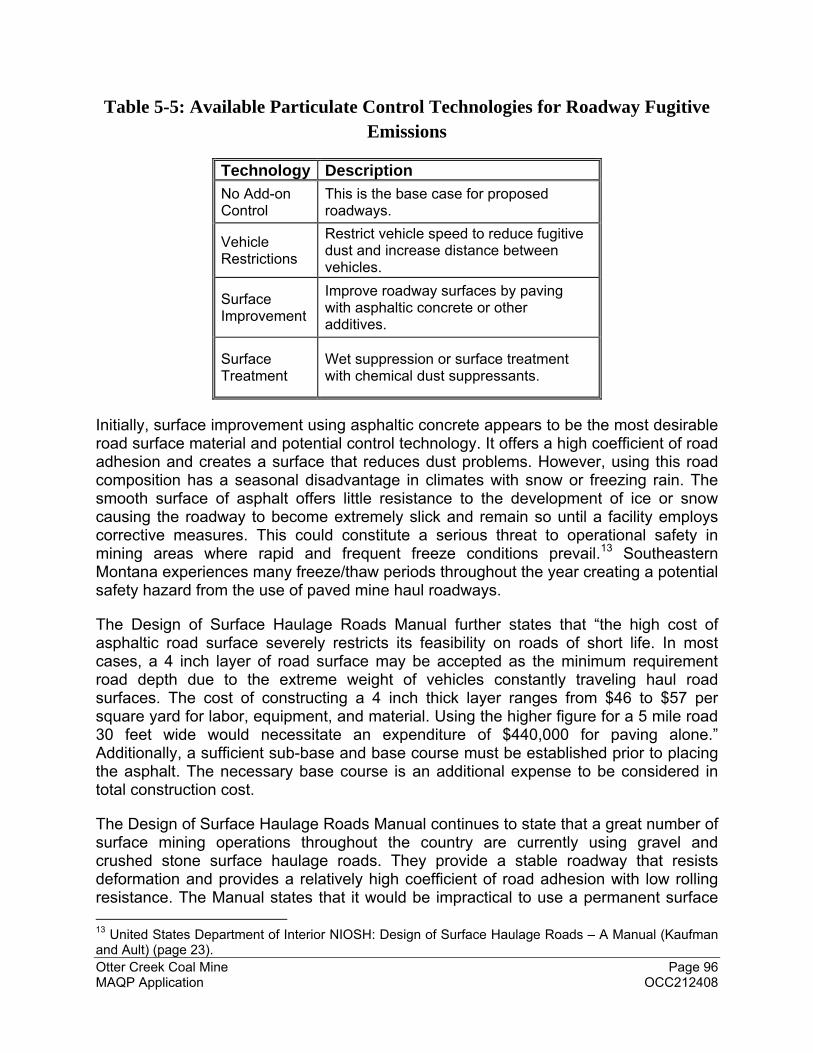
Otter Creek Coal Mine Page 96 MAQP Application OCC212408
Table 5-5: Available Particulate Control Technologies for Roadway Fugitive Emissions
Technology Description
No Add-on Control
This is the base case for proposed roadways.
Vehicle Restrictions
Restrict vehicle speed to reduce fugitive dust and increase distance between vehicles.
Surface Improvement
Improve roadway surfaces by paving with asphaltic concrete or other additives.
Surface Treatment
Wet suppression or surface treatment with chemical dust suppressants.
Initially, surface improvement using asphaltic concrete appears to be the most desirable road surface material and potential control technology. It offers a high coefficient of road adhesion and creates a surface that reduces dust problems. However, using this road composition has a seasonal disadvantage in climates with snow or freezing rain. The smooth surface of asphalt offers little resistance to the development of ice or snow causing the roadway to become extremely slick and remain so until a facility employs corrective measures. This could constitute a serious threat to operational safety in mining areas where rapid and frequent freeze conditions prevail.13 Southeastern Montana experiences many freeze/thaw periods throughout the year creating a potential safety hazard from the use of paved mine haul roadways.
The Design of Surface Haulage Roads Manual further states that “the high cost of asphaltic road surface severely restricts its feasibility on roads of short life. In most cases, a 4 inch layer of road surface may be accepted as the minimum requirement road depth due to the extreme weight of vehicles constantly traveling haul road surfaces. The cost of constructing a 4 inch thick layer ranges from $46 to $57 per square yard for labor, equipment, and material. Using the higher figure for a 5 mile road 30 feet wide would necessitate an expenditure of $440,000 for paving alone.” Additionally, a sufficient sub-base and base course must be established prior to placing the asphalt. The necessary base course is an additional expense to be considered in total construction cost.
The Design of Surface Haulage Roads Manual continues to state that a great number of surface mining operations throughout the country are currently using gravel and crushed stone surface haulage roads. They provide a stable roadway that resists deformation and provides a relatively high coefficient of road adhesion with low rolling resistance. The Manual states that it would be impractical to use a permanent surface 13 United States Department of Interior NIOSH: Design of Surface Haulage Roads – A Manual (Kaufman and Ault) (page 23).
Otter Creek Coal Mine Page 97 MAQP Application OCC212408
improvement control such as asphaltic concrete in areas where haul roads are subject to relocation or must accommodate heavy tracked vehicles.
Major traffic on OCC haul roads will consist of heavy machinery and certain roadways will be relocated throughout the life of the mine. Therefore, OCC determined that surface improvement control techniques utilizing asphaltic concrete are both economically impractical and potentially hazardous in the climate of the area.
The following sections discuss the application of the remaining control techniques to each type of roadway to be used at OCC. Permanent Haul Roads
Permanent haul roads will primarily be used at the OCC mine to move coal from the bench face to the coal dump. These roads vary in both silt and moisture content and produce a varying degree of fugitive road dust emissions. A combination of surface treatments and vehicle restrictions will be utilized to reduce fugitive road dust emissions from permanent haul roads.
The OCC mine proposes BACT as the utilization of magnesium chloride (MgCl2) and water as a surface treatment for the permanent haul roads. MgCl2 will be utilized to change the physical characteristics of the roadway surface, while water sprays will increase the moisture content of roadway material. Additional water spray will help to conglomerate particles and reduce the likelihood that they will become suspended.
Chemical dust suppressants, such as MgCl2, suppress emissions by changing the physical characteristics of the existing road surface material. After several applications, the chemical dust suppressant will form a hardened surface that binds particles together. A road treated with MgCl2 will resemble a non-uniformly flat, paved road.
Further vehicle restrictions will be enforced, as necessary, in order to control fugitive emissions from permanent haul road travel. This includes the limitation of vehicle speed. These measures, as well as available reasonable precautions, will maintain compliance with ARM.17.8.304 and ARM 17.8.308.
Temporary Haul Roads
Temporary haul roads will be used in conjunction with permanent haul roads at OCC to move coal from the bench face to the coal dump. These roads serve the same purpose as the permanent haul roads but will frequently change location throughout the life of the mine. Temporary haul roads also vary in both silt and moisture content and can produce a varying degree of fugitive road dust emissions. A combination of surface treatments and vehicle restrictions will be utilized to reduce fugitive road dust emissions from temporary haul roads at OCC.
OCC proposes BACT to be the utilization of water as a surface treatment for the temporary haul roads. MgCl2 is not utilized on these roads because road locations will be temporary. Changing the physical characteristics of the roadway surface using
Otter Creek Coal Mine Page 98 MAQP Application OCC212408
MgCl2 is impractical for temporary applications and will potentially inhibit future mining activities or the placement of future haul road locations. Thus, water sprays will be utilized to increase the moisture content of roadway material in order to conglomerate particles and reduce fugitive particulate emissions. The water sprays will be applied regularly.
Further vehicle restrictions will be enforced, as necessary, in order to control fugitive emissions from temporary haul road travel. This includes the limitation of vehicle speed. These measures, as well as available reasonable precautions, will maintain compliance with ARM.17.8.304 and ARM 17.8.308. Mine Access Roads
Mine access roads will be used at OCC for connection to the mining area and various industrial sites. These roads will primarily have a gravel surface and will experience very minimal usage by heavy machinery. A combination of surface treatments and vehicle restrictions will be utilized to reduce fugitive road dust emissions on mine access roads.
The OCC mine proposes BACT as the utilization of water as a surface treatment for all access roads. MgCl2 will not be utilized on these roads because of the location of access roads within the mine and their proximity to the local Otter Creek watershed. Mine access roads connect the main processing area of OCC to the mining and truck dumping sections by traversing Otter Creek. Rainwater can leach out highly soluble chlorides when in contact with MgCl2 and, due to the location of the access roads, the use of MgCl2 is technically infeasible due to the risk of leaching chlorides into the local drainage basin. This risk is absent in regard to MgCl2 use on permanent haul roads because of their shielded location within the mine site.
Additionally, mine access roads merely provide passage throughout the OCC property. They are not meant to accommodate heavy vehicle use on a continual basis and will experience far less overall usage than OCC permanent and temporary haul roads. Therefore, MgCl2 is also unnecessary for structural support of mine access roads.
Water sprays will be utilized to increase the moisture content of mine access roadway material in order to conglomerate particles and reduce the likelihood of fugitive particulate. The water sprays will be applied as necessary. Further vehicle restrictions will be also be enforced as necessary in order to control fugitive emissions from mine access road travel. This includes the limitation of vehicle speed. These measures, as well as available reasonable precautions, will maintain compliance with ARM.17.8.304 and ARM 17.8.308.
5.3.5 BACT for Gaseous (NO2, SO2, and CO) and Particulate (PM, PM10, PM2.5) Emissions from Portable and Mobile Engine Equipment
Engine emission sources at OCC include portable/mobile equipment that utilizes diesel and gasoline engines. The portable/mobile engines will power small portable light sources and additional equipment throughout OCC. They will not include large
Otter Creek Coal Mine Page 99 MAQP Application OCC212408
generator sets. Therefore, potential emissions have been calculated based upon fuel usage rather than an engine inventory. Emissions are based on Tier 4 worst-case engine emission factors for diesel use and AP-42 uncontrolled industrial engine emission factors for gasoline use. Emissions calculations are detailed in Section 3.0 and Appendix C of the report.
OCC proposes BACT for diesel engines to be in compliance with EPA Tier 4 Interim Standards and gasoline engines to be in compliance with applicable 40 CFR Part 60 Subpart JJJJ standards. By following Tier 4 and JJJJ standards, OCC will utilize good engine design and good combustion practices in order to control engine emissions.
Control of sulfur emissions from diesel engines will be from the combustion of ultra-low sulfur diesel. Other pollutants including CO, VOCs, NOX, and particulates are predicted to be very low due to the proposed engines meeting both EPA Tier 4 Interim Standards and NSPS Subpart JJJJ Standards.
MDEQ has recently permitted projects utilizing much larger generator sets that adhere to the same BACT standards as the proposed small engines at OCC. This includes the acceptance of EPA Tier 4 Standards as BACT at the Stillwater Mine for the Blitz and Benbow generator sets.
Otter Creek Coal Mine Page 100 MAQP Application OCC212408
6.0 AIR QUALITY IMPACT DEMONSTRATION
6.1 Introduction
Montana’s air quality rules require an applicant for a stationary source air quality permit to demonstrate compliance with ambient air quality standards designed to limit environmental impacts from air pollution emissions. The scope of this demonstration can vary greatly, depending on the size and type of development proposed. For smaller projects a qualitative evaluation may be sufficient, using professional judgment based on factors such as potential emission levels, emission source characteristics, existing air quality, regional meteorological conditions, surrounding terrain, and the proximity and scale of other nearby stationary emissions sources. For larger, more complex sources a quantitative modeling-based demonstration is often required. The OCC Mine is requesting a permitted production limit of 35 million tons of coal mined/year. The projected maximum annual coal production for mining in Tract 2 is 20.59 million tons (uncovered coal) occurring in Year 3. The operations would involve extensive stripping, excavating and hauling of material. OCC has conducted a detailed, quantitative and qualitative analysis of potential air quality impacts from the proposed mine based on the requested permit limit of 35 million tons/year. In the following section, OCC presents an analysis of air quality monitoring data collected near active coal mines in Montana. In addition, we have provided a dispersion modeling analysis which demonstrates that, by incorporating Best Management Practices and Best Available Control Technology (BACT) into its operations, the proposed mining activities can be conducted while maintaining compliance with applicable ambient air quality standards.
OCC has conducted this demonstration using two complementary approaches:
An analysis of extensive ambient data collected in the vicinity of comparable active coal mines in Montana is provided. This approach focuses on short term (1-hour and 24-hour) impacts from coal mines, and is supported by Section 234(a) of the 1990 Clean Air Act Amendments (commonly referred to as the Simpson Amendment), enacted in recognition of concerns about dispersion modeling’s accuracy for calculating short-term fugitive pollutant impacts from western surface coal mines. The results of that analysis are presented in Section 6.2 of this application.
To provide further analysis of potential impacts on ambient air quality, the EPA-preferred AERMOD model was used. This analysis used detailed emission source information, land use characteristics, and both onsite and offsite meteorological data to calculate pollutant concentrations. The results of that analysis are presented in Section 6.3 of this application.
By demonstrating ambient standard compliance with actual monitoring data from similar mines, and with a modeling analysis, OCC has satisfied the requirement to evaluate compliance with the National Ambient Air Quality Standards (NAAQS – 40 CFR 50) and Montana Ambient Air Quality Standards (MAAQS – ARM 17.8.201 et seq.).
Otter Creek Coal Mine Page 101 MAQP Application OCC212408
6.2 Compliance with Short-Term Standards As noted in the Introduction, there is recognition that existing dispersion models may not be a preferred tool for evaluating short-term pollutant impacts from surface coal mines; this was codified in Section 234(a) of the 1990 Clean Air Act Amendments. Therefore, a combined approach, using a detailed analysis of ambient data collected near comparable active mines and air dispersion modeling, was used to determine potential short-term pollutant impacts from the Otter Creek Mine:
Section 6.2.1 discusses the background and rationale for an empirical approach, including its particular relevance to the Otter Creek Mine.
Section 6.2.2 presents the technical approach for OCC’s selection and review of appropriate ambient monitoring data.
Section 6.2.3 presents the evaluation results for particulates (including both PM2.5 and PM10).
Section 6.2.4 presents the evaluation results for nitrogen dioxide (NO2).
6.2.1 Background and Rationale MDEQ requires submittal of an Air Quality Permit Application for any proposed facility with a potential to emit (PTE) of 25 tons per year or more of any airborne pollutant. The application form requires detailed facility and process information, and estimated pollutant emissions from each emitting unit. Additionally, Section 7.2 of the form requires an analysis of the area’s current air quality status, plus the results of any required dispersion modeling. The dispersion modeling analysis must demonstrate that the resulting ambient concentrations of the facility’s emitted pollutants (in combination with existing background levels) will not exceed the applicable ambient standards – which often include both long-term (annual) and short-term (e.g., 1-hour, 24-hour) averaging periods, depending on the pollutant.
Conventional Modeling Applications
Dispersion modeling for sources such as power generation facilities and industrial plants is relatively straightforward; the bulk of emissions from such facilities is largely concentrated in a limited number of emitting points (e.g., stacks and exhausts), which are often monitored by continuous emissions monitoring systems (CEMS). Modeling is based on precise, facility-specific pollutant emission data, and well-understood physical processes governing the dispersion of pollutants from well-defined, relatively consistent point or area sources. For smaller facilities, a limited screening-level modeling exercise based on conservative assumptions may suffice. If such modeling shows compliance, no further analysis is usually required. If initial results are more ambiguous, more detailed modeling is conducted using EPA-approved models such as AERMOD, with on-site and/or geographically representative meteorological data that realistically portray winds at stack height. For these types of sources, refined modeling estimating pollutant
Otter Creek Coal Mine Page 102 MAQP Application OCC212408
impacts over varying time periods is generally acceptable because of the use of facility-specific emission data and more realistic dispersion assumptions.
Use of Models for Surface Coal Mines Surface coal mines present a more challenging modeling problem, particularly for evaluation of short-term particulate impacts. The vast majority of particulate emissions from the Otter Creek Mine will be fugitive, as with other surface coal mines in the Powder River Basin (PRB) area of southeastern Montana. Primary emission sources will include blasting, excavating, hauling and transfer of material. Fugitive emissions also will be generated by primary and secondary crushers, access road traffic, and wind erosion of disturbed areas. These sources, and their projected particulate emissions on a calendar year basis, are summarized in Section 6.3 of this document. Standard emission factors have been developed for activities related to surface coal mining; fugitive particulate emissions are primarily addressed in the U.S. Environmental Protection Agency’s Compilation of Air Pollutant Emission Factors (AP-42), Section 11.9: Western Surface Coal Mining. These factors were developed based on limited empirical data; while qualitatively realistic, the factors may not be universally accurate for all surface coal mines. Perhaps even more important, these types of fugitive emissions are temporally variable due to the intermittent nature of the processes, and the emissions themselves can be strongly affected by localized weather conditions (such as winds and precipitation). Because such emissions often occur near ground level, their dispersion is greatly affected by small-scale terrain features – in contrast to more elevated point sources. Finally, there are limitations in the ability of dispersion models to accommodate such details, even if they could be precisely determined. While the inaccuracies resulting from these assumptions may “average out” to some degree over the long-term, they conspire to make the accurate short-term calculation of particulate impacts from surface coal mines difficult. Evaluations of model performance to date have shown that short-term particulate concentrations from surface coal mining activities are consistently over-predicted. 6.2.2 Technical Approach – Ambient Monitoring Data An evaluation of the OCC facility’s short-term impacts was made by analyzing ambient monitoring data from similar existing operations. The general approach included:
Reviewing production data from existing surface coal mines in Montana’s Powder River Basin, and identifying similar mines and/or mine groups;
Obtaining ambient monitoring data in the vicinity of those mines and/or mine groups; and
Evaluating the ambient data with respect to applicable ambient air quality standards.
OCC reviewed operational data for existing PRB coal mines in Montana, and identified mines and/or mine groups whose ambient impacts should be comparable to those from
Otter Creek Coal Mine Page 103 MAQP Application OCC212408
Otter Creek. Comparability factors included the tonnage of coal produced plus cubic yards of overburden removed and acreage of disturbed areas (where available).
Primary data sources included:
The U.S. Department of Energy’s Energy Information Administration, which issues annual reports on coal production,
The Montana Department of Environmental Quality (MDEQ), and
Information from mining companies and trade associations.
Another consideration was information availability. OCC was highly successful in obtaining representative operational/production data and ambient monitoring results to estimate impacts from the Otter Creek Mine with a reasonable degree of conservatism.
Based on the selection criteria discussed previously, three mines / mine groups were identified as comparable to Otter Creek:
The Spring Creek and Decker mines, located in southeastern Montana approximately 20 miles to the southwest of Otter Creek and 35 miles north of Sheridan, Wyoming. The Spring Creek Mine is currently the largest producing coal mine in Montana. The Decker Mine is currently a smaller producer, but its historical production was nearly equal to that at Spring Creek. They operated concurrently for many years and are essentially contiguous; therefore, they were considered as a single group. The Spring Creek Mine’s production was over 19 million tons in 2010 and 2011, but dropped to 17 million tons in 2012. Their combined production was between 21 and 22 million tpy from 1998-2000, and was over 20 million tpy from 2004-2010.
The Western Energy Company (WECO) Rosebud Mine is located approximately 20 miles north-northwest of Otter Creek, and just west of Colstrip, Montana. The Rosebud Mine’s annual production has varied, but was between 10 million and 14 million tpy in 1994 and 1995, and again from 1998 through 2010. While its production has been roughly half that projected at Otter Creek, the Rosebud Mine’s disturbed area is larger because of its longevity and because of a somewhat higher stripping ratio. Ambient PM10 data were collected from 1992 to 2001. Ambient data for the Rosebud Mine was considered relevant for evaluating the Otter Creek Mine’s potential impacts.
Montana’s Absaloka mine, located near Hardin, was also reviewed. Because its
production is much less than projected for Otter Creek, it was considered less representative.
For comparison, Table 6-1 presents relevant production data for selected years for each of the selected mines / mine groups, plus projected maximum activity levels at Otter Creek during the first 19 years of production (Tract 2).
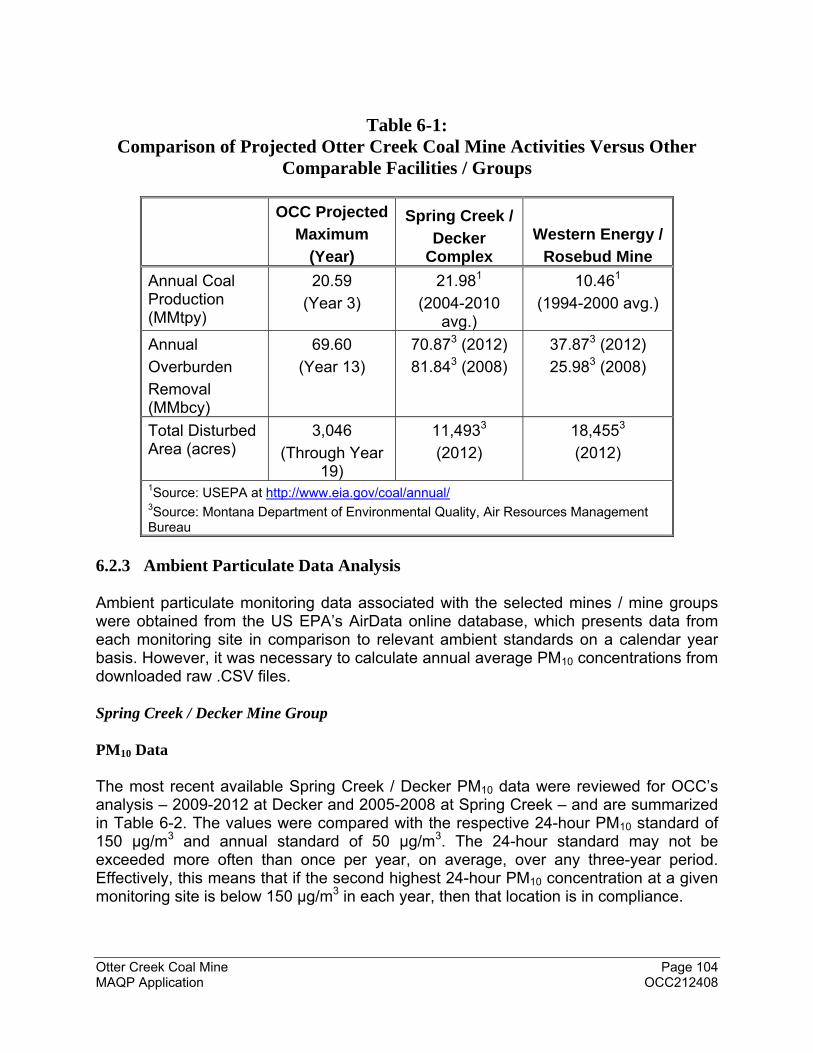
Otter Creek Coal Mine Page 104 MAQP Application OCC212408
Table 6-1:
Comparison of Projected Otter Creek Coal Mine Activities Versus Other Comparable Facilities / Groups
OCC Projected
Maximum
(Year)
Spring Creek /
Decker Complex
Western Energy /
Rosebud Mine
Annual Coal Production (MMtpy)
20.59
(Year 3)
21.981
(2004-2010 avg.)
10.461
(1994-2000 avg.)
Annual
Overburden
Removal (MMbcy)
69.60
(Year 13)
70.873 (2012)
81.843 (2008)
37.873 (2012)
25.983 (2008)
Total Disturbed Area (acres)
3,046
(Through Year 19)
11,4933
(2012)
18,4553
(2012)
1Source: USEPA at http://www.eia.gov/coal/annual/ 3Source: Montana Department of Environmental Quality, Air Resources Management Bureau
6.2.3 Ambient Particulate Data Analysis Ambient particulate monitoring data associated with the selected mines / mine groups were obtained from the US EPA’s AirData online database, which presents data from each monitoring site in comparison to relevant ambient standards on a calendar year basis. However, it was necessary to calculate annual average PM10 concentrations from downloaded raw .CSV files. Spring Creek / Decker Mine Group PM10 Data The most recent available Spring Creek / Decker PM10 data were reviewed for OCC’s analysis – 2009-2012 at Decker and 2005-2008 at Spring Creek – and are summarized in Table 6-2. The values were compared with the respective 24-hour PM10 standard of 150 µg/m3 and annual standard of 50 µg/m3. The 24-hour standard may not be exceeded more often than once per year, on average, over any three-year period. Effectively, this means that if the second highest 24-hour PM10 concentration at a given monitoring site is below 150 µg/m3 in each year, then that location is in compliance.
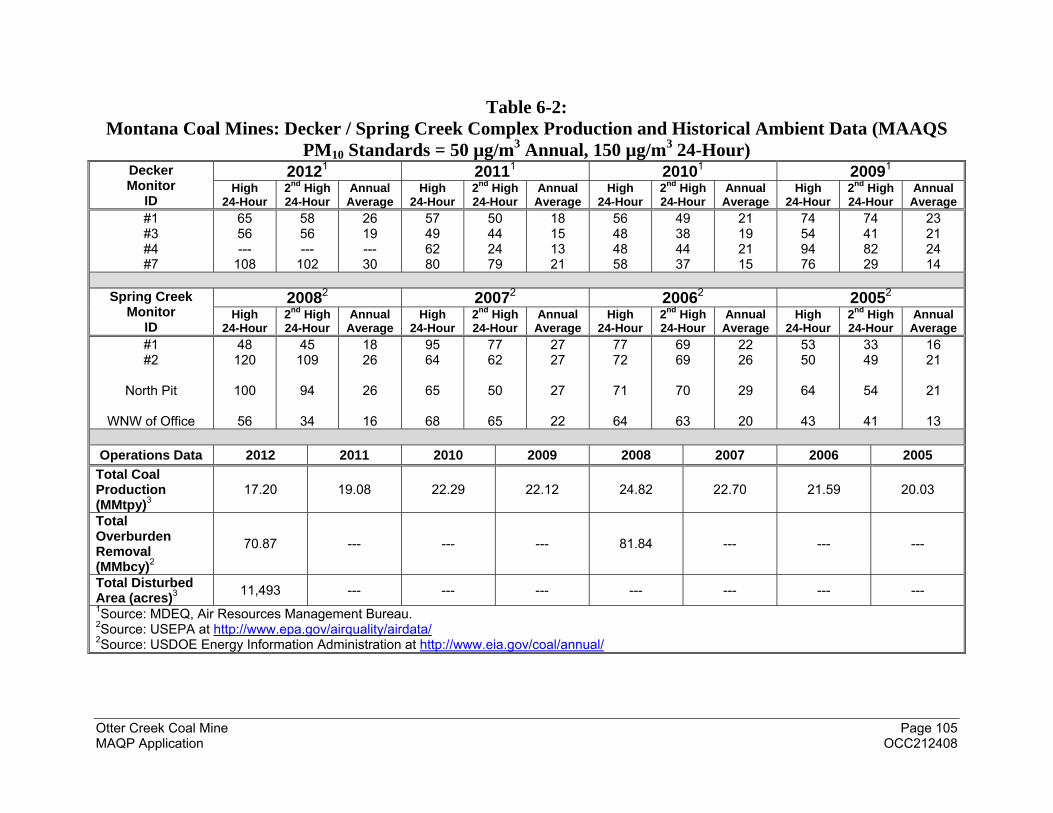
Otter Creek Coal Mine Page 105 MAQP Application OCC212408
Table 6-2: Montana Coal Mines: Decker / Spring Creek Complex Production and Historical Ambient Data (MAAQS
PM10 Standards = 50 µg/m3 Annual, 150 µg/m3 24-Hour) Decker Monitor
ID
20121 20111 20101 20091 High
24-Hour 2nd High24-Hour
AnnualAverage
High24-Hour
2nd High24-Hour
AnnualAverage
High 24-Hour
2nd High24-Hour
AnnualAverage
High24-Hour
2nd High24-Hour
AnnualAverage
#1 #3 #4 #7
65 56 ---
108
58 56 ---
102
26 19 --- 30
57 49 62 80
50 44 24 79
18 15 13 21
56 48 48 58
49 38 44 37
21 19 21 15
74 54 94 76
74 41 82 29
23 21 24 14
Spring Creek
Monitor ID
20082 20072 20062 20052 High
24-Hour 2nd High24-Hour
AnnualAverage
High24-Hour
2nd High24-Hour
AnnualAverage
High 24-Hour
2nd High24-Hour
AnnualAverage
High24-Hour
2nd High24-Hour
AnnualAverage
#1 #2
North Pit
WNW of Office
48 120
100
56
45 109
94
34
18 26
26
16
95 64
65
68
77 62
50
65
27 27
27
22
77 72
71
64
69 69
70
63
22 26
29
20
53 50
64
43
33 49
54
41
16 21
21
13 Operations Data 2012 2011 2010 2009 2008 2007 2006 2005
Total Coal Production (MMtpy)3
17.20 19.08 22.29 22.12 24.82 22.70 21.59 20.03
Total Overburden Removal (MMbcy)2
70.87 --- --- --- 81.84 --- --- ---
Total Disturbed Area (acres)3
11,493 --- --- --- --- --- --- --- 1Source: MDEQ, Air Resources Management Bureau.2Source: USEPA at http://www.epa.gov/airquality/airdata/ 2Source: USDOE Energy Information Administration at http://www.eia.gov/coal/annual/
Otter Creek Coal Mine Page 106 MAQP Application OCC212408
The maximum second-highest PM10 concentration of 109 µg/m3 occurred at the Spring Creek #2 site in 2008; this value represents 72.7% of the effective standard; 2008 was also the year of maximum combined coal production (just below 25 million tons). The highest annual average PM10 concentration, 30 µg/m3, occurred in 2012 at the Decker #7 site (representing 60% of the 50 µg/m3 annual standard). The historical ambient data from the Spring Creek and Decker mines indicate that the proposed operations at OCC will not result in violations of the 24-hour (or annual) PM10 standard. PM2.5 Data No PM2.5 data were available from either mine. Rosebud Mine PM10 Data The PM10 data set reviewed for this evaluation was collected between 1992 and 2001 at seven locations around the Rosebud mine, just west of Colstrip, Montana. After many years showing continuous compliance with both annual and 24-hour PM10 standards, MDEQ allowed the ambient monitoring program to end. Table 6-3 presents the data from those sites:
The highest of the second-highest 24-hour concentrations was 57 µg/m3 at WECO Site 10 in 2000. This is 38.0% of the corresponding ambient standard.
The highest annual average concentration in any single year was 14 µg/m3 at WECO Site 1 in 2000 and at WECO Site 10 in 1994. This value is 28.0% of the corresponding ambient standard.
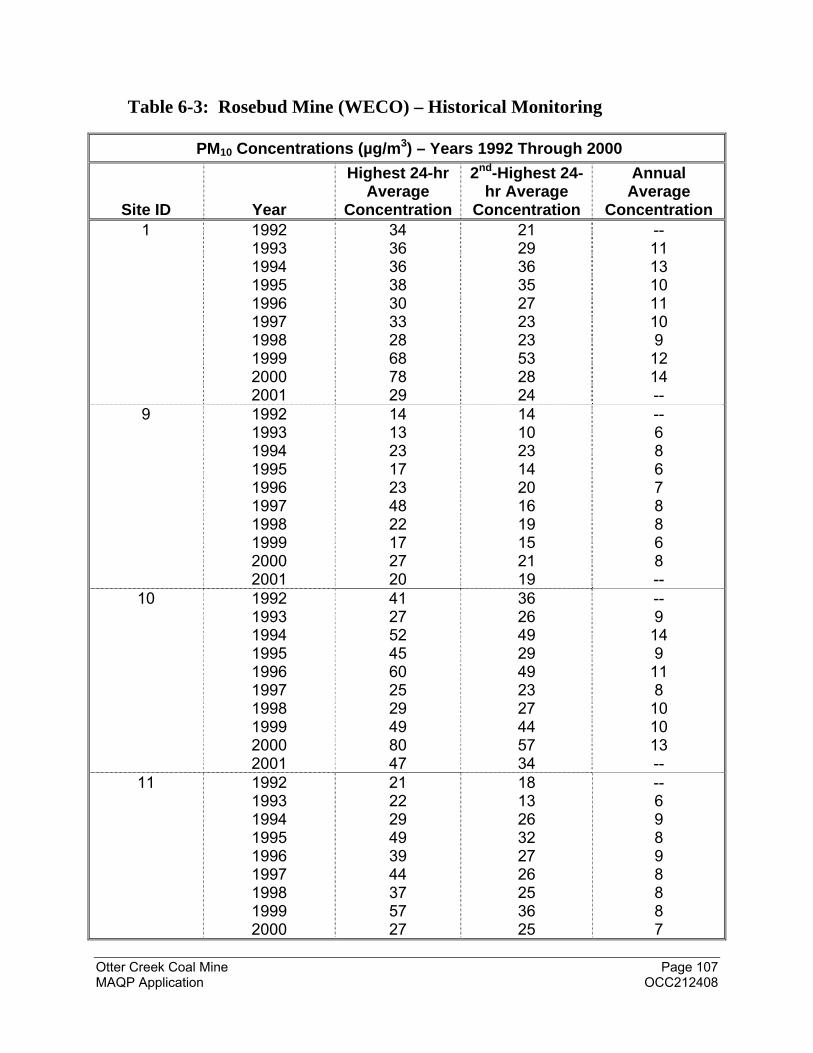
Otter Creek Coal Mine Page 107 MAQP Application OCC212408
Table 6-3: Rosebud Mine (WECO) – Historical Monitoring
PM10 Concentrations (µg/m3) – Years 1992 Through 2000
Site ID
Year
Highest 24-hr Average
Concentration
2nd-Highest 24-hr Average
Concentration
Annual Average
Concentration 1 1992
1993 1994 1995 1996 1997 1998 1999 2000 2001
34 36 36 38 30 33 28 68 78 29
21 29 36 35 27 23 23 53 28 24
-- 11 13 10 11 10 9 12 14 --
9 1992 1993 1994 1995 1996 1997 1998 1999 2000 2001
14 13 23 17 23 48 22 17 27 20
14 10 23 14 20 16 19 15 21 19
-- 6 8 6 7 8 8 6 8 --
10 1992 1993 1994 1995 1996 1997 1998 1999 2000 2001
41 27 52 45 60 25 29 49 80 47
36 26 49 29 49 23 27 44 57 34
-- 9 14 9 11 8 10 10 13 --
11 1992 1993 1994 1995 1996 1997 1998 1999 2000
21 22 29 49 39 44 37 57 27
18 13 26 32 27 26 25 36 25
-- 6 9 8 9 8 8 8 7
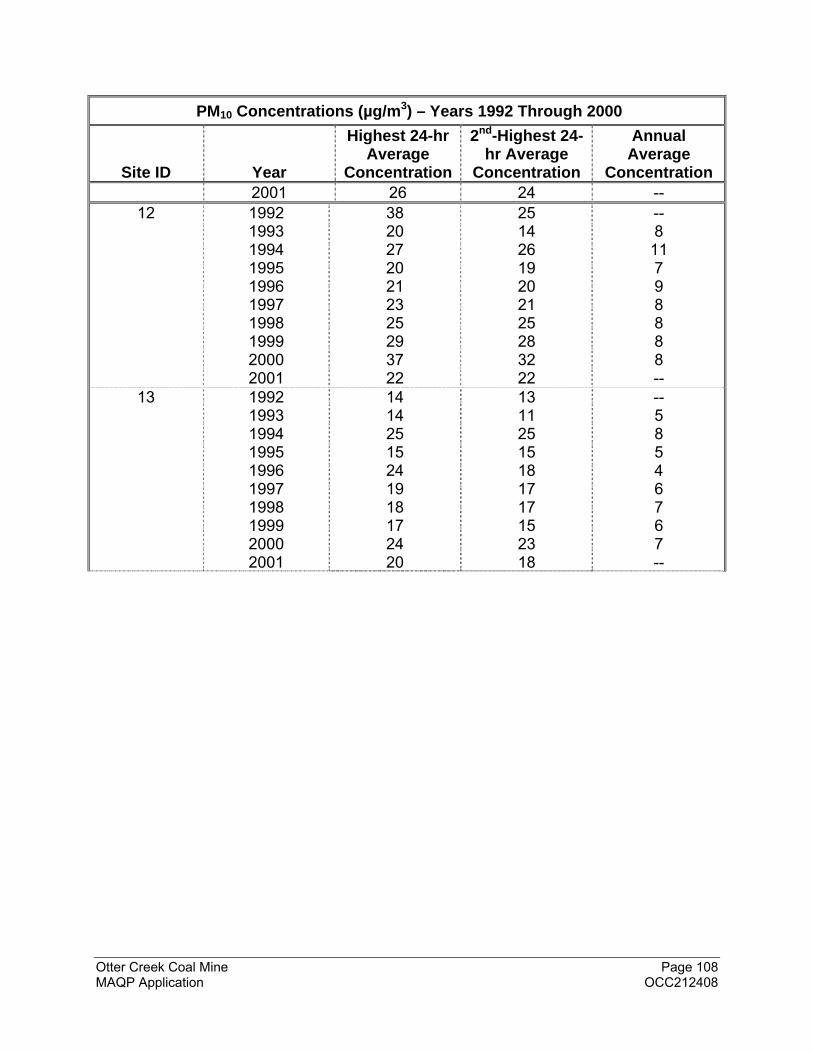
Otter Creek Coal Mine Page 108 MAQP Application OCC212408
PM10 Concentrations (µg/m3) – Years 1992 Through 2000
Site ID
Year
Highest 24-hr Average
Concentration
2nd-Highest 24-hr Average
Concentration
Annual Average
Concentration 2001 26 24 --
12 1992 1993 1994 1995 1996 1997 1998 1999 2000 2001
38 20 27 20 21 23 25 29 37 22
25 14 26 19 20 21 25 28 32 22
-- 8 11 7 9 8 8 8 8 --
13 1992 1993 1994 1995 1996 1997 1998 1999 2000 2001
14 14 25 15 24 19 18 17 24 20
13 11 25 15 18 17 17 15 23 18
-- 5 8 5 4 6 7 6 7 --
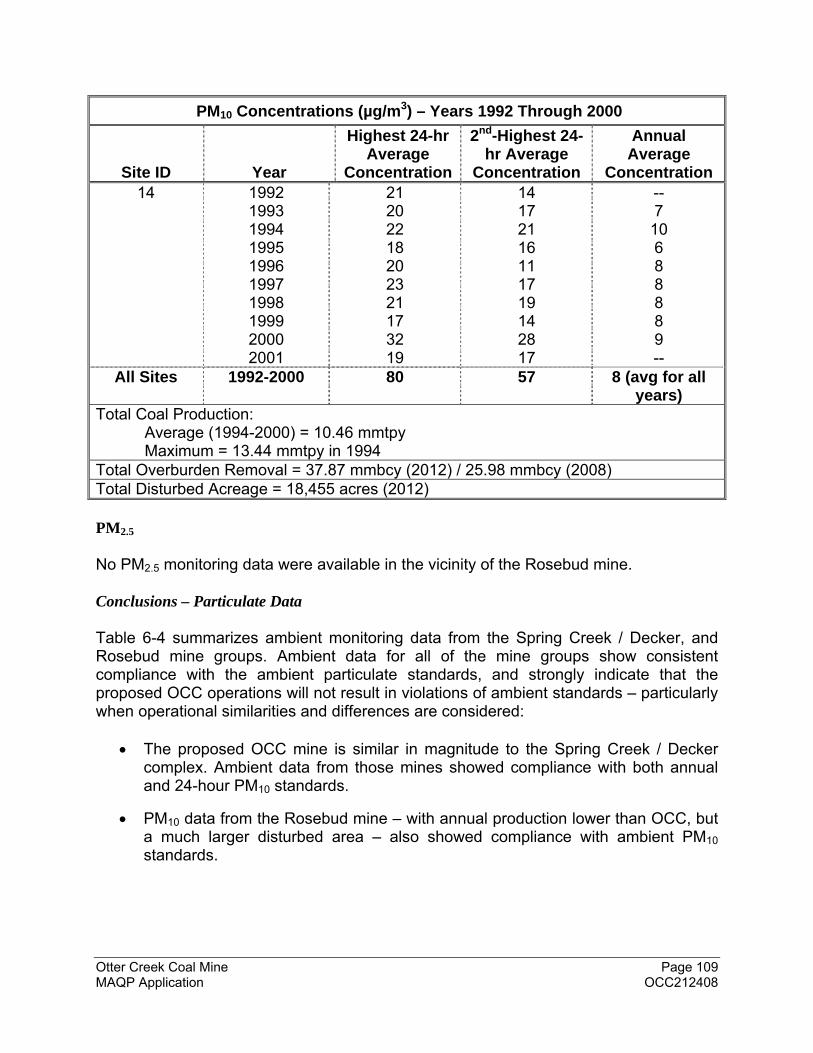
Otter Creek Coal Mine Page 109 MAQP Application OCC212408
PM10 Concentrations (µg/m3) – Years 1992 Through 2000
Site ID
Year
Highest 24-hr Average
Concentration
2nd-Highest 24-hr Average
Concentration
Annual Average
Concentration 14 1992
1993 1994 1995 1996 1997 1998 1999 2000 2001
21 20 22 18 20 23 21 17 32 19
14 17 21 16 11 17 19 14 28 17
-- 7 10 6 8 8 8 8 9 --
All Sites 1992-2000 80 57 8 (avg for all years)
Total Coal Production: Average (1994-2000) = 10.46 mmtpy Maximum = 13.44 mmtpy in 1994 Total Overburden Removal = 37.87 mmbcy (2012) / 25.98 mmbcy (2008) Total Disturbed Acreage = 18,455 acres (2012) PM2.5
No PM2.5 monitoring data were available in the vicinity of the Rosebud mine. Conclusions – Particulate Data Table 6-4 summarizes ambient monitoring data from the Spring Creek / Decker, and Rosebud mine groups. Ambient data for all of the mine groups show consistent compliance with the ambient particulate standards, and strongly indicate that the proposed OCC operations will not result in violations of ambient standards – particularly when operational similarities and differences are considered:
The proposed OCC mine is similar in magnitude to the Spring Creek / Decker complex. Ambient data from those mines showed compliance with both annual and 24-hour PM10 standards.
PM10 data from the Rosebud mine – with annual production lower than OCC, but a much larger disturbed area – also showed compliance with ambient PM10 standards.
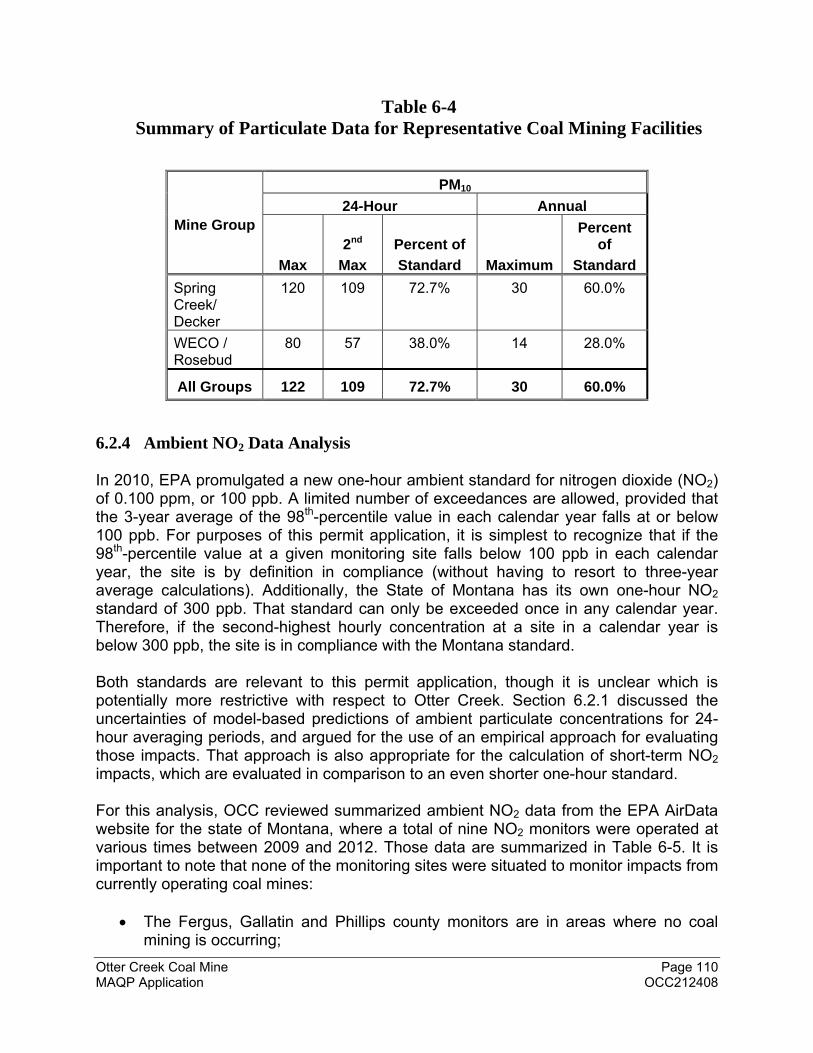
Otter Creek Coal Mine Page 110 MAQP Application OCC212408
Table 6-4 Summary of Particulate Data for Representative Coal Mining Facilities
Mine Group
PM10
24-Hour Annual
Max
2nd
Max
Percent of
Standard Maximum
Percent of
Standard
Spring Creek/ Decker
120 109 72.7% 30 60.0%
WECO / Rosebud
80 57 38.0% 14 28.0%
All Groups 122 109 72.7% 30 60.0%
6.2.4 Ambient NO2 Data Analysis In 2010, EPA promulgated a new one-hour ambient standard for nitrogen dioxide (NO2) of 0.100 ppm, or 100 ppb. A limited number of exceedances are allowed, provided that the 3-year average of the 98th-percentile value in each calendar year falls at or below 100 ppb. For purposes of this permit application, it is simplest to recognize that if the 98th-percentile value at a given monitoring site falls below 100 ppb in each calendar year, the site is by definition in compliance (without having to resort to three-year average calculations). Additionally, the State of Montana has its own one-hour NO2 standard of 300 ppb. That standard can only be exceeded once in any calendar year. Therefore, if the second-highest hourly concentration at a site in a calendar year is below 300 ppb, the site is in compliance with the Montana standard. Both standards are relevant to this permit application, though it is unclear which is potentially more restrictive with respect to Otter Creek. Section 6.2.1 discussed the uncertainties of model-based predictions of ambient particulate concentrations for 24-hour averaging periods, and argued for the use of an empirical approach for evaluating those impacts. That approach is also appropriate for the calculation of short-term NO2 impacts, which are evaluated in comparison to an even shorter one-hour standard. For this analysis, OCC reviewed summarized ambient NO2 data from the EPA AirData website for the state of Montana, where a total of nine NO2 monitors were operated at various times between 2009 and 2012. Those data are summarized in Table 6-5. It is important to note that none of the monitoring sites were situated to monitor impacts from currently operating coal mines:
The Fergus, Gallatin and Phillips county monitors are in areas where no coal mining is occurring;
Otter Creek Coal Mine Page 111 MAQP Application OCC212408
The Richland County monitor northwest of Sidney was established to monitor
impacts from the Montana portion of the Bakken oilfield;
The Powder River County monitor just east of Broadus is in “coal country,” but is not close to any active or historic mine – its purpose is to establish background NO2 concentrations in advance of expected regional development.
The Rosebud County monitor just north of Birney is essentially a background
monitor for the Otter Creek area. The data in Table 6-5 show the following:
Concentrations at the Fergus, Gallatin and Phillips county monitors are low with respect to both the Montana and federal one-hour standards. The highest single one-hour concentrations at each site were less than 50 ppb, and the 98th-percentile values were less than 30 ppb.
Similarly, the Powder River County monitor’s highest one-hour value was only 55 ppb, far below both the Montana and federal standards.
The Birney monitor, located within a few miles of the Otter Creek area, also shows very low NO2 concentrations over a 3-year period. The highest observed one-hour concentration was 16 ppb, while the 98th-percentile values were each below 10 ppb. This demonstrates that 1) background concentrations near Otter Creek are very low, and 2) ambient NO2 concentrations near Otter Creek are only minimally impacted – if at all – by NOX emissions from the Colstrip power plant and its nearby Rosebud Mine.
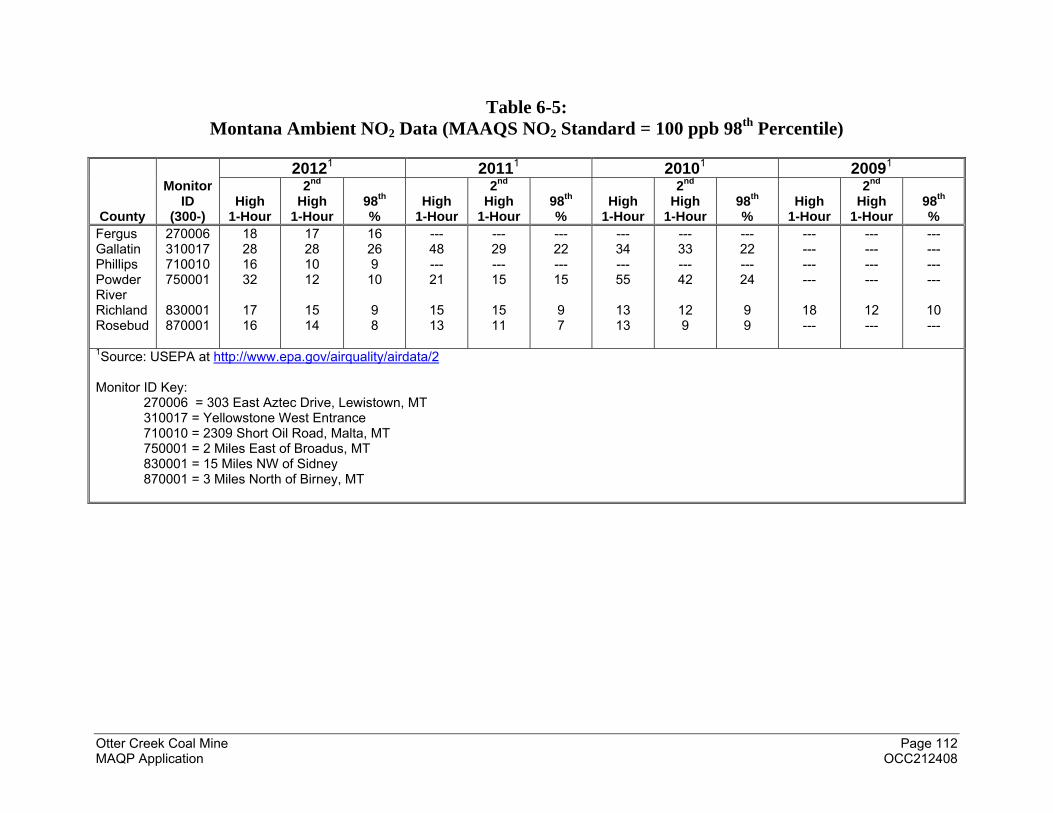
Otter Creek Coal Mine Page 112 MAQP Application OCC212408
Table 6-5: Montana Ambient NO2 Data (MAAQS NO2 Standard = 100 ppb 98th Percentile)
County
Monitor ID
(300-)
20121 20111 20101 20091
High 1-Hour
2nd High
1-Hour 98th %
High 1-Hour
2nd High
1-Hour 98th %
High 1-Hour
2nd High
1-Hour 98th %
High 1-Hour
2nd High
1-Hour 98th %
Fergus Gallatin Phillips Powder River Richland Rosebud
270006 310017 710010 750001
830001 870001
18 28 16 32
17 16
17 28 10 12
15 14
16 26 9 10 9 8
--- 48 --- 21
15 13
--- 29 --- 15
15 11
--- 22 --- 15 9 7
--- 34 --- 55
13 13
--- 33 --- 42
12 9
--- 22 --- 24 9 9
--- --- --- ---
18 ---
--- --- --- ---
12 ---
--- --- --- ---
10 ---
1Source: USEPA at http://www.epa.gov/airquality/airdata/2 Monitor ID Key:
270006 = 303 East Aztec Drive, Lewistown, MT 310017 = Yellowstone West Entrance 710010 = 2309 Short Oil Road, Malta, MT 750001 = 2 Miles East of Broadus, MT 830001 = 15 Miles NW of Sidney 870001 = 3 Miles North of Birney, MT
Otter Creek Coal Mine Page 113 MAQP Application OCC212408
6.3 Compliance with Short and Long-Term Standards-Dispersion Modeling
To further demonstrate compliance with applicable short and long-term (annual) MAAQS and NAAQS, OCC used the EPA-preferred AERMOD dispersion model and supporting software (AERMET and AERMAP) as described in Section 6.3.1. The general modeling approach is discussed in Section 6.3.2, while important model inputs and options are discussed in Sections 6.3.3 through 6.3.12. Modeling results, and an evaluation of their compliance with annual standards, are presented in Section 6.4.
6.3.1 Model Selection
MAAQS/NAAQS compliance demonstrations for this project were performed using EPA’s preferred refined air dispersion model for regulatory compliance demonstrations. AERMOD calculates ambient air concentration impacts using hourly meteorological data processed by the AERMET program and elevation data produced by the AERMAP program. The BEEST for Windows Version 10.13 suite, sold by Oris Solutions, LLC, was used for this project’s impacts analyses. It incorporates the following EPA software versions:
AERMOD – 14134
AERMET – 14134
AERMAP – 11103
All three programs were executed using the BEE-Line Software BEEST graphical user interface program, Version 10.13. Modeling input and output electronic files are provided on the DVD included with this report.
Additional algorithms used to conduct the modeling analyses included:
AERMINUTE, Version 11325 – This program uses one-minute wind speed data to generate hourly average wind speed and direction data for NWS ASOS weather stations. For the Otter Creek Mine modeling, this program was used with Billings Logan International Airport (NWS) meteorological data to reduce the number of calm hours in the dataset.
AERSURFACE, Version 13016 – This program extracts data from land use data files and calculates surface roughness, albedo, and Bowen ratio values that are used by AERMET.
Various input data files were used in the modeling analyses, and are described in the following sections.
6.3.2 General Analysis Methodology
OCC conducted its modeling demonstration of ambient air quality standards compliance via a two-stage process. In Phase 1, only the Otter Creek Mine’s proposed emission sources were modeled. The results of this first phase analysis were compared to
Otter Creek Coal Mine Page 114 MAQP Application OCC212408
appropriate Significant Impact Levels (SILs). If no modeled receptor registered a peak concentration impact greater than the SIL for a given pollutant, the determination was made that this project could not cause or contribute to a violation of the associated MAAQS/NAAQS, and no further modeling was conducted for that pollutant.
Phase 2 of the modeling process evaluated total ambient pollutant concentrations during mine operations by adding impacts from surrounding facilities (as indicated by ambient background concentrations) to those predicted from the mine itself. These calculated total concentrations then were compared against the respective MAAQS/NAAQS to determine compliance.
Select inputs to the various algorithms used to perform the modeling analyses are identified and described below. Complete input values and data files are contained in reports automatically generated by the modeling programs, and those reports are included on the DVD accompanying this document. In case of inadvertent discrepancies between model values presented in this report and those in the electronic, program-generated reports, the latter should be assumed correct.
6.3.3 Meteorological Data
AERMOD requires hourly meteorological (met) data with a minimum set of parameters such as temperature, wind speed, and wind direction to calculate concentration impacts. EPA modeling policy suggests the use of either one complete year of meteorological data collected near the site of the proposed project, or the five most current years of data collected at an NWS station within the general vicinity of the project. Modeling policy goes on to state that if more than one year of on-site data is available, that data should be used, up to a total of five years. OCC collected three years of meteorological data which includes February 2011 through January 2013.
The data provided to AERMOD must be processed through the AERMET module. AERMET requires, at a minimum, one set of hourly surface observation data and a complementary set of twice-daily upper air sounding data. If on-site data are provided, AERMET will optionally accept additional NWS surface data that it uses to substitute data missing from the on-site set.
Another optional form of meteorological data supplementation reduces “calm” condition occurrences. If an hourly wind speed measurement is below a threshold value, AERMOD does not calculate projected concentrations for that hour. To address instances where hourly observational data include a significant number of calm hours, thereby reducing the completeness of the modeling results, EPA recently developed a preprocessor called AERMINUTE that accepts one-minute ASOS data and generates hourly averaged wind speeds and wind directions that can supplement the standard hourly ASOS observations. AERMINUTE was used for processing of the Billings, MT, surface met data, to reduce the number of calm hours in the NWS data substituted for missing hours in the on-site data.

Otter Creek Coal Mine Page 115 MAQP Application OCC212408
Data describing surface characteristics surrounding the surface meteorological station are an additional required input to AERMET. Seasonally and directionally varying data are available in the form of land cover data files available from the Multi-Resolution Land Characteristics Consortium. Files from the 1992 National Land Cover Database (NLCD1992)14 were obtained from this site for input into AERSURFACE, which reads the data and reports surface characteristics that can be entered into AERMET.
EPA has recently incorporated new model input options developed to address the issues of the model over-prediction during stable, low wind conditions. The conservative over-prediction of model impacts has been discussed at the annual EPA Regional, State, and Local Modelers' Workshops and at the 2012 EPA 10th Conference on Air Quality Modeling. These model options include the STABLEBL_ADJ_U* adjustment that is designed to more accurately account for stable, low wind conditions affecting low-level sources. This modeling has incorporated the new "BETA" option to adjust u* (ustar) for low wind speed stable conditions, based on Qian and Venkatram (2011). The new option is selected by including the METHOD STABLEBL ADJ_U* keyword on the METPREP pathway in the Stage 3 input file.
Meteorological Data Selection
The Otter Creek Mine modeling analysis used all of the data types described above. To facilitate optimal calculations of emission transport, on-site meteorological data collected near Otter Creek from February 2011 through January 2014 were used as the primary source for surface wind speed, wind direction and temperature. The AERMOD suite also requires both surface and upper air data from one or more NWS / ASOS stations. The Billings, Miles City and Sheridan (WY) stations were considered for surface data, while the Glasgow, Great Falls and Riverton (WY) stations were considered for upper air data. The purposes of each dataset, and the station ultimately selected for each, are discussed in the following paragraphs.
The NWS surface station is used for:
Cloud cover data, which is used to calculate atmospheric stability, and
Substitute data, for periods when wind speed, wind direction, and/or temperature data are missing from the on-site station.
The Billings NWS station was chosen for these purposes, despite Miles City and Sheridan’s closer proximity, for the following reasons:
Of the three available surface stations, the temperature regime of Billings is the most similar to Otter Creek’s, with Sheridan a close second. Although Miles City is the closest of the three surface stations, it is often the least comparable in terms of temperature – particularly during winter months, when Miles City is
14 Note that, although newer datasets are available, they are not currently supported by AERSURFACE.
Otter Creek Coal Mine Page 116 MAQP Application OCC212408
impacted by arctic air masses considerably more often than areas to the south and west.
Billings is in close proximity to low hills, with the Beartooth Mountains approximately 60 miles to the southwest. Similarly, the Otter Creek area contains numerous small hills, with the Bighorn Mountains approximately 70 miles to the southwest. The Otter Creek and Billings areas receive similar annual precipitation and are otherwise climatologically similar. Therefore, cloud cover at those locations should be reasonably similar. Conversely, while Sheridan’s overall climate is similar to Otter Creek’s, cloud cover at Sheridan may be markedly affected by its close proximity to the Bighorn Mountains – which would tend to locally increase cloud cover during easterly airflow, and decrease cloud cover during westerly flow. Similarly, the terrain surrounding Miles City is relatively flat; both the Beartooth and Bighorn mountains are over 140 miles away. Additionally, Miles City is often influenced by different air masses than Otter Creek (and also Billings and Sheridan), particularly during winter months. The arctic air masses that dominate the Dakotas during the winter months also strongly influence the climate of northeastern Montana, and this zone of influence often extends to Miles City – but not to Billings, Sheridan, or most of southeastern Montana. Miles City and points north and east often experience episodes of low clouds and fog, while areas to the south and west are comparatively clear (and much warmer).
It is questionable whether surface wind data from any of the three stations accurately represent conditions at Otter Creek. However, only limited wind data substitution was required, since wind data recovery at Otter Creek exceeded 98%.
The NWS upper-air station data is used to calculate twice-daily mixing heights. The Great Falls NWS station was selected for this data source, despite Glasgow and Riverton’s (WY) closer proximity, for the following reasons:
Like Otter Creek, the climate of Great Falls is strongly influenced by prevailing downslope winds from the Rocky Mountains; both sites are generally exposed to the large-scale synoptic flow. While temperature inversions are common at Great Falls (and also at Otter Creek, as evidenced by the site’s delta temperature record), they are seldom persistent. It is reasonable to expect that mixing heights at Otter Creek and Great Falls would be comparable at most times.
Although closer than Great Falls, Glasgow is located in a nearly flat area of northeastern Montana. During winter months, its climate is dominated (to an even greater extent than Miles City) by the same arctic air masses that cover the Dakotas. Those periods are often characterized by strong surface-based temperature inversions, which are enhanced by persistent snow cover. This temperature profile would result in lower calculated mixing heights than are likely to exist at Otter Creek.
Otter Creek Coal Mine Page 117 MAQP Application OCC212408
Riverton, Wyoming, is located in the Bighorn basin, which is nearly surrounded by some of Wyoming’s highest mountains. Although usually far-removed from arctic air masses, its geography results in strong, persistent temperature inversions during much of the winter. As with Glasgow, the temperature profile would likely result in lower calculated mixing heights than are likely to exist at Otter Creek.
In summary, the following meteorological datasets were used for this dispersion modeling analysis:
Surface wind speed, wind direction and temperature (primary): On-site data
collected at Otter Creek from February 2011 – January 2014. Surface wind speed, wind direction and temperature (secondary): Surface
data from Billings NWS – substituted for missing on-site data as necessary. Supplemental one-minute wind speed and wind direction: Billings NWS;
used to minimize number of calm periods when substitution for missing on-site wind data was necessary.
Cloud cover (for entire period): Billings NWS. Upper air NWS data: Great Falls International Airport, February 2011 – January
2014. Surface characteristics data: Otter Creek Coal Mine and Billings NWS 1992
Land Use/Land Cover data.
Additional detail is provided in Appendix E, and in the model-generated electronic files included on the DVD attached to the submittal copy of this application.
On-Site Data Collection and Quality Assurance
The on-site met data was collected from a 20 meter tower located within the boundary of the proposed Otter Creek Coal Mine. The site was constructed and operated by Bison Engineering, Inc. The data was fully quality-assured according to the Meteorological Monitoring Guidance for Regulatory Modeling Applications (US EPA, 2000), and presented in quarterly reports generated by Bison. The following data was collected at each level of the tower.
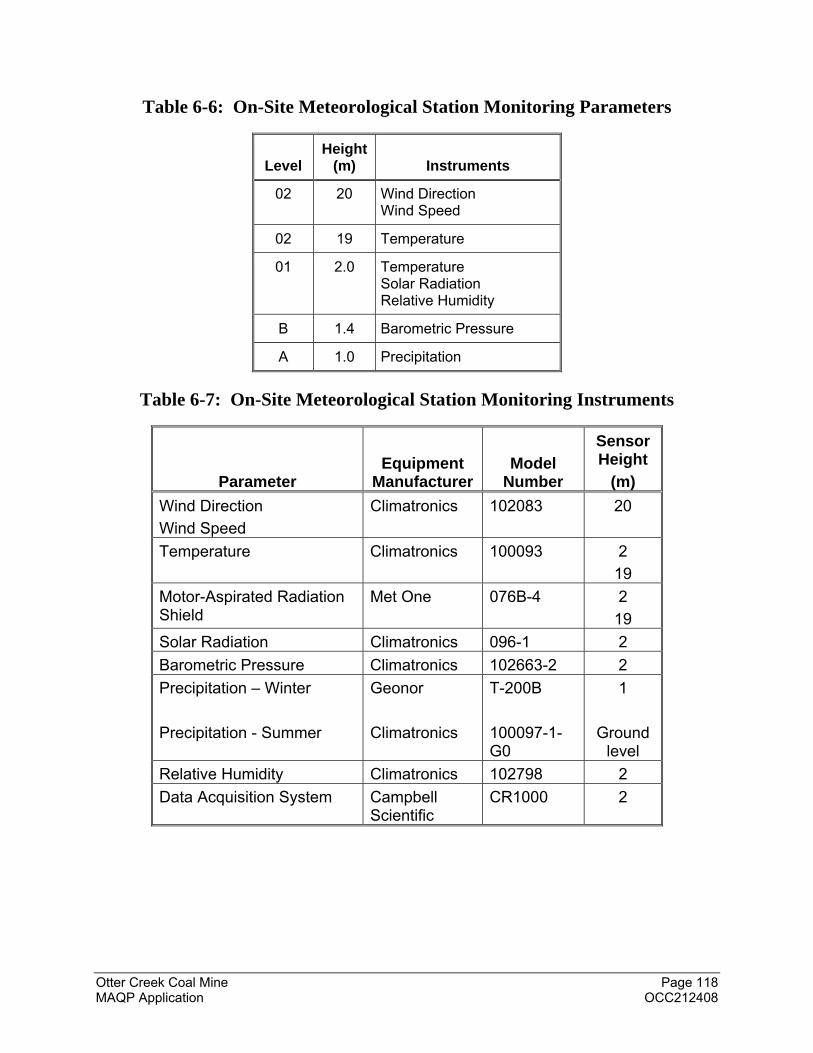
Otter Creek Coal Mine Page 118 MAQP Application OCC212408
Table 6-6: On-Site Meteorological Station Monitoring Parameters
Level Height
(m) Instruments
02 20 Wind Direction Wind Speed
02 19 Temperature
01 2.0 Temperature Solar Radiation Relative Humidity
B 1.4 Barometric Pressure
A 1.0 Precipitation
Table 6-7: On-Site Meteorological Station Monitoring Instruments
Parameter Equipment
Manufacturer Model
Number
Sensor Height
(m)
Wind Direction
Wind Speed
Climatronics 102083 20
Temperature Climatronics 100093 2
19
Motor-Aspirated Radiation Shield
Met One 076B-4 2
19
Solar Radiation Climatronics 096-1 2
Barometric Pressure Climatronics 102663-2 2
Precipitation – Winter
Precipitation - Summer
Geonor
Climatronics
T-200B
100097-1-G0
1
Ground level
Relative Humidity Climatronics 102798 2
Data Acquisition System Campbell Scientific
CR1000 2
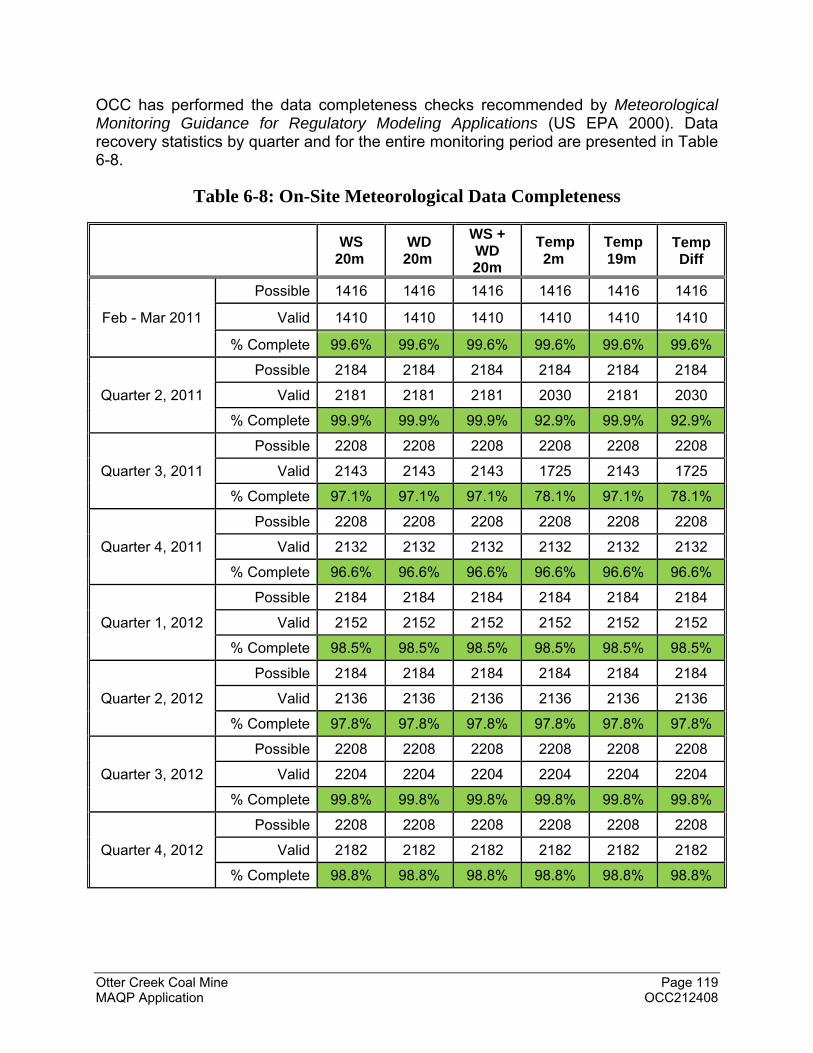
Otter Creek Coal Mine Page 119 MAQP Application OCC212408
OCC has performed the data completeness checks recommended by Meteorological Monitoring Guidance for Regulatory Modeling Applications (US EPA 2000). Data recovery statistics by quarter and for the entire monitoring period are presented in Table 6-8.
Table 6-8: On-Site Meteorological Data Completeness
WS
20m WD
20m
WS + WD 20m
Temp 2m
Temp 19m
Temp Diff
Feb - Mar 2011
Possible 1416 1416 1416 1416 1416 1416
Valid 1410 1410 1410 1410 1410 1410
% Complete 99.6% 99.6% 99.6% 99.6% 99.6% 99.6%
Quarter 2, 2011
Possible 2184 2184 2184 2184 2184 2184
Valid 2181 2181 2181 2030 2181 2030
% Complete 99.9% 99.9% 99.9% 92.9% 99.9% 92.9%
Quarter 3, 2011
Possible 2208 2208 2208 2208 2208 2208
Valid 2143 2143 2143 1725 2143 1725
% Complete 97.1% 97.1% 97.1% 78.1% 97.1% 78.1%
Quarter 4, 2011
Possible 2208 2208 2208 2208 2208 2208
Valid 2132 2132 2132 2132 2132 2132
% Complete 96.6% 96.6% 96.6% 96.6% 96.6% 96.6%
Quarter 1, 2012
Possible 2184 2184 2184 2184 2184 2184
Valid 2152 2152 2152 2152 2152 2152
% Complete 98.5% 98.5% 98.5% 98.5% 98.5% 98.5%
Quarter 2, 2012
Possible 2184 2184 2184 2184 2184 2184
Valid 2136 2136 2136 2136 2136 2136
% Complete 97.8% 97.8% 97.8% 97.8% 97.8% 97.8%
Quarter 3, 2012
Possible 2208 2208 2208 2208 2208 2208
Valid 2204 2204 2204 2204 2204 2204
% Complete 99.8% 99.8% 99.8% 99.8% 99.8% 99.8%
Quarter 4, 2012
Possible 2208 2208 2208 2208 2208 2208
Valid 2182 2182 2182 2182 2182 2182
% Complete 98.8% 98.8% 98.8% 98.8% 98.8% 98.8%
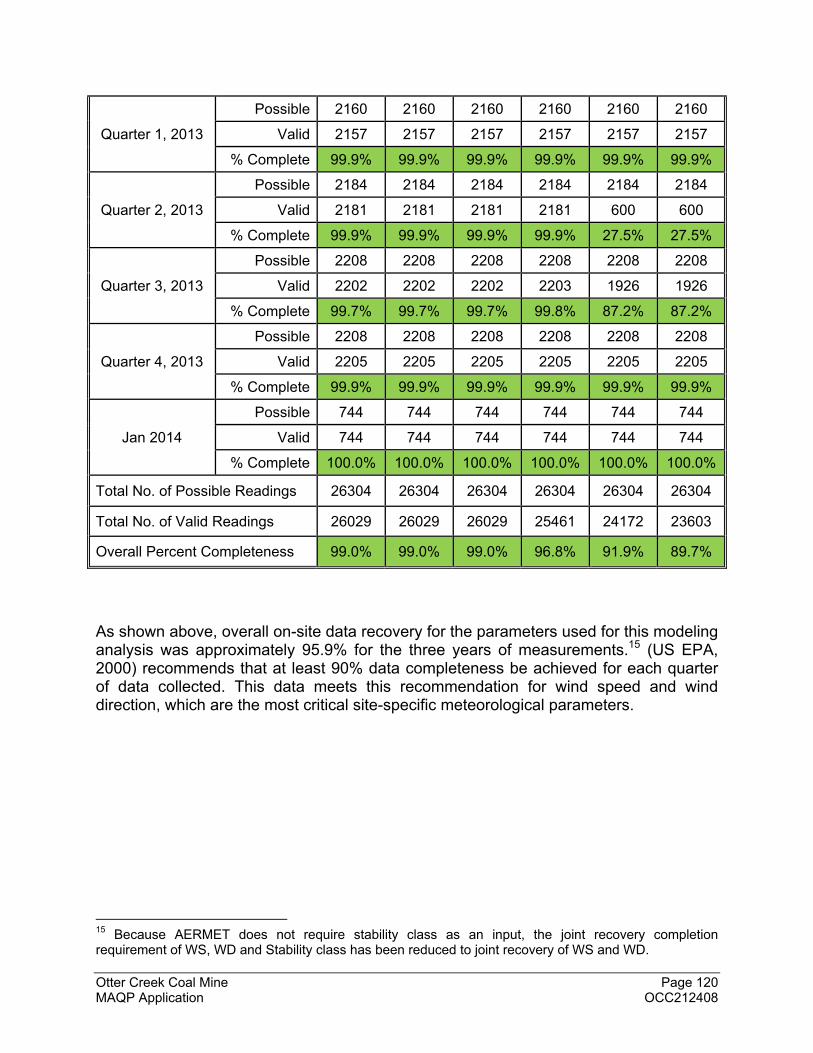
Otter Creek Coal Mine Page 120 MAQP Application OCC212408
Quarter 1, 2013
Possible 2160 2160 2160 2160 2160 2160
Valid 2157 2157 2157 2157 2157 2157
% Complete 99.9% 99.9% 99.9% 99.9% 99.9% 99.9%
Quarter 2, 2013
Possible 2184 2184 2184 2184 2184 2184
Valid 2181 2181 2181 2181 600 600
% Complete 99.9% 99.9% 99.9% 99.9% 27.5% 27.5%
Quarter 3, 2013
Possible 2208 2208 2208 2208 2208 2208
Valid 2202 2202 2202 2203 1926 1926
% Complete 99.7% 99.7% 99.7% 99.8% 87.2% 87.2%
Quarter 4, 2013
Possible 2208 2208 2208 2208 2208 2208
Valid 2205 2205 2205 2205 2205 2205
% Complete 99.9% 99.9% 99.9% 99.9% 99.9% 99.9%
Jan 2014
Possible 744 744 744 744 744 744
Valid 744 744 744 744 744 744
% Complete 100.0% 100.0% 100.0% 100.0% 100.0% 100.0%
Total No. of Possible Readings 26304 26304 26304 26304 26304 26304
Total No. of Valid Readings 26029 26029 26029 25461 24172 23603
Overall Percent Completeness 99.0% 99.0% 99.0% 96.8% 91.9% 89.7%
As shown above, overall on-site data recovery for the parameters used for this modeling analysis was approximately 95.9% for the three years of measurements.15 (US EPA, 2000) recommends that at least 90% data completeness be achieved for each quarter of data collected. This data meets this recommendation for wind speed and wind direction, which are the most critical site-specific meteorological parameters.
15 Because AERMET does not require stability class as an input, the joint recovery completion requirement of WS, WD and Stability class has been reduced to joint recovery of WS and WD.
Otter Creek Coal Mine Page 121 MAQP Application OCC212408
AERSURFACE Options
AERSURFACE was run using the BEEST AERMET for Windows Graphical User Interface. The options were left as default except for the following:
Primary and Secondary Site Surface Characteristics Frequency set to SEASONAL.
Primary and Secondary Site Wind Sectors set to 12.16 Winter Season Snowcover set to “No.”17 Arid set to “Yes.”18 Moisture set to “Average.”19 Airport set to “No” for on-site and “Yes” for NWS data.
6.3.4 Elevation Determination
Base elevations are required for receptors, sources, and structures for models with elevated terrain. Additionally, AERMOD requires that receptors be defined by a parameter known as “hill height” that AERMAP calculates as a function of the terrain elevations surrounding each receptor. To ensure this value can be calculated for each receptor in the modeling analysis, EPA guidance requires terrain elevation data within an area that includes all terrain features with an elevation exceeding a 10% slope from every modeled receptor. The BEEST program’s "domain calculation" function was used to identify this terrain domain which, for the current modeling analyses, was bounded by latitudes of 48.75 and 46.125 degrees and longitudes of 105.375 and 106.875 degrees.
Terrain elevation data were provided to AERMAP using National Elevation Dataset (NED) files downloaded from a United States Geological Survey (USGS) web site.20 NED data are provided in the NAD83 horizontal datum. Datasets were created with a 1/3 arc-second (approximately 10 meters) horizontal resolution and were provided in the form of multiple Geographic Tagged Image File Format (GeoTIFF) files, copies of which are included on the DVD accompanying this application.
16 The patchwork of LULC data surrounding the plant was variable enough that, upon examination, it was deemed better to use maximum wind sector division than to attempt a summarization of multiple custom sectors. 17 Though it is possible for more than one month of continuous snow cover at the plant, the snowfall in the surrounding area tends to cyclically fall and melt throughout the winter, as determined by a visual survey of daily imagery captured at the on-site met station. 18 The climate of the area is defined as Cold Arid Steppe per the Koppen-Geiger climate classification system map. 19 The 30-year climatological record per NCDC for Birney, Montana, indicates mean precipitation of 13.57 inches. 20 See http://www.mrlc.gov/ as geotiff versions of NED data are no longer available on the USGS National Map Viewer.
Otter Creek Coal Mine Page 122 MAQP Application OCC212408
6.3.5 Boundary Determination
The ambient air boundary of the Otter Creek Coal Mine was determined to include the entire 18,219 acres encompassing the permitted mine area, with the exception of two public roads which run within the mine boundary. The majority of the area included in the total acreage will not be actively mined at any given point in time. These areas may continue to be used in their current capacity under leasing agreements with Otter Creek. Otter Creek will maintain, at a minimum, three-strand fencing around the property border, with signage posted at all gates and entrances into the fenced area indicating the private status of the land and that access by unauthorized personnel is not allowed.
State Highway 484 (Otter Creek Road) runs adjacent to the proposed mine and 10 Mile Road runs through a small section of the southwest corner of the property. Each of these roads will be considered ambient air for the purpose of this modeling demonstration. Receptors will be placed along these roads within the mine boundary at 100 m intervals.
The mining area boundaries and road locations were obtained from visual coordination within the BEEST interface, using the georectified mine plan map as a reference.
6.3.6 Receptors To obtain sufficient modeling resolution, the following Cartesian system was used:
For the significant impact analysis: a. Receptors were placed along State Highway 484 (Otter Creek Road) at 100
meter intervals within the mine boundary; b. Receptors were placed along the plant boundary at 100-meter intervals; c. Receptors were placed at 100-meter spacing from the plant boundaries to a
distance of approximately 1 km; d. Receptors were placed at 250-meter spacing from 1 km to 3 km; e. Receptors were placed at 500-meter spacing from 3 km to 10 km; f. Receptors were placed at 1 km spacing from 10 km to 20 km;
The NAAQS analysis used those receptors identified as significant in the Phase 1 modeling analysis.
The receptor grids were generated using the Fenceline Grid Method of the “Special Grid” tab in the “Receptor Options” window in BEEST. By using the Fenceline Grid Spacing option coupled with the Fenceline Grid Distance option, a buffer of receptors is created around the boundary, omitting the unnecessarily dense receptors beyond the appropriate distance identified above. By removing these unnecessary receptors, the appropriate level of analysis is maintained, and model run times are reduced linearly with the reduction in total receptors.
Otter Creek Coal Mine Page 123 MAQP Application OCC212408
6.3.7 NOx to NO2 Conversion For modeling of NO2 impacts, the ozone limiting method will be applied to convert the NOx impacts to NO2. The 2012 annual average of background ozone data from the Birney, MT, monitoring station was used with the OLM method to determine NO2 impacts. This annual ozone average was 30.44 ug/m3.
6.3.8 Dry Particle Deposition To refine the modeled results for PM impacts, OCC utilized the Method 2 dry particle deposition option in AERMOD. In contrast to lighter gaseous pollutants, the higher density of particulates results in settling, also known as deposition. By using a mean particle size, particle mass and particle diameter, the deposition option accounts for the settling of a portion of the particulate emissions. The input parameters used for particle deposition calculations are derived from values found in AP-42 11.9 – Western Surface Coal Mining and are included in Table 6.9 below Table 6.9: Input Parameters for Particle Deposition Calculations
Method 2 Set
Fine Mass Fraction
(<2.5 micron) Representative Mass Mean Particle
Diameter (microns)
PITSRCS 0.05 7.7
ROADS 0.1 7.7
CRSHRS 0.05 7.7 The PITSRCS set includes the openpit volume sources. The ROADS set is all roads emissions occurring on the main haul and access roads. The coal crushers are included in the CRSHRS set.
6.3.9 Location Coordinate Determinations
AERMOD requires that all structures such as large tanks and buildings, emissions sources, and fencelines (used for defining fenceline receptors, and for excluding receptors within the facility boundary) be defined by a pair of north/south and east/west coordinates. While no tanks or buildings were included in the model, the locations of the fencelines and emissions sources were defined through the use of the mine plan map, which was georectified so that it could be imported into the BEEST interface, and be available as an underlay for the placement of emissions sources.
6.3.10 Operating Scenario to be Modeled The progressive nature of surface coal mining is such that mining operations will be moving from the initial mine area on the west side of Tract 2, working eastward throughout the tract until operations reach the eastern limits of the mine plan. These progressions are demonstrated in the year-by-year approach graphically presented in
Otter Creek Coal Mine Page 124 MAQP Application OCC212408
the mine sequence map, Figure 3. While the actual mining progress will be variable throughout the life of the mine, the mine sequence provides a basis for both emission inventory calculations and modeling. The variable emission rates and source locations result in shifting impact locations and concentrations from mining activities. To determine which mine year would be modeled, Bison reviewed the throughputs, emissions and locations for each of the Tract 2 mine years. Two periods were selected for modeling to represent the maximum ambient impacts. Year 7 is anticipated to be the first year that the mine could possibly produce 35 million tons of coal per year, and its activities are located such that the prevailing northwesterly winds may cause high impacts at the mine boundary. Year 17 is the last year in the mine plan that produces over 10 million tons of coal per year and the longest haul distance, and has the closest approach (of any full year of mining) to the eastern mine boundary. While the proposed coal production by year is reflected in the emission inventory and mine plan, OCC would like the flexibility to mine up to 35 million tons per year of coal annually, if economic conditions make this feasible. To accommodate this possibility, the two modeled scenarios were expanded in both size and emissions to reflect a maximum mining throughput of 35 million tons of coal per year. The Year 7 activities were expanded to the east, and the Year 17 activities were expanded to the west and east. This resulted in a 44% expansion of Year 7 base coal production by including 76% of Year 8 volumes. Year 17 coal production only accounts for 47% of the 35 million tons of coal per year analyzed. The remaining coal volumes included all of Year 16 coal production and 76% of year 18 coal production volumes. Results for each of these mining years are presented in Section 6.4.
6.3.11 Modeled Source Parameters Each emission source to be addressed in the emissions inventory is listed in Table 6-10 below, along with the proposed source type, and comments describing how the source was modeled.
The proposed new emission sources are described in Sections 2.0 and 3.0 above. This section provides additional descriptions focused on modeled characteristics. Tables 6-11 and 6-12 present all of the modeled Otter Creek Mine sources and associated modeling parameters.
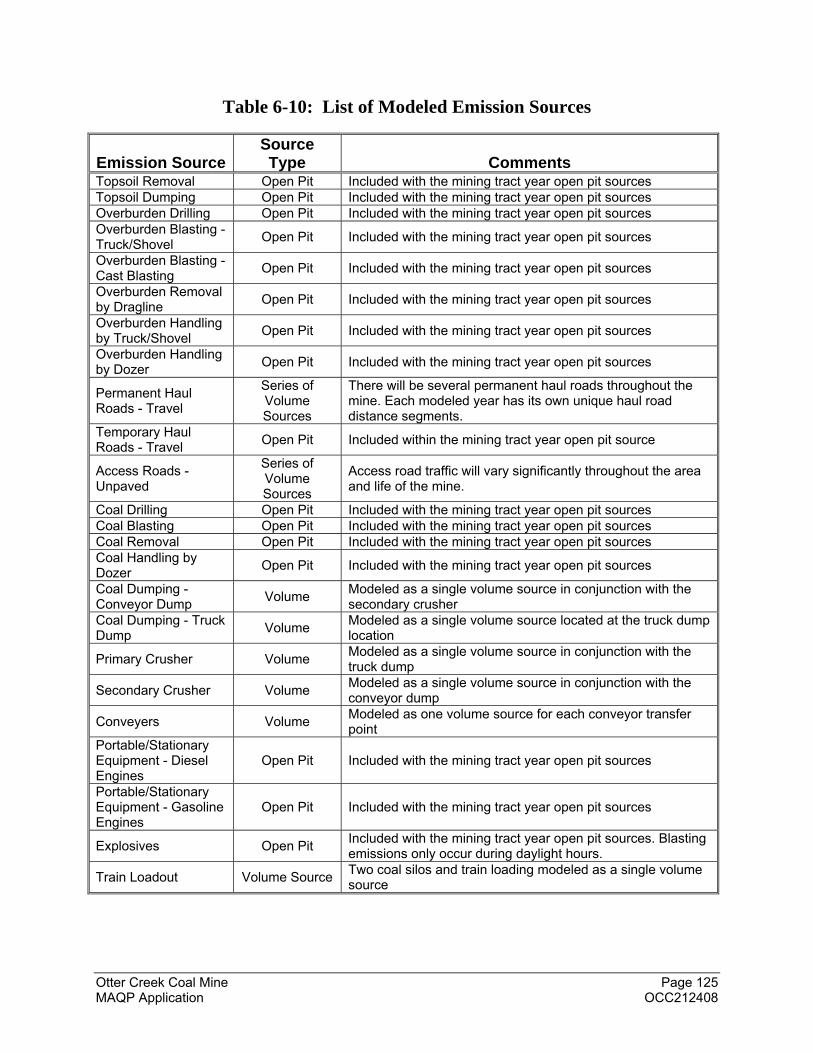
Otter Creek Coal Mine Page 125 MAQP Application OCC212408
Table 6-10: List of Modeled Emission Sources
Emission Source Source Type Comments
Topsoil Removal Open Pit Included with the mining tract year open pit sources Topsoil Dumping Open Pit Included with the mining tract year open pit sources Overburden Drilling Open Pit Included with the mining tract year open pit sources Overburden Blasting - Truck/Shovel Open Pit Included with the mining tract year open pit sources
Overburden Blasting - Cast Blasting Open Pit Included with the mining tract year open pit sources
Overburden Removal by Dragline Open Pit Included with the mining tract year open pit sources
Overburden Handling by Truck/Shovel Open Pit Included with the mining tract year open pit sources
Overburden Handling by Dozer Open Pit Included with the mining tract year open pit sources
Permanent Haul Roads - Travel
Series of Volume Sources
There will be several permanent haul roads throughout the mine. Each modeled year has its own unique haul road distance segments.
Temporary Haul Roads - Travel Open Pit Included within the mining tract year open pit source
Access Roads - Unpaved
Series of Volume Sources
Access road traffic will vary significantly throughout the area and life of the mine.
Coal Drilling Open Pit Included with the mining tract year open pit sources Coal Blasting Open Pit Included with the mining tract year open pit sources Coal Removal Open Pit Included with the mining tract year open pit sources Coal Handling by Dozer Open Pit Included with the mining tract year open pit sources
Coal Dumping - Conveyor Dump Volume
Modeled as a single volume source in conjunction with the secondary crusher
Coal Dumping - Truck Dump Volume
Modeled as a single volume source located at the truck dump location
Primary Crusher Volume Modeled as a single volume source in conjunction with the truck dump
Secondary Crusher Volume Modeled as a single volume source in conjunction with the conveyor dump
Conveyers Volume Modeled as one volume source for each conveyor transfer point
Portable/Stationary Equipment - Diesel Engines
Open Pit Included with the mining tract year open pit sources
Portable/Stationary Equipment - Gasoline Engines
Open Pit Included with the mining tract year open pit sources
Explosives Open Pit Included with the mining tract year open pit sources. Blasting emissions only occur during daylight hours.
Train Loadout Volume Source Two coal silos and train loading modeled as a single volume source
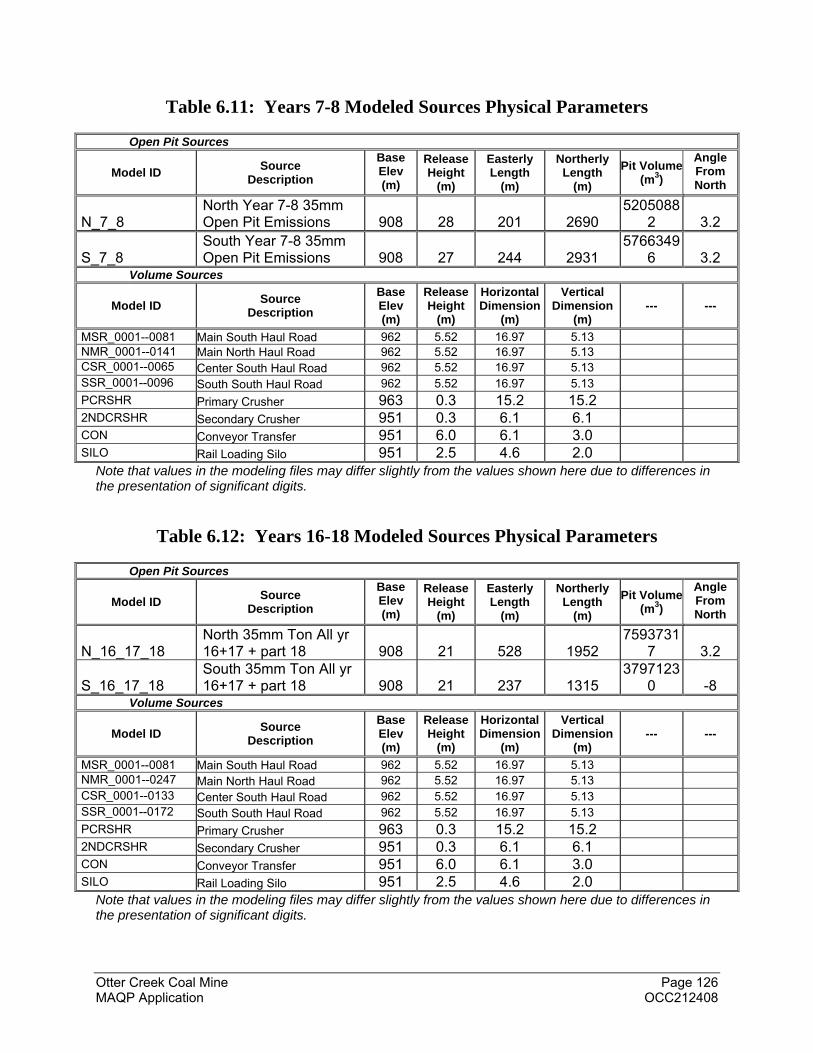
Otter Creek Coal Mine Page 126 MAQP Application OCC212408
Table 6.11: Years 7-8 Modeled Sources Physical Parameters
Open Pit Sources
Model ID Source
Description
Base Elev (m)
Release Height
(m)
Easterly Length
(m)
Northerly Length
(m)
Pit Volume(m3)
Angle From North
N_7_8
North Year 7-8 35mm Open Pit Emissions 908 28 201 2690
52050882 3.2
S_7_8
South Year 7-8 35mm Open Pit Emissions 908 27 244 2931
57663496 3.2
Volume Sources
Model ID Source
Description
Base Elev (m)
Release Height
(m)
Horizontal Dimension
(m)
Vertical Dimension
(m) --- ---
MSR_0001--0081 Main South Haul Road 962 5.52 16.97 5.13 NMR_0001--0141 Main North Haul Road 962 5.52 16.97 5.13 CSR_0001--0065 Center South Haul Road 962 5.52 16.97 5.13 SSR_0001--0096 South South Haul Road 962 5.52 16.97 5.13
PCRSHR Primary Crusher 963 0.3 15.2 15.2
2NDCRSHR Secondary Crusher 951 0.3 6.1 6.1
CON Conveyor Transfer 951 6.0 6.1 3.0
SILO Rail Loading Silo 951 2.5 4.6 2.0
Note that values in the modeling files may differ slightly from the values shown here due to differences in the presentation of significant digits.
Table 6.12: Years 16-18 Modeled Sources Physical Parameters
Open Pit Sources
Model ID Source
Description
Base Elev (m)
Release Height
(m)
Easterly Length
(m)
Northerly Length
(m)
Pit Volume(m3)
Angle From North
N_16_17_18
North 35mm Ton All yr 16+17 + part 18 908 21 528 1952
75937317 3.2
S_16_17_18
South 35mm Ton All yr 16+17 + part 18 908 21 237 1315
37971230 -8
Volume Sources
Model ID Source
Description
Base Elev (m)
Release Height
(m)
Horizontal Dimension
(m)
Vertical Dimension
(m) --- ---
MSR_0001--0081 Main South Haul Road 962 5.52 16.97 5.13 NMR_0001--0247 Main North Haul Road 962 5.52 16.97 5.13 CSR_0001--0133 Center South Haul Road 962 5.52 16.97 5.13 SSR_0001--0172 South South Haul Road 962 5.52 16.97 5.13
PCRSHR Primary Crusher 963 0.3 15.2 15.2
2NDCRSHR Secondary Crusher 951 0.3 6.1 6.1
CON Conveyor Transfer 951 6.0 6.1 3.0
SILO Rail Loading Silo 951 2.5 4.6 2.0
Note that values in the modeling files may differ slightly from the values shown here due to differences in the presentation of significant digits.
Otter Creek Coal Mine Page 127 MAQP Application OCC212408
Emission source parameters were generally obtained from documents submitted by Otter Creek in the mine plan application. These parameters were used in conjunction with model guidance to determine open pit and volume source parameters. Discussion of each modeled source type and the origin of emissions parameters is provided below.
Open Pit As shown in Tables 6-11 and 6-12, the open pit source in the model includes a multitude of sources which occur at varying depths below grade. The open pit source type available in AERMOD accounts for emission settling within the pit, and creates an effective area source based upon the wind direction at any given time. The volume of the pit was calculated based upon the maximum depth of the pit. The release height of the open pit source was selected at one-third of the total depth of the pit to account for emissions which are not generated at the bottom of the pit. Cross-section H of the cross-sections map (located in the mine plan) was used to visually determine an average coal seam bottom depth of 2980 ft. The average coal seam depth is estimated to be 67 feet across all of Tract 2. The average coal seam bottom depth of 2980 ft will be added to the soil, overburden and coal seam depths to determine the surface elevation of the open pit sources in AERMOD. The location, angle, and easterly and northerly lengths were all determined based on visual coordination within the BEEST GUI using the georectified mine plan map included on the DVD attached with this submittal. It should be noted that the length-to-width ratio of the pit source exceeds ten, which results in the generation of an error message in the .lst file. The pit source was not split into separate pieces to meet the maximum length-to-width ratio, because the open pit source parameter guidance in Volume 1 of the ISC3 User’s Guide21i advises against that approach. Because of this, the open pit source may not exactly conform to the annual active areas shown on the mine plan, but care was taken to visually match the open pit source as closely to the mine area as possible.
Haul Roads
Haul roads have been modeled as a series of adjacent volume sources. The initial horizontal dimension of the volume source was set equal to the road width, and the number of sources was defined such that all volume sources were contiguous. Release height from the haul roads was set based on the average height of the haul trucks.
Crushers
Each of the crushers was modeled as volume sources, in conjunction with the respective coal dumps associated with each crusher. The primary crusher was collocated with, and modeled together with, the truck dump. The secondary crusher was
21 Volume I – User Instructions of the User’s Guide for the Industrial Source Complex (ISC3) Dispersion Models states on page 3-38 that, since the pit algorithm generates an effective area for modeling emissions from the pit, and the size, shape and locations of the effective area are a function of wind direction, an open pit cannot be subdivided into a series of smaller sources.
Otter Creek Coal Mine Page 128 MAQP Application OCC212408
collocated with, and modeled together with, the conveyor dump. Both locations were determined from visual inspection of the mine plan map. Initial horizontal dimensions of the crushers were based upon the total size of the truck dump/crusher areas shown on the mine plan map. Initial vertical release heights were based on the height of the crushers. Release heights for each of these sources were set to zero to reflect the worst-case dispersion of the truck and conveyor coal dumping emissions.
Conveyor Transfer
Conveyor transfer emissions were modeled as a single volume source located at the area specified in the mine plan map. The initial vertical dimension was set based on an assumed structure height of the conveyor transfer.
Coal Storage Silo
Coal storage silo emissions were modeled as a single volume source located at the area specified in the mine plan map. Dimensions of the silo were estimated based on engineering judgment. The release height was set to the top of the silos to reflect the release of emissions from the top of the silo.
6.3.12 Significant Impacts
Significant impact modeling results establish the need for NAAQS/MAAQS impacts analyses. If modeled impacts from proposed emissions exceed any respective significant impact level (SIL), additional analyses demonstrating ambient concentration impacts are typically required.
SIA modeling results were compared to the applicable Class II SILs in Tables 6-13 and 6-14.
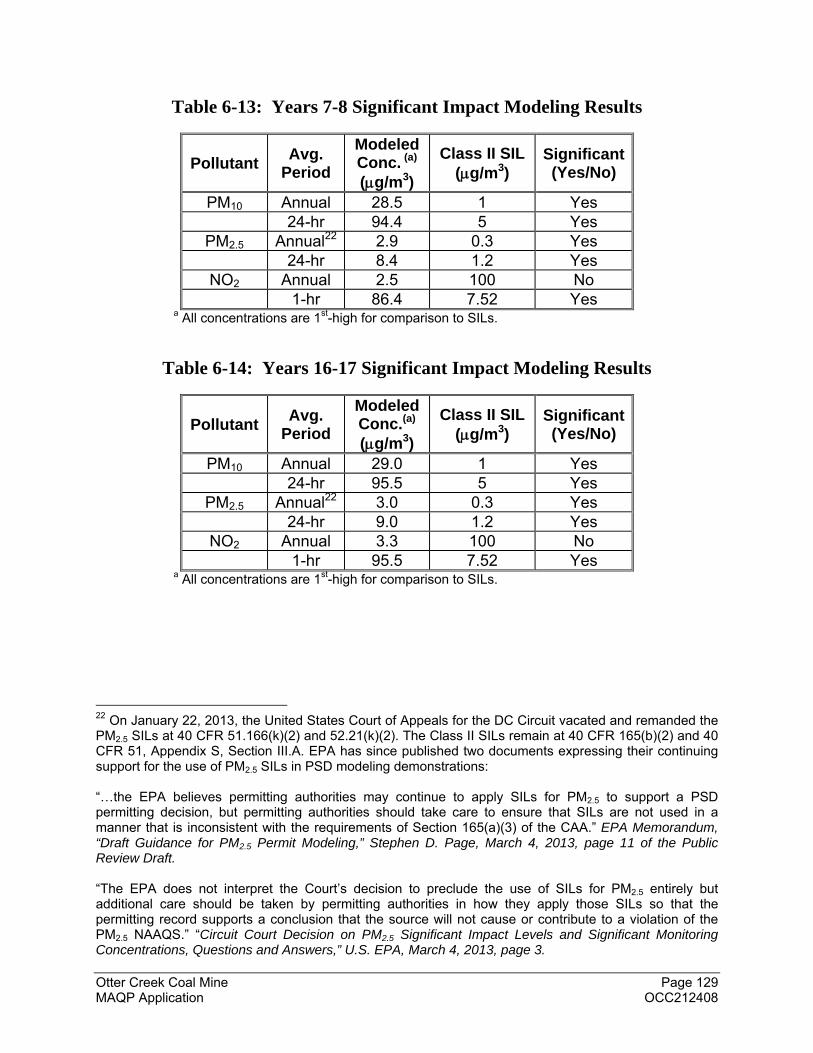
Otter Creek Coal Mine Page 129 MAQP Application OCC212408
Table 6-13: Years 7-8 Significant Impact Modeling Results
Pollutant Avg.
Period
Modeled Conc. (a)
(g/m3)
Class II SIL (g/m3)
Significant (Yes/No)
PM10 Annual 28.5 1 Yes 24-hr 94.4 5 Yes
PM2.5 Annual22 2.9 0.3 Yes 24-hr 8.4 1.2 Yes
NO2 Annual 2.5 100 No 1-hr 86.4 7.52 Yes
a All concentrations are 1st-high for comparison to SILs.
Table 6-14: Years 16-17 Significant Impact Modeling Results
Pollutant Avg.
Period
Modeled Conc.(a)
(g/m3)
Class II SIL (g/m3)
Significant (Yes/No)
PM10 Annual 29.0 1 Yes 24-hr 95.5 5 Yes
PM2.5 Annual22 3.0 0.3 Yes 24-hr 9.0 1.2 Yes
NO2 Annual 3.3 100 No 1-hr 95.5 7.52 Yes
a All concentrations are 1st-high for comparison to SILs.
22 On January 22, 2013, the United States Court of Appeals for the DC Circuit vacated and remanded the PM2.5 SILs at 40 CFR 51.166(k)(2) and 52.21(k)(2). The Class II SILs remain at 40 CFR 165(b)(2) and 40 CFR 51, Appendix S, Section III.A. EPA has since published two documents expressing their continuing support for the use of PM2.5 SILs in PSD modeling demonstrations: “…the EPA believes permitting authorities may continue to apply SILs for PM2.5 to support a PSD permitting decision, but permitting authorities should take care to ensure that SILs are not used in a manner that is inconsistent with the requirements of Section 165(a)(3) of the CAA.” EPA Memorandum, “Draft Guidance for PM2.5 Permit Modeling,” Stephen D. Page, March 4, 2013, page 11 of the Public Review Draft. “The EPA does not interpret the Court’s decision to preclude the use of SILs for PM2.5 entirely but additional care should be taken by permitting authorities in how they apply those SILs so that the permitting record supports a conclusion that the source will not cause or contribute to a violation of the PM2.5 NAAQS.” “Circuit Court Decision on PM2.5 Significant Impact Levels and Significant Monitoring Concentrations, Questions and Answers,” U.S. EPA, March 4, 2013, page 3.
Otter Creek Coal Mine Page 130 MAQP Application OCC212408
As indicated in Tables 6-13 and 6-14, potential emissions of PM10, PM2.5 and hourly NO2 are each expected to impact surrounding ambient concentrations. Based on the results of the SIL modeling, each of these pollutants underwent the Phase 2 analysis to determine impacts in comparison to the NAAQS/MAAQS. Only those receptors deemed significant were modeled in the Phase 2 analysis. NO2 annual impacts are below the SIL values and not included in the Phase 2 analysis.
6.4 NAAQS/MAAQS Modeling Results
Tables 6-16 and 6-17 compare results with the applicable MAAQS and NAAQS for those pollutants/averaging periods with modeled significant impacts as described above. The concentrations shown represent the combined impacts from Otter Creek, plus potential impacts from nearby and regional sources (incorporated by the addition of appropriate background values). As discussed in Section 6.3.6, impacts modeling for each pollutant/averaging-period combination was conducted using specific sets of significantly impacted receptors. MDEQ guidance states that the most current representative background information should be used in the modeling analysis. On-site background data was collected for both PM10 and PM2.5 from 4/27/2011 to 5/31/2013. To determine the background concentrations for the modeling analysis, two 12-month periods were reviewed: June 2011 to May 2012, and June 2012 through May 2013. During these periods, several wildfire events contributing to elevated PM10 and PM2.5 concentrations occurred, primarily during the summer months. Wildfire events documented by the operator, MDEQ, or from aerial images showing wildfire impacts were excluded from determining the background concentrations for this analysis. The ambient PM10 and PM2.5
concentrations not affected by wildfires were then used to determine the annual and 24-hr background concentrations. The 24-hr concentrations were determined for the same averaging timeframe as the NAAQS. For PM10, the 24-hr standard of 150 µg/m3 cannot be exceeded more than once per calendar year, averaged over three years. To determine the 24-hr PM10 background concentration, the average of the 2nd highest readings not influenced by wildfire during each 12-month period (June 2011 to May 2012, and June 2012 through May 2013), was determined. This resulted in a 24-hr PM10 concentration of 25.5 µg/m3. The annual average PM10 concentration during this two year period was determined to be 8.4 µg/m3. The 24-hr background concentration for PM2.5 was determined in a similar manner. The 24-hr PM2.5 NAAQS of 35 µg/m3 is the 98th percentile averaged over three years. To determine the 24-hr PM2.5 background concentration, the average of the 98th percentile readings not influenced by wildfire during each 12-month period (June 2011 to May 2012, and June 2012 through May 2013) was determined. This resulted in a 24-hr PM2.5 concentration of 8 µg/m3. The annual average PM10 concentration during this two-year period was determined to be 3.4 µg/m3. Supporting calculations and documentation for the background concentrations are included in Appendix D.
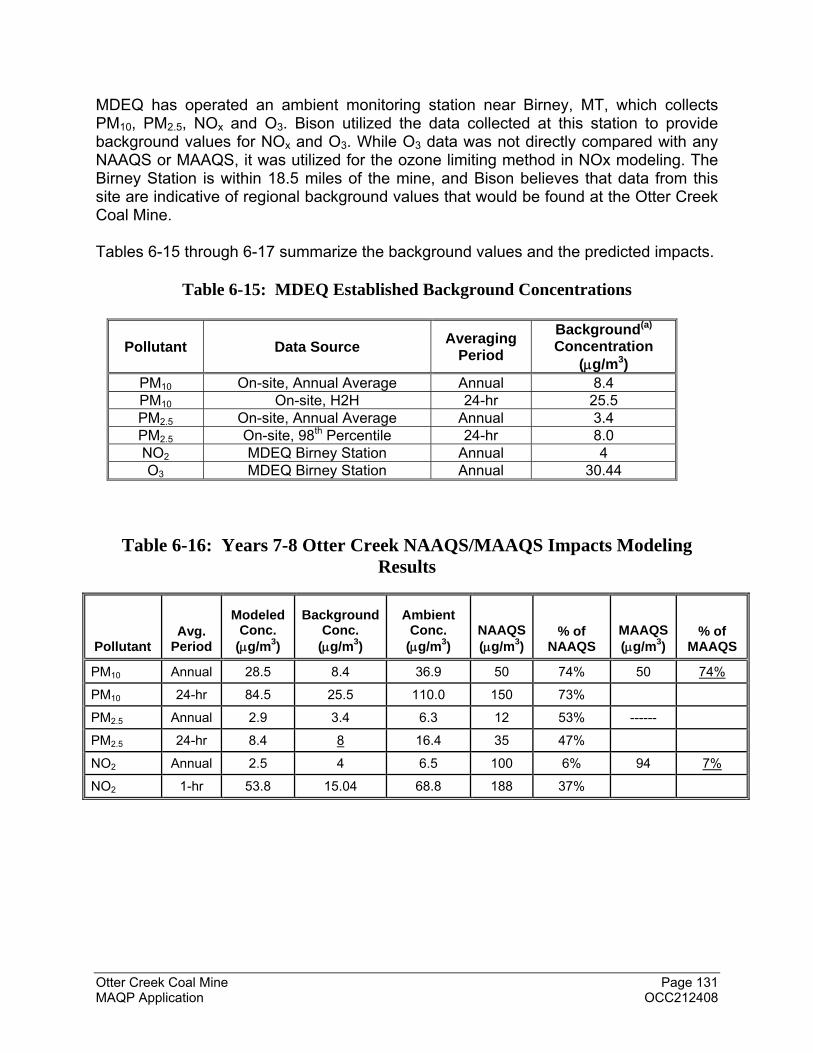
Otter Creek Coal Mine Page 131 MAQP Application OCC212408
MDEQ has operated an ambient monitoring station near Birney, MT, which collects PM10, PM2.5, NOx and O3. Bison utilized the data collected at this station to provide background values for NOx and O3. While O3 data was not directly compared with any NAAQS or MAAQS, it was utilized for the ozone limiting method in NOx modeling. The Birney Station is within 18.5 miles of the mine, and Bison believes that data from this site are indicative of regional background values that would be found at the Otter Creek Coal Mine. Tables 6-15 through 6-17 summarize the background values and the predicted impacts.
Table 6-15: MDEQ Established Background Concentrations
Pollutant Data Source Averaging
Period
Background(a)
Concentration (g/m3)
PM10 On-site, Annual Average Annual 8.4 PM10 On-site, H2H 24-hr 25.5 PM2.5
On-site, Annual Average Annual 3.4 PM2.5 On-site, 98th Percentile 24-hr 8.0 NO2 MDEQ Birney Station Annual 4 O3 MDEQ Birney Station Annual 30.44
Table 6-16: Years 7-8 Otter Creek NAAQS/MAAQS Impacts Modeling Results
Pollutant Avg.
Period
Modeled Conc.
(g/m3)
Background Conc.
(g/m3)
Ambient Conc.
(g/m3) NAAQS (g/m3)
% of NAAQS
MAAQS (g/m3)
% of MAAQS
PM10 Annual 28.5 8.4 36.9 50 74% 50 74%
PM10 24-hr 84.5 25.5 110.0 150 73%
PM2.5 Annual 2.9 3.4 6.3 12 53% ------
PM2.5 24-hr 8.4 8 16.4 35 47%
NO2 Annual 2.5 4 6.5 100 6% 94 7%
NO2 1-hr 53.8 15.04 68.8 188 37%
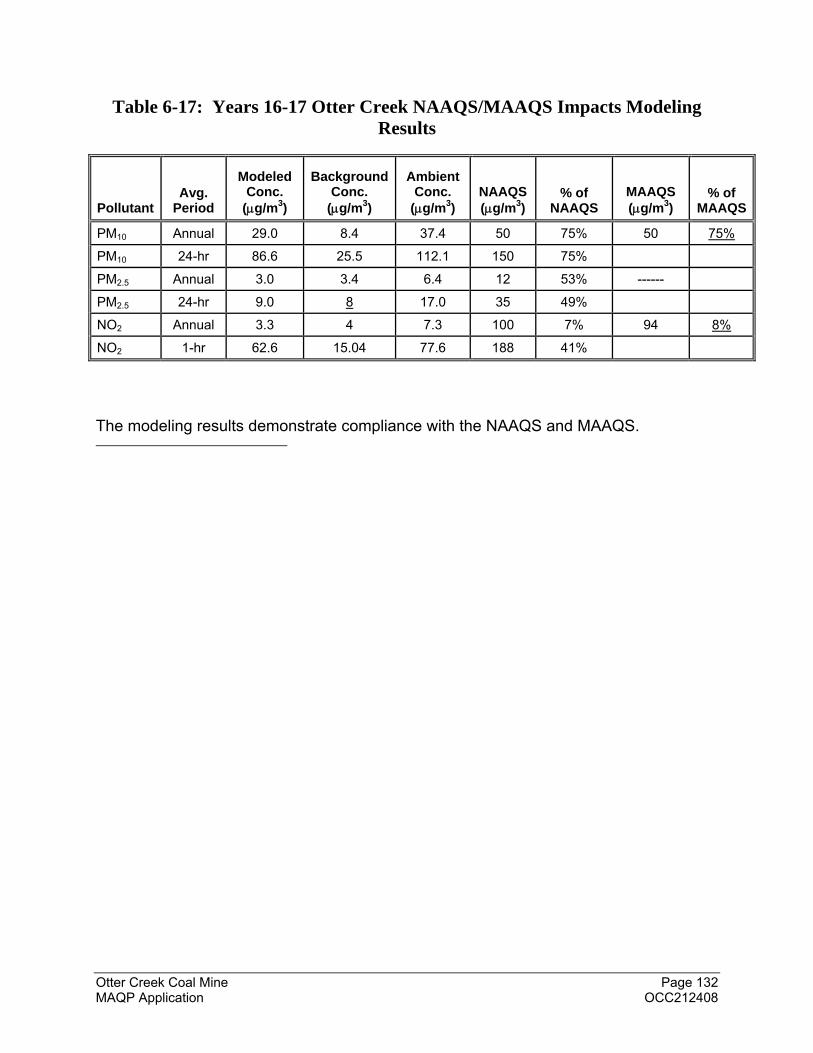
Otter Creek Coal Mine Page 132 MAQP Application OCC212408
Table 6-17: Years 16-17 Otter Creek NAAQS/MAAQS Impacts Modeling Results
Pollutant Avg.
Period
Modeled Conc.
(g/m3)
Background Conc.
(g/m3)
Ambient Conc.
(g/m3) NAAQS (g/m3)
% of NAAQS
MAAQS (g/m3)
% of MAAQS
PM10 Annual 29.0 8.4 37.4 50 75% 50 75%
PM10 24-hr 86.6 25.5 112.1 150 75%
PM2.5 Annual 3.0 3.4 6.4 12 53% ------
PM2.5 24-hr 9.0 8 17.0 35 49%
NO2 Annual 3.3 4 7.3 100 7% 94 8%
NO2 1-hr 62.6 15.04 77.6 188 41%
The modeling results demonstrate compliance with the NAAQS and MAAQS.