Embed Size (px)
Citation preview
The use of MEGA as an educational tool for examining the phylogeny of Antibiotic Resistance Genes
M.P. Ryan1, C.C. Adley1 and J. T. Pembroke2 1Microbiology Laboratory, 2Laboratory of Molecular and Structural Biochemistry, Department of Chemical and
Environmental Sciences, University of Limerick, Limerick, Ireland. Email: [email protected], Tel: +353 61 202491; Fax: +353 61 202568
The free availability of online software to undertake molecular evolutionary analysis coupled with the availability of large amounts of sequence data has made the analysis and evolution of antibiotic resistance determinants amenable in an educational context. Software such as MEGA (Molecular Evolutionary Genetics Analysis) [1] can be utilised to extract useful evolutionary information from nucleotide and protein sequence databases with a focus on antibiotic resistance determinants. The utility of this resource is illustrated here using the antibiotic resistance genes sulII and dhfR18 which are resistance determinants for sulfamethoxazole and trimethoprim found associated with Integrative Conjugative Elements (ICE’s) of the SXT/R391 family of bacterial mobile genetic elements [2, 3]. Using a stepwise tutorial with MEGA the genes are examined using both DNA and protein sequences showing the utility of this software for such analysis in an evolutionary context. These examples are aimed at demonstrating the utility of the software for undergraduate and early postgraduate students
1. Introduction
Phylogenetics is the study of relatedness among various groups of organisms/genes/proteins. Computational phylogenetics is the application of computational algorithms to phylogenetic analyses. The goal of computational phylogenetics is to create a phylogenetic tree representing a hypothesis about the ancestry or relatedness of a set of genes or protein sequences. With its theoretical basis firmly established in molecular evolution and population genetics, comparative sequence analysis has become essential for reconstructing the evolutionary histories of species and multi-gene families, estimating the rates of molecular evolution, and inferring the nature and degree of selective forces shaping the evolution of genes/proteins and genomes. This need is now well recognized and has led to a requirement for the application of computational and statistical methods. Since these methods require the use of computers, the need for easy-to-use computer software programs is well appreciated. These software programs must contain fast and accurate computational algorithms and useful statistical methods to validate results, and they must have an extensive user-interface so they can be used by scientists working with sequence data generated in their laboratories. This thinking stimulated the development of the MEGA (Molecular Evolutionary Genetics Analysis) software in the early 1990's and its continued evolution since [1, 4]. The aim of the MEGA software was to make a broad range of statistical and computational methods available for comparative sequence analysis in a user-friendly environment. Seven publications dealing with all five versions of MEGA have a combined 35,000 citations in the ‘Web of Knowledge’ (http://apps.webofknowledge.com/). These cites show that the software has been used in diverse disciplines of molecular biology and biochemistry, including AIDS/HIV research, bacteriology and general disease, plant biology, conservation biology, systematics, protein evolution, developmental evolution and population genetics. We have developed a number of exercises as part of an undergraduate programme in Molecular Biology and Biochemistry to give students experience in using the Genbank database, Blast, ClustalW and MEGA allowing them to create a phylogenetic tree for a variety of purposes.
2. Methods
2.1. Pre-practical Discussion
Students are first introduced to the concept of molecular phylogeny and its uses in modern biological sciences. A primer to begin discussion can be found in an article by Gregory [5]; in addition a good tutorial to introduce the concept of phylogenetic trees and how to understand them is located at: http://evolution.berkeley.edu/evolibrary/article/phylogenetics_01
2.2. Practical Activity
To guard against the potential for students to passively follow the instructions in this guide without actively considering what they are doing, it may be beneficial for students to work in pairs. Additionally, students can be encouraged to reflect on the purpose of steps in the protocol by informing them that in the post-activity discussion, each group will be called upon to explain to their peers the purpose of a randomly selected set of steps in the step by step guide. Two different sequences are illustrated here, one utilising DNA and the other utilising protein sequences.
Microbial pathogens and strategies for combating them: science, technology and education (A. Méndez-Vilas, Ed.)
© FORMATEX 2013
____________________________________________________________________________________________
736

2.3. Exercises
The antibiotic resistance genes sulII and dhfR18, which are resistance determinants for sulfamethoxazole and trimethoprim respectively, are associated with Integrative Conjugative Elements (ICE’s) of the SXT/R391 family of bacterial mobile genetic elements (MGE) [2, 3]. These exercises can be carried out in one or two 2 hour laboratory slots to allow students the necessary time to familiarize themselves with the software and to ask any potential questions. Exercise 1 lays out the procedure for making a phylogenetic tree with a sulII sequence to determine the phylogenetic relationship between sulII and dhfR18 genes of various ICE’s. Exercise 2 lays out the procedure for creating a phylogenetic tree from the protein sequences of both SulII and DhfR18. The first step in creating a phylogenetic tree is to get the sequence information necessary (either protein or nucleotide). This information can be extracted from the Genbank database (http://www.ncbi.nlm.nih.gov/Genbank/) or from laboratory sequences generated as part of an undergraduate practical. The Blast tool can be used to identify similar sequences [6]. A step by step guide is also presented in Accessory File 1: Step by Step MEGA Procedure.
2.4. Genbank
Genbank (http://www.ncbi.nlm.nih.gov/Genbank/) is the National Institutes of Health (NIH) sequence database. It contains all publicly available DNA sequences submitted by individual laboratories and obtained through sequence exchanges with international nucleotide sequence databases as a member of the International Nucleotide Sequence Database Collaboration. Entrez is the search engine that allows retrieval of molecular biology data and bibliographic citations from the NCBI's integrated databases. Take an accession number (as seen in Table 1 and 2) and paste it into the Entrez search bar, in the drag down menu beside the search bar select Nucleotide/Protein and press search. A result should appear in Genbank format. Click on the fasta button and copy and paste this output (and the others) in a word or text file and save this file as illustrated in Exercises 1 (Table 1) and 2 (Table 2). Table 1 Genbank accession number of the sulII genes
Species/Element Nucleotide Accession No. Protein Accession No. SXT AY055428 AAL59753 ICEVchind5 GQ463142 ACV96358 Shigella sonnei pKKTET7 NC_008439 YP_783830 Avibacterium paragallinarum A14 pYMH5 NC_010912 YP_001966538
Stenotrophomonas maltophilia 432 tnpA2 JX869967 AFU25579 Klebsiella pneumonia pK18An NC_020088 CCN80132 Cronobacter sakazakii 696 CALF01000000 ZP_18227671 Acinetobacter baumannii Tn6167 JN968483 ABO11123
Table 2 Genbank accession number of the dhfR18 genes
Species/Element Nucleotide Accession No. Protein Accession No. SXT AY055428 AAL59751 SXT MO10 AY034138 AAK64581 Pseudomonas putida F1 NC_009512 YP_001270309 Novosphingobium nitrogenifigens DSM 19370 NZ_GL876933 ZP_08207919 Gammaproteobacteria HTCC2148 NZ_DS999247 ZP_05096826 Gammaproteobacteria HTCC2207 NZ_CH672396 ZP_01223436 Escherichia coli pLMO226 NC_010064 YP_001569075 Nitrosospira sp. APG3 CAUA00000000 CCU62280
2.5. Blast
The Basic Local Alignment Search Tool (BLAST) finds regions of local similarity between sequences [6]. The program compares nucleotide or protein sequences to sequence databases and calculates the statistical significance of matches. BLAST can be used to infer functional and evolutionary relationships between sequences as well as help identify members of gene families. A version of this software can be accessed at http://blast.ncbi.nlm.nih.gov/Blast.cgi. Select either nucleotide blast or protein blast depending on the data one wishes to analyse. In nucleotide Blast (BlastN), paste the sequence into the text box under Enter Query Sequence. Under Choose Search Set in the database section select other and under Program Selection select “Somewhat similar sequences (blastn)”, leave the rest of the settings at their default setting and press the BLAST button. In protein Blast (BlastP) paste the sequence into the text box under Enter Query Sequence, leave the rest of the settings at their default setting and press the BLAST button. Outputs show the most closely related gene\protein first and then descend in the order of relatedness. A fuller explanation of the default settings and the implications of changing these settings is available using Blast help at the site.
Microbial pathogens and strategies for combating them: science, technology and education (A. Méndez-Vilas, Ed.)
© FORMATEX 2013
____________________________________________________________________________________________
737
2.6. ClustalW
ClustalW is a general purpose multiple sequence alignment program for DNA or proteins [7], which produces biologically meaningful multiple sequence alignments of divergent sequences. It calculates the best match for the selected sequences, and aligns them so that identities, similarities and differences can be seen. A version of this software can be accessed at http://align.genome.jp/. Copy all fasta sequence data from Exercises 1 and 2 into the text window. Select SLOW/ACCURATE and DNA/Protein depending on the type of data you are analysing. Click Execute Multiple Alignment. An alignment will be presented. Find the link to the clustalw.aln, right click on the hyperlink and click ‘Save Target As’ Exercise 1a/b.aln and Exercise 2a/b.aln. Students are encouraged to visually inspect their alignments to appreciate that some regions are more conserved among sequences (both the nucleotide and the protein) while others appear more chaotic and variable. The reason for the large differences between the protein sequences is that proteins contain regions that are especially integral to their functions, and these domains are under strong stabilizing selection. Length mutations in these regions are generally rare and if recent, small in size if they do occur. In contrast, segments of the protein sequence outside such functional domains may accumulate mutations in their encoding DNA that alter their lengths. Accordingly, conserved regions in sequences sampled from divergent species can be aligned with one another readily, but intervening regions may vary significantly in length. Gaps need to be inserted into the length-variable regions to account for length mutations that have accumulated over evolutionary history.
2.7. MEGA
2.7.1. Downloading and Installing MEGA
MEGA 5.1 is a powerful but easy to use tool for undertaking evolutionary analysis and the creation of phylogenetic trees. The program was written and developed by Koichiro Tamura, Masatoshi Nei, Sudhir Kumar, Daniel Peterson, Nicholas Peterson and Glen Stecher at the Centre of Evolutionary Functional Genomics, Biodesign Institute, Arizona State University [4]. To download the software access the website (www.megasoftware.net) and click on the icon for the operating system you are working under (Windows, Mac OS X, Linux). You will be asked to fill out a from (First Name, Last Name and E-mail address) and then press the “Submit Request” Button. An e-mail will automatically be sent to your E-mail account. Simply click on the link provided in the email and the download will begin. The following article will lay out the use of MEGA on the Windows operating system. MEGA can be used on the following Microsoft Windows® operating systems: Windows 95/98, NT, 2000, XP, Vista, Windows 7 and Windows 8. A computer with at least 64 MB of RAM, 20 MB of available hard disk space, and an entry- level Pentium® processor or equivalent is required to run the program. MEGA will run well on computers with an entry-level Pentium® CPU, however, for quick computation of large datasets, a faster processor and larger amount of physical memory (RAM) is necessary. Access icons for the software will save on the desktop or in the list of programs under the Start Button.
2.7.2. Using MEGA
To start MEGA under Microsoft Windows, double click on the MEGA icon on the desktop or select it in the list of programs under the Start Button. When the program starts the program displays a single main window (the display window) with a light blue background on the screen. There are three menus across the top: File, Analysis, Help.
2.7.3. Opening data in MEGA
To open the .aln file data (generated by ClustalW) in MEGA click File and select the “Convert to MEGA” format option and in the window that appears, select the file name (e.g. Exercise 1a/b) and click okay. This converts the .aln file into the .meg format. Save this file (Exercise 1 and 2). This file can then be opened by clicking on File >Open A File/Session. Select one of the .aln files and press okay. A popup window (M5: Input Data) will appear asking you to select the type of data that you have (DNA\Protein). For the DNA\Nucleotide data it asks if the data codes for protein. Select Yes or No (for these exercises select Yes). Select one of the .aln files and press okay. Save this new file as Exercise 1.meg or Exercise 2.meg.
2.7.4. Creation of a Phylogenetic Tree
To create a phylogenetic tree using this data, click the Phylogeny Button on the main window (or press the Analysis Tab and then select the Phylogeny Tab). Five different options are shown: Construct/Test Maximum likelihood Tree, Construct/Test Neighbour joining Tree, Construct/Test Minimum Evolution Tree, Construct/Test UPGMA and Construct/Test Maximum Parsimony Tree. A full explanation of all of these terms can be found at http://www.icp.ucl.ac.be/~opperd/private/phylogeny.html. Select the Construct/Test Neighbour joining Tree button and a window called “M5: Analysis Performance” will appear. In the yellow box beside “Test of Phylogeny” make sure Bootstrap Method is seen, in the yellow box beside “No. of Bootstrap Replications” place a value of 1000.
Microbial pathogens and strategies for combating them: science, technology and education (A. Méndez-Vilas, Ed.)
© FORMATEX 2013
____________________________________________________________________________________________
738

2.7.5. Nucleotide
Following this click on the green box beside Model, a dropdown menu will appear select Nucleotide on this list. Eight ways of calculating the phylogentic tree are presented. These are different mathematical ways of calculating trees. Select “Maximum Composite Likelihood”. Leave the rest of the variables as they are, following this click on the compute button to create the phylogentic tree. A phylogenetic tree is then displayed in a separate window called “M5: TreeExplorer”. The Phylogenetic trees generated can then be analysed.
2.7.6. Protein
Following this click box beside Model/Method, a pull down menu will appear with six ways of calculating phylogentic trees for protein sequences presented in the list. Select Poisson correction. Leave the rest of the variables as they are, following this step click on the compute button. A phylogenetic tree is then displayed in a separate window called “M5: TreeExplorer”. The Phylogenetic tree that has been generated can then be analysed. The process of creating a phylogenetic tree with MEGA can be seen in summary in Figure 1.
2.7.7. Getting more information and exploring the potential of MEGA
Students should explore the software and change different parameters of the tree such as changing the bootstrap values to higher or lower numbers to see what effect this might have on the tree. The students may also change tree types in order to compare with the “Neighbour Joining Tree” using the same parameters as laid out above. A comprehensive manual on MEGA can be obtained from the MEGA website http://www.megasoftware.net/manual.pdf and detailed tutorials are also available at http://www.megasoftware.net/tutorial.php, giving the reader access the full capabilities of the MEGA software.
3. Results and Discussion
Examples of phylogenetic trees created using MEGA can be seen in Figure 2 and 3. These phylogenetic trees illustrate a wealth of information that is discussed below. Neighbour-joining is a distance based clustering method that does not require all lineages to have diverged in equal amounts. The reason for the use of Neighbour joining to calculate the topology of the tree is that it is the simplest mechanism for the creation of phylogentic trees and gives trees that are the easiest to understand. Bootstrapping analysis is carried out as it gives a way to judge the strength of support for the way trees are branched. A number is presented by each node of each branch. The higher the number the higher the probability is that the relationship is correct. Trees with bootstrap values over 50% or greater are the trees we can be the most confident of. The number of bootstrapping cycles may depend on the computing time or the desired precision. Anything from 100 to 2000 boostrap replicates are typical, and the number of cycle’s increases the calculation time, a 1000 replicates is a good benchmark. The more replicates the greater the accuracy of the tree. The scale bar in Exercise 1 represents 0.05 substitutions per nucleotide position. This means that for every 20 nucleotides there is a nucleotide substitution. The scale bar in Exercise 2 represents 0.1 substitutions per amino acid position. This means that for every 10 amino acid there is an amino acid substitution. In spite of its appearance the Neighbor-Joining tree (with or without bootstraping) is unrooted. An unrooted tree illustrates relatedness without making assumptions about common ancestry. A rooted tree is a directed tree with a unique node corresponding to the most recent common ancestor. The most common method for rooting trees is the use of an uncontroversial out-group - close enough to allow inference from sequence or trait data, but far enough to be a clear outgroup. This outgroup will allow the rooting of the tree. To achieve this; in the tree window click the rooting icon that is located at the top left of the tree window. Click on the branch that you wish to designate as the root.
3.1. Analysis of Phylogenetic Trees from Exercise 1
The sulII gene sequence is approximately 810bp long and the protein is 271 amino acid residues. The protein is a type 2 dihydropteroate synthase that is resistant to the inhibitory effects of sulphonamides. The phylogenetic trees for both DNA and protein can be seen in Fig. 2. Cronobacter sakazakii 696 was used as an out-group for both the DNA (Fig 2 A) and protein (Fig 2 B) trees. As can be seen using the nucleotide sequence all sequences grouped together, whereas with the protein sequence two groups were shown. The first group were found on MGE’s such as ICE’s and transposons, the other groups were all located on plasmids. This indicates a possibility that the dihydropteroate synthase proteins of plasmids and MGE’s have diverged from each other. A full overview of the resistance mechanism to sulphonamides can be seen in Sköld [8].
Microbial pathogens and strategies for combating them: science, technology and education (A. Méndez-Vilas, Ed.)
© FORMATEX 2013
____________________________________________________________________________________________
739

Fig. 1 Summary of the creation of the phylogentic tree shown in Fig 3 B
Microbial pathogens and strategies for combating them: science, technology and education (A. Méndez-Vilas, Ed.)
© FORMATEX 2013
____________________________________________________________________________________________
740

Fig. 2 Phylogenetic tree of the sulII genes (A) and SulII proteins (B). Cluster analysis was based upon the neighbour joining method. Numbers at branch-points are percentages of 1000 bootstrap resamplings that support the topology of the tree. The tree was rooted using.
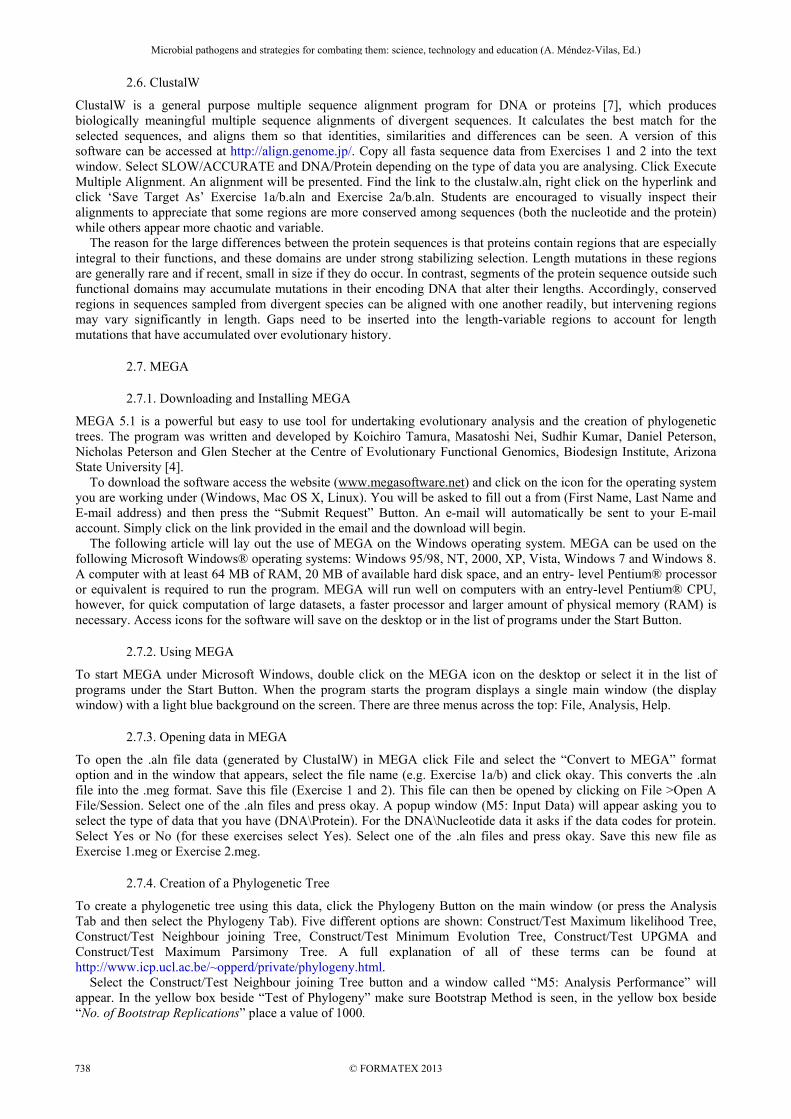
3.2. Analysis of Phylogenetic Trees from Exercise 2
The dhfR18 gene sequence is approximately 555bp long and the protein is 184 amino acid residues. The protein is a type 18 dihydrofolate reductase that is resistant to the inhibitory effects of trimethoprim. The phylogenetic trees for both DNA and protein can be seen in Fig. 3. These trees are examples of unrooted trees and indicate that the dhfR18 gene and DhfR18 proteins of SXT and SXTMO10 are highly similar (as was expected). However interestingly homologs from HTCC2148 and HTCC2207, Gammaproteobacteria isolated and sequenced from the same ocean environment, did not group together in the DNA tree but did group together in the protein tree. This indicates that there may be a large variance in the DNA sequence but not in the protein sequence. A similar situation is observed by the nucleotide sequence of pLMO226 grouping amongst all the other nucleotide sequences in the Fig 3A but the protein of pLMO226 grouping separate from the protein sequences in Fig 3B. This may indicate that the protein sequences of DhfR18 could potentially be very diverse. A full overview of the resistance mechanism to trimethoprim can be seen in Sköld [8]. An example of an output caption generated by MEGA can be seen in Figure 4. This output caption is for the phylogenetic tree shown in Fig 3B. These captions summarise the methods (Neighbour Joining), mathematical formulae (the Poisson correction), number of sequences (eight) and the number of positions (how many nucleotides/ amino acid residues- 151 amino acid residues in this case) used to create the phylogenetic tree. They are created by simply hitting the “Caption” in the “M5: TreeExplorer” window for both nucleotide and protein sequences.
Microbial pathogens and strategies for combating them: science, technology and education (A. Méndez-Vilas, Ed.)
© FORMATEX 2013
____________________________________________________________________________________________
741
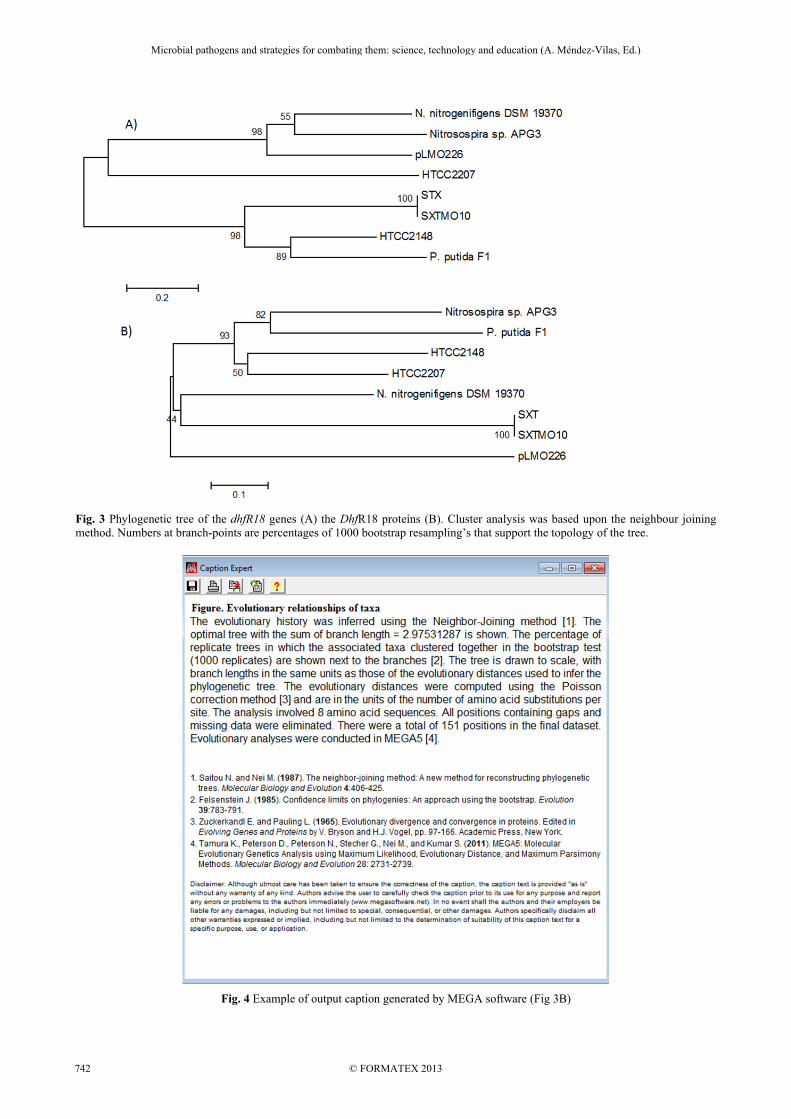
Fig. 3 Phylogenetic tree of the dhfR18 genes (A) the DhfR18 proteins (B). Cluster analysis was based upon the neighbour joining method. Numbers at branch-points are percentages of 1000 bootstrap resampling’s that support the topology of the tree.
Fig. 4 Example of output caption generated by MEGA software (Fig 3B)
Microbial pathogens and strategies for combating them: science, technology and education (A. Méndez-Vilas, Ed.)
© FORMATEX 2013
____________________________________________________________________________________________
742

3.3. Post-practical Discussion/Activities
Upon completion of the exercises, students understanding of the significance of the activity may vary widely. Additionally, the students may have an understanding of the steps for the creation of a phylogenetic tree but might have little understanding of the phylogenetic analysis or the possible uses of this analysis. With this in mind, we believe it to be necessary to engage with the students to explore the concepts illustrated by the use of the software. The following are questions that could be potentially used as discussion points in an after activity talk or could with modification be assigned to students as projects. If given as projects the students would have to use the understanding gained of computational phylogenetics in this study to help them. The students would be expected to read literature pertaining to the question set out and using knowledge gained from their reading to select a gene/protein target to carry out a phylogenetic study. Two to three two hour supervised laboratory slots should be set aside to allow students to ask questions and give them time to carry out the work.
4. Project Questions
1. One has discovered a new dhfR gene in a multi-drug resistant pathogen, how could one tell if this was related to previous homologs and what is its closest relative amongst sequenced dhfR genes?
2. If one were trying to trace the emergence of ampicillin resistance amongst clinical isolates of Vibrio cholerae. How would one plan the exercise, gather the information and present the data in an evolutionary manner?
3. Many ICE–like mobile genetic elements contain antibiotic resistance determinants encoding similar resistances but using different systems. Using the SXT/R391 family of ICE’s and the Tn4371-family as examples how would one plan a study to address this question?
4. A new antimicrobial peptide has been discovered that has activity against a wide range of bacteria. It is thought to be related to Nisin from Lactococcus lactis. How can one check this and what kinds of evidence would one use?
References [1] Tamura K, Peterson D, Peterson N, Stecher G, Nei M, Kumar S. MEGA5: Molecular Evolutionary Genetics Analysis using
Maximum Likelihood, Evolutionary Distance, and Maximum Parsimony Methods. Molecular Biology and Evolution 2011, 28: 2731-2739.
[2] Beaber JW, Hochhut B, Waldor MK. Genomic and functional analyses of SXT, an integrating antibiotic resistance gene transfer element derived from Vibrio cholerae. Journal of Bacteriology, 2002, 184 (15): 4259-4269
[3] Boltner D, MacMahon C, Pembroke JT, Strike P, Osborn AM. R391: a conjugative integrating mosaic comprised of phage, plasmid, and transposon elements. Journal of Bacteriology, 2002, 184(18): 5158-5169.
[4] Kumar S, Dudley J, Nei M, Tamura K. MEGA: A biologist-centric software for evolutionary analysis of DNA and protein sequences. Briefings in Bioinformatics, 2008, 9: 299-306.
[5] Gregory TR. Understanding evolutionary trees, Evolution: Education and Outreach, 2009, 1: 121-137. [6] Altschul S, Gish W, Miller W, Myers E, Lipman D. Basic local alignment search tool. Journal of Molecular Biology, 1990, 215:
403-410. [7] Thompson JD, Higgins DG, Gibson TJ. ClustalW-improving the sensitivity of progressive multiple sequence alignment through
sequence weighting, position-specific gap penalties and weight matrix choice. Nucleic Acids Research, 1994, 22: 4673-4680. [8] Sköld O. Resistance to trimethoprim and sulfonamides. Veterinary Research, 2001, 32: 261-273.
Microbial pathogens and strategies for combating them: science, technology and education (A. Méndez-Vilas, Ed.)
© FORMATEX 2013
____________________________________________________________________________________________
743