Embed Size (px)
Citation preview

1
The use of geomatic techniques to improve the management of metro
infrastructure
Mª Amparo Núñez-Andrés 1) Felipe Buill 1) Saturio Delgado-Medina 2) Carlos Plancho-Milian 3) 1) Department of Civil and Environmental Engineering. Division of Geotechnical Engineering and Geoscience, Universitat Politècnica de Catalunya 2) Unitat de projectes d’infraestructura i via, Ferrocarril Metropolita de Barcelona 3) Infraestructuras, COMSA SAU
The management of large infrastructures requires comprehensive knowledge of their
general characteristics and the elements that constitute them. It is essential to know
which elements are involved and where they are located. At the same time, it is vital to
understand the overall geometry. The accuracy and precision required for both types of
information is different: much greater accuracy is required in the understanding of the
geometry. However, it is difficult to obtain this information about underground
infrastructures due to their lighting characteristics, hazards, lack of GNSS (Global
Navigation Satellite System) signals, and time available. In this case, to achieve the
required quality in both tasks, the mobile mapping systems that are widely used in large
surveys and urban inventories have to be adapted to obtain data in underground
conditions. To achieve this, considerable geodesic support is necessary. The GNSS
positioning system should be replaced by IMU sensors, and infrared sensor cameras are
used, among other pieces of equipment. To establish the trajectory, additional
information extracted from the targets detected in the laser scanning point clouds must
be used. Therefore, a laser scanning and kinematic photogrammetry survey was carried
out to obtain the centimetric precision and complete information that is still used today.
This paper presents an adaptation of these systems for use in the Ferrocarril Metropolità
de Barcelona.
Keywords: mobile mapping, photogrammetry, underground surveying, infrastructure,
management transport infrastructure, laser scanning.
Introduction
Large infrastructures are present throughout Spain. When the need arises, construction
projects are undertaken to build large infrastructure, but they do not always take into
consideration the planning and subsequent management of maintenance.

2
In some cases, it is easy to carry out this management. However, in other cases, such
as the underground network, it may be much more difficult, since this is a complex system in
which everything must function so that passengers, and consequently city life, are not
affected. For effective management, it is vital to know all the elements that are part of the
Metropolitan Railway’s different systems. These systems are increasingly complex, with
elements such as the grid, roads and signage, among others. In other words, we need an
inventory of these elements, which must also be georeferenced.
The location and characteristics of these elements have traditionally been obtained
independently and discreetly. For each type of system, technical experts have to move to the
area and record the features, while its location is given in a survey. Consequently, a great
number of people have to go into the tunnels, and there are many disadvantages in terms of
time and safety. Moreover, the fact that this is not a massive data capture means that the
experts must return to the tunnel to measure new points.
Existing software can be used to manage road infrastructure inventories (McCarthy et
al., 2007), but not railway or underground infrastructure inventories. With the development of
smart cities, examples such as Singapore have emerged, where transport network
management is contained in an ISI (Infrastructure for Spatial Information), according to OGC
(Open Geospatial Consortium) standards.
We face two difficulties: capturing all the spatial information that is required to carry
out the inventory; and managing this information. The working conditions for the capture of
spatial information should be considered. It is very difficult to obtain data using traditional
geomatics techniques in underground tunnels, not only because of the nature of the network
and its confined and limited spaces, but also because of the continuous activity that takes
place in the tunnels.

3
Traditional topographic methods used to detect geometric changes in the design of the
railway are very common, but they only allow us to obtain data on a limited number of
elements. Consequently, it is vital to find geomatics solutions to obtain data on a large
number of objects, with enough quality to be georeferenced in a short time. Currently, the
techniques employed in the mass capture of spatial information are kinematic and static
photogrammetry and laser scanning, using GNSS (Global Navigation Satellite System)
positioning systems. Examples are found in Kingston et al. (2007) and Talaya et al. (2007).
Working inside galleries makes positioning difficult, so the support of other sensors and
indirect georeferencing is essential.
This is another of the challenges to be solved: while georeferencing of continuous
capture is precisely resolved in surface work through differential GNSS systems, in
underground work or in closed environments methods must be developed that allow
georeferencing of the trajectory with sufficient precision, since the drift that inertial
measurement unit (IMU) suffer makes it impossible to use the individual form for this task.
In the following sections, we analyse how this task was carried out to obtain a network
inventory of the Ferrocarril Metropolità de Barcelona (FMB), managed by Transports
Metropolitans de Barcelona (TMB) using a Mobile Mapping System (MMS) adapted to the
underground conditions.
This solution has three main advantages:
• Field work can be performed quickly and elements can subsequently be identified in
the office by specialists in each field.
• Due to the availability of tools, data can be continuously extracted and the results
validated.

4
• Safety is increased, since the flow of people circulating through the tunnels is reduced.
3D acquisition techniques
Usually, geospatial information for civil works is obtained by traditional topographic
methods, from bases that belong to a geodetic network. Detailed information is captured by
radiation, with laser scanning, aerial or terrestrial methods, and GNSS receivers for satellite
data (Velasco et al., 2014) or air and terrestrial photogrammetric methods.
When the work is carried out in tunnels, fewer suitable methods are available, and it is
difficult to obtain redundant information. In topography and photogrammetry, the problem is
solved using specific instruments and methods (Wang et al., 2009). In the case of kinematic,
photogrammetric or laser scanners, systems must be used to check the distances and turns of
the sensors used, for example odometers and inertial systems (INSs) (Gräfe, 2007). New
sensors have now been incorporated to complement these traditional methods and ensure
faster, complete, dynamic geospatial data capture. These are known as mobile mapping
systems (MMSs).
The traditional system is not valid in an underground environment, since positioning
and subsequent georeferencing of the trajectory through differential GNSS systems cannot be
used, as no signal is received inside the tunnel. In these cases, the IMU must be replaced by a
more accurate device with minimum drift, which makes the system more expensive. In
addition, external signals are required that allow us to recalibrate the system once the
deviation of the path has reached the allowed tolerance.
Photogrammetry
Photogrammetry has been widely used to obtain mapping information for nearly 100 years.
The most common method is the use of photographs taken from aerial platforms with

5
appropriate geometry for the subsequent work of staff and adequate lighting conditions
(Slama et al., 1980). The terrestrial method is used to obtain the geometry of unmapped
surfaces. In this case, cameras are placed in fixed positions over the ground. A special method
involves the use of a mobile platform that moves along the Earth's surface obtaining
photographs with an angle of inclination relative to the vertical that may be considerable. This
is known as the kinematic method (Scaioni et al., 2014) (Dai and Peng, 2013).
Photogrammetry or videogrammetry has been successfully used for over 20 years to
capture or update information on highways or railways and for infrastructure inventories. One
example is the Geovista application, which uses multiple cameras from platforms such as
GeoVan (Talaya et al., 2007).
A study of different techniques to capture spatial data from cameras can be found at
Zhu and Brilakis (2009), where the pros and cons of each technique are discussed. The main
purpose of this study is to select the proper technique based on the application requirements
of the data infrastructure. Cameras on mobile platforms are used not only to capture 3D
information, but also to detect problems in the pavement (cracks and potholes), thus reducing
the consumption of time and resources (Koch and Brilakis, 2011).
The type of spectral sensitivity used by the sensors in these cameras changes
depending on the objective of the work. The panchromatic sensor or separate RGB is the most
commonly used system, and in some cameras the near infrared channel (NIR) is also used. In
interior work, short-range lighting systems that allow good light for capturing images can be
used. In this case, sensitive cameras in the spectrum of infrared can be employed with
illumination of the same type. However, the use of long wavelength, NIR, is inversely related
to the resolution and the separator of the objectives: at longer wavelengths, the spatial
resolution power is lower (Slama et al., 1980).

6
One of the challenges that we face in taking photographs in tunnels is a lack of light.
Therefore, in these cases, artificial lighting (preferably LEDs) was required in addition to
infrared sensors. The disadvantage is that these cameras have a much lower resolution of
below 1.5 Mpx than conventional sensors.
Laser scanning
Terrestrial laser scanning (TLS) is widely used for numerous applications, among them
infrastructure management and monitoring. In tunnels, it can be very useful to obtain
elements to make management easier (Yoon et al., 2009), in geometry extraction (Gikas and
Stratakos, 2012; Seo et al., 2008; Han et al., 2013), and in deformation analysis of vaults and
walls (Wang et al., 2009), among other tasks.
This technique is suitable for many applications, since it allows us to capture 3D
information without direct contact with the object. Centimetre accuracy is obtained in a very
short time, and in unfavourable conditions.
In most applications of subterranean surveys, for example in caves, mines or tunnels,
the laser head is placed on a tripod. Several studies examine factors that influence accuracy
and precision, such as the distance between the sensor and the object, the type of material and,
in the case of a tunnel, the angle of incidence (Pejic et al., 2013; Roca-Pardiñas et al., 2014).
Specific conditions affect work in a tunnel: the working distance is more limited, the
atmospheric conditions influence the reflectivity of the material and are not controlled (Pejic
et al., 2013), the work is basically in a line, and the localisation of the TLS stations is critical
to the analysis, in order to avoid incidence angles that lead to intolerable errors. Pejic et al.
(2013) determined that the influence of the angle of incidence on measurement noise is 30%,
so in the normal conditions of a railway tunnel, the maximum distance scan should be 13 mm,

7
which significantly increases the number of stations required. The ideal localisation of the
TLS is the centre of the tunnel, in order to distribute the noise evenly. If the sensor is near the
gable, the errors are not uniform in cross-section, and are higher in the nearest wall due to the
angle of incidence (Roca-Pardiñas et al., 2014).
To improve the capture/time ratio, the system is used in kinematic mode and must be
integrated with other systems. This process is explained in more detail in the following
section.
In static or kinematic modes, control points, which are usually targets, are required to
georeference the point cloud. The coordinates are obtained by topographic methods and their
accuracy contributes directly to the accuracy of the final model (Pejic et al., 2013; Puente et
al., 2013).
Mobile mapping systems
The need to increase the productivity of laser scanner sensors and their application to urban
inventories and to control pavements, among other factors (Jacobs, 2005; Kingston et al.,
2006), has led to their use in kinematic mode. While some of the initial applications were a
‘stop-and-go’ system, in which the sensor was on a moving platform but stopped at the time
of capture, due to integration with other systems, data collection while fully in motion has
gradually become possible.
To achieve this, most systems are fixed to a stable platform. This is then attached to
the vehicle’s roof where the cameras are integrated with the TLS systems and GNSS antennas.
The car is also equipped with odometers and INSs. The distribution of the components varies
depending on the application, but in any case the set has to be calibrated previously to the data
capture (Gräfe, 2007).

8
The differential GNSS allows positioning with absolute centimetre quality. The
positions are determined for two main reasons: to georeference the point cloud, and initialise
the IMU when its bias exceeds the stated tolerance. Likewise, the position from the inertial
sensors is used when the GNSS signal is lost by occlusion, as long as it is for a short period of
time only.
As mentioned above, the use of this kind of positioning systems in mines, caves and
tunnels is not practical. It is essential to set control points, patterns, or mixed systems that
allow underground positioning. One of the latter systems consists of replacing TLS sensors
with 3D ToF (Time of Flight) cameras (Ratshidaho et al., 2014).
Barcelona underground management
At the time of this study, the metro network in Barcelona comprised 173 km of commercial
railways divided into 7 lines. The network has now been extended to 208 km and 9 lines. The
proper management of all elements in this underground network is based on the knowledge of
their location and characteristics. Therefore, with the aim of improving management, TMB
worked on a pioneering project in Spain, which had two main objectives:
• Creation of a cartographic base. Establishment of a geodetic network that allows
georeferencing, topographic surveying of the geometry and geometric design
calculation. Subcentimetric accuracy was required in the geometric determination of
the railway and the geodetic network.
• Inventory of the different elements (signalling, communication and sidewalks), to
record both their location in absolute coordinates and their attributes. In this case, the
accuracy required in the coordinates of the different elements was in a submetric
order, and therefore much lower than in the previous case.

9
It was impossible to obtain this information in the traditional way for the entire network,
so it was essential to find technology that could allow us to gather the data in a relative short
time, taking into account that this work could not interrupt the passenger service or
maintenance tasks. Therefore, we sought a system that could capture the information in the
shortest possible time, with guaranteed quality (Fig. 1, bottom).
Under these conditions, the solution used to extract information in the tunnels was to carry
out a kinematic survey, combining laser scanning and digital photogrammetry. This allowed
us to inventory the elements in the office, and to obtain a 3D laser scanner model and a
photogrammetric model of the tunnels.
The elements to be inventoried could be classified into five groups: railroads, works,
catenary, energy and signalling.
• Railroad: includes all the characteristic elements of the railroad, types of fixation,
sleepers, seat type, oilers, detours, expansion devices and molehills.
• Works: includes all elements relating to infrastructure, types of vault, ventilation
shafts and platforms, changes in section, bridges and walkways.
• Signalling: includes signals, track circuits, signalling cabinets and elements of
communication, changes and drives, ATP (Automatic Train Protection) and ATO
(Automatic Train Operation) elements.
• Catenary: comprises supporters, types of catenary insulators and switches.
• Energy: substations, switching cameras, transformer centres, and points of light,
feeders and power lines are identified in this category.

10
Fig 1. Flow chart of the work and people involved before and after of the methodology change
Within each group subcategories were defined, and specialised technical assistance was
required to identify and classify the elements.
Before this project (Fig. 1, top), georeferenced data on any elements of tunnels and
stations could be obtained only with a topographic survey, which involves time-consuming
tasks to connect with coordinate frame systems. This is a disadvantage when little time is

11
available. Moreover, the equipment that is used is extremely specialised, which means that the
work must be done by the specific technicians who can operate each piece of equipment, as
well as by the geomatic team who georeference the data. In other words, the work is slow and
requires a lot of human resources.
As a result of the project presented here, a continuous record of the continent and content
of the tunnels and part of the TMB stations was obtained. These data were gathered quickly
and enabled us to extract information a posteriori, even years after the data acquisition.
Therefore, each technical specialist could extract the required information in the office with
no time pressures, and could compare data and consult the model and photographs when new
information was required.
Methodology
The MoSES mobile sensing system (Gräfe, 2007) was chosen for the data capture. This
system had an original configuration to work in open air zones, based on four modules:
• Trajectory module: an IMU Applanix POS / LV with a bias from 1 to 0.01° per hour,
recalibrated with the integrated GPS system and an odometer.
• Photogrammetric module: composed of six colour cameras with the sensitivity
required to work in daylight.
• Laser-scanner module: two sensors Sick LMS200 ToF, with 180° coverage and nadir
orientation to obtain pavement data.
• Video module: to film in the forward direction.

12
Fig 2. Schedule of the modules modification
To work in the tunnel conditions, i.e. poor lighting and no GPS coverage to recalibrate the
IMU, the system had to be modified in the modules of trajectory, photogrammetry and laser
scanning (see Fig. 2).
The set of cameras, laser scanners, odometers and kinematic systems were calibrated in a
controlled environment (calibration field), consisting of a set of control targets located on the
floor and on the facades of the inspection area. From an initial approximate calibration, the
data of the sensors (cloud of points and images) and the control points were measured.
Successively the corrections were applied in a process of adjustment by least squares,
until a solution with the required precision was reached. The final result is a set of data
including the internal data of the cameras and the orientations of the sensors with respect to
the INS.
Various tests were carried out to calibrate the measurement systems. For this, three types
of reference distances with different orientations were used, captured simultaneously with
MoSES. All these were carried out in high accuracy test fields for the complete equipment
(cameras and video, laser scanner, odometer and IMU).
Working without GPS coverage affects the georeferencing trajectory. In this case, as

13
mentioned in Section 2.3, control points are required to correct the bias of INSs. These targets
are reference plates, PK (Point-Kilometric), located on gables, whose absolute coordinates are
obtained from the geodetic control network. These points were separated by 20 m, which is a
sufficient gap, according to the results of previous studies (Puentes et al., 2014).
Therefore, we have two work methods, depending on the final result to be obtained.
However, both methods share common processes, such as the trajectory definition. Figure 3
reflects the workflow, in which the sensors used to capture the 3D information and to define
the trajectory are differentiated.
Fig 3. Flowchart of the trajectory, photogrammetry and laser scanning modules and their integration. In red the sensors used in the trajectory definition and in green the sensor whose aim is the data
capture

14
To achieve high accuracy and precision geometry and scanning in a tunnel requires an
adequate geodetic network, in order to register and georeference the point clouds and check
the scan data quality. Therefore, one of the main, first tasks is to establish a reference frame.
Reference system
Owing to the kind and conditions of the work to provide coordinates for targets used in
georeferencing, three networks were required, each supported in the higher order, as shown in
Fig. 4.
Fig 4. Control geodetic network (exterior, tie, and interior) in vertical section
The Exterior Network is the connection to the geodetic reference frame of Catalonia. It
consists of 136 vertices, 124 of them at the entrances of the stations and garages chosen as the
start and end of the Tie Network, and 12 belonging to the XU (Xarxa Utilitaria, 4th order
network) of the ICGC (Institut Cartogràfic i Geològic de Catalunya), distributed

15
homogeneously over the study area, Fig. 5. This network was observed by static GPS
methods. Each base was observed 4-7 times; hence 982 baselines were available with enough
redundancies to achieve the required accuracy. After the network adjustment, the coordinates
were obtained with an average standard deviation of 2 cm in planimetric and altimetric
components.
Fig 5. Exterior geodetic network, interior network and an example of a tie network in one of the stations
The Tie Network is comprises of the traverses that connect the Exterior and Interior
Networks. In total, 53 traverses have been observed, consisting of 894 vertices. After
adjustment by least squares, coordinates were obtained with an average RMS of 1 cm.

16
The Interior Network comprises a main traverse along the tunnel connecting two
consecutive Tie Networks, and the radiated bolts from the bases. There are a total of 73
traverses formed by 883 vertices and 3522 bolts. In this case, the average RMS obtained or the
coordinates after adjustment is 1 cm.
Interior and Tie Networks were observed under unfavourable conditions. Observations of
the Interior Network must be made inside the tunnels and are affected by factors such as
lateral refraction (Velasco-Gómez et al., 2016). Observations of the Tie Networks are
performed within the stations, so the geometry is very unfavourable. To try to minimise the
errors in these conditions, high-precision surveying equipment and forced centring systems
were used. The method used for observations and calculations included three series on I and II
reciprocal observations angle and distance, and collimations using ATR (Automatic Target
Recognition). Thus, erroneous observations could be filtered before proceeding to the
calculation. Both networks were adjusted by the least squares indirect observations method,
applying the W-Baarda test (Baarda, 1967) for detecting gross errors, and setting α and β at
0.1% in 80%.
Laser scanning
The initial configuration of the laser scanning module was replaced by two phase difference
sensors, Z+F Imager 5006 and FARO LS880, since the optimal maximum range is different
for each one, to obtain the 3D model. The original sensors, Sick LMS200, were used to
reference the trajectory, because they are positioned to capture PK targets.
In order to capture the data, the truck was assembled on a platform driven by a draisine
used in the maintenance tasks of TMB.
The survey took place during the time slot reserved for maintenance tasks, between

17
1:00am and 4:15am, when the catenary has no voltage. Considering the time required to start
up the system and transfer the draisine from the garage to the starting point and vice versa on
completing the work, only 2 hours were available for the data capture. The system allowed us
to obtain data at 10 km/h, which is a profile every 5 cm (Fig. 6), so that each day between 15
and 20 km of infrastructure were measured. The complete survey was finished in 10 working
days.
Fig 6. Tunnel georeferenced section
After these tasks, partial cloud points were filtered and registered to obtain a complete
cloud of the tunnel, formed by 13809 million points.
Georeferencing
Since it was impossible to obtain GNSS positioning to restart the IMU, the original position
had to be replaced by another with greater trajectory accuracy. In this case, the IMAR iNAV-
RQH was used based on a laser gyroscope, with a bias from 0.01° to 0.0015º.
The trajectory during the data capture was calculated by integrating data from the IMU,

18
the odometer and the Kalman filter. This computed trajectory is continuous, in this case with
a bias of 0.01°, which represents 17.5 cm/km. This should be corrected and georeferenced
with the previously measured targets, which are located every 20m. The targets were
identified in the data from oblique scanners, since they intersected all the edges of the plate.
In this way, according to the bias estimated by the technical characteristics of the IMU, the
method used to correct it and the number of control points used for this transformation, the
final precision in the calculated trajectory was estimated at ± 2 cm and ± 5 mm in XY and Z,
respectively. This can be checked empirically by comparison with the measures of the railway
geometry obtained by topographic methods.
Once the trajectory had been determined, and since the whole system was calibrated, the
sensor positions were known at all times, and therefore the georeferenced coordinates of all
the data from scanning and cameras were also known, which facilitated the photogrammetric
processes.
Photogrammetric survey
In the photogrammetric module, the six RGB cameras needed to be replaced by seven high
sensitivity infrared spectrum JAI cameras with auxiliary LED lighting, which was also
infrared, Fig. 7. Thus, a more uniform illumination was achieved and the contrasts caused by
the spotlight used with RGB cameras were avoided. In addition, the localisation and
orientation of the cameras needed to be changed, so that they were focused on the gables,
vault and floor of the tunnel.

19
Fig 7. Infrared LED auxiliary lighting
The system was composed of a camera in almost zenith orientation, to capture images
of the catenary; two cameras in quasi nadir orientation (formed stereoscopic pair), to capture
images of the left and right rail profile respectively; two cameras in oblique orientation, to
capture images of the middle-top of the gables on both sides of the vehicle; and finally two
cameras in oblique orientation to capture the middle-bottom of the gables. Two types of
cameras with focal 8 mm and 12 mm were used since the range camera-object is closed due to
the tunnel characteristics. The sensor was of type 2/3'', with a resolution of 1040x1392, less
than the RGB, and a pixel size of 6.45 microns.
One of the difficulties to manage is the fact that the distances between object and
camera were different for each one. They depended on the position of the camera in the
system and the kind of tunnel. Moreover, the images taken from the side cameras were
parallel to the tunnel. Depending on which part of the image was used for the measurement,
the elements could be found to be a few centimetres or several meters.
In the case of photographs taken at a distance of 2 m, the value of the GSD (Ground

20
Sample Distance) obtained is slightly more than 1 mm, reaching the edges of the photographs
at 3 mm, considering for this calculation a distance of 5 m and a focal 12 mm (values between
1/167 and 1/417). For a focal length of 8 mm these values are increased by 50% (Eq. 1).
E = Df (Eq. 1)
For a distance (D) of 2 m, the scale would reach a value of 1/250 (1/E), and if the
distance is increased to 5 m the scale would be 1/625 (1/E), and the corresponding values of
GSD (GSD = E · pixel) are 2 mm and 5 mm, respectively (1/E= photographic scale).
In any case, the cameras enabled millimetric precision to be obtained in the
measurement of a point, and therefore the precision was higher than that in the topographic
work. As a consequence, the final precision was given by the topographic vertex, in
accordance with the established tolerances, i.e. it depends basically on the quality in the
topographic vertex, which is in accordance with the established tolerances.
Since the survey is in a kinematic mode, the photogrammetric pair could be from
images taken at the same time from different cameras if the images have an overlapping area,
or from images taken from the same camera at different times (example: t=1 and t=2).
However, in this last case, the quality is lower.
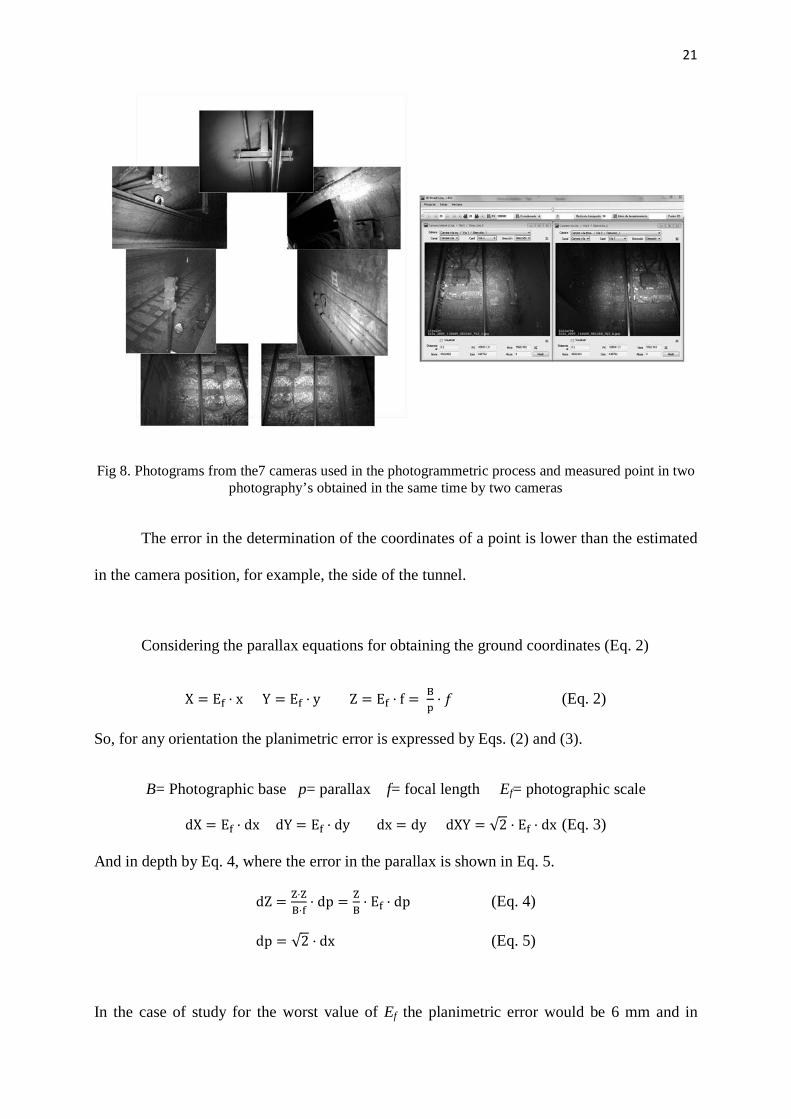
With these photographs and the photogrammetric data processing programme, the
spatial coordinates of details can be established from the stereoscopic pair or from
monoscopic photographs and the laser model (see Fig. 8).
21
Fig 8. Photograms from the7 cameras used in the photogrammetric process and measured point in two photography’s obtained in the same time by two cameras
The error in the determination of the coordinates of a point is lower than the estimated
in the camera position, for example, the side of the tunnel.
Considering the parallax equations for obtaining the ground coordinates (Eq. 2)
X = Ef · x Y = Ef · y Z = Ef · f = Bp
· 𝑓 (Eq. 2)
So, for any orientation the planimetric error is expressed by Eqs. (2) and (3).
B= Photographic base p= parallax f= focal length Ef= photographic scale
dX = Ef · dx dY = Ef · dy dx = dy dXY = √2 · Ef · dx (Eq. 3)
And in depth by Eq. 4, where the error in the parallax is shown in Eq. 5.
dZ = Z·ZB·f
· dp = ZB
· Ef · dp (Eq. 4)
dp = √2 · dx (Eq. 5)
In the case of study for the worst value of Ef the planimetric error would be 6 mm and in

22
depth 28 mm. So, when we change from the photographic system to the cartographic one, we
obtained the following: dEN ≈ 28 mm, dH ≈ 5 mm, perfectly in the range of the tolerance
previously established.
As this is a kinematic survey, photogrammetric methods for calculations can generate
pairs of images obtained at the same time from different cameras and different moments with
only camera (Fig. 8).
As result, a 3D model of all FMB tunnels was obtained. This has enough definition to
identify and locate any registered item, so is the basis for the inventory.
Data management: inventory
Once the three-dimensional models and images of the tunnels were available, the element
inventory could be started. All of this work was carried out in the office (Fig. 9).
Fig 9. Element extraction for the catalogue from a stereographic pair
As a result of this phase, a list with the inventory of items in the catalogue was
23
obtained, with over 200 different items established by the TMB.
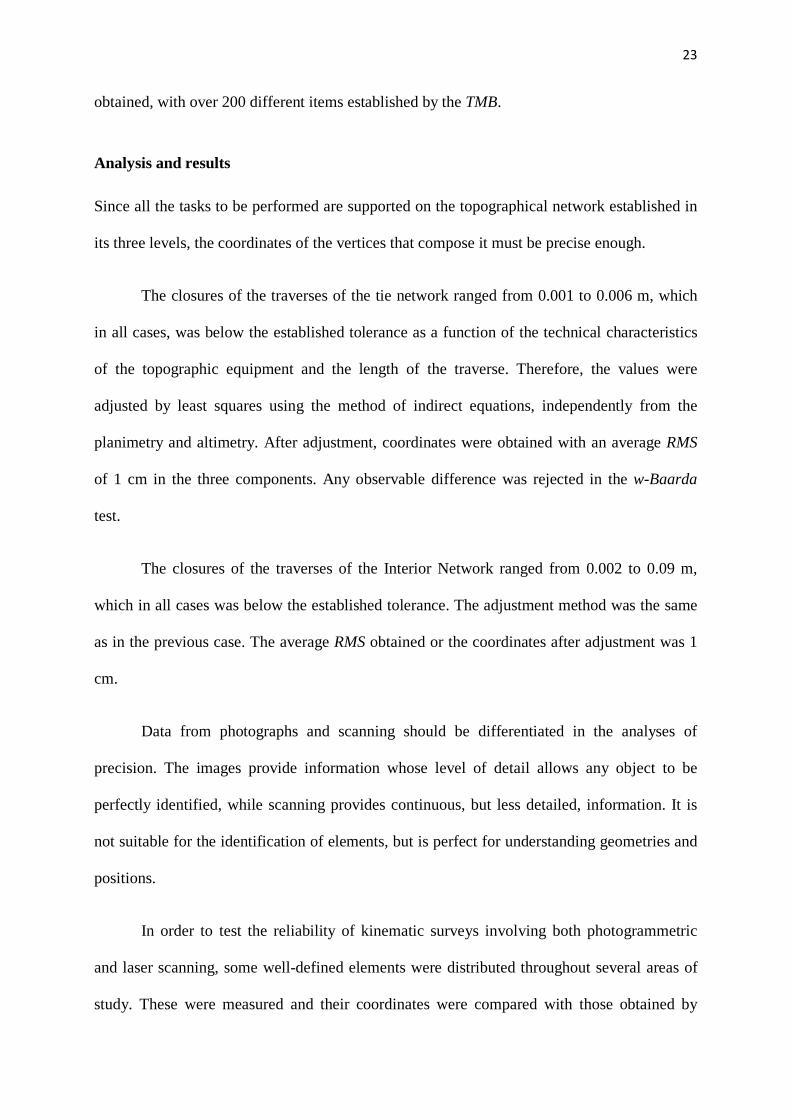
Analysis and results
Since all the tasks to be performed are supported on the topographical network established in
its three levels, the coordinates of the vertices that compose it must be precise enough.
The closures of the traverses of the tie network ranged from 0.001 to 0.006 m, which
in all cases, was below the established tolerance as a function of the technical characteristics
of the topographic equipment and the length of the traverse. Therefore, the values were
adjusted by least squares using the method of indirect equations, independently from the
planimetry and altimetry. After adjustment, coordinates were obtained with an average RMS
of 1 cm in the three components. Any observable difference was rejected in the w-Baarda
test.
The closures of the traverses of the Interior Network ranged from 0.002 to 0.09 m,
which in all cases was below the established tolerance. The adjustment method was the same
as in the previous case. The average RMS obtained or the coordinates after adjustment was 1
cm.
Data from photographs and scanning should be differentiated in the analyses of
precision. The images provide information whose level of detail allows any object to be
perfectly identified, while scanning provides continuous, but less detailed, information. It is
not suitable for the identification of elements, but is perfect for understanding geometries and
positions.
In order to test the reliability of kinematic surveys involving both photogrammetric
and laser scanning, some well-defined elements were distributed throughout several areas of
study. These were measured and their coordinates were compared with those obtained by

24
kinematic methods. The results showed that there were discrepancies of centimetre order,
which were within the precision required in all cases.
After several comparisons among coordinates of details from the point cloud and
topography, the average discrepancy was estimated at ± 1 cm, which is consistent with the
precision of the systems and methodologies used. It should be noted that the greatest
differences, which in no case exceeded a centimetre, were in areas, such as platforms, which
were not available targets to adjust the trajectory.
The results obtained with the monoscopic or stereoscopic photogrammetric process
showed values with a mean difference of 44 mm in planimetry and 56 mm vertically, in
absolute values. In no case did the differences exceed 10 cm. These variations are due to the
computation of the position in indirect orientation of the cameras, since the error in
photocoordinates can be considered residual.
The kinematic surveys resulted in a Database with the inventoried elements linked to
pack images and the display module of the software, and the georeferenced point clouds. The
volume of photogrammetric data was 430 GB, with nearly three million georeferenced
photographs (7 images for each 0.5 m section in each railway).
Thus, the identification, positioning and definition of the element attributes to the
catalogue are carried out from the images, while data from the laser scanning were used to
georeference the trajectory, and complement the interpretation of the different types of
infrastructure, to obtain geometries.

25
Fig 10. Platform longitudinal section
At present, data captured years ago can still be used to obtain information about
sections (Fig. 10), planimetric maps and other features without having to go into the tunnel,
since the original data are continuous and homogeneous in all the galleries.
Conclusions
The results show the working method as the best that offers the best binomial
productivity/quality, taking into account the strict conditions of work in infrastructure of this
nature.
The inability to directly georeference underground infrastructure and the fact that the
working space is a linear area of reduced dimensions has meant that mobile mapping, the
solution that has been adopted and widely used in urban surface surveys, is not directly
applicable.
The duality of techniques available in these systems allows the creation of a 3D laser
scanner model, which can then be used in the office to obtain the geometry of tunnels,
platforms and railroads with centimetre accuracy and precision. However, an inventory of all
items in absolute coordinates and their attributes can be obtained from photogrammetric pairs.
26
As the work can be done in the office, specialists in each of the categories do not need to enter
the tunnels, and the costs and time are reduced.
In any case, the geodetic network must be of good quality to achieve the accuracy
sought in other processes that require control points.
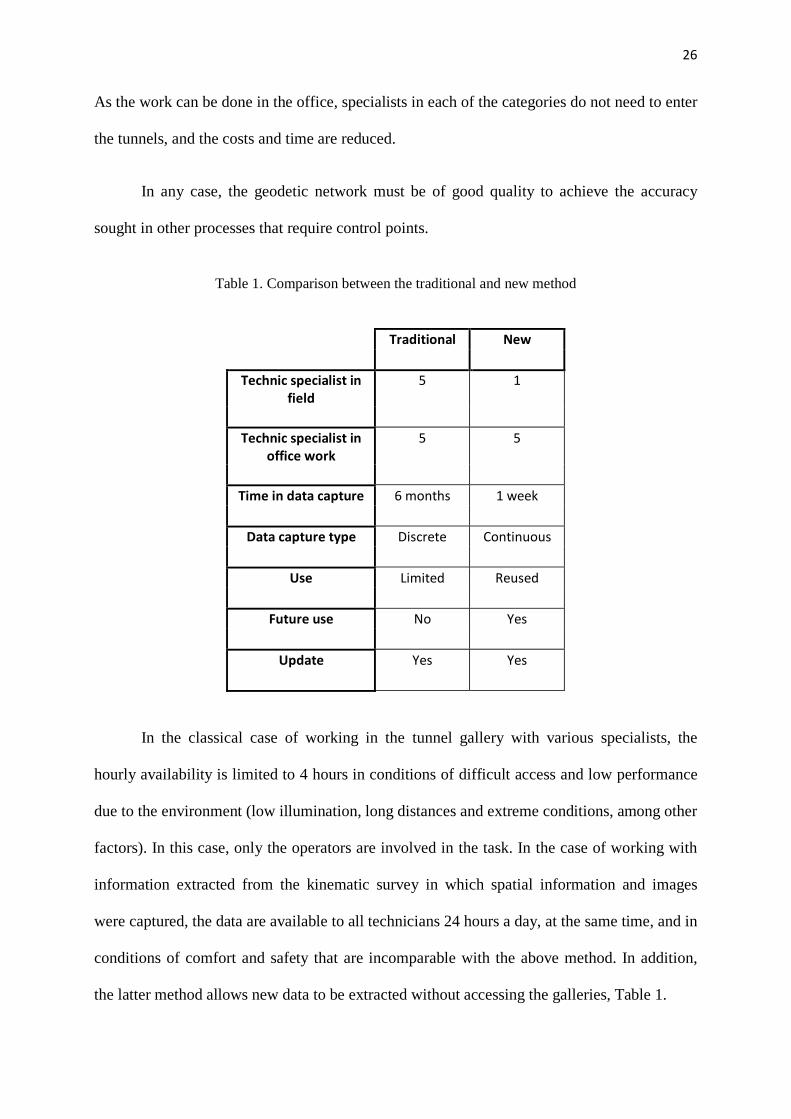
Table 1. Comparison between the traditional and new method
Traditional New
Technic specialist in field
5 1
Technic specialist in
office work 5 5
Time in data capture 6 months 1 week
Data capture type Discrete Continuous
Use Limited Reused
Future use No Yes
Update Yes Yes
In the classical case of working in the tunnel gallery with various specialists, the
hourly availability is limited to 4 hours in conditions of difficult access and low performance
due to the environment (low illumination, long distances and extreme conditions, among other
factors). In this case, only the operators are involved in the task. In the case of working with
information extracted from the kinematic survey in which spatial information and images
were captured, the data are available to all technicians 24 hours a day, at the same time, and in
conditions of comfort and safety that are incomparable with the above method. In addition,
the latter method allows new data to be extracted without accessing the galleries, Table 1.

27
Once these georeferenced three-dimensional models of the infrastructure are available,
a new task must be considered: updating the information. This requires systems that allow
changes to be updated as they occur, without undertaking a complete survey (and thus saving
resources). To undertake this task of updating the inventory, we believe that the best option is
systems based solely on photogrammetry. Further research should be undertaken in this area.
References
Baarda, W., 1967. Statistical concepts in geodesy, Netherlands Geodetic Commission. Publications on Geodesy, New Series 2, 4.
Dai, F. and Peng, W.B., 2013. Reality capture in construction engineering applications using close-range photogrammetry. Applied mechanics and materials, 2795, 353-356.
Gikas, V. and Stratakos, J., 2012. A novel geodetic engineering method for the accurate and automated extraction of road/railway alignments based on the bearing diagram and fractal behaviour, IEEE transactions on intelligent transportation systems, 13, 115–126.
Gräfe, G., 2007. High precision kinematic surveying with laser scanners, Journal of Applied Geodesy, 1, 185-199.
Han, S., Cho, H., Kim, S., Jung, J. and Heo, J., 2013. Automated and efficient method for extraction of tunnel cross sections using terrestrial laser scanned data. Journal of computing in civil engineering, 27(3), 274-281.
Jacobs, G., 2005. High definition Surveying & 3D laser scanning uses in transportation. Professional Surveyor Magazine, April.
Kingston, T., Gikas, V., Laflamme, C. and Larouche, C., 2007. An integrated mobile mapping system for data acquisition and automated asset extraction. In International Symposium on Mobile Mapping Technology.
Koch. C. and Brilakis, I., 2011. Pothole detection in asphalt pavement images. Advanced engineering informatics, 25 (3), 507-515.
McCarthy, T., Fotheringham, A.S., Charlton, M., Winstanley, A. and O’Malley, V., 2007. Integration of LiDAR and stereoscopic imagery for route corridor surveying. Mobile mapping technology, 37, 1125–1130.

28
Pejic, M., Bozic, B., Abolmasov, B. and Gospavic, Z., 2013. Design and optimization of laser scanning for tunnels geometry inspection, Tunnelling and underground space technology, 37, 199-206.
Puente, I., González-Jorge, H., Martínez-Sánchez, J. and Arias, P., 2013. Review of mobile mapping and surveying technologies. Measurement, 46 (7), 2127-2145.
Puente, I., González-Jorge, H., Martínez-Sánchez, J. and Arias, P., 2014. Automatic detection of road tunnel luminaires using a mobile LiDAR system, Measurement. 47. 569-575.
Ratshidaho, T.T., Tapamo, J.R., Claassens, N. and Govender, J., 2014. An investigation into trajectory estimation in underground mining environments using a time-of-flight camera and an inertial measurement unit. South african journal of industrial engineering, 25(1), 145-161.
Roca-Pardiñas J., Argüelles-Fraga R., López, F. and Ordóñez, C., 2014. Analysis of the influence of range and angle of incidence of terrestrial laser scanning measurements on tunnel inspection. Tunnelling and underground space technology, 43, 133-139.
Scaioni, M., Barazzetti, L., Giussani, A., Previtali, M., Roncoroni, F. and Alba, MI., 2014. Photogrammetric techniques for monitoring tunnel deformation. Journal earth science informatics, 7 (2), 83-95.
Seo, D.J., Lee, J.C., Lee, Y.D., Lee, Y.H. and Mun, D.Y., 2008. Development of cross section management system in tunnel using terrestrial laser scanning technique, In: Proceedings of the international archives of the photogrammetry, remote sensing and spatial information sciences, XXXVII (B5), 573-581.
Slama, C.C., Theurer, C. and Hendrikson, S.W., 1980. Manual of photogrammetry 4th Edition. Falls Church: American Society of Photogrammetry.
Talaya, J., Bosch, E., Alamús, R., Serra, A. and Baron, A., 2007. GEOVAN: The mobile mapping system from the Cartographic Institute of Catalonia. In: Advances in Mobile Mapping Technology. London: Taylor & Francis Group.
Velasco, J., Herrero, T. and Prieto, J., 2014. Metodología de diseño, observación y cálculo de redes geodésicas exteriores para túneles de gran longitud. Informes de la Construcción, 66 (533).
Velasco-Gómez, J., Prieto, J.F., Molina, I., Herrero, T., Fábrega, J. and Pérez-Martín, E., 2016. Use of the gyrotheodolite in underground networks of long high-speed railway tunnels. Survey review, 48, (350).
Wang, T.T., Jaw, J.J., Chang, Y.H. and Jeng, F.S., 2009. Application and validation of profile–image method for measuring deformation of tunnel wall. Tunnelling and underground space technology, 24(2), 136-147.

29
Yoon, J.S., Sagong, M., Lee, J.S. and Lee, K.S., 2009. Feature extraction of a concrete tunnel liner from 3D laser scanning data. NDT&E international, 42(2), 97–105.
Zhu, Z. and Brilakis, I., 2009. Comparison of optical sensor-based spatial data collection techniques for civil infrastructure modeling. Journal of computing in civil engineering, 23 (3), 170–177.