Embed Size (px)
Citation preview

THE USE OF D20 •8 FOR MEASURING ENERGY METABOLISM
IN COLUMBA LIVIA AT REST AND IN FLIGHT
EUOENE A. L•FE•w•
MANY meaningful problems in avian ecology and physiology could be aided by studies of total energy metabolism on birds living under natural environmental conditions. The classical methods of direct and indirect
calorimetry thus far employed (e.g., Benedict, 1938; Benedict and Riddle, 1929; Brody, 1945; Kleiber, 1950; Pearson, 1950; and Peters and Van Slyke, 1946) are not suited for reliable measurements of metabolism of unconfined birds in steady flight or for relatively long periods of time under natural conditions.
Lifson et al. (1955) proposed a method for determining carbon dioxide production (and hence energy expenditure, given supplementary informa- tion) in unrestricted animals by means of isotopically labeled water (D.•O•S). The method was validated, by necessity, on confined rats and mice on a regular food regime in the laboratory (Lifson et al., 1955; McClintock and Lifson, 1958a, b), and on fasting rats (Lifson and Lee, 1961), and hereditarily obese mice (McClintock and Lifson, 1957a, b). In these studies the doubly labeled water determination provided estimates of CO.• output with errors of only 5-10 per cent. This procedure appeared to be applicable to energy studies in birds.
The present investigation was initiated to test the validity of the method by comparing in birds the D20 •s determinations of CO2 production with CO.• production as it is customarily obtained in the laboratory, and to measure the energy expenditure of flight by means of the isotope method and by material balance. Flight-energy determinations have been at- tempted under laboratory conditions by Pearson (1950, 1954) and Lasiewski (1962) on hummingbirds. The estimates by Odum (1960a, b) and Odum et al. (1961) on flight ranges of some passefine birds have im- plicitly required an indirect calculation of flight-energy expenditure. Other workers (Zeuthen, 1942; Brown, 1951, 1961; Wilkie, 1959; Rasper, 1960; Nisbet et al., 1963) have used aerodynamic considerations for de- ducing indirectly the energy requirements involved in bird flight.
RATIONALE OF THE METHOD
Fundamental to the isotopic method is the fact that the oxygen of respiratory CO,• is in isotopic equilibrium with the oxygen of the body water (Lifson et al., 1949). Therefore, although the hydrogen of the body water is lost mainly as water, the oxygen is lost both in water and in the CO• produced. The turnover rate for body water oxygen, therefore, is sig-
403 The Auk, gl: 403-416. July, 1964

404 LEFEBvRE, Energy Metabolism of Columba livia [ Auk Vol. 81
nificantly higher than that for hydrogen and the difference in the two turn- over rates is proportional to the COs produced. The respective turnover rates are obtainable by labeling the two components of the body water with stable isotopes of hydrogen (deuterium) and oxygen (oxygen -18). In the case in which an animal is given isotope and then allowed to drink unlabeled water during the experimental period, the isotopic turnover rate (K,) is calculated (from an equation given by Lifson et al., 1955) from the change in specific activity (S,) of the initial and final blood or body water samples:
K, = •X In S,/•X t (Equation 1).
Because the rate of CO2 plus water output is equal to the product of the total body water (N) and the fractional turnover rate (K) of the body water oxygen (in this case, of the isotope, or Ko*), and the rate of water loss alone is equal to the product of the total body water and the fractional turnover rate of the body water hydrogen (in this case, of deuterium, or KD), the rate of COs production (rCOo) can be derived (from an equation given by Lifson et al., 1955) as follows:
rCO2 = N/2 (Ko*-KD) (Equation 2).
These relationships are based on the following assumptions, which simplify the calculations: (1) total body water is constant; (2) hydrogen and oxy- gen of body water are lost only as water and CO• output; (3) all rates re- main constant; (4) storage is negligible; (5) isotopes enter all compart- ments of the body water; (6) isotopes are lost at the specific activity attained in the body water; and (7) there is no isotope reentry.
The theoretical basis for the D20 •8 method and the assumptions involved are discussed by Lifson et al. (1955). Published reports have explored certain aspects of the method in greater detail (Lee and Lifson, 1960; Lifson and Lee, 1961). The reader is referred to these papers and to LeFebvre (1962) for a critical analysis of the method and of potential errors introduced by deviations from the assumed conditions.
I. VALIDATION EXPERIMENT
Method.--The first experiment was designed to compare CO• production determined isotopically ("Calculated CO•") with CO• output determined simultaneously by an accepted laboratory procedure ("Observed CO2") (cf. Lifson et al., 1955). The "Ob- served CO._," production was measured by placing the experimental bird (pigeon, Columba livia) in an open-circuit system. Air entering the metabolism chamber was dry and CO•-free; the water and CO• were removed respectively by means of "Ascarite" and "Drierite" absorbers in a series of "U" tubes preceding the chamber. Air flow was maintained between 600 and 1,000 cc per minute. Expired COe was absorbed from the exiting air in 30 per cent KOH contained in a series of three flasks. Total

July ] L•F•Bw•, Energy Metabolism o! Colum. ba livia 405 1964
COz absorbed by the KOH was determined by Van Slyke manometric analysis. Analyses of KOH solutions for CO= content were compared periodically with standard solutions; the technique yielded an average error within ñ 1 per cent. Two preliminary recovery tests indicated that total recovery of CO= in the metabolism train was about 3 per cent less than actual production.
Starting with pigeon number NB13, the lower portion of the metabolism chamber was packed in dry ice to hold the water condensate and droppings in a frozen condi- tion. This prevented decomposition of the excreta and probably reduced isotopic re- entry due to water reentry.
The experimental bird was acclimatized in the metabolism chamber for several days and was provided with 1.5 per cent H=O •s (atom per cent excess) for drinking water. Following the consumption of a sufficient volume of H.•O •s, an injection of 99.5 per cent D=O (excess) was given (intravenously or intraperitoneally). These amounts pro- vided a concentration of about 0.5 per cent for H=O • and 1 per cent for D,.,O in the body water. On the basis of preliminary experiments, one hour was allowed for dis- tribution of the isotope throughout the body water compartment, after which time an initial blood sample was withdrawn via heart puncture.
The bird was returned to the chamber and provided with fresh water and food. The chamber was sealed, the air flow adjusted, and the CO.• collection begun. At the end of four days (three days, in the case of two birds) the bird was removed from the chamber for a final blood sample. The CO= collecting flasks were saved for analysis. The "Calculated CO=" was then determined: the average total body water was considered, as in the experiments of Lifson et al. (1955), as the average of the initial and final body weights and the final per cent body water as determined by oven desiccation of the sacrificed bird to constant weight. It was assumed that the per cent body water did not change significantly during the course of the experiment. The analytical error in the estimate of final per cent body water was within 1 per cent and average total body water was accurate to ñ 5 per cent. The blood water was analyzed by mass spectrometry for specific activity of the isotopes. The measured change in specific activity was used to calculate the turnover rates using equation (I); these values were then substituted in equation (2) which assumes the validity of all assumptions for the rate of CO2 production. The largest single source of error in this method is probably in the determination of the specific activity and the resultant turnover rates, KD and Ko., since the calculation involves relatively small differences between large values. Lifson et al. (1955) cite an example in which a discrepancy of only 0.003 atom per cent in the determination of the final So. would produce an error of 4 per cent in the calculated CO• production. In samples of both the validation study and the flight study, wide discrepancies in the duplicate readings for specific activity sometimes occurred. Such errors generally result from incomplete distillation of the blood water and subsequent dilution of the sample due to fractionation effects (LeFebvre, 1962: 9-11). Accordingly, in the mass spectrometer analysis, whenever a difference occurred in duplicate samples which exceeded 2 per cent, only the higher reading was used (cf. McClintock and Lifson, 1958a) unless other data indicated the higher result was due to contamination or other error. Whenever possible, additional samples were tested in place of these which were variable.
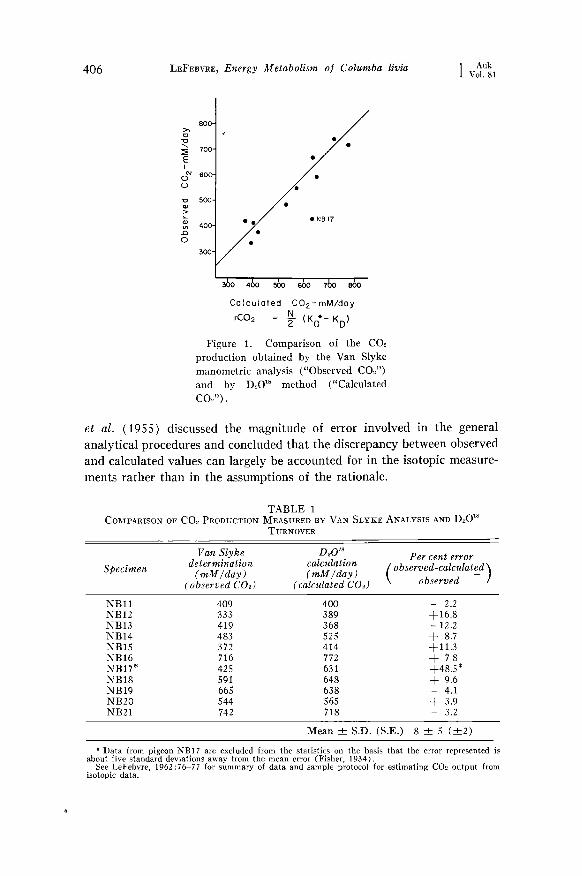
Results.--The Van Slyke COs determinations ("Observed COs") and D20 •s CO2 determinations ("Calculated CO•") are compared in Figure 1 and Table 1. There is considerable variation in the errors observed al-
though a majority of the comparisons agrees within 10 per cent. Lifson
406 LEFEBVRE, Energy Metabolism o] Columba livia [ Auk Vol, 81
800-
• 700-
o
•6o •6o •6o &o •6o 8•o
Calculated C 02- mM/day
rC02 = •- (Ko*- KD) Figure 1. Comparison of the CO2
production obtained by the Van Slyke manometric analysis ("Observed CO2") and by D,_,O TM method ("Calculated CO2").
et al. (1955) discussed the magnitude of error involved in the general analytical procedures and concluded that the discrepancy between observed and calculated values can largely be accounted for in the isotopic measure- ments rather than in the assumptions of the rationale.
TABLE 1 COMPARISON OF C0,2 PRODUCTION MEASURED BY VAN SLYKE ANALYSIS AND D20 •s
TURNOVER
Specimen Van Slyke D•O'$ Per cent error
determination calculation [ observed-calcuIated• (mM/day) (mM/day) \ ob• (observed CO•) (calculated CO•)
NBll 409 400 - 2.2
NB12 333 389 q,16.8 NB13 419 368 - 12.2
NB14 483 525 q- 8.7 NB15 372 414 +11.3 NB16 716 772 q- 7 8 NB17* 425 631 q,48.5' NB18 591 648 q- 9.6 NB19 665 638 - 4.1 NB20 544 565 q- 3.9 NB21 742 718 - 3.2
Mean -+ S.D. (S.E.) 8 -+ 5 (+2)
* Data from pigeon NBI7 are excluded from the statistics on the basis that the error represented is about five standard deviations away from the mean error (Fisher, 1934).
See LeFebvre, 1962:76 77 for summary of data and sample protocol for estimating CO'-, output from isotopic data.
July] LEFEBVRE, Energy Metabolis•n o] Colurnba livia 407 1964 ]
TABLE 2 SLTMMARY OF TIlE AVERAGE ERRORS PROVIDED BY THE D,20 TM CALCULATIONS COMPARED WITH THE VAN SLYKE MANOMETRIC DETERMINATIONS OF CO• PRODUCTION IN BIRDS
AND MICE
Birds*
A B
rC02 = N/2 (Ko, - K,) rCO2 = N/2.08 (Ko, - KD) - .015 KDN
Mice* *
MeanñS.D. 8ñ5 per cent 8ñ8 per cent 7+__7 per cent S.E. 2 per cent 3 per cent 2 per cent Alg. Mean +4 per cent -6 per cent -3 per cent
(N) (10) (10) (15)
* See LeFebvre (1962) for complete table comparing observed and calculated CO. o outputs in pigeons when basic equation is modified by corrections for simplifying assumptions.
•* Lifson et al. (1955).
The comparisons of the calculated and observed rates of CO= output indicate that the D=O I8 method provides results in birds comparable to those obtained in small mammals (Lifson et al., 1955). Table 2 provides a summary of the mean errors obtained in this experiment and in the original study on mice (Lifson et al., 1955). The mean error (column A) is 8 per cent ñ 5 per cent (S.D.) and standard error of the mean is 2 per cent. In Lifson et al. (1955) the mean error was 7 per cent ñ 7 per cent (S.D.). It should be noted that Lifson used an equation corrected for in- validity of one of the simplifying assumptions (fractionation effects). In column B, the comparable values which would be obtained using the cor- rected equation are listed. Little real difference in the error resulted; only the algebraic bias differs between the two. calculations. In the flight ex- periment to be considered next, I have arbitrarily computed the rate of CO= output using equation B, because the published results previously cited have all been based on this equation.
In the validation experiment reported here, the D._,O •s method was found to be as accurate for CO= determinations for birds in a steady state of body composition as for mice and rats, and therefore is applicable to avian energy studies. In measuring the energy cost of flight, one would expect a non-steady state of body composition, particularly with respect to water and fat. However, Lifson and Lee (1961) found the isotopic determina- tions satisfactory (mean error ñ S.D.: 4 per cent ñ 4 per cent) for fasted rats in which body water decreased exponentially with time, and it may be assumed a similar situation holds true for birds. Actually, as will be noted later, the total body water did not decrease greatly during flight and the error from failure to adjust for changing body water was not as great as might be anticipated.

408 LEFEBvRE, Energy Metabolism of Columba livia [ Auk Vol. 81
II. FLIGHT EXPERIMENT
Method.--For an accurate determination of CO.2 production in flight, it is desirable to obtain blood samples immediately before and after an uninterrupted flight. To convert the CO2 output to the equivalent energy expenditure, it is necessary to know the composition of the "fuel" burned during the flight. The use of trained racing pigeons as experimental animals makes it possible to approach these requirements. Such individuals are conditioned to fly directly to their home lofts from selected re- lease sites and are conditioned to do so after being deprived of food for 24 hours or more before racing. Upon reaching the home loft area, a good racer usually goes quickly into the loft where it may be caught.
Preliminary tests indicated that pigeons in good physical condition could fly a 300-mile route in a time sufficient for accurate measurement of the decrease in specific activity. The anticipated technique for obtaining blood samples via heart punctures did not appear to affect the flight performance or behavior of the pigeons used in the preliminary tests. Following the actual flight experiment, each individual bird was dissected and examined for any gross indication of damage to the heart. None was evident; this agreed with earlier observations on anesthetized pigeons which demon- strated no apparent damage or trauma following heart puncture.
The flight experiment involved 31 birds. The pigeons had all flown in 300-mile races and some had participated in 500-mile events. Condition of the animals was comparable; all had been in good health and had been exercised frequently prior to the experiment. The flight route was familiar to each experimental animal from its racing experience. Of these birds, 22 (referred to as the experimental or flight group) were released at Allerton, Iowa, a distance of 300 miles directly south of St. Paul, Minnesota, and were allowed to return to their home lofts located at the southern edge of the St. Paul metropolitan area. Nine additional pigeons selected at random (re- ferred to as the preflight group) were maintained under conditions identical to those of the flight pigeons and were sacrificed just prior to release of the homing birds to obtain preflight data on water, fat, and protein composition. These data were used to estimate the initial water, fat, and protein levels in the experimental pigeons for purposes of estimating the energy cost of flight from material balance for comparison with the isotopic determination. Lipid was extracted from an aliquot of dehydrated carcass with diethylether in the Soxhlet apparatus, and nitrogen content was de- termined on the residual sample by the Kjeldahl method. Both techniques provided determinations with less than one per cent error in recovery tests. Total lipid and nitrogen determinations, however, were undoubtedly less accurate.
The pigeons were kept in individual cages measuring 12 X 12 X 12 inches and they were given a mixture of 99.5 per cent D20 and 1.5 per cent H.•O •s orally until a pre- determined minimum amount had been consumed. Three days were required to load the birds with isotopic water. Food was provided only on the first evening (29 July 1961) and was removed the following morning. Water was removed from the cages of the flight and preflight groups after dark on the second evening (30 July). On the third morning (31 July), the weather conditions and predictions appeared favor- able enough to warrant releasing the experimental birds.
Prior to release, the flight birds were weighed and initial blood samples were ob- tained via heart puncture. All were then released as a group. Following the flight, the birds were recaptured as they entered the home lofts, weighed, and the final blood samples obtained. Each bird was killed, placed in a plastic bag, and subsequently used for determination of total body water and total lipid content by desiccation and ether

July ] LEFE•VRE, Energy Metabolism o] Columba livia 409 1964
TABLE 3 C02 PRODUCTION AND ENERGY EXPENDITURE OF FLIGHT CALCULATED FROM
ISOTOPICALLY LABELED WATER
Mean wt /xt•b,a• /xt (flight) Average velocity Calc. CO•. Energy** Specimen (g) (hr) (hr) (mph) (mM/hr) (kcal/hr)
1285 398 8.6 (8.3) 36 159 24 2660 367 9.8 (9.2) 33 166 25 3208 345 8.1 (7.2) 42 97 14 4082 395 9.3 (8.4) 36 168 25 4084 387 9.4 (8.4) 36 175 26 2029 432 9.3 (8.4) 36 142 21 4012 361 12.1 (11.3) 25 102 15 4051 390 8.1 (7.5) 40 188 28
MeanñS.E. 384 9.3 8.6 36 150'+11 22ñ2***
N
Corrected for fractionation only: rCO2: •.08 (Ko, KD) - .015 KDN (Lifson et al., 1955). At RQ 0.707; 0.1485 kcal/mM CO'-, (Peters and Van Slyke, 1946).
Converted to weight-specific basis: mean value -4- S.E. z 58 -4- 9 kcal/kg/hr.
extraction. Because of the conditioning of these individuals, it was reasonable to assume that all flights were non-stop unless evidence showed otherwise. The energy requirement for flight was calculated by using the caloric equivalent for CO2 produced, with the assumption that in the flying bird only fat was being metabolized at an R.Q. of 0.71. This assumption was supported by the material balance results. Fasting quotients are obtained in pigeons and doves after 24 hours of food deprivation (Benedict and Riddle, 1929: 518). Since all food was removed from the holding cages about 36 hours prior to the flight release, these birds were in a fasting condition.
Results.--Thunderstorms occurred late in the day of the flight experi- ment and apparently forced most of the pigeons down. Of the 22 birds released, only 8 returned by evening of that day. Of these, 4 (nos. 2660, 4084, 4082, and 2029) showed indications of having landed (mud on feet, food in crops); the other 4 (nos. 1285, 3208, 4012, and 4051) apparently flew non-stop. Table 3 shows the time lapse from release to capture, aver- age flight speed, calculated CO2, and energy expenditures obtained for these eight pigeons. The mean energy expenditure per hour as calculated from the mass spectrometer data was 22 kcal -+ 2 (S.E.). Sample calcula- tions of the energy expenditure and raw data used for computations of Table 3 for one individual and values are provided in LeFebvre (1962: 41, 80-84). In the calculations of flight-energy requirements, the time interval between initial and final blood samples, • t (bid), was used to repre- sent the flight time. This use introduces some difference in the final values but the maximum so obtained (specimen no. 3208) was approximately + 2 per cent.
A comparison was then made between the caloric expenditures obtained from the D2018 method and the energy expenditures calculated from the estimated initial lipid content and the ether-extracted final lipid content obtained on each pigeon. Of the last two values (see Table 4), the former

410 LEFEBVRE, Energy Metabolism of Cohonba Iivia [ Auk Vol. 81
TABLE 4 SUMMARY OF PREFLIGHT PER CENT BODY CO1VIPOSITIOBI AND CYIANGE OF COMPOSITION
FOR EIGHT EXPERIZVIENTAL PIGEONS
Prefiight estimates** Postflight determinations*** Live
Speci- carcass* Total men (g) body water Fat Protein 4 Total body .X Protein (g) (g) (g) water (g) • Fat (g) (g)
1285 362.9 231.5 43.1 62.9 q- 4.1 22.8 +7.2 2660 332.8 212.3 39.5 57.7 - 8.5 -12.3 +1.5 3208 334.7 213.5 39.8 58.1 - 7.5 -23.6 -2.0 4082 367.7 234.6 43.7 63.8 - 13.6 -19.2 +6.3 4084 366.2 233.6 43.5 63.5 - 4.3 -24.6 +5.5 2029 412.4 263.5 48.8 71.3 - 14.3 -18.6 +0.5 4012 352.9 225.2 41.9 61.2 - 26.2 -21.1 - 1.6
4051 367.8 234.7 43.7 63.8 - 5.8 -25.3 +4.2
Mean 'q- S.E. 10.5 -q- 3.0 20.9 q- 1.5 3.6 -q- 2.3
• Live carcass = total live weight feather weight; total body water therefore represents body water of the cmcass assuming body water of feathers was negligible or normally was not part of the physiologically active body water compartment.
*• Based on average per cent body composition determined from nine preflight pigeons (see text) and the initial body weights of each experimental pigeon.
*• Based on actual postflight measurements on each individual (see text).
was obtained from the per cent body composition of the nine "preflight" pigeons; the latter value was determined for each sacrificed flight pigeon following the experiment. The estimated fat loss (protein loss was negligi- ble) was used to calculate energy expense of flight by assigning a caloric value of 9.5 kcal per g fat loss (King and Farner, 1961: 219). The total caloric expenditure divided by the time, At (m), yields the energy required per hour of flight. These data are presented in Table 5. The mean metabo- lism estimated from the computed fat loss was 22 - 2 (S.E.) kcal/hr. In this experiment the two methods for determining the energy metabolism of steady flight, one relatively direct, the other, an accepted material balance method, showed close agreement (cf. Tables 3 and 5).
There is no apparent difference in the results obtained from the four probable-stop birds and the four non-stop individuals. The average esti- mated flight speed of the probable-stop birds was close to that of the other pigeons, suggesting that non-flight time was relatively short. Furthermore, the energy expenditures, whether derived from the D20 •s data or the fat- loss data, were consistent with the relative flight speeds with the exception of one pigeon for each set of data (no. 3280, Table 3; no. 2660, Table 5). The exceptions noted do not invalidate the results from the seven remaining individuals in each set of data.
The data on changes in body composition of the flight pigeons (Table 4) are of special interest. The fat and protein losses were as expected, but the water loss during this experiment was unexpectedly small (mean = 10.5 g/bird/8.6 hr plus metabolic water, or 20.9 g fat x .107 g water/g fat,:

July ] LEFEBvRE, Energy Metabolism o! Columba livia 411 1964
TABLE 5 ENERGY EXPENDITURE O•' FLIGHT DETER1V•INED FRO•Vr THE ESTI3,IATED FAT LOSS
IN FLIGHT PIGEONS
Average Fat loss Caloric equivalent /Xt(b•d• Energy* Specimen velocity o! fat loss (mph) (g) (kcal/hr*) (hr) (kcal/hr)
1285 36 22.9 217 8.6 25 2660 33 12.3 117 9.8 12 3208 42 23.6 224 8.1 28 4082 36 19.2 182 9.3 20 4084 36 24.7 235 9.4 25 2029 36 17.6 167 9.3 18 4012 25 21.1 200 12.1 17 4051 40 25.0 238 8.1 29
Mean+S.E. 22ñ2**
If At (flight) were used to determine caloric cost/hr, a slight correction would be necessary resultiug in a mean energy expenditure of 24 q- 2 kcal/hr.
Converted to weight-specific basis: mean value ñ S.E. is 57 ñ 10 kcal/kg X hr.
32.9 g/bird/8.6 hr or 3.8 g/bird/hr). It is generally believed that the in- creased heat production associated with flight in birds is dissipated pri- marily by evaporative cooling (e.g., Yapp, 1956, 1962; Eliassen, 1963: 234-235) and estimates of water loss based on this concept suggest rela- tively high rates (Zeuthen, 1942). Zeuthen's (1942) calculated rates ap- pear too high; as noted by Raveling (Master's dissertation, Univ. of Min- nesota, 1963: 45) following Zeuthen, a 290 g pigeon would lose 190 g of water in an eight hour flight! The estimation of energy requirements in migrating Blackpoll Warblers (Dendroica striata) by Nisbet et al. (1963: 136) suggests that metabolic water can compensate for water loss during flight. Odum et al. (1964) present evidence for homeostasis in the nonfat components in the body during migration. Perhaps dehydration is not as great in birds in flight as has been generally accepted.
TABLE 6 CO1V•PARISON O•' ENERGY EXPENDITURE OF STEADY FLIGHTS WITH THEORETICAL
ESTIlV•ATIONS DERIVED FROM VALIDATION EXPERIMENT DATA
Calculated Flight metabolism D20 •8 data Specimen resting metabolism (resting kcal/hr X 8)
( kcal/ hr* ) ( kcal/ hr* ) ( kcal/ hr ) 1285 2.79 22 24 2660 2.57 21 25 3208 2.42 19 14 4082 2.77 22 25 4084 2.71 22 26 2029 3.02 24 21 4012 2.53 20 15 4051 2.73 22 28
Mean q- S.E. 2.69 ñ 0.07 22 ñ .5 22 ñ 2
* Calculations are provided in LeFebvre, 1962: 80-84.

412 LEFEBVRE, Energy Metabolism o! Columba livia [ Auk Vol. 81
DISCUSSION
The vadidation of the DsO •s method for determining COs production and energy balance in birds provides a basis for examining certain current theoretical work in avian bioenergetics.
Odum (1960a) has estimated the flight ranges for several bird species based on the actual lipid contents of the birds at the time of collection and some inferred value for flight-energy requirements. The energy cost of flight was calculated by using Brody's (1945:916) ratio for energy cost of sustained strenuous work to the energy cost of resting metabolism (c/. Brody, 1945:352 and 916, resting---- 1.5 basal). Brody's (1945) investiga- tion of the work capacities of horses led to his conclusion that strenuous work requires up to eight times the resting energy requirements, a con- clusion similar to that made for humans by Dill (1936). Pearson (1950) measured the oxygen consumption in the Allen's Hummingbird (S½lasphor•s sas•n) which provided a calculated resting requirement of 0.06 kcal/g/hr for one 3.5 g male, while the calculated hovering flight (strenuous work) requirement was 0.40 kcal/g/hr (assuming average flight weight of 3.5 g). These data provide a strenuous work energy to resting energy ratio of about 7, suggesting that Brody's (1945) relationship may apply equally well to birds. Although Pearson's (1950) original figures are high com- pared to those given in Lasiewski's recent studies (1962, 1963), this ratio is substantiated by Lasiewski's data.
This relation can be tested further with the data obtained in this study. If the observed values (Van Slyke) of COs output are used to estimate the resting metabolic rate for each of six pigeons of the validation experiment, the mean energy expenditure in the metabolism chamber is 7 q- 1 (S.E.) kcal/kg/hr (LeFebvre, 1962: 85). This value, which I shall assume is a reasonable one for approximating the resting metabolism, compares well with the resting metabolic rate one could calculate from standard metabolic rates recorded for pigeons (cf. King and Farner, 1961: 224). A resting metabolic rate for each flight experiment pigeon is found by:
7 kcal/kg/hr x mean weight (kg) x
The estimated resting metabolism is multiplied by the factor 8 to arrive at an estimated energy requirement for strenuous work (Table 6). The re- sulting mean caloric expenditure of 22 q- 0.5 (S.E.) kcal/hr may be com- pared with that obtained directly from the D.,O • data. These data further suggest (along with Pearson's and Lasiewski's work) that Brody's (1945) ratio for the energy required for sustained strenuous work to resting energy determined originally for mammals applies to birds generally, and specifi- cally to hummingbirds and pigeons. Hemmingsen's (1960: 61) analysis of the proportionality of maximal energy metabolism to body weight provides

July] LEFEBVRE, Energy Metabolism o] Columba livia 413 I964 J
TABLE 7 COMPARISON OF TIIE FLIGHT ENERGY TO RESTING ENERGY RATIOS DERIVED
FROM D20 TM METIIOD AND ZEI/TIIEN'S (1942) TIIEORETICAL CALCULATIONS
Zeuthen' s ratios Average Flight energy Estimated Ratios (modi]ied)
Specimen speed D,O •8 method resting energy ]light energy/ ]light energy/ (mph) (kcal/hr) (kcal/hr) resting energy resting energy
4012 25 15 2.53 5.9 5.9 2660 33 25 2.57 9.7 13.8 4082* 36 24* 2.82* 8.5 16.5 4051 40 28 2.73 10.3 21.6 3208 42 14 2.42 5.8 23.0 3208** 42 28 2.42 11.6 23.0
* The metabolic rates for four specimens (1285, 4082, 4084, 2029) were combined to obtain aver- age values. All had average speeds of 36 mph.
*' The D20 •s value for flight energy required per hour appears to be unusually low, suggesting a mistaken value. Because the fat loss determination shows such close agreement, on the average, I used the energy expenditure/hour represented by the fat-loss data for an alternative estimate for no. 3208.
tacit agreement that the ratio of energy required for strenuous work to basal (and resting) energy requirements is similar in birds and mammals.
Zeuthen (1942) in a study on the respiratory needs of birds has in- cidentally provided another set of interesting figures on the energy re- quirements of bird flight based on aerodynamic consideration. The flight metabolism as a multiple of the resting metabolism which his data provide can be compared with those obtained in the D20 •S flight experiment. For this purpose I have used Zeuthen's figure for flight to resting ratio for a speed of 25 mph and have extrapolated to obtain similar ratios for speeds represented by my pigeons. These results may then be compared to my flight energy to resting energy ratios listed in column (5) of Table 7. The agreement is only approximate, as one would expect considering the un- certainties involved in each set of calculations. Zeuthen's (1942) figures are derived from theoretical considerations and are judged by him to be only approximations good within - 50 per cent. It should be emphasized, too, that in the data for pigeons the speeds recorded may or may not represent close approximations to the true ground speed of each bird.
The significance of the isotopic method for ecological studies is obvious. The energy requirements of many wild organisms may be determined with greater certainty whenever the assumptions involved in the method are validated. Energy flow in ecosystems or main components of ecosystems are amenable to more direct determinations. Thus, aspects of the environ- mental physiology of wild species may be investigated with minimum ma- nipulation of the organism. In birds and mammals the energy cost of vari- ous activities of interest to investigators (e.g., migration, hibernation, in- cubation, etc.) may be determined directly without the need for greatly altered or artificial environmental situations.

414 LEFEBwE, Energy Metabolism of Columba livia [ Auk Vol. 81
SUMMARY
The D20 •s method for determination of CO2 production and other com- ponents of the energy balance (food intake, water turnover, and gaseous exchange) had been shown to be applicable to laboratory mammals by other workers. The method was extended in this investigation to pigeons for the purpose of validating this approach for metabolism studies in birds. The validation studies performed on ordinary common pigeons and racing pigeons gave a mean calculated CO2 production which is 8 per cent --- 2 per cent (S.E.) that of the observed CO2 production obtained by collection in concentrated KOH solution and analyzed by the Van Slyke manometric method. For the energy expenditure of flight, a mean caloric requirement of 22 -+ 2 (S.E.) kcal/hr was obtained for eight racing pigeons averaging 384 g in weight and flying a distance of 300 miles. Four of these birds apparently flew the entire route non-stop, while four showed evidence of having stopped (although the average flight speed suggests this was for a relatively short time). The calculations based on data obtained in this investigation indicate that energy expenditure in flight (sustained, strenu- ous work) is approximately eight times the energy expenditure of a resting domestic pigeon. This agrees with data obtained for man and large domes- tic mammals and supports previous estimates of the energy expenditure of sustained flight in small birds.
The results suggest further considerations of this method for studies of metabolism in birds.
ACKNOWLEDGMENTS
This investigation was supported by a research grant (GM-07345) to Dwain W. Warner from the National Institutes of Health.
I wish to acknowledge my indebtedness to the many individuals who aided me throughout this study, especially Mr. and Mrs. Rudolf Lange and Mr. and Mrs. Arnold Elmquist of the Twin Cities Racing Pigeon Club for providing the pigeons used in the flight experiments. Joyce LeFebvre aided me in the laboratory and field and offered many valued suggestions. Stuart Jacobson and Dwain W. Warner provided valuable suggestions and criticisms for which I am thankful. I am especially grateful for the assistance and guidance of Nathan Lifson throughout the course of this in- vestigation.
LITERATURE CITED
BEN•)ICT, F. G. 1938. Vital energetics: a study in comparative basal metabolism. Carnegie Inst. Washington, Publ., 503: 1-215.
BEN•t>ICT, F. G., ANt> O. Rmt>L•. 1929. The measurement of the basal heat production of pigeons. II: physiological technique. J. Nutrition, 1: 497-536.
BxoD¾, S. 1945. Bioenergetics and growth. New York, Reinhold. BaowN, R. H.J. 1951. Flapping flight. Ibis, 93: 333-359.

July] LEFEBvRE, Energy Metabolism o3 • Columba livia 415 1964 ]
BROWN, R. H.J. 1961. Flight. Pp. 289-305 in Biology and comparative physiology of birds, Vol. 2, A. J. Marshall (ed.). New York, Academic Press.
D•;•;, D.B. 1936. The economy of muscular exercice. Physiol. Rev., 16: 263-291. ELiASSEn, E. 1963. Preliminary results from new methods of investigating the physi-
ology of birds during flight. Ibis, 10S: 234-237. F•S•ER, R.A. 1934. Statistical methods for research workers. Fifth edit. London,
Oliver and Boyd. HEMM•NgS•N, A.M. 1960. Energy metabolism as related to body size and respiratory
surfaces and its evolution. Rep. Steno Mem. Hosp. and Nord. Insulin Lab., 9: 1-110.
KxNg, J. R., AnD D. S. FARNER. 1961. Energy metabolism, thermoregulation and body temperature. Pp. 215-288 in Biology and comparative physiology of birds, Vol. 2, A. J. Marshall (ed.). New York, Academic Press.
KnEmER, M. 1950. Calorimetric measurements. Chapter 6 in Biophysical research methods, F. Uber (ed.). New York, Interscience.
L^sxEwsx•, R. C. 1962. The energetics of migrating hummingbirds. Condor, 6•: 324. L^s•Ewsxx, R. C. 1963. Oxygen consumption of torpid, resting, active, and flying
hummingbirds. Physiol. Zool., 36: 122-140. LEE, J. S., ̂ ND N. Lxvson. 1960. Measurement of total energy and material balance
in rats by means of doubly-labeled water. Amer. J. Physiol., 199: 238-242. LEFE•vRE, E. 1962. Energy metabolism in the pigeon (Columba livia) at rest and
in flight. Ph.D. thesis, Univ. of Minnesota, 85 pp. Minneapolis, Minnesota. LIFSON, N., G. B. GORDON, AND R. McCLINTOCK. 1955. Measurement of total carbon
dioxide production by means of D•O '8. J. Appl. Physiol., 7: 704-710. L•vsoN, N., G. B. GORDON, M. B. V•SSCHER, AND A. O. Nma. 1949. The fate of molec-
ular oxygen and the source of the oxygen of respiratory carbon dioxide, studied with the aid of heavy oxygen. J. Biol. Chem., 180: 803-811.
L•vsoN, N., AND J. S. LzE. 1961. Estimation of material balance of totally fasted rats by doubly-labeled water. Amer. J. Physiol., g00: 85-88.
McCn•nzocx, R., aND N. LrvsoN. 1957a. Applicability of the D•O •s method to the measurement of the total carbon dioxide content of obese mice. J. Biol. Chem., 11116: 153-156.
McCL•Nxocx, R., AnD N. L•vson. 1957b. COe output and energy balance of hereditary obese mice. Amer. J. Physiol., 189: 463-469.
McC•;•Nxocx, R., AND N. L•vson. 1958a. Determination of the total carbon dioxide outputs of rats by the D•O •8 method. Amer. J. Physiol., 10g: 76-78.
McCn•Nzocx, R., AND N. L•vSON. 1958b. CO_o output of mice measured by D.•O TM under conditions of isotope re-entry into the body. Amer. J. Physiol., 10S: 721- 725.
N•s•zz, I. C. T., W. H. DROR¾, JR., AND J. BAreD. 1963. Weight-loss during migra- tion. Bird-Banding, 34,: 107-159.
ODOM, E.P. 1960a. Lipid deposition in nocturnal migrant birds. Proc. XII Int. Orn. Congr.: 563-576.
ODUM, E.P. 1960b. Premigratory hyperphagia in birds. Amer. J. Clin. Nutr., 8: 6214529.
ODOM, E. P., C. E. CONNEOn, ^N• H. L. S•ODD^RD. 1961. Flight energy and esti- mated flight ranges of some migratory birds. Auk, 78: 515-527.
O•)•rM, E. P., D. T. ROGERS, A•,m D. L. H•cxs. 1964. Homeostasis of the nonfat com- ponents of migrating birds. Science, 14,3: 1037-1039.

416 LEFEBVRE, Energy Metabolism o! Columba livia [ Auk Vol. 81
PE^RSO•, O.P. 1950. The metabolism of hummingbirds. Condor, 52: 145-152. PE^RSO•, O.P. 1954. The daily energy requirements of a wild Anna Hummingbird.
Condor, 56: 317-322. PETERS, J.P., aND D. D. V^• SLYXE. 1946. Quantitative clinical chemistry: interpre-
tations. Vol. 1. Second edit. Baltimore, Williams and Wilkins. R^SPE:r, A. 1960. Biophysics of bird flight. Science, 132: 191-200. W•LXXE, D. R. 1959. The work output of animals: flight by birds and by man-
power. Nature, 183: 1515-1516. Y^PP, W.B. 1956. Two physiological considerations in bird migration. Wilson Bull.,
68: 312-319.
Y^PP, W. B. 1962. Some physical limitations on migrations. Ibis, 1.04: 86-89. ZEUTaEN, E. 1942. The ventilation of the respiratory tract in birds. Kgl. Danske
Videskab. Selskab., 17: 1-50.
Minnesota Museum of Natural History, University of Minnesota, Min- neapolis 14, Minnesota.


![C R E D I T S - thetrove.is [multi]/Naruto (d20)/d20-Naruto... · This Naruto: d20 supplement is designed for use with the Naruto d20 and d20 Modern Roleplaying Game published by](https://img.pdfslide.us/doc/110x75/60afa37945ac8908e62fd7cc/c-r-e-d-i-t-s-multinaruto-d20d20-naruto-this-naruto-d20-supplement.jpg)