Embed Size (px)
Citation preview

G. Katz, A. Arazi
"The use of automated data collection, mining and analysis for future farm
management"
* S.A.E. Afiimilk, Kibbutz Afikim, Israel

2
• Introduction• Automated Data collection• Data mining and analysis• Summary
Outline

3
Raw Data
Standard Reports
Descriptive Modeling
Predictive Modeling
Data Information Knowledge Intelligence
Optimization
What happened?
Why did it happen?
Analytical on-line
Reports
Processed Data
What is going to happen?
What is the best that could
happen?
Data Collection, mining and analysis

4
* Free flow* Non-interfering measurement * Continuous real time acquisition of milk components * Data is acquired automatically for the individual cow during its milking
Real Time acquisition of milk components, yield and conductivity
Milk analyzerMilk meter

5
Behavior Sensor(pedometer + )How do we know how an animal feels?
Assuming an animal manifests its feeling by its behavior
there are numerous aspects of behavior
ActivityMoving – steps
LyingLying time Lying bouts
Calmness Restlessness
(option)
••Pedometer Plus measures:Pedometer Plus measures:--Activity Activity –– StepsSteps
--Rest time Rest time –– Minutes Rest bout Minutes Rest bout -- ##Antenna visits Antenna visits –– # # -- Calmness/RestlessnessCalmness/Restlessness

6
Sensors
Milk quantum and flow
Cow activity
Milk components
Cow weight
Milk conductivity
Cow behavior
Milking parlor
Energy balance
Devices and expertsDatabase &Management
Dairy experts
Row Data
Estrus detection
Individual feeding
Milk separation
Decisions &Reports
Cows welfare
Milking efficiency
Cows production
Calving detection
Health
Scheme for a Data Recording and ManagementSystem

Data mining and analysisMajor Goal:• Maximize Milk yield and Quality and
minimize the Cost of productionPrimary Factors• production• Feed ration• Health and welfare• Reproduction

Milk PaymentMilk Payment•ECM – Milk production, %Fat, %Protein, SCC
Schcolnik et. al, 2007
ECM
(NIS
) -1.04-0.09
0.00

• Feed ration ≠ Consumed ration
• On-Line milk component data → rapid detection of nutritional changes
Nutritional Information Nutritional Information --Control Nutritional Status Control Nutritional Status
Schcolnik et. al, 2007
-0.05 0.150.28
Fat
(%)
Prot
ein
(%)
0.01 0.010.05
Nutritional problems –> fat depression,Fat/Protein fluctuations -> energy efficiencyOr moldy feed

igh importance – Management where supplement of additional concentrate feeding is needed (pasture, robotic milking, fresh cows)
RC 2001 formula:
MI(kg/day)=(0.372*FCM0.75 + 0.0968*BW)*(1-e-0.192*(wol+3.67))
Nutritional Information Nutritional Information --Individual FeedingIndividual Feeding
Daily data required for calculation:FatProteinMilk yieldBody weightWeek of lactation

• Cow 2823
• Allocation concentrate feeding according to 4% Fat
Individual Feeding Individual Feeding -- ExampleExample
E. Maltz, personal communication
Over estimation of 60 kg concentrates by periodic test– most likely leading to further decline in fat

• Correlation between udder health and milk components
• Lactose and conductivity two of the most promising parameters (Pyorala, 2003)
Mastitis ControlMastitis ControlMastitis – Case Report – Commercial Kibbutz Farm
Lactose
Yield
SCC
Conductivity

Mastitis ControlMastitis ControlMastitis – Case Report – Commercial Kibbutz Farm
SCC
Conductivity
Lactose
Yield

14
Cow Health Monitoring Cow Health Monitoring ––Early Mastitis DetectionEarly Mastitis Detection
Behavior changes Behavior changes
significantly during significantly during one one
day priorday prior to milk drop and to milk drop and
sharp increase in milk sharp increase in milk
conductivityconductivity
(mastitis diagnosed in day 7)(mastitis diagnosed in day 7)
1500
2000
2500
3000
3500
4000
1 2 3 4 5 6 7 8 9
days
No.
of s
teps
0
100
200
300
400
500
600
700
800
Lyin
g tim
e (m
in)
Number of steps Lying time (min)
0
10
20
30
40
50
60
1 2 3 4 5 6 7 8 9
Days
Dai
ly m
ilk y
ield
(kg)
678910111213141516
Milk
con
duct
ivity
Daily milk yield Milk conductivity

Clinical Mastitis EventClinical Mastitis Event
Yield
Lying time
SCC
conductivity

Abdominal PainAbdominal Pain
Ѵ
Lying time
Lying bouts

Clinical Mastitis EventEye Scratching Injury Eye Scratching Injury
Ѵ
Ѵ
activity
Lying time

• Correlation between metabolic diseases and milk components
• Ketosis (NEB) – Fat/Protein Ratio (FPR)> 1.35-1.50 (Heuer et. al., 1999)
• SARA – FPR< 1.0 or more then 10% with fat<2.5% (Tomaszewski and Cannon, 1993; Nordlund et. al., 2004)
Cow Health Monitoring Cow Health Monitoring ––Diagnosis of Metabolic DiseasesDiagnosis of Metabolic Diseases

Diagnosis of Ketosis Diagnosis of Ketosis –– FPRFPR
FPR BHBA>1.4 (31.3%*)Sensitivity (%)
AfiLab (Laboratory)Specificity (%)
AfiLab (Laboratory)
>1.2 59.3 (90.3) 56.1 (37.4)>1.4 33.3 (45.2) 82.7 (75.5)>1.6 11.1 (25.8) 92.4 (92.8)>1.8 2.8 (6.5) 98.3 (97.8)
Schcolnik et. al., 2007
* % of cases with BHBA above threshold

Diagnosis of Ketosis Diagnosis of Ketosis ––MultifactorialMultifactorial ApproachApproach
1 SHI – Sound Health Indicators2 BHI – Bad Health Indicators
Livshin et. al., 2008
FPR cut off FPR + SHI1 filters + BHI2 filtersSensitivity (%) Specificity (%)
1.25 82.6 73.41.30 83.5 73.71.35 85.2 74.41.40 77.4 76.11.45 74.8 75.0

Ketosis Ketosis –– Case ReportCase Report
Ketosis events

Suspected SARA by Group Suspected SARA by Group

mean sd = 0.57 fat% , mean peak-to-peak = 2.16 fat %Comparing lab results to on line Analyzer for a typical Holstein cow
30 consecutive milking sessions in 10 consecutive days was sampled in the lab and by the analyzer (A.R.O farm, n=88 Holstein cows).
Max Peak to peak fluctuation for all cows during experiment session
Fat concentration fluctuations between milking sessions
The range of our ensemble for a given 10 days period
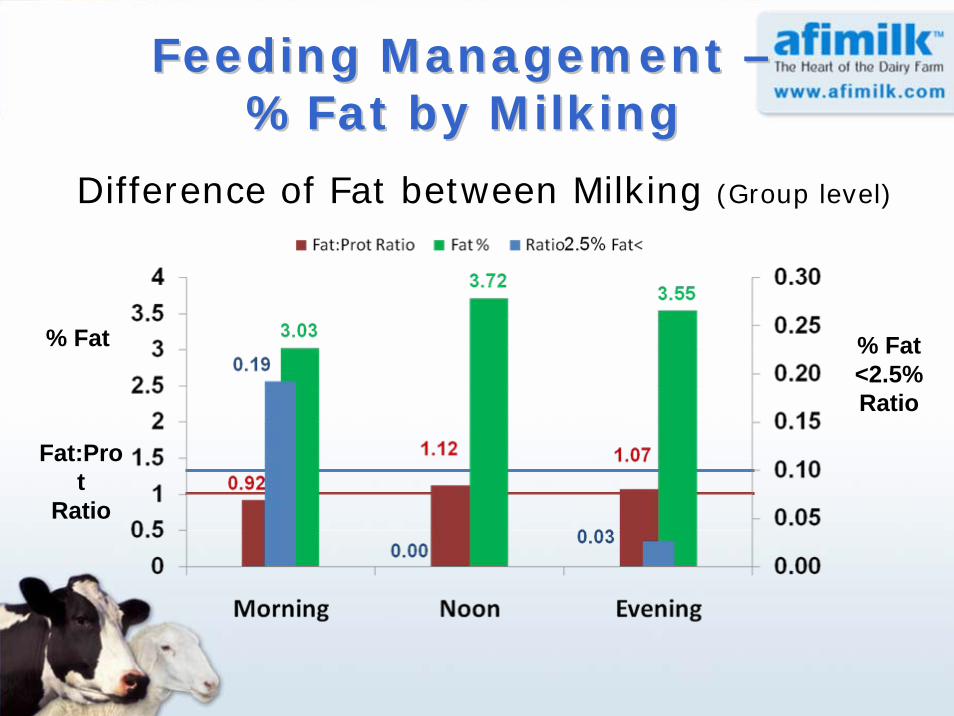
Feeding Management Feeding Management ––%Fat by Milking %Fat by Milking
Difference of Fat between Milking (Group level)
% Fat
Fat:Prot
Ratio
% Fat <2.5%Ratio
%FAT
Fat/Prot
Morning noon evening
Feeding Management Feeding Management ––%Fat by Milking %Fat by Milking

Heat DetectionHeat Detection
• Cows in heat are usually restless (walk more and lie down less)
• Heat detection through changes in lying behavior
Milk yield
Fat
Restlessness
Lying time
Activity

Normal Heat BehaviorNormal Heat Behavior

Silence HeatSilence Heat
Activity

Detecting Calving TimeDetecting Calving Time
•Helpful tool for daily routine plan
•Attend expected difficult calving
•Cows behavior changes prior to calving

Detecting Calving TimeDetecting Calving Time
Activity/Lying ratio in the last 7 days prior to calving
* P< 0.01 day -1 vs. day -2Maltz and Antler, 2008
A.R.O
*
Ѵ

Applied Research Applied Research DevelopmentDevelopment
and Cooperationand Cooperation

Applied Research Applied Research AfikimAfikimS.A.E. S.A.E.
• Cow health monitoring – Afikim farm
• Heat detection free stalls barns –Cooperation with Volcani Center (Israel) –Meimad farm
• Welfare and Comfort group level
• Deviation parameters for Pasture management – South Africa
• Pasture quality and availability information

• Improving calving time detection –Cooperation with Volcani Center (Israel)
• Heat detection in and management –Commercial farms - Germany and Poland
• Improve cow health and fertility monitoring – specification and timing – Integrated data
• Self feeding allocation – Afikim farm
• Crazy Elephants ?!!!
Applied Research Applied Research AfikimAfikimS.A.E. S.A.E. TeamTeam
Jerusalem Zoo

Academic CooperationAcademic Cooperation
uelph University (Canada)
•arly diagnosis of lameness cows
•arly detection of cows suspected for postpartum diseases - cooperation with Volcani Center

Academic CooperationAcademic Cooperation
Oregon State University (U.S.A.)
• Welfare and comfort – individual cow level
• Detect health problems and abortions
I.R.T.A. (Spain)
• Effects of group changing – behavior and production

Academic CooperationAcademic Cooperation
Volcani Center (Israel)
• Effect of group changing – Behavior, fertility and production
Virginia tec(USA)
• Genetic evaluation, Udder health
University of Florida(USA)
• Economic decision making in farm management

Thank you for your attention