Embed Size (px)
Citation preview
The use of 5S and TPM in a business
critical machine station within production
A case study at Parker Hannifin in Falköping
Bachelor thesis – University engineering
Industrial Engineering
Thesis number: 2017-15-03
Chingying Au-Yeung, S141785, Industrial Economy - Logistic engineering
Emma Andreasson, S143315, Industrial Economy - Business engineering
i
Swedish title: Användningen av 5S och TPM på en företagskritisk maskinstation inom
produktionen
English title: The use of 5S and TPM in a business critical machine station within production
Year of publication: 2017
Authors: Chingying Au-Yeung and Emma Andreasson
University supervisor: Håkan Svensson
Company supervisor: Claas Meyer
Examiner: Daniel Ekwall
Abstract: The project was performed at Parker Hannifin Cylinder Division at Falköping, where a station
in the most critical flow at the production has been studied, which is the hand welding station.
Within this report, the purpose is to identify disturbances, in order to eliminate and reduce
these by coming up with improvement proposals. Furthermore, the aim is to help improve the
company's work with 5S and TPM (Total Productive Maintenance). A combination of tools
and concepts are being used in this project when generating improvement proposals to avoid
the risk of falling back into old habits and facilitate the work. The combination of concepts,
intends to be continued to work with, in order to facilitate for the company to reach even
higher results.
The methodology of TPM is the basis of the project, although it is not about a complete
implementation of TPM, but is limited to chosen parts since it is a time consuming process
that can go on for years. The main focus of TPM is about the first pillar, 5S. Action plans for
how to solve these problems and how to achieve the desired state has been established.
Thereafter, the researchers in cooperation with the company´s staff have implemented a
couple of small improvement proposals. Further improvement proposals have also been
presented in this report, but due to the limited time no implementations was made.
Moreover, this project is divided into a couple of phases. Situational analysis has been made
through both interviews with staff and observation studies. Analysis has also been made by
some numeric data taken out by researchers and partly through mapping the equipment. The
intention of this is to create a status image of the current situation over the hand welding
station. The current state has shown the appearance of problems and challenges that exist.
Additional wastages and disturbances in the station can come up to the surface and can thus
easily be identified. In turn, occurring wastages and disturbances can be eliminated and the
amount of wasted time reduced with help of the action plans to reach a future state.
Another method that occurs is spaghetti charts. It has been used for mapping up the existing
procedures during the process of the orders in the station, and by that identified different types
of disturbances. In addition, the creation of a Value Stream Mapping (VSM) has been made.
The map is used as a measurement to identify how much time on a working day that is spent
as value adding time and non-value adding time of work.
Keywords: The 5 why, 7 + 1 waste, VSM, Spaghetti chart, TPM, The Eight pillars, 5S
ii
Contents Abstract: ...................................................................................................................................... i
1. Introduction .......................................................................................................................... 1
1.1 Background ................................................................................................................ 2
1.1.1 Problem Description.................................................................................... 2
1.2 Purpose ....................................................................................................................... 3
1.3 Research Question ...................................................................................................... 3
1.4 Limitations ................................................................................................................. 3
2. Method ................................................................................................................................... 5
2.1 Study methods ............................................................................................................ 5
2.1.1 Mixed method research ............................................................................... 6
2.1.2 Semi-structured interviews .......................................................................... 6
2.1.3 Quantitative data gathering......................................................................... 7
2.2 Validity ....................................................................................................................... 7
2.3 Reliability ................................................................................................................... 8
2.4 Data Collection methods: ........................................................................................... 8
2.5 Selection of literature ................................................................................................. 8
3. Theory ................................................................................................................................. 10
3.1 Lean .......................................................................................................................... 10
3.1.1 7+1 Waste .................................................................................................. 10
3.1.2 Spaghetti Chart .......................................................................................... 12
3.1.3 The 5 why? ................................................................................................. 13
3.2 Value Stream Mapping (VSM) ................................................................................ 13
3.3 Total Productive Maintenance, TPM ....................................................................... 15
3.3.1 The eight Pillars of TPM ........................................................................... 15
3.4 5S .............................................................................................................................. 19
3.5 Theory conclusion .................................................................................................... 21
4. Current state ....................................................................................................................... 22
4.1 Process Description .................................................................................................. 22
4.1.1 In-buffer ..................................................................................................... 22
4.1.2 Article number ........................................................................................... 23
4.1.3 Fixtures and tools in cabinets .................................................................... 25
4.1.4 Ergonomics ................................................................................................ 27
iii
4.1.5 Details and picking list .............................................................................. 27
4.1.6 Lack of material ......................................................................................... 28
4.1.7 Wagons ...................................................................................................... 29
4.1.8 Reporting ................................................................................................... 29
4.1.9 Out-buffer and Safety ................................................................................. 30
4.2 Paper with disturbances ............................................................................................ 31
4.3 Further Discoveries .................................................................................................. 33
4.3.1 The 5 Why? ................................................................................................ 34
4.4 Spaghetti chart .......................................................................................................... 35
4.5 Value Stream Mapping (VSM) – Current State ....................................................... 37
5. Analyze ................................................................................................................................ 39
5.1 Identifying wastes .................................................................................................... 39
5.1.1 Tube Rods shelves - Misplacement ............................................................ 39
5.1.2 Fixtures and tools in cabinets .................................................................... 40
5.1.3 Ergonomics ................................................................................................ 41
5.1.4 Picking list ................................................................................................. 41
5.1.5 Lack of material ......................................................................................... 42
5.1.6 Wagons ...................................................................................................... 42
5.1.7 Reporting ................................................................................................... 43
5.1.8 Out buffer and Safety ................................................................................. 43
5.1.9 Layout ........................................................................................................ 43
5.2 The 5 why ................................................................................................................. 48
5.3 Spaghetti Chart - After transport reduction .............................................................. 50
5.4 Value Stream Mapping - Future State ...................................................................... 51
6. Discussion ............................................................................................................................ 54
7. Recommendations .............................................................................................................. 56
8. Conclusion ........................................................................................................................... 57
References ............................................................................................................................... 58
Appendix ................................................................................................................................. 61
1
1. Introduction
The course of the thesis for the Bachelor of Science degree in industrial economics is taught
in the University of Borås. The course stretches over the spring semester of 2017 and includes
15 credits. The work has been performed at Parker Hannifin Cylinder Division Europe in
Falköping. The introductory section describes the background and purpose, the boundaries
that are made and the methods used.
Today's economy is characterized by rapid pace of production and global competition, which
also means that, companies needs to work hard in order to survive at the market in the long
run (Sörqvist, 1998). This can be done by improving performance and at the same time,
constantly improving their products and processes. Increased competition, faster delivery
times, higher quality products requires long-term focus on improvement work, which can be
achieved by using Total Productive Maintenance, TPM (Sharma et al., 2006).
When improving companies and processes, it is a benefit to have sustainable development in
mind. It is a concept characterized by three dimensions. A social- , environmental- , and
economical dimension. Achievements of these three dimensions are to be performed
individually as well as globally (Mignaqui, 2014). The concept is about a development which
is to ensure that today's needs are secured and that the goals of the future are not disrupted.
This project has its base within Lean Thinking and tools of Lean, which coincides with
sustainable development as both concepts seeks continuous improvements. People must see
the whole world as a whole system, and understand that any changes made, are changes that
are disturbing another part of the system. Some parts of continuous improvements are about
reducing wastes, cut down errors within production and reduce unnecessary transportations
and movements. This is an advantage seen from both environmental and economical
perspective (Gröndahl & Svanström, 2011). Referring back to Lean, 5S is a tool normally
used within businesses where Lean is being adopted and established. A tool is used in a right
way, resulting to increased quality, productivity and safety (Bicheno, 2013). Comparing this
with sustainable development, it is can be related to the three dimension environmental,
economical respectively the social dimension.
All around the world, organizations have become more aware of the benefits of taking
responsibility for their actions with the impact that follows. The result is that an even bigger
interest has been raised for these questions, regardless whether the companies themselves
contribute to a small or big impact. Taking responsibility for its impact can contribute to
positive effects such as increased reputation and competitive advantages, having the ability to
attract employees and customers (Porter & Kramer, 2009).
Increased competition means that more companies are being forced to work in order to reduce
costs and lead times (Bergman and Klefsjö, 2012). The requirement for quality also increases
which requires work of change and improvements (Sörqvist, 1998). In order for a company to
become more competitive, the employees needs to feel involved, motivated and participated
which in turn creates commitment. Kaizen is one conceptual tool where every individual is
supposed to be involved within, as it refers to small continuous improvements, becoming a
part of the regular work. At the same time, it is important that the manager participates and
supports the employees. Nevertheless, this is done by identifying what activities from a
customer perspective that are value adding and waste, and gradually reduce waste with help of
2
teamwork, generation of ideas and problem solving which has an important role regarding a
successful company. Motivation increases among individuals, while the individual gains a
more secure employment and companies are gaining a better profitability. Sustainable
economic growth is the basis for more jobs as well as for long term sustainable social
conditions, while the community receives more tax revenues in order to drive forward
(Emerald insight, 1997).
Study has shown, for companies adopting the methodology of 5S to a great extent, the
perception is that significant improvements have been made in both quality and productivity.
Change in the productivity is achieved as reduction of non-value adding time. A number of
defective products could also be seen. In addition, workers no longer need to spend much time
in looking for tools and equipment. Hence, they are more comfortable in the working place
(Bayo‐Moriones et al., 2010). From a company perspective, it is important to be examined
with regard to productivity, visualization where problems easier come to surface and
reduction of wastes in production. Moreover, this study is important to carry out in correlation
with better environment for the workers such as ergonomics and safety. This also coincides
with the case company which is Parker Hannifin in Falköping.
1.1 Background
Parker Hannifin's history dates back to 1917, when it was founded by Arthur L. Parker. At
first the company was called Parker Appliance Company, which then came to be developed to
Parker Hannifin Corporation. In 2014 Parker achieved its highest sales of over 13 billion USD
in total. Today, Parker is the world's leading diversified manufacturer of motion and control
technologies with 57,500 employees worldwide in 50 different countries (Parker.com).
It is possible to find Parker in and around the most moving things. Advanced components and
systems are manufactured in order to simplify the movements and flows of both liquids and
gases. It is in a great variety of uses globally where these are used (Parker.com).
Parker Cylinder Division Falköping is part of the "Parker Manufacturing Sweden AB," which
in turn is a part of the "Parker Hannifin Corporation". The production site has currently 75
employees. In the production of hydraulic cylinders, many different types of machines are
used. These machines are important to different degrees for the production. In this thesis, it is
planned to study a machine station in one of the company's critical areas within the
production (Parker.com).
1.1.1 Problem Description
The production in Falköping has been divided into three parts; mantle, piston rod and
assembly. Currently, the process of mantles is the most critical part and the one that is facing
the most issues, hence it is this part that the work will take the direction towards. The process
flow of mantles consists of five stations. The opportunity to choose between two critical
machine stations was given, "skiving machine" and "hand welding". The main reasons that
these two machine stations were selected are partly because they are most timely possible to
3
study/improve for this thesis equivalent to 15 credits. At the same time, similar work has
already begun with improvements in two of the other machine stations in the process.
After having observed both machine stations with care, the hand welding station were finally
selected as the machine station to be studied. This is because the plurality of improvement
proposals in various areas. Moreover, it was the one that felt the most possible to handle
within the time frame. The hand welding is the final stop in the mantle flow and is staffed by
one, sometimes two operators per shift. It is a station where the operators perform the work
manually.
Parker in Falköping has been using 5S methodology during a longer period, but in a way that
has not been as successful as desired. This has led to the fact that some contradiction has
come to appear with employees regarding the concepts, mainly in production. This study
therefore aims to see how 5S and TPM can be improved within the company.
1.2 Purpose
No stream is effective and flawless enough that improvements cannot be done. From this
work, which sorely will include 5S and TPM, the purpose is to highlight the problems that
exist in the current situation for the hand welding station. Further purpose of the thesis is to
suggest improvement proposals mainly within the elimination of wastes, restructuring and
layout. The purpose is also to make small implementations of the proposed improvement
proposals together with the team in the areas of 5S.
The goal is to answer the questions comprehensively, and further give Parker a basis for
possible improvement proposals to promote the business.
The setup of the goal of the project is as follows:
Create a status image of current situation over the hand welding station partly through
interviews with staff, and partly through mapping of equipment.
Identifying wastage or losses in the station to eliminate or improve them.
1.3 Research Question
What improvements within 5S and TPM can be done to the machine station hand welding?
1.4 Limitations
There are several different machine stations within the company's various processes, but the
project is limited to a specific machine station. The station is within one of the company's
critical areas of production, the so called hand welding. This limitation is to prevent the thesis
from becoming too large and extensive, since it is easy to get outside the box. The limitation
is also made with respect to the set time limit. A crucial statement that has to be done with
4
this though is that the researches do not recommend only improving and making one part of
the process flow more effective. That would only lead to suboptimization, which could lead to
negative effects. What is being done in this project is to come up with improvement ideas for
the hand welding station, which if the company approves, are to be implemented in a rate with
the rest of the flow. Also, due to the limited available time, it would not have been possible to
do a proper analysis of all the machines in the production flow at Parker and collect more
different types of data. Thus, what can be added is that other stations in the same flow are also
under similar investigation during the time of this project by the company.
It is also important to point out that limitations are made within the amount of theory. Only
some areas within TPM will be discussed, due to relevance of what is investigated. With all
these limitations in mind, the researchers wants to make an exhortation about what is not
possible to take under consideration during this project, which can influence the conclusion.
5
2. Method
The chapter describes different methods that were used during this study. There are methods
related to the scientific approach used, as well as two different methods in order to collect the
most important empirical data. Furthermore, the following chapter also presents the study's
validity and reliability.
The work at the company will include different steps:
Analyze the current situation
Comparing the current situation with literary theory
Bring out improvement proposals/ideas
Together with staff/team at Parker make small implementations within 5S
Moreover, the practical method consist of visiting the company, watching the process for the
welding machine, talking to the people who are working with the machine (producer,
technicians, warehouse personnel, manager), observing the current situation for the welding
machine/station, how the materials input and output to and from the machine works, its
dependence, and how the machine is planned. After analyzed the practical barriers and
proposing improvement proposals for the company, a small part of 5S has been implemented
together with the team. Only small implementations have been made due to the time limit.
Information will be gathered from staff who is either working or is involved with the
machine. Knowledge of the area regarding the welding machine/station as well as their views
on the approach, opportunities for improvement, unnecessary additives and wastes are
examples of things that the staff will be consulted.
Considering that there are few people who work with the machine being investigated,
interviews has been conducted. This is to get as much information about the machine station
as possible and be able to get developing responses and opinions/thoughts/ideas from the staff
who work at the station, which can be difficult to get out from questionnaires. Since
consideration is made to the fact that two shifts prevails, and that a service technician and
scheduler are involved in the machine's reality, this leads to an extent of a small group of
people. This means that all persons involved around the station are included to get access to as
much collection of data as possible. In addition, this also leads to that different aspects can be
taken into account and, above all, that everyone feels involved and participated in what
happens, which is something that is advocated within Lean.
2.1 Study methods
Different methods have been used during the procedure of this project. This, in order to gain
the work as much as possible using different techniques for different purposes. Below follows
what different method techniques are used with description of why and how.
6
2.1.1 Mixed method research
This project has used both qualitative and quantitative methods. Only using a qualitative
method for example, observations or structured interviews do not give as much empirical data
to answer the studied questions as needed. Neither does a single quantitative method result in
sufficient data for the project. Therefore, a mixed method research approach has been used.
Bryman (2011) mentioned that the purpose of the mixed method research is to fill in gaps that
one single method leaves behind by combining different methods.
2.1.2 Semi-structured interviews
Qualitative interviews are one of the methods, which have been used in order to achieve a
great result for this project, through the gathering information about the welding station. In
qualitative research, interviews are the most used method pursuant to. Mainly, interviews are
flexible, which makes it more useful and a lot easier for adaptation in varying and different
situations. Furthermore, respondents´ feelings, opinions and experiences are continuous in
focus. The interviews´ structure makes it easier for the respondents to feel more comfortable
and free in order to get insight in what they consider both as important and relevant (Bryman,
2011).
Semi-structured interviews took place during the collection of data. Starting with open
questions that gradually became more detailed, allowing new ideas to be brought up during
interviews. By initiating the interview with more general questions can make it easier for the
person being interviewed to feel a lot more comfortable and less exposed, which leads to a
more natural communication (Patel & Davidsson, 1994). An interview guide consisting of
different type of questions was prepared (see appendix 8) which made it easier to adapt to
different situations and participants. However, it allows the researcher to develop and ask
questions more freely, rather than following a strict template of questions. A semi-structure
also allows the researchers to develop questions a lot more deeply, when adapting to different
situations (Bryman, 2011).
Furthermore, there was two researchers who conducted all the interviews, and with only one
respondent each time. During the interviews, one researcher asked all the questions, while the
other one took notes. The reason for this approach is in order to avoid as much variation and
differences as possible during the data collection, all the interviews were handled in the exact
same way. Moreover, in order to understand the working process within the working area,
observations were made by the two researchers. At the same time as the interviews took place,
the operators answered the questions, and most of the time went to explaining and showing
how things worked and the existing problems.
An interview guide was followed at the interviews with each operator. This was done in order
to get as reliable information as possible, and provide the same preconditions for the
7
operators. Several interviews were conducted with each operator, and each interview was
unique, where new information was generated in each interview.
2.1.3 Quantitative data gathering
Quantitative research is a methodical way for the gathering of numerical data, later used to
create statistics and analyze the results. A relatively large portion of the quantitative research
data collection is based on theory, that serves as a not too strictly formulated interest
alignment from which the researchers collects his data (Bryman, 2011). Quantification is a
matter of the degree of precision in the observation. If precise observations are desired, the
data must be objectively measured. A researcher has to perceive his field of research as an
object to be observed, with respect for one or several variables (Andersen, 1994).
During this project, measurements have been made in order to create a Value Stream Mapping
(VSM) of the current state in the station. The VSM are to be used as a way of measuring time
in this project. In order to create a VSM, the average size of an order was taken out, followed
and observed as it was processed in the hand welding station.
Data was observed in such way that one researcher measured the time it took for the order to
pass through the process, and the other researcher made a spaghetti chart. Time for the
process overall (lead time) and the time for individual parts in the process (cycle time) and
downtime was measured. This procedure was repeated and made for several different orders
to collect sufficient data in order for calculating the average time for an order of average size,
and get a picture of the different transportation routes that are made.
Another quantitative data gathering that was made was the construction of a paper listed with
different types of disturbances that show up during a work day, which was set up at a tool
cabinet in the area of the machine station. The waste alternatives listed on the paper are
formulated based on information from the qualitative interviews made with the operators. The
operators gave information about problems turning up during the day, forcing them to erupt
working with what is seen as value adding work at the station.
The placement of the paper was carefully determined, which was in a highly visualized area
so that the operators would not miss to make marks on it. This, in order to ensure that as
reliable data as possible was gathered. The paper was hanging on the tool cabinet and then the
researchers took it down. An estimation could be made of how many times different wastes
showed up at the station during a longer period, giving the approximation of times in a week.
Each waste is based on operator's responses, said to take an X amount of time.
2.2 Validity
Validity is concerned with whether what is measured, really is what is supposed to be
measured (Bryman, 2011). In order to increase the validity of the work, knowledge and
8
information was taken directly from the source, that is, an actual person or measurements at
Parker. The collected information was summarized and documented as quickly as possible in
order to avoid distorted information.
A part of the task was to make a map of the current situation and in order to do so, spaghetti
diagrams and a Value Stream Mapping was made for the station. The study gave data about
how the current process in the station worked.
2.3 Reliability
Reliability concerns the issue of the reliability of the overall information. Whether a new
investigation would show the same results if it is performed again, or if the random and
temporary conditions affect the result. During quantitative investigations and data gathering,
the question whether a measurement is stable or not is of interest (Bryman, 2011).
As investigations and measurements are important parts of the project, data gathering has
been made during a longer time in order to control and strengthen the reliability.
2.4 Data Collection methods:
Data collection can be done through different approaches. There are two ways to go, the
collection of primary data and secondary data, both of these will be used for data acquisition
in this report. Primary data is data that the researchers himself collected and are therefore not
available previously. To exemplifying this, the collection can be done through surveys,
interviews or observations. Secondary data is when there exists information that has been
published literature on the area and is collected by other people (Lundahl & Skärvad, 2000),
(Eriksson et al., 2001).
2.5 Selection of literature
The first step in the study was using the database Summon, searching for scientific articles. It
was done to assemble relevant theories for the interconnection of the study´s aim. Summon
has also been used in the search of methods and ideas on how the company can improve the
efficiency of the maintenance work. Below is a selection of the keywords used in the article
search:
5S
TPM
5 Why
Lean
The Eight pillars
VSM
Spaghetti chart
9
The secondary collection method was required to compile the theory in which relevant
literature is used in order to answer the research question. The secondary source that has been
useful is the library, which was located at Borås University library.
Searches for relevant information and facts have also been made using the database Google,
these searches have similar keywords mentioned above.
Primary data has also been used in this study, where the two researchers collected data by
themselves through interviews with the operators. Observations have also been done by the
researchers.
10
3. Theory
Following chapter describes different literary theories used as a basis for the study.
The literature support methodologies, tools and concepts that have been used in a scientific
approach. Furthermore, the chapter presents the meaning and approach of the different
studied areas brought up.
3.1 Lean
Lean is a manufacturing philosophy, where the purpose is to maximize customer value while
eliminating all types of waste. It is critical to identify different types of activities and
processes, which are called value streams in Lean (Womack and Jones, 2003). Accordingly
to Womack and Jones (1990), the fundamental ideas of Lean production are universal, and are
applicable anywhere by anyone. First brought to live within vehicle manufacturing, Lean
Thinking has been transferred to many other industries. Referring to manufacturing and
production, being Lean involves eliminating waste which is absolutely not essential for
production, for example the minimum amount of equipment, materials, parts, and working
time (Shamah, 2008).
Lean Thinking which is: specify value, identify the value stream, let the value stream flow, use
“Pull” instead of “Push”, as well as working towards perfection where the five principles
must be met in order to implement Lean in a company. It is important to focus on getting the
products to flow constantly through a “one piece flow”, in order to handle the Lean concept.
Also, it is necessary and important to manage to deliver products or services that is based on
customer needs, and that is called the Pull system.
Lean thinking can be divided into two parts or perspective. Relating to guiding principles and
overarching goals, it can be seen from a philosophical perspective. From the other point of
view, Lean can be considered from a practical perspective, within the set of management
practices, techniques or tools which can be used and applied directly (Boyle et al,. 2011)
Lean also focuses on reducing cycle time, increasing flexibility and improving productivity
(Hobbs, 2004). Knowledge is essentially distributed in Lean because reduction in waste is
considered as a common responsibility, where all the employees in the organization are
included (Brown et al., 2008). Lean covers aspects such as workflow management, culture of
minimizing waste as well as continuous improvement. The process by always striving for
continuous improvements through elimination of waste or non-value adding activities is the
driving force of Lean manufacturing, such as 7 + 1 types of waste categories (Burton and
Boeder, 2003).
3.1.1 7+1 Waste
In order to create value for the customer, it is extremely important to identify and eliminate
wastes. The 7+1 wastes describes as overproduction, waiting, transportation, over-
processing, inventory, motion, defects and non-used employee talent according to Liker
(2012).
11
1. Overproduction
Producing more than needed, making or delivering too much, too early or to build up safety,
which leads to a creation of wastes through excess inventory. It also creates unnecessary
stock-keeping, transports, and also unevenness of the material flow (Liker, 2012).
Overproduction is often classified as the most serious waste of them all, as it lays the
foundation for many other problem and different types of waste (Harrison et al., 2014).
Overproduction also prevents the smooth flow of products and services. Instead, the goal
should be to manufacture what actually is required, neither more nor less (Ohno, 1988).
2. Waiting
Waiting takes place whenever time is not being used effectively. When this happens, no value
is being created for the customer (Liker, 2012). Waiting times are a big enemy at regular
flows. It is not an ideal situation when the product is waiting. The same applies to operators
and other employees as they are waiting for new duties to show up, which leads to wasted
time. Waiting can also appear due to material shortages, production delays or bottlenecks that
occur in the process (Harrison et al., 2014).
3. Transportation
Unnecessary transportation adds no value to the customer, which is defined as a waste of
resources. Double handling, conveyors and movements by forklift truck are a couple of
examples of this kind of waste. By placing processes as close as possible to each other does
not only minimize the waste of transport, but also improve communications between them
(Liker 2012; Harrison et al. 2014).
4. Over-processing
Over-processing is to fulfill additional work that the customer is not willing to pay for (Liker,
2012). It normally occurs when the process consist of too many activities, poor tools or when
a higher quality than the customer requires is achieved. However, inefficient process can also
leads to over-processing. Duplication of documentation is a common example of work that
exists in most businesses. It implicates that multiple people are documenting the same things
(Harrison et al., 2014).
5. Excess inventory
Excess inventory arise due to overproduction, and is also a sign that flow has been disrupted.
Furthermore, inventory is often the main source to other hidden wastes, but it can also
increase both lead times and space requirement which is considered as a serious problem
(Liker, 2012).
There are three kinds of inventory: raw materials, WIP (Work In Process) and finished
products. All these inventories are different forms of waste. However, there are a couple of
differences in why they exist and how they can be reduced. Storing raw materials can
sometimes be necessary, as there may occur problems with the suppliers regarding quality and
12
reliability. Stocks of finished products can sometimes also be seen as a necessity, but should
still be considered as a nuisance (Ohno, 1988).
6. Motion
Motion occurs if operators have to bend, stretch or extend themselves unduly. These kinds of
movements can be classified as waste (Liker, 2012). It has an immediate impact on
themselves and the quality and productivity of the plant. To exemplify this, the machines can
have an improper layout at the workplace which can cause the unnecessary movement. The
unnecessary movement can be repeated many times a day without anyone notices it (Ohno,
1988).
7. Defects
Defects occur when the product or the service does not meet the specific requirement that is
needed. This can arise when a product or component is incorrect. Producing defects costs both
time and money, whether it is in short or long term (Harrison et al., 2014). The internal errors
can be scrap, rework and delays, while the external defects can include warranty, repairs and
potentially a loss of customers. These quality costs to correct errors have the ability to
increase the longer they remain undetected (Ohno, 1988).
(8). Non-used employee talent
Non-used employee talent occurs when the organization loses ideas, solutions and
improvements (Liker, 2012). Unused skills are considered by many to be the worst form of
waste. In order to counteract this waste, it is effective to establish an improvement program
where all the employees have to be involved by having a broad commitment to improve the
ability to make improvements and not just changes (Ohno, 1988)
3.1.2 Spaghetti Chart
In a business, transportations and movements is unavoidable, but a fair amount of it can be
controlled so that unnecessary transportations and movements are avoided. To get an
approximate picture of how the physical stream looks in for example a process, a spaghetti
chart can be made (Petersson et al., 2015). The method aims to get a visualized picture of the
transportation and movements in processes and streams (Bicheno 2013). The method can be
used to map the transportation of material, tools or products as well as the transportation
movements of operators. Furthermore, a version of the method can be used to follow
administrative errands.
The course of action of this method is to, in detail, follow the chosen object and draw every
movement of it in a layout over the area. Every movement represents one drawn line in the
layout. It is from all these lines resulting, like boiled spaghetti, the method has been given its
name (Petersson et al., 2015).
13
After getting a visualized picture of the present situation, the method aims to analyze what
transportation routes that can be eliminated (Petersson et al., 2015). If some movements are
unnecessarily repetitive and can be made in less movement, or if some materials can be
moved to another place to completely eliminate that route. This can be concluded from a
spaghetti chart and new drawings of the work area can be performed. The purpose with this
method is to minimize waste and transportation movements in order to save time (Bicheno
2013).
3.1.3 The 5 why?
The 5 why is a conceptual tool commonly used in Lean manufacturing, used to find the root
cause to why a problem has occurred. The concept of it is to ask the question “why?” when a
problem is occurring. The question is not just asked once, but at least five times, in order to
arrive at the root of the problem so that it can be eliminated and not just temporarily solved or
solved at the surface. When the first why is answered, the second why is based on the answer
of the first why, and so on, until the underlying cause of the problem is stated. Hence, 5
analyzes are made. In practice however, there are not always simple and straightforward
answers to problems related to manufacture. It often has a lot of depth and breadth, and
therefore the 5 why analysis could be seen as both corrective and preventive of problems
(Murugaiah et al. 2010; Ohno 1988).
In order for it to be possible to find the root cause, the deviation has to be specific, it is not
possible to analyze a big amount of deviations. Although, there might be several reasons for a
problem, it is only possible to analyze one of them at a time (Petersson et al., 2015). The 5
why analysis provides a structured and fact based approach to identification and correction of
problems when applied. It can among others help companies improve the overall equipment
efficiency, breakdown, time-loss and customer complaints. The solutions do not necessarily
have to cost a lot, in fact inexpensive or zero cost solutions can be used to implement or
eliminate defects and waste (Ohno, 1988).
The use of the 5 why tool, can for example benefit in decreased costs, leveled production,
reduced lead times, continuous flow production, lower inventories, higher productivity and
increased job satisfaction for employees (Murugaiah et al., 2010). It is also important to state,
that the analysis focus on the way of working, not individuals, requiring leaders to take
responsibility and making sure that individuals do their best. If something still goes wrong, it
is the conditions such as tools and the way of working that shall be questioned. In this way, a
positive climate arises where the workers actually want to bring to surface those deviations
that have occurred (Petersson et al., 2015).
3.2 Value Stream Mapping (VSM)
A Value Stream Mapping can be a valuable support in the work with how the stream of a
process can be improved and more effective. It is a powerful and effective method in its
simplicity but using it in a wrong way can be counterproductive. It originates from the Toyota
14
Production System and consists of both value stream analysis and value stream design
(Petersson et al. 2015; Haefnera et al. 2014).
The course of action of this method can be divided into three major steps. The first step is to
map the current state of the process. This step requires that today's process in detail comes to
knowledge (Petersson et al., 2015). Process mapping is a graphical illustration method using
paper and pen (Jarebrant et al., 2015). Making use of flowchart symbols also allows showing
the sequence of activities (Haefnera et al., 2014). The mapping is made from incoming
material all the way to out loading. As the method is commonly used in manufacturing, which
in general handles many different streams of production, a chosen product family is often
picked to be followed through the stream. This, to be able to carry out the mapping within a
seasonable input of resources. Example of data that can be used in the VSM is lead time,
defined as the time spent on one piece from the beginning of the process stream to the end of
it (Jarebrant et al., 2015). Other examples of process data that can be included in the VSM is
process time, cycle time, setup time, lot size, buffers and number of operators (Petersson et al.
2015; Jarebrant et al. 2015). Definitions of key concepts´ importance will be made below, in
order to remove any ambiguity.
The second step is to develop a desired future state. Here different Lean principles can be
effective as support for the identification of improvements. In this step, the aim is then to have
created a new VSM that is desired. The map over the future state should be drawn in the same
way and with the same symbols as the one for the current state (Petersson et al. 2015;
Haefnera et al. 2014).
The third step is to create a plan of action. It includes what to be done, when it shall be done
and who that is responsible. The plan of action aims to take the business or process from
current state to a future state. To start with the work of improvements, it is important that the
idea of the future state is broken down to smaller parts. These are to be of a more manageable
task of work, since the transformation from current to future state can be a quite massive task
to fulfill (Petersson et al. 2015; Jarebrant et al. 2015).
The more often a plan of action is followed up, the better it usually gets. By doing this, it can
lead to among others, a clarification of the importance of the work and a continuity of the
work. It is also more likely that the work gets done in the set time frame and deviations in the
work of improvement is more easily found (Petersson et al., 2015).
15
Key concepts regarding VSM:
Cycle time (C/T) = The time taken from an article to came out of the process until the next
article comes out of the process
Downtime/Setting time (S/T) = The time it takes to switch from production of a output
variant to another.
Lead time (L/T) = The time it takes for a product to move from start to finish in a certain
process or a specific flow.
Value adding time (V/T) = The time in a process which the customer is willing to pay for
(Rother and Shook, 2004).
3.3 Total Productive Maintenance, TPM
The idea behind TPM originates from the US when Nakajima started studying American
production in 1950 and managed to develop the system of TPM. But it was not until TPM was
introduced in Japan 1971 that it saw major success. Total productive maintenance (TPM) is a
holistic concept and an approach where maintenance is aimed to increase the overall
equipment effectiveness and develop the company's productivity processes. The main idea is
that as many parts as possible of the maintenance work should be accomplished by the
operators themselves. Thus the operators and maintenance department should work closer
together and as a team (Nakajima, 1992). The goal of TPM is firstly to change the corporate
culture by creating committed employees, and thereafter reduce all types of losses in order to
achieve zero defects (Ljungberg, 1997).
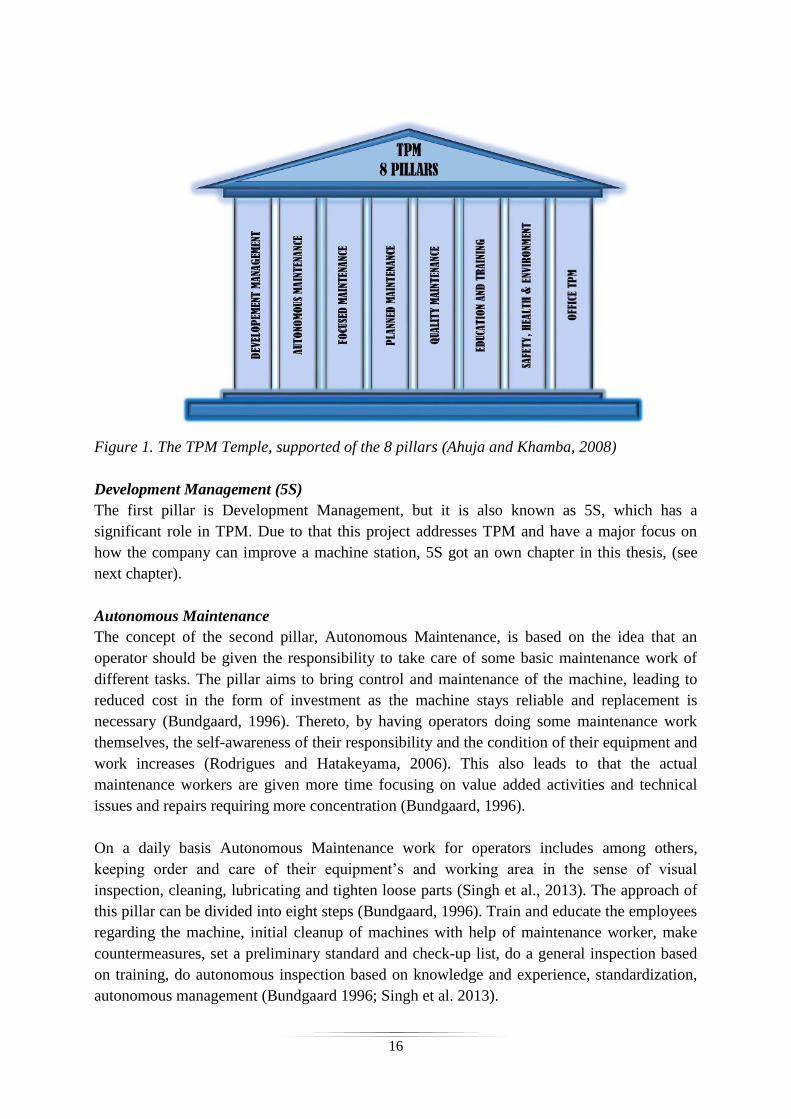
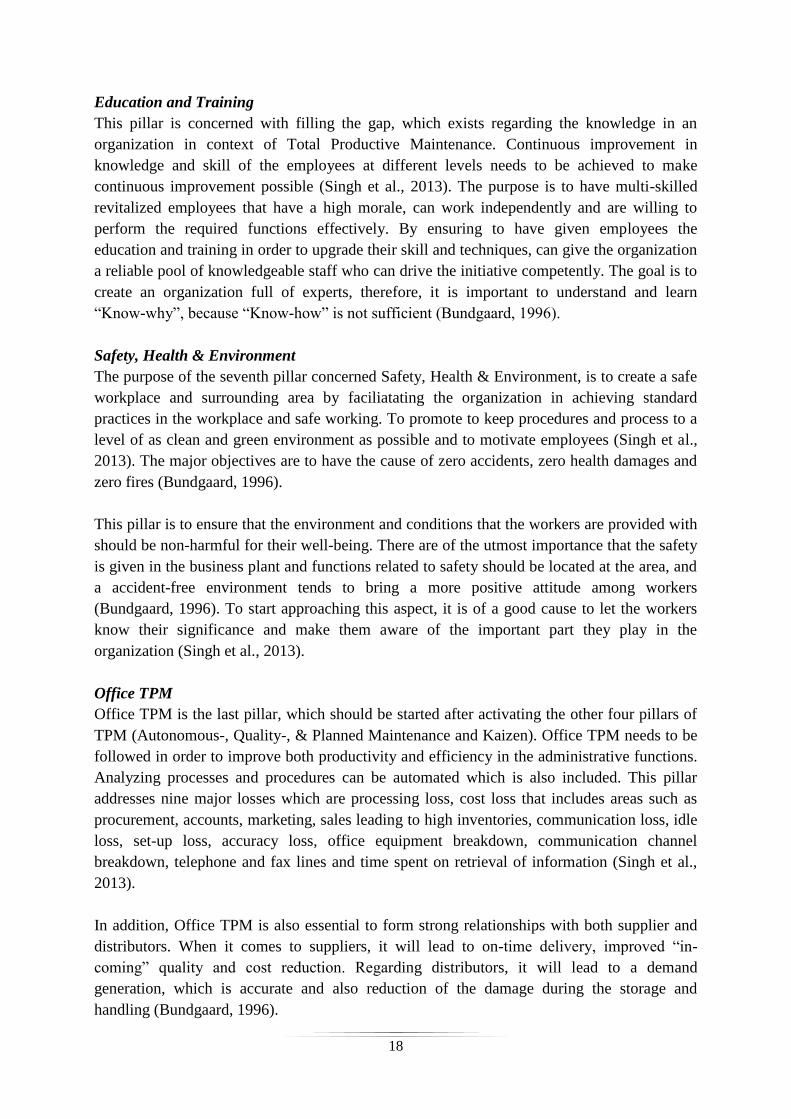
3.3.1 The eight Pillars of TPM
The eight pillars are a fundamental basis that represents the meaning of TPM. The pillars have
a dimensional focus on productivity, quality, customer attendance, safety and morale
(Rodrigues and Hatakeyama, 2006). TPM gives fine prerequisites for organizing, planning
monitoring and controlling through the eight pillar methodology. The eight pillars are as
following Development Management, Autonomous Maintenance, Focused Maintenance,
Planned Maintenance, Quality Maintenance, Education and Training, Safety, Health &
Environment and finally Office TPM (Ahuja and Khamba, 2008), (see figure 2).
16
Figure 1. The TPM Temple, supported of the 8 pillars (Ahuja and Khamba, 2008)
Development Management (5S)
The first pillar is Development Management, but it is also known as 5S, which has a
significant role in TPM. Due to that this project addresses TPM and have a major focus on
how the company can improve a machine station, 5S got an own chapter in this thesis, (see
next chapter).
Autonomous Maintenance
The concept of the second pillar, Autonomous Maintenance, is based on the idea that an
operator should be given the responsibility to take care of some basic maintenance work of
different tasks. The pillar aims to bring control and maintenance of the machine, leading to
reduced cost in the form of investment as the machine stays reliable and replacement is
necessary (Bundgaard, 1996). Thereto, by having operators doing some maintenance work
themselves, the self-awareness of their responsibility and the condition of their equipment and
work increases (Rodrigues and Hatakeyama, 2006). This also leads to that the actual
maintenance workers are given more time focusing on value added activities and technical
issues and repairs requiring more concentration (Bundgaard, 1996).
On a daily basis Autonomous Maintenance work for operators includes among others,
keeping order and care of their equipment’s and working area in the sense of visual
inspection, cleaning, lubricating and tighten loose parts (Singh et al., 2013). The approach of
this pillar can be divided into eight steps (Bundgaard, 1996). Train and educate the employees
regarding the machine, initial cleanup of machines with help of maintenance worker, make
countermeasures, set a preliminary standard and check-up list, do a general inspection based
on training, do autonomous inspection based on knowledge and experience, standardization,
autonomous management (Bundgaard 1996; Singh et al. 2013).
17
Focused Maintenance - (Kaizen - Continuous Improvement)
Kaizen is originally a Japanese expression where “Kai” means change and “Zen” means good
(for the better), referring to the company who is always striving for continuous improvement
by involving all people in the organization (Bundgaard, 1996). When the improvements have
been achieved, the work will not stop there, instead there should be an effort to develop even
more achievements (Bergman and Klefsjö, 2012). By always striving for incremental
improvements in order to eliminate all types of wastes, and not making any radical changes is
what is the essence of Kaizen. In other words, Kaizen is opposite to enormous innovations.
Furthermore, Kaizen can even be described as a way to document, solve problems and focus
on teamwork (Liker, 2012).
Planned Maintenance
To effectively plan and keep control of maintenance, with daily scheduling and planning of
stops, leads the focus to the fourth pillar (Rodrigues and Hatakeyama, 2006). The purpose is
to achieve and sustain availability of machines, likewise improve the reliability and
maintainability of the machines aiming to have zero failures (Bundgaard, 1996), meaning
trouble free machines and equipment’s without any breakdowns. Thereby also have optimum
maintenance cost and reduces spares inventory. Furthermore, planned maintenance aims to
produce products to the quality of a level making the customer satisfied.
Looking at planned maintenance, a proactive approach is used in the sense of using trained
and knowing maintenance workers to support the training of operators so they in their turn
can better maintain the equipment (Singh et al., 2013).
Different steps that is included in the process of this pillar is making evaluation of equipment
and recording the present status, make restoration of deterioration and improve weaknesses.
Also building up management system of information and prepare time based information
system. Likewise making selection of equipment needed and map out a plan of action
(Bundgaard, 1996).
Quality Maintenance
The fifth pillar Quality Maintenance is aimed towards achieving customer
satisfaction, through products of the highest quality and putting focus on freeing the
manufacturing from defects (Singh et al., 2013). The focus is on eliminating non-
conformances from the process in a systematic way and manage to achieve and sustain
customer complaints at zero. It is a bit similar to the third pillar “Focused Improvement”. In
order to prevent defects and ensure that the measure values are within the standard values, the
condition equipment parts is checked and measured in time series. The transition of the
measured values is watched through charts in order to predict any possibilities for defects to
occur and to take counter measures beforehand. The transition is from Quality control to
Quality Assurance (Bundgaard, 1996).
18
Education and Training
This pillar is concerned with filling the gap, which exists regarding the knowledge in an
organization in context of Total Productive Maintenance. Continuous improvement in
knowledge and skill of the employees at different levels needs to be achieved to make
continuous improvement possible (Singh et al., 2013). The purpose is to have multi-skilled
revitalized employees that have a high morale, can work independently and are willing to
perform the required functions effectively. By ensuring to have given employees the
education and training in order to upgrade their skill and techniques, can give the organization
a reliable pool of knowledgeable staff who can drive the initiative competently. The goal is to
create an organization full of experts, therefore, it is important to understand and learn
“Know-why”, because “Know-how” is not sufficient (Bundgaard, 1996).
Safety, Health & Environment
The purpose of the seventh pillar concerned Safety, Health & Environment, is to create a safe
workplace and surrounding area by faciliatating the organization in achieving standard
practices in the workplace and safe working. To promote to keep procedures and process to a
level of as clean and green environment as possible and to motivate employees (Singh et al.,
2013). The major objectives are to have the cause of zero accidents, zero health damages and
zero fires (Bundgaard, 1996).
This pillar is to ensure that the environment and conditions that the workers are provided with
should be non-harmful for their well-being. There are of the utmost importance that the safety
is given in the business plant and functions related to safety should be located at the area, and
a accident-free environment tends to bring a more positive attitude among workers
(Bundgaard, 1996). To start approaching this aspect, it is of a good cause to let the workers
know their significance and make them aware of the important part they play in the
organization (Singh et al., 2013).
Office TPM
Office TPM is the last pillar, which should be started after activating the other four pillars of
TPM (Autonomous-, Quality-, & Planned Maintenance and Kaizen). Office TPM needs to be
followed in order to improve both productivity and efficiency in the administrative functions.
Analyzing processes and procedures can be automated which is also included. This pillar
addresses nine major losses which are processing loss, cost loss that includes areas such as
procurement, accounts, marketing, sales leading to high inventories, communication loss, idle
loss, set-up loss, accuracy loss, office equipment breakdown, communication channel
breakdown, telephone and fax lines and time spent on retrieval of information (Singh et al.,
2013).
In addition, Office TPM is also essential to form strong relationships with both supplier and
distributors. When it comes to suppliers, it will lead to on-time delivery, improved “in-
coming” quality and cost reduction. Regarding distributors, it will lead to a demand
generation, which is accurate and also reduction of the damage during the storage and
handling (Bundgaard, 1996).
19
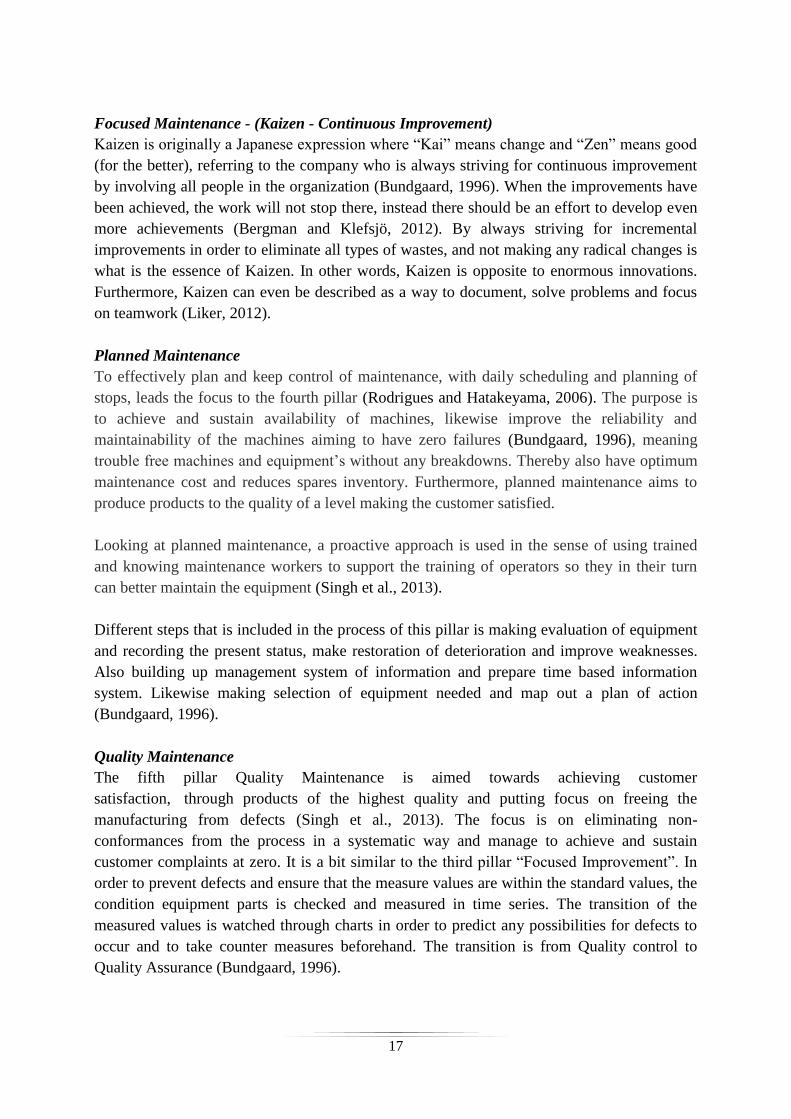
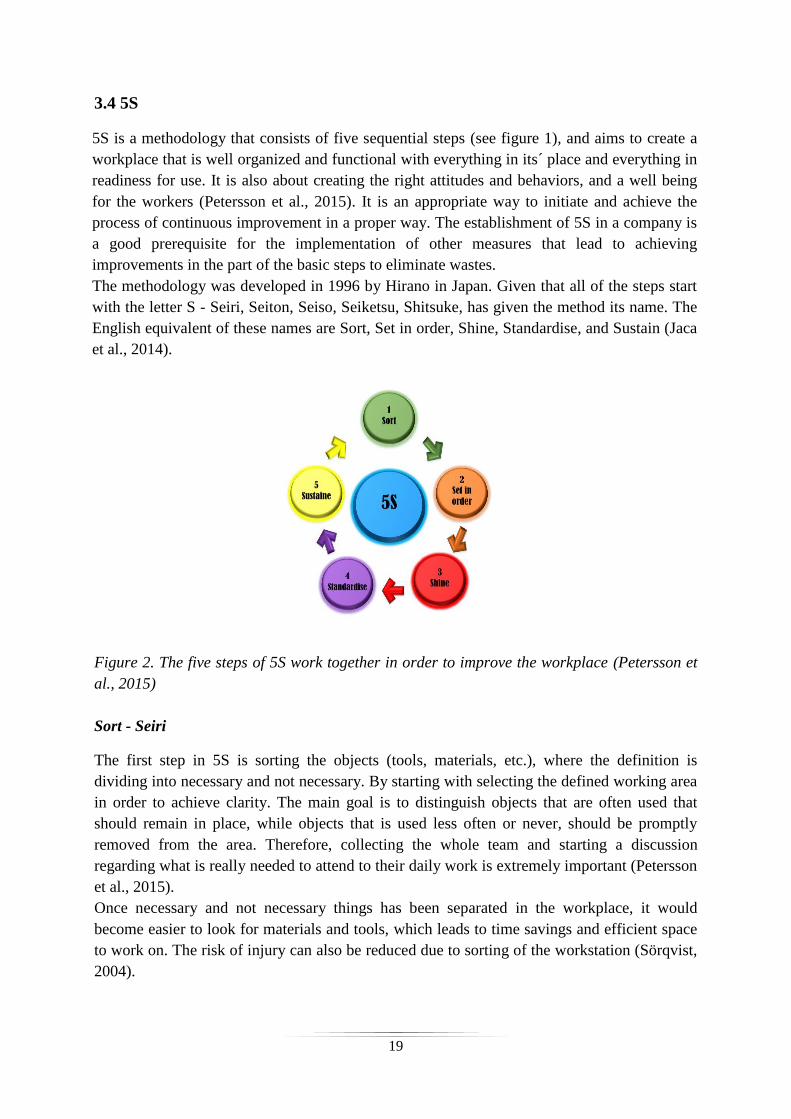
3.4 5S
5S is a methodology that consists of five sequential steps (see figure 1), and aims to create a
workplace that is well organized and functional with everything in its´ place and everything in
readiness for use. It is also about creating the right attitudes and behaviors, and a well being
for the workers (Petersson et al., 2015). It is an appropriate way to initiate and achieve the
process of continuous improvement in a proper way. The establishment of 5S in a company is
a good prerequisite for the implementation of other measures that lead to achieving
improvements in the part of the basic steps to eliminate wastes.
The methodology was developed in 1996 by Hirano in Japan. Given that all of the steps start
with the letter S - Seiri, Seiton, Seiso, Seiketsu, Shitsuke, has given the method its name. The
English equivalent of these names are Sort, Set in order, Shine, Standardise, and Sustain (Jaca
et al., 2014).
Figure 2. The five steps of 5S work together in order to improve the workplace (Petersson et
al., 2015)
Sort - Seiri
The first step in 5S is sorting the objects (tools, materials, etc.), where the definition is
dividing into necessary and not necessary. By starting with selecting the defined working area
in order to achieve clarity. The main goal is to distinguish objects that are often used that
should remain in place, while objects that is used less often or never, should be promptly
removed from the area. Therefore, collecting the whole team and starting a discussion
regarding what is really needed to attend to their daily work is extremely important (Petersson
et al., 2015).
Once necessary and not necessary things has been separated in the workplace, it would
become easier to look for materials and tools, which leads to time savings and efficient space
to work on. The risk of injury can also be reduced due to sorting of the workstation (Sörqvist,
2004).
20
Set in order - Seiton
Every tool that is used shall have its own specific place. The tools should also be placed next
to or near the area where they are supposed to be used. Documents shall be placed in a sense
that makes finding what is searched for easier, requiring standardised names of documents and
file structures (Petersson et al., 2015). To maintain and ensure that order is kept, visual
management of materials, production charts and position marks is of essential significance. To
have a standardised structure and knowing where things should be, makes it important to also
quickly be able to determine whether something is missing in order to discover and avoid
deviation, also useless searching is avoided (Jaca et al., 2014).
Shine - Seiso
The third step in 5S is systematic cleaning. Systematic cleaning is more about ensuring that
everything is in setup and works as it should. A good approach in the cleaning step is concise
and the time is spent on making sure that all the things are in good condition. It is also
important to stop the source of contamination (Petersson et al., 2015).
The main point to why the people who work with the equipment should do the cleaning is
because it becomes possible to detect errors and deviations at an early state. It is good for
efficiency, which can lead to a reduction of the number of errors in production and even the
material losses can be reduced (Sörqvist, 2004).
Standardise - Seiketsu
The fourth step in 5S is about standardisation of the way of working. The step is reached when
the three previous ones are completed and the working team has reached an agreement of how
things should be and work. It is important to then continuously maintain the achieved level of
the first three S's. The standardisation will serve as a tool detecting abnormality in the
processes (Jaca et al., 2014). It is also essential that a standard is easily understood and
followed. Preferably, the standard instructions are shown in the context of a picture to make it
even more simplistic and easier to update, requiring less administrative work. The standard
reached and agreed upon can for example be about what objects there should be at the
working area and how they are to be structured. How often the checkups are to be made over
tools and cleaning routines are also agreed upon. (Petersson et al., 2015). Another way of
looking at standardisation is the aspect of creating uniformity among the people and in the
workplace. This could for example be the worker wearing the same type of uniform (Jaca et
al., 2014).
Sustain - Shitsuke
The last and the fifth step of 5S is creating the habit. To get all employees to follow the
agreed standard and make it into a habit and discipline is normally the most difficult part, but
this part is also the most important. The reason behind the difficulty is mostly a matter of
changing attitudes and behavior. It is a big variation of time, but in some cases, it may take
21
several years in order to get the approach to work smoothly. Since it is based on employees
themselves to apply 5S in their daily work and drive the search for continuous improvements
(Jaca et al., 2014).
When the previous steps in 5S have been done, a habit must be created, since it is easy to fall
into the old pattern and return to the old habit. In order to not fall into old habits, allocating
time for 5S is necessary. Also, it is important that leaders understand that it takes time to
change attitudes and behavior. Otherwise, the risk is that the employees´ commitment will
decrease. It applies to all involving people having an incentive to 5S (Petersson et al., 2015).
3.5 Theory conclusion
The context of the above theories, have resulted into a base from where the questions to the
interview guide (see appendix 8) have arisen. The theories bring up the context of how tools
within Lean and VSM are to be used and the purpose of concepts such as TPM and 5S. Much
of the theory concerns the working environment and the importance of it, including reduction
of disturbances such as wastes and recommended ways of handling different situations. The
theory base has helped to state questions concerning the workplace and how the daily work is
carried out. The questions will help the researchers to create a visualized current state of the
station and discover disturbances.
22
4. Current state
This chapter introduces the current state of how the hand welding station´s structure and
process look like. Furthermore, the chapter brings up what type of problem areas that exist in
the current state. It also involves pictures and diagram of gathered data of the current
situation at the hand welding station.
(Everything that follows under section 4.1 and 4.2 covers the theory for part of 5S, the eight
pillars of TPM and the 7+1 wastes. These follow a clearer development in chapter 5 -
Analysis.)
4.1 Process Description
At current state, there prevails a two-shift at the hand welding station with one operator
operating at each shift. There is two hand welding machine for normal mantles and a third one
for stainless mantles, all the machines requires manual handling. The working hour per shift is
7 hours and 30 minutes a day, meaning one day gives a total of 15 working hours a day,
breaks excluded.
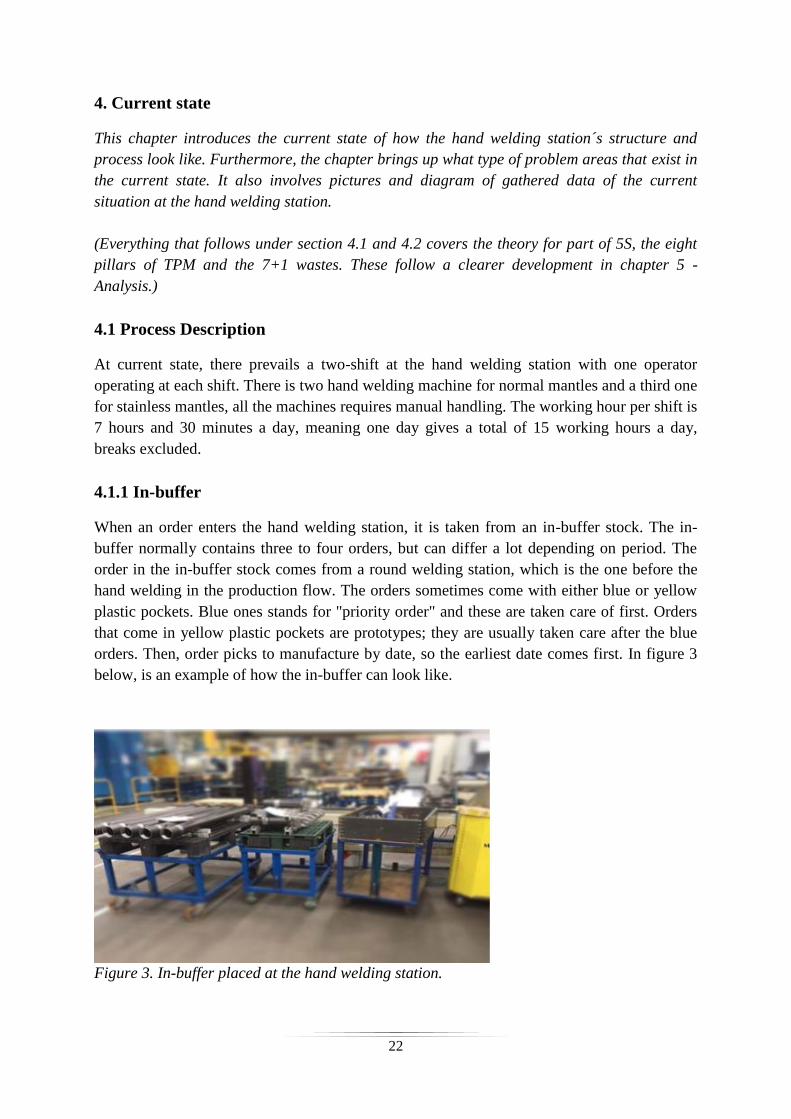
4.1.1 In-buffer
When an order enters the hand welding station, it is taken from an in-buffer stock. The in-
buffer normally contains three to four orders, but can differ a lot depending on period. The
order in the in-buffer stock comes from a round welding station, which is the one before the
hand welding in the production flow. The orders sometimes come with either blue or yellow
plastic pockets. Blue ones stands for "priority order" and these are taken care of first. Orders
that come in yellow plastic pockets are prototypes; they are usually taken care after the blue
orders. Then, order picks to manufacture by date, so the earliest date comes first. In figure 3
below, is an example of how the in-buffer can look like.
Figure 3. In-buffer placed at the hand welding station.
23
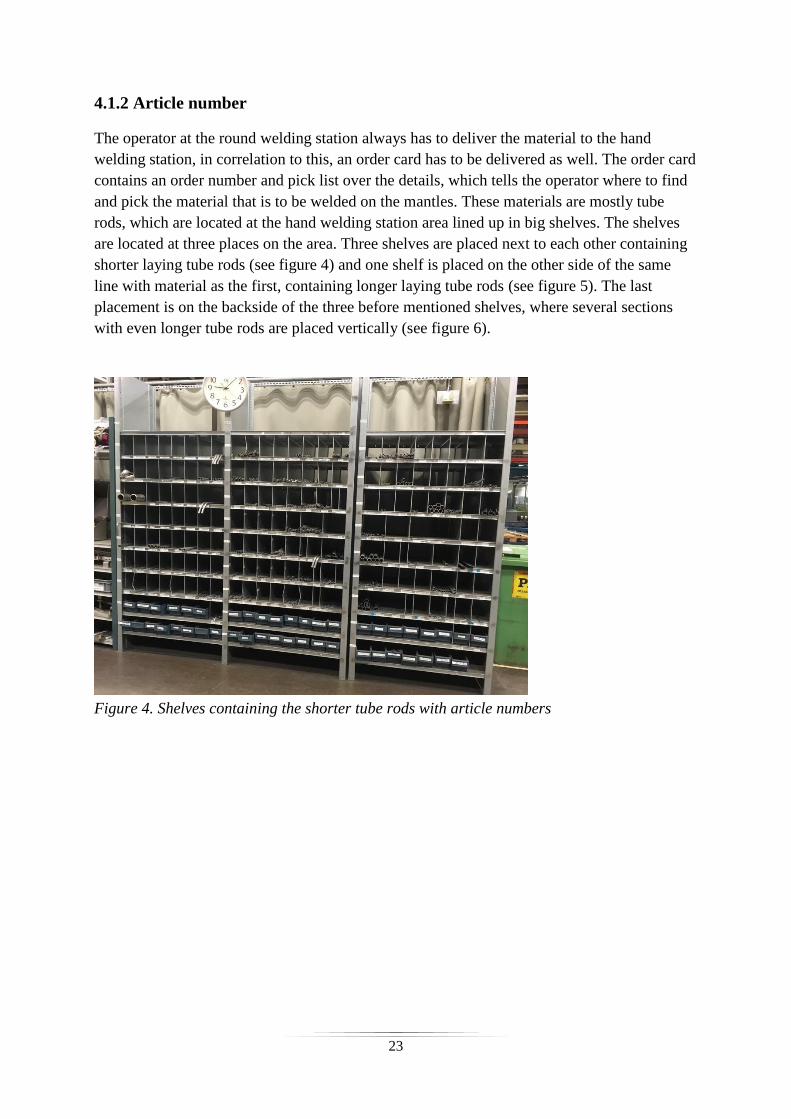
4.1.2 Article number
The operator at the round welding station always has to deliver the material to the hand
welding station, in correlation to this, an order card has to be delivered as well. The order card
contains an order number and pick list over the details, which tells the operator where to find
and pick the material that is to be welded on the mantles. These materials are mostly tube
rods, which are located at the hand welding station area lined up in big shelves. The shelves
are located at three places on the area. Three shelves are placed next to each other containing
shorter laying tube rods (see figure 4) and one shelf is placed on the other side of the same
line with material as the first, containing longer laying tube rods (see figure 5). The last
placement is on the backside of the three before mentioned shelves, where several sections
with even longer tube rods are placed vertically (see figure 6).
Figure 4. Shelves containing the shorter tube rods with article numbers
24
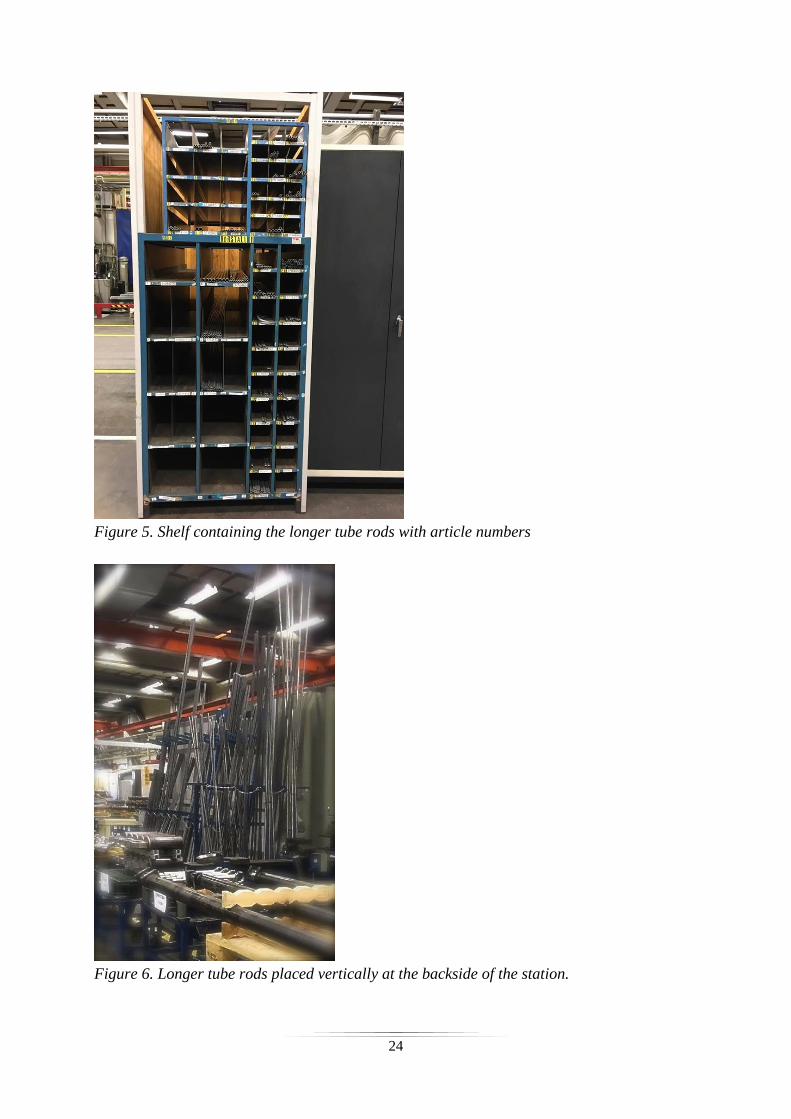
Figure 5. Shelf containing the longer tube rods with article numbers
Figure 6. Longer tube rods placed vertically at the backside of the station.
25
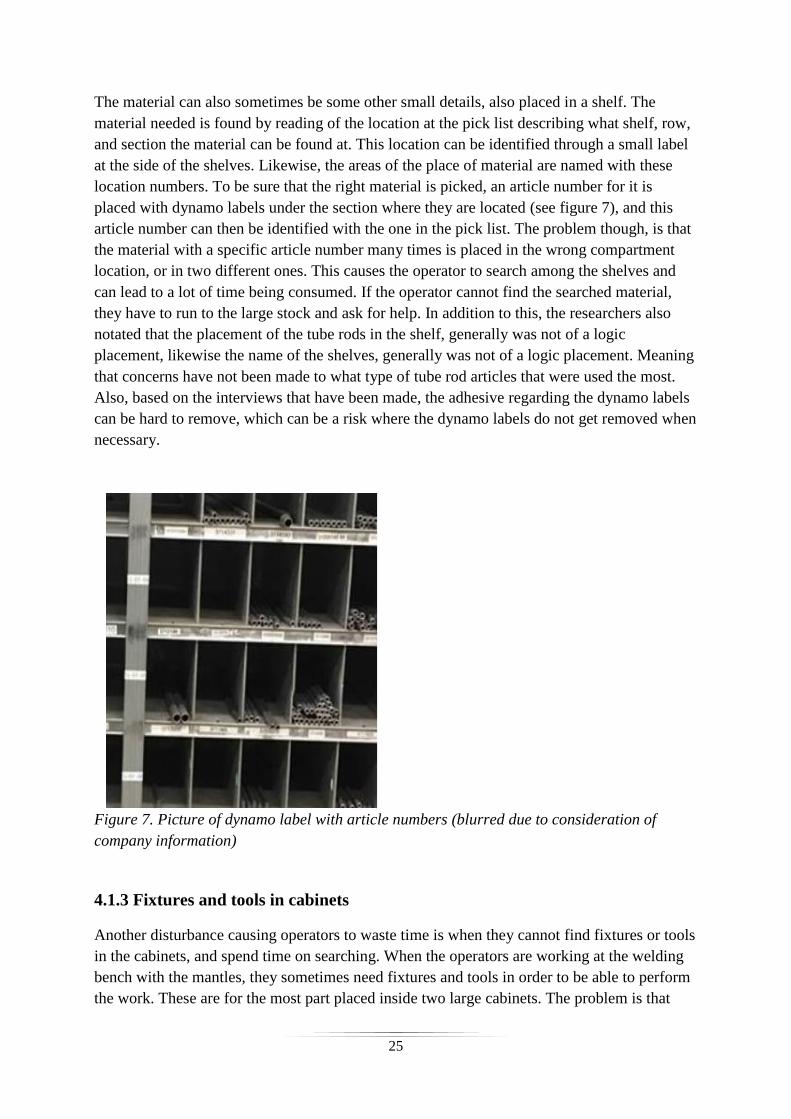
The material can also sometimes be some other small details, also placed in a shelf. The
material needed is found by reading of the location at the pick list describing what shelf, row,
and section the material can be found at. This location can be identified through a small label
at the side of the shelves. Likewise, the areas of the place of material are named with these
location numbers. To be sure that the right material is picked, an article number for it is
placed with dynamo labels under the section where they are located (see figure 7), and this
article number can then be identified with the one in the pick list. The problem though, is that
the material with a specific article number many times is placed in the wrong compartment
location, or in two different ones. This causes the operator to search among the shelves and
can lead to a lot of time being consumed. If the operator cannot find the searched material,
they have to run to the large stock and ask for help. In addition to this, the researchers also
notated that the placement of the tube rods in the shelf, generally was not of a logic
placement, likewise the name of the shelves, generally was not of a logic placement. Meaning
that concerns have not been made to what type of tube rod articles that were used the most.
Also, based on the interviews that have been made, the adhesive regarding the dynamo labels
can be hard to remove, which can be a risk where the dynamo labels do not get removed when
necessary.
Figure 7. Picture of dynamo label with article numbers (blurred due to consideration of
company information)
4.1.3 Fixtures and tools in cabinets
Another disturbance causing operators to waste time is when they cannot find fixtures or tools
in the cabinets, and spend time on searching. When the operators are working at the welding
bench with the mantles, they sometimes need fixtures and tools in order to be able to perform
the work. These are for the most part placed inside two large cabinets. The problem is that

26
there is no structure or logical placement among these. Furthermore, there are rarely any clear
markings on them to facilitate for the operators. At the order card, the article number of which
fixture or tool to use is also listed. Some equipment are whether lack of article number or hard
to read it. Other fixtures consist of several parts and these are sometimes laying spread in the
shelves in the cabinets (see figure 8 and 9). According to the operators, it can sometimes take
up to five minutes to find the right equipment that is needed.
Figure 8. One of the cabinet containing fixtures and tools
Figure 9. A closer picture of the unstructured fixtures
27
4.1.4 Ergonomics
Ergonomically, operators are affected variously. If tube rods used frequently are placed high
up on the shelves, the operator often has to extend in order to reach the rod. Likewise, if some
of the tube rods frequently used are in a low placement near the floor, the operator often has
to bend over. A lot of empty compartments also exists with marked article numbers that has
been there for up to one year without use.
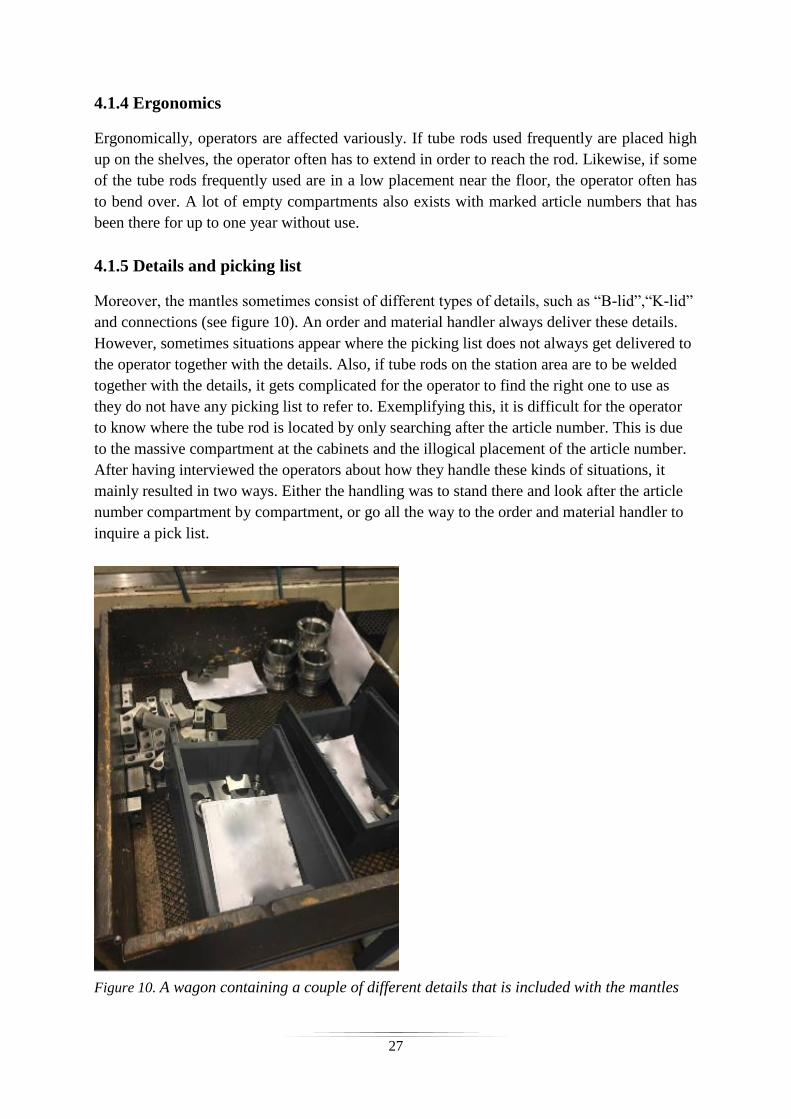
4.1.5 Details and picking list
Moreover, the mantles sometimes consist of different types of details, such as “B-lid”,“K-lid”
and connections (see figure 10). An order and material handler always deliver these details.
However, sometimes situations appear where the picking list does not always get delivered to
the operator together with the details. Also, if tube rods on the station area are to be welded
together with the details, it gets complicated for the operator to find the right one to use as
they do not have any picking list to refer to. Exemplifying this, it is difficult for the operator
to know where the tube rod is located by only searching after the article number. This is due
to the massive compartment at the cabinets and the illogical placement of the article number.
After having interviewed the operators about how they handle these kinds of situations, it
mainly resulted in two ways. Either the handling was to stand there and look after the article
number compartment by compartment, or go all the way to the order and material handler to
inquire a pick list.
Figure 10. A wagon containing a couple of different details that is included with the mantles
28
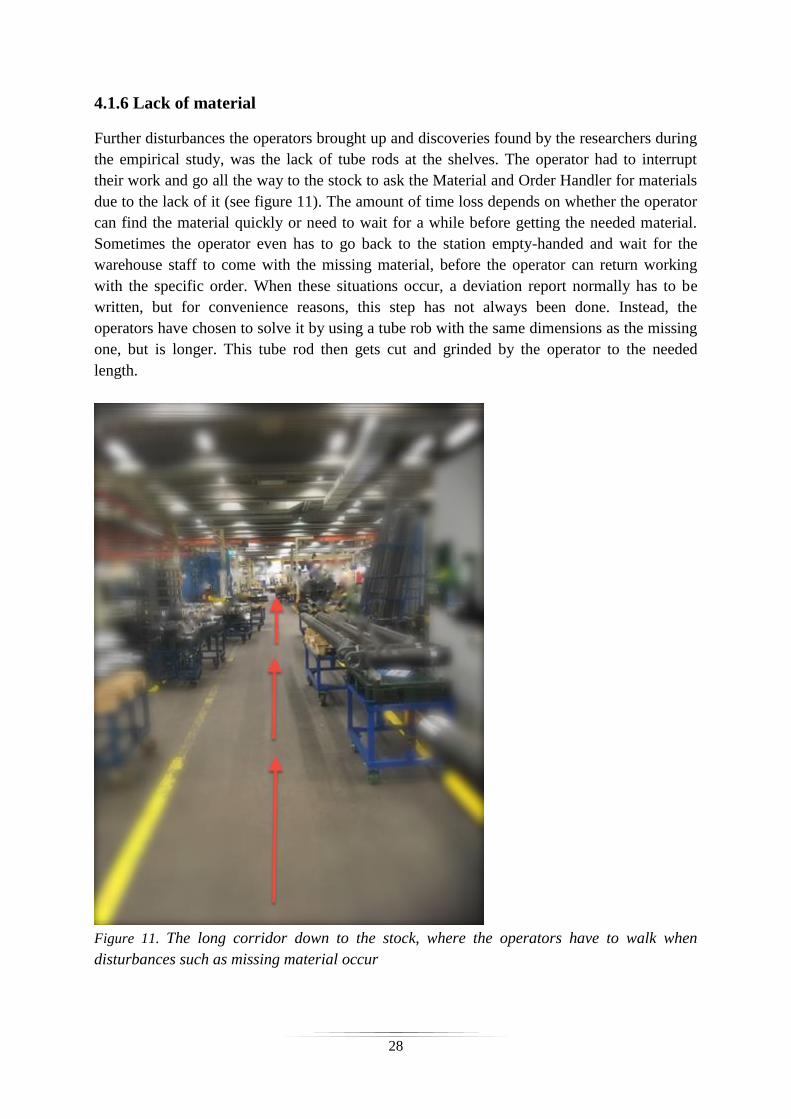
4.1.6 Lack of material
Further disturbances the operators brought up and discoveries found by the researchers during
the empirical study, was the lack of tube rods at the shelves. The operator had to interrupt
their work and go all the way to the stock to ask the Material and Order Handler for materials
due to the lack of it (see figure 11). The amount of time loss depends on whether the operator
can find the material quickly or need to wait for a while before getting the needed material.
Sometimes the operator even has to go back to the station empty-handed and wait for the
warehouse staff to come with the missing material, before the operator can return working
with the specific order. When these situations occur, a deviation report normally has to be
written, but for convenience reasons, this step has not always been done. Instead, the
operators have chosen to solve it by using a tube rob with the same dimensions as the missing
one, but is longer. This tube rod then gets cut and grinded by the operator to the needed
length.
Figure 11. The long corridor down to the stock, where the operators have to walk when
disturbances such as missing material occur
29
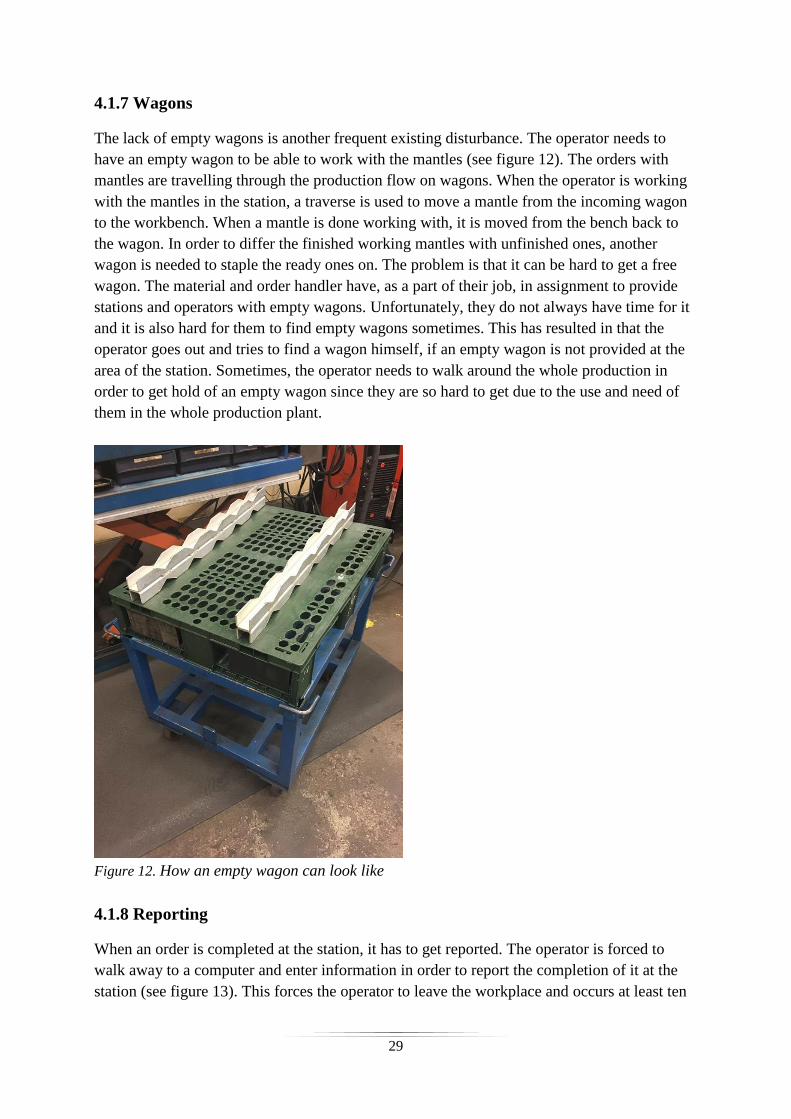
4.1.7 Wagons
The lack of empty wagons is another frequent existing disturbance. The operator needs to
have an empty wagon to be able to work with the mantles (see figure 12). The orders with
mantles are travelling through the production flow on wagons. When the operator is working
with the mantles in the station, a traverse is used to move a mantle from the incoming wagon
to the workbench. When a mantle is done working with, it is moved from the bench back to
the wagon. In order to differ the finished working mantles with unfinished ones, another
wagon is needed to staple the ready ones on. The problem is that it can be hard to get a free
wagon. The material and order handler have, as a part of their job, in assignment to provide
stations and operators with empty wagons. Unfortunately, they do not always have time for it
and it is also hard for them to find empty wagons sometimes. This has resulted in that the
operator goes out and tries to find a wagon himself, if an empty wagon is not provided at the
area of the station. Sometimes, the operator needs to walk around the whole production in
order to get hold of an empty wagon since they are so hard to get due to the use and need of
them in the whole production plant.
Figure 12. How an empty wagon can look like
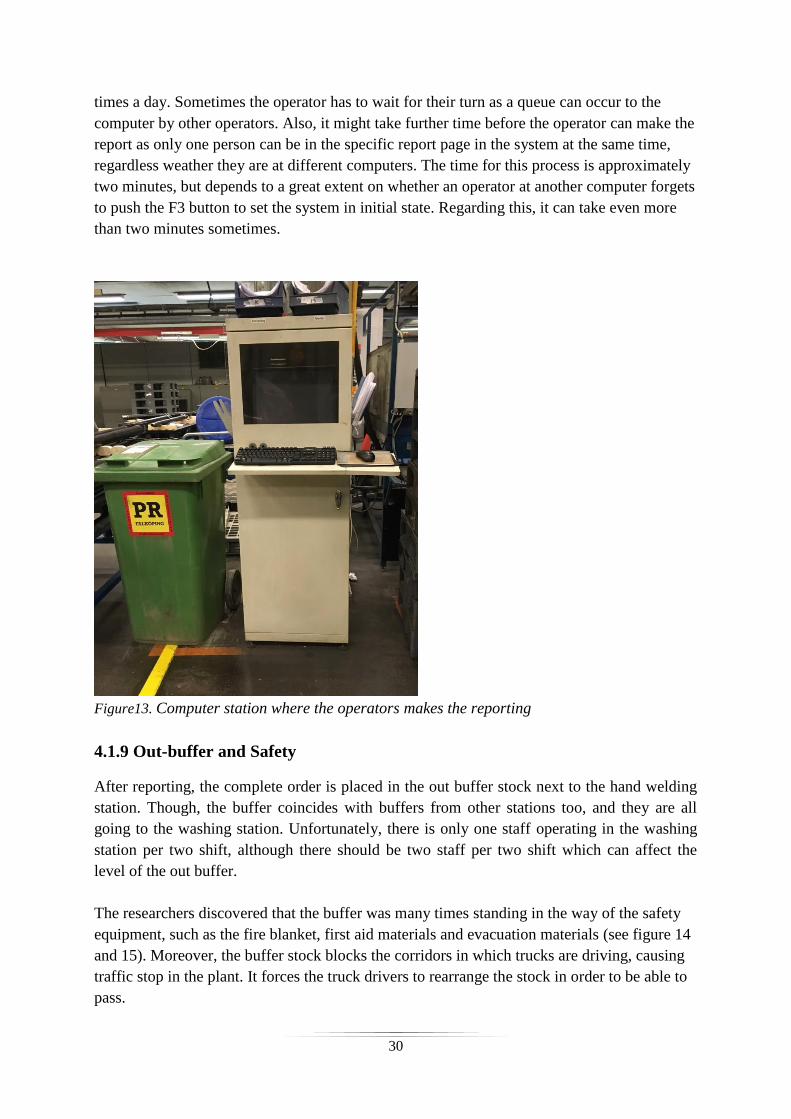
4.1.8 Reporting
When an order is completed at the station, it has to get reported. The operator is forced to
walk away to a computer and enter information in order to report the completion of it at the
station (see figure 13). This forces the operator to leave the workplace and occurs at least ten
30
times a day. Sometimes the operator has to wait for their turn as a queue can occur to the
computer by other operators. Also, it might take further time before the operator can make the
report as only one person can be in the specific report page in the system at the same time,
regardless weather they are at different computers. The time for this process is approximately
two minutes, but depends to a great extent on whether an operator at another computer forgets
to push the F3 button to set the system in initial state. Regarding this, it can take even more
than two minutes sometimes.
Figure13. Computer station where the operators makes the reporting
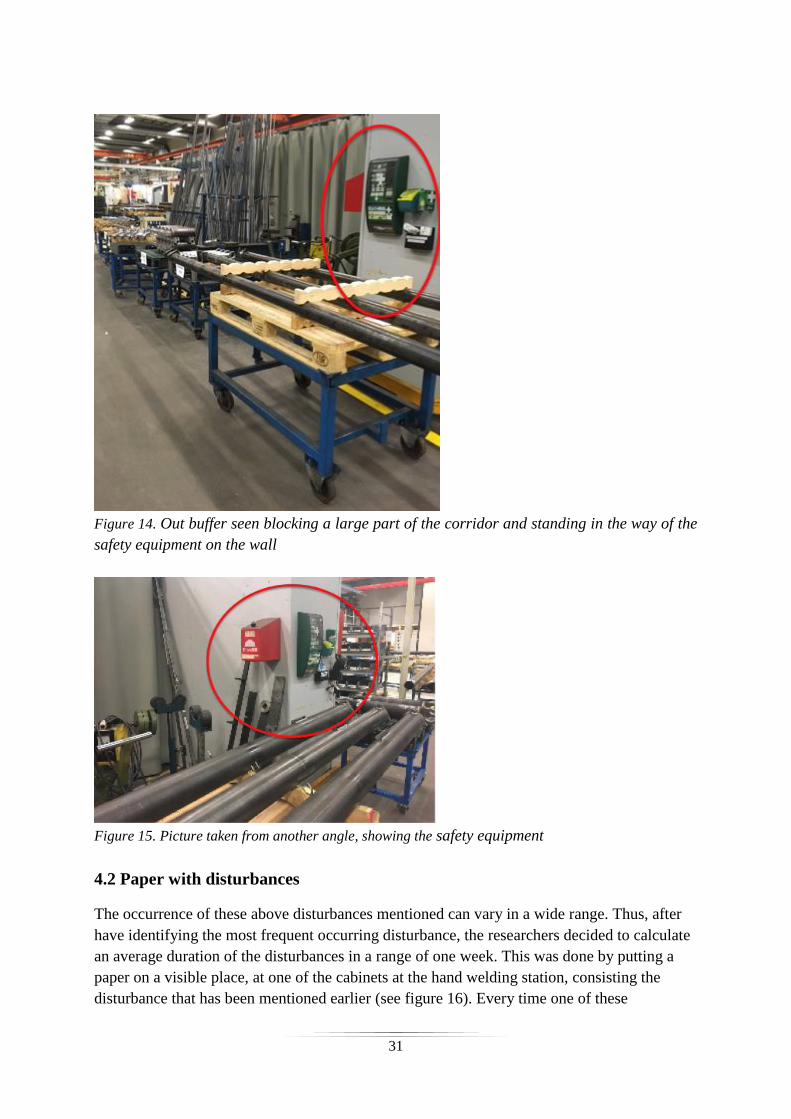
4.1.9 Out-buffer and Safety
After reporting, the complete order is placed in the out buffer stock next to the hand welding
station. Though, the buffer coincides with buffers from other stations too, and they are all
going to the washing station. Unfortunately, there is only one staff operating in the washing
station per two shift, although there should be two staff per two shift which can affect the
level of the out buffer.
The researchers discovered that the buffer was many times standing in the way of the safety
equipment, such as the fire blanket, first aid materials and evacuation materials (see figure 14
and 15). Moreover, the buffer stock blocks the corridors in which trucks are driving, causing
traffic stop in the plant. It forces the truck drivers to rearrange the stock in order to be able to
pass.
31
Figure 14. Out buffer seen blocking a large part of the corridor and standing in the way of the
safety equipment on the wall
Figure 15. Picture taken from another angle, showing the safety equipment
4.2 Paper with disturbances
The occurrence of these above disturbances mentioned can vary in a wide range. Thus, after
have identifying the most frequent occurring disturbance, the researchers decided to calculate
an average duration of the disturbances in a range of one week. This was done by putting a
paper on a visible place, at one of the cabinets at the hand welding station, consisting the
disturbance that has been mentioned earlier (see figure 16). Every time one of these
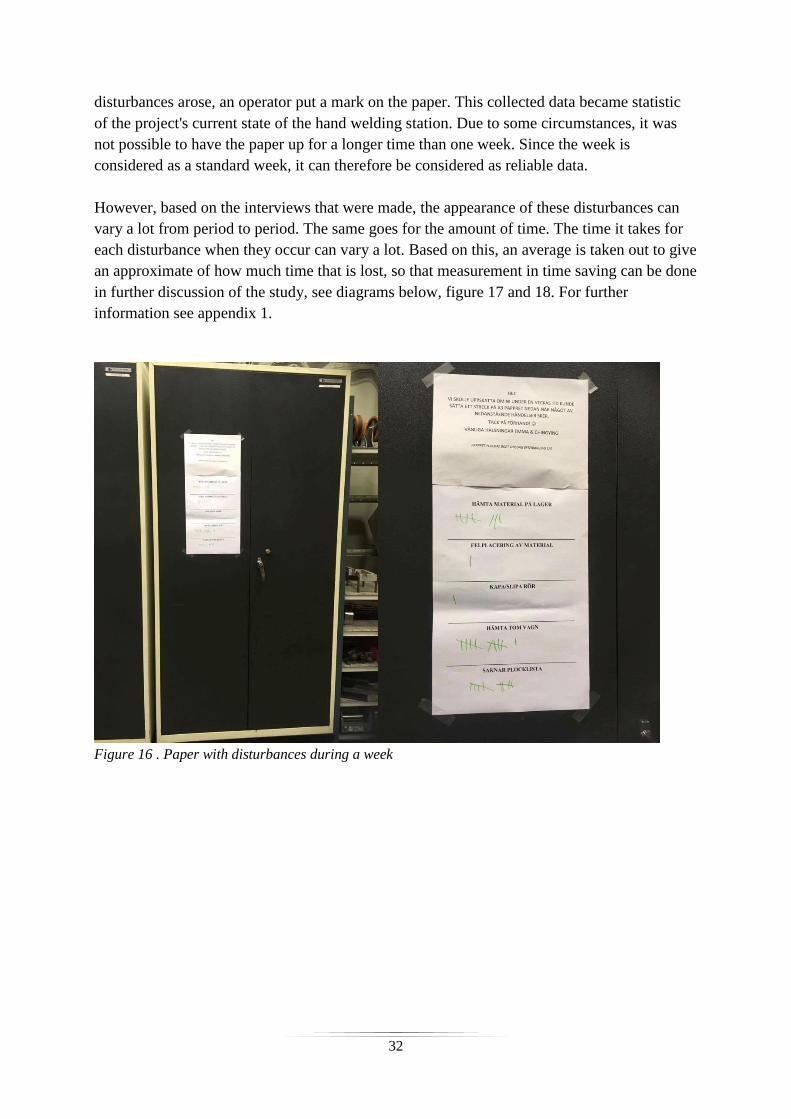
32
disturbances arose, an operator put a mark on the paper. This collected data became statistic
of the project's current state of the hand welding station. Due to some circumstances, it was
not possible to have the paper up for a longer time than one week. Since the week is
considered as a standard week, it can therefore be considered as reliable data.
However, based on the interviews that were made, the appearance of these disturbances can
vary a lot from period to period. The same goes for the amount of time. The time it takes for
each disturbance when they occur can vary a lot. Based on this, an average is taken out to give
an approximate of how much time that is lost, so that measurement in time saving can be done
in further discussion of the study, see diagrams below, figure 17 and 18. For further
information see appendix 1.
Figure 16 . Paper with disturbances during a week
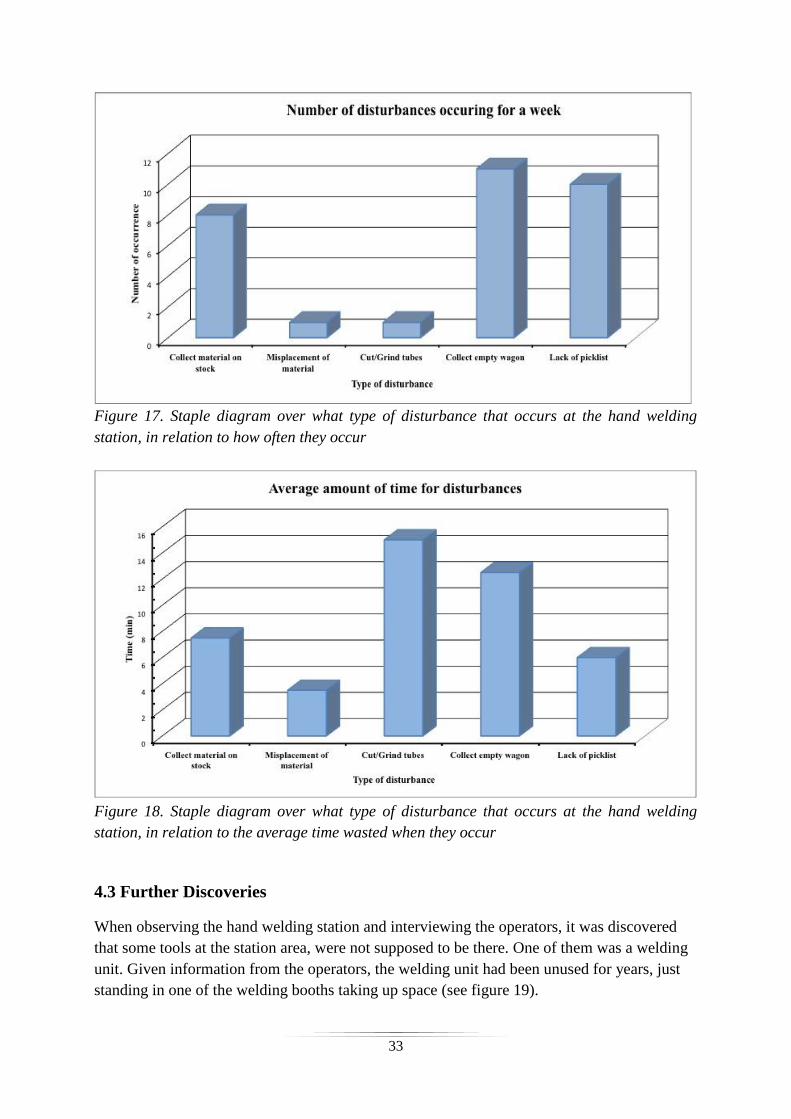
33
Figure 17. Staple diagram over what type of disturbance that occurs at the hand welding
station, in relation to how often they occur
Figure 18. Staple diagram over what type of disturbance that occurs at the hand welding
station, in relation to the average time wasted when they occur
4.3 Further Discoveries
When observing the hand welding station and interviewing the operators, it was discovered
that some tools at the station area, were not supposed to be there. One of them was a welding
unit. Given information from the operators, the welding unit had been unused for years, just
standing in one of the welding booths taking up space (see figure 19).
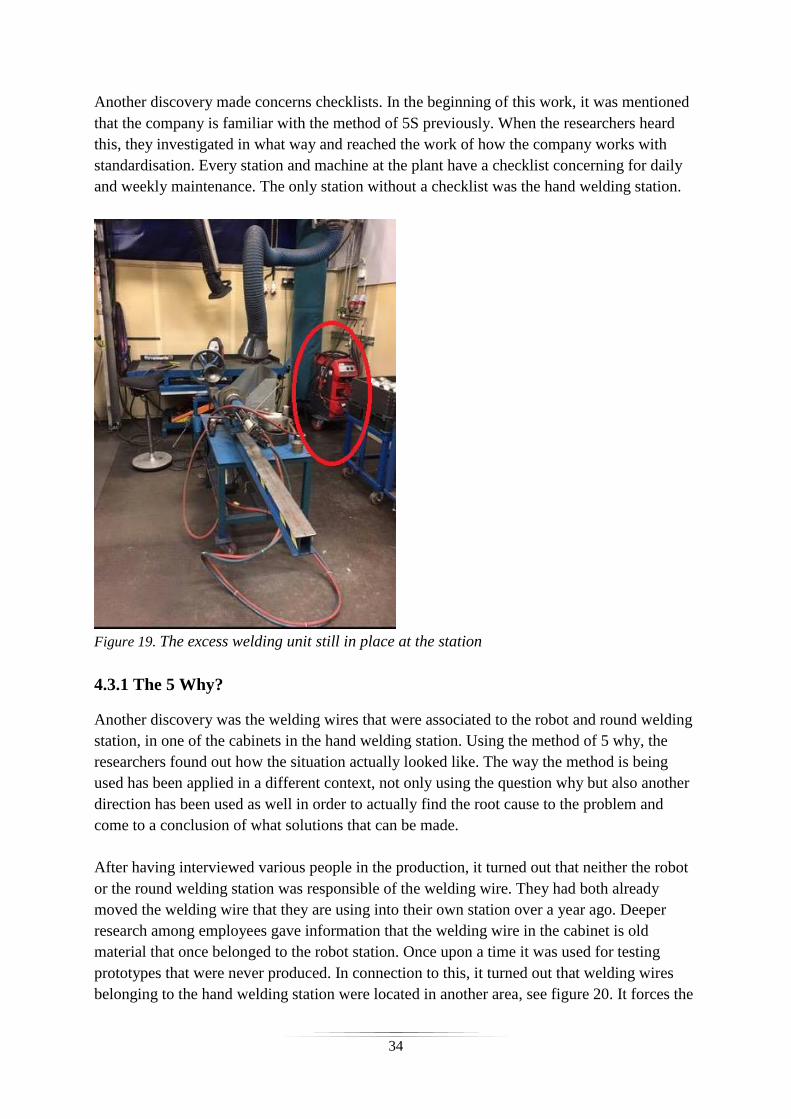
34
Another discovery made concerns checklists. In the beginning of this work, it was mentioned
that the company is familiar with the method of 5S previously. When the researchers heard
this, they investigated in what way and reached the work of how the company works with
standardisation. Every station and machine at the plant have a checklist concerning for daily
and weekly maintenance. The only station without a checklist was the hand welding station.
Figure 19. The excess welding unit still in place at the station
4.3.1 The 5 Why?
Another discovery was the welding wires that were associated to the robot and round welding
station, in one of the cabinets in the hand welding station. Using the method of 5 why, the
researchers found out how the situation actually looked like. The way the method is being
used has been applied in a different context, not only using the question why but also another
direction has been used as well in order to actually find the root cause to the problem and
come to a conclusion of what solutions that can be made.
After having interviewed various people in the production, it turned out that neither the robot
or the round welding station was responsible of the welding wire. They had both already
moved the welding wire that they are using into their own station over a year ago. Deeper
research among employees gave information that the welding wire in the cabinet is old
material that once belonged to the robot station. Once upon a time it was used for testing
prototypes that were never produced. In connection to this, it turned out that welding wires
belonging to the hand welding station were located in another area, see figure 20. It forces the
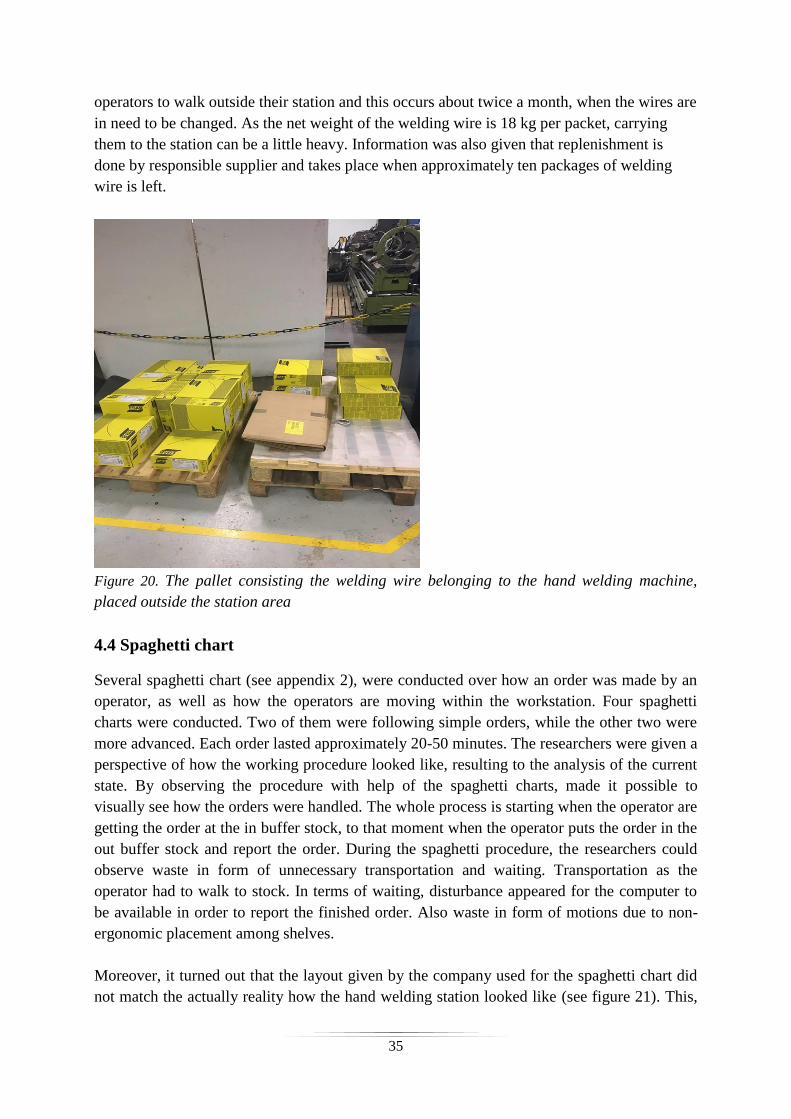
35
operators to walk outside their station and this occurs about twice a month, when the wires are
in need to be changed. As the net weight of the welding wire is 18 kg per packet, carrying
them to the station can be a little heavy. Information was also given that replenishment is
done by responsible supplier and takes place when approximately ten packages of welding
wire is left.
Figure 20. The pallet consisting the welding wire belonging to the hand welding machine,
placed outside the station area
4.4 Spaghetti chart
Several spaghetti chart (see appendix 2), were conducted over how an order was made by an
operator, as well as how the operators are moving within the workstation. Four spaghetti
charts were conducted. Two of them were following simple orders, while the other two were
more advanced. Each order lasted approximately 20-50 minutes. The researchers were given a
perspective of how the working procedure looked like, resulting to the analysis of the current
state. By observing the procedure with help of the spaghetti charts, made it possible to
visually see how the orders were handled. The whole process is starting when the operator are
getting the order at the in buffer stock, to that moment when the operator puts the order in the
out buffer stock and report the order. During the spaghetti procedure, the researchers could
observe waste in form of unnecessary transportation and waiting. Transportation as the
operator had to walk to stock. In terms of waiting, disturbance appeared for the computer to
be available in order to report the finished order. Also waste in form of motions due to non-
ergonomic placement among shelves.
Moreover, it turned out that the layout given by the company used for the spaghetti chart did
not match the actually reality how the hand welding station looked like (see figure 21). This,
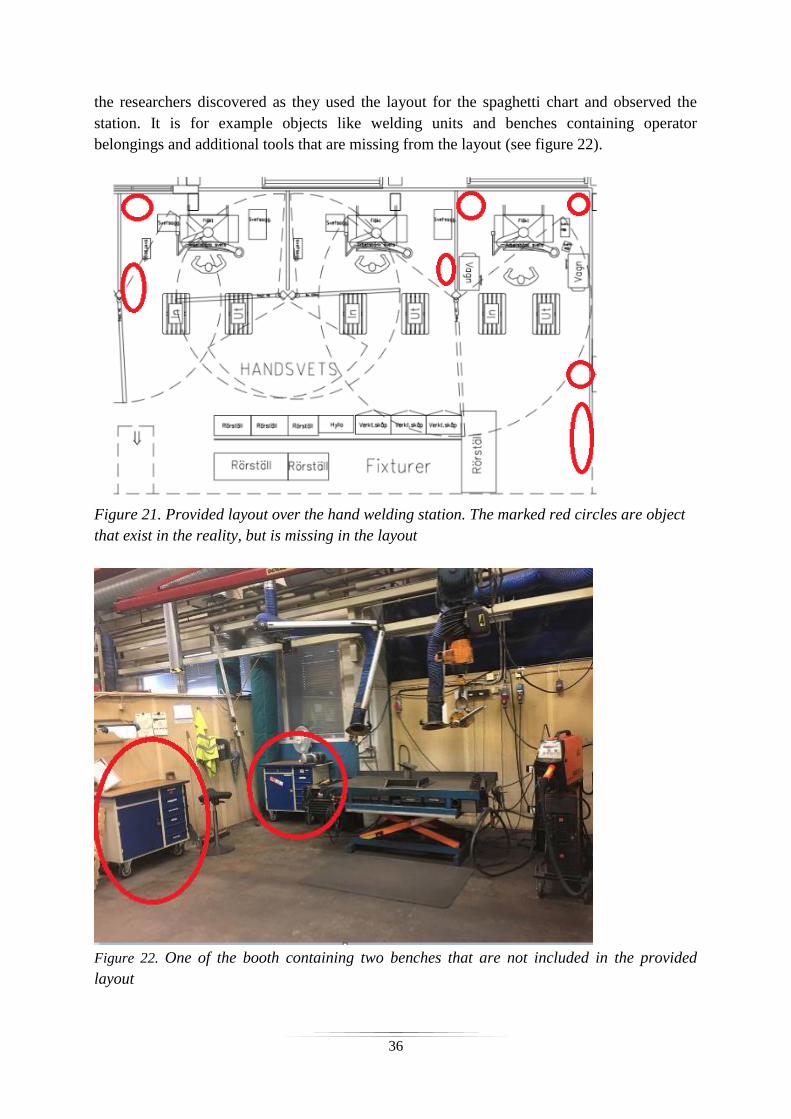
36
the researchers discovered as they used the layout for the spaghetti chart and observed the
station. It is for example objects like welding units and benches containing operator
belongings and additional tools that are missing from the layout (see figure 22).
Figure 21. Provided layout over the hand welding station. The marked red circles are object
that exist in the reality, but is missing in the layout
Figure 22. One of the booth containing two benches that are not included in the provided
layout
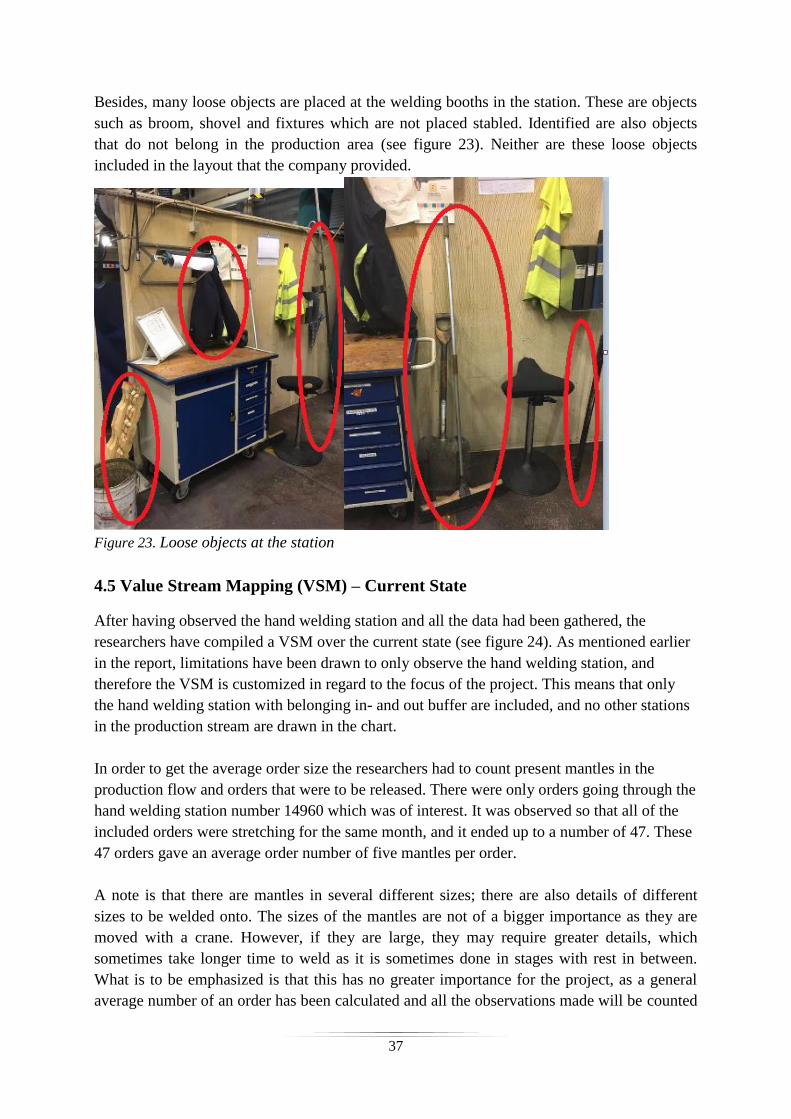
37
Besides, many loose objects are placed at the welding booths in the station. These are objects
such as broom, shovel and fixtures which are not placed stabled. Identified are also objects
that do not belong in the production area (see figure 23). Neither are these loose objects
included in the layout that the company provided.
Figure 23. Loose objects at the station
4.5 Value Stream Mapping (VSM) – Current State
After having observed the hand welding station and all the data had been gathered, the
researchers have compiled a VSM over the current state (see figure 24). As mentioned earlier
in the report, limitations have been drawn to only observe the hand welding station, and
therefore the VSM is customized in regard to the focus of the project. This means that only
the hand welding station with belonging in- and out buffer are included, and no other stations
in the production stream are drawn in the chart.
In order to get the average order size the researchers had to count present mantles in the
production flow and orders that were to be released. There were only orders going through the
hand welding station number 14960 which was of interest. It was observed so that all of the
included orders were stretching for the same month, and it ended up to a number of 47. These
47 orders gave an average order number of five mantles per order.
A note is that there are mantles in several different sizes; there are also details of different
sizes to be welded onto. The sizes of the mantles are not of a bigger importance as they are
moved with a crane. However, if they are large, they may require greater details, which
sometimes take longer time to weld as it is sometimes done in stages with rest in between.
What is to be emphasized is that this has no greater importance for the project, as a general
average number of an order has been calculated and all the observations made will be counted
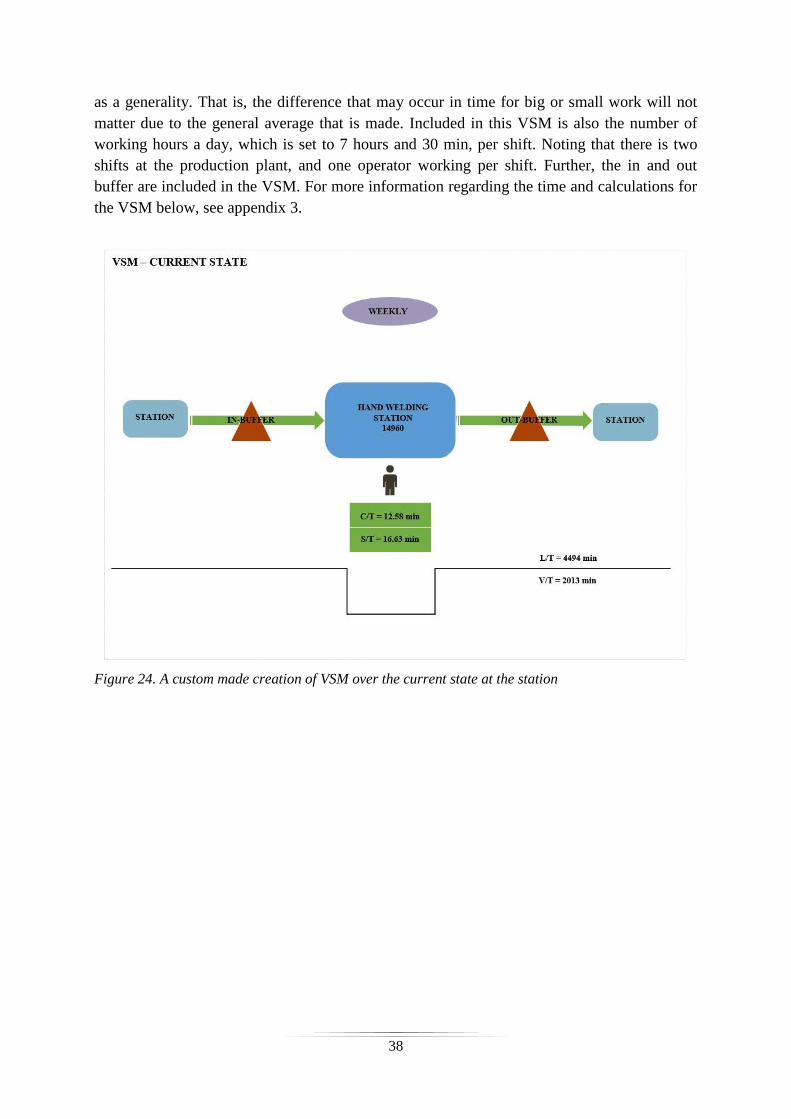
38
as a generality. That is, the difference that may occur in time for big or small work will not
matter due to the general average that is made. Included in this VSM is also the number of
working hours a day, which is set to 7 hours and 30 min, per shift. Noting that there is two
shifts at the production plant, and one operator working per shift. Further, the in and out
buffer are included in the VSM. For more information regarding the time and calculations for
the VSM below, see appendix 3.
Figure 24. A custom made creation of VSM over the current state at the station
39
5. Analyze
In this chapter, an analysis of the empirical current state of the hand welding station is made,
in relationship to the theory brought up. The situation of the station at the company is
discussed in parallel with what the literary studies demonstrates. This chapter is also taking
up the improvement proposals suggested by the researchers.
5.1 Identifying wastes
The following section is observed disturbances identified as wastes. Under this, theory and
current state coincides within the areas of 5S, the eight pillars of TPM and the 7+1 wastes.
5.1.1 Tube Rods shelves - Misplacement
It was brought up that problem with misplacement of material resulting in operator searching
among the shelves can lead to a lot of time being consumed. The main reason to the
misplacement of tube rods according to the researchers is the illogical placement of the article
numbers. The fact that just labels with article numbers are placed at the shelves can easily
confuse staff when placing out material in the shelves. As well as the operators who try to
find the tube rods can get confused by this, since it is easy to misread.
This misplacement of materials occurring can many times result in secondary time loss in the
cause of wasted transportation, unnecessary motion and confusion when the operator might
think that the material is not available, and needlessly run to the stock. From this, more
downtime and waste in the work is created leading to over-processing, the amount of wasted
time could vary a lot. Regardless, the operator loses valuable time that have become wasted
which has an immediate impact on themselves and the quality and productivity of the plant
(Ohno, 1988)
The researchers suggest a reorganization of the tube rods in the shelves so they can be placed
in a more ergonomically and logically matter. Moreover, to structure the material in the shelf
so that often used articles are placed in the middle and more seldom used articles are placed at
the bottom. This will reduce the frequency of bending for the operators. Also, all the articles
which goes as prototypes could be put in one single row in order to make it easy to distinguish
between the materials.
In order to make a reorganization of the shelves, a plan of action following the concept of 5S
is to be recommended. It will approximately follow the same style with sort, categorize, and
structure as the next section concerning fixture cabinets. The plan of action is to be more
described in detailed in the following section as it concerns some more steps.
40
5.1.2 Fixtures and tools in cabinets
In the table below, an improvement proposal with following action plan regarding problem
with the unstructured cabinets is presented.
Table 1: Plan of action for improvement
1a Sort: What is relevant to keep, what can be thrown or what can be archived? The
researchers want the company to make up a team to sort the fixtures and tools in the
cabinets, according to Petersson et al., (2015). To facilitate, a suggestion is to put post-it
notes in different colors on the equipment. Green for keep as “these equipment’s are
relatively often used”. For yellow, representing archiving, the researchers suggest that
equipment not used for over a year is to be placed at the company's tool storage, the
“paternoster”. Red post-it, are put at equipment which there is knowledge about, that
“these are not to be used anymore”.
Also, the researchers introduce a fourth post-it, an orange one, to put on those fixtures
and tools for which there is an uncertainty about whether the equipment are used or not.
If the operators use the equipment, they remove the post-it from it, but if the post-it is still
stuck on the equipment after six months, these are to be removed to the archiving, to the
paternoster.
1b Categories: The idea is to categories the fixtures and tools in different piles, to exemplify
this. The same type of equipment but in different dimensions, are gathered in order to
later receive a logical structure in the cabinets. Another sort of category is to collect the
loose parts that constitutes the one same fixture, and put them in boxes, also marked with
a label referring to the fixtures put in it. The next category is to sort the equipment into
how often or seldom they are used. This in order to later be able to structure them in an
ergonomical way in the shelves of the cabinets.
2 With help of dynamo-label, mark all the fixtures and tools.
3 Obtain extra shelves to put in the cabinets. Also, place several small separation walls to
create different sections to ease the visualization and structure. (See what is possible
based on equipment remaining after stage 1a).
4 Structure the equipment according to the recommended layout from the researchers, to
create the desired standardised future state of the cabinets. The layout that the researchers
provide is based on the categories discussed with employees in stage 1b).
The structure of the shelves in the cabinet will be clarified with plastic label holders. This
will make it easier for staff to maintain structure and order if need of replacement, and
thus maintain the method of 5S. This structure will result in that each fixture and tool will
have its own specific place, and it gets easier to see what is missing (Jaca et al., 2014).
41
By performing this stage, the second and third S in 5S is achieved. By structuring the
equipment in the cabinets, a clean environment is created in the cabinets at the same time.
Also the equipment are controlled to be in good condition.
5 Take a picture after cleaning and structuring (when the cabinet is in the new standard
mode) in order to show the level of “good cleaning”, this makes it easier to see if
something deviates. Since different people have different levels of what they think is
structure and order, this is a good way to make a standard that everyone can relate to.
6 Put up the picture showing the standard mode, at the inside of the cabinet door, so that
employees always have a knowledge reference of how it should look like.
By putting up a picture, it is easy for the staff to make the new standard sustainable,
referring to the last 5S. This, in order to avoid falling back into the old pattern and
creating a habit for all employees to follow the standard that has been created (Jaca et al.,
2014).
By implementing this improvement proposal and following the plan of action, the goals are to
make it easier for the operators to find the fixtures and tools they are in need of more quickly.
Disturbance of wasting time with searching for the right equipment can then be eliminated as
a result. Thus, the expectations are to reduce the waste of time and devote the time for work
that is of a value adding form. The company has started with this implementation. However,
the actual result of the implementation will not be taken into consideration in this report due
to the incomplete implementation within the time frame.
5.1.3 Ergonomics
As previously mentioned, the operator has to bend over, stretch or extend themselves many
times when picking tube rods from the shelves depending on the placement of the rods. These
movements are seen as waste in form of motion. Furthermore, in the longer run, the body will
be tired and the risk of labour injuries will increase as the body is exposed to a certain amount
of tensions, several times a day (Ohno, 1988). This can be associated with the seventh pillar
Safety, Health & Environment. The purpose is to create a workplace facilitating to achieve
safe working and promote procedures that have a positive effect on the employees to motivate
them. Furthermore, the major objectives of the pillar are to create an environment with non-
existing accidents and health damages in order to strive for the employees’ well-being
(Bundgaard 1996; Singh et al. 2013).
5.1.4 Picking list
The picking list was another big problem discovered. Observing and analyzing the effect
caused by the lack of picking list, resulted to many types of waste being detected. Wastes,
such as unnecessary transportation, waiting and over-processing. The resolution of these
42
situations was either to stand there and look after the article number or go all the way to the
stock.
Waste in form of over-processing occurs, when the operator needs to spend time on searching
after the article number among illogical placement and multiple compartments at the cabinets.
The searching of right material makes the operator inefficient in the process of value adding
work (Harrison et al., 2014). This can take between 2-5 minutes. If the operator cannot find
the material on his own, unnecessary transportation appears. The operator instead has to go all
the way to the stock to inquire a pick list from the order and material handler, as they move
from their own station. At the stock the operator can cause a secondary waste, waiting. It
depends on whether the Order and Material Planner is present and how long it takes for the
Order and Material Planner to solve the problem, finding what material the operator should
pick. This results in additional waste of time since the operator is not performing any value
adding work, time is not being used in an effective way (Liker, 2012).
5.1.5 Lack of material
Lack of material is also a disturbance in the work, making the operator walk down to the
stock and talk with the Order and Material Handler. Like discussed in the previous section
about the picking list, transportation to the stock might result in waste of time in the form of
transportation and waiting.
What differs from the section above is the way over-processing is occurring. It begins with
the operator searching for the material. When they later realize that the kind of tube rods they
need are missing, including at the stock, a deviation report has to be written. However, this
has not always been done. Instead, the operator have sometimes chosen to solve it by cutting
and grinding other tube rods with the same dimensions, but taller.
This in terms strives against both the third and fifth pillar within the TPM. The third pillar,
focused maintenance also known as continuous improvement and Kaizen, cannot be achieved
since the deviation report is not always written. If the report is not written, the problem is not
brought up to the surface so that it could be taken care of, and can thus keep happening and
therefore going against continuous improvements (Bundgaard 1996; Liker 2012). As
continuous improvements cannot be done due to unwritten reports, this could be linked to the
fifth pillar, quality assurance. Defects cannot be prevented and ensured that the measure
values are within the standard values (Singh et al., 2013), as cutting and grinding the tube rods
by the operators themselves.
5.1.6 Wagons
The search of empty wagons is another time consuming activity seen as waste of time. At the
same time, this disturbance leads to wastes, such as unnecessary transportation and waiting. In
other words, unnecessary transportation appears since no value is provided in the working
43
process. The cause of waste in terms of waiting appears when no empty wagon is available,
which leads to time is not being effectively used. Time wasted in this scenario vary but can
end up in a great time loss.
5.1.7 Reporting
When an order is finished, the operator needs to walk outside the station in order to report it in
a computer. This procedure is causing unnecessary transportation due to the repeated amount
of times running back and forth. Likewise, a certain period of standstill is to be reckoned with
as waiting appears when the operator has to wait at a queue that can occur to the computer.
5.1.8 Out buffer and Safety
As the hand welding station shares the same out buffer area together with some other stations,
it many times leads to blockage in the corridors. Affected are those who try to walk past and
even more the trucks that are driving through, as they need to rearrange the buffer wagons
back and forth in order to be able to pass by. Several employees are affected by this situation,
but as the researchers discovered the significance of the problem and that it involved several
other stations, a limitation was therefore drawn to not go any further with the buffers blocking
the corridor. Thus, no improvement proposals regarding this will be obtained.
Moreover, the out buffer prevents the employees to reach the safety equipment attached on
the wall at the station area. This strides against the seventh pillar in TPM concerning Safety,
Health & Environment. According to Bundgaard (1996), the utmost importance of safety is
given in the business plant, which in terms prevents accidents to occur in the environment.
This tends to bring a more positive attitude among the workers (Singh et al., 2013). The
improvement proposals given by the researchers, is for the company to find a more suitable
placement for the safety equipment, as the problem with the buffers standing in the way, will
not be easy to solve quickly. Instead working with small improvements according to Kaizen,
the third pillar of TPM.
5.1.9 Layout
Deviations were noted by the researchers concerning the layout given from the company. The
layout was used as underlay support when performing the observation and writing down the
transportation movements of the operators, as they were working with an order. Though, it
was discovered by the researchers that the position of several objects in the reality, was not in
the layout map of the station. The improvement proposal the researchers gives to the company
concerning this is to update the graphic animated layout, so that it matches the reality.
44
Benches
Benches were specifically missing in the layout. In one of the welding booths, there are two
benches, one with the operator's personal equipment and belonging, while the other one is
containing additional tools. Just like in the other two booths, it could be necessary that the
operator has a personal bench, but the bench with additional tools could be removed. It would
give more space into the area, which can be better utilized, while the additional tools can be
placed with other equipment in the cabinets, so all tools are gathered in one place.
Loose objects
As mentioned before, several loose objects are placed at the welding booths. Some of these
objects are placed in an unstable way and constitutes a security risk. There are also loose
objects at the station that do not belong to the production area such as an umbrella. This is
striving against the seventh pillar concerning Safety, Health & Environment, since the major
purpose of the seventh pillar is to have the cause of zero accidents, zero health damages and
zero fires according to Bundgaard (1996).
The proposal is to install quick release fasteners to easily attach the equipment to wall,
avoiding staff to stumble over them and also avoiding them to overturn. For the bigger fixture
soft leaning against the wall, a device in the form of a steel frame should be inserted. A frame
of two small steel rods standing out horizontally from the wall and a steel frame on the floor
to give support to the leaning fixture.
Welding Unit
As mentioned in section 4.3, something to be removed from the current layout instead of
being added into it is the welding unit not being used. The researchers proposed to the
company during the time of the project, that the welding unit should be removed from the
station as it is not in use and has not been for years. The company implemented the proposal
and took the welding unit away, following the concept of Kaizen with small implementations
for continuous improvement without making any radical changes and at the same time,
striving for incremental improvements (Liker, 2012). The space in the booths where it stood
can now be used better, for example orders that are under progress, seen in the after picture
below (see figure 25).
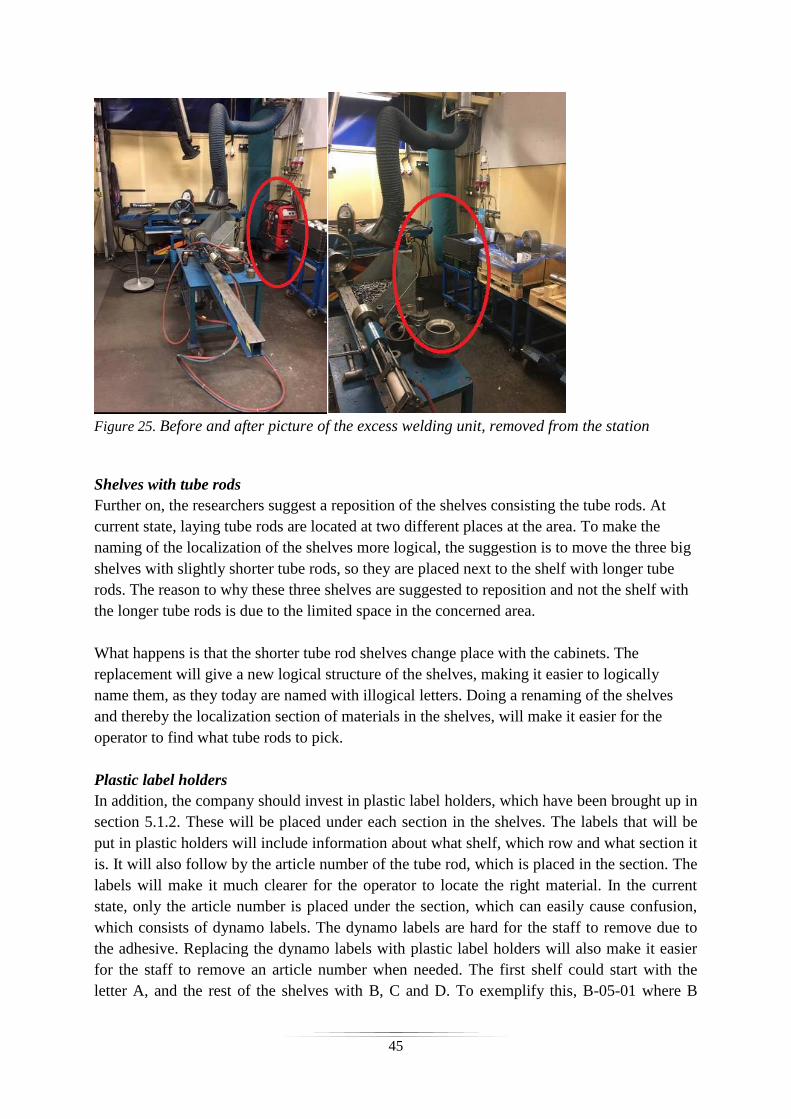
45
Figure 25. Before and after picture of the excess welding unit, removed from the station
Shelves with tube rods
Further on, the researchers suggest a reposition of the shelves consisting the tube rods. At
current state, laying tube rods are located at two different places at the area. To make the
naming of the localization of the shelves more logical, the suggestion is to move the three big
shelves with slightly shorter tube rods, so they are placed next to the shelf with longer tube
rods. The reason to why these three shelves are suggested to reposition and not the shelf with
the longer tube rods is due to the limited space in the concerned area.
What happens is that the shorter tube rod shelves change place with the cabinets. The
replacement will give a new logical structure of the shelves, making it easier to logically
name them, as they today are named with illogical letters. Doing a renaming of the shelves
and thereby the localization section of materials in the shelves, will make it easier for the
operator to find what tube rods to pick.
Plastic label holders
In addition, the company should invest in plastic label holders, which have been brought up in
section 5.1.2. These will be placed under each section in the shelves. The labels that will be
put in plastic holders will include information about what shelf, which row and what section it
is. It will also follow by the article number of the tube rod, which is placed in the section. The
labels will make it much clearer for the operator to locate the right material. In the current
state, only the article number is placed under the section, which can easily cause confusion,
which consists of dynamo labels. The dynamo labels are hard for the staff to remove due to
the adhesive. Replacing the dynamo labels with plastic label holders will also make it easier
for the staff to remove an article number when needed. The first shelf could start with the
letter A, and the rest of the shelves with B, C and D. To exemplify this, B-05-01 where B
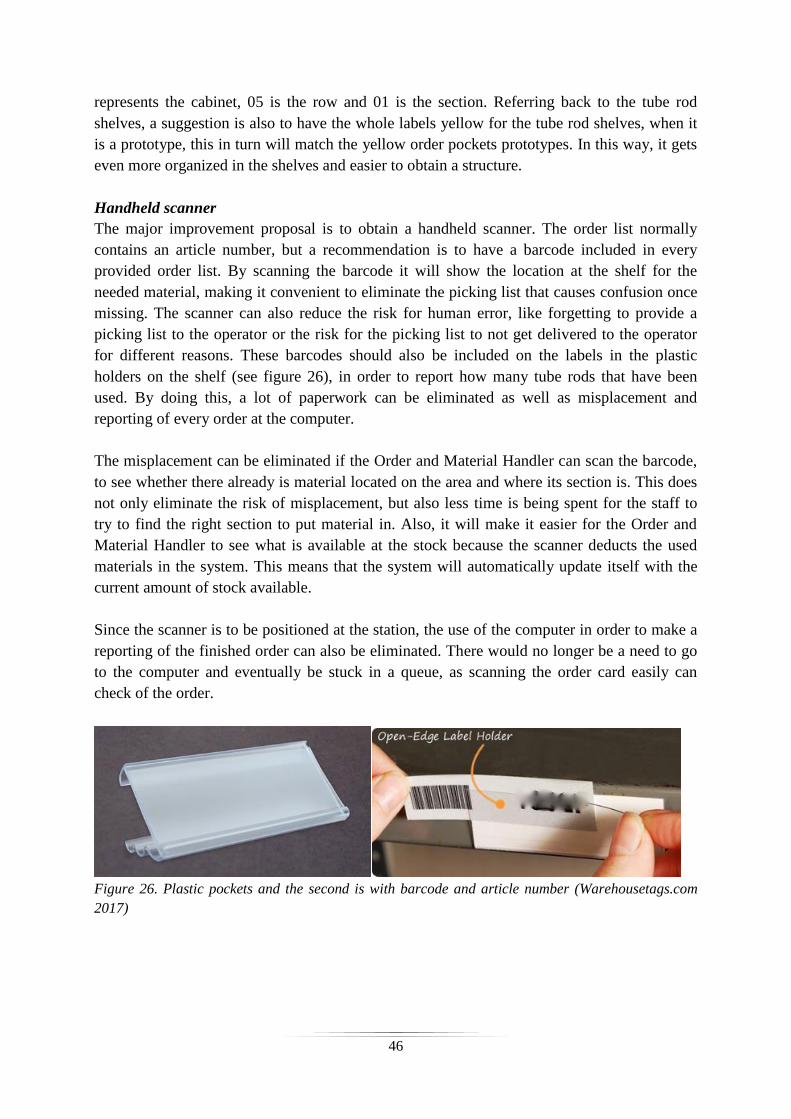
46
represents the cabinet, 05 is the row and 01 is the section. Referring back to the tube rod
shelves, a suggestion is also to have the whole labels yellow for the tube rod shelves, when it
is a prototype, this in turn will match the yellow order pockets prototypes. In this way, it gets
even more organized in the shelves and easier to obtain a structure.
Handheld scanner
The major improvement proposal is to obtain a handheld scanner. The order list normally
contains an article number, but a recommendation is to have a barcode included in every
provided order list. By scanning the barcode it will show the location at the shelf for the
needed material, making it convenient to eliminate the picking list that causes confusion once
missing. The scanner can also reduce the risk for human error, like forgetting to provide a
picking list to the operator or the risk for the picking list to not get delivered to the operator
for different reasons. These barcodes should also be included on the labels in the plastic
holders on the shelf (see figure 26), in order to report how many tube rods that have been
used. By doing this, a lot of paperwork can be eliminated as well as misplacement and
reporting of every order at the computer.
The misplacement can be eliminated if the Order and Material Handler can scan the barcode,
to see whether there already is material located on the area and where its section is. This does
not only eliminate the risk of misplacement, but also less time is being spent for the staff to
try to find the right section to put material in. Also, it will make it easier for the Order and
Material Handler to see what is available at the stock because the scanner deducts the used
materials in the system. This means that the system will automatically update itself with the
current amount of stock available.
Since the scanner is to be positioned at the station, the use of the computer in order to make a
reporting of the finished order can also be eliminated. There would no longer be a need to go
to the computer and eventually be stuck in a queue, as scanning the order card easily can
check of the order.
Figure 26. Plastic pockets and the second is with barcode and article number (Warehousetags.com
2017)
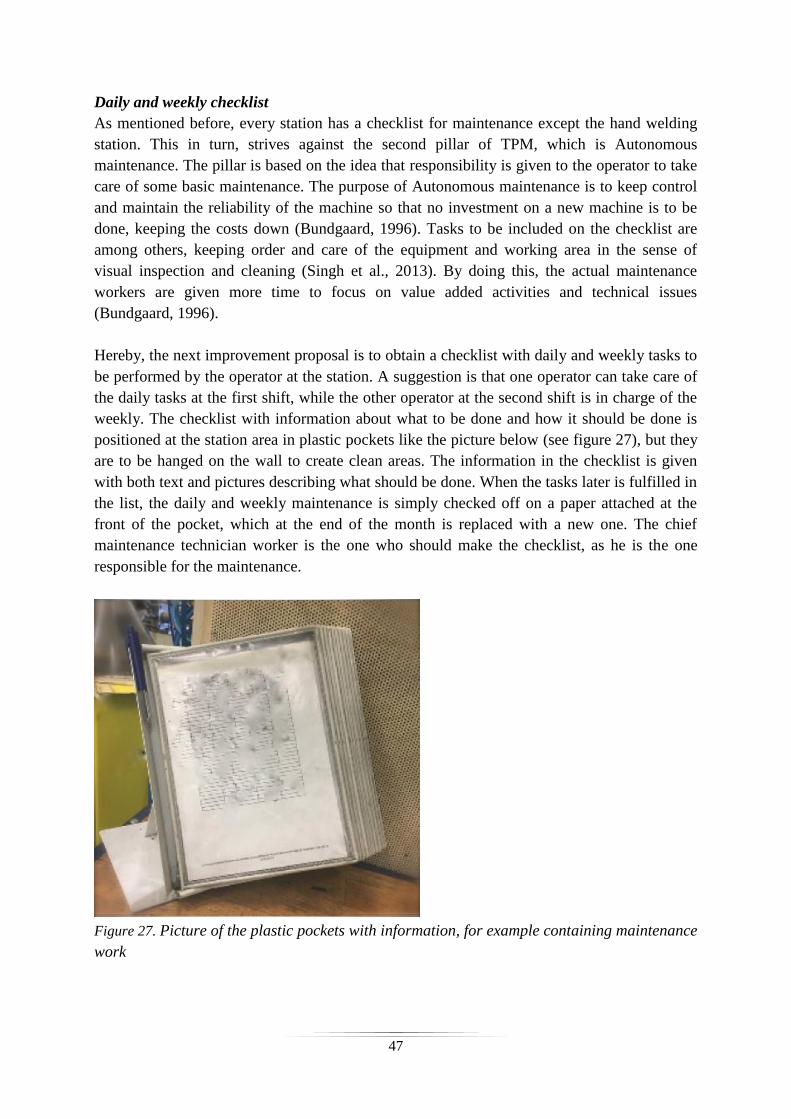
47
Daily and weekly checklist
As mentioned before, every station has a checklist for maintenance except the hand welding
station. This in turn, strives against the second pillar of TPM, which is Autonomous
maintenance. The pillar is based on the idea that responsibility is given to the operator to take
care of some basic maintenance. The purpose of Autonomous maintenance is to keep control
and maintain the reliability of the machine so that no investment on a new machine is to be
done, keeping the costs down (Bundgaard, 1996). Tasks to be included on the checklist are
among others, keeping order and care of the equipment and working area in the sense of
visual inspection and cleaning (Singh et al., 2013). By doing this, the actual maintenance
workers are given more time to focus on value added activities and technical issues
(Bundgaard, 1996).
Hereby, the next improvement proposal is to obtain a checklist with daily and weekly tasks to
be performed by the operator at the station. A suggestion is that one operator can take care of
the daily tasks at the first shift, while the other operator at the second shift is in charge of the
weekly. The checklist with information about what to be done and how it should be done is
positioned at the station area in plastic pockets like the picture below (see figure 27), but they
are to be hanged on the wall to create clean areas. The information in the checklist is given
with both text and pictures describing what should be done. When the tasks later is fulfilled in
the list, the daily and weekly maintenance is simply checked off on a paper attached at the
front of the pocket, which at the end of the month is replaced with a new one. The chief
maintenance technician worker is the one who should make the checklist, as he is the one
responsible for the maintenance.
Figure 27. Picture of the plastic pockets with information, for example containing maintenance
work
48
By introducing the checklist as a part of the TPM, Autonomous maintenance, the hand
welding station can be maintained. This in turn makes the annual check much smoother for
the maintenance workers, since many errors can be avoided. Considering the current situation
of the non-checklist regarding the hand welding station, there is nothing that can actually
confirm that the daily and weekly maintenance work has been done. Even though a station
area seems clean at the surface, it does not ensure that everything beneath are as it should. For
example, some components could be missing at the machine, causing effects that can only be
seen when a problem occurs. However, by introducing the visual checklist, the pillar of
Autonomous maintenance can be strengthened and achieved. Thereto, self-awareness of the
operator's responsibility and the condition of their equipment and work increases by having
the operators doing some maintenance work themselves (Rodrigues and Hatakeyama, 2006).
5.2 The 5 why
Based on the first S - Sorting, necessary and unnecessary material could be identified. This
was achieved by collecting the whole team and starting a discussion regarding what is really
needed to attend to their daily work, according to Petersson (2015). In order to find out which
station the material belonged to and why it was there required an investigation. This
investigation resulted in the 5 why. The result of the investigation answer to the root cause of
who, where and why concerning the situation of the welding wire. The investigation carried
on to an analysis and then into alternative improvement proposals with related action plan for
the company to implement by the researchers.
This situation was considered as a small doable implementation that could be done
immediately, which also supports the concept of Kaizen (Bundgaard, 1996). Kaizen
represents small improvements in order to achieve a higher purpose. The implementation has
therefore taken place, where the welding wire not belonging to the hand welding station got
removed. While the welding wires associated to the hand welding were moved into the
cabinet, leading to the achievement of the second S - Set in order and also the third S- Shine.
The used material now has its own specific place. Petersson et al., (2015) also claims the
importance of the tools to be placed next to or nearby the working area. As well as the
material is ensured to be in good condition (Jaca et al., 2014).
The researchers had made a calculation and drew a picture over how many, and how, the
packages with welding wire could be fitted into the cabinet and handed it over to the company
for action, see appendix 4. Further on, the fourth and final S- Standardise and Sustain are
achieved, since the station from now on will have the welding wire laying at the station area.
It is also from here the operators now will go and pick the welding wire when it is in need for
change. Furthermore it is at this place the suppliers will make the replenishment.
The implementation was done according to the improvement proposal. Though, in
conjunction with the replenishment, complications with external factors, leads to the fact that
it is not possible for the company to have the welding wire in the cabinet. Only half of the
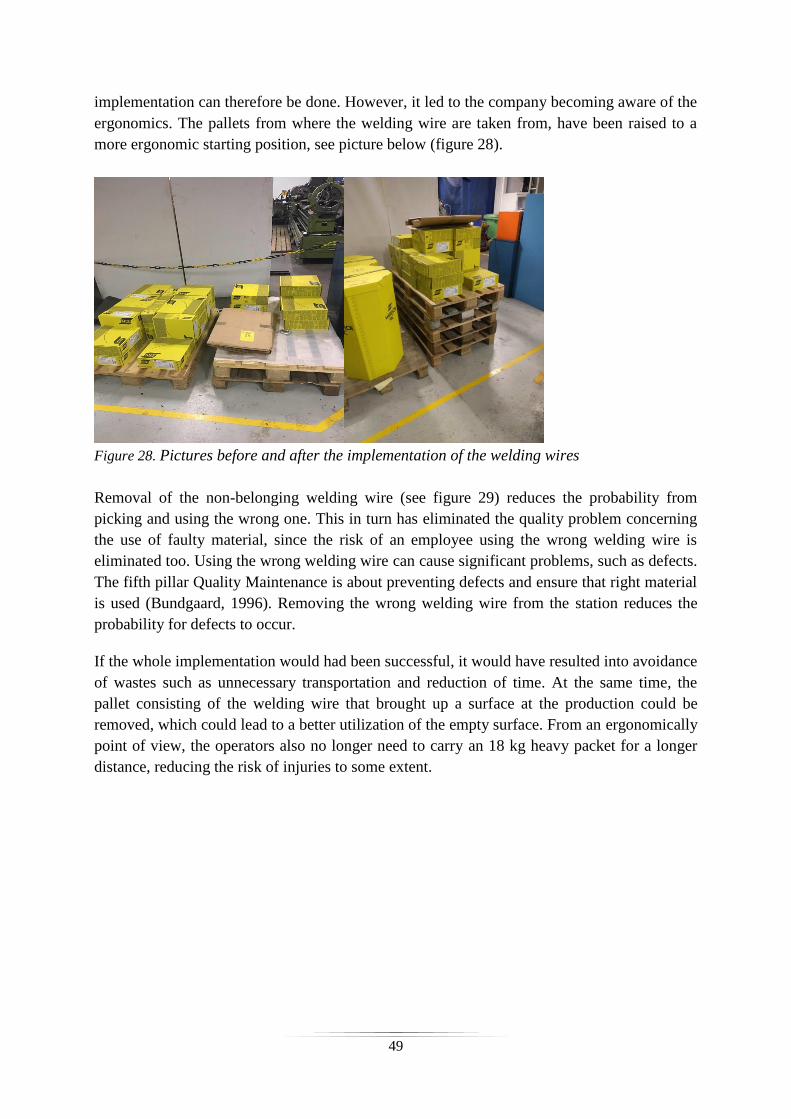
49
implementation can therefore be done. However, it led to the company becoming aware of the
ergonomics. The pallets from where the welding wire are taken from, have been raised to a
more ergonomic starting position, see picture below (figure 28).
Figure 28. Pictures before and after the implementation of the welding wires
Removal of the non-belonging welding wire (see figure 29) reduces the probability from
picking and using the wrong one. This in turn has eliminated the quality problem concerning
the use of faulty material, since the risk of an employee using the wrong welding wire is
eliminated too. Using the wrong welding wire can cause significant problems, such as defects.
The fifth pillar Quality Maintenance is about preventing defects and ensure that right material
is used (Bundgaard, 1996). Removing the wrong welding wire from the station reduces the
probability for defects to occur.
If the whole implementation would had been successful, it would have resulted into avoidance
of wastes such as unnecessary transportation and reduction of time. At the same time, the
pallet consisting of the welding wire that brought up a surface at the production could be
removed, which could lead to a better utilization of the empty surface. From an ergonomically
point of view, the operators also no longer need to carry an 18 kg heavy packet for a longer
distance, reducing the risk of injuries to some extent.
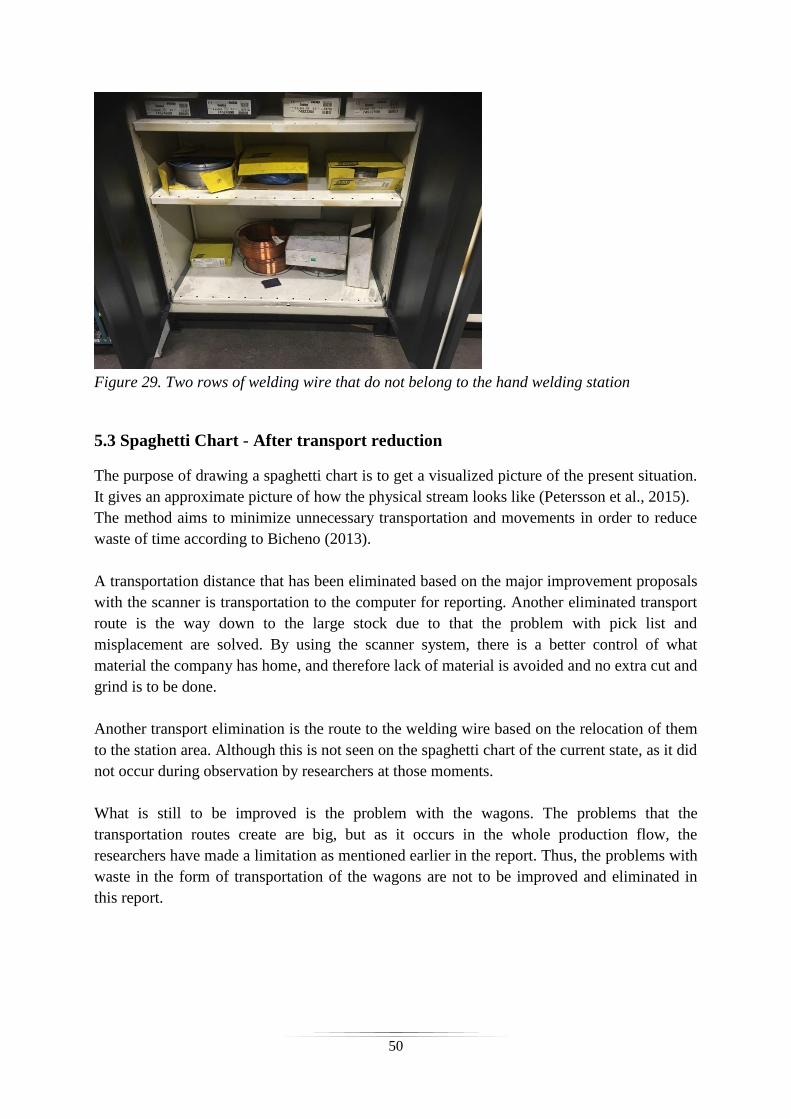
50
Figure 29. Two rows of welding wire that do not belong to the hand welding station
5.3 Spaghetti Chart - After transport reduction
The purpose of drawing a spaghetti chart is to get a visualized picture of the present situation.
It gives an approximate picture of how the physical stream looks like (Petersson et al., 2015).
The method aims to minimize unnecessary transportation and movements in order to reduce
waste of time according to Bicheno (2013).
A transportation distance that has been eliminated based on the major improvement proposals
with the scanner is transportation to the computer for reporting. Another eliminated transport
route is the way down to the large stock due to that the problem with pick list and
misplacement are solved. By using the scanner system, there is a better control of what
material the company has home, and therefore lack of material is avoided and no extra cut and
grind is to be done.
Another transport elimination is the route to the welding wire based on the relocation of them
to the station area. Although this is not seen on the spaghetti chart of the current state, as it did
not occur during observation by researchers at those moments.
What is still to be improved is the problem with the wagons. The problems that the
transportation routes create are big, but as it occurs in the whole production flow, the
researchers have made a limitation as mentioned earlier in the report. Thus, the problems with
waste in the form of transportation of the wagons are not to be improved and eliminated in
this report.
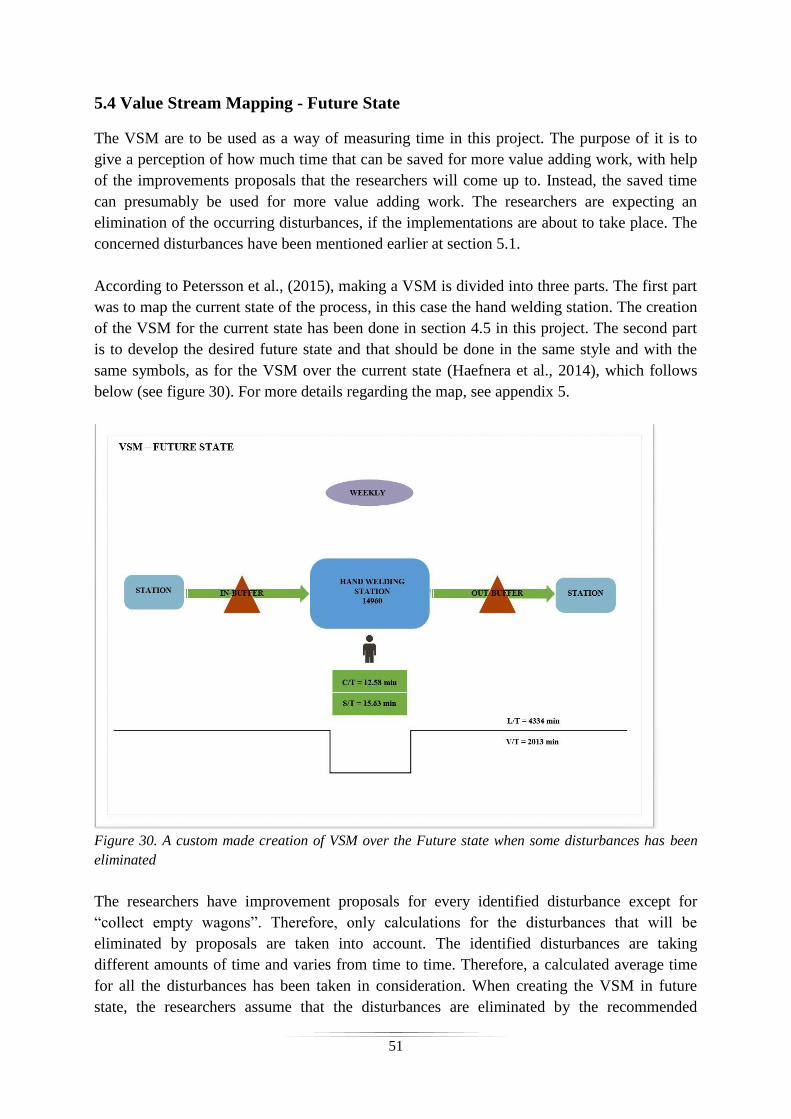
51
5.4 Value Stream Mapping - Future State
The VSM are to be used as a way of measuring time in this project. The purpose of it is to
give a perception of how much time that can be saved for more value adding work, with help
of the improvements proposals that the researchers will come up to. Instead, the saved time
can presumably be used for more value adding work. The researchers are expecting an
elimination of the occurring disturbances, if the implementations are about to take place. The
concerned disturbances have been mentioned earlier at section 5.1.
According to Petersson et al., (2015), making a VSM is divided into three parts. The first part
was to map the current state of the process, in this case the hand welding station. The creation
of the VSM for the current state has been done in section 4.5 in this project. The second part
is to develop the desired future state and that should be done in the same style and with the
same symbols, as for the VSM over the current state (Haefnera et al., 2014), which follows
below (see figure 30). For more details regarding the map, see appendix 5.
Figure 30. A custom made creation of VSM over the Future state when some disturbances has been
eliminated
The researchers have improvement proposals for every identified disturbance except for
“collect empty wagons”. Therefore, only calculations for the disturbances that will be
eliminated by proposals are taken into account. The identified disturbances are taking
different amounts of time and varies from time to time. Therefore, a calculated average time
for all the disturbances has been taken in consideration. When creating the VSM in future
state, the researchers assume that the disturbances are eliminated by the recommended
52
improvement proposal. The result gives a time saving of 3,5 % per week if the disturbances
are eliminated, representing 200 minutes of time saving each week, giving 800 minutes per
month.
A Value Stream Mapping is a powerful and effective method in its simplicity, where the
mapping is made from incoming material all the way to out loading. Using it incorrectly can
be counterproductive according to Petersson et al., (2015). As mentioned earlier by the
researchers, limitations have been drawn due to the time frame and size of the project.
Because of this, only the hand welding station with its in- and out-buffer stocks are taken into
consideration when the VSM has been created. Normally the typical way of creating a VSM
is to study the stream in the whole production process and follow a chosen product family
(Jarebrant et al., 2015). Therefore, the researchers do not recommend only improving and
making one part of the process flow more effective, since it could lead to suboptimization.
This can also lead to negative effects. As mentioned before, other stations in the same flow
are under similar investigation as the hand welding station, and improvement proposals of all
the stations should be done at the same time.
The third step which includes the work of improvements, Petersson et al., (2015) mentioned
the importance that the idea of the future state is broken down into smaller parts, in order to
make a more manageable task of work. The researchers have come up with several
improvement proposals and some small ones have been implemented by the company,
following the concept of Kaizen with continuous improvements. In section 5.3, analysis has
been made and improvement proposals generated, in order to find a way to eliminate
disturbances observed during this project. The disturbances on the paper that hanged on the
cabinet are those that were the most occurring ones daily, according to interviews that were
made. Although, it is not just the improvement proposals of these ones that affect the VSM in
the current and future state. Also other disturbances mentioned have an effect on the
processes, although they are not included in the mapping of the value stream as the VSM is
constructed over a weekly state, and other disturbance happens more seldom.
For instance, to go and get the welding wire takes six minutes each time, and needs to be
exchanged twice a month. From this, it is given 12 minutes of wasted time per month, which
gives one hour and 12 minutes per half year. When improvement proposals have been
implemented, the reduction of the time went down from six minutes to one minute, see
appendix 6. Instead of walking out from the station, the welding wire from now on can be
collected in a cabinet at the station area.
Another disturbance not brought up on the disturbance paper was the occurrence of
happenings within making the reporting at the computer. Except the transport to the computer,
it could include a queue to the computer, with eventually waiting based on logins to the
system page and the defect of not going back to initial state. Based on interviews, the
reporting happens about ten times per shift, which is 20 times a day. With a time spent of two
minutes each occurrence, it gives a approximation of 200 minutes a week that is lost on this
occurrence per shift. Based on the improvement proposal presented in chapter 5.1.9 under
53
Layout concerning the scanner, this problem could be eliminated and results in a time save of
200 minutes a week. Giving a time save of 800 minutes a month, see appendix 7 for
calculations. Except those 800 minutes of waste that can be saved per month, further 10
minutes from the improvement with the welding wire, and 800 minutes for the reporting.
Adding these values together, gives a time saving of 24,2 hours per month, if improvement
proposals are implemented which will eliminate the disturbances. Not taking holidays into
consideration, working hours per month is 300 hours. This gives a number of 8,2% waste a
month that could be spent on more value adding work.
54
6. Discussion
In this chapter, reflection over analysis and results are made. It aims to raise discussion
whether process could have been made in a different way, as well as give the reader insight
into how the researchers look at the problems regarding the different improvement proposals.
It is also brought up how different circumstances have affected the project in different way.
It is difficult in a short time, to see what effect the developed improvement proposals have on
the company for the current situation with regard to the time frame of this project. A few
smaller proposals have been implemented while more demanding and time consuming
proposals have just been commenced. The improvement proposal with the action plan
regarding fixtures mentioned in section 4.1.3 got a positive response by the company. Except
from the commenced implementation regarding the hand welding station, the company has
also decided to introduce the concept developed at several other stations in the plant. It could
be pointed out that the approach used in this project and the improvement proposals with
related action plan are very general generated. In fact, they are so basically and generally
constructed, that similar production companies with similar conditions can apply the same
concept, which in turn represents a sustainable plan of work. As written before, in the
introduction 1.1, this project is important to investigate with regard to several aspects from a
company perspective, such as productivity, visualization and quality. Also ergonomics and
safety are aspects that are involved. The improvement proposals generated covers these
different aspects from a perspective of the company.
As mentioned earlier in Limitation, section 1.4, it is important to not only focus on doing
improvement on only one station in the production flow. The rest of the stations in production
flow is to be taken into consideration too, in order to prevent suboptimizing as the stations in
the production flow is coherent. This is also something that have occurred during this project,
for example, the improvements proposal concerning the investment in hand holding scanners
has been brought up earlier. Several disturbances could be reduced by this implementation,
but it coincides with the whole production system. In order to eliminate some disturbances in
one station, a system has to be applied in which the rest of the production has to be involved
too, and similar disturbances has a good chance to be eliminated as well. Investing in hand
holding scanners for every station will probably entail in high financial cost. This in turn, will
save 3.5 % each week of the eliminated disturbances, which will generate in more value
adding time. In overall the production will be more effective and less disturbances will exist.
Though, the improvement proposal is just a basic idea of how the company can act in order to
eliminate disturbances and make the production process more effective. How it actually is to
be worked with and implemented in detail, is open for further investigation. It is not
something the researchers can go into as it lays outside the time limit and area of expertise.
The same goes for the disturbance of empty wagons. It was not something the researchers
could go deeper into, as investigation showed that the problem existed in the entire production
plan. It is a serious problem though, the company has and something that is recommended to
be looked deeper into.
55
An important thing for the company to have in consideration, if they decide to implement the
improvement proposals, is the continuing work. The use of TPM´s general purpose is to
increase competition, reduce lead times and produce a product with higher quality which
requires long-term focus on improvement work (Sharma et al., 2006). Implementations of 5S
are proven to result into both quality and productivity changes that are achieved. Result
factors such as time saved, less defects and comfortable employees are some examples of
what the concept can lead to in the long run (Bayo‐Moriones et al., 2010). Implementing the
suggestions will take the hand welding station a step into the right direction towards achieving
5S and TPM. Hence, Kaizen is one of the eight pillars in TPM, which in turn is all about
always striving for continuous improvement by involving all people in the station (Bergman
and Klefsjö, 2012). This means, the suggested improvements proposals are not set to be an
absolute final solution. They might eliminate some existing problems and disturbances, but as
stated in the introduction, no stream is so effective and flawless that improvements cannot be
done, and the same goes with system overall.
The implementation regarding the welding wire was not fully implemented, due to external
causes that were discovered in conjunction with the replenishment. However, this
improvement has contributed to the company's awareness regarding the importance with
ergonomics. The placement of welding wires, fixtures and tools at shelves and cabinets are
examples of this. Not only ergonomics in the aspect of health had a raised awareness but also
the safety in the station. In aspects of the seventh pillar, Safety, Health & Environment is
about creating a safe workplace and surrounding area which can generate zero accidents, zero
health damages and zero fires (Bundgaard, 1996). It is therefore important that the layout is
updated and matched with reality in case of something unforeseen danger should happen,
requiring the layout to locate something or someone. With regard to this, the researchers
therefore claim that it is important that the company follows these strong recommendations
that are given in the analysis under section 5.1.
During the analysis, improvement suggestions regarding 5S have been presented. This has
been accomplished by clearly describing how the company can proceed by the action plan.
Each improvement proposal has been prepared by doing an analysis of the current state.
A major challenge for a company is to adapt the employees´ behavior, attitudes and
experiences to increase the efficiency of the work that is being done. To get all employees to
really follow the agreed standard and make it into a habit and discipline is often the most
difficult part (Jaca et al., 2014). The employees are accustomed to the culture they are used to
and believe that their workstations are good the way it is. It is important that the employees
have a positive attitude with change and improvements. It does not have to be major changes
for improvement, even small adjustments can lead to major improvements, Kaizen see chapter
3.3.1.
In this project, the major empirical data is based on the interviews made with the employees
in the production. A consideration regarding ethics is togetherness. Therefore, the researchers
spend much time in deliberating with the employees and always tried to involve everyone in
order to prevent the feeling of omitted over the improvement proposals. This in turn, is related
56
to Kaizen, which is about striving for continuous improvement by involving all people
(Bundgaard, 1996). Also, a recalcitrant existed towards the concept of 5S and TPM among the
production employees. 5S and TPM have been implemented before, but have somehow fallen
into the old pattern again, giving the employees a bad experience of the concepts. During the
procedure of the project the employees became more recipient for the concepts and the idea of
the improvement suggestions. This can also be related to sustainability in 5S, meaning it is
important to have in mind that it takes time to change attitudes and behavior among the
employees (Petersson et al., 2015). For further work with implementations, it is important for
the company to not only give information, but also really make the employees feel involved
by discussion and motivation to why improve something.
To get a measurement of time saving, the VSM was created. Also spaghetti charts have been
constructed in order to gather data for the VSM. As only four spaghetti charts were made, it is
hard to cover all possible transportations and procedures that can occur during the work of
process. If more charts were to be made, other results could have occurred, such as the
numbers of appearances consider the different disturbances. The amount of time regarding
orders varies in a wide range as well as the difficultness of an order. Then, it is also important
to state that when the average order size was taken out, they were all based on the same
month. Whether this investigation was to be done during another time of the year, the average
order size could have been divergent. By this, it could be questioned whether the results in the
VSM would have differ a lot, if data have been gathered in another period. In comparison with
the data given in the established current state of this report, it could then be questioned how
the results of wasted time and thereby saved, could differ.
7. Recommendations
In this chapter further recommendations are made to the company, which stretches outside
the limitations of studying and improving the hand welding station.
It is recommended for the company to start with the daily and weekly routine with the
checklists at each station. Once they are more familiar and accustomed with the checklist, a
recommendation is to implement another type of checklist sheet, which is attached at the
jointly whiteboard. It should be a laminated checklist for checking that maintenance has been
done at each station. When the daily maintenance check is done at the station, the operator
walks to the jointly whiteboard. At the whiteboard, he should fill in that the maintenance work
of the day has been done. By the end of the month, the whiteboard can be easily wiped out.
57
8. Conclusion
The final answer of the research question is given and also how the purpose is achieved.
Conclusions of what the researchers have come up to during the investigation of this project.
The aim with this project was to analyze the current situation of the hand welding station at
Parker Hannifin in Falköping, and then compare it with literature theories found in purpose to
generate improvement proposals. Semi-structured interviews where applied, combined with
observations. It was thereby possible for the researchers to state the current situation of the
hand welding station and generate improvement proposals. Hereby, the improvements the
company must implement to achieve the expected results have been presented. Improvement
proposals will mainly reduce waste in terms of waiting and transportation as well as bringing
a standardized approach and improved visualization in the company.
To answer the research question: What improvements within 5S and TPM can be done to the
machine station hand welding? The improvements that can be made within the hand welding
station are reorganization within the shelves and structuring tools and equipment. Further
improvements are the update of the layout and improvements concerning safety and health in
different aspects. The largest and most requiring improvement proposal that will eliminate
different types of disturbances is the investment of the handheld scanners. The expected
results of all studies regarding the improvement proposals proved a time saving of 8,2 % per
month, which can be used on more value adding work.
It can be concluded, with the use of methods such as VSM, spaghetti charts and 5 why,
problems and deficiencies becomes more visualized. This in turn, can easily be identified
whereas solutions and improvements are being created and implemented. In order to have a
chance to verify the results, the best would have been to have more time for implementations.
This verification will hopefully come in the nearby future, by following the suggested
improvement proposals and begun investigation made in this project, by the company.
58
References
Ahuja, I.P.S. and Khamba, J.S. (2008),"Total productive maintenance: literature review and
directions", International Journal of Quality & Reliability Management, Vol. 25 Iss 7 SS. 709
- 756
Andersen H. (1994), Vetenskapsteori and metodlära. Lund: Studentlitteratur
Bayo‐Moriones, A., Bello‐Pintado, A., Merino‐Diaz de Cerio, J. (2010) "5S use in
manufacturing plants: contextual factors and impact on operating performance", International
Journal of Quality & Reliability Management, Vol. 27, Iss 2, SS. 217-230
Bergman, B., Klefsjö, B. (2012), Kvalitet från behov till användning. Lund: Studentlitteratur.
Bicheno, J. (2013), Ny Verktygslåda för Lean: Filosofi, transformation, metoder and verktyg,
5 uppl. Göteborg: Revere
Boyle, T.A., Scherrer-Rathje, M. and Stuart, I. (2011), "Learning to be lean: the influence of
external information sources in lean improvements", Journal of Manufacturing Technology
Management, Vol. 22 No. 5, pp. 587-603.
Brown, A., Eatock, J., Dixon, D., Meenan, B.J. and Anderson, J. (2008), “Quality and
continuous improvement in medical device manufacturing”, The TQM Magazine, Vol. 20 No.
6, pp. 541-55.
Bryman, A. (2011), Samhällsvetenskapliga metoder. Malmö: Liber.
Bundgaard, N. H. (1996), TPM activities in denmark, Conference Proceedings “Euro
maintenance 96”, Copenhagen Denmark, SS: 21-23.
Burton, T. and Border, S. (2003), The Lean Extended Enterprise: Moving beyond the Four
Walls to Value Stream Excellence, J. Ross Publishing, Boca Raton, LA.
Emerald insight, (1997) "Happy ever after?", Management Development Review, Vol. 10
Issue: 7, pp.244-245,
Eriksson, L.T & Wiedersheim-Paul, F 2001. Att utreda, forska and rapportera, Malmö: Liber
Ekonomi AB
Gröndahl, F & Svanström, M. (2011). Hållbar utveckling: en introduktion för ingenjörer och
andra problemlösare. 1. uppl. Stockholm: Liber
59
Haefnera, B., Kraemera, A., Staussa, T., Lanzaa, G. (2014), “Quality Value Stream Mapping”,
Procedia CIRP, Vol 17, 2014, SS. 254-259
Harrison, A., Van Hoek, R., Skipworth, H. (2014), Logistics management and strategy:
competing through the supply chain, SS.255
Hobbs, D.P. (2004), Lean Manufacturing Implementation, 1st ed., Ross Publishing, Boca
Raton, FL.
Jaca, C., Viles, E., Paipa-Galeano, L., Santos, J., and Mateo, R. (2014), “Learning 5S
principles from Japanese best practitioners: case studies of five manufacturing companies”,
International Journal of Production Research, Vol 52, No. 15
Jarebrant, C., Winkel, J., Johansson Hanse, J., Mathiassen, S. E., Öjmertz, B. (2015),
”ErgoVSM: A Tool for Integrating Value Stream Mapping and Ergonomics in
Manufacturing”, Human Factors and Ergonomics in Manufacturing and Service Industries,
Vol 26, Iss 2, SS. 191-204
Liker, J. (2012), The Toyota Way. Malmö: Liber AB.
Ljungberg, Örjan (1997). Att förstå & tillämpa TPM. 3., omarb. uppl. Vimmerby: TPM
institutet
Logistics management and strategy: competing through the supply chain (2014) Alan
Harrison, Remko van Hoek, Heather Skipworth. s.255.
Lundahl, Ulf. Skarvad, Per-Hugo (2000) Utredningsmetodik for samhallsvetare and
ekonomer. Lund: Studentlitteratur. Tredje upplagan.
Michael E. Porter and Mark R. Kramer (2006) Strategy and Society: The Link between
Competitive Advantage and Corporate Social Responsibility. Harvard Business Review 84,
no. 12: s.78-92
Mignaqui, V. (2014), “Sustainable Developement as a Goal: Social, Environmental and
Economic Dimensions”, The International Journal of Social Quality, Oxford 4.1, s.57-77
Murugaiah, U., Jebaraj Benjamin M, J., Marathamuthu, S., Muthaiyah, S. (2010),"Scrap loss
reduction using the 5-whys analysis", International Journal of Quality & Reliability
Management, Vol. 27 Iss 5 SS. 527 - 540
Nakajima, S. (1992), Introduktion till TPM: totalt produktivt underhall. Are: TQM
produktionsskolan
60
Parker.com (2017), About us. http://www.partker.com/portal/site/PARKER/menu [2017-03-
20].
Patel, R. & Davidson, B. (1994), Forskningsmetodikens grunder – Att planera, genomföra
and rapportera en undersökning. Lund: Studentlitteratur
Petersson, P., Olsson, B., Lundström, T., Johansson, O., Broman, M., Blucher, D., Alsterman,
H. (2015), LEAN - gör avvikelser till framgång, Part Development AB, SS. 307)
Rodrigues, M., Hatakeyama, K. (2006), “Analysis of the fall of TPM in companies”, Journal
of Materials Processing Technology, Vol 179, SS. 276–279
Rother, Mike. Shook, John. (2004) Lära sig se: Att kartlägga and förbättra värdeflöden för
att skapa mervärden and eliminera slöseri. Plan utbildning and Lean Forum. Stockholm
Shamah, R. (2008), "A framework for enhancing productivity efficiency through application
of knowledge management", The International Journal of Knowledge Management & Culture
Change, Vol. 8 No. 3, pp. 47-67.
Sharma, K.S., Kumar, D. & Kumar, P. (2006) Manufacturing excellence through TPM
implementation: a practical analysis. Industrial Management & Data Systems, Vol. 106, No.
2, 256-280
Singh, R., Gohil, A. M., Shah, D. B., Desai, S. (2013), “Total Productive Maintenance (TPM)
Implementation in a Machine Shop: A Case Study”, Procedia Engineering, Vol 51, SS. 592-
599)
Sörqvist, L. (1998) Kvalitetsbristkostnader. Lund: Studentlitteratur.
Sorqvist, L. (2004), Standiga forbattringar, Lund: Studentlitteratur.
Ohno, T 1988. Toyota production system. 1:a upplagan. Productivity Press
Womack, J. P., Jones, D. T., & Roos, D. (1990). The machine that changed the world. New
York,
Womack, J.P. & Jones, D.T. (2003). Lean Thinking - Banish Waste and Create Waste in Your
Organization. London: Simon & Schuster UK Ltd.
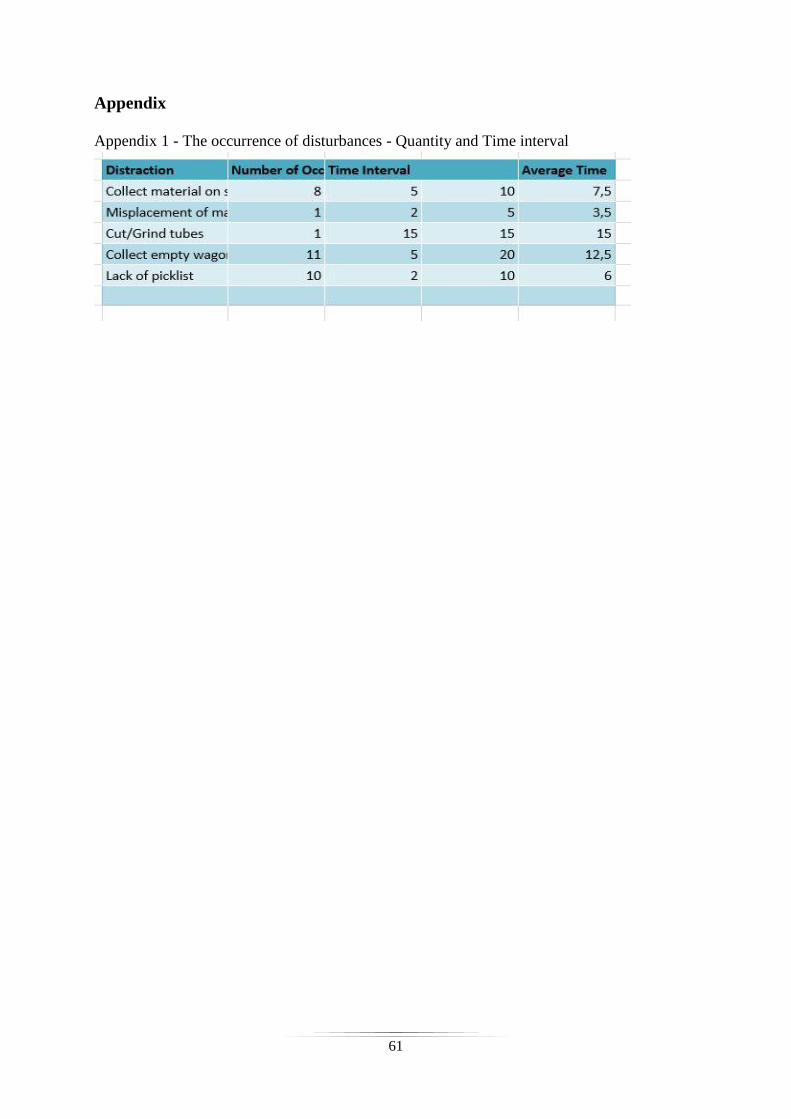
61
Appendix
Appendix 1 - The occurrence of disturbances - Quantity and Time interval
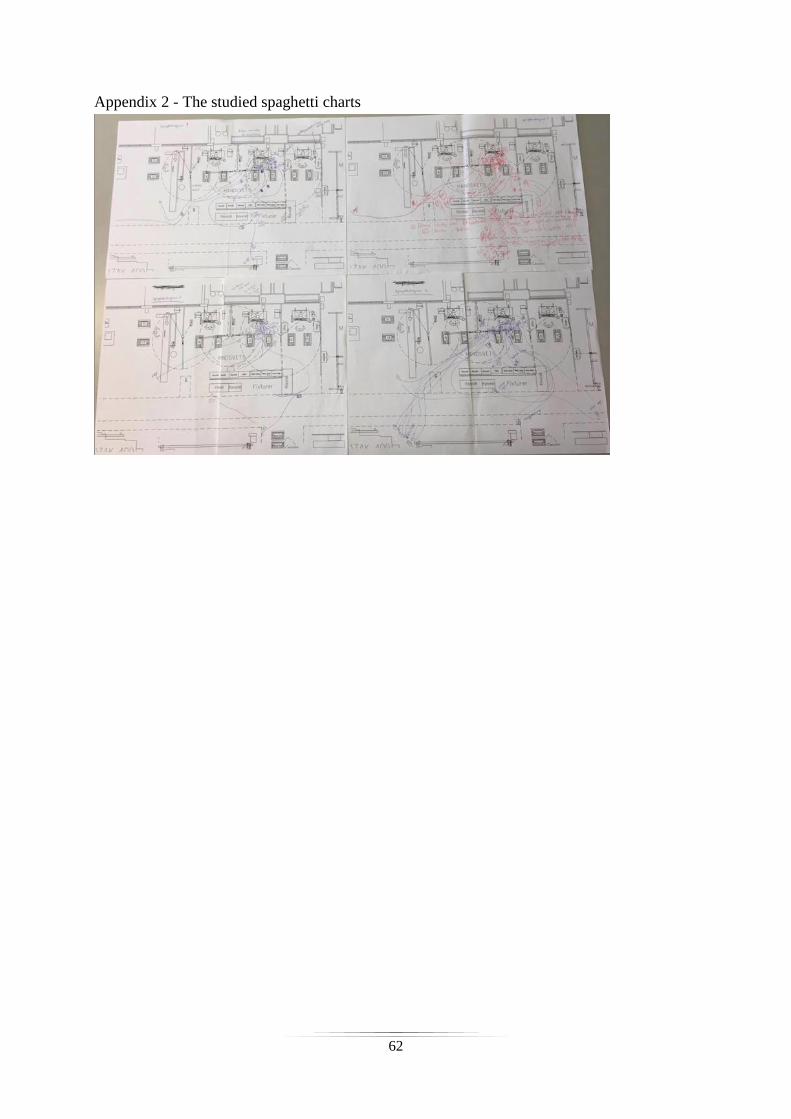
62
Appendix 2 - The studied spaghetti charts
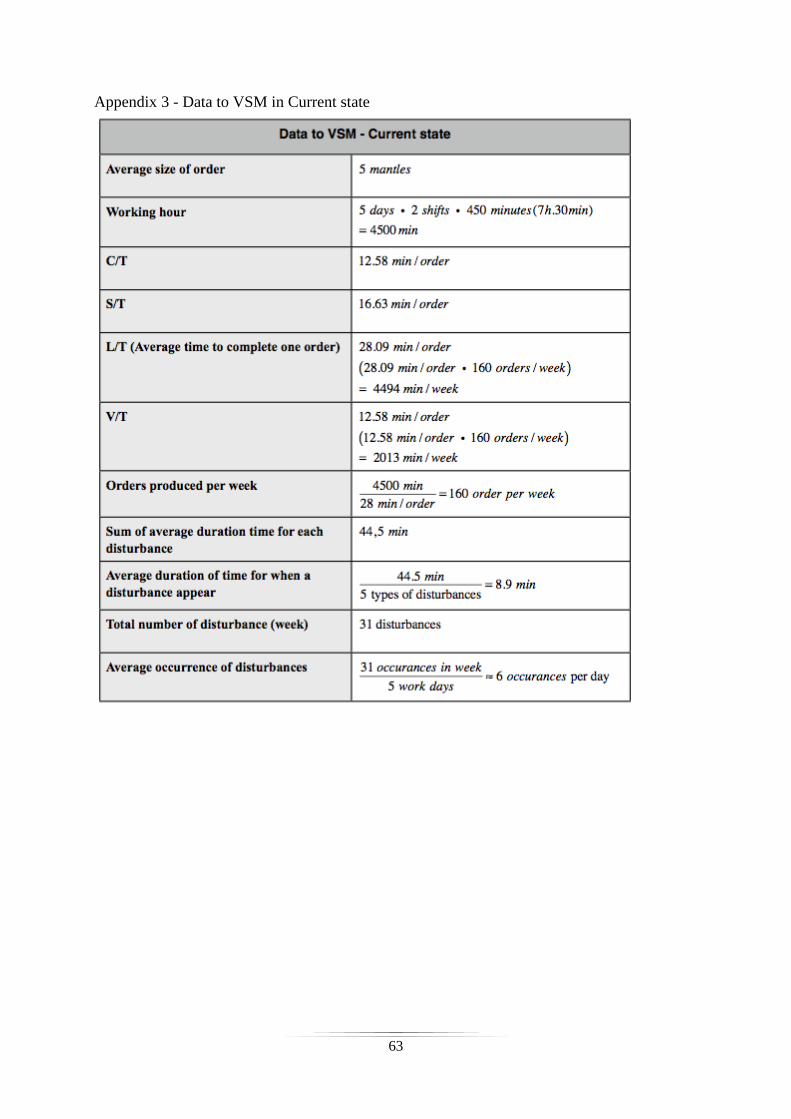
63
Appendix 3 - Data to VSM in Current state
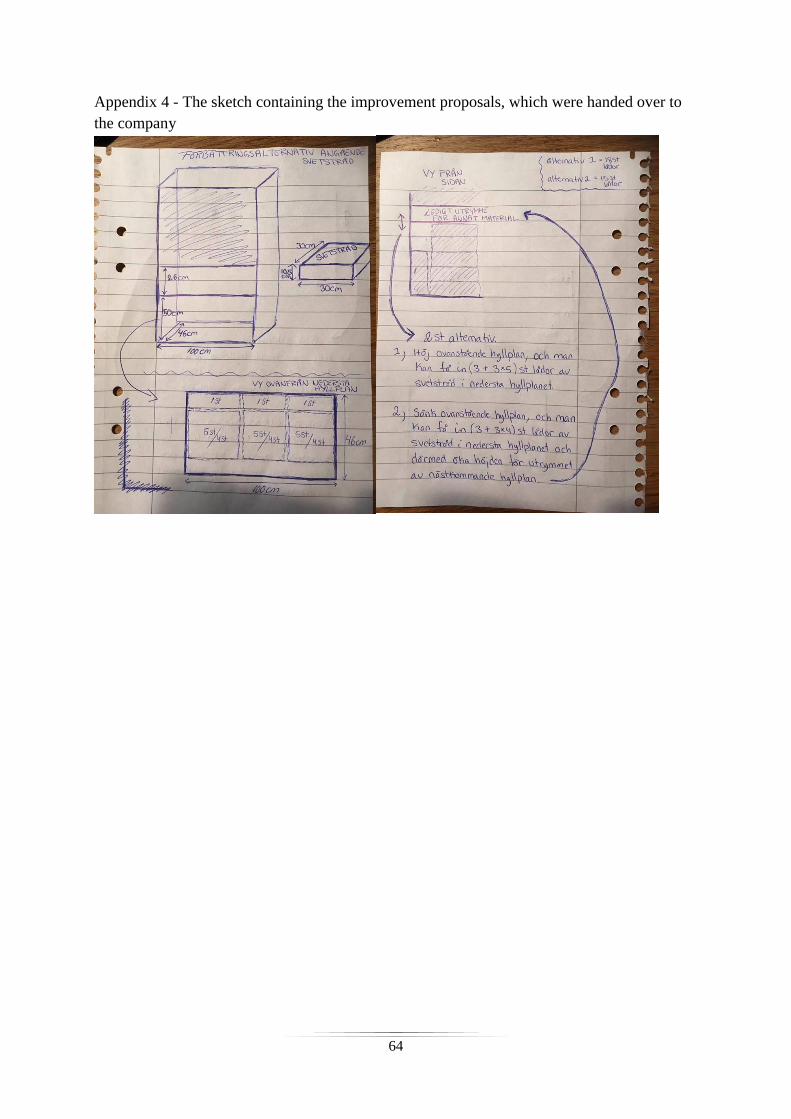
64
Appendix 4 - The sketch containing the improvement proposals, which were handed over to
the company
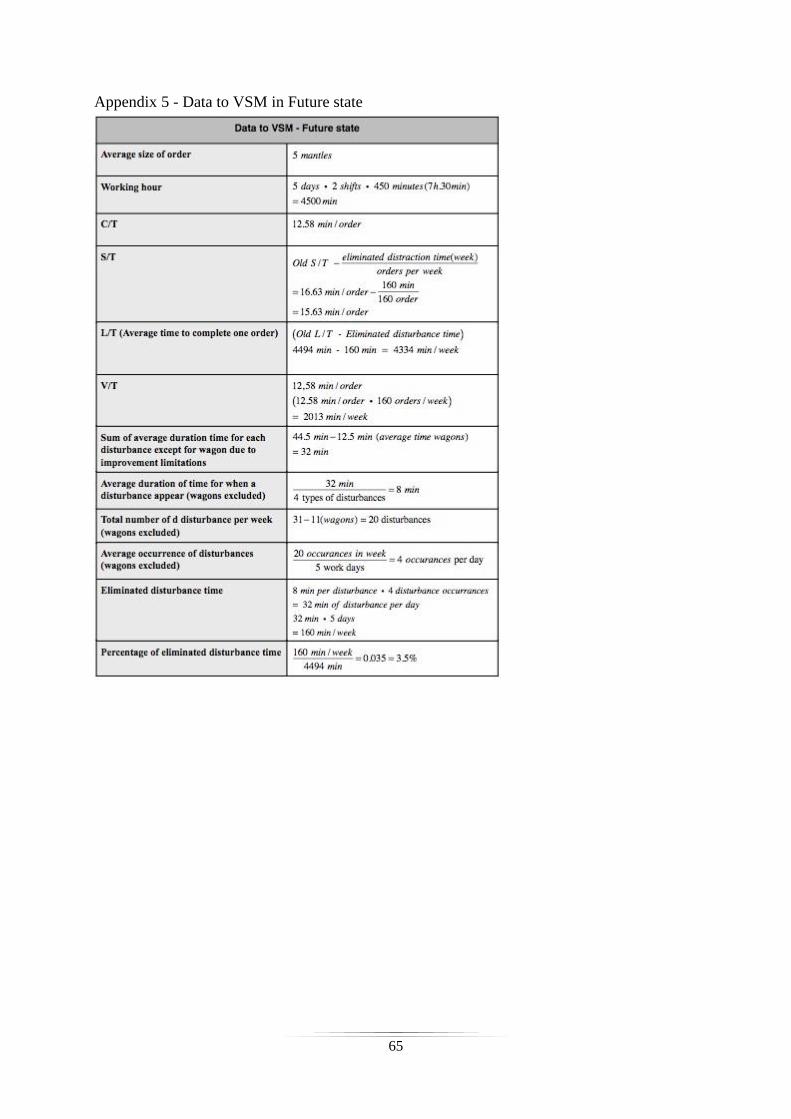
65
Appendix 5 - Data to VSM in Future state
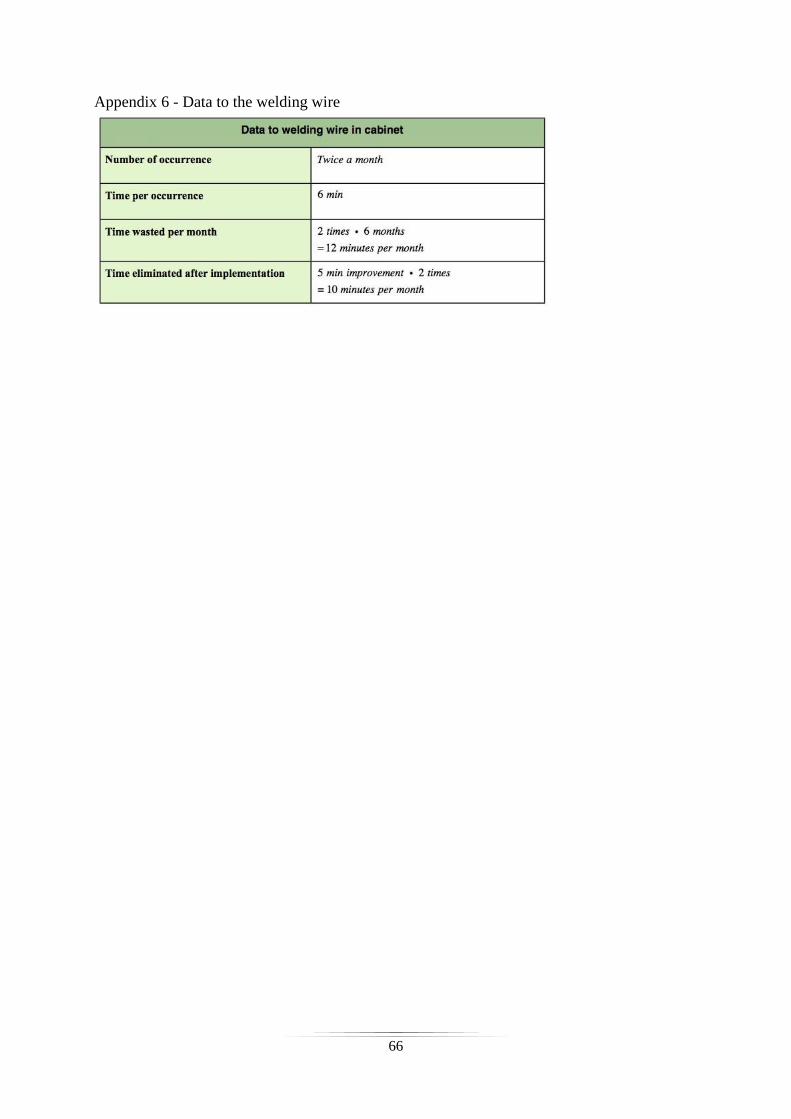
66
Appendix 6 - Data to the welding wire
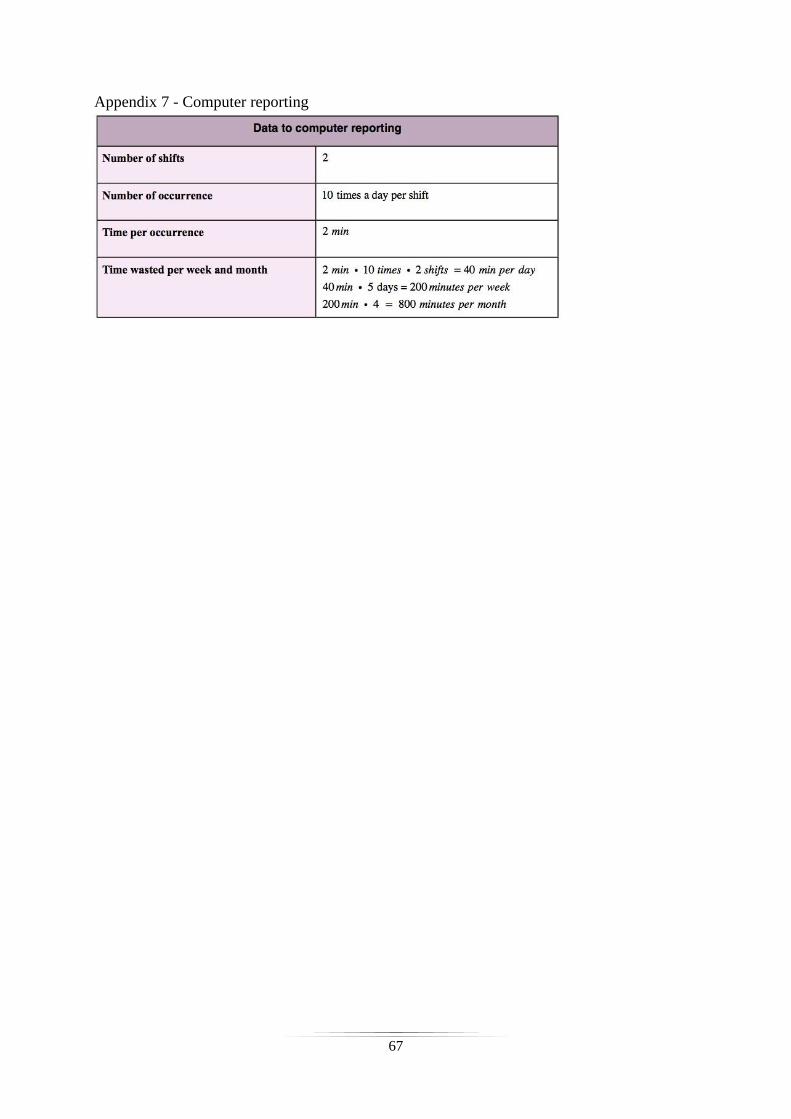
67
Appendix 7 - Computer reporting
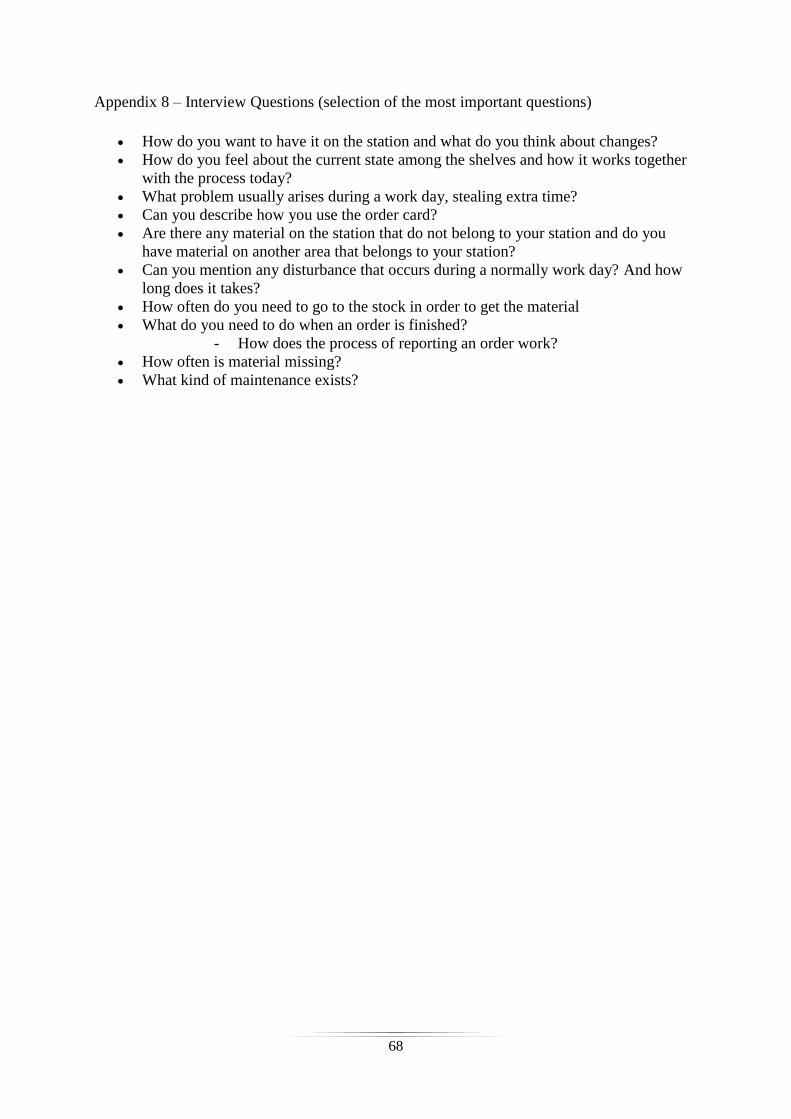
68
Appendix 8 – Interview Questions (selection of the most important questions)
How do you want to have it on the station and what do you think about changes?
How do you feel about the current state among the shelves and how it works together
with the process today?
What problem usually arises during a work day, stealing extra time?
Can you describe how you use the order card?
Are there any material on the station that do not belong to your station and do you
have material on another area that belongs to your station?
Can you mention any disturbance that occurs during a normally work day? And how
long does it takes?
How often do you need to go to the stock in order to get the material
What do you need to do when an order is finished?
- How does the process of reporting an order work?
How often is material missing?
What kind of maintenance exists?