Embed Size (px)
Citation preview
Proceedings of the
THE USE AND DISPOSAL OF COAL COMBUSTION BY-PRODUCTS
AT COAL MINES: A TECHNICAL INTERACTIVE FORUM
Held at The National Energy Technology Laboratory
Morgantown, West Virginia
April 10-13, 2000
Edited by: Kimery C. Vories
Dianne Throgmorton
Sponsored by:
U.S. Department of the Interior, Office of Surface Mining U.S. Department of Energy, National Energy Technology Laboratory
Coal Research Center, Southern Illinois University at Carbondale

U.S. Department of Interior, Office of Surface Mining, Alton, IllinoisCoal Research Center, Southern Illinois University, Carbondale, IllinoisCopyright 2000 by the Office of Surface Mining. All rights reserved.Printed in the United States of America8 7 6 5 4 3 2 1
Library of Congress Cataloging-in-Publication DataThe Use and Disposal of Coal Combustion By-Products at Coal Mines: A Technical Interactive Forum (2000: Morgantown,West Virginia)
Proceedings of The Use and Disposal of Coal Combustion By-Products at Coal Mines: A Technical Interactive Forum: U.S.Department of Energy, National Energy Technology Laboratory, Morgantown, West Virginia, April 10-13, 2000/ edited byKimery C. Vories, Dianne Throgmorton; sponsored by U.S. Dept. of the Interior, Office of Surface Mining, U.S. Dept. ofEnergy, National Energy Technology Center, Coal Research Center, Southern Illinois University at Carbondale.p. cm.Includes bibliographical references.ISBN 1-885189-06-01. Coal Combustion By-Products–United States Congresses. 2. Coal ash – Environmental aspects – Congresses. 3. Waste
products as building materials – Congresses. 4. Fly ash -- Congresses. 5. Ash disposal -- Congresses. I. Title: Use andDisposal of Coal Combustion By-Products at Coal Mines. II. Vories, Kimery C. III. Throgmorton, Dianne. IV. United States. National Energy Technology Laboratory, U.S. TA455.A63 P76 2000621.31'2132–dc21
00–053143CIP

vv
ContentsForeword . . . . . . . . . . . . . . . . . . . . . . . . . . . . . . . . . . . . . . . . . . . . . . . . . . . . . . . . . . . . . . . . ix
Steering Committee Members . . . . . . . . . . . . . . . . . . . . . . . . . . . . . . . . . . . . . . . . . . . . . . xi
Coal Combustion By-Products Steering Committee Recommendations . . . . . . . . . . . . xiii
What is a Technical Interactive Forum? . . . . . . . . . . . . . . . . . . . . . . . . . . . . . . . . . . . . . . xvKimery C. Vories, USDI Office of Surface Mining
Combustion By-Products Recycling Consortium (CBRC) . . . . . . . . . . . . . . . . . . . . . . . 1Paul Ziemkiewicz, Tamara F. Vandivort, and D. Courtney Black, National Mine Land ReclamationCenter, Morgantown, West Virginia
Session 1: Coal Combustion By-Products: The Basics
Production of Coal Combustion By-Products: Processes, Volumes, and Variability . . . . . . . . . 7Debra Pflughoeft-Hassett, Energy and Environment Research Center, University of North Dakota,Grand Forks, North DakotaThe Composition of Coal Combustion By-Products: Examples from a Kentucky Power Plant 15Allen Kolker, U.S. Geological Survey Coal Division, Reston, VirginiaPhysical and Engineering Properties of Coal Combustion By-Products . . . . . . . . . . . . . . . . . . . 25Yoginder P. Chugh, Department of Mining and Mineral Resources Engineering, Southern IllinoisUniversity, Carbondale, IllinoisEnvironmental Performance and Regulatory Status of Coal Combustion By-Products . . . . . . 37David Hassett, Energy and Environment Research Center, University of North Dakota,Grand Forks, North DakotaElectric Power Utilities Materials Flow in the United States . . . . . . . . . . . . . . . . . . . . . . . . . . . . . 43Samuel S. Tyson, American Coal Ash Association, Alexandria, Virginia
Session 2: Regulatory Perspectives
U.S. Environmental Protection Agency (EPA)/Fossil Fuel Combustion: A Hazardous WasteDetermination . . . . . . . . . . . . . . . . . . . . . . . . . . . . . . . . . . . . . . . . . . . . . . . . . . . . . . . . . . . . . . . . . . 57Andrew Wittner, U.S. Environmental Protection Agency, Washington, D.C.The Evolution and Development of Indiana's Program to Regulate the Disposal of Coal CombustionMaterials at Surface Coal Mines . . . . . . . . . . . . . . . . . . . . . . . . . . . . . . . . . . . . . . . . . . . . . . . . . . . 59Paul Ehret, Indiana Department of Natural Resources, Bureau of Mine Reclamation, Indianapolis,IndianaUtility Industry Perspective on Mine Placement of Coal Combustion Products . . . . . . . . . . . . 67Steven J. Groseclose, Piper, Marbury, Rudnick, and Wolfe LLP, Washington, D.C.A Citizen Regulatory Perspective on Disposal of Coal Combustion Wastes at the Mine Site . . 75Jeff Stant, Hoosier Environmental Council, speaking for Tom FitzGerald, Kentucky Resources Council,Inc., Frankfort, KentuckyThe Office of Surface Mining’s Perspective on Coal Combustion Waste Disposal onNative American Lands . . . . . . . . . . . . . . . . . . . . . . . . . . . . . . . . . . . . . . . . . . . . . . . . . . . . . . . . . . . 81Rick Holbrook, Office of Surface Mining, Denver, ColoradoA Comparison of State Legal Approaches to CCB Reuse . . . . . . . . . . . . . . . . . . . . . . . . . . . . . . . 87Christina L. Archer, Howard and Howard Attorneys, Peoria, Illinois
vivi
Session 3: Beneficial Uses at the Mine Site
Development and Demonstration of CCB Based Structural Products for Mine Use . . . . . . . . . 95Yoginder P. Chugh, Department of Mining and Mineral Resources Engineering, Southern IllinoisUniversity, Carbondale, IllinoisBackfilling of Highwalls for Improved Coal Recovery . . . . . . . . . . . . . . . . . . . . . . . . . . . . . . . . . 107Robert Rathbone, Center for Applied Energy Research, University of Kentucky, Lexington, KentuckyGrout Injection into an Underground Coal Mine to Control Acid Mine Drainage and Subsidence . . . . . . . . . . . . . . . . . . . . . . . . . . . . . . . . . . . . . . . . . . . . . . . . . . . . . . . . . . . . . . . . . . . . . 117D. Courtney Black, National Mine Land Reclamation Center, West Virginia University, Morgantown,West VirginiaBeneficial Uses of Clean Coal Combustion By-Products: Soil Amendment and Coal RefuseTreatment Examples and Case Studies . . . . . . . . . . . . . . . . . . . . . . . . . . . . . . . . . . . . . . . . . . . . . 119Warren Dick, School of Natural Resources, The Ohio State University, Wooster, OhioUnderground Placement of Coal Processing Waste and Coal Combustion By-ProductsBased Paste Backfill for Enhanced Mining Economics . . . . . . . . . . . . . . . . . . . . . . . . . . . . . . . . 143Yoginder P. Chugh, Department of Mining and Mineral Resources Engineering, Southern Illinois
University, Carbondale, IllinoisRe-mining with CCBs at the Broken Aro Demonstration Site . . . . . . . . . . . . . . . . . . . . . . . . . . . 155Ben J. Stuart, Department of Civil Engineering, Ohio University, Athens, Ohio
Session 4: Hydrologic Long-Term Monitoring
Water Quality Effects of Beneficial CCBs Use at Coal Mines . . . . . . . . . . . . . . . . . . . . . . . . . . . 167Paul F. Ziemkiewicz, National Mine Land Reclamation Center, West Virginia University, Morgantown,West VirginiaEffects of CCBs on Groundwater Quality after Mining . . . . . . . . . . . . . . . . . . . . . . . . . . . . . . . . 179David J. Hassett, Energy and Environment Research Center, Grand Forks, North DakotaPerformance Assessment of a Flue Gas Desulfurization Material at a Lined Pond Facility . . . 185Tarunjit Butalia, Department of Civil and Environmental Engineering and Geodetic Science, The OhioState University, Columbus, OhioWater Quality at an Abandoned Mine Site Treated with Coal Combustion By-Products . . . . 201Ralph J. Haefner, U.S. Geological Survey, Water Resources Division, Columbus, OhioHydrologic Monitoring at Three Mine Sites Reclaimed with Mixtures of Spoil and Coal CombustionResidues in Illinois . . . . . . . . . . . . . . . . . . . . . . . . . . . . . . . . . . . . . . . . . . . . . . . . . . . . . . . . . . . . . . . 211Stephen P. Esling, Department of Geology, Southern Illinois University, Carbondale, Illinois
Poster Abstracts
Assessment of Coal Combustion By-Products and Water Quality Variations at Mine Sites . . 223Carol R. Cardone and Ann G. Kim, U.S. Department of Energy, National Energy Technology Laboratory,Pittsburgh, PennsylvaniaMine Remediation with Coal Combustion By-Products . . . . . . . . . . . . . . . . . . . . . . . . . . . . . . . . 235Ann G. Kim, U.S. Department of Energy, National Energy Technology Laboratory, Pittsburgh,PennsylvaniaThe Release of Common Metals from Fly Ash During Leachate by Low pH Liquids . . . . . . . . 237George Kazonich and Ann G. Kim, U.S. Department of Energy, National Energy Technology Laboratory,Pittsburgh, Pennsylvania
Where Do We Go From Here? . . . . . . . . . . . . . . . . . . . . . . . . . . . . . . . . . . . . . . . . . . . . . 239Forum Participant Recommendations

viivii
Survey Results . . . . . . . . . . . . . . . . . . . . . . . . . . . . . . . . . . . . . . . . . . . . . . . . . . . . . . . . . . 241Participant Statistics,Comments, and Individual Recommendations
Appendix 1: Recorded Discussions . . . . . . . . . . . . . . . . . . . . . . . . . . . . . . . . . . . . . . . . . . 247Edited by Kimery C. Vories, USDI Office of Surface Mining, Alton, Illinois
Participants List . . . . . . . . . . . . . . . . . . . . . . . . . . . . . . . . . . . . . . . . . . . . . . . . . . . . . . . . . . 263Addresses and Phone Numbers

viiiviii

Christina L. Archer specializes in environmental law, with an emphasis on air pollution-relatedmatters, including compliance counseling and State and Federal litigation. She is a former assistantcounsel of both the Bureau of Air Regulatory and Enforcement Units of the Illinois EnvironmentalProtection Agency and has practiced in front of both the Illinois Pollution Control Board and the U.S.Environmental Protection Agency’s Environmental Appeals Board. Ms. Archer graduated from theUniversity of Illinois at Urbana-Champaign with two B.A. degrees (Political Science and Sociology) in1990 and received a J.D. degree from Southern Illinois University School of Law in 1993. Based inthe Peoria office of Howard and Howard Attorneys, Ms. Archer is admitted to practice in the state ofIllinois and the U.S. District Courts for the Central and Southern Districts of Illinois. She is a memberof the Peoria County Bar, the Central Illinois Women’s Bar, and the Sangamon County BarAssociations.
D. Courtney Black is a Program Manager with the National Mine Land Reclamation Center at WestVirginia University. He serves as the Eastern Regional Director for the Combustion By-ProductsRecycling Consortium and as Director of the National Environmental Education and Training Center. Mr. Black has over seven years experience in acid mine drainage treatment and control. He specializesin using alkaline waste products including coal combustion by-products to accomplish AMD treatmentand control.
Tarunjit S. Butalia, P.E. is a Research Specialist with the Department of Civil and EnvironmentalEngineering and Geodetic Science, The Ohio State University, Columbus, Ohio. He holds a Ph.D in Engineering from The Ohio State University and is a Registered ProfessionalEngineer in the State of Ohio. He is the Program Coordinator for a statewide Coal CombustionProducts Pilot Extension program at the Ohio State University. His technical specialty is thecharacterization of natural and synthetic materials and their use in technically sound, environmentallybenign, socially acceptable, and commercially competitive applications. He is involved directly inseveral CCP research and demonstration projects and has authored, presented, and/or published morethan 25 technical papers.
Paul Chugh has BS, MS, and Ph.D. degrees in Mining Engineering, the latter two are from ThePennsylvania State University. Dr. Chugh has been at Southern Illinois University for the past 23 years.For the past nine years, he has been actively engaged in research, development, and demonstrationstudies related to coal combustion by-products. He has commercialized three CCBs-based lightweightstructural materials for use in mining industries. Currently, he is developing utility poles from CCBs andhopes to commercialize them in the near future. He is currently Director, Combustion By-productsRecycling Consortium- Midwestern Region.
Warren Dick is a Professor of Soil and Environmental Science at The Ohio State University inWooster, Ohio. He is actively involved in understanding the characteristics of coal combustionby-products, especially those created by different sulfur scrubbing processes. He also has conductedstudies related to various land application uses of coal combustion by-products including their use as anagricultural lime substitute for surface mine land reclamation, as a sulfur and trace mineral nutrientsource for crop production, and for treatment of coal refuse to reduce acid production and drainage.
Warren is currently serving a second three year term as Editor of
the Journal of Environmental Quality and beginning January 1, 2000 has assumed the role ofEditor-in-Chief of all publications produced by the Soil Science Society of America.
Paul J. Ehret is the Deputy Director of the Indiana Department of Natural Resources. The Division ofReclamation is the regulatory authority for the enforcement of the Surface Mining Control andReclamation Act (SMCRA) in Indiana and has been empowered with the regulation of CoalCombustion Material disposal at surface coal mines. Previously, Mr. Ehret was employed by theIllinois Department of Mines and Minerals from 1980 through 1992 which included responsibilitieswith the Land Reclamation Division. In Illinois, in conjunction with the Illinois Environmental ProtectionAgency, the Land Reclamation Division is responsible for the regulation of the disposal of coalcombustion materials at coal mines.
Steven P. Esling is an Associate Professor of Geology at Southern Illinois University. He received hisM.S. in Mathematics in 1982 and his Ph.D. in Geology in 1984, both from the University of Iowa. Heblends his background in mathematics and geology with his interests in hydrogeology and quaternarystratigraphy. His efforts have led to studies quantifying erosion rates in strip mine spoils, evaluating theimpact of agricultural drainage wells on shallow bedrock aquifers, and assessing the impacts of minereclamation with coal combustion residues on groundwater flow and quality. Esling works closely withhis students investigating a variety of hydrogeologic and quaternary stratigraphic problems in southernIllinois. Developing analytic models to describe the groundwater flow systems that develop in responseto mining activities, monitoring the hydrologic budget of coal refuse sites, and characterizing the materialproperties of surficial deposits, including hydraulic conductivity, are research projects now underway. Esling also is active in developing innovative, interactive simulations of physical systems including aquasi-three-dimensional cylindrical finite-difference groundwater flow model. He is also the author of apre- and post-processor for numeric groundwater modeling.
Tom FitzGerald is the Director of the Kentucky Resources Council, Inc., a non-profit environmentaladvocacy organization providing free legal, strategic, and policy assistance to individuals, organizations,and communities concerning environmental quality and resource extraction issues. Mr. FitzGerald holdsnumerous appointments on State and National environmental advisory organizations. He holds a JurisDoctor degree from the University of Kentucky College of Law and has authored numerous articles onthe citizen perspective of environmental issues related to coal mining and reclamation.
Steven J. Groseclose is an environmental attorney in the Washington, D.C. office of Piper, Marbury,Rudnick, and Wolfe LLP. His practice focuses on State and Federal regulation of hazardous waste,solid waste, and hazardous materials transportation. One of his principal clients is the Utility SolidWaste Activities Group, the national consortium of electric utility operating companies and tradeassociations that has been active in Federal solid andhazardous waste issues for more than twenty years.
Ralph J. Haefner is a hydrologist with the U.S. Geological Survey, Water Resources Division in
Columbus, Ohio. He holds a Ph.D. in Geology from The Ohio State University in 1998 where hestudied geochemistry and groundwater flow beneath an abandoned coal mine. During his 13 years withthe USGS, he has published more than 20 abstracts, articles, and reports related to the hydrologicsciences. His research interests include groundwater chemistry, groundwater flow and transportsimulations, and application of geographic information systems to groundwater investigations.
David J. Hassett is a Senior Research Advisor at the Energy and Environmental Research Center(EERC) of the University of North Dakota. He received his B.S. in Chemistry and Mathematics fromWinona State University in Winona, Minnesota, in 1966 and continued with graduate studies inChemistry from 1970 to 1975. He has authored or coauthored more than 130 publications. Mr.Hassett's principal areas of interest and expertise include the application of analytical chemistry towardthe solution of environmental problems associated with trace element occurrence, transport, and fate. The most recent research focus has been on trace element transformations during coal conversionprocesses and interaction between groundwater and coal conversion solids as related to the leachabilityof trace elements. Additional areas of expertise include hydration reactions of coal conversion solidresidues as well as organic synthesis, radiochemistry, x-ray spectrometry, analytical chemistry, andvegetable oil diesel fuels.
Richard Holbrook is the manager of the Southwest Program Operations Branch of the U.S. Office ofSurface Mining’s Western Regional Coordinating Center. Mr. Holbrook received a B.A. degree inEnvironmental Biology from the University of California at Santa Barbara in 1972. During his 15 yearswith OSM, he has been involved in Federal lands program activities in the western states and permittingactivities under the Indian Lands Program and Washington and California Federal Programs. He hasauthored numerous permitting guidance documents used in OSM’s Western Region, including theguidance for the disposal of coal combustion by-products at coal mines on Indian lands and in stateswith Federal programs. Before joining OSM, Mr. Holbrook was the Environmental Quality ControlSupervisor for Consolidation Coal Company’s Western Region, and was the Director of theEnvironmental Sciences Division of VTN Colorado, an environmental consulting firm.
Debra F. Pflughoeft-Hassett is a Research Manager in Residuals Research at the Energy andEnvironmental Research Center (EERC) of the University of North Dakota. She received her B.S. inChemistry from the University of North Dakota in 1982. Ms. Pflughoeft-Hassett's principal areas ofinterest and expertise include utilization and characterization of coal by-products, waste management,and environmental impacts of coal by-product use and disposal. She has worked on the developmentof databases containing characterization information on coal by-products and on the development ofchemical characterization protocols. Ms. Pflughoeft-Hassett also has expertise in analytical chemistry,primarily atomic spectroscopy, chromatography, classical analytical methods, molecular spectroscopy,and atomic absorption methods development, as well as environmental and geologic research. Ms.Pflughoeft-Hassett has participated extensively as an investigator on laboratory research investigationsof groundwater contamination, sediment attenuation, coal conversion by-product characterization,leaching characterization, and chemical fixation of trace elements and has developed and appliednumerous analytical techniques for these tasks. She also participates as a principal researcher andproject manager on several investigations of the utilization and disposal of coal combustion by-products

and characterization of coal by-products and currently coordinates the research effort of the Coal AshResources Research Consortium (CARRC) and other coal by-product research at the EERC. Inaddition, she has coauthored more than 50 publications.
Allen Kolker has been a Geologist with the U.S. Geological Survey (USGS) Energy ResourcesProgram in Reston, Virginia since 1996. He received his Ph.D. in Geochemistry from the StateUniversity of New York at Stony Brook in 1989, his M.S. in Geology from the University ofMassachusetts in 1980, and his B.A. in Geology from Franklin and Marshall College, Lancaster,Pennsylvania, in 1977. Dr. Kolker’s current research interests include coal geochemistry, traceelements, environmental geochemistry, microbeam analytical instruments (electron microprobe, ionprobe, etc.), geochemistry and health issues, and trace elements in acid mine drainage and groundwatersystems. He serves as Project Manager for a collaborative program on trace element transformationsduring coal combustion.
Robert Rathbone is a research scientist at the University of Kentucky Center for Applied EnergyResearch. He has been involved with many aspects of coal combustion product (CCP) research andcharacterization including studies of ammonia in fly ash, the effects of fly ash carbon on air entrainmentin concrete, the use of fluidized bed combustion ash as a low-cost grout in mine voids, and the potentialuse of fly ash carbon as a boiler fuel. He has authored or co-authored publications in manyprofessional journals and conference proceedings related to CCP research, and serves on the ProgramCommittee for the International Ash Utilization Symposium in Lexington, Kentucky.
Ben J. Stuart is an Assistant Professor holding a joint appointment between the Department of CivilEngineering and the Department of Chemical Engineering at Ohio University. Dr. Stuart received hisB.S., M.S., and Ph.D. in 1990, 1993, and 1995 from the Department of Chemical and BiochemicalEngineering at Rutgers, the State University of New Jersey. He is a registered professional engineer inthe state of Ohio. Dr. Stuart has been involved with the study of emissions from municipal wastecombustion and coal fired power plants for ten years. Major recent research efforts include theutilization of coal combustion by-products for abatement and treatment of acid mine drainage, andscrubbing of power plant flue gases.
Samuel S. Tyson is the Executive Director of the American Coal Ash Association (ACAA) andPresident of the ACAA Educational Foundation with offices in Alexandria, Virginia. He earned bothundergraduate and graduate degrees in Civil Engineering at the University of Virginia, and served forfour years in the U.S. Army where he was a commissioned officer in the Corps of Engineers. He was aResearch Engineer for nine years with the Virginia Transportation Research Council where hespecialized in materials for construction and maintenance of concrete pavements and bridges. Sam is aregistered Professional Engineer in the District of Columbia where he worked for five years asTechnical Director for a ready mixed concrete company. He has both laboratory and field experiencewith fly ash concrete mixtures for construction of commercial and residential buildings, as well as fortransportation and water treatment facilities. Sam joined ACAA in 1986 as its Director of TechnicalServices and was appointed as Executive Director in 1993.

Andrew Wittner represented EPA at the meeting and had no prepared remarks. He spoke to thestatus of the rule making process at time of the meeting. Mr.Wittner has continuing responsibility for therisk assessment and economic analysis associated with the current fossil fuel combustion rule making.He managed both the groundwater and above ground risk analyses, the costing of risk mitigationalternatives, and the industry economic analyses. Mr. Wittner has degrees from Cornell and Columbiauniversities and additional post graduate study in economics, engineering, and operations research.
Paul Ziemkiewicz is the Director of the National Mine Land Reclamation Center and the WestVirginia Water Resources Research Institute, National Mine Land Reclamation Center, West VirginiaUniversity, Morgantown, West Virginia. He received a B.S. and M.S. from Utah State University inBiology and Range Ecology, respectively, and a Ph.D from the University of British Columbia in ForestEcology. He joined the Alberta Government’s Department of Energy after graduating from UBC in1978 where he directed its reclamation research program in coal and oil sand mining. He also servedon Alberta’s Regulatory Review Committee and served as the Research Manager of the Province’scoal research program. He came to West Virginia University in 1988 as the Director of the NationalMine Land Reclamation Center and the West Virginia Water Resources Research Institute. He serveson a number of Federal, State and industry advisory panels on environmental remediation. He hasmore than 70 publications on the topic of mine land reclamation, acid mine drainage, and coal ashapplication in mines.

viivii
FOREWORD
Beginning in May of 1994, the Office of Surface Mining (OSM) took an active role in encouraging and promotingtechnological advances, research, and technology transfer related to the use and disposal of those material residuesremaining after the combustion of coal to produce electrical power. The primary activities and accomplishments ofOSM in this area have been the establishment of a multi-interest group steering committee that has: (1) conductedone national interactive forum in October of 1996 at Southern Illinois University at Carbondale; (2) published anddistributed hundreds of copies of the forum proceedings; (3) developed and managed an Internet Website dedicatedto providing a user friendly guide to coal combustion by-products (CCB) literature, organizations, and events; and(4) conducted a second national technical interactive forum on “The Use and Disposal of CCBs at Coal Mines” inApril of 2000 at the National Energy Technology Laboratory in Morgantown, West Virginia.
In addition, OSM has signed a Memorandum of Understanding with the U.S. Department of Energy, National EnergyTechnology Laboratory (NETL) to collaborate on CCB research and issues. OSM also participated in theinteragency discussions with the U.S. Environmental Protection Agency that lead up to its May 22, 2000 rule makingwhere EPA concluded that fossil fuel combustion wastes do not warrant regulation as hazardous wastes underSubtitle C of the Resource Conservation and Recovery Act (RCRA) and is retaining the hazardous waste exemptionfor these wastes. OSM staff also serve on the (1) national steering committee of the Combustion By-ProductsRecycling Consortium in order to assist in directing CCB research efforts; and (2) technical program committee forthe biennial International Ash Symposium conducted by the University of Kentucky Center for Applied EnergyResearch.
One of the needs identified during the 1996 interactive forum was that there should be better access to existingscientific and technical literature and new developments in scientific research associated with CCBs. In response tothis need, a steering committee was assembled that cooperated in development of the CCB Information NetworkWebsite hosted by OSM. Many of the other questions and concerns, however, have not yet been addressed. Inresponse to these additional concerns, the steering committee resolved to conduct an additional technical interactiveforum in the year 2000 to address the more important concerns and new developments related to coal mining andCCBs that were identified at the 1996 forum or since that time.
This purpose of the April 2000 forum was to provide (1) an organized format for discussion of issues concerning theuse and disposal of CCBs at coal mines; (2) an easily understood, state-of-the-art summary talk by knowledgeablespeakers; (3) a published proceedings that summarizes the presentations and participant discussions; (4) access tothe discussions for all interested participants at the forum; (5) an opportunity for poster presentations on CCBprojects and research; and (6) an opportunity for exhibits of CCB use, technology, services, and equipment.
Based on the results of the above efforts, OSM will assess the outcomes of the forum and other CCB activities andmake recommendations for potential revisions to OSM policy and plans for enhancement of additional technologytransfer efforts.
I would like to sincerely thank the speakers, authors, steering committee members, and participants for their time andefforts to making this program a success.

STEERING COMMITTEE MEMBERS
Kimery C. Vories (Forum Chairperson) Mid-Continent Region USDI Office of Surface Mining Dr. Barry Stewart American Coal Ash Association Dan Wheeler Illinois Office of Mines and Minerals Debra Pflughoeft-Hassett University of North Dakota Dr. Tarunjit S. Butalia The Ohio State University Randy Lubbert and John Mead Coal Research Center Southern Illinois University at Carbondale Dr. Paul Chugh Mining Engineering Department Southern Illinois University at Carbondale Stephen Smith TXU
Dr. Ralph Clark USDA Agricultural Research Service William Aljoe and Scott Renninger US Department of Energy National Energy Technology Laboratory Ken Foit Indianapolis Field Office USDI Office of Surface Mining Joe Galetovic Western Region USDI Office of Surface Mining Steffen Koratich Columbus Field Office USDI Office of Surface Mining Dr. Rustu Kalyoncu USGS Minerals Information Team
xiii
COAL COMBUSTION BY-PRODUCTS STEERING COMMITTEERECOMMENDATIONS
The following are recommendations made by the Coal Combustion By-Products Steering Committee immediatelyfollowing the end of the forum. The recommendations represent areas that have the potential for future efforts.
1. The next forum should have a more regional focus. The committee should consider a regional forum,possibly in 2002, that would focus on CCB and mining issues in the western United States.
2. The committee needs to get more specifically involved with the U.S. Environmental Protection Agency, theAssociation for Standard Testing Methods, and other interested parties to develop recognized standardtesting methods for CCBs that are used or disposed of on mine sites.

xv
WHAT IS A TECHNICAL INTERACTIVE FORUM?
Kimery C. VoriesUSDI Office of Surface Mining
Alton, Illinois
I would like to set the stage for what our expectations should be for this event. The steering committee has workedhard to provide you with the opportunity for a free, frank, and open discussion on issues related to the use anddisposal of coal combustion by-products on coal mine lands in an atmosphere that is both professional andproductive. Our rationale for the format of the technical interactive forum is that, unlike other professionalsymposia, we measure the success of the event on the ability of the participants to question, comment, challenge,and provide information in addition to that provided by the speakers in the hope that by the end of the event, aconsensus will emerge concerning the issues discussed.
We realize that we hold this discussion in the shadow of the current debate surrounding the U.S. EnvironmentalProtection Agency rule making on whether or not CCBs will require regulation under the hazardous waste provisionsof the Resource Conservation and Recovery Act. It has been my experience that most of the heated controversies Ihave been aware of, related to coal mining and reclamation, have been a result of the lack of sufficient scientific andtechnical information on the issue and the lack of the means to communicate such information to all of thoseconcerned with the issue. Therefore, one of the main purposes of this event is to bring as much scientific light aspossible to bear on this issue in the hopes of dispelling as much of the current heat and confusion on the subject aspossible.
It also has been my personal experience that the most progress I have seen toward making advances in the field ofsurface mining reclamation has come when we have been able to work as a team of professionals toward aconsensus on:• the facts related to the actions we have proposed, and • the state of the science in terms of our most workable options and alternatives.
During the course of these discussions, we have the opportunity to talk about technical, regional, and local issues,while examining new and existing methods for finding solutions, identifying problems, and resolving issues. Theforum gives us the opportunity to:C share our experiences and expertise concerning the use and disposal of CCBs, C outline our reasons for taking specific actions, and C give a rationale for why we should or should not be promoting the use or disposal of CCBs at coal mines in a
specific manner.
A basic assumption of the interactive forum is, that no person present has all the answers or understands all of theissues. It is also assumed that some of these issues, solutions, and concerns may be very site, regional, or Statespecific.
The purpose of the forum is to: C present you with the best possible ideas and knowledge during each of the sessions, C promote the opportunity for questions and discussion by you the participants, and C let each person decide what is most applicable to his/her situation.
We are not here to come up with new policies or regulations, but to empower you the participants with betterknowledge, new contacts, and new opportunities for problem solving and issue resolution.
The format of the forum strives to improve the efficiency of the discussion by providing the following:C A copy of the abstract for each speaker’s talk which you may want to read before hand in order to improve your
familiarity with the subject matter.C Tape recordings of the talks and discussions for later inclusion in a post forum publication so that you do not

xvi
have to worry about taking notes. For this reason, we will require that all participants speak into a microphoneduring the discussions.
C A post forum publication categorizing issues raised during the discussions by affiliation such as government,industry, academic, or public and will not identify individual names. All registrants will receive one copy of thispublication. This publication will be very similar to the proceedings of earlier forums conducted by OSM. Theproceedings also will be made available electronically on the CCB Information Network Website.
In order for us to make the most efficient use of time, we require our session chairpersons to strictly keep to theschedule. One of the reasons for providing refreshments during the breaks and lunch is to keep people fromwandering off and missing the next session. In addition, the breaks and lunch provide a better atmosphere andopportunity for you to meet with and discuss concerns with the speakers or other participants. Please takeadvantage of the opportunity at break time to visit the exhibits and posters in the break area. When the meetingadjourns today all participants are invited to a reception where refreshments will be provided.
It is important to remember that there are three separate opportunities for you the participants to be heard:• Five (5) minutes will be provided for questions at the end of each speaker’s talk. C Twenty (20) minutes of participant discussion will be provided at the end of each topic session. The
chairperson will recognize each participant who wishes to speak; participants will be required to identifythemselves and speak into one of the portable microphones so that everyone can hear the question.
C A blue forum evaluation form has been provided in your folder. This will help us to evaluate how good a job wedid and recommend improvements for future forums or workshops. Please take time to fill it out and provide anyadditional comments or ideas.
Finally, the steering committee and I would like to thank all of the speakers who have been so gracious to help uswith this effort and whose only reward has been the virtue of the effort. I would also like to thank all of you for yourwillingness to participate and work with us on this important issue.
11
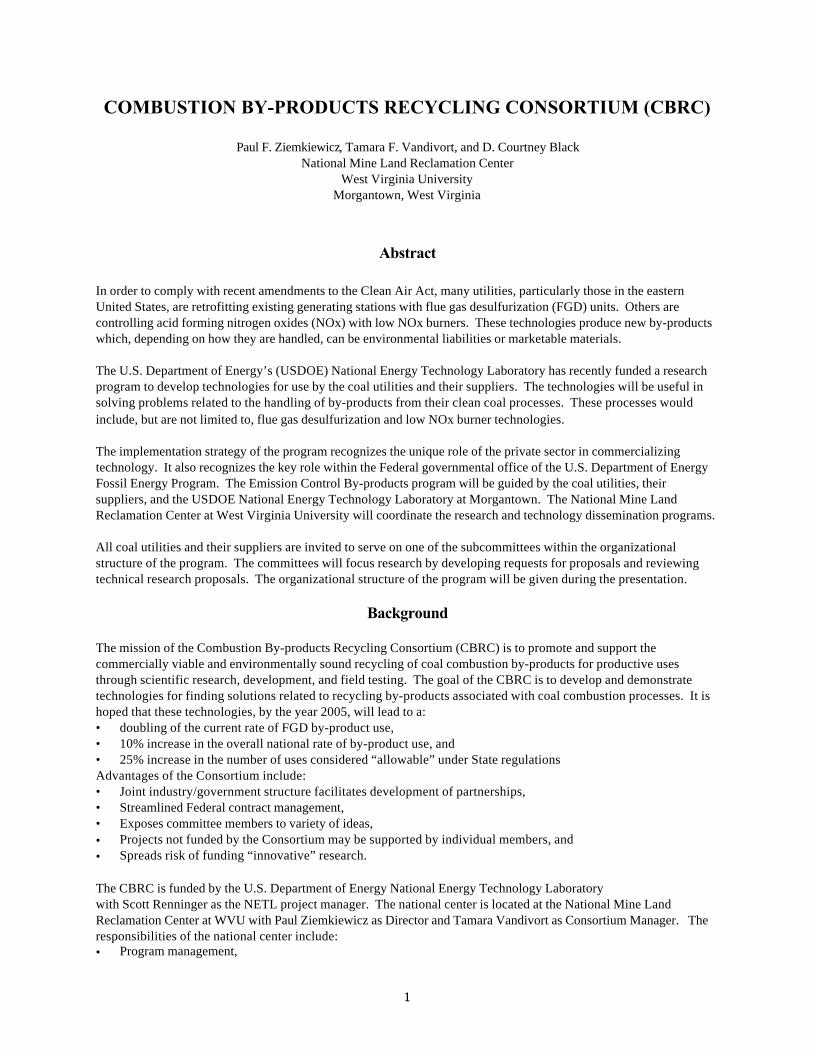
COMBUSTION BY-PRODUCTS RECYCLING CONSORTIUM (CBRC)
Paul F. Ziemkiewicz, Tamara F. Vandivort, and D. Courtney BlackNational Mine Land Reclamation Center
West Virginia UniversityMorgantown, West Virginia
Abstract
In order to comply with recent amendments to the Clean Air Act, many utilities, particularly those in the easternUnited States, are retrofitting existing generating stations with flue gas desulfurization (FGD) units. Others arecontrolling acid forming nitrogen oxides (NOx) with low NOx burners. These technologies produce new by-productswhich, depending on how they are handled, can be environmental liabilities or marketable materials.
The U.S. Department of Energy’s (USDOE) National Energy Technology Laboratory has recently funded a researchprogram to develop technologies for use by the coal utilities and their suppliers. The technologies will be useful insolving problems related to the handling of by-products from their clean coal processes. These processes wouldinclude, but are not limited to, flue gas desulfurization and low NOx burner technologies.
The implementation strategy of the program recognizes the unique role of the private sector in commercializingtechnology. It also recognizes the key role within the Federal governmental office of the U.S. Department of EnergyFossil Energy Program. The Emission Control By-products program will be guided by the coal utilities, theirsuppliers, and the USDOE National Energy Technology Laboratory at Morgantown. The National Mine LandReclamation Center at West Virginia University will coordinate the research and technology dissemination programs.
All coal utilities and their suppliers are invited to serve on one of the subcommittees within the organizationalstructure of the program. The committees will focus research by developing requests for proposals and reviewingtechnical research proposals. The organizational structure of the program will be given during the presentation.
Background
The mission of the Combustion By-products Recycling Consortium (CBRC) is to promote and support thecommercially viable and environmentally sound recycling of coal combustion by-products for productive usesthrough scientific research, development, and field testing. The goal of the CBRC is to develop and demonstratetechnologies for finding solutions related to recycling by-products associated with coal combustion processes. It ishoped that these technologies, by the year 2005, will lead to a:• doubling of the current rate of FGD by-product use,• 10% increase in the overall national rate of by-product use, and• 25% increase in the number of uses considered “allowable” under State regulationsAdvantages of the Consortium include:• Joint industry/government structure facilitates development of partnerships,• Streamlined Federal contract management,• Exposes committee members to variety of ideas,• Projects not funded by the Consortium may be supported by individual members, and• Spreads risk of funding “innovative” research.
The CBRC is funded by the U.S. Department of Energy National Energy Technology Laboratorywith Scott Renninger as the NETL project manager. The national center is located at the National Mine LandReclamation Center at WVU with Paul Ziemkiewicz as Director and Tamara Vandivort as Consortium Manager. Theresponsibilities of the national center include:• Program management,

22
• Research project development,
• Reporting to the funding agency,• Technology archive and transfer, and• Soliciting members to serve on the National Steering Committee.
The CBRC has a free quarterly newsletter called the Ashlines. It highlights CBRC projects, program news, and has acalendar of events. First issue hardcopies are currently in production and can now be downloaded from the CBRCweb site at http://cbrc.nrcce.wvu.edu.
Organization
There are three regional research centers. D. Courtney Black is the Director of the Eastern Regional Center at WestVirginia University; Dr. Paul Chugh is the Director of the Midwestern Regional Center at Southern IllinoisUniversity, Carbondale; and Debra Pflughoeft-Hassett is the Director of the Western Regional Center at theUniversity of North Dakota. The regional center responsibilities include:• Subcontract management,• Managing regional research projects,• Reporting research project activities to National Center,• Compiling and ranking regional proposal evaluation results,• Providing technical information to regulatory agencies and industry, and• Technology archive and transfer.
The national steering committee is chaired by Robert Dolence of the Pennsylvania Department of Protection and ismade up of representatives from the following organizations:• American Coal Ash Association• Interstate Mining Compact Commission• National Mining Association• Office of Surface Mining• U.S. Army Corp of Engineers• U.S. Department of Energy• U.S. Environmental Protection Agency• Ohio Coal Development Office• Illinois Department of Commerce and Community Affairs• Edison Electrical Institute• Public Service Company of Colorado
The national steering committee responsibilities include:• Identifying national research priorities,• Authorizing Requests for Proposals,• Reviewing program performance annually,• Ranking proposals for funding consideration,• Advising the National Mine Land Reclamation Center on strategic direction, and• Selecting, from its membership, chairs for regional reviewers/advisors.
There are three regional advisors/reviewers. Jackie Bird with the Ohio Coal Development Office is the chair of theEastern Region. Wayne Bahr with the Illinois Department of Commerce and Community Affairs is the chair of theMidwestern Region. David Goss with the Public Service Company of Colorado is the chair of the Western Region. The responsibilities of the regional advisors/reviews includes: • Identifying regional research priorities,• Evaluating proposals for funding consideration,• Identifying funding opportunities for research projects,• Reviewing technical progress on funded projects, and• Reporting important results to the National Steering Committee

33
Results of the 1999 RFP
Table 1 Phase II Funding
DOE-NETL Cost-Share Total
$1,266,667 $2,316,417 $3,583,084
Table 2 Eastern Region Projects
Organization CBRC Cost-Share Total
Waynesburg Col. $68,673 $98,476 $167,149
GAI Consultants $84,969 $69,486 $154,455
Ohio State Univ. $48,650 $48,650 $97,300
Univ. of Florida $75,466 $42,354 $117,820
Univ. of Georgia $59,553 $19,851 $79,404
USGS $60,000 $20,000 $80,000
Lehigh University $83,188 $56,263 $139,451
WV DEP $25,071 $27,656 $52,727
Ohio State Univ. $25,258 $924,542 $949,800
Table 3 Midwestern Region Projects
Organization CBRC Cost-Share Total
SIUC $116,180 $405,331 $521,511
SIUC $66,795 $51,446 $118,241
Univ. of Wisconsin $101,310 $34,624 $135,934
Univ. of Wisconsin $66,190 $40,000 $106,190
SIUC $113,880 $299,094 $412,974
44
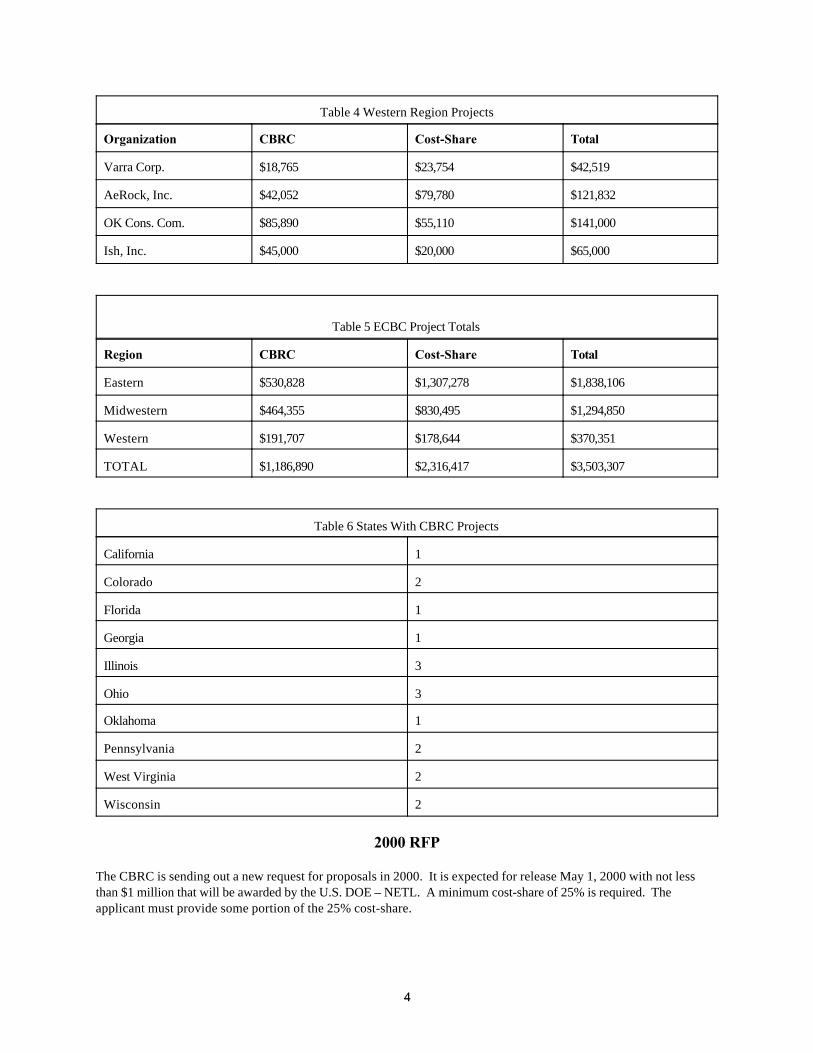
Table 4 Western Region Projects
Organization CBRC Cost-Share Total
Varra Corp. $18,765 $23,754 $42,519
AeRock, Inc. $42,052 $79,780 $121,832
OK Cons. Com. $85,890 $55,110 $141,000
Ish, Inc. $45,000 $20,000 $65,000
Table 5 ECBC Project Totals
Region CBRC Cost-Share Total
Eastern $530,828 $1,307,278 $1,838,106
Midwestern $464,355 $830,495 $1,294,850
Western $191,707 $178,644 $370,351
TOTAL $1,186,890 $2,316,417 $3,503,307
Table 6 States With CBRC Projects
California 1
Colorado 2
Florida 1
Georgia 1
Illinois 3
Ohio 3
Oklahoma 1
Pennsylvania 2
West Virginia 2
Wisconsin 2
2000 RFP
The CBRC is sending out a new request for proposals in 2000. It is expected for release May 1, 2000 with not lessthan $1 million that will be awarded by the U.S. DOE – NETL. A minimum cost-share of 25% is required. Theapplicant must provide some portion of the 25% cost-share.
Session 1
Coal Combustion By-Products: The Basics
Session Chairperson:Debra Pflughoeft-Hassett
Energy and Environmental Research CenterUniversity of North DakotaGrand Forks, North Dakota
Production of Coal Combustion By-Products: Processes, Volumes, andVariabilityDebra Pflughoeft-Hassett, E.A. Sondreal, E.N. Steadman, K.E. Eylands, and B.A.Dockter, Energy and Environmental Research Center, University of North Dakota,Grand Forks, North Dakota
Composition of Coal Combustion By-Products : Examples from a KentuckyPower PlantAllan Kolker, Robert B. Finkelman, Robert H. Affolter, and Michael E. Brownfield, U.S.Geological Survey, Coal Division, Reston, Virginia and Denver, Colorado
Physical and Engineering Properites of Coal Combustion By-ProductsYoginder P. Chugh, Debasis Deb, and C.B. Raju, Department of Mining and MineralResources Engineering, Southern Illinois University, Carbondale, Illinois
Environmental Performance and Regulatory Status of Coal Combustion By-ProductsDavid J. Hassett and D.F. Pflaghoeft-Hassett, Energy and Environmental ResearchCenter, University of North Dakota, Grand Forks, North Dakota
Electric Power Utility’s Materials Flow in the United StatesSamuel S. Tyson and Rustu S. Kalyoncu, American Coal Ash Association, Alexandria,Virginia and United States Geological Survey, Reston, Virginia

7
PRODUCTION OF COAL COMBUSTION BY-PRODUCTS:PROCESSES, VOLUMES, AND VARIABILITY
D.F. Pflughoeft-Hassett1, E.A. Sondreal,E.N. Steadman, K.E. Eylands, and B.A. Dockter
Energy and Environmental Research Center University of North DakotaGrand Forks, North Dakota
Introduction
Coal is a vital part of energy production in the United States and both conventional and advanced coal conversiontechnologies result in the generation of solid by-products. The nearly 90 million tons of coalcombustion/desulfurization by-products (CCBs) produced annually in the United States is a valuable nationalresource that is vastly underutilized. Current use of about 30% of the coal ash and only 2% of the flue gasdesulfurization products represents a failed opportunity when compared to the nearly complete utilization alreadyachieved in some western European countries. Future opportunities can be seized by concerted action to offersubstantial benefits to the nation's electric generation, construction, and manufacturing industries; to agriculture;and to the environment; whereas failure to act will create, literally, mountains of solid waste that will be anunnecessary legacy of future energy production.
The value of CCBs is well established by research and commercial practice both in the United States and abroad. Asengineering construction materials, these products can add value and enhance strength and durability whilereducing cost. In agricultural applications, gypsum-rich products can provide plant nutrients and improve the tilth ofdepleted soils over large areas of the country. In waste stabilization, the cementitious and pozzolanic properties ofthese products can immobilize hazardous nuclear, organic, and toxic metal wastes for environmentally safe andeffective disposal. Public benefits of CCB utilization are substantial, including conservation of land, energy, andnatural resources; reduction in CO2 emissions generated in the production of competing materials; improvements inthe balance of trade (e.g., fewer cement imports); and prevention of solid waste pollution. Increasing cost andheightened regulation are making the disposal of CCBs an undesirable option.
U.S. Energy Production from Coal
U.S. coal production totaled a record high of 1,088.6 million short tons in 1997 according to preliminary data from theEnergy Information Administration (EIA) (Hong, 1998). Utilities and industry continue to be the dominant coalconsumers, using a record 922.0 million short tons in 1997 as a result of a substantial decline in nuclear-poweredgeneration and moderate growth in electricity demand. U.S. coal consumption by all users in 1997 showed a 2.2%increase over 1996. Growth came entirely from the electric power industry, as coal consumption in the nonelectricitysectors decreased. Coal continued to be the principal energy source for electric power generation in the UnitedStates, accounting for 52% of total generation in 1996 (Hong, 1998). Coal consumption in the nonelectricity sectors(coke plants, other industrial plants, and residential/commercial users) totaled 105.8 million short tons in 1997, downby 2.6 % from the 1996 level of 108.7 million short tons.
It is forecast that the United States will continue to rely heavily on coal for energy production at least through 2020.It is further forecast that future coal consumption will be primarily in existing power generation facilities or infacilities that utilize clean coal technologies (CCTs) such as fluidized-bed combustion (FBC) and gasification. TheCCT processes have been designed to meet ever-tightening emission control standards set by EPA and Stateagencies, but it is important to note that any use of coal in future energy production will continue to result in thegeneration of solid materials. These solids, referred to as wastes or by-products, vary with the type of coal used, the

8
conversion system, the emission controls applied to the system, the solid collection system, and the specificoperating conditions.
Production of Coal Combustion By-Products
The type of coal or coal rank indicates the degree of coalification that has occurred for a particular coal. Coal isformed by the decomposition of plant matter without free access to air and under the influence of moisture, pressure,and temperature. Over the course of the geologic process that forms coal, coalification, the chemical composition ofthe coal gradually changes to compounds of lower hydrogen content and higher carbon content in aromatic ringstructures. With an increase in degree of coalification, the percentage of volatile matter decreases and the calorificvalue increases. The common ranks of coal in the United States are anthracite, bituminous, subbituminous, andbrown coal/lignite. Anthracite is the highest-ranked coal in the series, exhibiting the lowest volatile matter and highercalorific value, while lignite is the lowest-ranked coal in the series, with significantly greater volatile matter and lowercalorific value. Figure 1 shows the geographic location of U.S. coal fields and the associated coal rank. It is generallytrue that the higher-ranked coals have a lower-percentage ash content and the lower-ranked coals have increasingpercentages of ash, with the notable exception in certain Powder River Basin (Montana and Wyoming)subbituminous coals, which yield a very low ash percentage.
All coal contains minerals. These minerals are composed of inorganic constituents and can be present as includedminerals, which are inherent in the coal particles, or as excluded minerals, which are separate from the coal substance.Excluded minerals may be dispersed in the coal or may be present simply because of the inadvertent mining ofadjacent mineral strata by procedures used to extract the coal. This inorganic material becomes the ash or CCBfollowing combustion or conversion.
Conventional Combustion Systems
The most common utility combustion systems in place in the United States today are pulverized coal (pc)combustion, cyclone firing, and stoker firing, with pc-fired units outnumbering the cyclone and stoker units. Figure 2shows a simple schematic diagram for a typical pc combustion system. In this type of combustion system, the coal isprepared by grinding it to a very fine consistency for combustion. Typically, 70% of the coal is ground to passthrough a 200-mesh per unit screen. There are several configurations for commonly used pc furnaces, which canimpact ash formation, but the primary advantage of pc combustion is the very fine nature of the fly ash produced. Ingeneral, pc combustion results in approximately 65%–85% fly ash, and the remainder in coarser bottom ash (dry-bottom boiler) or boiler slag (wet-bottom boiler). Cyclone combustion uses coarsely pulverized coal (95% !¼ in.) andproduces much higher percentages of bottom ash (up to 75%–90%, depending on coal type) and smaller amounts offly ash. Stoker-fired units do not require the same level of coal grinding (e.g., !¾ in.) because the coal generallystays in the hot zone for an extended period of time, allowing complete combustion of larger coal particles.
Utilities use a variety of techniques for air pollution or emission control. Currently, emission control technologies arefairly broadly applied for control of particulates, SO2, and NOx. ESPs have been commonly installed on U.S. coal-firedsteam–electric power plants to reduce particulate emissions. In recent years, baghouses have been specified forsome new units as well as retrofits of existing units. At present, every operating U.S. utility-owned coal-fired unit isbelieved to have particulate control equipment in place.
U.S. utilities generally employ one of two strategies to control SO2 in the flue gas stream: 1) use of compliance fuel or2) use of flue gas desulfurization (FGD) units. Many western coals and some eastern coals are naturally of low sulfurcontent, and these can be used to meet SO2 compliance requirements. Utilities may also physically clean or wash allor part of the fuel prior to combustion. Physical coal cleaning at the mine, transhipment point, or power plant is quitewidespread in the United States not only because it results in reduced emissions, but also because some increase insteam generator efficiency is often possible if the fuel feedstock can be made more homogeneous. Utilities may alsoblend coals of different sulfur contents in order to obtain a mix allowing compliance with applicable regulations.

9
Control of NOx emissions, which is relatively new for the utility industry, is complicated, since these emissions arerelated to both the nitrogen content of the fuel and the formation of various NOx species during the combustionprocess. NOx controls include combustion modifications such as use of overfire air or low-NOx burners. Selectivenoncatalytic reduction and selective catalytic reduction are just beginning to be used as postcombustion NOxcontrol. Commercial installations have been made, but research and evaluation continue in the area of NOx control.
10
Figure 1. Geographic location of U.S. coal fields and the associated coal rank.
Figure 2. Schematic diagram for a typical pc combustion system.
11
Each of the emission control technologies that an individual coal-fired unit needs to use has the potential to impactthe quantity and the character of the by-products generated. Current research on air toxic emissions (Benson andothers, 1995; Miller and others, 1996; Pavlish and others, 1995) is evaluating the potential need for further emissioncontrols for trace elements such as mercury and other hazardous air pollutants (HAPs). Technologies that may berequired to control these emissions will also impact CCBs.
Fluidized-Bed Combustion
The FBC process consists of two subprocesses: 1) the fluidization of solids, by which solid particles/granules aresuspended in an upward-flowing stream of gas, and 2) the combustion process, in which fuel particles are burned tosustain temperature. The solids in FBCs are typically fuel ash, bed material, sorbent used to control pollutants, andreaction products formed by sulfur capture and other sorbent–coal interactions. FBC systems operated atatmospheric pressure are classified as atmospheric fluidized-bed combustors (AFBCs), which usually also denoteslow fluidization velocities resulting in a bubbling bed. Circulating fluidized-bed combustors (CFBCs) operate atfluidization velocities approximately 2 to 3 times higher. At these velocities, the rising gas entrains the bed materials;the resulting bed consists of a turbulent cloud of solids that fills the combustion chamber. A portion of the bedmaterial is continuously carried out with the offgas and recirculated to the combustion chamber. Pressurizedfluidized-bed combustor (PFBC) systems are similar to AFBCs, but operate under pressure. The compressed air usedcontains more oxygen per unit volume and, therefore, sustains a higher intensity of combustion, allowing for thedesign of smaller combustors. The other principal advantage of the PFBC is the increased conversion efficiency(coal-to-electricity) that can be achieved by passing the hot, pressurized combustion gases through both a gasturbine and a waste heat boiler serving a steam turbine to extract more useable energy in a combined cycle system.
The characteristics of the solid residues produced in FBCs depend on the bed material, fuel and ash compositions,unburnt carbon, desulfurization products, and unreacted sorbents. The residues can be collected from severallocations in the system, including the bed offtake, primary cyclone, and final particulate control device. In mostcases in the United States, these residues are combined.
Fluidized-bed combustion systems operate at low temperatures, typically less than 900EC, which prevents significantfusion and melting of the ash particles. The FBC fly ash particles are, therefore, angular and very different from thespherical fused ash particles produced in pc firing (Mann and others, 1985; Smith, 1990). Entrained bed material alsoinfluences the physical and chemical properties of the fly ash collected in the particulate control devices. Thecharacteristics of the spent bed material depend on the properties of the coal ash, the bed material, and the sorbentand degree of sulfation due to sulfur capture. The solids recirculation of a CFBC and the higher pressure of a PFBCcause these systems to achieve higher sorbent utilization, resulting in a higher sulfation level in their residues. High-calcium materials used for sulfur capture (i.e., limestone or dolomite) produce residues containing high levels ofcalcium sulfate, free lime, and coal ash, which reflects the chemical characteristics of the sorbent and coal used.Selection of coal and sorbent combinations may provide an opportunity to adjust residue compositions to meet aparticular utilization specification. The particle size of the fines collected from an FBC baghouse is similar to that ofpulverized coal fly ash (mass mean diameter of 10 to 15 µm). The respective particle sizes of the bed offtake, cyclone,and baghouse residues were similar for eight test coals burned under similar conditions (Dearborn EnvironmentalConsulting Services, 1988). Comparison of the AFBC and CFBC residues indicates finer particle-size distributions forthe CFBC because of the high degree of solid recycle (Dearborn Environmental Consulting Services, 1986). Problemscan arise in the disposal of FBC residues as a result of the high levels of CaO and CaSO4, the alkalinity of leachate,and dust associated with residues that contain high levels of CaO. Rapid exothermic reactions and solidificationoccurring with the addition of water require that care be used in handling, utilizing, and disposing of the FBCresiduals (Smith, 1990).
PFBC technology has been investigated under the DOE CCT program, including demonstration of commercial-scalesystems. The current terminology applied to PFBC technologies is “first-generation PFBC” and “second-generationPFBC.” The first-generation PFBC technology was demonstrated at the Tidd Pressurized Fluidized-Bed CoalTechnologies Project.
12
CCB Volumes
Annual summaries of CCB production and consumption have been prepared by the American Coal Ash Association(ACAA) since 1966. These surveys generally cover the highest-volume CCBs: fly ash, bottom ash, boiler slag, andFGD material. Production data from 1966, 1976, 1986, 1993, and 1998 (the most recent summary available from theACAA) are presented in Table 1. A summary of CCB production and use for 1966 through 1993 that was publishedby ACAA (1996) indicates that CCB production increased from 1966 to about 1980. Since 1980, CCB production hasremained relatively constant, with the exception of FGD materials. FGD material production began in 1987 and hasremained relatively constant through 1996.
Table 1. Summary of CCB Production (ACAA, 1996).
By-Product Production1
1966 1976 1986 1993 1998Fly Ash 17.1 42.8 49.26 47.76 63.00Bottom Ash 8.1 14.3 13.41 14.21 16.76Boiler Slag NA2 4.8 4.13 6.23 2.98Combined Ash and Slag 25.2 61.9 66.80 68.20 82.74FGD Material NA NA NA 20.34 25.00 1 All values shown in million short tons.2 No data available.
The quantity of CCBs produced is directly proportional to the amount of coal burned, the ash content of the coal,and the use of FGD. The average ash content of coal used by U.S. electric power utilities is approximately 10%; ashcontent has decreased significantly since 1975 (ICF Resources Inc., 1993). This reduction has resulted from anominal increase in coal cleaning and a large increase in the use of low-sulfur, low-ash western coals to meet thesulfur dioxide emission requirements of the Clean Air Act. U.S. coal consumption for electric power generation hasdoubled since 1975 and is projected to increase an additional 25% by 2010 (EIA, 1993a). Approximately 22% of U.S.coal-fired generating capacity is currently equipped with FGD controls, and additional retrofit installations areprojected to increase FGD coverage to about one-third of generating capacity by the year 2000, when the sulfurcontrol provisions of the 1990 CAAA are fully implemented (EIA, 1993a, b).
CCB Variability
The characteristics of CCBs currently being produced vary widely. In the earlier discussion of processes from whichCCBs are produced, the variability between different types of CCBs (fly ash, bottom ash, boiler slag, FGD material,and FBC by-products) was referred to as being related to the coal type, the combustion system, the emission controlsystem, and collection method. There are physical and chemical differences in these by products. Fly ash is a finelypowdered material comprised mainly of amorphous (glassy) spherical particles. Bottom ash is a coarse material withsintered and agglomerated amorphous particles. Boiler slag generally has the form of glassy pellets. FGD material is agenerally crystalline fine powder, but may be a sludge (wet FGD) or a dry powder. FBC fly ash is a finely powderedmixture of coal ash and crystalline spent sorbent. FBC spent bed material is also a combination of coal ash andsorbent (both reacted and unreacted), primarily crystalline in nature. Table 2 summarizes the physical variability ofthese common CCBs.
CCBs also exhibit chemical variability. Fly ash and bottom ash from a single source have similar major chemicalcompositions; however, the trace element composition varies considerably, because many trace constituents of coalare volatile and tend to be associated with the fly ash. Some trace elements are also captured in FGD materials alongwith SO2 gases. FGD material is generally high in calcium and sulfur-associated in crystalline phases. FBC by-products are also generally high in crystalline calcium–sulfur phases. The chemical variability of CCBs is alsosummarized in Table 2.

13
Table 2. Physical and Chemical Variability of CCBs.
CCB Type Particle SizeParticle
Morphology ColorMajor
CompositionTrace ElementComposition
Fly Ash High % less than325 sieve
Spherical Tan to gray Depends oncoal source
Enriched in trace elements
Bottom Ash Range fromgranular to½ in.
Angular Tan to black Depends oncoal source
Low concentrations
Boiler Slag Granular Approx.spherical
Black Depends oncoal source
Low concentrations ofmost traces
FGD Fine powder Angular (wet ordry)
White to off-white
Calcium andsulfur
May contain some traceelements
Variability within a single CCB type is generally understood as a range of characteristics exhibited by a particularCCB type. Ranges of performance are indicated by these characteristics and are important in considering CCBs forvarious management scenarios, including mine placement. Most of the variability is related to the source coal.
Variability in composition and physical properties can be an indicator of variability in performance, but performancetesting is the most reliable means to determine the performance of a specific material.
Compositional Variability of Fly Ash
The bulk composition of fly ash is similar to that of many geologic materials. Fly ash is primarily composed of silicon,aluminum, iron, calcium, magnesium, sodium, potassium, and sulfur in association with oxygen as oxides, silicates,and aluminates. The combined silicon, aluminum, and iron content (reported as oxides) is frequently used to providean indication of the pozzolanic or cementitious nature of fly ash ( as in ASTM C 618). A combined value of 70% ofthese components is used to indicate a pozzolanic fly ash, and a value between 50% and 70% is used to indicate acementitious fly ash. A pozzolan is a material that sets up when combined with water and a source of calcium. Acementitious material sets up when combined with water. Another indicator of pozzolanic/cementitious behavior isthe calcium content of fly ash. Ranges of calcium content of fly ashes from different sources of U.S. coals are notedin Table 3.
Other major elements, most notably silicon and aluminum, vary inversely with the calcium content in the ash. Calciumcontent also provides an indication of the pH of the fly ash. Higher calcium content fly ashes tend to be morealkaline.
Table 3. Ranges of Calcium Content in Fly Ash Produced by Combustion of Coal from Various U.S. Sources (afterTishmack and Olek, 1999)
Source of Coal Range of Calcium, as % CaOAppalachian Region – Bituminous 1–6Illinois Basin – Bituminous 1–6Gulf Coast – Lignite 7–15Fort Union – Lignite 18–25Powders River Basin – Subbituminous 22–32
Total trace element concentrations and trace element leachate concentrations are frequently determined for fly ash.Leaching is the best available test to evaluate environmental performance of fly ash. Variability is noted in both total

14
and leachate trace element concentrations. The ranges of leachate concentrations for RCRA (Resource Conservationand Recovery Act) elements (arsenic, barium, cadmium, chromium, lead, mercury, selenium, and silver) fall below theRCRA limits for hazardous waste and usually below the Primary Drinking Water Standard limits.
Summary
CCBs will continue to be available throughout the United States for at least the next 20 years. Since onlyapproximately one-third of these materials are used in construction, engineering, and manufacturing, large volumesare available for other applications, including mine reclamation. CCBs exhibit variability primarily related to the coalused and the production system. The range of characteristics exhibited by CCBs makes them useful in minereclamation applications such as fills, treating acid mine drainage, and soil amendment for revegetation. As with anymaterial, it is important to evaluate the properties and performance of CCBs in considering their use for anyapplication.
References
American Coal Ash Association. Coal Combustion Byproduct (CCB) Production & Use: 1966–1993; AmericanCoal Ash Association: Alexandria, VA, 1996.
Benson, S.A.; Pavlish, J.H.; Erickson, T.A.; Katrinak, K.A.; Miller, S.J.; Steadman, E.N.; Zygarlicke, C.J.; Dunham,G.E.; Pflughoeft-Hassett, D.F.; Galbreath, K.C. Center for Air Toxic Metals Final Technical Report; Energy &Environmental Research Center: Grand Forks ND, Dec 1995.
Dearborn Environmental Consulting Services. Characterization of Circulating Bed AFBC Wastes; DECS S10-512,CEA 432 G 494; Dearborn Chemical Company Ltd.: Ontario, Canada, Oct 1986; 119 p.
Dearborn Environmental Consulting Services. Utilization Potential of CFBC Residue in Construction Applications:Final Report; SSC 03SQ.23440-7-9216, DECG S10-608; Dearborn Chemical Company Ltd.: Ontario, Canada, Nov1988; 51 p.
Energy Information Administration (EIA). Electric Power Annual 1991; DOE/EIA–0348(91);U.S. Department ofEnergy, Office of Coal, Nuclear, Electric, and Alternate Fuels: Washington, DC, Feb. 1993a, 162 p.
Energy Information Administration (EIA). Annual Energy Outlook 1993—With Projections to 2010;DOE/EIA–0383(93), Jan 1993b, 214 p.
Hong, B.D. U.S. Coal Supply and Demand: 1997 Review. U.S. Department of Energy, Energy InformationAdministration (http://www.eia.doe.gov//cneaf/coal/cia/summary/cia_sum.html). Published as Annual Review1997: Coal. Mining Engineering 1998, 50 (5).
ICF Resources Incorporated. Coal Combustion Waste Management Study; prepared for U.S. Department of EnergyContract DE-AC01-91FE62017; Washington, DC, Feb 1993.
Mann, M.D.; Willson, W.G.; Hendrikson, J.G. Gasifier Wastewater Treatment: Phase I—Cooling Tower Assessment.Environ. Prog. 1985, 4 (1), 33–39.
Miller, S.J.; Ness, S.R.; Weber, G.F.; Erickson, T.A.; Hassett, D.J.; Hawthorne, S.B.; Katrinak, K.A.; Louie, P.K.K.A. AComprehensive Assessment of Toxic Emissions from Coal-Fired Power Plants: Phase I Results from the U.S.Department of Energy Study; final report for U.S. Department of Energy Pittsburgh Energy Technology Center;Energy & Environmental Research Center: Grand Forks, ND, Sept 1996.

15
Pavlish, J.H.; Gerlach, T.R.; Zygarlicke, C.J.; Pflughoeft-Hassett, D.F. Mitigation of Air Toxics from LigniteGeneration Facilities; final report; Energy & Environmental Research Center: Grand Forks, ND, Oct 1995.
Smith, I.E. Management of AFBC Residues; IEACR/21; IEA Coal Research, Feb 1990.
Tishmack, J.K.; Olek, J. Coal Consumption by U.S. Electric Utilities and Its Impact on Fly Ash Composition. In 13thInternational Symposium on the Management and Use of Coal Combustion Products, Orlando, FL, Jan 11–15,1999; Paper 81, 20 p.
______________________________1Debra F. Pflughoeft-Hassett is a Research Manager in Residuals Research at the Energy and EnvironmentalResearch Center (EERC) of the University of North Dakota. She received her B.S. in Chemistry from the University ofNorth Dakota in 1982. Pflughoeft-Hassett's principal areas of interest and expertise include utilization andcharacterization of coal by-products, waste management, and environmental impacts of coal by-product use anddisposal. She has worked on the development of databases containing characterization information on coal by-products and on the development of chemical characterization protocols. Pflughoeft-Hassett also has expertise inanalytical chemistry, primarily atomic spectroscopy, chromatography, classical analytical methods, molecularspectroscopy, and atomic absorption methods development, as well as environmental and geologic research. Pflughoeft-Hassett has participated extensively as an investigator on laboratory research investigations ofgroundwater contamination, sediment attenuation, coal conversion by-product characterization, leachingcharacterization, and chemical fixation of trace elements, and has developed and applied numerous analyticaltechniques for these tasks. She also participates as a principal researcher and project manager on severalinvestigations of the utilization and disposal of coal combustion by-products and characterization of coal by-products and currently coordinates the research effort of the Coal Ash Resources Research Consortium (CARRC)and other coal by-product research at the EERC. In addition, she has coauthored over 50 publications.

16
THE COMPOSITION OF COAL COMBUSTION BY-PRODUCTS: EXAMPLES FROM A KENTUCKY POWER PLANT
Allan Kolker1,3, Robert B. Finkelman1, Ronald H. Affolter2 and Michael E. Brownfield2
Energy Resources ProgramU.S. Geological Survey
1Reston, Virginia and 2Denver, Colorado
Abstract
A comprehensive study of feed coal, fly ash, bottom ash, feed limestone, and flue-gas desulfurization sludge wasconducted at a Kentucky power plant over a 2-year period. Sampling was conducted monthly at two units, oneburning high-sulfur coal (2.5 to 3.5 wt. % S), and another burning low sulfur coal (0.6 to 0.9 wt. % S). Determinationsof mineralogy and elemental composition were integrated with directed studies of element modes of occurrence,magnetic properties, isotopic composition, organic chemistry, and leachability. Results show that the composition ofthe coal (element contents and modes of occurrence) is the primary determinant of the composition of the coalcombustion products. Mass balance calculations show that with the exceptions of mercury and selenium, mostelements are largely retained in the solid waste products. Ratios of element concentrations in fly ash versus bottomash are very similar to the orders of element volatility reported in the literature. Nickel, chromium, and cobalt showsubstantial enrichment in the magnetic fly ash fraction from the low-sulfur plant, consistent with the occurrence ofthese elements in iron oxide minerals. Fission track studies show a uniform distribution of uranium in the largerglassy cenospheres, and possible enrichment of uranium in dark, iron rich glass versus clear glass. Electronmicroprobe results indicate a uniform distribution of arsenic at low levels throughout glassy fly ash particles, butpossible trace element enrichments on particle surfaces were not detectable by this method. Environmental leachingstudies show that leachate pH, and in the case of the low-sulfur fly ash, grain size, are important factors indetermining element mobility. Our results help determine the suitability of these coal combustion products forrecycling to beneficial uses and their potential environmental impact.
Introduction
The chemical composition of coal combustion by-products (CCBs) is a fundamental parameter in determiningsuitability for various applications. Element contents and their modes of occurrence in CCBs will determine thebehavior of these materials upon disposal or use in the environment, and whether any metallic or chemical by-products can be economically extracted. The major purpose of this project is to provide a comprehensive chemicaland physical characterization of these materials, including an assessment of their possible interaction with theenvironment, and to relate CCB properties to those of the feed coal precursor. In this paper, we summarize themineralogy, chemistry, and other properties of CCBs and demonstrate the relation of these parameters to differencesin the composition of feed coals. More detailed information is available primarily in recent proceedings papers and inUSGS Open-File Report 98-342. This research was conducted jointly by the U.S. Geological Survey, the KentuckyGeological Survey, the University of Kentucky Center for Applied Energy Research, and the cooperating powerplant.
Sampling Approach
Feed coal, fly ash, and bottom ash were collected monthly from July 1994 through June 1996 by the KentuckyGeological Survey. Feed coal and CCBs were taken from two units: Unit 1, a tangentially fired unit burning a blendof relatively high sulfur (~3 wt. %) Illinois Basin and Appalachian Basin coals; and Unit 3, a wall-fired unit burning ablend of low-sulfur (< 1 wt. %) Appalachian Basin coal. Grab samples of washed coal were collected at gravimetricfeed units prior to pulverization and injection into the furnaces of each unit. For the low-sulfur unit, samples of flyash were collected from two parallel banks of hoppers underneath the electrostatic precipitators, a coarse-sidehopper closest to the flue gas entry point, and a fine-side hopper farther along the path through the precipitators(Eble, 1998). Fly ash from the high-sulfur unit, which has a different configuration, was collected from a single bankof hoppers. Samples of bottom ash were collected by suspending a hollow bucket covered with a nylon-mesh
17
screen into the water train carrying ash to the ash pond. This was the only available sampling point and possiblemodification of the bottom ash by interaction with water was unavoidable. A flue-gas desulfurization (FGD) systemwas installed on Unit 1 during the course of our study, and samples of feed limestone and FGD sludge were takenmonthly following its installation. This report summarizes the results for fly ash and bottom ash, primarilyrepresenting the first year of the study.
Results
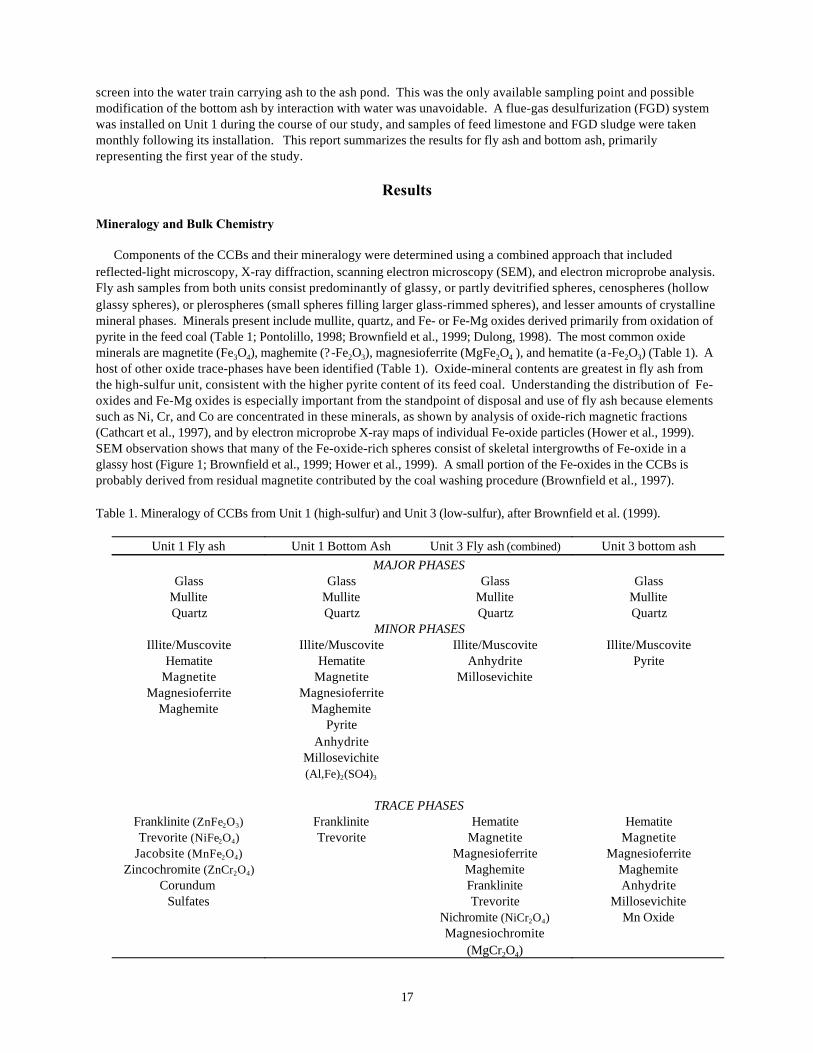
Mineralogy and Bulk Chemistry
Components of the CCBs and their mineralogy were determined using a combined approach that includedreflected-light microscopy, X-ray diffraction, scanning electron microscopy (SEM), and electron microprobe analysis. Fly ash samples from both units consist predominantly of glassy, or partly devitrified spheres, cenospheres (hollowglassy spheres), or plerospheres (small spheres filling larger glass-rimmed spheres), and lesser amounts of crystallinemineral phases. Minerals present include mullite, quartz, and Fe- or Fe-Mg oxides derived primarily from oxidation ofpyrite in the feed coal (Table 1; Pontolillo, 1998; Brownfield et al., 1999; Dulong, 1998). The most common oxideminerals are magnetite (Fe3O4), maghemite (?-Fe2O3), magnesioferrite (MgFe2O4 ), and hematite (a-Fe2O3) (Table 1). Ahost of other oxide trace-phases have been identified (Table 1). Oxide-mineral contents are greatest in fly ash fromthe high-sulfur unit, consistent with the higher pyrite content of its feed coal. Understanding the distribution of Fe-oxides and Fe-Mg oxides is especially important from the standpoint of disposal and use of fly ash because elementssuch as Ni, Cr, and Co are concentrated in these minerals, as shown by analysis of oxide-rich magnetic fractions(Cathcart et al., 1997), and by electron microprobe X-ray maps of individual Fe-oxide particles (Hower et al., 1999). SEM observation shows that many of the Fe-oxide-rich spheres consist of skeletal intergrowths of Fe-oxide in aglassy host (Figure 1; Brownfield et al., 1999; Hower et al., 1999). A small portion of the Fe-oxides in the CCBs isprobably derived from residual magnetite contributed by the coal washing procedure (Brownfield et al., 1997).
Table 1. Mineralogy of CCBs from Unit 1 (high-sulfur) and Unit 3 (low-sulfur), after Brownfield et al. (1999).
Unit 1 Fly ash Unit 1 Bottom Ash Unit 3 Fly ash (combined) Unit 3 bottom ashMAJOR PHASES
Glass Glass Glass GlassMullite Mullite Mullite MulliteQuartz Quartz Quartz Quartz
MINOR PHASESIllite/Muscovite Illite/Muscovite Illite/Muscovite Illite/Muscovite
Hematite Hematite Anhydrite PyriteMagnetite Magnetite Millosevichite
Magnesioferrite MagnesioferriteMaghemite Maghemite
PyriteAnhydrite
Millosevichite(Al,Fe)2(SO4)3
TRACE PHASESFranklinite (ZnFe2O3) Franklinite Hematite HematiteTrevorite (NiFe2O4) Trevorite Magnetite Magnetite
Jacobsite (MnFe2O4) Magnesioferrite MagnesioferriteZincochromite (ZnCr2O4) Maghemite Maghemite
Corundum Franklinite AnhydriteSulfates Trevorite Millosevichite
Nichromite (NiCr2O4) Mn OxideMagnesiochromite
(MgCr2O4)

18
Figure 1. Backscattered electron image (left) and wavelength-dispersive elemental map for Ni (right) showing skeletalFe-oxide in a glassy host, and correspondence of Ni distribution with Fe-oxide.
Fly ash from both units is classified as class F, having a minimum combined percentage of SiO2 + Al2O3 + Fe2O3 of70% (ASTM, 1988; Brownfield et al., 1999). In the present study, bulk concentrations were determined for mostelements by inductively coupled plasma mass spectroscopy (ICP-MS) or by inductively coupled plasma atomicemission spectroscopy (ICP-AES). Selenium was determined by instrumental neutron activation analysis (INNA),whereas Hg contents were determined by cold vapor atomic absorption spectrophotometry (CVAA). Major andtrace-element averages for feed coals and CCBs are given in Appendix 1. The averages show large standarddeviations, especially for trace elements such as As, Cd, Ni, Pb, Sb, Se, and U, reflective of the variation incomposition of the feed coals. In some cases, coals from more than 20 sources were utilized in a given month(Brownfield et al., 1999). Temporal (monthly) variations in the chemistry of CCBs and feed coal were investigated byAffolter et al. (1997) and Affolter (1998), as shown in Figure 2. For example, over a 12-month period, the arseniccontent of feed coal in Unit 1 (high-sulfur) varied from 62 to 240 ppm (expressed on an ash basis, equivalent to 6.6ppm to 26 ppm on a whole coal basis), resulting in a range of 100 to 330 ppm in fly ash, and <5 to 20 ppm in thebottom ash. On a month-to-month basis, the correlation between feed coal composition (expressed on an ash basis)and CCB chemistry is imperfect, due in part to differences in the ash contents of the coals used (Figure 2). Two ofthe bottom ash samples have high contents of Pb (>1000 ppm) and Mn (>1 wt. %), likely contributed by pulverizerdiscards such as pyrite and galena and boiler slag, as well as bolts, gears, etc. that are discarded in the bottom ash(Affolter et al., 1997). Hower et al. (1999) investigated the partitioning of residual carbon and trace metals with particle size, comparing flyash from the low-sulfur and high-sulfur units. Five size fractions, expressed by mesh size ranges +100, 100x200,200x325, 325x500, and -500, were prepared from fly ash fractions collected from both units in November andDecember of 1994. The –500 (< 25 µm) fraction was the largest weight fraction (55.2 to 89.9 % of the sample) in allcases. Residual carbon, and carbon-bearing phases were determined by ultimate analysis, ash yield, andpetrographic methods. The proportion of carbon is greatest in the +100 mesh (> 150 µm) fractions, comprisingbetween 36.8 and 58.0 % of this fraction. However, the two sub 325-mesh (< 42 µm) fractions together constituteabout 80 to 90% of each sample. This is potentially an important consideration in ash utilization , as carbon in thissize fraction is more difficult to remove than that in the coarse fraction (Tondu et al., 1996; Hower et al., 1999). Trace-element data for the sized fractions show that arsenic, zinc, and lead are concentrated in the –500 fraction, consistentwith enrichment of metals found in bulk samples of fine fly ash, relative to the coarse fly ash, in Unit 3 (Appendix 1). For Unit 1, there appears to be a correlation between carbon content and mercury concentration of the fly ash. Mercury contents in fly ash from Unit 3 were too low to establish any correlation with carbon content (Hower et al.,1999).

19
Figure 2. Monthly distribution of As, Be, Co, Cr, Ni,Pb, and Sb contents in feed coal laboratory ash, flyash, and bottom ash for Unit 1 (high-sulfur, left) andUnit 3 (low-sulfur, right), including coarse and fine flyash. Results from Affolter, 1998. Spike for Pb in Unit3 bottom ash (November, 1994), is due to the additionof extraneous material.
20
Element Modes of Occurrence and Mass Balance Calculations
Understanding the mode of occurrence of a given element in the CCBs is important from the standpoint of assessingits suitability for a given purpose, and evaluating the potential for groundwater contamination by leaching ofarsenic, radionuclides, and other potentially harmful substances. Element associations in the Kentucky fly ashsamples were investigated by Finkelman et al. (1997) and by Palmer et al. (1998a), who also investigated the bottomash. These studies utilize a combination of approaches including sequential selective leaching, X-ray diffraction,SEM, and electron microprobe. In the selective leaching approach, CCB samples were leached with a 4-stepsequence of reagents originally devised for determinations of element modes of occurrence in whole coals (Palmer etal. 1998b). Listed in order of application, the leaching sequence includes 1) 1N ammonium acetate (NH4C2H3O2); 2)2N hydrochloric acid (HCl); 3) concentrated (48-51%) hydrofluoric acid (HF); and 4) 1.5N nitric acid (HNO3). Themode of occurrence of an element is assessed by comparing the fraction removed by a given reagent to theconcentration of that element in the bulk sample. As the bulk of the ash consists of silicate material, the largestfractions of material were leached by HF (Palmer et al., 1998a).
Leaching results were obtained for several elements of interest, including arsenic, nickel, cobalt, chromium,antimony, zinc, uranium and thorium (Palmer et al., 1998a). Fly ash samples from each unit show that a substantialportion (about 80%) of the arsenic is present as an HCl-soluble phase, possibly as Ca3(AsO4)2 that has beenidentified as a condensate on fly ash particle surfaces (EPRI, 1998). Electron microprobe results for the Kentuckyash (McGee et al., 1995), and Canadian fly ash (Mukhopadhyay et al., 1996), show that arsenic is also present in solidsolution in the glass phase in fly ash. Some of this Ca-silicate glass is leachable in HCl (C. A. Palmer, unpublisheddata). The electron microprobe studies show no enrichment in arsenic at the particle surfaces; however, the scale ofthis enrichment is likely to be too fine to resolve with the electron microprobe. Follow-up studies are underway totry to clarify the mode of occurrence of arsenic in fly ash. A much greater proportion (40-80%) of the arsenic in thebottom ash was found to be in silicates (HF soluble), compared to the fly ash.
Leaching results for iron, cobalt, nickel, and chromium in both fly ash and bottom ash show that these elements areprimarily HF soluble, indicating they are present in silicates, and likely in Fe-oxides not exposed until their glassymatrix is dissolved by HF. Electron microprobe elemental maps confirm the presence of Ni and Cr in the Fe-oxides(Figure 1; Hower et al., 1999; Finkelman et al., 1997). Cobalt is likely to be present in pyrite, the precursor of Fe-oxides in the coal ash (Kolker et al., 1998). Analysis of magnetic separates, enriched in Fe-oxide phases, also showsenrichment in Ni, Co, and Cr, relative to bulk ash samples, especially in fly ash from the low-sulfur unit (Crowley etal., 1998; Cathcart et al., 1997). Leaching results for uranium and antimony in fly ash from the two units shows thatsignificant (40-65%) portions of these elements are removed by HF. The presence of uranium in glassy portions ofthe fly ash is confirmed by fission track radiography (Zielinski and Budahn, 1998). Large (> 63 µm) cenospheresshowed a uniform distribution of uranium with no apparent surface enrichment on the glassy rims. Opaque (oxide-rich) grains also contain moderate amounts of uranium that appear to be uniformly distributed, but the resolution ofthe radiography technique is not sufficient to distinguish skeletal magnetite from the host glass (Zielinski andBudahn, 1998).
Mass balance of elements between feed coal and solid CCBs was investigated by Crowley et al. (1998), whocompared the concentration of selected elements in the feed coal ash to contents in the sum of the solid coalcombustion products, calculated assuming the proportions of fly ash and bottom ash produced by the power plantare 75% and 25%, respectively. For most elements, including arsenic, beryllium, cadmium, cobalt, chromium, nickel,antimony, and uranium, the material balance equals or approaches 100%. A major exception is selenium. Only 10%(Unit 3) to 30% (Unit 1) of the selenium was retained in the solid CCBs, consistent with previous work indicating thatselenium is a volatile element that can potentially escape in stack gasses. Similar, or even more highly volatilebehavior is expected for mercury, but its mass balance was not determined. The mass fraction in the CCBs exceeds100% for Pb in Unit 1 (140%) and for Mn in Unit 3 (130%). In the first case, the excess is controlled by the Pbcontent of the fly ash, which itself accounts for 125% of the Pb in the feed coal ash. In the second case, the bottomash is enriched in Mn by a factor of 2, relative to the fly ash, possibly due to contamination.
21
Environmental Leaching Studies
In order to investigate the leachability of metals from the Kentucky CCBs, short-term deionized-water batch leacheswere performed over periods ranging from a few minutes to 18 hours, with select samples placed into long-term (> 1year) flow columns (Rice et al., 1999). Experimental conditions may provide an analogue to natural conditions inwaste disposal sites exposed to infiltration of dilute meteoric water. The behavior of elements such as Cu, Ni, Cr, Zn,Mn, Mo, As, and U was investigated. Comparing averages for 12 monthly samples of high-S fly ash, low-S coarsefly ash, and low-S fine fly ash, all leached for 18 hours, significant differences were found in pH and averagepercentage of metals extracted. Average pH of the18-hour leachates ranged from 4.6 in the low-S fine ash to 11in thehigh-S ash. The low-pH leachates from the low-S fine ash had the highest percentages of metals that form cations insolution, and that are present as soluble oxides, extracted after 18 hours. Percentages extracted exceeded 2% of theamount present in the ash for Co (2.6%), Cr (4.4%), Mn (3.8%), Ni (3.8%), and Zn (4.3%). For Cu (28%) and Cd (21%),more than 20% of the total in the ash was extracted under these conditions. Solution pH, and a series of reactions between the fly ashes and solutions, were found to be the most significantcontrolling factors determining the leachability and mobility of trace elements (Rice et al., 1999). In short-term (< 1hour) experiments, leachates initially show a pH minumum, due to dissolution of aluminum sulfate surface coatingson fly ash particles. Within minutes, pH increases as a result of hydrolysis of metal oxides, and concentrations ofmetals in solution decrease, probably from co-precipitation and adsorption of metals onto secondary phases. Insamples lacking sulfate grain coatings, such as the coarse low-S fly ash, initial pH of the leachates can be alkaline(Anderson and Leventhal, 1998). Concentrations of elements such as As, Mo, and U, that form oxy-anions inoxidizing solutions, are highest in the alkaline leachates. High pH-soluble elements like As and U continue to beleached over longer time periods, as seen in the column leaching experiments. The complexity of element speciationover varying pH and the influence of competing reactions between fly ash components and solutions make itdifficult for standard short-term leaching tests to adequately predict the behavior of many metals of environmentalconcern (Rice et al., 1999).
Summary
The Kentucky power plant investigated provided a good opportunity to determine the composition ranges of fly ashand bottom ash produced by two units having differing firing geometries, and burning coals with differing sulfurcontents. Monthly samples were investigated in detail using a combined analytical approach to assess mineralogy,bulk composition, element modes of occurrence, mass balance of environmentally sensitive elements, and thepotential for mobility of these elements by infiltration of meteoric water into ash disposal sites. Significant chemicalvariations were found between monthly samples of a given CCB, between ash from the high- and low-S sources, andbetween coarse and fine fly ash fractions from the low-S boiler. These differences are primarily a consequence ofdifferences and variation in the feedstock. Once in the environment, significant differences in leaching behavior arelikely to result from these variations. Thorough characterization of coal ash composition is needed to predict itsbehavior during use and disposal.
Acknowledgements
The authors thank the following individuals who contributed to this project: George Breit, John Bullock, JimCathcart, Sharon Crowley, Frank Dulong, Joe O’Connor, Curtis Palmer, Cindy Rice, and Bob Zielinski (all USGS);Cortland Eble (Kentucky Geological Survey); and Jim Hower (University of Kentucky Center for Applied EnergyResearch). Constructive comments on the manuscript were provided by Curtis Palmer, Bob Zielinski, Cindy Rice,and Ione Taylor.
References
Affolter, R. H., 1998, The chemical composition of feed coal, fly ash , and bottom ash, section D., in Breit, G. N., andFinkelman, R. B., Characterization of coal and coal combustion products from a coal-burning powerplant—Preliminary report and results of analyses: U. S. Geological Survey, Open-File Report 98-342, 101 p.
22
Affolter, R. H., Brownfield, M. E., and Breit, G. N., 1997, Temporal variations in the chemistry of feed coal fly ash, andbottom ash from a coal-fired power plant: Proceedings of the 1997 International Ash Utilization Symposium,Lexington, KY, p. 757-764.
American Society for Testing and Materials (ASTM), 1988, Annual Book of ASTM Standards, section 4: ConstructionMaterials, vol. 04.01: Cement, Lime, Gypsum.
Anderson, T., and Leventhal, J. S., 1998, Coal ash environmental leaching: pH, section J., in Breit, G. N., and Finkelman,R. B., Characterization of coal and coal combustion products from a coal-burning power plant—Preliminary reportand results of analyses: U. S. Geological Survey, Open-File Report 98-342, 101 p.
Brownfield, M. E., Cathcart, J. D., and Affolter, R. H., 1997, Characterization of feed coals and waste products from a coal-burning power plant in Kentucky: Proceedings of the 1997 International Ash Utilization Symposium, Lexington,KY, p. 780-784.
Brownfield, M. E., Affolter, R. H., Cathcart, J. D., O’Connor, J. T., and Brownfield, I. K., 1999, Characterization of feedcoal and coal combustion products from power plants in Indiana and Kentucky: Proceedings of the 24th
International Technical Conference on Coal Utilization and Fuel Systems, Clearwater, FL, p. 989-1000.
Cathcart, J, D., Reynolds, R. L., Brownfield, M. E., and Hower, J. C., 1997, Chemical, mineralogical, and, magneticcharacterization of sized fly ash from a coal-fired power plant in Kentucky: Proceedings of the 1997International Ash Utilization Symposium, Lexington, KY, p. 785-792.
Crowley, S. S., Finkelman, R. B., Palmer, C. A., and Eble, C. F., 1998, Characterization of hazardous trace elements insolid waste products from a coal-burning power plant in Kentucky, section E., in Breit, G. N., and Finkelman, R.B., Characterization of coal and coal combustion products from a coal-burning power plant—Preliminary reportand results of analyses: U. S. Geological Survey, Open-File Report 98-342, 101 p.
Eble, Cortland F., 1998, Sample collection procedure, section B., in Breit, G. N., and Finkelman, R. B., Characterization ofcoal and coal combustion products from a coal-burning power plant—Preliminary report and results of analyses:U. S. Geological Survey, Open-File Report 98-342, 101 p.
EPRI (Electric Power Research Institute), 1998, Identification of arsenic species in coal ash particles, EPRI, Palo Alto, CA,TR-109002, 168 p.
Dulong, F., 1998, X-ray diffraction analysis, section R., in Breit, G. N., and Finkelman, R. B., Characterization of coal andcoal combustion products from a coal-burning power plant—Preliminary report and results of analyses: U. S.Geological Survey, Open-File Report 98-342, 101 p.
Finkelman, R. B., Kolker, Allan, and Palmer, C. A., 1997, Modes of occurrence of arsenic and other trace elements in flyash from a Kentucky power plant: Proceedings of the 1997 International Ash Utilization Symposium, Lexington,KY, p. 239-246.
Hower, J. C., Trimble, A. S., Eble, C. F., Palmer, C. A., and Kolker, Allan, 1999, Characterization of fly ash from low-sulfurand high-sulfur coal sources: Partitioning of carbon and trace elements with particle size: Energy Sources, v. 21,p. 511-525.
Kolker, Allan, and Finkelman, R. B., 1998, Potentially hazardous elements in coal: Modes of occurrence and summary ofconcentration data for coal components: Coal Preparation, v. 19, p. 133-157.
McGee, J. J., Finkelman, R. B., and Pontolillo, J., 1995, Microanalysis of hazardous air pollutants in fly ash and bottomash from a coal-burning power plant: Geological Society of America, Abstracts with Programs, v. 27, no. 6, p. 139.
Mukhopadhyay, P. K., Lajeunesse, G., and Crandlemire, A. L., 1996, Mineralogical speciation of elements in feed coaland their combustion residues from an eastern Canadian coalfield and power plant: International Journal of CoalGeology, v. 32, p. 279-312.

23
Palmer, C. A., Finkelman, R. B., Krasnow, M. R., and Eble, C. F., 1998a, Laboratory leaching behavior of environmentallysensitive trace elements from fly ash and bottom ash samples, section F., in Breit, G. N.and Finkelman, R. B.,Characterization of coal and coal combustion products from a coal-burning power plant—Preliminary report andresults of analyses: U. S. Geological Survey, Open-File Report 98-342, 101 p.
Palmer, C. A., Crowley, S. S., Mroczkowski, S. J., Finkelman, R. B., and Bullock, J. H., Jr., 1998b, the use of sequentiallaboratory leaching to quantify the modes of occurrence of trace elements in coal: Proceedings of the 15th
Pittsburgh Coal Conference, 28 p., CD-ROM.
Pontolillo, J., 1998, Fly ash petrography, section S., in Breit, G. N., and Finkelman, R. B., Characterization of coal and coalcombustion products from a coal-burning power plant—Preliminary report and results of analyses: U. S. GeologicalSurvey, Open-File Report 98-342, 101 p.
Rice, C. A., Breit, G. N., Fishman, N. S., and Bullock, J. H., Jr., 1999, Leachability of trace elements in coal and coalcombustion wastes: Proceedings of the 24th International Technical Conference on Coal Utilization and FuelSystems, Clearwater, FL, p. 355-366.
Tondu, E., Thompson, W. G., Whitlock, D. R., Bittner, J. D., and Vasiliauskas, A., 1996, Commercial separation ofunburned carbon from fly ash: Mining Engineering, v. 48, p. 47-50.
Zielinski, R. A., and Budahn, J. R., 1998, Radionuclides in fly ash and bottom ash: Improved characterization based onradiography and low energy gamma-ray spectrometry: Fuel, v. 77, no. 4, p. 259-267.

24
Appendix 1. Averages of geochemical results for major elements and selected trace elements of interest.
1A: Results for high-sulfur unit (Unit 1). Modified from Affolter (1998) and Brownfield et al., 1999.
Oxide (wt. %)or
Element (ppm)
Feed Coal Mean(whole coal basis)
± standarddeviation1
Feed Coal Mean(ash basis)± standarddeviation1
Fly Ash Mean Bottom Ash Mean
(ash %) 10 99 93SiO2 42 ± 4.1 47 ± 2.2 44 ± 2.7TiO2 0.98 ± 0.07 1.0 ± 0.07 0.85 ± 0.11Al2O3 21 ± 1.2 22 ± 0.78 20 ± 1.7Fe2O3 21 ± 3.7 19 ± 3.8 24 ± 5.1MgO 0.76 ± 0.07 0.83 ± 0.06 0.71 ± 0.08CaO 3.6 ± 0.72 3.6 ± 0.54 3.8 ± 0.63Na2O 0.61 ± 0.24 0.66 ± 0.21 0.58 ± 0.21K2O 1.8 ± 0.26 1.9 ± 0.27 1.5 ± 0.21P2O5 0.26 ± 0.12 0.25 ± 0.09 0.16 ± 0.04
Trace Elements(ppm)
As 12 ± 6.1 120 ± 58 170 ± 67 11 ± 5Be 1.5 ± 0.55 15 ± 5.4 19 ± 6.7 14 ± 5Cd 0.36 ± 0.36 3.6 ± 3.6 5.5 ± 3.1 0.8 ± 0.25Co 4.6 ± 1.8 45 ± 17 59 ± 20 49 ± 16Cr 15 ± 2.6 150 ± 21 170 ± 12 150 ± 12Hg2 0.07 ± 0.06 0.69 ± 0.6 0.39 ± 0.3 0.02 ± 0.01Mn 25 ± 6.3 250 ± 57 270 ± 63 330 ± 63Ni 18 ± 10 170 ± 97 220 ± 110 210 ± 92Pb 11 ± 8.6 110 ± 77 150 ± 67 46 ± 21Sb 0.87 ± 0.55 8.7 ± 5.2 13 ± 5.9 3.5 ± 1.6Se2 2.5 ± 0.62 26 ± 6.2 8.9 ± 4.4 0.59 ± 0.76Th 2 ± 0.24 20 ± 1.5 22 ± 3.1 21 ± 2.2U 1.6 ± 1.3 16 ± 13 19 ± 8.1 14 ± 7.3
1Standard deviation based on a minimum of 10 determinations and a maximum of 12 determinations.2Values for Hg and Se in coal ash computed from determinations on whole coal.

25
1B: Results for low-sulfur unit (Unit 3). Modified from Affolter (1998) and Brownfield et al., 1999.
Oxide (wt. %)or
Element (ppm)
Feed Coal Mean(whole coal
basis)± standarddeviation1
Feed Coal Mean(ash basis)
± standard dev.
Coarse Fly AshMean
Fine Fly AshMean
Bottom AshMean
(ash %) 9.1 98 98 97SiO2 53 ± 6.7 58 ± 3.3 55 ± 3.8 57 ± 5.2TiO2 1.6 ± 0.14 1.5 ± 0.15 1.6 ± 0.13 1.4 ± 0.22Al2O3 30 ± 1.6 30 ± 1.4 30 ± 1.3 26 ± 2.9Fe2O3 4.4 ± 1.0 4.2 ± 0.71 4.9 ± 0.4 8.2 ± 3.3MgO 0.85 ± 0.16 0.97 ± 0.16 1.1 ± 0.11 0.81 ± 0.14CaO 1.3 ± 0.3 1.2 ± 0.29 1.4 ± 0.16 1.1 ± 0.37Na2O 0.41 ± 0.09 0.37 ± 0.07 0.41 ± 0.06 0.32 ± 0.1K2O 2.1 ± 0.27 2.5 ± 0.46 2.6 ± 0.3 2.1 ± 0.37P2O5 0.18 ± 0.07 0.18 ± 0.07 0.28 ± 0.06 0.11 ± 0.05
Trace Elements (ppm)
As 3.3 ± 0.73 37 ± 8.8 54 ± 20 91 ± 19 54 ± 62Be 2.4 ± 0.35 27 ± 3.7 22 ± 4.1 27 ± 4.3 16 ± 2.5Cd 0.07 ± 0.03 0.8 ± 0.32 0.8 ± 0.22 1 ± 0.41 --Co 11 ± 2.2 120 ± 23 97 ± 24 150 ± 37 61 ± 9.2 Cr 19 ± 3.1 210 ± 26 190 ± 26 230 ± 22 200 ± 64Hg2 0.034 ± 0.04 0.31 ± 0.4 0.02 ± 0.005 0.02 ± 0.005 0.24 ± 0.3Mn 14 ± 3.9 150 ± 45 210 ± 69 230 ± 36 480 ± 320Ni 17 ± 2.5 190 ± 26 160 ± 32 220 ± 42 140 ± 25Pb 11 ± 0.84 120 ± 11 100 ± 16 170 ± 33 380 ± 920Sb 0.71 ± 0.07 7.9 ± 0.98 8.9 ± 1.7 15 ± 3.4 10 ± 23Se2 5.6 ± 1.8 5.6 ± 1.8 0.82 ± 1.4 1.1 ± 1.7 1.7 ± 1.5Th 2.9 ± 0.49 32 ± 5.6 30 ± 5.5 31 ± 2.9 29 ± 2.9U 1.4 ± 0.32 16 ± 3.9 15 ± 3.4 21 ± 4.1 10 ± 2.7
1Standard deviations computed from a minimum of 9 determinations and a maximum of 14 determinations.2Values for Hg and Se in coal ash computed from determinations on whole coal.--Insufficient number of analyses with values above detection limit.
______________________________3Allen Kolker has been a Geologist with the U.S. Geological Survey (USGS) Energy Resources Program in Reston,Virginia since 1996. He received his Ph.D. in Geochemistry from the State University of New York at Stony Brook in1989, his M.S. in Geology from the University of Massachusetts in 1980, and his B.A. in Geology from Franklin andMarshall College, Lancaster, Pennsylvania, in 1977. Kolker’s current research interests include coal geochemistry,trace elements, environmental geochemistry, microbeam analytical instruments (electron microprobe, ion probe, etc.),geochemistry and health issues, and trace elements in acid mind drainage and groundwater systems. He serves asProject Manager for a collaborative program on trace-element transformations during coal combustion.

26
PHYSICAL AND ENGINEERING PROPERTIES OF COAL COMBUSTION BY-PRODUCTS
Yoginder P. Chugh1, Debasis Deb and C.B. RajuDepartment of Mining and Mineral Resources Engineering
Southern Illinois UniversityCarbondale, Illinois
Coal Combustion By-Products Issue: An Overview
Over 80% of the 1.2 billion tons of coal annually produced in the USA are combusted for power generation. Thisresults in generation of about 110 million tons of by-products known as “Coal Combustion By–products (CCBs).”These include fly ash, bottom ash, and boiler slag from conventional boilers, and Flue Gas Desulfurization (FGD) by-products from advanced clean coal technology combustors. Based on American Coal Ash Association collectedstatistics, the generation of CCBs has increased from about 78 metric tons in 1987 to about 110 metric tons in 1998;an increase of about 3% annually. Over 60% of the CCBs are generated as fly ash. An estimate of the averagemanagement cost for CCBs in the USA is about $15-20 per ton.
Cost-effective management of CCBs, in an environmentally friendly manner, has been, is, and will be an importantproblem impacting the economics of coal production and power generation. The U. S. Department of Energy, variousStates, Electric Power Research Institute, universities, private organizations, and entrepreneurs have providedleadership over the past 20 years to research, develop, demonstrate, and implement new technologies for CCBsmanagement. With implementation of clean coal technologies and Clean Air Act Amendments of 1990, thegeneration volume of CCBs and FGD by-products will increase and their quality will decrease over the yearsrequiring additional research and development for effective management. The development and recent funding of theCombustion By-Products Recycling Consortium (CBRC) by the National Energy Technology Laboratory is a verytimely effort in this direction.
Coal Combustion By-Products Utilization: An Overview
CCBs beneficial use (excluding FGD by-products) has been steadily increasing over the past three decades fromabout 12% in 1967 to about 29% in 1994 and 34.7% in 1998. If FGD by-products are included, the usage hasincreased from about 23% in 1987 to about 29% in 1998. The remaining CCBs are disposed in on-site ponds, nearbyabandoned or active mine sites, or landfills. Approximately 33-35% each of fly ash, bottom ash, and boiler slag wasutilized in 1998.
Based on 1998 data, the major uses of fly ash include cement/concrete applications (16%), waste stabilization (5%),structural fills (4%), mining applications (3%), and road base/subbase (2%). Bottom ash is primarily used in roadbase/subbase (30%), structural fills (20%), snow and ice control (14%), and cement/concrete applications (12%). So boilerslag is mostly used for blasting grit/roofing shingles (75%). The FGD by-products are mostly consumed in wallboardindustry (7%). These numbers may vary considerably from year to year; however, the overall use trend continues to beupward.
Coal Combustion By-Products as a Material: An Overview
CCBs represent incombustible materials left after combustion of coal in conventional and/or advanced clean coaltechnology combustors. Therefore, they represent inherent incombustible matter in coal, and sorbents for clean coaltechnologies and their chemical transformation during coal combustion and subsequent gas cleanup operations.Therefore, chemical composition of coal, inorganic matter associated with coal, and sorbents affect CCBs propertiesas a material.

27
Chemically, coal is an organic material and it primarily contains carbon, hydrogen, nitrogen, oxygen, and sulfur. Theprimary inorganic constituents associated with the coal include clay minerals, silica, carbonates, and sulfides. Theseconstituents may decompose completely, partially or remain inert during the combustion process with temperaturesranging from 800-1500/C depending upon the technology used. Similarly, decomposed products may combinechemically to form new minerals based on reactivity, catalytic reactions, and temperature. The resulting CCBs areprimarily made of silicon, aluminum, iron, calcium, magnesium, sulfur oxides, and several trace elements such asarsenic, selenium, lead, mercury, boron, etc. Most of these elements combine with oxygen to form correspondingoxides. Since combustion of coal is never complete, CCBs also contain varying amounts of unburned carbon andother matter (LOI). The chemical nature of CCBs may also vary based on clean coal and FGD technologies used suchas fluidized bed combustion (FBC), wet scrubber, dry sorbent injection, etc. Tishmack (1997) and others haveprovided a good review of mineralogical composition of CCBs.
Typical Physical and Engineering Characteristics of Common CCBs
Fly Ash. A SEM micrograph of an F-ash from the Midwest and a C-ash is given in Figure 1. Table 1 shows a rangeof properties for F-fly ash and C-fly ash. It is a relatively dry (2-3% moisture content), cohesionless material withmean particle size of 20-30 µm (Figure 2). Particles range in size from 5 microns to about 7 mm. Specific area variesdepending upon the mean particle size and the uniformity coefficient. The specific gravity of the ash varies from 1.9to about 2.4. Most fly ash particles are hollow and spherical in shape. C-fly ash may also contain solid, irregularshaped particles. The size uniformity coefficient for both fly ashes is generally high. Since fly ash does not containclays, it has no plastic limit. The fly ash may be classified as either F-ash or C-ash based on ASTM C-618requirements shown in Table 2. The classification is primarily based on the sum of oxides of silicon, iron, andaluminum (50 to 70% for C-ash, 70% for F-ash). Bituminous coals invariably produce F-ash while lignite orsubbituminous coal can produce either F-ash or C-ash based on calcium content in coal (Table 3). The free limecontent indicated by calcium oxide must be less than 30% in F-ash and less than 40% in C-ash. Typical values ofCaO in F-ash are less than 10% while for C-ash, they range from 15-20%.
Table 1. A Few Physical Properties of CCBs .
Properties C-Type Fly ash (Ref:McCarthy et al., 1987)
F-type Fly ash (Ref:Chugh et al., 1998)
Mean particle size 45.0 µ 32.6 µAs-received moisture 0.02 % 16.0%
CCE 44.46% 3.7%Paste pH NA 8.8
Table 2. Classification of Fly Ssh (ASTM C-618).
Chemical: Class F Class C
SiO2 + Al2O3+Fe2O3 min 70 50SO3 , % max 5 5LOI, % max 6 6Alkalis, % max 1.5 1.5Physical:Fineness, % 34 34Strength Activity7 days (with PC), % of control
75 75
Strength Activity28 day (with PC), % of control
75 75
Soundness, % (autoclave expansion) max 0.8 0.8Density, max variation from average (%) 5.0 5.0
28
Table 3. Calcium Content in Various Types.
Type of coal CaO in ash
Bituminous 1- 8%Subbituminous 6-12%
Lignite 10-32%
Typical oxide compositions for F-ash and C-ash are given in Table 4. ASTM C-311 dictates sampling and testingprocedures for fly ash. Both types of fly ash demonstrate good compaction characteristics although C-ashdemonstrates higher maximum density because of irregular particle shape. Figure 3 shows particle size distributionsof different CCBs.
F-fly ash is a “pozzolonic” material only and requires addition of activators like cement or lime to initiate cementationreactions. C-fly ash on the other hand is both pozzolonic and self-cementing (because of available free lime) anddoes not require activation. Siliceous or alumino-silicate glass is the primary active component of F-fly ash, while forC-fly ash it is calcium alumino-silicate glass. Hydration of fly ash is not only governed by chemical composition butalso by the crystallanity of ash.
Fluidized Bed Combustion By- Products. FBC is a well-established clean coal technology. An FBC combustoroperates at a much lower temperature (about 800oC) and reduces generation of nitrous oxides. However, the amountof LOI is increased in the ashes. Over the next decade, several new FBC units are being planned in the USA,particularly in the Midwest. Just as in a pulverized coal boiler, fly ash and bottom ash (or spent-bed ash) areproduced in the ratio of about 60:40 in a FBC boiler. Typical SEM micrograph of FBC fly ash is shown in Figure 4.FBC fly ash mean particle size is similar to pulverized coal fly ash (about 20-30 µm) and most of the particles are ofprismatic shape. The uniformity coefficient is also similar to F-fly ash and C-fly ash. The specific gravity varies from1.9 to 2.4. The particle size of FBC is small and thus has the highest potential for fugitive dust generation (Figure 3).
Table 4. Chemical and Physical Characterization of Fly Ash.
Composition SIPC SIPC SIUC CementLOI 7.11 1.65 9.73 -SiO2 40.99 45.45 36.10 21.79Al 2O3 15.73 16.28 13.89 4.46Fe 2O3 22.15 23.72 11.08 2.96CaO 4.31 7.38 18.00 62.20NaO2 0.7 0.29 0.55 0.09MgO 0.57 0.55 0.43 4.06SO3 2.57 1.62 8.23 2.69K2O 3.43 1.92 1.44 0.48Mn2O3 0.15 0.16 0.08 -P2O5 1.21 0.16 0.40 -TiO2 1.08 0.81 0.40 -
Typical oxide composition for FBC fly ash and FBC spent bed ash is given in Table 5. The CaO content of FBC flyash typically varies from 15 to 30%, while it is 30-45% for the spent-bed ash. Because of the high CaO content, theash is highly self-cementing and produces very large amount of heat during the hydration process. The ash hasmuch smaller amount of glassy material as compared to pulverized coal ash because of lower temperatures in thecombustor. Since FBC technology is used for high sulfur coals, the ash contains more Fe as oxides.
The spent–bed ash is generally much coarser in size and resembles sand (70-80 µm) with lower uniformity coefficientthan FBC fly ash. The LOI values in FBC fly ash and spent-bed material vary over a wide range depending upon theload on the boiler.

29
Table 5. Typical Oxide Composition of FBC Fly Ash andFBC Spent Bed Ash (Ref: Chugh, et al., 1998).
Chemical composition FBC Fly Ash FBC SpentBed Ash
ASTM C 618 Fly ashSpecifications
SiO2 22.10 9.7Al2O3 6.80 3.69Fe2O3 6.67 2.16
Total SiO2+Al2O3+Fe2O3
35.57 15.55 Class C: 50% MinClass F: 70% Min
SO3 15.67 24.42CaO 38.70 53.10MgO 1.29 0.88LOI 5.46 0.80 6.0 Max
Free Moisture 0.11 0.00Water of Hydration 0.71 2.65
Total Na2O 0.50 0.16Total K2O 1.12 0.39
Others (TiO2+P2O5+SrO+BaO)
0.83 2.04
Paste pH 12.2 12.00
The use of FBC by-products in development of construction materials requires their prehydration to convertanhydrite to gypsum. This can be achieved through addition and thorough mixing of 10 to 25% water in two steps.
An additional area of concern in the use of FBC by-products is the higher amount of sulfates in ash. Limitedavailable data indicates that sulfates in the range of 5 to 10% only delays the hydration reactions but have no effecton the ultimate strength. At higher sulfate contents, durability is significantly reduced. Formation of ettringite duringinitial hydration and its subsequent swelling can have a negative effect on the strength and performance of thestructure. These issues can also be important for C-fly ash.
Flue Gas Desulfurization By-Products. Flue gas desulfurization is an established technology to remove SOx. Theflue gases are forced to react with chemical sorbents in a wet slurry form or dry form in a scrubber. Over 90% of theexisting FGD systems utilize limestone (CaCO3), calcium hydroxide, Ca (OH)2, or calcium oxide (CaO) as the sorbent. The resulting CCBs may be sulfite-rich or sulfate-rich depending upon whether the chemical reactions are oxygeninhibited or not.
Typical SEM microphotographs for sulfite-rich and sulfate rich FGD by-products are shown in Figures 5 and 6. Particle size and particle shape distributions vary significantly from plant to plant. Typical particle size ranges 0.88mm to 1 mm. These variables have significant effect on compaction and strength development characteristics. FGDby-products contain some fly ash carried with flue gases. Because of the added sorbent, oxides of iron, silicon, andiron are smaller than for pulverized coal ash. Sulfite–rich by-products demonstrate thixotropic behavior and areextremely difficult to dewater. Sulfate-rich sludge has very similar characteristics to natural gypsum and is usedprimarily for wallboard applications. A common application for sulfite-rich wet scrubber sludge is to stabilize it withfly ash and 1-2% lime and use it as a structural fill.
Typical oxide compositions for wet scrubber sludge are given in Table 6. Free lime content is very low and thereforetheir reactivity is generally low.
Importance of Physical and Engineering Properties in CCBs Utilization
Based on an extensive literature review, the following physical properties have been identified as important.
• Particle Size Distribution (ASTM D 422)

30
• Minus 325 Sieve Fineness (ASTM C 311)• Blaine Fineness (ASTM C 204)• As received• 325 Sieve Fraction• Surface area• Moisture Content (ASTM C 311)• Specific Gravity (ASTM C311)
Table 6. Typical Oxide Composition of PCC Fly Ash and Scrubber Sludge (Ref: Chugh et al., 1998).
Chemicalcomposition
PCC Fly Ash Scrubber Sludge
ASTM C 618 Fly ash Specifications
SiO2 55.90 0.45Al2O3 15.40 BDLFe2O3 16.10 BDLTotalSiO2+Al2O3+Fe2O3
87.40 0.45 Class C: 50% MinClass F: 70% Min
SO3 1.15 58.73CaO 5.06 41.0MgO 0.78 BDLLOI 0.58 0.00 6.0 MaxTotal Na2O 1.48 BDLTotal K2O 1.93 0.02Free lime 0.10 0.23CaSO4 -- 99.87CaSO3 -- BDLCaCO3 -- BDLPaste pH 12.26 7.99
Similarly, the following engineering properties have been identified as important.
• Loss on Ignition (ASTM C311)• Compaction Properties (ASTM D-698, ASTM C-593)• Pozzolonic Activity Index (ASTM C 618)• Atterberg Limits (ASTM 4318)• Swelling Properties • Chugh’s Engineering Test for air entrainment• Calcium Carbonate Equivalent (CCE)• Paste pH (ASTM D4972)• Durability (ASTM 593)• Flow properties (ASTM C 109)• Sulfate resistance (ASTM C1012)
These properties will be discussed in relation to various applications for CCBs in later sections of this paper.
Classification of Beneficial Use Applications
Based on a literature review, which is rather extensive, an attempt is made here to classify beneficial use applicationsbased on CCBs significant properties. These are: • Large volume (structural fills, embankments, unstabilized road subbase)• Cementitous/Pozzolonic (cement/concrete, flowable fills, structural materials, waste stabilization)

31
• Chemical/Neutralization properties (acid mine drainage, mine reclamation)• Abrasive properties (blasting grit, roof shingles, snow and ice removal)• Mineralogical properties (magnetite removal, aluminum alloys, silicon alloys, etc.)• Soil enhancement properties (artificial soils, soil amendments)
Figure 7 shows utilization of CCBs for various applications in the United States for the year 1998. A discussion ofdesirable physical and engineering properties for each type of application follows.
Large Volume Applications
These applications generally represent low value, large volume applications such as structural fills, embankments,road subbase, etc. The important physical properties for CCBs will be particle shape and particle size distributionsince both of these will impact their compaction characteristics, porosity, and permeability and strength andfreeze–thaw durability. Particle size, particle shape, and moisture content will impact fugitive dust generation andcontrol. FBC fly ash may not be well suited for this application unless it is modified by mixing with F-fly ash, and/orsome amount of water. On the other hand, POZOTEC material (a combination of poor quality F-fly ash and wetscrubber sludge with 1-2% lime) may be best suited for this application, because of a combination of prismatic shapeand spherical shape particles and appropriate water content to control dust and to achieve optimum moisture-density relationships. A ponded mixture of low quality F-fly ash and bottom ash also may be suitable for the abovementioned reasons. Such a mixture has found widespread use in housing construction around the Springfield,Illinois area. Such mixture materials are generally environmentally benign because most of the leaching has alreadyoccurred.
Cementitious/Pozzolanic Properties
This represents the largest use of CCBs and involves their most important property (pozzolonic and/or cementitous). ASTM C-618 test requirements for physical, chemical, and engineering properties adequately serve to determine if aCCB can be effectively used. The use of C-Fly ash is generally limited by the amount of LOI. Supplementaryoptional requirements for physical and chemical properties may be imposed depending upon the application. Flexiblepavement design recommends similar requirements for CCBs except for LOI, which is 10% for F-fly ash and 6% for C-fly ash. The requirements for CCBs to be used in waste stabilization could be even less stringent. Pozzolonic activityindex is a good measure of success in using the cementitious and pozzolonic properties. Sulfate resistance could bea very important variable for using FBC fly ash. Flow properties are important in using a fly ash for controlled lowstrength material (CLSM).
Hydration characteristics of a CCB are influenced by the form in which the calcium compounds exist. In soil/wastestabilization applications, where good cementation is essential, hydration chemistry could be very critical. Where flyash is used as a drying agent or to reduce shrink–swell potential of clay soils, hydration characteristics may not bevery important. Therefore, CCBs performance for each application should be studied.
In development of low and medium value and high fly ash volume lightweight structural materials, ability to foamCCBs is extremely critical. “Foam Index Test” has been used to some extent by the cement–concrete industries. Chugh (1998) developed and used a test similar to pozzolonic activity index test. In this test, 100 grams ofCCBs–binder (Ordinary Portland Cement, Type I) mix is tested for increase in bulk density with increasing watercontent until an equilibrium value is achieved (Figure 8). Then, in a separate similar test, increasing amount of foamor foaming chemical may be added around point “A” in the figure to document decrease in bulk density and thelowest achievable density (Figure 9). Using this approach, the minimum amount of water/powder ratio, the point atwhich foam must be added, foamability, and minimum achievable density can be determined. This has helpedtremendously to achieve maximum strength with least amount of foam in our research on development of lightweightmaterials for use in mines.
It is important to note that addition of CCBs will change compaction characteristics and, therefore, themoisture–density relationship. A delay in compaction may have a detrimental effect on the strength achievable withstabilized soil (Ferguson, 1993). This is clearly shown in Figure 10.

32
C-Fly ash and other self–cementing ashes may be used as a soil-drying agent to perform compaction. Moisturecontent can be easily reduced 10 to 20%. Similarly, fly ashes may also be used, instead of lime stabilization, to reduceswelling potential of clay soils. Fly ashes have also been successfully used for soil stabilization to increase shearstrength.
Chemical and Neutralization Properties
Amendment of acidic soils and control of acid mine drainage from coarse coal refuse and fine coal refuse areexamples of beneficial use applications using chemical and neutralization properties. Acid–base neutralizationpotential, paste pH, particle size distribution, and alkalinity rate release are some of the properties of interest. Somefly ashes demonstrate initially acidic pH which slowly changes to alkaline pH. FBC fly ash and FBC spent-bedmaterial are good candidates for these applications because of high CaO content. Several mines in the Midwest areusing poor quality C-fly ash to achieve the same goal.
Chugh (1998) demonstrated a novel application to effectively manage fine coal processing waste (FCPW) inconjunction with CCBs with financial support from the Office of Coal Development and Marketing of the State ofIllinois, and National Energy Technology Laboratory of the U.S. Department of Energy. Currently, two of the paperauthors (Chugh and Raju) are involved in extending the concept to develop direct vegetation concepts on FCPW aswell as fly ash ponds. Paste pH, acid–base neutralization potential (CCE), CaO content, sulfate content, and particlesize distribution properties have been used to achieve success.
Abrasive Applications
These represent low value applications. Particle size and shape and its strength and toughness are the primaryphysical properties of interest.
Mineralogical Properties
Recovery of magnetite from fly ash, use of fly ash in aluminum alloys, addition of fly ash as a raw material in cementmanufacture, development of pozzolon and quick setting cements utilize mineralogical properties.
Soil Enhancement Applications
Addition of CCBs can benefit the soil as well as its vegetation characteristics by modifying its physical and chemicalcharacteristics. Particle size and shape, alkalinity, and availability of several micronutrients in CCBs (except nitrogenand phosphorous) have been used to amend soil texture for increased water infiltration and acidity, and to supplysome of the nutrient needs of the agricultural soil. FBC by-products, C-Fly ash, and FGD oxidized wet scrubbersludge are the primary CCBs used for this purpose. Most of the wet scrubber sludge around Springfield, Illinois isused in this manner. Korcak (1996) has identified Ca:Mg ratio, reduction in potassium (K) due to high calcium CCBsaddition, reduction in availability of phosphorous (P) to plants, and high soluble salts as the major problems in usingCCBs for soil enhancement and mine reclamation. Addition of organic matter to high calcium CCBs can helpovercome some of the problems. For these applications, physical and engineering properties are not as critical as thechemical and micronutrient properties. The sulfite-rich scrubber sludge is generally much more difficult to managethan is sulfate-rich sludge. The use of CCBs can also increase infiltration rates, efficient use of water, and depth ofroots. Korcak 1998), Dick et al (1999), and Dick et al (2000) have provided a more detailed discussion of beneficialuses of CCBs and FGD by-products/for agriculture.
Concluding Remarks
Coal combustion by-products (including flue gas desulfurization by-products) are complex, non-homogeneousmaterials with significant variability from plant to plant. The materials have potential for beneficial use in a variety ofapplications including construction materials, mine land reclamation, soil amendment, structural fills, and extractionof valuable trace elements. The use of physical and engineering properties must be evaluated for each project bothbecause of high variability in properties, and because currently established tests may not be representative of thefield performance. Tremendous opportunities exist to develop meaningful beneficial use applications for

33
CCBs—using their appropriate physical and engineering properties—with some applied research to make eachproject successful.
References
Chugh, Y.P, F. Brackebusch, and J. Carpenter, 1998, “ Management of Dry Flue Gas Desulfurization By-Products inUnderground Mines”, US DoE Project Report Volume I, pp 176
Chugh, Y.P., and D. Dutta, 1998, “Development and Demonstration of a New Approach for Waste SlurryManagement Using Natural Resources Utilization By-Products”, Final Report, Illinois Clean Coal Institute
Dick W.A., J.M. Bigham, R. Forster, F. Hitzhausen, R. Lal, R. Stehouwer, S. Traina, W. Wolfe, R. Haefner, and G.Rowe, “ land Application Uses for dry flue gas desulfurization by-products: phase 3. EPRI Report TR-112916,1999, Electric Power Research Institute, Palo Alto, California.
Dick, W.A., R.C. Stehouwer, J.M. Bigham, W.E. Wolfe, Y.L. Hao, D.C. Adriano, J.H. Beeghley, and R.J. Haefner, “Beneficial uses of FGD By-Products: examples and case studies of land application, P.505-536. 2000, In J.F.Power and W.A. Dick (Eds.), Land Application of Agricultural, Industrial, and Municipal By-Products, SoilScience Society of America, Madison, WI
Ferguson, G., 1993, “Use of self-cementing fly ashes as a soil stabilization agent”, textbook on Fly Ash for SoilImprovement, Ed. By Kevan D. Sharp, American Society of Civil Engineers, New York, NY, p115.
Gehler, J., 1991, “Recommended Practice: Coal Fly Ash in Pozzolanic Stabilization Mixtures for Flexible PavementSystem”, Flexible Pavement Manual, Published by ACAA, pp.40
Korcak, R.F, “ Agricultural Uses of Coal Combustion By-Products, p.103-1019. In R.J. Wright, P.D. Millner, and R.F.Korcak (Eds.), Agricultural Uses of Municipal, Animal and Industrial By-Products. USDA Technical InformationCenter, Springfield, VA
McCarthy G.J, O.E. Manz, D.M. Johansen, S.J. Stainwand and R.J. Stevenson, 1987, “Correlations of Chemistry andMineralogy of Western U.S. Fly Ash”, Materials Research Society Symposium Proceedings, Vol. 86, pp. 109-112.
Saylak, D., G. Sorensen, and A. Gadalla, July 1994,”Use of FGD Gypsum and Bottom Ash in Roadway and BuildingConstruction”, EPRI Report, EPRI TR- 103856.
Stevenson R.J. and T.P. Huber, 1987, “SEM Study of Chemical Variation in Western U.S. Fly Ash”, MaterialsResearch Society Symposium Proceedings, Vol. 86, pp. 99-108.
Tishmack, Jody K.’ Bulk Chemical and Mineral Characteristics of Coal Combustion By-Products (CCB)’, Proceedingsof the Coal Combustion By-Products Associated with Coal Mining–Interactive Forum, SIUC at CarbondaleOctober 29-31, 1996, ed. by Yoginder P.Chugh, Brandi M. Sangunett and Kimery C. Vories.

34
Figure 1: SEM microstructure of F Type -Fly Ash
0
10
20
30
40
50
60
70
80
90
100
0.0010.010.11101001000
Particle Size (mm)
Per
cest
Pas
sing
(%)
FBC Spent BedPCC Fly AshScrubber SludgeFBC Fly Ash
Figure 2. SEM microstructure of C-type fly ash (Ref: Stevenson et al., 1987)
Figure 3. Particle size distribution of CCBs

35
Figure 4: SEM micrograph showing irregular shape of particles in FBC fly ash
Larg
e V
ol
Che
mic
al
Min
erol
ogic
al
Fly
Ash
Bot
tom
Ash
Boi
ler
Sla
gF
GD
Mat
eria
l 02468101214
Uti
lizat
ion
(m to
n)
Figure 7. Usage of Dry and Moist CCBs based on Different Application
Figure 5. SEM of sulfite rich FGD by-products (Ref: Saylak et al., 1994)
Figure 6. SEM of Sulfate rich FGD by-products (Ref: Saylak et al., 1994)
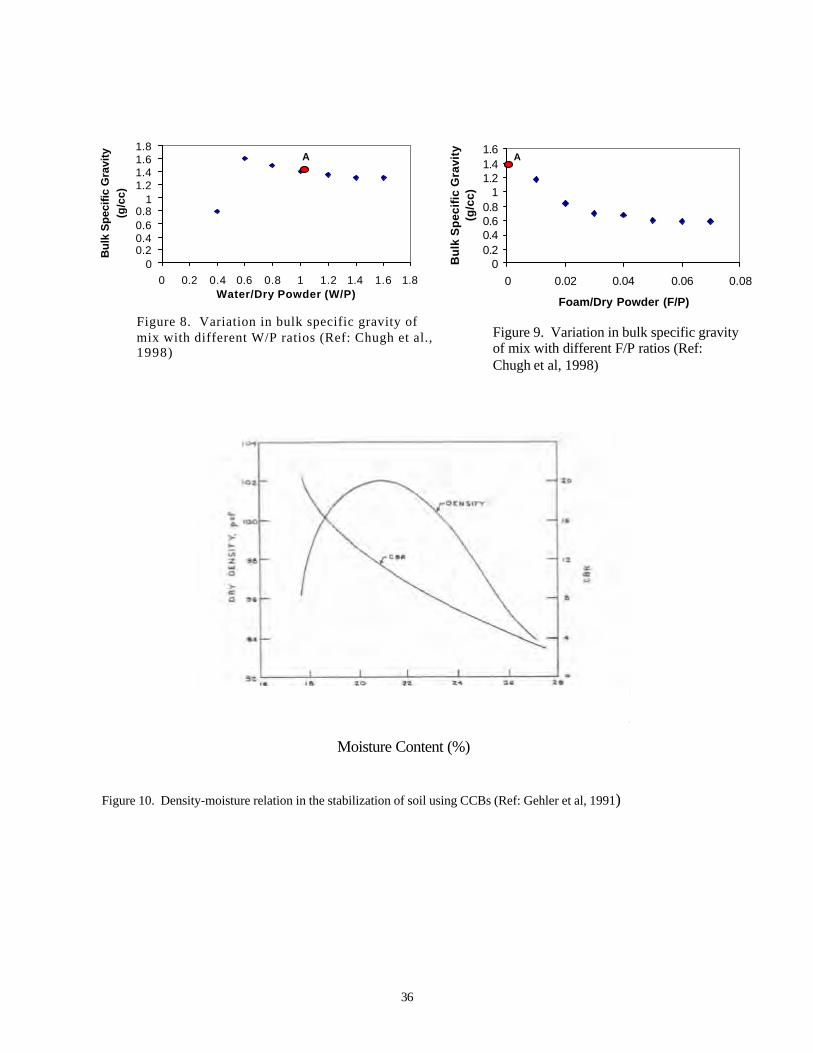
36
Figure 8. Variation in bulk specific gravity of mix with different W/P ratios (Ref: Chugh et al., 1998)
00.20.40.60.8
11.21.41.61.8
0 0.2 0.4 0.6 0.8 1 1.2 1.4 1.6 1.8Water/Dry Powder (W/P)
Bul
k S
peci
fic G
ravi
ty
(g/c
c)
A
00.20.40.60.8
11.21.41.6
0 0.02 0.04 0.06 0.08
Foam/Dry Powder (F/P)
Bu
lk S
pec
ific
Gra
vity
(g
/cc)
A
Figure 9. Variation in bulk specific gravity of mix with different F/P ratios (Ref: Chugh et al, 1998)
Figure 10: Density-moisture relation in the stabilization of
soil using CCBs (Ref: Gehler et al, 1991)
Moisture Content (%)
Moisture Content (%)
Figure 10. Density-moisture relation in the stabilization of soil using CCBs (Ref: Gehler et al, 1991)

37
______________________________1Paul Chugh has BS, MS, and Ph.D. degrees in Mining Engineering; the latter two are from The Pennsylvania StateUniversity. Chugh has been at Southern Illinois University for the past 23 years. For the past nine years, he has beenactively engaged in research, development, and demonstration studies related to coal combustion by-products. He hascommercialized three CCBs-based lightweight structural materials for use in mining industries. Currently, he isdeveloping utility poles from CCBs and hopes to commercialize them in the near future. He is currently Director,Combustion By-Products Recycling Consortium-Midwestern Region.

38
ENVIRONMENTAL PERFORMANCE AND REGULATORY STATUSOF COAL COMBUSTION BY-PRODUCTS
D.J. Hassett1 and D.F. Pflughoeft-HassettEnergy and Environmental Research Center
University of North DakotaGrand Forks, North Dakota
Introduction
The environmental performance of coal combustion by-products (CCBs) is, because of the nature of environmentalscience, both well documented and highly controversial. On the basis of scientific evidence, CCBs have beenclassified in a spectrum of potential for harm that ranges from “toxic-forming” to environmentally benign, and thesetwo descriptions may be referring to a single material because of differences in interpretation of data. It is likely thatCCBs can be found worldwide that fit well into either category, with the norm somewhere between the two extremes.It is the opinion of the authors that in truth, the potential for environmental impact for most CCBs is much closer toand often well within the environmentally benign classification. It would be expected that the polarization ofpositions regarding the environmental performance of CCBs has had an effect on the regulatory process. Thisappears to be the case.
Environmental Performance
There are two basic approaches to determining the environmental performance of disposed or utilized CCBs. One isto monitor an actual disposal site or utilization project; the other is to predict environmental performance through theuse of laboratory studies, usually involving leaching tests. The best approach is field monitoring of actual sites;however, this is not always possible, especially in the case where environmental performance projections are to bedetermined in advance of actual disposal or use of CCBs. Volumes have been published regarding the use oflaboratory leaching for the prediction of environmental impacts of CCBs. An excellent summary of leaching methodshas been published that presents more than 50 different leaching tests (Sorini, 1997). As would be expected, some ofthe tests are suitable for use with CCBs, some are clearly not suitable, and many could be debated. The authorsgenerally use a test developed at the University of North Dakota (UND) Energy & Environmental Research Center(EERC) called the synthetic groundwater leaching procedure (SGLP) (Hassett, 1987). This test was developed over anumber of years prior to being published in order to facilitate ongoing ash research at the EERC.
The development of the SGLP was an evolutionary process that progressed as our ash research group gained a morefundamental understanding of the hydration of alkaline CCBs. We observed unusual leaching trends in alkalineCCBs that could lead to reductions in leachate concentrations of select trace elements. It became evident that manypublished leaching methods were unsuitable for use in the characterization of CCBs because they either utilized tooshort an equilibration time, thus not taking the effect of hydration reactions into account, or because they utilizedleaching solutions that imposed artificial conditions on the ash–water system that would never be encounteredunder field conditions (Stevenson and others, 1988; Hassett and others, 1991; Hassett, 1994). The preferential use ofSGLP by the ash research group at the UND EERC is not to be taken to suggest that there are not other suitable,published leaching methods for prediction of potential for environmental impact of CCBs. Many such tests exist. Wesimply continue to utilize and develop the SGLP as a part of our ongoing ash research program. There are, however,many leaching tests that are inappropriate for use with CCBs and many examples of the misuse or inappropriate useof leaching tests with CCBs for prediction of potential environmental impacts. It is beyond the scope of thismanuscript to discuss the scientifically valid and invalid application of laboratory tests. It may be sufficient to saythat in laboratory experiments to predict potential environmental impact, as in other disciplines, “garbage in, garbageout.” The use of laboratory protocols to predict field phenomena must be carefully considered with a thoroughunderstanding of the chemistry of the material being studied, field conditions at the site, and a realization of thelimitations of laboratory studies to replicate field conditions.
39
Regulatory decisions have historically been made primarily by a regulatory body that performed research to supportits own regulations, of which activity the objectivity has been sharply, and probably rightly, questioned. Theprimary objective of regulation is to protect the public interest, and many regulations have been developed toaddress, directly and indirectly, issues of safety and health. Regulatory objectives can usually be accomplished byseveral routes, but varying degrees of risk may be inherent within these options. The ideal regulation might be onethat carries zero safety or health risk to the public; however, zero risk situations are not conducive to progress andare likely not even possible. It is the job of responsible scientists to provide unbiased information so risk can bereasonably assessed and, further, it is essential that scientists present their scientific results and evidence in afashion understandable to regulators and the public sector. Both the regulators and scientists bear a heavy burdenin the accomplishment of these objectives. The success of their interactions can only be measured by thereasonableness of the resulting regulations. Of course, the success rating will vary, depending on who is making thejudgement.
CCBs can be held to numerous standards, especially in evaluating results of laboratory leaching. The expectationthat leachate generated in a laboratory or collected at a field site meets primary drinking standards is, in the authors’opinion, rather extreme. Primary drinking water standards were developed to assist in evaluating if a water source issafe for human consumption. Leachate standards, however, have been developed with the expectation that leachategenerated in disposed material with no interaction with the environment outside the disposal site will undergochanges through interactions with local sediments and through natural attenuation processes, including dilution,dispersion, and chemical attenuation. The argument is then often made, What if someone were to sink a well in anarea of ash disposal? The obvious answer is simply that testing of the source water will tell if it is safe forconsumption, irrigation, or other intended uses. It is important to realize that there are many natural sources of wateras well as sources impacted by human activity that do not meet primary drinking water criteria, thus the need forwater treatment plants in most cities. Most of the water on the earth (ocean water) is not potable. Additionally, traceelement toxicity for most elements is a function of concentration, not identity; thus the simple presence of seleniumor boron does not automatically indicate toxicity.
Public and private sector response to imposed regulations often leaves much to be desired and frequently addsanother dimension to the interactions between regulators and scientists. The interpretation of regulations can lead todisagreements between regulators, scientists, and the public and private sectors. The difference between the spirit ofthe law and the letter is often the basis for the disagreements in interpretation, but it is important to note thatdevelopment of regulation to cover all situations is not possible, because there are always exceptions. This of courseadds to the burden of regulators and scientists. The existence of exceptions also makes it important that the publicand private sectors maintain vigilance over regulations. The way to develop responsible and realistic regulations isfor all concerned to become involved and begin working together. Working together successfully requires that alevel of trust be developed that requires commitment and time as well as open and honest interaction.
Regulatory Status
The regulatory status of coal ash is well summarized in “Barriers to the Increased Utilization of CoalCombustion/Desulfurization By-Products by Government and Commercial Sectors” (Pflughoeft-Hassett, 1999).
The 1976 Resource Conservation and Recovery Act (RCRA) and the 1980 Solid Waste Disposal Act Amendmentsprovide for comprehensive cradle-to-grave regulation of solid waste generation, collection, transportation,separation, recovery, and disposal (Jagiella, 1993; Findley and Farber, 1992; Butler & Binion, 1993). Subtitle C ofRCRA and its implementing regulations impose specific federal requirements on materials deemed to be “hazardous,”either because of being listed by the U.S. Environmental Protection Agency (EPA) as hazardous or by reason ofhaving hazardous or toxic characteristics. Subtitle D of RCRA delegates regulation of nonhazardous solid wastes tothe individual states. In its original form, RCRA did not specify whether coal ash fell under Subtitle C or D. The 1980amendments temporarily excluded CCBs from Subtitle C regulation pending an EPA study report addressingappropriate classification. In the interim, CCBs were subject to regulation under state laws pertaining to solid wastes.
On August 2, 1993, EPA presented its final regulatory decision on fly ash, bottom ash, boiler slag, and flue gasemission control waste, stating that effective September 2, 1993, these materials are not regulated as hazardouswastes under Subtitle C and officially placing them under Subtitle D as solid wastes under the jurisdiction of

40
individual states (EPA, 1993). EPA will further evaluate the hazardous or toxic properties of industrial solid wastes,but at this time, CCBs are expected to remain under state regulation, where little positive change is expectedregarding beneficial use.
Federal Action on CCB Utilization
In January 1983, EPA issued federal procurement guidelines on cement and concrete containing fly ash. In Octoberof that year, Executive Order 12873 on Federal Acquisition, Recycling, and Waste Prevention required EPA to issueguidance for preference and purchase of environmentally preferable products. In July 1994, DOE submitted a reportto Congress, “Barriers to the Increased Utilization of Coal Combustion/Desulfurization By-Products by theGovernment and Commercial Sector.” In this document, DOE charged itself to:
C Consider CCBs under Executive Order 12873.C Contribute data on RCRA performance of clean coal technology CCBs.C Work with State and local governments to identify concerns regarding CCB use.C Transfer technology targeting environmental/health-sensitive CCB markets.C Cooperate with the States to review/revise/develop specifications and regulations relating to CCB use.C Demonstrate high-volume CCB utilization.C Explore ways to make CCBs easier to use or dispose of.
State Governments and CCBs
State departments of transportation (DOTs) are high-volume users of CCBs and have the potential to use more.DOTs rely on consensus standards for guidance and generally accept the use of fly ash in concrete. They canprovide good opportunities for CCB demonstration projects.
State environmental health offices most frequently regulate CCB utilization on a case-by-case basis or under genericrecycling laws. The State offices usually have limited resources and look to DOE or industry to provide data on newmaterials and projects. By 1996, 27 States had adopted laws, regulations, policies, and/or guidance authorizing atleast limited CCB utilization in cement/concrete products. Notable efforts have been made in Illinois, Indiana, Iowa,North Carolina, Ohio, Pennsylvania, Texas, and West Virginia.
Regulatory approaches vary from State to State. Several States, such as Florida, Georgia, and Colorado, judge allproposed by-products and uses on a case-by-case basis, which may be costly and time-consuming. Other States,such as Pennsylvania, Tennessee, and Virginia, have several preapproved uses that require only notification to theregulatory agency. Iowa has generators register their by-products for use as a soil amendment, and reregistration isrequired only if there is a process change. West Virginia preapproves the use of CCBs as mine subsidence and minefire control in a permitted coal mine. FBC by-products are regulated there the same as other CCBs and are preferredfor mining applications.
An important barrier issue originating in RCRA legislation is the indiscriminate designation of CCBs as solid wasteswhether they are recovered for use or disposed of in a landfill. In the absence of special State exemptions from solidwaste regulations for beneficial use, which exist in only a few States, the “waste” designation can trigger case-by-case approval and permitting procedures that discourage CCB use because of unreasonable cost and delay. Theremedies for this problem include both elimination of the “waste” designation and the creation of appropriateexemptions from regulation based on environmentally sound regulatory classifications for various classes of by-product use. While RCRA is the principal Federal law affecting the regulation of CCBs, a larger statutory frameworkof Federal law that is more or less integrated with State and local statutes may ultimately have to be considered. It isnot within the scope of this study to unravel this potential regulatory maze. However, other Federal statutes thatmay apply to coal ash use or disposal in particular circumstances, as well as to virgin raw materials and derivedproducts, include the Clean Water Act of 1972, the Safe Drinking Water Act of 1974, the Toxic Substances ControlAct of 1976, and the Comprehensive Environmental Response, Compensation, and Liability Act of 1980 (CERCLA,the Superfund Act). All of these statutes deal with the control of toxic substances and ultimately rely onenvironmental testing and risk assessment to establish regulatory criteria. The final answer to regulatory questionsconstituting barriers to beneficial use, therefore, lies in obtaining adequate environmental data to demonstrate

41
environmental safety, a process that is well advanced for CCBs, but requires systematic compilation and refinementto provide the basis for regulatory classification.
Summary and Conclusions
The authors have had the opportunity to work with a number of citizen groups, regulatory agencies, industrygroups, scientists, and engineers in a consulting or advisory capacity. Most of these experiences have beenextremely positive and have pinpointed a single important requirement for scientists in working in the area ofregulations: clear, factual information. In nearly all of the cases in which the authors have had a personalinvolvement, the presentation of factual information in a concise manner allowed the interested parties to make theirown informed decisions, which has generally produced satisfactory results for all involved. There have beenpositive interactions with groups in North Dakota, South Dakota, Minnesota, Wyoming, and Indiana. In all of theselocations, the application of reasonable science and discussions involving data that all parties found acceptableresulted in satisfactory resolutions to conflicts—resolutions that satisfied concerned citizens, local environmentalgroups, state regulatory agencies, coal ash producers, and coal ash users.
Coal ash is a material not likely to go away in the near future; thus proper handling, including engineering useoptions as well as disposal, must be properly conducted, even in light of the benign nature of most coal ash. Withnewer power-generating stations coming on-line or being converted for low-NOx burners, it is likely that there will besome changes in the nature of the ash produced. This, of course, opens up an entirely new line of environmental andengineering performance issues.
It is hoped that this presentation and other issues, as they arise, will stimulate discussion conducive to acooperative and trusting environment, thus allowing regulators, concerned citizens, power producers, ash marketersand users, and scientists to interact as colleagues with a common goal, that being the better interests of people andthe environment. Since the decisions involving the potential for environmental harm are so important, it is imperativethat objectivity be maintained, as well as a productive dialog among all concerned. Since that includes all of us, wehad better keep talking and furthering our understanding of how things really work! Use rather than disposal is likelyone of the best solutions to environmental problems concerning CCBs. Poor decisions where the environment isconcerned are clearly unacceptable.
References
Butler & Binion. Environmental Law Simplified: A Practical Guide for Oil and Gas Operations; Robertson, G.L.,Ed.; PennWell: Tulsa, OK, 1993; 132 p.
Findley, R.W.; Farber, D.A. Environmental Law in a Nutshell; West Publishing Co.: St. Paul, MN, 1992; 355 p.
Hassett, D.J. A Generic Test of Leachability: The Synthetic Groundwater Leaching Procedure. In Proceedings of theWaste Management for the Energy Industries Conference, University of North Dakota, April 29–May 1,1987.
Hassett, D.J.; Pflughoeft-Hassett, D.F.; McCarthy G.J. Ettringite Formation in Coal Ash as a Mechanism forStabilization of Hazardous Trace Elements. In Proceedings of the 8th Annual International PittsburghCoal Conference, Pittsburgh, PA, Oct. 14–18, 1991.
Hassett, D.J. Scientifically Valid Leaching of Coal Conversion Solid Residues to Predict Environmental Impact. InProceedings of the Trace Element Transformations in Coal-Fired systems Workshop, Scottsdale, AZ, April19–22, 1993; Special Issue of Fuel Processing Technology 1994, 39 (1–3), 445–459.
Jagiella, D.M. Coal Combustion By-Products: A Survey of Use and Disposal Provisions. In High-VolumeUses/Concrete Applications, Proceedings of the 10th International Ash Use Symposium, Orlando, FL, Jan.18–21, 1993; EPRI TR-101774, Project 3176, 1993; Vol. 1, pp 36-1 to 36–24.
Pflughoeft-Hassett, D.F.; Renninger, S. Review of Barriers t the Increased Utilization of CCBs by Government and

42
Commercial Sectors. Presented at the American Coal Ash Association 13th International Symposium on theManagement and Use of Coal Combustion Products (CCPs), Orlando, FL, Jan 10–14, 1999.
Sorini, S.S. A Summary of Leaching Methods; prepared for the American Coal Ash Association, Inc.; WesternResearch Institute: Laramie, WY, April 1997.
Stevenson, R.J.; Hassett, D.J.; McCarthy, G.J.; et al. Solid Waste Codisposal Study; final report to Gas ResearchInstitute for Contract No. 5083-253-1283; Energy & Environmental Research Center: Grand Forks, ND, Feb1988.
U.S. Environmental Protection Agency. Final Regulatory Determination on Four Large-Volume Wastes from theCombustion of Coal by Electric Utility Power Plants. Code of Federal Regulations; Part 261, Title 40;Federal Register 1993, 42466–42482 (Aug 9, 1993).
______________________________1 David J. Hassett is a Senior Research Advisor at the Energy and Environmental Research Center (EERC) of theUniversity of North Dakota. He received his B.S. in Chemistry and Mathematics from Winona State University inWinona, Minnesota, in 1966 and continued with graduate studies in Chemistry from 1970 to 1975. He has authoredor coauthored over 130 publications. Hassett's principal areas of interest and expertise include the application ofanalytical chemistry toward the solution of environmental problems associated with trace element occurrence,transport, and fate. The most recent research focus has been on trace element transformations during coalconversion processes and interaction between groundwater and coal conversion solids as related to the leachabilityof trace elements. Additional areas of expertise include hydration reactions of coal conversion solid residues as wellas organic synthesis, radiochemistry, x-ray spectrometry, analytical chemistry, and vegetable oil diesel fuels.
43
ELECTRIC POWER UTILITY’S MATERIALS FLOW IN THE UNITED STATES
Samuel S. Tyson1,3, Rustu S. Kalyoncu2
1American Coal Ash Association, Alexandria, VA;
2United States Geological Survey, Reston, VA
Abstract
Materials are essential in meeting our most fundamental needs – food and shelter—and to maintain and improve ourstandard of living. Materials processing requires significant amounts of energy. One of the most versatile and,therefore, desirable forms of energy is electricity. Electricity accounts for more than one third of the total energyconsumption in the United States, and more than half of the nations’ electricity is produced by burning coal. During1998, approximately 1 billion tons of coal were burned by electric utilities. As a result, more than 100 million tons ofcoal combustion products (CCPs) were generated. As such, CCPs rank behind only sand and gravel and crushedstone as a produced ‘mineral commodity,’ and rank ahead of Portland cement and iron ore. Understanding thesystem of materials flow, from source to ultimate disposition, can help management and use of our natural resourcesand protect the environment. This study traces the flow of CCPs from the point of coal mining through their manyapplications as viable mineral commodities. The base year for this study was taken to be 1966, the first year forwhich statistical data for CCPs are available. Analysis tools such as life cycle assessment (LCA) are now used toprovide quantitative scientific analysis of industrial systems. An LCA assessment that compared the use of coal flyash in a highway embankment with using soil showed fly ash use is superior with respect to raw materials consumedand landfill space conserved. In addition, fly ash enables greater haul distances, and produces equal or lower airemissions, when compared to a soil embankment. The haulback of CCPs for use in mined land reclamation isparticularly attractive from a “balance of materials” point of view. Scenarios for mine backhaul will be examined.
Introduction
ACAA’s mission is to advance the management and use of coal combustion products (CCPs) in ways that aretechnically sound, commercially competitive, and environmentally safe. ACAA has a large volume and wide varietyof information on all types of CCPs. This information is all available on its Website at www.acaa-usa.org or bycontacting ACAA directly.
Some of the annual benefits of using CCPs are:• by using 31 million tons of CCPs during 1998, 28 million cubic yards of landfill space were preserved for
future use;• assuming average landfill depths of 50 feet, the area preserved during 1998 would be about 350 acres;• $620 million of disposal costs were avoided;• revenues from the sales of CCPs are estimated to have been in excess of $150 million;• the use of 1 ton of fly ash in concrete will avoid approximately 1 ton of carbon dioxide being emitted from
cement production; and • in 1998, 10.4 million tons of fly ash were used in cement and concrete products displacing 6.9 million tons of
Portland cement, thereby avoiding 6.9 million tons of carbon dioxide emissions.
Reduction of Carbon Dioxide Emissions
Concerning the role of recycling power plant by-products into useful CCPs, the United States has developed aClimate Challenge Program to reduce the carbon dioxide emissions to below 1990 levels before 2010. The U.S.Department of Energy and the electric utilities have signed participation accords pledging to increase the use ofCCPs, particularly fly ash that would displace Portland cement in concrete products. Increasing the fraction ofmineral admixtures that utilize CCPs in all concrete products from the current level of 15 percent to 50 percent wouldeliminate up to 600 million metric tons of carbon dioxide. This would be the equivalent of removing twenty fivepercent of the carbon dioxide emissions from all of the cars in the world. This is the maximum level of replacement as
44
it would require the utilization of all of the fly ash now produced. Barriers that must be overcome in order to realizethis type of utilization would include improving transportation of these materials to potential markets, beneficiationof materials so that they have a marketable quality, and improve the acceptance of these materials to the marketplace.
Production and Use of CCPs in the United States
Statistics on the production and use of CCPs for the last 30 years show that the use of fly ash and indeed all CCPshas been steadily increasing. This use, however, has not kept pace with the increase in the production of fly ashand other CCPs (See Figures on Fly Ash and Total CCP Production and Use). Concerning the rate of use forselected applications such as concrete, structural fill, road base, waste stabilization, snow and ice control, andflowable fill, the use of fly ash in concrete has been the application that has most dramatically increased over the lasttwenty years (See Figures on Fly Ash and Bottom Ash Use in Selected Applications). We do not show miningapplications on these charts yet because they are still relatively small by comparison. Part of the reason they are notshown is that some mining applications are not yet classified as use but as disposal. Boiler slag has a very high rateof application being utilized almost completely for very high value applications such as blasting grit.
Potential for Use of CCPs as Flowable Fill
One of the areas that could be improved in terms of utilization of CCPs is as flowable fill. In support of this conceptwe have generated some statistics that show that based on the current U.S. population of 273,172,307, the entire 54million tons of fly ash and bottom ash that would be available for use in flowable fill would amount to 390 poundsper person. A well developed flowable fill market in a major metropolitan area of one million persons may supportabout 65,000 cubic yards of flowable fill. Given a normal range of ash content in flowable fill mixtures from 400 to2,000 pounds of ash per cubic yard of fill, that would represent about 26-130 pounds of ash per person per year inflowable fill usage. Since 80 percent of the U.S. population lives in metropolitan areas that results in a market ofbetween 3.5 and 18 million tons of ash as flowable fill.
______________________________3Samuel S. Tyson is the Executive Director of the American Coal Ash Association (ACAA) and President of theACAA Educational Foundation with offices in Alexandria, Virginia. He earned both undergraduate and graduatedegrees in Civil Engineering at the University of Virginia, and served for four years in the U.S. Army where he was acommissioned officer in the Corps of Engineers. He was a Research Engineer for nine years with the VirginiaTransportation Research Council where he specialized in materials for construction and maintenance of concretepavements and bridges. Sam is a registered professional engineer in the District of Columbia where he worked forfive years as technical director for a ready mixed concrete company. He has both laboratory and field experiencewith fly ash concrete mixtures for construction of commercial and residential buildings, as well as for transportationand water treatment facilities. Sam joined ACAA in 1986 as its Director of Technical Services and was appointed asExecutive Director in 1993.


Electric Power Utility’s Material Flow in the United States
Sam Tyson, ACAARustu Kalyoncu, USGS
Use of Fly Ash and Other CCPs at Coal Mines
Morgantown, WV - April 11, 2000

www.acaa-usa.org

Mission Statement
ACAA’s mission is to advance the management and use of coal combustion products (CCPs) in ways that are technically sound, commercially competitive and environmentally safe
Annual Benefits of Using CCPs
• By using 31 million tons of CCPs (1998) 28 million cubic yards of landfill space were preserved for future use

Annual Benefits of Using CCPs
• Assuming average landfill depths of 50 feet; the area preserved would be about 350 acres (1998)

Annual Benefits of Using CCPs
• The productive use of 31 million tons of CCPs avoided $620 million in disposal costs (1998)

Annual Benefits of Using CCPs
• Revenues from the sales of CCPs are estimated to have been in excess of $150 million (1998)
Climate Challenge Program
• Reduction in CO2 emissions to/below 1990 levels before 2010
• U.S. DOE and utilities have signed participation accords pledging increased use of CCPs, particularly fly ash to displace portland cement
CO2 Emission Avoidance
• Use of 1 ton of fly ash in concrete will avoid approximately 1 ton of CO2 emitted from cement production

Annual Benefits of Using CCPs
• In 1998 10.4 million tons of fly ash were used in cement and concrete products displacing 6.9 million tons of portland cement; thereby avoiding 6.9 million tons of CO2 emissions

Increasing the fraction of mineral admixtures in all concrete from 15% of cementing materials to 50% would eliminate up to 600 million metric tons of CO2 –equivalent to removing one quarter of all cars in the world. This level of replacement is the maximum possible, because it would require the utilization of all the fly ash produced. –Environmental building news-
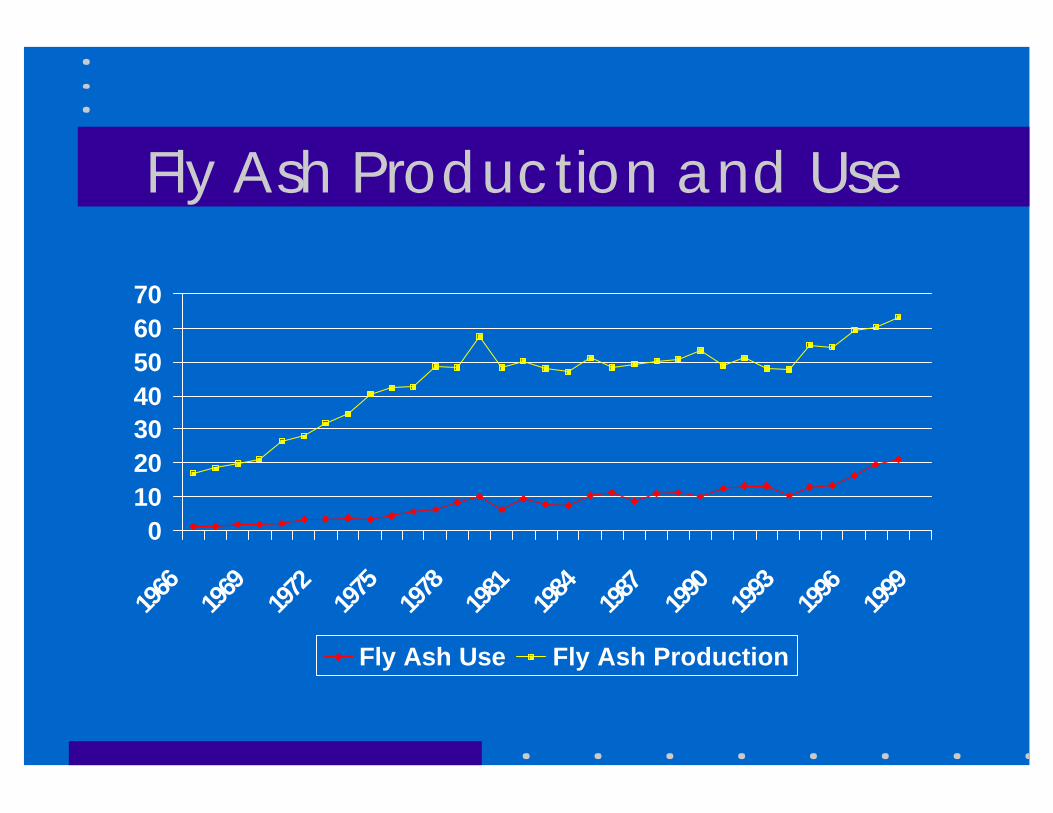
Fly Ash Production and Use
010203040506070
1966
1969
1972
1975
1978
1981
1984
1987
1990
1993
1996
1999
Fly Ash Use Fly Ash Production
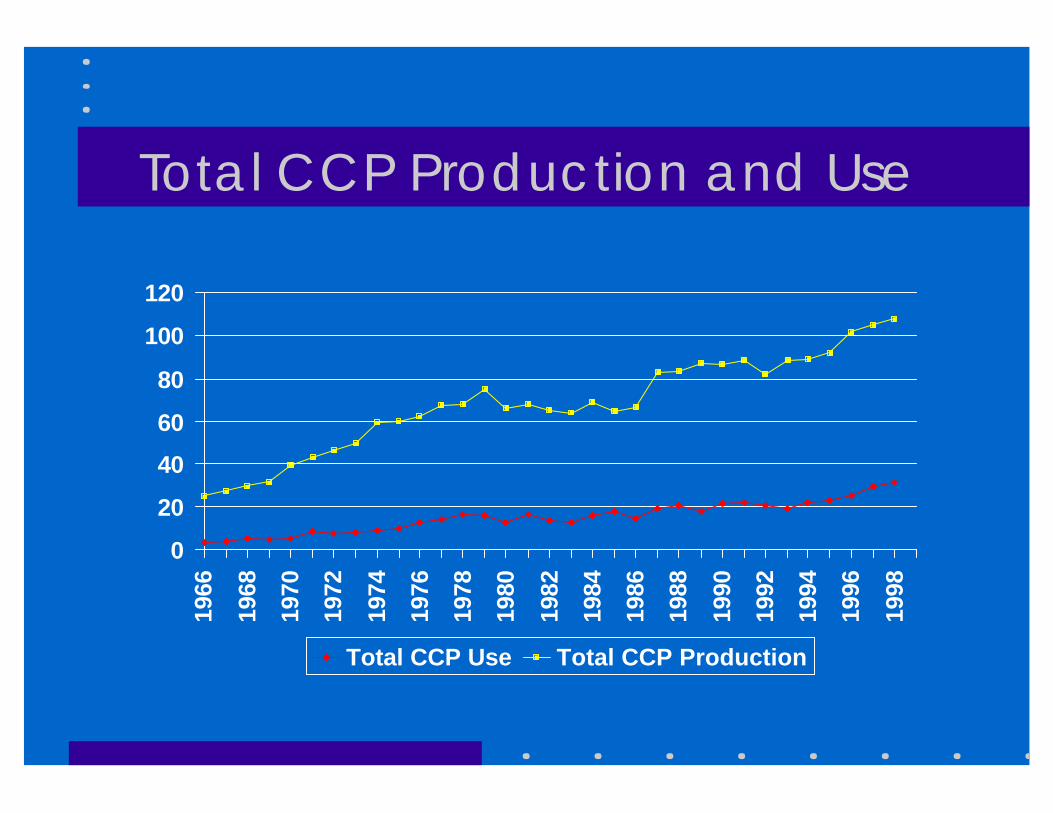
Total CCP Production and Use
0
20
40
60
80
100
120
1966
1968
1970
1972
1974
1976
1978
1980
1982
1984
1986
1988
1990
1992
1994
1996
1998
Total CCP Use Total CCP Production
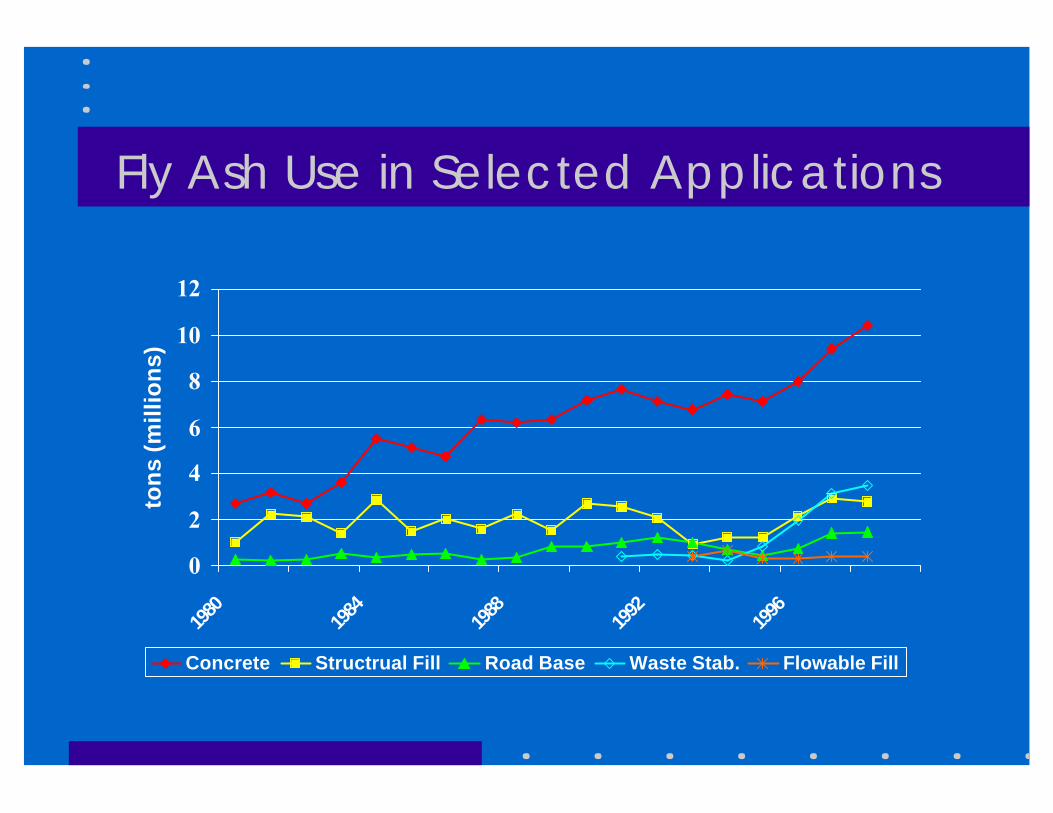
Fly Ash Use in Selected Applications
0
2
4
6
8
10
12
1980
1984
1988
1992
1996
ton
s (m
illio
ns)
Concrete Structrual Fill Road Base Waste Stab. Flowable Fill

Bottom Ash Use in Selected Applications
00.20.40.60.8
11.21.41.61.8
2
1980
1984
1988
1992
1996
ton
s (m
illio
ns)
Concrete Structrual Fill Road Base Snow/Ice Control

Region I
Region IV
Region IIRegion V
Region VI
Region III

Leading Mineral Resources in the USA
Mineral Resources Annual Production(short tons, millions)
Crushed Stone 1,350Sand & Gravel 980CCPs 109Portland Cement 90Iron Ore 65

Flowable Fill Potential Materials
• Current U.S. Population is 273,172,307
• 54 million tons of fly ash & bottom ash are available for use in flowable fill
• That’s 390 lbs per person

Flowable Fill Market Potential
• A well developed flowable fill market in a metropolitan area of one million people may support 65,000 yd3 of flowable fill
• A high ash content mix may contain up to one ton of ash per yd3, while a low ash mix might contain 400 lbs per yd3

Flowable Fill Market Potential
• That come out to between 26 - 130 lbs of ash per person per year in flowable fill usage
• 80% of the U.S. population of 273,172,307 lives in metropolitan areas
• That gives a potential market of between 3.5 and 18 million tons of coal ash
Future of Flowable Fill
• The number of future uses of flowable fill are limited only by the imagination of those using it
Future of Flowable Fill
• The use of coloring agents to code flowable fill may give it an advantage in utility cut work
• EPA Comprehensive Procurement Guideline (CPG) for flowable fill containing fly ash will lead to more fly ash being used

22 OTAG Affected States
The Cost of Compliance
• Compliance with all air regulations will cost coal fired electric utilities 22 BILLION dollars over the next 10 years
Source RDI, 1999

NOx Control Methods
• Low NOx Burners 33%• SCR 45%• SNCR 10%• Natural Gas Re-burn 3%• Fuel Switching 4.5%• Other 4.5%
Source ACAA NOx survey 1998

1998 ACAA NOx Survey
• 60% of the units reporting will require additional NOx control*
• About half (52%) of these additional control measures will involve ammonia
*RDI estimates 207,000 MW of the 303,000 MW (68%) U.S. coal-fired generating capacity will be affected by this ruling

1998 ACAA NOx Survey
• The survey data indicates that 2.7 million tons of fly ash may be rendered unusable for pozzolan markets
• An additional 1.4 million tons will become unusable for their present uses
• In total, over 4 million tons of fly ash that is presently used will require disposal
Learn More
• ACAA Workshop: Y2K Compliant Fly Ash at ACAA’s Annual Meeting, Workshop & Committee Meetings– Shelter Pointe Hotel & Marina - San Diego, CA – January 25, 2000
• Educational Program for the Managers of CCPs– NRCCE - WVU - Morgantown, West Virginia– June 5-9, 2000
• 14th International Symposium on the Management and Use of CCPs– Hilton Palacio del Rio - San Antonio, Texas– January 22 - 26, 2001

American Coal Ash Association6940 South Kings Highway, Suite 207
Alexandria, Virginia 22310-3344Internet: www.acaa-usa.org
E-mail: [email protected]: 703-317-2400
Fax: 703-317-2409

Session 2
Regulatory Perspectives
Session Chairperson:Daniel Wheeler
Illinois Office of Mines and MineralsSpringfield, Illinois
U.S. Environmental Protection Agency (EPA)/Fossil Fuel Combustion: AHazardous Waste DeterminationAndrew Wittner, U.S. Environmental Protection Agency, Washington, D.C.
The Evolution and Development of Indiana’s Program to Regulate theDisposal of Coal Combustion Materials at Surface Coal MinesPaul Ehret, Indiana Department of Natural Resources, Bureau of Mine Reclamation,Indianapolis, Indiana
Utility Industry Perspective on Mine Placement of Coal CombustionProductsSteven J. Groseclose, Piper, Marbury, Rudnick, and Wolfe LLP, Washington, D.C.
A Citizen Regulatory Perspective on Disposal of Coal Combustion Wastesat the Mine SiteJeff Stant, Hoosier Environmental Council speaking for Tom FitzGerald, KentuckyResources Council, Inc., Frankfort, Kentucky
The Office of Surface Mining’s Perspective on Coal Combustion WasteDisposal on Native American Lands Rick Holbrook, Office of Surface Mining, Denver, Colorado
A Comparison of State Legal Approaches to CCB ReuseChristina L. Archer, Howard and Howard Attorneys, Peoria, Illinois
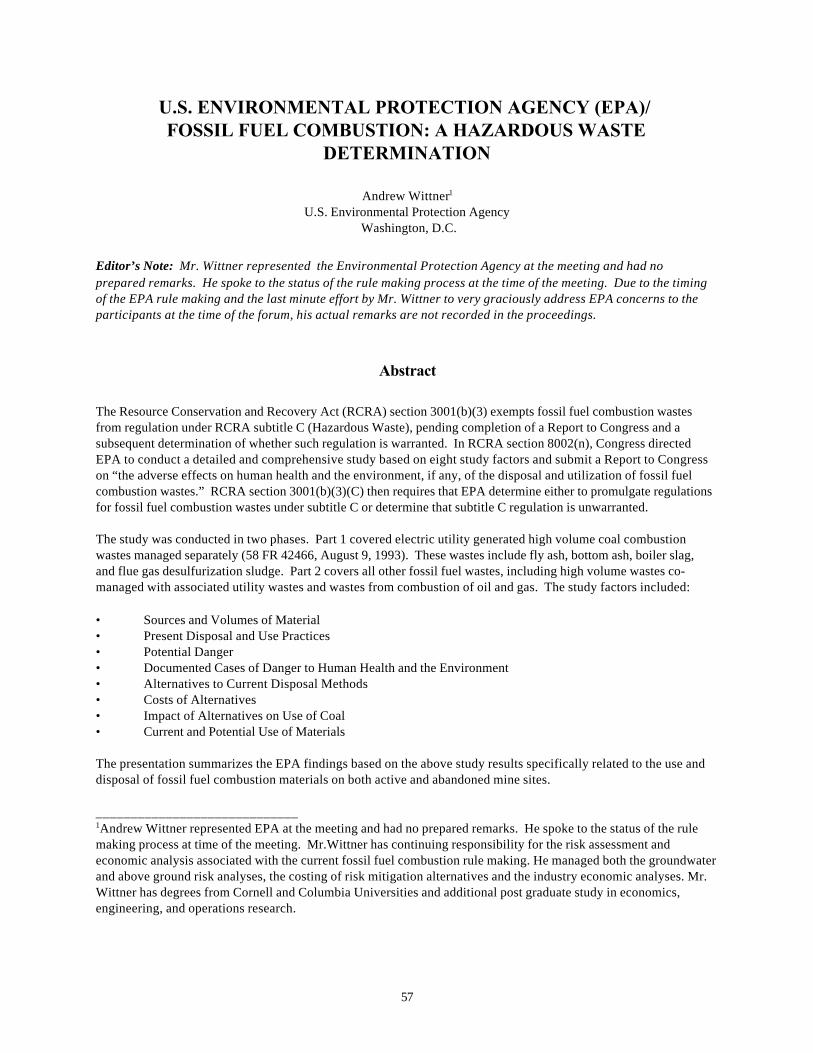
57
U.S. ENVIRONMENTAL PROTECTION AGENCY (EPA)/ FOSSIL FUEL COMBUSTION: A HAZARDOUS WASTE
DETERMINATION
Andrew Wittner1
U.S. Environmental Protection Agency Washington, D.C.
Editor’s Note: Mr. Wittner represented the Environmental Protection Agency at the meeting and had noprepared remarks. He spoke to the status of the rule making process at the time of the meeting. Due to the timingof the EPA rule making and the last minute effort by Mr. Wittner to very graciously address EPA concerns to theparticipants at the time of the forum, his actual remarks are not recorded in the proceedings.
Abstract
The Resource Conservation and Recovery Act (RCRA) section 3001(b)(3) exempts fossil fuel combustion wastesfrom regulation under RCRA subtitle C (Hazardous Waste), pending completion of a Report to Congress and asubsequent determination of whether such regulation is warranted. In RCRA section 8002(n), Congress directedEPA to conduct a detailed and comprehensive study based on eight study factors and submit a Report to Congresson “the adverse effects on human health and the environment, if any, of the disposal and utilization of fossil fuelcombustion wastes.” RCRA section 3001(b)(3)(C) then requires that EPA determine either to promulgate regulationsfor fossil fuel combustion wastes under subtitle C or determine that subtitle C regulation is unwarranted.
The study was conducted in two phases. Part 1 covered electric utility generated high volume coal combustionwastes managed separately (58 FR 42466, August 9, 1993). These wastes include fly ash, bottom ash, boiler slag,and flue gas desulfurization sludge. Part 2 covers all other fossil fuel wastes, including high volume wastes co-managed with associated utility wastes and wastes from combustion of oil and gas. The study factors included:
• Sources and Volumes of Material• Present Disposal and Use Practices• Potential Danger• Documented Cases of Danger to Human Health and the Environment• Alternatives to Current Disposal Methods• Costs of Alternatives• Impact of Alternatives on Use of Coal• Current and Potential Use of Materials
The presentation summarizes the EPA findings based on the above study results specifically related to the use anddisposal of fossil fuel combustion materials on both active and abandoned mine sites.
_____________________________1Andrew Wittner represented EPA at the meeting and had no prepared remarks. He spoke to the status of the rulemaking process at time of the meeting. Mr.Wittner has continuing responsibility for the risk assessment andeconomic analysis associated with the current fossil fuel combustion rule making. He managed both the groundwaterand above ground risk analyses, the costing of risk mitigation alternatives and the industry economic analyses. Mr.Wittner has degrees from Cornell and Columbia Universities and additional post graduate study in economics,engineering, and operations research.

59
THE EVOLUTION AND DEVELOPMENT OF INDIANA’S PROGRAMTO REGULATE THE DISPOSAL OF COAL COMBUSTION
MATERIALS AT SURFACE COAL MINES
Paul J. Ehret1
Deputy DirectorIndiana Department of Natural Resources
Indianapolis, Indiana
Abstract
The State of Indiana is the second largest producer of coal combustion materials (CCM) in the nation. Producing anestimated 6 to 7 million of CCMs annually, viable alternatives as to how best to deal with this material has been anissue of significant concern. With the passage of Public Law 103 in 1988, Indiana embarked upon the path ofproviding an alternate mechanism for the disposal of CCM. The legislature envisioned that disposal at surface coalmines presented a cost effective and environmentally protective alternative to the existing solid waste landfillapproach to disposal and storage. However, since the law’s passage, there has been little, if any, agreement orpeace concerning the CCM disposal debate between the primary stakeholders. Since the law’s passage more thenten years ago, only a very limited tonnage of CCMs produced in the State has actually been placed at mines. Despite this fact, litigation has been extensive. At the time of this writing, the Indiana Department of NaturalResources (IDNR) is attempting to finalize specific regulations for the disposal of CCMs at surface coal mines. Theyears spent getting to this point have been long and litigious. It is questionable whether the establishment of finalrules will at long last put an end to the litigation. Probably, the new rules, when finalized, will themselves be thesubject of their own litigation. This paper will discuss the evolution of this issue as it developed in Indiana. Fromwhat we know and what we have learned in the State of Indiana, others may find our experience beneficial.
Background
The State of Indiana, after Texas, is the largest producer of coal combustion materials (CCM) in the nation. Thequantity of CCMs produced is directly related to the fact that 98 percent of all the State’s electrical generation comesfrom the burning of coal. Indiana’s dependance on coal fired utilities for electrical production is the highest in thenation. In an attempt to level the playing field for Indiana coal operators in competition with low sulphur Westerncoals caused by expanding clean air limitations, the Indiana General Assembly intervened to provide legislativerelief. Indiana utilities were seeking a cost-effective alternative to current methods of CCM disposal and storage justas expanded use of clean coal technologies was causing a corresponding increase in the quantity of CCMsproduced. With CCM production in the State estimated at six to seven million tons annually, the question of howbest to manage this issue has been no small task. More recently, it has become the subject of a considerable publicpolicy debate within the State.
In 1988, in response to a 1987 recommendation from the Governor appointed Indiana Coal Commission, the IndianaGeneral Assembly passed Public Law 103. An uncomplicated piece of legislation, the new law simply exempted CCMdisposal from solid waste regulations administrated by the Indiana Department of Environmental Management(IDEM) when disposal occurred at surface coal mines regulated by the Indiana Department of Natural Resources(IDNR) under the Surface Mining Control and Reclamation Act (SMCRA). The underlying rationale behind theswitch in authority to regulate CCMs was that, for a material that with few exceptions is nonhazardous, existing solidwaste requirements associated with normal landfill regulations were viewed to be excessive. The view was thatdisposal of CCMs in the volumes being generated was an unwise use of otherwise precious landfill space. Supporters also advanced additional arguments that massive storage cells and holding impoundments located nearthe power plants was not necessarily the best location for placement of these materials. Moreover, neither was it

60
considered a wise use of land, as the expansion of these holding cells continued to take up ever increasing amountsof otherwise productive land. In Indiana, characteristically most power plants are found in floodplain areasimmediately adjacent to rivers and lakes. These alluvial areas can often be highly favorable hydrologicalenvironments to the conductance of pollutants through the groundwater. To some, disposing of CCMs seemedlogical. In a hydrologic environment already disturbed by surface coal mining, the groundwater was typically highlymineralized. There also seemed to be a sort of symbiotic logic in returning these burned coal residues to their placeof origin. As we have learned, this choice was not so logical or wise to others.
With the passage of Public Law 103-88 IDNR in the late 1980s and early 1990s, Indiana made several attempts atadministrative rule making. None of these attempts met with any measure of success. The Natural ResourcesCommission (NRC), which serves as IDNR’s policy making body overseeing the agency’s programs, held hearingson proposed CCM disposal regulation. Unfortunately, the hearings were highly contentious. Representatives fromboth the coal industry and the electrical utilities claimed that the early draft versions of the rules proposed by IDNRwere far too stringent. Opponents to CCM disposal at surface coal mines claimed them to be not strict enough. Areview of several of these early drafts revealed that they were based largely on the State’s existing solid wastedisposal regulations administered by IDEM. Proponents of CCM disposal at surface coal mines argued that theintention of the law was not simply to replicate the existing solid waste rules and have it administered by anotheragency, but to develop a new disposal approach. It was argued that CCM disposal at mines could make maximumutility of the unique environmental setting created by the activity of surface coal mining. Moreover, it was felt that,due to the mining regulatory agency’s full understanding of the surface mining environment, they would be betterprepared to deal with CCM disposal at mines than a solid waste regulatory agency.
To resolve the issue, an attempt was made to get the various multi-interest stakeholders together to agree on anapproach to regulate CCM disposal. As a result, a group was created among the stakeholders that agreed to havethe University of North Dakota (UND) conduct a study to characterize Indiana CCMs. The group also agreed onhow to conduct the study and what parameters to examine. The UND report was to serve as basis for determiningwhat level of risk CCM presented to the environment. It was hoped that corresponding regulations could bedeveloped commensurate to the degree of risk.
Unfortunately, the completion of the UND report itself was contentious. To a varying extent, each party used thestudy to declare that its case, for or against disposal at coal mines, had been proven. With the breakdown of furtherprogress toward a solution, IDNR acted unilaterally to get the program moving. Using the UND study as support forthe initiative, IDNR approached the NRC with a suggested solution that would avoid the need for drafting specificCCM disposal regulations. It was IDNR’s position that current SMCRA rules regulating surface mines were bythemselves adequate to accommodate CCM disposal and protect the environment. To that end, IDNR drafted“Memorandum 92-1" as a policy guidance document instructing applicants for CCM disposal what they must do tosecure permit approval and comply with existing SMCRA law and regulations. After more than four years since thepassage of Public Law 103-88 authorizing CCM disposal at surface mines with no end in sight to the debate, the NRCapproved IDNR’s Memo 92-1 as Indiana’s CCM disposal program.
Indiana Program Requirements
Among other requirements, the highlights of Memo 92-1 include: 1) a characterization of the disposal siteshydrogeologic setting (pre- and post-mining and disposal); 2) a qualitative and quantitative analysis of the effects ofCCM placement within that setting; and 3) waste characterization determined through bulk, 18-hour, and 30-dayneutral leachate analysis in compliance with ASTM (D3987-85) standards. CCMs are analyzed for 22 differentconstituents, including all eight RCRA metals, plus pH, potential acidity, neutralization potential, and netneutralization potential. Memo 92-1 also carries with it the proviso that any CCM leachate result that exceeded 25percent of the limit for any RCRA element would be rejected for disposal. All sources of CCM proposed for disposalwill be subject to these tests and the requirement to representatively sample and analyze each active waste streamquarterly.
Other factors considered in IDNR’s review included: 1) proximity to public and private water supplies; 2) maximumpossible concentrations of constituents; 3) site characteristics such as type and extent of aquifers; 4) spoil

61
characteristics; 5) expected influences of attenuation, dispersion, and dilution; 6) direction of groundwater flow; 7)volume proposed for disposal; and 8) baseline water quality and quantity data. Plans also are required to include: 1)provisions for handling and placement of CCM during disposal; 2) control of dust; and 3) plans for final reclamationand groundwater monitoring both during and after the completion of disposal activities through final SMCRA bondrelease.
CCM Litigation Status
Since approval by the NRC in April 1992, IDNR has received a total of 18 permit applications for CCM disposal.Under the Memo 92-1 regulatory approach, IDNR issued its first permit in May 1994. Subsequently, of the 18applications received, 14 have been approved, three applications were withdrawn and one is currently pending. Ofthe 14 approved permits, one was withdrawn after approval and eight are currently pending administrative appeals. At present, there are seven surface coal mine sites actively disposing of CCM, two of them coming online as ofJanuary 2000. One approved permit that had been actively disposing of CCMs has now officially terminateddisposal. Through the last quarter of 1999, approximately 1.9 million tons of CCM have been disposed of at Indianasurface coal mines. Approximately 70 percent of all disposal or 1.34 million tons have been placed at one site,Peabody Universal Mine as permitted for disposal by PSI-Cinergy utility corporation. Disposal activities could bestbe described as intermittent.
Of the 14 issued permits, 11 have been subject to some form of legal challenge. All legal challenges have been filedby an umbrella environmental group, the Hoosier Environmental Council (HEC). Some challenges filed by HEC haveincluded individually named adjacent landowners aligned with HEC as objecting parties. Only three permits of the11 challenged have completed the administrative appeal process. There currently are no permits pending appealedto the Indiana Circuit Courts for judicial review. None of the remaining eight issued disposal permits withadministrative appeals currently pending have been stayed from disposing. Therefore, all are legally eligible toaccept CCM for disposal subject to the eventual conclusion of the administrative appeals. Of those eight permitsonly two are actively disposing of CCM. Of the three permits that completed the administrative appeal process, the first completed the process with nochanges to the permit. Active CCM disposal is currently taking place at this mine. The second permit, however, didnot pass through the process unchanged and was subject to additional conditions imposed by the AdministrativeLaw Judge (ALJ). As conditioned, the ALJ reduced the amount of CCM disposal that IDNR had approved in thepermit by 75 percent. The initial permit approved the disposal of approximately 7.0 million tons of CCMs over thepermit term. The IDNR approved plan proposed a 1:1 ratio of tons of coal mined to tons of CCM disposed. Inlimiting CCM disposal by 75 percent, or one quarter of the coal removed, the ALJ found that this ratio representedapproximately the amount of CCM produced by the coal mined under the permit. The ALJ further ruled the 25percent figure represented approximately the same amounts of RCRA elements returned to the mine site as originallypresent in the coal.
The ALJ further conditioned the permit to require a disclosure affidavit filed in the County Recorder’s officeproviding a legal description of land parcels where CCM disposal occurred. An additional requirement also wasimposed requiring the full recharge of groundwater, as determined by monitoring wells, before the release of finalSMCRA bonds. Highly controversial, all parties appealed the ALJ’s decision to the NRC, including IDNR. Inadministrative appeals, the NRC serves as the final arbiter in permit dispute cases. As a result of the appeal, theNRC modified the ALJ’s decision by doubling the disposal limit to 50 percent of the coal mined by the permittee. This tonnage increase, however, represented a reduction of 50 percent from the original tonnage approved by IDNR. The NRC otherwise maintained all other ALJ imposed conditions on the permit.
Following the NRC’s final administrative determination, both the coal operator and the Hoosier EnvironmentalCouncil filed for judicial review. On September 13, 1999, the Daviess County Indiana Circuit Court ruled to upholdthe NRC’s decision to issue the permit, as conditioned, on all points. Of major significance, however, whileupholding NRC and essentially most of the ALJ’s decision, the Court found that many of the ALJ’s findings were“confusing.” The Court noted that while the findings of the ALJ appearing to suggest possibilities of“environmental degradation owing to CCW disposal,” “ . . . there was evidence and even other ALJ findings to the

62
contrary.” The Court also determined that the ALJ improperly considered some of the evidence and testimony uponwhich those findings were based. IDNR found the Court’s clean up of the ALJ’s contradictory findings and use ofevidence extremely helpful in providing future program guidance. The Circuit Court decision was not appealed byany of the parties. Coal combustion materials are currently being disposed at the mine.
The obvious fallout due to legal challenges filed on most of Indiana’s CCM permits has been to complicate analready complex and lengthy permitting process. Since the issuance of the first permit in May 1994, Indiana hasproduced approximately 42 million tons of CCMs. In contrast, only about 1.9 million tons or about 4.5 percent ofwhat has been produced has been placed at coal mines. While no projections have ever been done to estimate thetonnage expected to be returned to mines, the amount would undoubtedly be higher without the litigation. Despitethe litigation, however, more practical economic factors such as 1) transportation costs related to haulage distanceand handling expenses, 2) increasingly viable and profitable recycling initiatives, and 3) other disposal options,serve to inhibit CCM disposal at mines. Realistically, it is unlikely that more than two to three million tons per yearwould be placed at Indiana surface coal mines due to these economic limitations. Litigation and the controversy,deserved or otherwise, raised by the opponents of CCM disposal also has served as an effective constraint todisposal below levels otherwise anticipated.
Basis of Opposition
The arguments brought forward by the opponents of CCM disposal have been many and varied. One of theunderlying philosophies is that CCM is classified as a solid waste and is best left to the regulation of the agencyresponsible for solid waste disposal in the State (the Indiana Department of Environmental Management or IDEM). Opponents have argued that, based on the legal precept of “equal protection under the law,” it is not equal to haveCCM disposed of in a non-mining location subject to one set of rules while disposal at coal mines is subject to adifferent set. They assert that this “double standard” is less protective of citizens living in the coalfields than thoseliving near landfills.
Opponents also have made arguments that the requirements of the program itself, as expressed in Memo 92-1 as a“non-rule policy,” are not enforceable and are therefore not protective. Criticism was made that CCMs also were notbeing properly characterized. The leachate medium of distilled water, pursuant to ASTM standards, was improper. Testimony given at the administrative hearings by experts representing the opponents of CCM disposal advocatedthat TCLP was the only correct method to properly determine the degree a waste may be a danger to theenvironment. The CCM disposal opponents also wanted the list of constituents tested to include a quantification ofradio nuclides and polyaromatic hydrocarbons (PAH) as possible mutagens and carcinogens. An article written byAlex Gabbard of the U.S. Department of Energy’s Oak Ridge National Laboratory, alleging that CCMs could be usedto extract sufficient quantities of weapons grade plutonium, was touted as proof of the nuclear danger. Informationalbulletins distributed by CCM disposal opponents contained such quotations from Gabbard’s article as “significantquantities of fissionable material . . . ” and “potentially employable as weapon fuel by any organization so inclined.” At public hearings held on CCM disposal, citizens’ stated that they did not wish to live adjacent to “a weaponsgrade nuclear facility.” Others expressed fear over the potential for radioactive CCMs from “hot” Colorado coalsfinding their way into Indiana for disposal.
Opponents also have attacked the Indiana program under the allegation that its regulation of CCM disposal was farweaker in comparison to its neighboring states of Illinois, Kentucky, and Ohio. This allegation fed a corollaryallegation that, because Indiana’s program was lax, it would inundate the State with as much as 200 millions tons ofCCMs over the next five years, most coming from “out-of-State.” The argument played upon recent emotionalbattles fought within the State over the import of out-of-State garbage into Indiana landfills. This concern wasraised despite the fact Memo 92-1 strictly limits the disposal of out-of-State CCMs to materials generated from theburning of Indiana coal. Pursuant to Memo 92-1, CCM from out-of-State sources may equal an amount no morethan the tonnage of CCM generated from exported Indiana coal. As the State exports only about four million tonsannually, the return of CCMs from those same out-of-State sources would not exceed one million tons at most. These facts, however, have not been sufficient to quell the specter of out-of-State CCM for some and it continues tobe raised as a basis to criticize the agency.
63
Opponents of the Indiana disposal program frequently use the fact that program tests run on these materialsproduce a leachate that exceeds U.S. EPA’s primary drinking water standards for a variety of one or more testconstituents as proof that CCM is dangerous. Information also is distributed to the public with descriptions of howthe various constituents such as lead, mercury, arsenic, cadmium, and others can affect human health and biota. They also frequently reference U.S. EPA’s February 1988 “Report to Congress” as evidence of the pervasive natureof groundwater contamination from improper CCM disposal. Together CCM opponents have used these issues tojustify their call for strict regulation of disposal at surface coal mines and the need for synthetic liners and leachatecollection and treatment systems.
One of the observations that can be made by watching this process is that the primary entities involved notsurprisingly view the issue from very different conceptual perspectives. The paradigm for some in the Indianaenvironmental community has been developed as a result of dealing with issues like CCM from purely a “landfill”perspective. This is not surprising considering the extensive history of these individuals in working with solid wastelaws in comparison to their understanding of SMCRA and the environment found at a “typical” surface coal mine. In their view, CCM is a solid waste and as such it must be disposed of in a typical solid waste landfill. Correlatingwith this viewpoint is the opinion that waste materials must be maintained completely separate from thegroundwater. Conversely, IDNR mine regulators view the CCM issue through their SMCRA paradigm. Knowingthe post-mining groundwater environment, the nature of mine spoils, and how materials such as coal processingwastes are successfully disposed under SMCRA, the addition of CCMs has always been considered a manageableoperation by IDNR. Placing CCMs in direct contact with the groundwater did not present the agency with anyundue concern in many situations. The effects of 1) attenuation, 2) dispersion, 3) dilution, 4) chemical interaction, 5)the beneficial impacts of CCM mineralization within the surface mine groundwater environment, and 6) many ofCCMs physical characteristics did not appear to warrant the additional costs associated with total isolation. Totalisolation of a solid waste is more typically characteristic of a landfill approach. To the agency charged withadministering SMCRA, a certain logical, if not an elegant symbiotic relationship, exists between coal originating froma mine and having the CCM returned to the mine. In a differing analogy, the opponents to disposal have describedcoal as differing from CCM as does the food you eat from the wastes you produce.
Program groundwater monitoring requirements were criticized. The number of wells was considered too few tocharacterize the mine’s hydrologic environment and determine flow direction and too far removed from the disposalareas to detect any potential contamination. Again, in the paradigm of the landfill with many closely sitedmonitoring wells, no justification for anything less was acceptable. The water monitoring issue led to the criticismthat the program contained no groundwater standards, nor specific requirements or plans for remediation should thegroundwater become contaminated.
Despite the lack of specific remediation requirements, the lack of groundwater standards was not only true of theCCM program, but the entire State. Attempts to establish groundwater standards have been ongoing in Indiana forat least as long as the CCM disposal controversy. Defenders of the program responded that it would make no senseto establish groundwater standards for the disposal of CCM at mines when the State as a whole had no standards. Defenders also stated that they understood that the industry would be responsible for meeting whatever State widecriteria were eventually establish anyway. Coal operators argued that groundwater monitoring in mine spoils inproximity to CCM disposal areas made no sense since the two materials were very similar in constituent make up. Assuch it was argued that it would be difficult if not impossible to differentiate between water impacted by CCM and“typical” water found within the mine spoil. Industry also argued that it made no sense to remediate groundwatermineralized as heavily as the water found in most Indiana spoil fields.
State Response
Representing the State’s position, IDNR has attempted to respond to what it viewed as inaccurate or amisrepresentation of information. For the most part, the agency has attempted to provide the public an explanationof how the program worked whenever and wherever possible. As an example of some specifically debated points,such as the use of distilled water instead of TCLP to test CCM, the agency responded that TCLP was designed formunicipal landfill environments, not at all representative of a mining environment. While IDNR recognized thatdistilled water also did not necessarily represent a mining environment, it is was considered by the agency to be a
64
closer representation of CCM characterization and in-situ leachability than was TCLP. In one of the few areas ofagreement everyone did eventually agree that TCLP is not an appropriate test for CCM placement at coal mines. Unfortunately, however, there has been no corresponding agreement on what is the best test medium or method oftesting.
Concerning the issue of radio nuclides, IDNR pointed to a substantial mainstream of scientific literature that showedradioactivity from CCMs were well within background radiation levels for many commonly occurring earth materials. That the possibility of “hot” CCMs from some obscure Colorado coal seam coming to Indiana was not realistic. Moreover, IDNR has indicated that neither the Federal government nor any State that it was aware of tested foreither radioactivity or PAHs.
Responding to attacks on Memo 92-1 as “non-enforceable,” IDNR pointed out that while the memo itself may not beenforceable, SMCRA regulations and specific conditions placed on the permits were enforceable and protective ofthe environment. The agency also responded that it never intended Memo 92-1 to do anything more than to provideguidance to operators. The purpose of the memo was to specifically inform coal operators what must be done tocomply with the SMCRA regulations when disposing of CCMs and securing permit approval. In defending the program, very often the sources of information and documents used to “prove” the soundness ofthe State’s CCM approach were the same sources of information and documents used by the CCM opponents to“prove” the program’s inadequacies. Not surprisingly in the public opinion arena, IDNR’s attempt to respond withfacts and science have not always played well against the emotional arguments often brought forth by theopponents of CCM disposal. Clearly, the public and the press have become extremely confused over what is ahighly technical matter. The fact that the positions taken by the proponents and opponents of CCM disposal andtheir technical experts have been so diametrically opposed only enhances this confusion. Additionally, theextremely strident opponents to CCM disposal have made significant effort to fan the flames of public fears andmedia concerns. When opponents describe the disposal of CCM at coal mines as the next great “unintendedenvironmental” threat, paralleled with automobile exhaust and global warming, freon and the ozone layer, asbestos,DDT, leaded gasoline, nuclear power waste and Love Canal, the public and press become understandably alarmed. Unfortunately, government defensively proclaiming that those arguments are untrue, while expounding on thesciences of hydrogeology and groundwater chemistry, provides little solace to a fearful public.
The New Approach
Beginning in January 1998, the State embarked on a new course in an attempt to bring to an end the conflict overCCM disposal at surface coal mines. It was the hope of the State’s new administration to develop a set ofregulations for CCM disposal as a preferable method of regulating the activity to the current “policy” memorandumapproach. To initiate this new course, a work group was formed from a cross section of the stakeholders including 1)representatives from the utility industry, 2) coal operators, 3) environmentalists, and 4) a variety of State governmentagencies and institutions. In preparation for these discussions, IDNR drafted a set of proposed rules specific toCCM disposal at mines. These rules were based primarily on the State of Illinois’ existing program. This approachwas selected because Illinois has had a viable CCM disposal program at coal mines in operation for numerous years. Also, the Indiana environmental community acknowledged it as the type of sound program that addressed theirconcerns.
From January through June 1998, the Coal Combustion Disposal Work Group met in a series of nine day-longmeetings with discussions covering nearly all points of a possible regulation. While the meetings themselvesproduced a great deal of agreement on a conceptual level, they agreed upon little as to what would make up anappropriate regulatory solution. When it came down to details, minimal agreement was achieved. Generally, theonly agreements on specific regulatory issues were ones that must otherwise be considered minor. Trying to breakwhat had become an impasse and to overcome the “public posturing” that may have been affecting thestakeholders’ willingness to work together, a form of “shuttle diplomacy” was attempted with a team representingState government. This approach involved meeting individually with each of the three primary stakeholder groups. It was hoped that individually the groups might be more willing to accept privately, what they were unwilling to

65
agree to in a group setting. This additional effort proved fruitless as there was too much distance between thepositions of the groups.
The Work Group’s unfortunate failure to agree on regulatory language in almost every area required the IndianaDNR to again impose its own judgement to develop regulations. IDNR relied on 1) its experience gained from morethan ten years of data gathering while regulating CCMs; 2) its knowledge of other surface mine CCM disposalprograms; 3) volumes of the latest in CCM scientific research; 4) ideas expressed as part of the Work Group process;and 5) numerous U.S.EPA reports. The result was that in November of 1998 IDNR brought before the NaturalResource Commission a new set of CCM regulations for preliminarily adoption.
Newly Proposed CCM Rule Requirements
Based in part on the foundation of DNR’s Memo 92-1, the new regulations expand on the policy in several importantrespects. Although there are others, a few of the most significant differences are that the new regulations requiremuch more testing of the CCM waste stream and establish a waste certification requirement. Each waste stream isrequired to undergo three separate pre-disposal tests for bulk analysis, 18-hour and 30-day leach characterization of17 different constituents. Memo 92-1 required only one pre-disposal sample test on bulk analysis, 18-hour and 30-day leach on 25 constituents. After disposal begins, Memo 92-1 requires quarterly testing of the waste stream solong as disposal continues. The new regulation requires monthly testing the first year, quarterly the second, andone test annually thereafter.
While still limiting disposal to CCMs that are less than 25 percent of the RCRA standard and rejecting those testedthat exceed that standard, the new regulation further divides acceptable CCMs into two categories: 1) those testingat less than 10 percent of the RCRA level (Class A); and 2) those more than 10 percent but less than 25 percent(Class B). These categories are important in that they relate directly to 1) the tonnage of CCM materials permittablefor disposal, 2) the type of disposal allowed, and 3) the type of groundwater monitoring required. For “Class A”CCMs (less than 10% RCRA), waste volumes permitted for disposal are limited to 50 percent of the tonnage of coalproduced from the mine accepting the waste. Further, “Class A” CCMs can be disposed of either in a monofill(usually in abandoned pit of an active mine with disposal thickness in excess of 10 feet) or as a continuous backfillthat disposes of the CCM along with mine spoil materials as the mining pit advances. Continuous backfill CCMthicknesses are limited to no more than 10 feet. For groundwater monitoring, “Class A” CCMs may default tomonitoring plans intended for compliance with SMCRA regulations. For “Class B” CCMs (greater than 10%, butless than 25% RCRA), volumes are restricted to 25 percent of the mine’s coal production and can only be placed inmonofills. Also, setback distances and spacing of monitoring wells in relationship to “Class B” monofills areestablished beyond normal SMCRA groundwater monitoring requirements. Monitoring wells placed on 750 footcenters down gradient from the monofill and are setback 300 feet from the edge of the unmined area.
In spite of a highly contentious NRC meeting, these rules were preliminarily adopted with two stated concerns by theCommission. The NRC felt that, before they could approve the rules as final, the issue of extended post-SMCRAliability had to be addressed and some form of groundwater quality standards needed to be established. In dealingwith the NRC’s concern over post-SMCRA liability for potential damages caused by CCM disposal, relief wasprovided by the Indiana State Legislature. With the passage of Public Law 63-1999, DNR was allowed to use fundsavailable to it to replace domestic water supplies to individuals whose groundwater was contaminated by CCM afterthe termination of a coal mine’s SMCRA liability. Resolution of the second issue relating to the establishment ofgroundwater standards also was an issue beyond DNR’s immediate control. By statute, the only entity in the Stateauthorized to establish groundwater standards was the Indiana Department of Environmental Management (IDEM). As described earlier, IDEM had intermittently struggled with the development of these standards for the last tenyears. Fortunately, IDEM was at last getting close to adopting specific groundwater standards. With the post-SMCRA liability issue resolved and development of State wide groundwater standards imminently pending, DNRprepared to go back to the NRC with a final rule for approval.
Unfortunately on March 1, 2000, just two weeks prior to the scheduled NRC meeting, the IDEM groundwaterstandard rules proved not to be as imminent as hoped and the Department determined to terminate its CCM disposalrule initiative. Prior to the adoption of any future regulations, the Department will be required to start an entirely new

66
rule making initiative. These efforts will not begin until after the State has finalized it’s groundwater qualitystandards which are currently projected for sometime this summer, if at all.
In retrospect, the total lack of any support for the proposed rules on the part of CCM opponents, while not alltogether surprising, is somewhat mildly ironic. One of the major stated criticisms of the State’s existing Memo 92-1was the fact that it was a policy document and not a rule. Apart from the standpoint that the proposed CCMdisposal rules was demonstrably more stringent than the Memo 92-1 policy, it was also more enforceable because itwas a rule. Brushing aside the importance of establishing rules, CCM disposal opponents claimed that the newregulations would serve only to “legitimize” the activity they found objectionable. Throughout this process theopposition to CCM disposal has become more strident. The proposed rules themselves appear to have become alightning rod for criticism. CCM opponents have made significant strides at involving the media. For its part, themedia, besides finding the issue “highly technical” and “very confusing,” have become caught up in the emotion ofeverything. For the most part, the media has repeatedly sided with CCW disposal opponents stating, “if there is anydispute over the facts, disposal should not be allowed.”
Conclusion
After more than twelve years, Indiana appears to have gone more than full circle in its attempt to deal with the issueof CCM disposal at surface coal mines. As of the writing of this paper, the issue of final CCM disposal regulationstands yet unresolved. Without a rule in place, Indiana will continue to rely on Memo 92-1. Whether or not we willever obtain normalcy regarding the acceptance of CCM disposal at surface coal mines seems to be a far off prospect. In a similar paper written not quite two years ago, I stated my hope that the Work Group process would ultimately, “ .. . generate[d] a program that is better than the one currently being administered.” In spite of itself and what mustbe considered the unfortunate failure of the Work Group, I believe that we had at least drafted a better program. Inthat same paper, a hope was also expressed that the Work Group process, with its “broader foundation” for ideasthan previous resolution efforts, would produce an ownership by the contributors to the final product. Unfortunately, this hope was too optimistic.
_____________________________1Paul J. Ehret is the Deputy Director of the Indiana Department of Natural Resources. The Division of Reclamation isthe regulatory authority for enforcement of the Surface Mining Control and Reclamation Act (SMCRA) in Indianaand has been empowered with the regulation of Coal Combustion Material disposal at surface coal mines. Previously, Mr. Ehret was employed by the Illinois Department of Mines and Minerals from 1980 through 1992 whichincluded responsibilities with the Land Reclamation Division. In Illinois, in conjunction with the Illinois Environmental Protection Agency, the Land Reclamation Division is responsible for the regulation of the disposal ofcoal combustion materials at coal mines.

67
UTILITY INDUSTRY PERSPECTIVE ON MINE PLACEMENT OF COAL COMBUSTION PRODUCTS
Steven J. Groseclose1
Counsel to the Utility Solid Waste Activities GroupWashington, DC
Abstract
The Utility Solid Waste Activities Group (USWAG) is responsible for addressing solid and hazardous wastes onbehalf of the utility industry. Over the last twenty-one years, USWAG has worked closely with US EPA on theRegulatory Determination for Fossil Fuel Combustion Wastes. One of the issues of concern, identified by EPA inPhase II of the Regulatory Determination, is the placement of coal ash in mines. The placement of CCBs in minesprovides an important management option for electric utilities. Several utilities have chosen to use the material tostabilize abandoned mines and mitigate the effects of acid mine drainage and subsidence rather than manage largevolumes of CCBs in surface impoundments and landfills. USWAG is vitally interested in preserving its members'options for the management of coal combustion products, including mine placement.
Background
The [U.S. EPA] Administrator shall, after public hearings and opportunity for comment, either determine topromulgate regulations under this subtitle [subtitle C hazardous waste] … or determine that such regulations areunwarranted. [RCRA § 3001(b)(3)(C); 42 U.S.C. § 6921(b)(3)(C)].
The Bevill Amendment
The final stages of the U.S. Environmental Protection Agency’s (EPA) process to reach its Phase II Bevill regulatorydetermination on wastes from the combustion of fossil fuels has taken an unfortunate turn away from science andthe clear requirements of RCRA in favor of politics. This presentation seeks to clarify what the Bevill Amendmentdoes and does not allow.
Quite simply, EPA is required to determine whether hazardous waste regulation is or is not warranted. Well aware ofthe burdens a Subtitle C determination would impose, EPA has attempted to frame such as decision as somethingmore palatable. This would be a “Soft C” approach that is somehow not as draconian as subtitle C. RCRA § 3004(x)provides that EPA may modify a limited number of subtitle C requirements applicable to landfills and surfaceimpoundments. It is clear that EPA can use this authority to tweek the regulations only after it has reached adetermination that the wastes warrant regulation as hazardous wastes. The “hazardous waste” label would crippleefforts to expand the beneficial reuse of coal combustion products in numerous applications, including minereclamation.
Lead-up to the Current Political Battle: 1993 Phase I Regulatory Determination and 1999Phase II Report to Congress
In March 1999, EPA Administrator Carol Browner transmitted the Report to Congress on Wastes from theCombustion of Fossil Fuels. It was the second report to Congress on these wastes and the culmination of the PhaseII study of fossil fuel combustion wastes. In Phase I, EPA reached its Regulatory Determination that the “highvolume” coal combustion wastes from utility coal combustion – fly ash, bottom ash, boiler slag, and flue gasdesulfurization material – did not warrant regulation under subtitle C [58 Fed. Reg. 42466 (Aug. 9, 1993)]. Thus, in1993, EPA was convinced that the wastes at issue posed limited risks and found “generally adequate State andFederal regulatory programs.”

68
The 1999 Report to Congress built upon the ensuing research over the following five and a half years, andrecommended that:
• disposal of coal-fired co-managed wastes should remain exempt from RCRA Subtitle C;• most beneficial used os coal-fired co-managed wastes should remain exempt form RCRA Subtitle C;• oil combustion wastes managed in lined units do not warrant regulation under RCRA Subtitle C;• beneficial uses of oil combustion wastes should remain exempt from RCRA Subtitle C; and• the Subtitle C exemption for natural gas combustors should remain in effect.
Each of these recommendations rests on well-documented Agency findings tied to "real world" data that show that:
• these waters rarely exhibit the characteristics of hazardous waste;• the trend among electric utilities is to install more environmental controls at waste management facilities,
including liners, covers, and groundwater monitoring;• there are few documented cases of proven damage to the environment caused by fossil fuel combustion
wastes, and these few cases all involve older, unlined management units, most of which no longer arereceiving combustion wastes, and at which there were no adverse human side effects;
• electric utility companies have achieved an outstanding record of environmental regulatory compliance,with no major enforcement cases involving solid or hazardous waste at a utility facility in the five yearperiod between 1992 and 1997; and
• the states have developed a comprehensive body of regulations applicable to the waste managementunits in which utilities store and dispose of combustion wastes.
The Report left two clouds. First, EPA made no recommendation on mine placement. EPA cited no indications ofenvironmental damage from mine placement activities, but indicated a general concern with placement of thesematerials in contact with the water table. EPA recognized that:
under ideal circumstances, placement of wastes in mines should present no increased risks tohuman health and the environment relative to landfills. In fact, minefills could result in netenvironmental benefits relative to conventional landfills through avoided development ofGreenfield space for UCCW disposal; improvement of disturbed mine lands through contouring,revegetation, and reduced infiltration to mine workings; and abatement of acid mine drainagethrough neutralization and diversion.
[Report to Congress at 3-51.]
However, EPA identified data gaps that it intended to address and therefore did not reach a firm recommendation. Second, EPA reached a tentative conclusion that agricultural applications should be limited, possibly to the 13 partsper million arsenic standard proposed in August 1999 for cement kiln dust.
Comment Period
In response to the Report to Congress, EPA received voluminous input from government agencies, academia,industry, and public interest groups. First, EPA convened a public meeting in Washington, D.C. EPA also provideda written comment period that lasted until June 14th. And then, at the request of environmental interest groups, EPAsought an amendment to the court order that controls the timing of its decision in order to reopen the commentperiod.
Much of the new information was provided in response to EPA’s request for information on mine placement casestudies. (“Case studies, when available, are preferable to modeling.”) In addition, EPA and representatives ofenvironmental interest groups participated in mine site visits in Maryland, West Virginia, and Indiana.

69
EPA was presented with reams of data and comments from USWAG, other industry associations, utility companies,mining companies, academia, and State and Federal regulatory agencies. USWAG’s comments included an ElectricPower Research Institute Mine Placement Synthesis Report that provided detailed case studies of:
1. Universal Mine, Indiana2. Storm Strip Mine Ash Fill, West Virginia3. Midwestern Mine, Indiana4. Arnold Willis Mine, Indiana5. Frazee Mine, Maryland6. Omega Mine, West Virginia7. Clinton County Surface Mine, Pennsylvania8. Kempton Mine Complex, Maryland and West Virginia9. Red Oak Mine, Oklahoma10. Harwick Mine Complex, Pennsylvania
USAWG beseeched EPA to refer to the wealth of data and research amassed by other Federal Agencies andacademia. And those institutions provided numerous, detailed, and thoughtful comments to the docket. In addition,many States provided EPA with details of their regulatory programs. Furthermore, local environmental interest andorganizations in Pennsylvania submitted comments urging EPA not to erect barriers to the placement of coal ash inmines to mitigate acid mine drainage.
With the objective of sweeping Federal regulation of fossil fuel combustion by-products, the Hoosier EnvironmentalCouncil and the National Citizens’ Coal Law Project submitted comments, including research papers and anecdotalevidence they claimed demonstrated widespread damage from coal combustion wastes.
January 2000
By the end of January 2000, EPA’s Office of Solid Waste had assessed the comments submitted by the September24th deadline and was preparing to issue the regulatory determination by the March 10th court deadline. To that end,EPA staff reported to Federal agencies including DOE, OSM, and USDA on a draft of the determination and statedthat EPA intended to file publish a positive, – i.e., nonhazardous, determination on all uses except mine placement.
EPA reported that in response to public comments, most significantly those from the USDA, it had revised itsagricultural use risk assessment. Only minor changes were sufficient to demonstrate that there was no significantrisk from those uses, and EPA had drafted a positive determination on that issue.
For mine placement, EPA indicated simply that it intended to study the issue further but that no subtitle Cdetermination was warranted.
March 2000
Within approximately one month, EPA had changed its position 180 degrees. The publication Inside EPA publisheda draft regulatory determination dated March 5, 2000 – a negative determination for all coal combustion wastes. EPA was prepared to state definitively that Subtitle C hazardous waste regulation is warranted not only for the“remaining wastes” addressed in the Phase II study but also for the high volume utility coal combustion wastes thatwere addressed in the 1993 regulatory determination. Interestingly, EPA intended to recognize all beneficial uses ofCCPs, except for mine placement, as desirable.
The reason for the about-face is evidently a desire by EPA senior officials to respond to environmental interestorganizations’ lobbying efforts. Those groups – a coalition of local groups concerned with coal ash disposalpractices and national groups focused on air emissions from utilities–have openly sought uniform Federal regulationof these materials as a means to impose costs on the use of coal that might affect the financial viability of coal use.

70
The draft regulatory determination is intended as the first step towards a subtitle C rule making, and as such, EPAdid not delineate the exact shape of the regulations it intended. However, it is clear from the March 5th draft that EPAenvisions some sort of “contingent management” approach, similar to its proposed rule in August 1999 on cementkiln dust.
The exact shape of those rules is irrelevant to the profound impacts a hazardous label would have on industry andthe beneficial uses EPA recognizes as desirable. If EPA were to adopt a negative determination, the messagereceived by regulators and the marketplace would reduce to this: Fossil fuel combustion wastes are so dangerousthat EPA wants to regulate them under RCRA Subtitle C. PERIOD. Supportive statement about beneficial useswould be of no use. The regulations would not be fleshed out for quite some time, perhaps years. During thatperiod, the dense cloud over these materials would persist – an unfortunate betrayal of the many years of effort byindustry, DOE, OSM, USDA, and EPA as well to reduce barriers to the beneficial reuse of these materials.
As far as the evidence to support this about face, we can only speculate based on the sketch presented in the March5th draft. Despite urgent requests for information, EPA has not shared with us the details of its new found concerns. We do know from the March draft and statements in meetings and to the press that EPA bases its reversal ofposition in large part on 4 new proven damage cases allegedly resulting from coal combustion waste disposal: two inWisconsin; one in North Dakota; and one in New York. This brings the total of “proven damage cases” from sevento eleven. Somehow eleven out of 600 coal burning utility management units is significant and warrants regulatoryaction, whereas 6 out of 600 was indicative of sound management practices. EPA also buffers its position by calling19 non-proven damage cases “potential” damage cases. Most of these involve transient secondary drinking waterstandard exceedances with little or no impact to public drinking water. It is significant to note that not a singlealleged damage case is related to mine placement! And not a single alleged damage case is related to any beneficialuse practice. Just as EPA found in the March 1999 RTC, most of these cases are the results of old managementpractices and had been identified and corrected under State oversight, with no prodding from EPA. Indeed, thesealleged “damage cases” are evidence of responsible reactions by industry and State and local regulators – suggesting that a stepped-up Federal role is unnecessary.
EPA has taken the position in meetings that it does not plan to regulate beneficial use – that it recognizes theeconomic and environmental benefits of increased reuse that the industry has pursued diligently over the years. The Agency somehow plans to convince the market place that on the one hand these materials are “hazardouswaste” but on the other hand, they should be freely utilized. We know from DOE’s Ash Barriers Report thatuncertainty over the status of these materials has impeded the development of reuse markets. Can EPA seriouslybelieve that these uses will not be impacted severely by a negative regulatory determination?
EPA officials have also suggested that the March 5th draft represents something much less ominous than subtitle Cregulation. However, the notion that a contingent hazardous waste determination is qualitatively less than a non-contingent hazardous waste determination is disingenuous. The Bevill amendment quite simply calls for adetermination whether subtitle C regulation is warranted or not. A result other than “not” will carry with it all of thenegative baggage, regardless of the caveats, footnotes, and words of support for beneficial use that EPA mightinclude.
Reactions
There has been strong reaction against EPA’s about-face – seen as a rejection of the science-basedrecommendations of Agency staff incorporated in the 1999 Report to Congress in favor of the political desires ofupper management. Indeed, the Administrator’s technical staff reaffirmed the science-based conclusions in theReport to Congress in January 2000 meetings with other Federal agencies–after having the benefit of the newlyavailable information submitted in comments on the Report to Congress.
There has been strong reaction from the States. At this time, we are aware of strong letters of opposition from theenvironmental agencies of Michigan, Wisconsin, North Dakota, North Carolina, Pennsylvania, Florida, Tennessee,Texas, Maryland, and the Association of State and Territorial Solid Waste Management Officials. As can beimagined, the March 5th draft is seen widely as a slap in the face of States with effective regulatory programs as wellas an attempt to usurp the authority Congress provided to the States under the RCRA Subtitle C-Subtitle D

71
dichotomy. A number of prominent governors have also written the Administration. For example, GovernorO’Bannon of Indiana wrote to Administrator Browner:
"I hope your final decision will reflect experiences of coal-producing States like Indiana indealing with coal ash, as well as the scientific data and the recommendations of your technicalstaff and scientists."
Over 40 Senators, evenly split among Democrats and Republicans have written in protest of the last-minute, politicalreversal. For example, Senator Paul Sarbanes of Maryland wrote to Administrator Browner in support of mineplacement:
"By injecting [coal combustion product grout] into the Kempton mine passages, we can makebeneficial use of the by-products as an alternative to landfilling, greatly reduce the amount ofacid formed in the mines, and restore water quality."
and
"I would appreciate it if you would provide me with a full report on the rationale for regulatingthese coal combustion materials under Subtitle C and the documentation on the relativeenvironmental impacts associated with coal combustion wastes vs the benefits of utilizing theseby-products for remediating acid mine drainage."
Dozens of Congressmen have also opposed EPA’s path towards a Subtitle C determination. Congressman RickBoucher of Virginia wrote to Administrator Browner:
"Characterizing combustion by-products as warranting hazardous waste regulation couldeasily destroy much of the emerging ash marketing industry. To now declare that thesematerials must be regulated under the hazardous waste program, after determining that therecycling of these combustion materials into useful commercial applications is environmentallysafe, is simply illogical."
and
"I hope that you will adopt the technically sound and scientifically based recommendations ofthe professional staff in the Office of Solid Waste to retain State regulation of combustion wasteunder Subtitle D of RCRA."
OMB Review
EPA received an extension of the March 10th deadline until April 10th so that it could have time to run its reworkeddraft through the interagency review process. The interagency review process, required by Executive Order 12866and marshaled by the Office of Management and Budget represents the last and ultimate hurdle for EPA beforeimposing a Subtitle C determination. However, it also represents the best opportunity for experts from other Federalagencies – USDA, DOE, OSM – to block this action and hold EPA accountable for a science-based decision. Therecord will support only one determination – the non-hazardous determination recommended in the Report toCongress and discussed with other agency officials as recently as January 2000.
At this point, we can only hope that the results of the interagency review will prove the merit of President Clinton'sExecutive Order, which was designed to avoid the politicization of regulatory decisionmaking:
"The American people deserve a regulatory system that works for them, not against them: aregulatory system that protects and improves their health, safety, environment, and well-beingand improves the performance of the economy without imposing unacceptable or unreasonablecosts on society; regulatory policies that recognize that the private sector and private marketsare the best engine for economic growth; regulatory approaches that respect the role of State,

72
local, and tribal governments; and regulations that are effective, consistent, sensible, andunderstandable. We do not have such a regulatory system today."
[Executive Order 12866.]
Postscript
On April 25th, USWAG went to court to block what would have been EPA’s fourth extension of the deadline for thefinal determination since publication of the Report to Congress in 1999. EPA had requested a 90 day extension of theconsent decree deadline controlling the timing of the action. After business hours on April 25th, EPA AdministratorBrowner signed the Phase II regulatory determination for fossil fuel combustion wastes as required by the court. The second sentence of the press release stated directly, “These wastes are not being classified as hazardouswastes.”
The determination appeared in the Federal Register on May 22, 2000. The official statement was that fossil fuelcombustion wastes “do not warrant regulation under Subtitle C of RCRA” and retained the Bevill exemption underRCRA § 3001(b)(3)(C). [65 Fed. Reg. 32214.] Along with the non-hazardous Bevill Determination, EPA announcedthat it will develop national standards under RCRA Subtitle D to address coal combustion wastes disposed inlandfills and surface impoundments or placed in mines. EPA provided an unqualified endorsement of all beneficialuses other than mine placement, and the Subtitle D regulations will not address those activities. In sum, EPA statedthat:
[a]fter considering all of the factors specified in RCRA Section 8002(n), we have decided . . . ,that the decisive factors are trends in present disposal and utilization practices (Section8002(n)(2)), and the current and potential utilization of the wastes (Section 8002(n)(8)), andthe admonition against duplication of efforts by other Federal and State agencies.
[Id. at 32215.]
In particular, EPA cites with approval data that demonstrates the use of liners and groundwater monitoring by theindustry has increased substantially over the past 15 years. [ Id. at 32215-16.] Furthermore, EPA identifies asignificant “downside” to Subtitle C regulation as influential in its decision to use Subtitle D authority – thepotential for adverse impacts on beneficial use of coal combustion by-products. [Id. at 32217, 32232.] EPA explainsthat:
[n]ormally, concerns about stigma are not a deciding factor in EPA’s decisions under RCRA,given the central concern under the statute for protection of human health and the environment. However, given our conclusion that the Subtitle D approach here should be fully effective inprotecting human health and the environment, and given the large and salutary role thatbeneficial reuse plays for this waste, concern over stigma is a factor supporting our decisiontoday that Subtitle C regulation is unwarranted in light of our decision to pursue a Subtitle Dapproach.
[ Id. at 32217.]
Through a future rule making, EPA will develop Subtitle D standards that apply to both coal combustion wastes – flyash, bottom ash, boiler slag, and flue gas desulfurization material—when managed separately or when co-managedwith other wastes generated during the combustion of coal.
EPA acknowledges the potential benefits of mine placement, but is concerned that an alleged lack of adequateregulatory oversight could result in damage to human health and the environment. The bases for the determinationto regulate mine placement under Subtitle D include:
• The potential to present a danger to human health and the environment "under certaincircumstances"; and

73
• Few States have comprehensive programs that specifically address the unique circumstancesof mine filling.
[Id. at 32221.]
Although EPA identified no damage cases related to mine placement, it remains concerned about placement of coalcombustion wastes in contact with groundwater, but offers no explanation of the nature of its concern. [ Id. at32231.] EPA is particularly critical of State programs that lack a requirement for groundwater monitoring or lackcontrols or prohibitions on waste placement below the water table. “We are concerned that government oversightis necessary to ensure that mine filling is done appropriately to protect human health and the environment,particularly since mine filling is a recent, but rapidly expanding use of coal combustion wastes. Governmentoversight has not yet ‘caught up’ with the practice consistently across the country.” [ Id. at 32231.]
In its effort to develop non-hazardous waste regulations applicable to mine placement, EPA will consider whetherRCRA Subtitle D, the Surface Mining Control and Reclamation Act (SMCRA), or a combination of the twoauthorities would be most effective. EPA promises to consult with the Office of Surface Mining in the Department ofthe Interior to assess whether SMCRA is suited to address its concerns with mine placement. [ Id. at 32215.] EPAacknowledges that SMCRA is “expressly designed to address environmental risks associated with coal mines.” [ Id.at 32217, 32232.]
______________________________1 Steven J. Groseclose is an environmental attorney in the Washington, D.C. office of Piper, Marbury, Rudnick, andWolfe LLP. His practice focuses on State and Federal regulation of hazardous waste, solid waste, and hazardousmaterials transportation. One of his principal clients is the Utility Solid Waste Activities Group, the nationalconsortium of electric utility operating companies and trade associations that has been active in Federal solid andhazardous waste issues for more than twenty years.

74
75
A CITIZEN REGULATORY PERSPECTIVE ON DISPOSAL OF COAL COMBUSTION WASTES AT THE MINE SITE
Jeff StantHoosier Environmental Council
Presenting forTom FitzGerald1
Kentucky Resources Council, Inc.Frankfort, Kentucky
Editor’s Note: Due to the last minute acceptance by Mr. Stant in agreeing to speak for Tom FitzGerald, only thepaper previously prepared by Mr. FitzGerald is included in the proceedings.
Summary
In summary manner, we believe that sufficient evidence exists of contamination from disposal of coal combustionwastes to warrant the development of national minimum standards concerning the characterization, storage,disposal, and reuse of these wastes. Specifically, and of particular interest to this forum, we believe that theevidence is sufficient to justify an immediate nationwide moratorium on further co-disposal of coal combustionwastes in mine voids and pits until the Office of Surface Mining (OSM) and the U.S. Environmental ProtectionAgency (EPA) assert regulatory authority over the disposal of coal combustion wastes in mine pits and voids anddevelop national minimum standards governing the co-disposal of such wastes in mine voids and backfill.
The uneven and inadequate State regulation of disposal of coal combustion wastes at mine sites is evident. Thecoal combustion waste stream, having been accorded by many States a legal status that is “neither fish nor fowl,”neither solid nor hazardous waste but instead “special waste,” has been subject to disposal without protectionsappropriate to the toxicity of the wastes and the potential problems from improper management. The failuresregarding management of these wastes include a failure to require adequate background characterization of geologicand hydrogeologic conditions relative to the disposal of these wastes and haphazard characterization of the toxicity,fate, and transport of these wastes under proposed disposal conditions. These failure lead to disposal withoutadequate precautions against future pollution.
These failures are the direct and predictable result, the bitter fruit, of the failure of OSM and EPA to establish aFederal “floor” of regulation of coal combustion wastes. While EPA is in the last stages of the process of assessingwhether these wastes should be managed as hazardous wastes under Subtitle C of the Resource Conservation andRecovery Act, OSM has studiously avoided exercising regulatory authority to establish minimum standards for co-disposal of coal combustion wastes at mine sites, choosing instead to stand idly by while the States engage in the“one-downsmanship” in standard setting that Congress sought to avoid in enacting the 1977 mining law.
EPA Report to Congress
EPA, as I mentioned, is obligated by Section 8002(n) of RCRA to conduct a “detailed and comprehensive study . . .on the adverse effects on human health and the environment, if any, of the disposal and utilization of fly ash waste,bottom ash waste, slag waste, flue gas emission control waste, and other by-product materials generated primarilyfrom the combustion of coal or other fossil fuels.” That study is complete and EPA is scheduled to make a finalrecommendation soon.
The draft Report To Congress was of concern because it contained numerous assumptions and characterizationsconcerning the nature, severity, and scope of the problem of co-disposal of coal wastes at mine sites, and regardingthe adequacy of State regulation of such wastes.

76
Among the concerns that we had regarding the draft Report, the Administrator’s study appeared to be limited to afile review of third-party data, falling short of the “detailed and comprehensive study” of the consequences ofmanagement and disposal of material generated from the combustion of coal and other fossil fuels that Congressenvisioned.
While EPA chose to rely almost entirely on data submitted by third parties to support an assessment of whether therisks associated with improper disposal warrant such effort, the draft report failed to acknowledge the full range ofevidence of groundwater contamination associated with current CCW disposal practices. The HoosierEnvironmental Council comments outline numerous “documented cases in which danger to human health or theenvironment” has been demonstrated, yet the agency has previously rejected that information because of theabsence of pre-disposal background. Much of the information available regarding disposal practices may notconform to laboratory protocols, since the hodgepodge of State controls over the disposal of this waste results, inmany cases, in disposal without proper characterization of background conditions or the waste stream for thoseconstituents of concern present in this waste. The rejection of such information, as has been developeddemonstrating contamination because of questions concerning quality control or background, is an easy butinappropriate response.
The lack of background, characterization, hydrologic, and other information regarding these past disposal activitiesis itself a product of uneven and inadequate State regulation of the waste stream, and speaks volumes of the needfor establishment of a Federal “floor” of regulation of coal combustion wastes.
Where the EPA will go in its recommendations is unclear. It has authority to craft standards blending Subtitle Chazardous and Subtitle D solid waste standards to “take into account the special characteristics of such wastes,practical difficulties associated with implementation of such requirements, and site-specific characteristics, includingbut not limited to the climate, geology, hydrology, and soil chemistry at the site, so long as such modifiedrequirements assure protection of human health and the environment.” Section 3004(x). The EPA has the flexibilityand discretion to adopt a program that is tailored to the specific problems associated with the “open dumping” ofcoal combustion wastes in mine backfill and voids, in order to assure protection of human health and theenvironment.
Does the co-disposal of coal combustion wastes in mining areas present heightened risks of contamination ofgroundwater and injury to public health that warrant assertion of EPA hazardous-waste authority over that disposalpractice, and which justify OSM adopting specific standards governing such practices? We believe clearly that itdoes; and that, in fact, the disposal of coal combustion wastes in mine backfill constitutes, by definition, an imminentdanger situation that subjects the disposal practice to suit under RCRA.
It is a fact that coal combustion wastes containing leachable metals at levels well above accepted drinking waterstandards for safe potability of water are being placed indiscriminately in unlined backfills of coal mining operationsin direct communication with groundwaters, and without proper characterization, isolation, management, closure,financial responsibility, monitoring, and post-closure corrective action requirements attendant to such wastes. Suchactivity falls squarely within the scope of the citizen suit provision of RCRA, since the imminent and substantialendangerment language addresses the avoidance and mitigation of potential endangerments and does not hinge ondemonstration of actual manifest harm or the presence of an emergency. United States v. Waste Industries, Inc., 734F.2d 159 (4th Cir. 1984).
The failure of EPA to date to assert jurisdiction under RCRA over this problematic waste stream, because of themistaken assumption that the wastes are not “hazardous” in the context of open mine dumping, will create thelikelihood that the regulation of the placement of such wastes and the health and environmental consequences willbe driven by the courts. This court action will be in the context of citizen-initiated suits alleging imminent andsubstantial endangerment from such disposal due to the inadequate management of such wastes under State wasteand mining programs.
The failure of EPA and OSM to assert Federal leadership in establishing up-front baseline standards concerning thedisposal of coal combustion wastes invites significant judicial intrusion into the field. It also implicates the

77
disposers, transporters, and generators in a web of liability that is as open-ended as are the State managementprograms themselves.
The evidence of groundwater contamination from disposal of coal combustion wastes in situations comparable tothe dumping of such wastes in mine backfill is more than sufficient to warrant Federal involvement in establishingbaseline standards for coal combustion waste disposal in mining sites.
The EPA Report relies on probabilistic risk assessments to conclude that the target risk for regulation as a hazardouswaste is not exceeded based on available data. Yet EPA has discounted the available evidence demonstratingcontamination and assumes erroneously that other sites have no contamination because no data existsdemonstrating contamination. In truth, many of the disposal sites have never been monitored for groundwaterimpacts. Surface mining permits have not contained the full gamut of monitoring parameters, including numerousmetals and radio nuclides, needed to fully characterize the waste, its leachate, and its mobility in the chaotichydrogeologic environment of an active or “reclaimed” mining operation. What is known, concerning the potential toxicity of the leachate from coal combustion ash, suggests that a Federalfloor of management standards is needed. It is a myth that there is no potential public health and environmentalimpact of improper management of coal combustion wastes. The 1988 EPA report to Congress concerning coalcombustion wastes acknowledged the existence of potential for causing groundwater contamination among andwithin the categories of coal combustion waste. According to the EPA Report Wastes from the Combustion of Coalby Electric Utility Power Plants, EPA/530-SW-88-002: “The primary concern regarding the disposal of wastes fromcoal-fired power plants is the potential for waste leachate to cause groundwater contamination. Although most ofthe materials found in these wastes do not cause much concern (for example, over 95 percent of ash is composed ofoxides of silicon, aluminum, iron, and calcium), small quantities of other constituents that could potentially damagehuman health and the environment may also be present. These constituents include arsenic, barium, cadmium,chromium, lead, mercury, and selenium. At certain concentrations these elements have toxic effects (Id., at ES-4)."
While the findings of the EPA Report and review of industry-generated studies indicated generally that metals didnot leach out of coal combustion waste at levels 100x the primary drinking water standard (i.e., characteristicallyhazardous by TCLP toxicity), hazardous levels of cadmium and arsenic were found in ash and sludge samples, andboiler cleaning wastes sometimes contained hazardous levels of chromium and lead. Id.
The literature suggests that, among other things:
l. Neither EP nor TCLP tests provide a good indication of leachability of CCW in natural disposal settings. Long-term leaching tests conducted until equilibrium has been achieved for each element of concern,using a leaching solution that approximated percolating groundwater, would give a more accuratedepiction of groundwater contamination potential at a disposal site.
2. Seventeen potentially toxic elements are commonly present in CCW: aluminum, antimony, arsenic,barium, beryllium, boron, cadmium, chromium, copper, lead, manganese, mercury, molybdenum, nickel,selenium, vanadium, and zinc.
3. Fluidized bed combustion (FBC) wastes retain volatile and semi-volatile elements in the bottom ash to agreater extent than conventional pulverized coal combustion, thus enhancing the leachability of FBCwaste elements.
4. Leachates from coal power plant ash and flue gas desulfurization wastes typically exceed drinking waterstandards, but by a factor less than hazardous levels (i.e., 100 x DWS). The major leaching studies onCCW indicate that drinking water standards are typically exceeded by CCW ash leachate at a factor of1.1 to 10, and often by a factor greater than 10 for one or more elements.
Other reports indicate a concern with enhanced levels of radio nuclides in coal combustion fly ash, including radium-226 and other daughters of the uranium and thorium series that pose significant long-term management challenges.
The available evidence suggests that disposal of coal combustion wastes in mine pits or other workings may be ofparticular concern, due to a number of factors: 1) the increase in surface area available for leaching of elements
78
resulting from fracturing of overburden and confining layers; 2) higher total dissolved solids levels in mine spoilsthat compete for sorption sites on solids with toxic elements released from the buried ash; 3) direct communicationbetween surface and underground mine workings and aquifers through stress-relief fracture systems andsubsidence-induced fracture flow; 4) the dependence of residents of coal-baring regions on private, groundwatersupplies and the significant potential for contamination of those supplies; and 5) the presence of site conditionsconducive to creation of acid or toxic-forming material that can solubilize constituents of concern from the waste.
In choosing the appropriate standard for assertion of jurisdiction over the disposal of these wastes in mineworkings, the appropriate endpoint for assessment should not be whether the waste leaches at 100 times thedrinking water standards (which is the relevant TCLP characteristic of the wastes’ “hazard”), but should be whether,if improperly managed, the wastes may leach into groundwater at above the drinking water standards themselves. Since the evidence shows that such leaching does occur, intervention to assure proper siting, construction, and useof barrier technology to prevent the wastes from contacting groundwater or rainfall percolation is needed.
The prior EPA Report concluded preliminarily that coal combustion waste need not be regulated under RCRASubpart C as hazardous, but rather that the wastes should continue to be regulated under Subpart D as solid wastes. This conclusion rested on the assumption that mitigative measures under Subpart D such as: 1) installation ofliners, 2) leachate collection systems, and 3) groundwater monitoring systems and corrective action to clean upgroundwater contamination would be adequate for protecting public health and the environment. The EPArecommendation was predicated on the application of such measures to the management of coal combustion wastes.Unfortunately, such measures are not being employed universally among the States.
The information developed by the Hoosier Environmental Council demonstrates the wide variability among States inthe caliber of the management programs for coal combustion wastes disposed of at mine sites. States have thecapacity, but not the will, to properly regulate these wastes.
The lack of Federal standards has resulted in uneven standard setting among the States; a regulatory “one-downsmanship” in which States are unwilling to establish stronger standards that might disadvantage their coalindustry relative to those standards of other States. This destructive interstate competition in environmentaldegradation has long been acknowledged as a problem among the coal States, particularly in those areas of the East,Midwest and West where the coalfields span a number of States. Congress enacted a national regulatory programover coal mining operations including Federal minimum performance and design standards, Federal oversight, and aFederal enforcement component precisely because of the inability of the States to overcome this problem.
For a number of predictable reasons – including insufficient funding and the tendency for State agencies to beprotective of local industry – State enforcement has in the past, often fallen short of the vigor necessary to assureadequate protection of the environment.[H.R. Report 95-218, 95th Cong., 1st Sess. 129 (1977).]
The draft EPA Report devotes a mere two pages to the assessment of risks associated with coal combustion wastedisposal in coal mines. If the EPA believes, as it asserts, that there is insufficient information to characterize therisks, then we believe that it has a legal and moral obligation to prevent further open-dump disposal of coalcombustion wastes in mine sites where the wastes will come into communication with groundwater or are placed inan uncontrolled manner, pending the completion of that assessment. The “current lack of sufficient information” tocharacterize the degree of risk from mine co-disposal is not a sufficient answer. Absent imposition of a requirementfor proper monitoring of coal combustion waste disposal, such information will not be forthcoming.
Recommendations
We believe, however, that EPA has sufficient information concerning the leaching potential of these wastes, thevulnerability of coalfield groundwater resources, and the documented cases of damage to compel immediate actionby the agency to list and control such wastes where co-disposed in coal mines. Such controls should include: 1) aprohibition on open-end dumping of coal combustion wastes in mine backfill; and 2) characterization of the waste. In order to properly design a facility for disposal of coal combustion waste, the full extent of the characteristics ofthe waste must be known. All coal combustion wastes should be screened for metals and for radio nuclides. Where
79
the wastes exhibit elevated radioactivity, they should be managed as technologically enhanced low-level radioactivewastes in accordance with the applicable State and Federal laws.
Site suitability should be assessed and the leachate potential must be established by use of 1) appropriate modelingof the disposal site; 2) the amount of rainfall infiltration; 3) the pH of the waste and associated materials throughwhich the rainfall will pass; and 4) a hydrogeologic investigation into the location, extent, and characteristics of thesurface and groundwater systems at the site. No disposal should be allowed absent: 1) the complete characterizationof the waste stream(s) proposed for land disposal; and 2) assurance that the engineering design of the disposalfacility and controlled placement in a discrete, properly engineered and lined land disposal facility will assurecompliance with the environmental performance standards (including no contamination of aquifers above drinkingwater standards and no increase in groundwater of any constituents above background levels of thosecontaminants).
Groundwater monitoring must be sufficient to allow for prompt detection of leachate migration at the waste site (andnot the mine) boundary. Monitoring parameters and well locations must be such that they are appropriate to thearea in which the wastes are disposed.
Blending of mine wastes with spoil in the backfill, rather than controlled placement of the wastes in a designedfacility, should be treated as prohibited open dumping with closure and post-closure care, and financialresponsibility requirements.
Federal Regulatory Responsibility
The EPA and OSM share responsibility over development of standards for disposal of coal combustion wastes. RCRA provides for integration of the two laws. RCRA does not provide OSM with such exclusive authority withrespect to the disposal of coal combustion wastes in mine sites, leaving by exclusion, the primary responsibility forproper management of such wastes within the province of the Administrator. We are hopeful that EPA will properlyexercise such authority in short order.
That EPA has primary responsibility, does not relieve OSM of its concurrent authority. Properly applied, a numberof provisions of the Surface Mining Control and Reclamation Act of 1977 could be utilized to better control disposalof coal combustion wastes on mine sites. For example:
• No coal combustion waste should be placed in a mined area where it would displace soil to a hollowfill, because such additional spoil displacement would violate the requirement that all spoil generatedby the mine be returned to the mined area except excess spoil.
• The requirement for contemporaneous reclamation would arguably be violated by any delay inreclamation associated with disposal of coal combustion wastes in active mining and reclamation areas.
• The permit requirements of 30 U.S.C. 1257 and the reclamation plan requirements of 30 U.S.C. 1258,properly applied, could require characterization of the wastes and their interaction with the minedenvironment, and of the development of groundwater monitoring sufficient in types of parameters,appropriate in location, and sufficient in duration to detect disposal problems.
• Placement of coal combustion wastes in backfill without proper barriers to prevent migration togroundwater and to prevent saturation of the waste from infiltration of rainfall or groundwater, wouldalso appear to violate provisions of the law addressing protection of the hydrologic balance andprevention of off-site damage, through isolation of acid- or toxic-forming materials from surface orgroundwater.
OSM has fretted long enough, and should, by guidance and regulation, move promptly to control the co-disposal ofcoal combustion wastes.
The information concerning the leaching potential of these wastes, the vulnerability of coalfield groundwaterresources, and the documented cases of damage are sufficient to allow for immediate action by OSM and the U.S.EPA to control such wastes where co-disposed in coal mines. The available evidence suggests that disposal of coal

80
combustion wastes in mine pits or other workings may be of particular concern, due to a number of factors: 1) theincrease in surface area available for leaching of elements resulting from fracturing of overburden and confininglayers; 2) higher total dissolved solids levels in mine spoils that compete for sorption sites on solids with toxicelements released from the buried ash; 3) direct communication between surface and underground mine workingsand aquifers through stress-relief fracture systems and subsidence-induced fracture flow; 4) the dependence ofresidents of coal-bearing regions on private, groundwater supplies and the significant potential for contamination ofthose supplies; and 5) the presence of site conditions conducive to creation of acid or toxic-forming material that cansolubilize constituents of concern from the waste.The placement of uncontrolled and unconsolidated deposits of coal combustion waste in mine backfills, valley orhollow fills, or underground mine voids is irresponsible. The groundwater systems in many coalfields areparticularly vulnerable to contamination because of the high transmissivity of the fracture-dominated aquifersystems and because of the high degree of interconnection of aquifers through subsidence-induced deformation ofstrata above underground coal seams.
The Future
What will the future bring absent Federal intervention? To answer this, one must question why coal combustionwastes are being backhauled and disposed of in mine workings (including both underground mine voids and morecommonly, in surface mine backfills or spoil/mine waste fills). It is not because of the beneficial attributes of thewastes relative to other backfill materials, or the lack of alternative locations available to utilities and non-utilitycustomers for coal combustion waste disposal. It is because the coal companies offer the backhauling and disposalas a “service” or incentive in order to attract buyers for their coal in an increasingly competitive marketplace. Absent Federal intervention in this regard, the competitive forces of the deregulated utility marketplace will continueto result in a parochial failure of the individual States to effectively control the disposal of CCW. This will increasepressure on coal companies to remain “competitive” with each other and with other coalfields across the nation, byoffering the ultimate “out of sight, out of mind” solution to the generation of the coal combustion waste.
Many utilities will not allow their waste to be co-disposed in mine voids and workings, preferring to manage theirliabilities associated with the waste on-site or in a manner more controlled than the typical mine site. Those that doallow the waste to be managed in co-disposal situations likely assume that the problems with their waste streams willbe masked by the significant hydrogeologic and chemical disruptions associated with mining operations, or that thecontamination will not be discovered because of lack of adequate and sufficient monitoring. In many cases, they arecorrect. Absent EPA and OSM intervention, such practices will be encouraged, placing those engaging in morecareful, controlled disposal, at a competitive disadvantage.
Conclusion
In sum, what is known, concerning the potential toxicity of the leachate from coal combustion ash, suggests that ageneral Federal floor of management standards is needed. Additionally, the information concerning the leachingpotential of these wastes, the vulnerability of coalfield groundwater resources, and the documented cases of damageare sufficient to allow for immediate action by U.S. EPA and OSM to control such wastes where co-disposed in coalmines.
_____________________________1Tom FitzGerald is the Director of the Kentucky Resources Council, Inc., a non-profit environmental advocacyorganization providing free legal, strategic, and policy assistance to individuals, organizations, and communitiesconcerning environmental quality and resource extraction issues. FitzGerald holds numerous appointments on Stateand National environmental advisory organizations. He holds a Juris Doctor degree from the University ofKentucky College of Law and has authored numerous articles on the citizen perspective of environmental issuesrelated to coal mining and reclamation.

81
THE OFFICE OF SURFACE MINING’S PERSPECTIVE ONCOAL COMBUSTION WASTE DISPOSAL ON NATIVE AMERICAN
LANDS
Richard Holbrook1
Western Regional Coordinating CenterOffice of Surface Mining Reclamation and Enforcement
Denver, Colorado
Abstract
The Office of Surface Mining Western Regional Coordinating Center (WRCC) regulates CCB disposal operations atone surface coal mine on the Navajo Reservation. Because the Surface Mining Control and Reclamation Act of 1977(SMCRA) and the implementing regulations do not contain specific requirements for CCB disposal at coal mines,WRCC developed a guidance document to ensure that CCB disposal at surface coal mines will comply with therequirements of SMCRA and the applicable regulatory program. Most States also have developed policies forcoordinating the regulation of CCB disposal at coal mines between State agencies. There are broad differencesbetween States, as well as on Indian lands, in the requirements and methods for regulating CCB disposal operationsat coal mines. The WRCC guidance is but one approach to such regulation.
Background
Four years ago at the first CCB Forum, Office of Surface Mining (OSM) Acting Director Kay Henry addressed theincreased interest in coal mines as disposal sites for coal combustion by-products (CCBs). She noted that neitherthe Surface Mining Control and Reclamation Act (SMCRA) nor OSM’s regulations specifically address the use ordisposal of CCBs at surface coal mines; however, she recognized that CCB use and disposal at active mine sites isnot precluded so long as such disposal is conducted in accordance with the environmental protection standards ofSMCRA and with applicable solid waste disposal requirements. Director Henry also recognized the challenge toState regulatory authorities to develop appropriate strategies for integrating the concerns of State solid wasteprograms with SMCRA programs regarding CCB disposal on permitted coal mine sites. That challenge is also sharedby OSM to the extent that we are the regulatory authority on Indian lands and in States with Federal programs.
The BHP Navajo Mine
Coincident with the first CCB Forum in 1996, BHP Navajo Coal Company informed OSM’s Western RegionalCoordinating Center (WRCC) of its intent to expand ongoing CCB disposal operations at the Navajo Mine ontolands regulated under the Indian lands permanent program. Facing a forthcoming permitting action for CCBdisposal, we embarked on developing guidance for permitting and regulating disposal operations at active minesunder the Indian lands program. The resulting WRCC guidance document is the subject of this presentation.
WRCC is currently completing the technical review of BHP’s permit revision application to dispose of CCBs onpermanent program lands at the Navajo Mine. The public comment period ends on May 30. BHP has beendisposing CCBs at the Navajo Mine since 1971 under 1968 authorizations by the Navajo Nation and Secretary of theInterior Udall, and subsequently by OSM in the mid-1980s under the Initial regulatory program. BHP disposes about1.9 million cubic yards annually and anticipates that disposal will increase to 2.6 million cubic yards per year after2004.

82
A Federal Program Guidance Document for Permitting Coal Combustion By-Products
Director Henry, at the 1996 forum, also noted the differing chemical and physical characteristics of CCBs, regionaldifferences of mine sites, and the differences in regulatory requirements among the States. Our research indeveloping WRCC’s guidance document certainly confirmed the broad differences between States (and on Indianlands) in the requirements and methods for regulating CCB disposal operations at coal mines. Accordingly, WRCC’sapproach to regulating CCB disposal should be regarded as but one of many approaches and one which we maymodify as we work through the process.
Objectives and Strategies
In developing WRCC’s guidance document, we identified five objectives for regulating CCB disposal under SMCRAand applicable solid waste disposal requirements, and then formulated strategies to achieve those objectives.
Objective 1
CCB disposal operations will not cause a violation of, or create a variance from, the reclamation and environmentalprotection performance standards of SMCRA and the applicable SMCRA regulatory program.
Strategy 1.1. CCB disposal operations should comply with the backfilling and grading performance standardsat 30 CFR § 816.102. CCB disposal is usually conducted with the backfilling activities and is handled in thesame manner as spoil. Therefore, the backfilling and grading performance standards should be applicableto the CCB disposal operations, except as noted below in Strategies 1.2 and 1.3.
Strategy 1.2. The final surface configuration of the mined-out area where CCBs are disposed should achieve theapproximate original contour (AOC) in accordance with 30 CFR § 816.102(a), and the AOC variances allowedat 30 CFR § 816.102(k)(3)(ii), 785.16 and 816.133(d) and the thick overburden AOC exemption allowed at 30CFR § 816.102(k)(2) and 816.105 should not be applicable. CCB disposal operations should not be allowed inareas where AOC could not be achieved. The additional volume of CCBs, imported into the coal mine from anoutside source, should not cause any variance or exemption from the AOC requirements.
Strategy 1.3. CCBs should not be disposed in mined-out areas if spoil would be displaced and disposed as excessspoil. CCB disposal should be allowed only where disposal capacity would be available after all spoil is returned tothe mined-out area. CCBs should not displace spoil that otherwise would be returned to the mined-out area. Inaccordance with 30 CFR § 816.102(b), all spoil, except excess spoil, must be returned to the mined-out area. Excessspoil includes only that spoil that is not needed to restore AOC [48 FR 23358, May 24, 1983]. Excess spoil disposalareas should not be created, or enlarged, to provide capacity for disposal of CCBs. In a decision concerning thecreation of excess spoil, the IBLA noted, "There is nothing 'automatic' about the privilege to treat spoil as 'excess'."
Strategy 1.4. CCBs should be disposed in a controlled manner in designated disposal sites in the permit area inaccordance with 30 CFR § 816.89. CCBs are solid wastes that should be subject to the appropriate performancestandards for disposal of noncoal mine wastes at 30 CFR ' 816.89, which follow the solid waste disposal criteria of 40CFR Part 257.
Strategy 1.5. CCB disposal operations should be conducted to minimize disturbance to the hydrologic balancewithin the permit and adjacent areas, to prevent material damage to the hydrologic balance outside the permitarea, to assure the protection and replacement of water rights, and to support the approved postmining landuses. The potential for groundwater pollution is singularly the greatest environmental concern of CCB disposal atmine sites. CCB disposal should be subject to the hydrologic balance protection standards at 30 CFR ' 816.41.
Strategy 1.6. The timing of CCB disposal operations should be based on completion of all mining andreclamation operations in accordance with contemporaneous reclamation performance standards. CCB disposalas monofills in final pits and ramps could delay final reclamation for a considerable time (possibly many years)

83
depending on the disposal rate. The timing of disposal, backfilling, and final grading of CCB disposal areas shouldbe clearly identified in the permit application and considered in the permitting decision.
Objective 2
CCB disposal operations must conform to applicable State, Tribal, or local solid waste disposal laws andregulations, in addition to SMCRA and the SMCRA regulatory program.
Strategy 2.1. The permit application should describe the steps that have been taken to comply with applicableFederal, State, and Tribal solid waste disposal laws and regulations.Under 30 CFR ' 780.18(b)(9), the permit application must contain a description of the steps to be taken to complywith the requirements of applicable air and water quality laws and regulations and health and safety standards.
Strategy 2.2. OSM should consult with State, Tribal, and local solid waste regulatory authorities to ensure thatCCB disposal operations conform to State, Tribal, or local laws and regulations governing solid waste disposaland to coordinate the review and issuance of permits. Section 504(h) of SMCRA requires coordination of thereview and issuance of permits with other Federal, State, or Tribal permit process as applicable to the proposedoperation. Section 702 of SMCRA precludes it from superseding, amending, modifying, or repealing the Solid WasteDisposal Act and other environmental statutes and rules or regulations promulgated thereunder. Therefore,consultation with the solid waste regulatory authority is appropriate.
Objective 3
CCB disposal operations must be approved in a SMCRA permit application in conformance with the permittingrequirements of the applicable SMCRA regulatory program before the disposal operations may begin.
Strategy 3.1. Any permit revision application proposing CCB disposal is a significant permit revision subject tothe notice, public participation, and notice of decision requirements of 30 CFR § 773.13, 773.19(b)(1) and (3),and 778.21. Federal, State, Tribal, and local agencies and the public should be notified of any revision thatproposes CCB disposal operations. Public interest in the location and methods of solid waste disposal is almostalways high, and the agency notifications required at 30 CFR ' 773.13(a)(3) also support Objective 2, above.
Strategy 3.2. The permit application or permit revision application should contain applicable informationrequired for an alternative land use at 30 CFR § 780.23(b). Although CCB disposal operations conductedconcurrently with surface coal mining and reclamation operations would not require a postmining land use changepursuant to 30 CFR ' 816.133(c), the disposal operations would be an additional joint land use with the coal miningand reclamation operations. Similar to the postmining land use discussion required by 30 CFR ' 780.23(b), the permitapplication should include a specific discussion of (1) the utility and capability of the land where CCBs are disposedto support a variety of alternative uses, (2) the relationship of the proposed CCB disposal operations to existing landuse policies and plans, and (3) the consideration which has been given to making all of the proposed CCB disposalactivities consistent with surface owner plans and applicable State and local land use plans and programs. Thedescription should be accompanied by a copy of the comments concerning the proposed CCB disposal operationsby the legal or equitable owners of record of the surface of the land where CCB disposal would occur, and the State,Tribal, and local government agencies which would have to approve or authorize the solid waste disposaloperations.
Strategy 3.3. The permit application should contain, for each area where CCBs would be disposed, a copy of thewritten consent of the surface owner for CCB disposal; a copy of the conveyance that expressly grants or reservesthe right to dispose of CCBs; or if the conveyance does not expressly grant the right to dispose of CCBs,documentation that under applicable State or Tribal law, the applicant has the legal authority to dispose ofCCBs. In conformance with the purpose of SMCRA at Section 102(b) to assure that the rights of surface landownersare fully protected, the applicant must demonstrate "right-of-entry" for CCB disposal operations.

84
Strategy 3.4. CCB disposal sites should be specifically designated, described, and identified on a map. Under 30CFR§816.89(a), noncoal mine wastes (i.e., solid wastes) must be placed in a designated portion of the permit area (seethe discussion for Strategy 1.4). The requirements for maps and plans at 30 CFR§780.14(b)(8) and (11) require thatwaste disposal facilities be shown on a map.
Strategy 3.5. A CCB disposal plan should be included in the Reclamation and Operation Plan required under30 CFR Part 780. CCB disposal operations would be an integral part of the surface coal mining and reclamationoperations approved in the permit application, and a CCB disposal plan should be included in the permit application. The backfilling and grading performance standards should be used for evaluating the proposed CCB disposal plan. The plan should:
• Identify the source and components (e.g., fly ash, bottom ash, scrubber sludge) of the CCBs.• Describe the physical and chemical properties of the CCBs.• Include data and analysis used to determine the physical and chemical properties of CCBs, cover
requirements, and, if needed, treatment or encapsulation requirements for the disposal of the CCBs.• Identify and describe the location of designated CCB disposal areas, the volume and disposal rate of CCBs
in each area, and the anticipated or actual starting and ending dates of disposal activities in eachdesignated disposal area.
• Describe the plans and procedures to transport, handle, place, treat, if necessary, and bury CCBs. Theplans and procedures should include the routes, methods and equipment to be used to transport the CCBson the mine site; the method of placement; any special handling procedures to be employed (e.g., mixingwith spoil, cell construction practices); the depth of cover to be placed over the buried CCBs; the type,amount, and source of the nontoxic and noncombustible materials that would be used to cover and, ifapplicable, encapsulate, or isolate, the materials; and the methods and specifications for treating thematerials, if applicable.
• Describe how the disposal measures to be employed would effectively avoid acid or toxic drainage, controlthe impact on surface water and groundwater, and minimize adverse effects on plant growth and thepostmining land use.
• Describe the effect of CCB disposal on achieving the approximate original contour.• Describe the timing and schedule of CCB disposal, backfilling, and final grading of CCB disposal areas.
Include the names of persons or organizations that collected and analyzed the data and informationcontained in the disposal plan, the dates of the collection and analysis, and description of the methodologyused to collect and analyze the information.
Strategy 3.6. The fugitive dust control practices in the air pollution control plan should specifically address theCCB disposal operations, including fugitive dust control during transport and placement of the CCBs within thepermit area. Fly ash, usually the major component of CCBs, is very powdery and very susceptible to wind erosion.
Strategy 3.7. The probable hydrologic consequences analysis and hydrologic reclamation plan in the permitapplication, and the Cumulative Hydrologic Impact Assessment prepared by OSM, should specifically addressthe CCB disposal operations, including the probability of adverse impacts on the hydrologic balance,contamination of surface or groundwater supplies, and the time for manifestation of impacts to surface orgroundwater supplies. The probable hydrologic consequences analysis contained in the permit application shouldspecifically address the CCB disposal operations. Groundwater monitoring plans should specifically analyze andassess monitoring needs around CCB disposal areas and consider the length of time for the manifestation of anyeffects of disposed CCBs on groundwater resources. CCBs should be regularly sampled and tested throughout thedisposal period to assure consistency with the materials tested for permit issuance and plan approval.
Objective 4
CCB disposal operations will be conducted only as described in the approved permit application and in accordancewith the applicable performance standards.
85
Strategy 4.1. CCB disposal operations should be inspected and enforced by OSM in accordance with theinspection and enforcement provisions of the applicable regulatory program and 30 CFR Parts 842 through846. OSM inspectors should inspect the CCB disposal operations as an integral part of the surface coal mining andreclamation operations to ensure they are conducted only as described in the approved permit application and inaccordance with applicable performance standards of SMCRA and the applicable SMCRA regulatory program.
Inspectors should understand and be aware of the disposal and reclamation requirements for CCB disposal areas,requirements for periodic sampling and testing of the CCBs, materials handling and compaction requirements, anddisposal locations and elevations (depths) which may be critical. OSM inspectors should be trained specifically inthe potential environmental, health and safety hazards and special environmental considerations of CCBs and CCBdisposal operations. Some CCBs can contain high levels of toxic substances. Some CCBs can be so highly alkalinethat they cause caustic burns.
Objective 5
CCB disposal areas will be fully reclaimed in accordance with the applicable performance standards and theapproved permit application.
Strategy 5.1. The evaluation of any phase I, II, or III bond release application involving a CCB disposal area,including the determination of the amount of bond to be released, should consider whether pollution of surface andsubsurface water is occurring, the probability of future occurrence of such pollution, and the estimated cost ofabating such pollution. The bond release requirements at 30 CFR § 800.40(b)(1) require evaluation of "whetherpollution of surface and subsurface water is occurring, the probability of future occurrence of such pollution, andthe estimated cost of abating such pollution." The period of liability provisions at 30 CFR § 800.13 are basedprimarily on achievement of successful revegetation, although 30 CFR § 800.13(a) also adds "or until achievement ofthe reclamation requirements of the Act, regulatory programs, and permit, whichever is later." Similarly, the Phase IIbond release criteria at 30 CFR § 800.40(c)(2) are concerned principally with the establishment of vegetation capableof controlling erosion. Groundwater pollution, which potentially could result from CCB disposal, could take morethan twenty years to manifest itself in some groundwater systems.
______________________________1Richard Holbrook is the manager of the Southwest Program Operations Branch of the U.S. Office of SurfaceMining’s Western Regional Coordinating Center. Mr. Holbrook received a B.A. degree in Environmental Biologyfrom the University of California at Santa Barbara in 1972. During his 15 years with OSM, he has been involved inFederal lands program activities in the western States and permitting activities under the Indian Lands Program andWashington and California Federal programs. He has authored numerous permitting guidance documents used inOSM’s Western Region, including the guidance for the disposal of coal combustion by-products at coal mines onIndian lands and in States with Federal programs. Before joining OSM, Mr. Holbrook was the Environmental QualityControl Supervisor for Consolidation Coal Company’s Western Region, and was the Director of the EnvironmentalSciences Division of VTN Colorado, an environmental consulting firm.

86

87
A COMPARISON OF STATE LEGAL APPROACHES TO CCB REUSE
Christina L. Archer1
Howard and Howard Attorneys, P.C.Peoria, Illinois
Abstract
From the viewpoint of an attorney, this paper will analyze the status of reuse of CCBs in the United States anddescribe construction, manufacturing, engineering, and agricultural reuse applications; other barriers to reuse; andcompetitive market drivers of CCB reuse. In addition, the paper will summarize the Federal laws applicable to CCBs:Resource Conservation and Recovery Act (RCRA) including a description of Subtitle C (hazardous waste) andSubtitle D (solid waste); history of Subtitle C exemption for CCBs including the Bevill Exemption – temporaryexemption of CCBs from Subtitle C; the 1988 EPA study on CCBs, Bull Run Coalition v. EPA – litigation seekingpermanent rule on CCB waste status; the Final rule that CCBs will not be regulated under Subtitle C – September 2,1993; and remaining open issues including mixed wastes and remaining wastes. In addition, State laws and rulesregulating CCBs will be evaluated.
Federal Regulation of CCBs
CCBs are regulated at the Federal level under the Resource Conservation and Recovery Act. Subtitle C of RCRAregulates hazardous wastes and Subtitle D regulates solid wastes that are then subject to State law.
A brief history of the Bevill exemption of fly ash, bottom ash, boiler slag, and flue gas desulfurization materials fromregulation under Subtitle C of RCRA shows the following:
12/1978 EPA proposed a rule to implement Subtitle C of RCRA. EPA proposed a limited set of regulations formanagement of certain large volume fossil fuel wastes.
10/1980 Congress passed the Solid Waste Disposal Act Amendments. It temporarily exempted fromregulation under Subtitle C certain large volume fossil fuel wastes. Congress directed EPA to conducta detailed and comprehensive study of fossil fuel wastes based on 8 study factors. Congress furtherdirected that, within 6 months of filling the report, EPA must decide whether regulation under SubtitleC is warranted.
1984 RCRA is amended giving EPA the flexibility to promulgate regulations under Subtitle C thatconsidered the unique characteristics of Fossil Fuel Combustion Wastes (FFW) and modify the SolidWaste requirements to account for special characteristics as long as health and the environment wereprotected.
2/1988 EPA submits its report to Congress. EPA failed to publish the regulatory determination as required byCongress and was sued by Bull Run Coalition (an Oregon Citizen’s Group) with Edison ElectricInstitute intervening as plaintiffs.
6/30/1992 EPA enters a consent decree that establishes a schedule to complete the determination. The decreeestablishes two categories with separate schedules: (1) the 4 large volume wastes, and (2) allremaining wastes. August 2, 1993 was the deadline for the large volume wastes and April 1, 1998 forall remaining wastes.
8/9/1993 EPA makes a regulatory determination that the 4 large volume FFWs do not warrant regulation underSubtitle C. EPA commits to a schedule to complete the report to Congress for the mixed fuels andremaining low volume wastes by March 31, 1999 and issue a regulatory determination by October 1,1999.

88
3/31/1999 EPA submits a report to Congress on remaining wastes indicating that regulation under Subtitle C willnot be warranted. EPA states, however, “The agency has insufficient information on managing FFWin surface and underground mines in order to assess the potential for risks associated with thispractice, whether for disposal or beneficial uses such as mine reclamation.
2/10/2000 EPA conducts interagency briefing under OMB with OSM, USDA, and DOE.
3/6/2000 EPA provides a 91 page draft revision of findings that would no long exempt CCBs from Subtitle C fordisposal or mine filling.
3/10/2000 Court approves extension of deadline for EPA determination to April 10, 2000.
4/10/2000 EPA provides a draft proposed decision that departs from its findings under its March 31 Report toCongress. In this proposal, mine filling is not exempted as a beneficial use (active or inactive). Forland disposal or mine filling, even large volume wastes could be subject to Subtitle C regulationunless managed properly.
State Regulation of CCBs
Currently, under Subtitle D of RCRA, States may regulate CCBs. There are several ways that States may choose toapproach this regulation. In order to illustrate the range of State approaches, I have chosen to look at just a fewStates in detail. One of the first things you need to look at in detail is how each State actually defines the specificcoal combustion wastes it regulates. There was a lot of State regulatory activity concerning CCBs in the 1990s. I amlooking forward with interest on how the States will respond to this new Federal regulatory determination on thesubject.
States may regulate CCBs as a solid waste, on a case by case basis as hazardous waste, or as a special waste. Theways a State may do this is by statute, by generic reuse or specific reuse regulations, or by guidance and/or policy. States vary widely in how this is done. Specifically with mine applications, there are seven States that I am aware ofthat expressly allow by statute mine applications. There may be more States that allow this on a case by case basis. Those States that authorize mine application by law are:
• Illinois• Indiana• Kentucky• Ohio• Oklahoma• Pennsylvania• Virginia.
At this point, I will focus on Illinois since it is the State I am most familiar with. It is an interesting program in that ithas two classifications of waste, coal combustion waste and coal combustion by-products. In Illinois, it is preferableto be classified as a coal combustion by-product. Illinois defines coal combustion waste as:
• fly ash, bottom ash, boiler slag, flue gas desulfurization material, fluidized bed combustion material; or • coal ash combusted with fuel grade petroleum coke, other fossil fuel, both fuel grade petroleum coke and
other fossil fuel; or • fuel grade petroleum coke, other fossil fuel, or both fuel grade petroleum coke and other fossil fuel in
combination with no more than 20 percent tire derived fuel or wood or other materials.
Coal combustion by-products are defined in Illinois as coal combustion wastes that:
• meet specified analytical requirements (a leach test that meets a class one groundwater standard); and• are reused in specified applications.

89
Allowable CCB reuse applications in Illinois include:
• extraction/recovery of materials and compounds;• cement and concrete;• roof shingles (asphalt/cement);• Illinois Department of Transportation approved applications;• anti-skid material, athletic tracks, foot paths (bottom ash);• pavement base, pipe bedding, foundation backfill;• structural fill; and• mine subsidence, mine fire control, mine sealing, and mine reclamation.
Allowable mining applications for coal combustion wastes in the State of Illinois must be associated with coal sales. Coal sales may not exceed 35 percent without Illinois Department of Mines and Minerals approval. There are no coalsales restrictions for CCBs.
In Kentucky, allowable reuse includes:
• ingredient in product;• cement, concrete, paint, plastics;• anti-skid material;• structural fill;• blasting grit;• roofing granules; and• disposal in active mining operation if allowed by permit (specific requirements apply).
In Ohio, regulation of CCBs is by policy rather than by statute. Allowable reuse includes:
• ingredient in product;• stabilization agent;• as part of a composting process;• extraction/recovery of materials and compounds;• anti-skid/road preparation material;• mine subsidence stabilization, mine fire control, and mine sealing with Ohio Department of Natural
Resources approval;• additive in commercial soil blending operations;• landfill daily cover;• structural fill;• pipe bedding;• road/parking lot material; and• beneficial uses less than 200 tons.
In Pennsylvania, allowable reuse applications by statute include:
• structural fill;• soil substitute/additive;• active mine reclamation;• abandoned coal or industrial mine;• concrete;• extraction/recovery of materials and compounds;• anti-skid/road preparation material;• ingredient in product;• mine subsidence, mine fire control, and mine sealing;• drainage material or pipe bedding; and• stabilized product.

90
In Virginia, allowable reuse applications by statute include:
• mine reclamation/mine refuse disposal;• soil nutrient additive;• anti-skid/road surface material;• structural fill; and• extraction/recovery of materials and compounds.
The following States expressly allow CCB reuse by statute but do not specifically mention mine applications:
• Alaska• Colorado• Iowa• Maine• Maryland• Massachusetts• Michigan• Missouri• Nebraska• New Hampshire• New Jersey• New York• North Carolina• Tennessee• Texas• Utah• West Virginia• Wisconsin
A case in point is Iowa. Iowa does not specifically allow mine filling as a reuse; however, it does allow “similarcementitious use.” My law firm was involved with obtaining approval for a very large mine filling application in Iowaunder that language. Massachusetts, Utah, and Nebraska have a similar provision under “other approvedcommercial or industrial purposes.”
States that allow reuse of CCBs in concrete applications by statute include:
• Indiana• Iowa• Kentucky• Massachusetts• Michigan• North Carolina• Ohio• Pennsylvania• South Carolina• Virginia• West Virginia
States that allow reuse of CCBs as aggregate include:
• Massachusetts• Michigan

91
• New York• North Carolina• Pennsylvania• South Carolina
• West Virginia• Virginia
States that allow reuse of CCBs as structural or flowable fill include:
• Indiana• Kentucky• Massachusetts• Michigan• New York• North Carolina• Pennsylvania• South Carolina• Virginia• West Virginia
States that allow reuse of CCBs as anti-skid materials include:
• Indiana• Kentucky• New York• North Carolina• Pennsylvania• Virginia• West Virginia
States that allow reuse of CCBs as road base include:
• Indiana• Iowa• Kentucky• Massachusetts• Michigan• North Carolina• Ohio• Pennsylvania• South Carolina• Virginia• West Virginia
In conclusion, most of the States allow beneficial reuse either by stature or by policy.
______________________________1Christina L. Archer specializes in environmental law, with an emphasis on air pollution-related matters, including compliance counseling and State and Federal litigation. She is a former assistantcounsel of both the Bureau of Air Regulatory and Enforcement units of the Illinois Environmental Protection Agency and has practiced in front of both the Illinois Pollution Control Board and the U.S. EnvironmentalProtection Agency’s Environmental Appeals Board. Ms. Archer graduated from the University of Illinois at Urbana-Champaign with two B.A. degrees (Political Science and Sociology) in 1990 and received a J.D. degreefrom Southern Illinois University School of Law in 1993. Based in the Peoria office of Howard and Howard Attorneys, Ms. Archer is admitted to practice in the State of Illinois and the U.S. District Courts for theCentral and Southern Districts of Illinois. She is a member of the Peoria County Bar, the Central Illinois Women

92

Session 3
Beneficial Uses at the Mine Site
Session Chairperson: Scott Renninger
National Energy Technology Laboratory U. S. Department of Energy Morgantown, West Virginia
Development and Demonstration of CCB Based Structural Products for Mine Use Yoginder P. Chugh, Department of Mining and Mineral Resources Engineering, Southern Illinois University, Carbondale, Illinois Backfilling of Highwalls for Improved Coal Recovery Robert Rathbone, Center for Applied Energy Research, University of Kentucky, Lexington, Kentucky Grout Injection into an Underground Coal Mine to Control Acid Mine Drainage and Subsidence D. Courtney Black, National Mine Land Reclamation Center, West Virginia University, Morgantown, West Virginia Beneficial Uses of Clean Coal Combustion By-Products: Soil Amendment and Coal Refuse Treatment Examples and Case Studies Warren Dick, School of Natural Resources, The Ohio State University, Wooster, Ohio Underground Placement of Coal Processing Waste and Coal Combustion By-Products Based Paste Backfill for Enhanced Mining Economics Yoginder P. Chugh, Department of Mining and Mineral Resources Engineering, Southern Illinois University, Carbondale, Illinois Re-mining with CCBs at the Broken Aro Demonstration Site Ben J. Stuart, Department of Civil Engineering, Ohio University, Athens, Ohio

95
DEVELOPMENT AND DEMONSTRATION OF CCB BASED STRUCTURAL PRODUCTS FOR MINE USE
Y. P. Chugh1, M. Prichard, D. Deb, and H. Wilcox
Department of Mining and Mineral Resources Engineering Southern Illinois University (SIUC)
Carbondale, Illinois
Abstract Environmental considerations, resulting from the disposal of coal combustion by-products (CCBs) and the impacts of deforestation associated with the harvesting of timber for utilization as roof supports in mines, should become more severe in the future as landfill space and suitable timber reserves become more scarce. To help address these concerns, lightweight, artificial supports such as post and crib elements, utilizing large percentages of coal combustion by-products as aggregate, have been developed for use in underground mines. These structural products show equal or better engineering characteristics as timber and have the potential to replace timber support in underground mines. CCBs -based ultra-light structural material (ULSM) also has been developed and commercialized for utilization in construction of ventilation stoppings in underground mines. The bulk density of these blocks are in the range of 25 to 40 pounds per cubic foot (pfc) with over 75% CCBs. Efforts are also given to develop and demonstrate large volume CCPs based sub-grade improvement technique for road construction. Soil treated with SIUC fluidized bed combustion (FBC) fly ash developed an immediate bearing value exceeding 25%, with swelling strain less than 1%, over untreated soils and met Illinois Department of Transportation (IDOT) standard specifications. In this paper, development procedures, engineering characteristics, and beneficial use of CCBs -based structural products are given.
Introduction Over the past five (5) years or so, the Department of Mining and Mineral Resources Engineering at Southern Illinois University (SIU) has been developing CCBs -based structural products for use in mines. It was thought this would provide the mining industry with better and more uniform quality structural materials throughout the year, reduce deforestation, and allow for the return of CCBs underground. The replacement of wooden cribs and posts was identified as a high priority based on input from the mining industry. Later, the replacement of currently used ventilation blocks (cinder, concrete, Omega, etc.) by lightweight or ultra-lightweight CCBs -based blocks and fill materials were included for development. It was estimated that utilizing these materials in Illinois Basin coal mines would consume about 40,000 – 50,000 tons of fly ash annually. Research into the utilization of CCBs was divided into two classifications, fill materials and lightweight structural materials. Fill materials developed at SIUC include paste backfill mixtures for underground mine excavations, as well as flowable fills and sub-base stabilizers for the construction industry. Structural materials include ventilation blocks as well as posts and crib elements, the demonstration of which will be the main focus of this paper. Structural materials consisted of lightweight (85-95 pcf) support members and ultra-lightweight (30-40 pcf) ventilation blocks. The lightweight support members consist of 5-inch × 5-inch × 36-inch crib elements at 85 pcf and 6-inch × 6-inch × 96-inch posts at 95 pcf, while the ventilation blocks are 8-inch × 12-inch × 16-inches in size at about 30 pcf.

96
Review of Pertinent Literature Fly Ash Types and Usage Fly ash is the fine by-product of coal combustion that exits from the top of the boiler with the combustion gases and is classified as Class C or Class F by the American Society for Testing and Materials (1994). Class C fly ash is produced from burning western bituminous coal, subbituminous coal, or lignite, while Class F fly ash is produced from burning anthracite coal or eastern bituminous coal. These classes differ mainly in the level of calcium oxide (CaO) present in the ash. Typically, Class F fly ash will contain less than 10% CaO, while Class C fly ash will often contain levels of CaO from 15 to 35% (Wei, Naik, and Golden, 1994). Over the last several years, interest has been shown in developing new uses for fly ash. These include fill material for mine reclamation (Kim and Cardone, 1997), subsidence control (Chugh et al., 1996), and lightweight, artificial, supports suitable as substitutes for wood products in mines (Chugh et al., 1997). Characteristics of Wooden Supports Wood is the traditional material utilized for supplemental roof support in underground mines. It is easy to work with and, until recently, has been in abundant supply and reasonably priced. Wooden support members are relatively lightweight, easily trimmed to length, and fairly durable. Wood, however, has many disadvantages as a structural member. As a naturally occurring material it is subject to wide variances in strength and density, and is subject to seasonal fluctuations in supply. Wood also absorbs moisture and is subject to decay. Because it is a natural product, wood is subject to considerable variance in strength characteristics. Soft spots, knots, moisture content, and voids within the wood will all cause the wood to be weaker than anticipated. For instance, Yu (1987) indicated drops in strength of up to 50% from a two-inch knot for a given specimen. A section of wood may appear to be free of defects to the naked eye, but may include one, or all, of the aforementioned defects. The strength characteristics of wood are unidirectional; wood products are much stronger when loaded axially, with the grain, instead of 90o to the grain. Biron and Arioglu (1983) reported maximum safe stresses for Class I Oak at about 1,700 psi parallel to the grain (post configuration), and about 425 psi perpendicular to the grain (crib configuration). Yu (1987), and Biron and Arioglu, (1983) identified the moisture content of wood as a major limiting factor on the strength of wood products. In general, as the moisture content of the wood increases, the strength of the wood decreases. For pine, crushing strength decreases about 82% as the moisture content increases from 0% to 50%. This is a significant reduction in strength and will affect the performance of wood when utilized as post or crib members, especially within the humid environment of a mine. Concrete Supports – Previous Attempts and Results Anderson and Smelser (1980) investigated the effectiveness of steel-fiber-reinforced concrete (SFRC) crib supports and found them to be significant improvements over their wooden counterparts. Tests of open, SFRC cribs (30-inch × 30-inch) averaged 2373 pounds per square inch (psi) in compressive strength with an elastic modulus of 0.68×10⁶ psi, while wooden cribs of the same configuration averaged 811 psi compressive strength with an elastic modulus of 24.5×10³ psi. A series of field demonstrations conducted by Smelser and Henton (1983) at seven coal mines and one trona mine demonstrated that SFRC supports were a technically superior and potentially cost effective alternative to wood supports in mines. In all but one of the demonstrations, the supports were used as a direct replacement for wooden supports in the tailgate entries of active longwall panels at mines. Smelser and Henton concluded that it was technologically and economically feasible to utilize these supports as substitutes for wood cribbing; however, the configuration and dimensions of full-size cribs constructed of these materials affect their ultimate compressive strength and “after-failure toughness.”

97
They determined that supports with solid, smaller cross-sections with fewer joints have the highest strength per unit area with the greatest post-failure “toughness.”
Development of Structural Materials Advantages of Engineered Supports vs. Wood CCBs -based artificial supports have several advantages over their wooden counterparts. Specifically, CCBs -based supports are much stronger and stiffer than wood products; they are dimensionally stable, will not decay or absorb water, and will not burn. In addition, these artificial supports can be excavated with today’s mining machinery, unlike wood, which shreds and becomes wrapped around the cutter head. Performance Advantages of CCBs -Based Artificial Supports Figure 1 illustrates the relative performance of 8-inch × 8-inch × 24-inch wooden posts and 6-inch × 6-inch × 24-inch CCBs -based posts, tested axially, while Figure 2 illustrates the relative performance of wooden and CCBs -based cribs. The CCBs -based posts averaged about 3,000 psi in compressive strength while the wooden posts averaged about 2,300 psi with average elastic modulus of 450,000 psi and 160,000 psi respectively. This demonstrates an improvement of about 30% in unconfined compressive strength and 180% in the elastic modulus. However, the wooden posts demonstrated plastic post-failure characteristics while the CCBs -based posts demonstrated strain-softening post-failure characteristics. The residual strength of the CCBs -based posts, about 40-50% of the compressive strength, was supplied by the reinforcing fibers utilized in the mix. A comparison of the performance of the crib members, tested in a crib configuration, shows even greater improvements. The artificial cribs averaged 2,400 psi in compressive strength while the wooden crib yielded a compressive strength of around 900 psi. The elastic modulus of the CCBs -based cribs averaged about 300,000 psi while the wooden crib demonstrated an elastic modulus of only about 17,000 psi. This shows an improvement of about 167% in compressive strength and a 1,665% improvement in the elastic modulus.
Figure 1. Load-Deformation Characteristics of Wooden and CCBs -Based Posts (Chugh et al, 1997).
Figure 2. Load-Deformation Characteristics of 2 × 2 Cribs (Chugh et. al, 1997).
Other Advantages of CCBs -Based Artificial Supports The use of CCBs -based art ificial supports in place of wooden supports would help address the problems of deforestation, and seasonal fluctuations in the supplies and cost of supports, as well as disposal of CCBs. In addition, the use of these supports would enhance worker safety, since CCBs -based supports are

98
substantially stronger and stiffer than wooden supports, are not effected by moisture, and are incombustible. Since the moisture content of wood adversely affects its strength, wood gradually becomes less effective as a support over time in a humid mine environment. A replacement for wood that shows good time-dependent strength characteristics will enhance safety by providing superior long-term roof support. Wood not only degrades over time, it is dimensionally unstable; it is subject to shrinkage, and supports constructed of wooden materials require periodic retightening to provide an acceptable level of support. Supports manufactured from CCBs -based materials are dimensionally stable; they will not shrink (or swell) over time; they do not absorb moisture and will not decay. An additional benefit of CCBs -based supports is they will not burn. Composed of about 70% fly ash and 30% binding agents, the finished products are incapable of supporting combustion. Potential for Utilization It has been estimated that the substitution of CCBs -based post and crib members in lieu of wood could utilize about 0.25×10⁶ tons of coal combustion by-products in the Illinois Basin alone (Chugh, et. al., 1996). This would amount to about 2.5×10⁶ tons nationwide, an amount that could double if the materials were utilized in non-coal operations as well. The utilization of CCBs -based artificial supports in place of wooden supports will help address the problems of deforestation, seasonal fluctuations in supplies of supports, non-uniform support quality, and disposal of CCBs and associated environmental problems.
Prototype Fabrication and Field Demonstration Studies Development of Facilities for Production of Prototype Supports Laboratory studies resulted in mix development for lightweight CCBs -based structural materials in the 75-105 pcf density range. The mixes typically consisted of about 70% F-fly ash, binders, and appropriate fibers (Chugh, et. al, 1998). Experience gained in the production of laboratory sized specimens was used in assembling a facility for producing full-sized prototype post and crib elements. The facility consisted of a large mixer, mold preparation/handling operations, curing equipment, and finished product storage. The posts and crib members produced in this facility were utilized in two (2) field demonstrations to test the viability of CCBs -based artificial supports in a mine environment. Experience gleaned from the assembly and use of the prototype facility was utilized in the design of a full-size pilot scale facility. Fabrication of the prototype, CCBs -based artificial supports began during August 1996 and concluded in May of the following year. Approximately 230 crib members (5 inch × 5 inch × 30 inch) and 20 posts (6 inch × 6 inch × 96 inch) were produced at the facilities for use in two field demonstrations and for characterization testing. Support Characterization Engineering properties of the crib elements were obtained utilizing a 600,000 lb. MTS stiff testing machine. Testing of the posts was conducted utilizing a large-scale testing machine, designed by the department staff, located at the research facilities of the Illinois Clean Coal Institute at Carterville, IL. This machine has a capacity of 400,000 lb. and can test specimens up to 7 ft. in length. Characterization of specimens was accomplished by determining the unconfined compressive strength and elastic modulus as a function of density. Crib members were trimmed to a length of 24 inches and tested in the MTS stiff testing machine under a constant rate of loading, approximately 3000 lb./minute. Posts were trimmed to a length of 7 feet and tested in the full sized testing machine. Poisson’s ratio was determined for the crib elements utilizing d ial gages setting in the longitudinal direction.

99
Figure 3 shows the relationship between the unconfined strength, Co, and the density, ρ, where Co (cribs) = 142.76e0.0304ρ , R2 (cribs) = 0.8207, and Co (posts) = 364.98e0.0134ρ , R2 (posts) = 0.9341, N (cribs) = 19 and N (posts) = 3. A total of twenty-eight (28) crib elements, 5-inches × 5-inches × 24-inches in size, and four (4) posts, 6-inches × 6-inches × 72-inches in size were tested. Figure 4 shows the relationship between the elastic modulus, E, and the density, ρ, where E (cribs) = 0.5206e0.0249ρ , R2 = 0.4724, and E (posts) = 0.7142e0.035ρ , R2 = 0.7618 and N (cribs) = 19 and N (posts) = 4. A significant problem manifested itself during the manufacturing of the prototype supports. Of the twenty (20) posts manufactured, 10 broke immediately after removal from the curing tanks, six were sent underground at Old Ben #26 for the initial field demonstration, and four were set aside for characterization studies. Of the ten posts that were successfully produced, six eventually broke before utilization. The breakage problem was successfully addressed when the concept of a disposable mold, one that remains on the support after completion of the manufacturing process, was introduced. A mold that remains on the support would ensure that any micro-cracks formed during the curing process would not be able to propagate, provide a confining pressure for the CCBs -based structural material under load, and increase the post-failure load bearing capacity of the supports. Initial studies of CCBs -based supports cast into plastic pipe were very encouraging. The supports, both solid and solid core designs, exhibited performance characteristics very similar to wood products, as shown in Figure 5. Figure 6 shows a full size support utilizing a disposable mold of circular cross-section after failure. Old Ben Coal Field Demonstration The first field demonstration of the prototype CCBs -based post and crib elements took place at the Old Ben Coal Company Mine #26, located near Sesser, Illinois, during the months of November and December, 1996. Old Ben #26 was mining the Illinois #6 seam at a depth of about 600 feet with an immediate roof composed of approximately 30 feet of competent gray shale. The coal seam averaged 8 feet in thickness and roof conditions in this area were generally favorable.
Figure 3. Compressive Strength/Density Relationship.
Figure 4. Elastic Modulus/Density Relationship.
Variation of Compressive Strength with Density
C0 = 142.76e0.0304ρ
R2 = 0.8207, N = 19
C0 = 364.98e0.0134ρ
R2 = 0.9341
1000
1200
1400
1600
1800
2000
2200
2400
2600
2800
3000
75 80 85 90 95 100 105 110 115
Density (pcf)
Com
pres
sive
Stre
ngth
(psi)
Cribs
Posts
95% Confidence Interval
Variation of Elastic Modulus with Density
E = 0.7142e0.035ρ
R2 = 0.7618, N=4
E = 0.5206e0.0249 ρ
R2 = 0.4724, N = 19
0.00
5.00
10.00
15.00
20.00
25.00
30.00
35.00
40.00
75 80 85 90 95 100 105 110 115
Density (pcf)
Ela
stic
Mod
ulus
(x10
4 psi)
Cribs
Posts
95% Confidence Interval

100
Test Area and Instrumentation The posts and cribs were placed in the tailgate entry, illustrated in Figure 7, of the last longwall panel of the mine; Old Ben Mine #26 ceased operations after this panel was completed. Two cribs and three posts were erected and equipped with load cells designed at SIUC. However, the load data for two posts were unobtainable. Two wooden cribs and one wooden post were equipped with load cells as controls. The outbye wooden crib, located at station 893+00 was damaged during the test and its data was discarded.
Figure 5. Performance of CCBs-based supports cast into disposable molds.
Figure 6. Full size post cast into a disposable mold.
The load cells, developed as part of this study, are relatively inexpensive, accurate, and durable instruments for measuring dynamic loads in the field. They were designed to be disposable and easily assembled and consist of a 3 ½ inch × 3 ½ inch × 1 inch polyurethane wafer placed between two 7 ½ inch × 7 ½ inch × 1 inch steel plates. The lower plate has ¼ inch diameter holes at each corner where the compression of the wafer was to be measured by use of a bottoming micrometer. The load deformation curve for the polyurethane wafers was determined with the use of the 600,000 lb MTS stiff testing machine at SIUC. The load on each cell was determined by averaging the compression, or displacement, measured at each corner of the load cell. The equation describing the load characterization curve of the polyurethane wafers is Load = 2E+07 × Disp3 – 7E+06 × Disp2 + 1E+06 × Disp.
Figure 7. Old Ben #26 Fie ld Demonstration.
0
500
1000
1500
2000
2500
3000
3500
0 0.02 0.04 0.06 0.08 0.1 0.12 0.14 0.16 0.18
Stain (in/in)
Stre
ss (p
si)
6-inch Diameter, 101pcf
Field Demonstration #1 - Old Ben Coal Co. Mine 26
Face
LongwallPanel
Directionof
Mining
TailgateEntry
Gob
CCB Post
CCB Crib
Wood Post
Wood Crib
850+00
893+00
928+00
958+00951
+00
987+00
Legend: Chain Pillar

101
For the cribs, one of these load cells was placed at each corner during assembly, approximately halfway between the roof and the floor. For the posts, the load cells were placed between the top of the post and the existing wooden crossbar. Convergence points, consisting of ½-inch × 18-inch diameter pins driven into the mine floor beneath a roof bolt, were installed adjacent to each post and crib utilized in this demonstration. An extensometer was utilized for measuring the roof-to-floor convergence. Data Gathering and Analysis Initial measurements were taken on the load cells immediately after erection of the CCBs -based artificial supports with a second set of measurements taken 2 ½ weeks later. When the longwall face approached to within 200 feet of the inby support, load cell measurements were taken every shift until the face passed the last instrumented support. A bottoming-type micrometer was utilized to measure the compression of the load cells to the nearest 0.001 inch. Convergence measurements were taken with an extensometer to the nearest 0.01 inch. Mine #26 Demonstration Results The results of the Old Ben demonstration are shown in Figures 8 and 9. Figure 8 compares the performance of the wooden and CCBs -based cribs as load vs. deformation while Figure 9 compares the performance of the wooden and CCBs -based posts. Load values were obtained from measuring the compression of the polyurethane wafers of the load cells while the deformation values were obtained from the convergence stations. Worker reaction to the supports was very positive. The time and degree of difficulty in erection of the supports was no different than conventional wooden supports. This was due to the fact that the supports were similar in size and shape to the supports the labors were accustomed to.
Figure 8. Crib Performance at Old Ben Mine #26. Figure 9. Post Performance at Old Ben Mine #26. Costain Coal Co. – Pyro Mine Demonstration The second field demonstration of the CCBs -based artificial supports took place at the Pyro Mine of Costain Coal Co., located near Clay, Kentucky, during the month of June, 1997. For this demonstration, the supports were installed on the headgate of a new longwall panel. This mine is required to fully support all gate entries for ventilation requirements and a bleeder fan is used to provide ventilation to the longwall face; full support of the head and tailgate entries is mandatory for maintaining proper airflow.
Load Deformation Characteristics of Cribs
0
2000
4000
6000
8000
10000
12000
14000
16000
18000
0.0 0.1 0.2 0.3 0.4 0.5 0.6 0.7 0.8
Deformation (in.)
Load
(lb
s)
CCB Crib Outby CCB Crib Inby Wooden Crib Inby
Load Deformation Characteristics of Posts - Old Ben # 26
0
10000
20000
30000
40000
50000
60000
70000
0.0 0.2 0.4 0.6 0.8 1.0 1.2
Deformation (in.)
Lo
ad (
Lb
s)
CCB Post Towards Panel Wooden Post Towards Panel
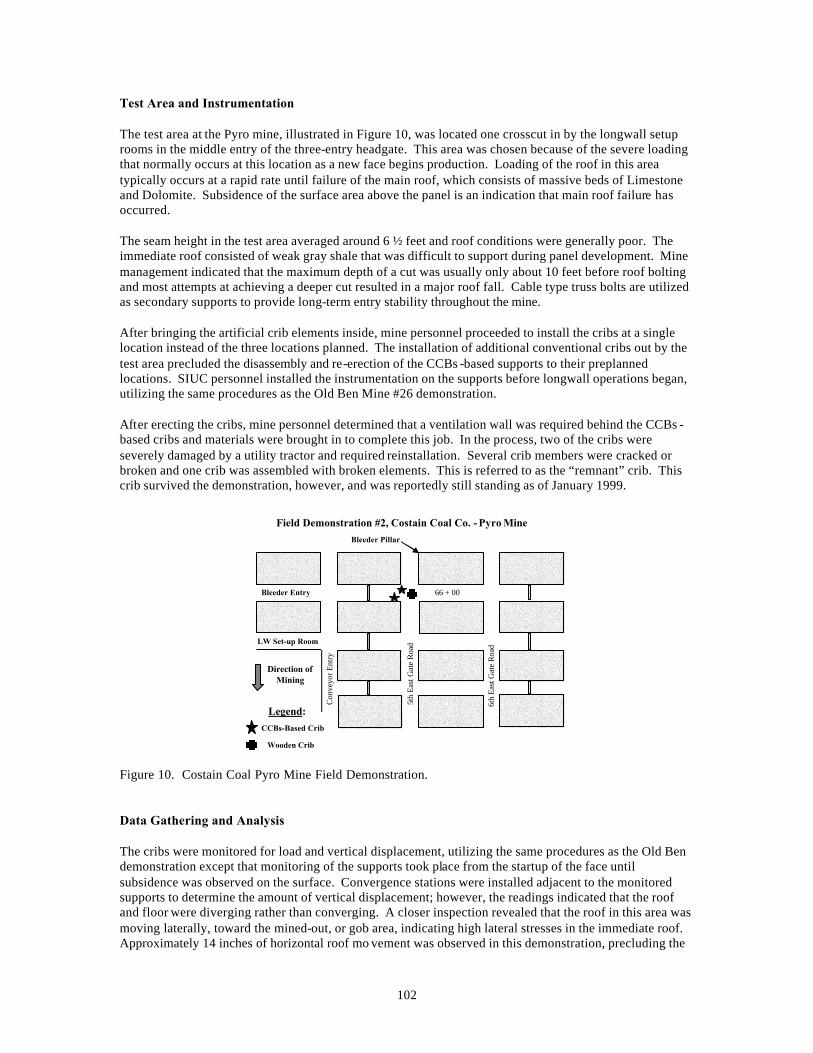
102
Test Area and Instrumentation The test area at the Pyro mine, illustrated in Figure 10, was located one crosscut in by the longwall setup rooms in the middle entry of the three-entry headgate. This area was chosen because of the severe loading that normally occurs at this location as a new face begins production. Loading of the roof in this area typically occurs at a rapid rate until failure of the main roof, which consists of massive beds of Limestone and Dolomite. Subsidence of the surface area above the panel is an indication that main roof failure has occurred. The seam height in the test area averaged around 6 ½ feet and roof conditions were generally poor. The immediate roof consisted of weak gray shale that was difficult to support during panel development. Mine management indicated that the maximum depth of a cut was usually only about 10 feet before roof bolting and most attempts at achieving a deeper cut resulted in a major roof fall. Cable type truss bolts are utilized as secondary supports to provide long-term entry stability throughout the mine. After bringing the artificial crib elements inside, mine personnel proceeded to install the cribs at a single location instead of the three locations planned. The installation of additional conventional cribs out by the test area precluded the disassembly and re-erection of the CCBs -based supports to their preplanned locations. SIUC personnel installed the instrumentation on the supports before longwall operations began, utilizing the same procedures as the Old Ben Mine #26 demonstration. After erecting the cribs, mine personnel determined that a ventilation wall was required behind the CCBs -based cribs and materials were brought in to complete this job. In the process, two of the cribs were severely damaged by a utility tractor and required reinstallation. Several crib members were cracked or broken and one crib was assembled with broken elements. This is referred to as the “remnant” crib. This crib survived the demonstration, however, and was reportedly still standing as of January 1999.
Figure 10. Costain Coal Pyro Mine Field Demonstration. Data Gathering and Analysis The cribs were monitored for load and vertical displacement, utilizing the same procedures as the Old Ben demonstration except that monitoring of the supports took place from the startup of the face until subsidence was observed on the surface. Convergence stations were installed adjacent to the monitored supports to determine the amount of vertical displacement; however, the readings indicated that the roof and floor were diverging rather than converging. A closer inspection revealed that the roof in this area was moving laterally, toward the mined-out, or gob area, indicating high lateral stresses in the immediate roof. Approximately 14 inches of horizontal roof mo vement was observed in this demonstration, precluding the
Field Demonstration #2, Costain Coal Co. - Pyro Mine
Direction ofMining
LW Set-up Room
CCBs-Based Crib
Wooden Crib
66 + 00
5th
East
Gat
e Ro
ad
Con
veyo
r Ent
ry
Legend:
Bleeder Entry
Bleeder Pillar
6th
East
Gat
e R
oad
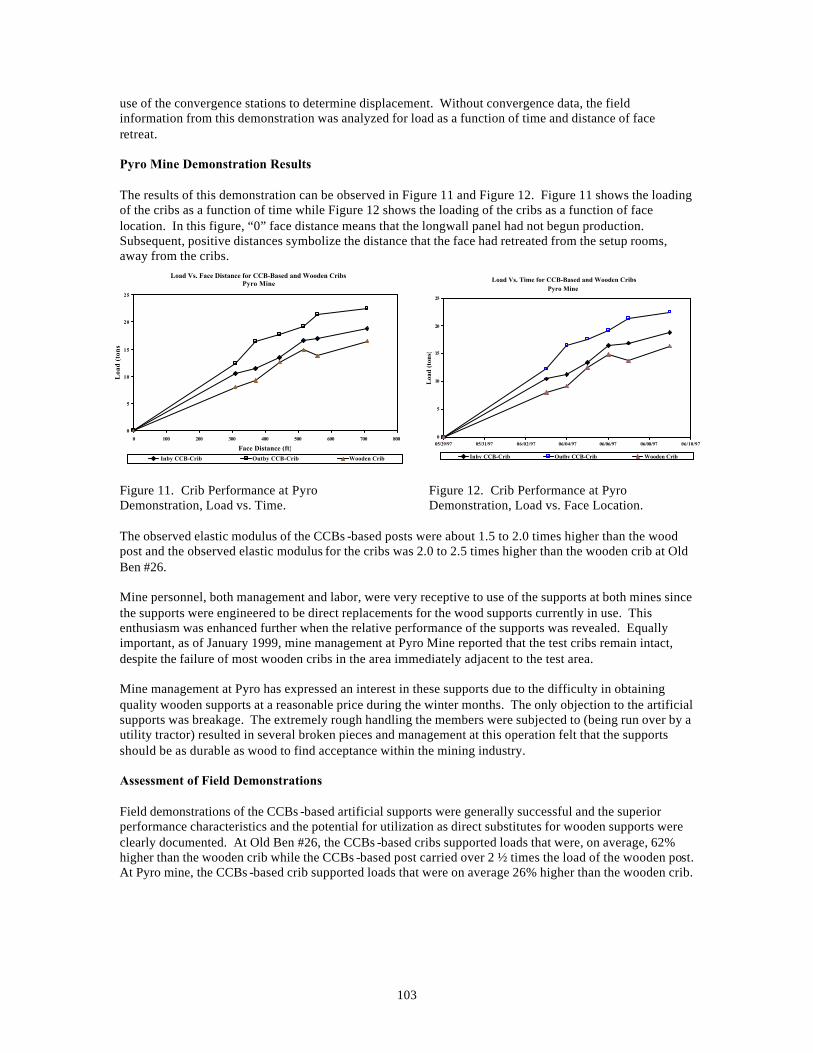
103
use of the convergence stations to determine displacement. Without convergence data, the field information from this demonstration was analyzed for load as a function of time and distance of face retreat. Pyro Mine Demonstration Results The results of this demonstration can be observed in Figure 11 and Figure 12. Figure 11 shows the loading of the cribs as a function of time while Figure 12 shows the loading of the cribs as a function of face location. In this figure, “0” face distance means that the longwall panel had not begun production. Subsequent, positive distances symbolize the distance that the face had retreated from the setup rooms, away from the cribs.
Figure 11. Crib Performance at Pyro Demonstration, Load vs. Time.
Figure 12. Crib Performance at Pyro Demonstration, Load vs. Face Location.
The observed elastic modulus of the CCBs -based posts were about 1.5 to 2.0 times higher than the wood post and the observed elastic modulus for the cribs was 2.0 to 2.5 times higher than the wooden crib at Old Ben #26. Mine personnel, both management and labor, were very receptive to use of the supports at both mines since the supports were engineered to be direct replacements for the wood supports currently in use. This enthusiasm was enhanced further when the relative performance of the supports was revealed. Equally important, as of January 1999, mine management at Pyro Mine reported that the test cribs remain intact, despite the failure of most wooden cribs in the area immediately adjacent to the test area. Mine management at Pyro has expressed an interest in these supports due to the difficulty in obtaining quality wooden supports at a reasonable price during the winter months. The only objection to the artificial supports was breakage. The extremely rough handling the members were subjected to (being run over by a utility tractor) resulted in several broken pieces and management at this operation felt that the supports should be as durable as wood to find acceptance within the mining industry. Assessment of Field Demonstrations Field demonstrations of the CCBs -based artificial supports were generally successful and the superior performance characteristics and the potential for utilization as direct substitutes for wooden supports were clearly documented. At Old Ben #26, the CCBs -based cribs supported loads that were, on average, 62% higher than the wooden crib while the CCBs -based post carried over 2 ½ times the load of the wooden post. At Pyro mine, the CCBs -based crib supported loads that were on average 26% higher than the wooden crib.
Load Vs. Time for CCB-Based and Wooden CribsPyro Mine
0
5
10
15
20
25
05/29/97 05/31/97 06/02/97 06/04/97 06/06/97 06/08/97 06/10/97
Loa
d (t
ons)
Inby CCB-Crib Outby CCB-Crib Wooden Crib
Load Vs. Face Distance for CCB-Based and Wooden CribsPyro Mine
0
5
10
15
20
25
0 100 200 300 400 500 600 700 800
Face Distance (ft)
Loa
d (t
ons)
Inby CCB-Crib Outby CCB-Crib Wooden Crib
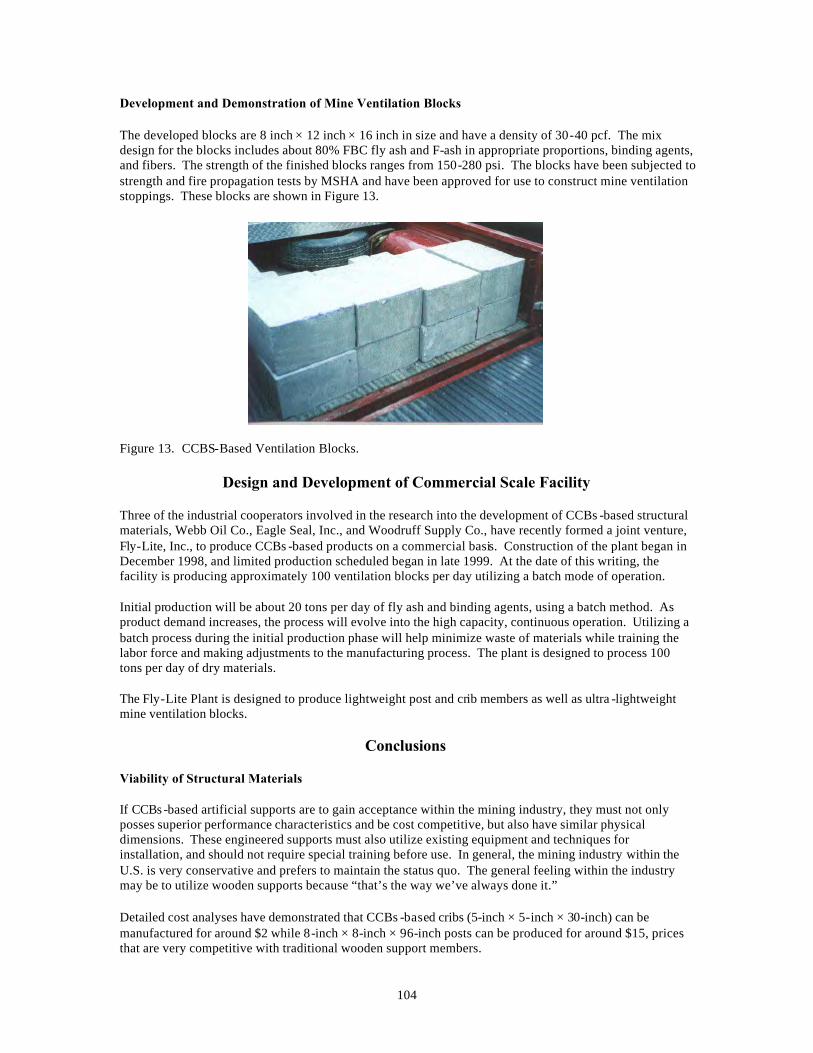
104
Development and Demonstration of Mine Ventilation Blocks The developed blocks are 8 inch × 12 inch × 16 inch in size and have a density of 30-40 pcf. The mix design for the blocks includes about 80% FBC fly ash and F-ash in appropriate proportions, binding agents, and fibers. The strength of the finished blocks ranges from 150-280 psi. The blocks have been subjected to strength and fire propagation tests by MSHA and have been approved for use to construct mine ventilation stoppings. These blocks are shown in Figure 13.
Figure 13. CCBS-Based Ventilation Blocks.
Design and Development of Commercial Scale Facility
Three of the industrial cooperators involved in the research into the development of CCBs -based structural materials, Webb Oil Co., Eagle Seal, Inc., and Woodruff Supply Co., have recently formed a joint venture, Fly-Lite, Inc., to produce CCBs -based products on a commercial basis. Construction of the plant began in December 1998, and limited production scheduled began in late 1999. At the date of this writing, the facility is producing approximately 100 ventilation blocks per day utilizing a batch mode of operation. Initial production will be about 20 tons per day of fly ash and binding agents, using a batch method. As product demand increases, the process will evolve into the high capacity, continuous operation. Utilizing a batch process during the initial production phase will help minimize waste of materials while training the labor force and making adjustments to the manufacturing process. The plant is designed to process 100 tons per day of dry materials. The Fly-Lite Plant is designed to produce lightweight post and crib members as well as ultra -lightweight mine ventilation blocks.
Conclusions Viability of Structural Materials If CCBs -based artificial supports are to gain acceptance within the mining industry, they must not only posses superior performance characteristics and be cost competitive, but also have similar physical dimensions. These engineered supports must also utilize existing equipment and techniques for installation, and should not require special training before use. In general, the mining industry within the U.S. is very conservative and prefers to maintain the status quo. The general feeling within the industry may be to utilize wooden supports because “that’s the way we’ve always done it.” Detailed cost analyses have demonstrated that CCBs -based cribs (5-inch × 5-inch × 30-inch) can be manufactured for around $2 while 8-inch × 8-inch × 96-inch posts can be produced for around $15, prices that are very competitive with traditional wooden support members.

105
Marketability of CCBs-Based Supports The work presented in this paper has demonstrated that CCBs -based artificial supports have superior strength characteristics as compared to their wooden counterparts, and can be produced in sufficient quantities at a competitive price. This work may change some minds within the industry, causing some to take a better look at CCBs -based artificial supports. So far, the response from individuals within the industry that have been exposed to these supports is strongly positive. In addition, by utilizing disposable molds of square cross-section, these supports can be produced in shapes and sizes very similar to existing wooden supports. Field experience has also shown that CCBs -based supports can be cut to length with commonly used hand and power tools and will readily accept a mine spad or screw. No special equipment or tools should be required in the utilization of these products as direct replacements for wooden supports.
References
Anderson, G., and Smelser, T., 1980, “Development Testing and Analysis of Steel-Fiber-Reinforced
Concrete Mine Support Members,” U.S. Bureau of Mines Report, RI 8412. Biron, C., Arioglu, E., 1983, “Design of Supports in Mines,” John Wiley & Sons, Inc., New York, pp. 3-26. Chugh, Y.P., et al., 1996, “Lightweight Combustion Residues-Based Structural Materials for Use in
Mines,” Southern Illinois University at Carbondale. Chugh, Y.P., et al., 1997, “Lightweight Coal Combustion By-Products Based Structural Materials for Use
in Mines,” Southern Illinois University at Carbondale. “Coal Data 1993,” National Coal Association, Washington D.C. Wei, L., Naik, T.R., Golden, D.M., 1994, “Construction Materials Made with Coal Combustion By-
Products,” Cement, Concrete and Aggregates, June issue, pp.36-42. Yu, Z, 1987, “Evaluation of Underground Supports Made of Wood and Other materials,” Masters Thesis,
Virginia Polytechnic Institute and State University.
Acknowledgements The authors sincerely acknowledge the financial support of the Office of Coal Development and Marketing of the Illinois Department of Commerce and Community Affairs and the Federal Energy Technology Laboratory of the U.S. Department of Energy. The cooperation and financial support of the industrial cooperating organizations is also sincerely acknowledged. _____________________________ 1Paul Chugh has BS, MS, and Ph.D. degrees in Mining Engineering; the latter two are from The Pennsylvania State University. Dr. Chugh has been at Southern Illinois University for the past 23 years. For the past 9 years, he has been actively engaged in research, development, and demonstration studies related to coal combustion by-products. He has commercialized three CCBs -based lightweight structural materials for use in mining industries. Currently, he is developing utility poles from CCBs and hopes to commercialize them in the near future. He is currently Director, Combustion By-products Recycling Consortium-Midwestern Region.

106

107
BACKFILLING OF HIGHWALLS FOR IMPROVED COAL RECOVERY
Thomas Robl and Robert Rathbone1 University of Kentucky
Center for Applied Energy Research Lexington, Kentucky
Abstract Auger mining of coal highwalls has left billions of tons of stranded coal reserves in the United States Appalachian coalfields because the auger holes render the highwalls unstable. The use of low-cost grout prepared from fluidized bed combustion (FBC) ash to stabilize the overburden strata, combined with modern highwall mining techniques to recover the coal beyond the depth of augering, has the potential to add significant quantities of recoverable coal reserves in the eastern United States. Laboratory testing and field demonstrations conducted for this project demonstrated that FBC ash-based grouts can be prepared and placed in the auger holes with sufficient fluidity and ultimate strength to allow for recovery of the stranded coal. Furthermore, economic analysis indicates that the process can allow coal to be recovered at a significant profit.
Introduction There are thousands of linear miles of abandoned highwall in the Appalachian coalfields left from contour strip mining, about 25% of which are estimated to have been auger mined to depths of 100-150 feet. Auger mining weakens the face of the highwall and makes the coal beyond the depth of augering difficult to recover (Figure 1a). This “stranded” coal represents a major resource, comprising several billion tons of often high quality reserves. In some areas of Appalachia it is the only significant coal that is left. Grouting auger holes to strengthen and stabilize the augered highwalls is one method that can be used to recover stranded coal. Portland cement-based grouts have been investigated, but are too expensive. Our concept is to utilize fluidized bed combustion (FBC) ash which is currently being disposed of in Kentucky under a waste back-haul contract. The grout would be prepared using FBC ash and water, and then pumped into auger holes to stabilize the highwall (Figure 1b). Automated highwall mining equipment would then recover the stranded coal to a depth well beyond that of the auger holes (Figure 1c). FBC by-products are known to be cementitious when mixed with water and, with sufficient curing, can produce a high-compressive strength material. The calcium sulfate in FBC ash reacts with hydroxide and dissolved glass components to form calcium sulfo-aluminates, the most important mineral of this group being ettringite (Weinberg et al., 1991). Unlike Portland cement-based materials, ettringite is an important cementitious component in FBC-based concrete, grout, flowable fill, etc. (Berry et al., 1991). Ettringite and gypsum formation also contribute to expansion (Jones et al., 1980). In fact for the application described herein, some expansion is desirable. The project was completed in two phases. Laboratory ash/grout testing, hydrologic monitoring, and evaluation of emplacement methods occurred in Phase I, whereas the field demonstration and economic analysis was completed for Phase II.
Laboratory Testing Procedures Materials FBC ash originated from the U.S. Generating Co. FBC co-generation facility in Cedar Bay, Florida. The ash was sampled from a receiving and disposal facility in Ivel, Kentucky. Physically, the spent bed material “bed ash” has the consistency of coarse sand. The baghouse material typically referred to as “fly ash” is much finer.

108
Figure 1. (a) Auger-mined coal extends back about 100 feet and weakens the highwall face. (b) Auger holes are grouted to match highwall mining pattern. (c) Coal is removed to a depth of 1000 to 1200 feet between the grouted holes. Cylinder Preparation and Curing The grout samples tested in the laboratory were prepared with ash and distilled water using a paddle-type mixer. Water contents were devised that would provide a range of grout fluidity and strengths. Water:solid ratios ranged from 0.62 to 0.77 (38.3-44.5% moisture). Specimens for mechanical strength testing were formed in several types of cylinder molds, all of which had a length:diameter ratio of 2. The specimens were cured in an enclosed water bath at a fixed temperature with the open top of each specimen above the water-line so that curing occurred in high humidity. Curing temperatures were 50o C, 30oC, and -21o C. Unconfined Compressive Strength Testing Unconfined compression testing was selected as the most preferred geotechnical test for this study because it best represents the type of loading that the grout will encounter in an auger hole. A finite element analysis indicated that a compressive strength of 500 PSI would be sufficient to support the rock strata overlying the coal. The strength testing was conducted as per ASTM C 39, C 192, and C 617/C 1231, using a triaxial compression machine containing a 10,000 lb. load cell.
1 m
Stage 1 Grout Fill Every 3rd Auger Hole
Stage 2 Highwall Mine Between Filled Holes
1 m
Stage 0 Augered Coal Seam

109
Chemical and Mineralogical Characterization The chemical and mineralogical compositions were determined on the dry ash samples and on the grouts. Chemical analysis comprised major element oxides and SO3 content, and was conducted in accordance with ASTM D 3177 and D 3682. Free lime was determined in accordance with the procedures of ASTM C 25. Mineralogical characterization was accomplished using x-ray diffraction analysis (XRD). XRD was conducted using a Phillips x-ray diffractometer configured to produce Cu Kα radiation (1.5406D) at 40 keV and 20ma. Each sample was ground to a powder in a mortar and pestle prior to XRD analysis.
Laboratory Results Chemical and Mineral ogical Composition The chemical composition of the Cedar Bay fly ash and bed ash is shown in Table 1. X-ray diffraction analysis of the Cedar Bay fly ash and bed ash revealed that although the crystalline phases are similar for the two sets of materials, the distribution of these phases is significantly different (Figure 2; Table 2). The fly ash contains more quartz, gehlenite, and glass, whereas the bed ash has a larger proportion of lime-portlandite and anhydrite. The identification of the crystalline phases was confirmed by optical and scanning electron microscopy, and is consistent with that reported in the literature for similar materials (e.g., McCarthy and Solem-Tishmack, 1994; Iribarne et al., 1994). XRD spectra of the grout samples are shown in Figure 3. The phases identified are listed in Table 2. Although gypsum occurred in the bed ash-based grout, it was rarely observed in the fly ash grout. This is probably a consequence of the relatively low abundance of lime and anhydrite in the Cedar Bay fly ash. The relative paucity of calcium and sulfate ions and abundance of aluminum in the Cedar Bay fly ash favors the precipitation of ettringite, which is highly insoluble at the high pH (∼12.4) of the solution.
Table 1. Chemical Composition of FBC Fly Ash and Bed Ash
Ash Type
SiO2 (%)
Al2O3 (%)
TiO2 (%)
CaO (%)
Fe2O3 (%)
MgO (%)
K2O (%)
Free Lime (%)
SO3 (%)
Fly Ash 33.8 23.7 1.2 28.4 3.6 0.9 1.2 8.1 6.6 Bed Ash 14.9 6.4 0.3 47.9 1.3 2.7 0.4 17.0 29.9
Table 2. Crystalline Phases Identified in FBC Ash and Grout
Mineral Name Abbreviation Chemical Formula
Calcite (Cc) CaCO3 Anhydrite (An) CaSO4 Gehlenite (Ge) Ca2Al2SiO7
Lime (Lm) CaO Portlandite (Pt) Ca(OH)2
Quartz (Qz) SiO2 Ettringite (Et) Ca6Al2(SO4)3(OH)12•26H2O Gypsum (Gp) CaSO4•2H2O

110
2 theta (degrees)10 15 20 25 30 35 40
Inte
nsity
(co
unts
)
0
50
100
150
200
250
Bed Ash GroutFly Ash Grout
Et EtEt Et
Et
Et
Qz
Qz
EtCc
Ge
Gp
Gp Cc
Gp
PtEt
Figure 2. XRD spectra of Cedar Bay bed ash and fly ash. The effect of curing time on grout mineralogy is shown in Figure 4 for the fly ash grout samples cured at 21oC. Over the course of curing there was a loss of portlandite and an increase in ettringite and calcite abundance; the remaining phases remained more-or-less unchanged. The XRD spectra show that after curing for long periods of time, the distribution of crystalline phases such as ettringite was unaffected by the initial water content. Higher temperatures accelerated the grout curing rate and thus the rate of ettringite and, to a lesser degree, calcite formation, while increasing the rate of decline in portlandite abundance. Curing temperature had no significant effect on final mineral composition of the fully-cured grout samples.
Figure 3. XRD spectra of bed ash- and fly ash-based grouts.
2 Theta (degrees)
10 15 20 25 30 35 40
Inte
nsity
(cou
nts)
0
50
100
150
200
250
300
350
Bed AshFly Ash
Qz
Qz
An
An
GeAn
Lm
Pt
Pt
Ge Ge Lm

111
Figure 4. XRD spectra of FBC fly ash-based grouts at different curing intervals. Unconfined Compressive Strength The effect of water content on the unconfined compressive strength of the Cedar Bay fly ash grouts was similar to that for Portland cement paste: increasing the water:solid ratio resulted in a significant decrease in strength, probably because of a higher degree of porosity in the hardened grout. At each water content, the rate of strength gain was considerably increased as the curing temperature increased (Figure 5). The maximum strength was achieved by day 10 and day 25 for the 50oC and 30oC curing, respectively, whereas the grout cured at 21oC continued to gain strength after 100 days. However, the increased curing temperature also caused a slight strength decrease after the maximum was achieved; at 50oC, maximum strength occurred at approximately 10 days, then decreased slightly (Figure 5). At 30o C curing, a similar trend occurred. This held true for all of the moisture contents studied. These relationships are consistent with those published for Portland cement concrete. In general, higher curing temperature increases the early strength of concrete but often adversely affects the longer-term strength, possibly because of greater porosity and more poorly developed physical structure (Neville, 1996). The laboratory tests suggested that the FBC ash grouts could be formulated at water contents high enough to provide an adequate degree of fluidity, whilst providing sufficient mechanical strength for highwall stablization (i.e., > 500 PSI). However, the data als o suggested that elevated temperatures are required for adequate strength to develop within a period of several weeks.
Field Demonstration Site Preparation The field demonstration site was developed at a surface mine located in Floyd County, Kentucky. The augered highwall was located approximately 50 feet from an active haul road. More than twenty auger holes were uncovered (Figure 6) using earth-moving equipment. The auger holes dipped away from the entrance, which caused some of
2 theta (degrees)
5 10 15 20 25 30 35 40 45
Inte
nsity
(cou
nts)
0
50
100
150
200
250
44 days
11 days
Qz
Qz
Ge
PtPt
Ge Cc
Et
EtEt
EtEt
EtQz

112
Figure 5. The effects of temperature on unconfined compressive strength of fly ash-based grout prepared with a
water:solid ratio = 0.62 (38.3% moisture). the holes to be completely filled with water towards the back. This is common for auger holes and is caused by the massive auger stem “bottoming-out” of the coal bed within about 100 ft. depth. The standing water was pumped from some of the holes to permit depth measurement and general surveying. Comparison of hole capacity with the actual volume of grout emplaced was used to assess the extent of hole filling. Grouting Procedure It was decided to use readily available concrete mixing and emplacement equipment for the field demonstrations. Concrete trucks, of 10 yd3 capacity, were chosen to mix the grout prior to emplacement. The FBC ash was loaded into the trucks along with a specified amount of water, whereupon the grout was mixed and delivered to the site. The grout was then transferred to a concrete piston pump (Figure 7) that can deliver material at pressure and high rates of approximately 115 yd3/hr. Hardened agglomerates of fly ash were removed from the grout using a large screen installed on the concrete pump hopper. PVC pipe was connected to the piston pump outlet and inserted into the auger holes. The grout was then pumped through the pipe until the auger hole rejected the material. The piston pump was mounted on a truck and was equipped with a 90 ft. long extendable, hydraulically -controlled boom. This boom is a desirable feature because it can reach auger holes not immediately adjacent to a haul road. It was also used to withdraw the pipe from the auger hole and move the assembly to the next hole.
Curing Time (days)
0 20 40 60 80 100 120
Com
pres
sive
Str
engt
h (P
SI)
0
500
1000
1500
2000
2500
3000
21oC curing30oC curing50oC curing
Curing Time (days)
0 20 40 60 80 100 120
Com
pres
sive
Str
engt
h (P
SI)
0
500
1000
1500
2000
2500
3000
21oC curing30oC curing50oC curing
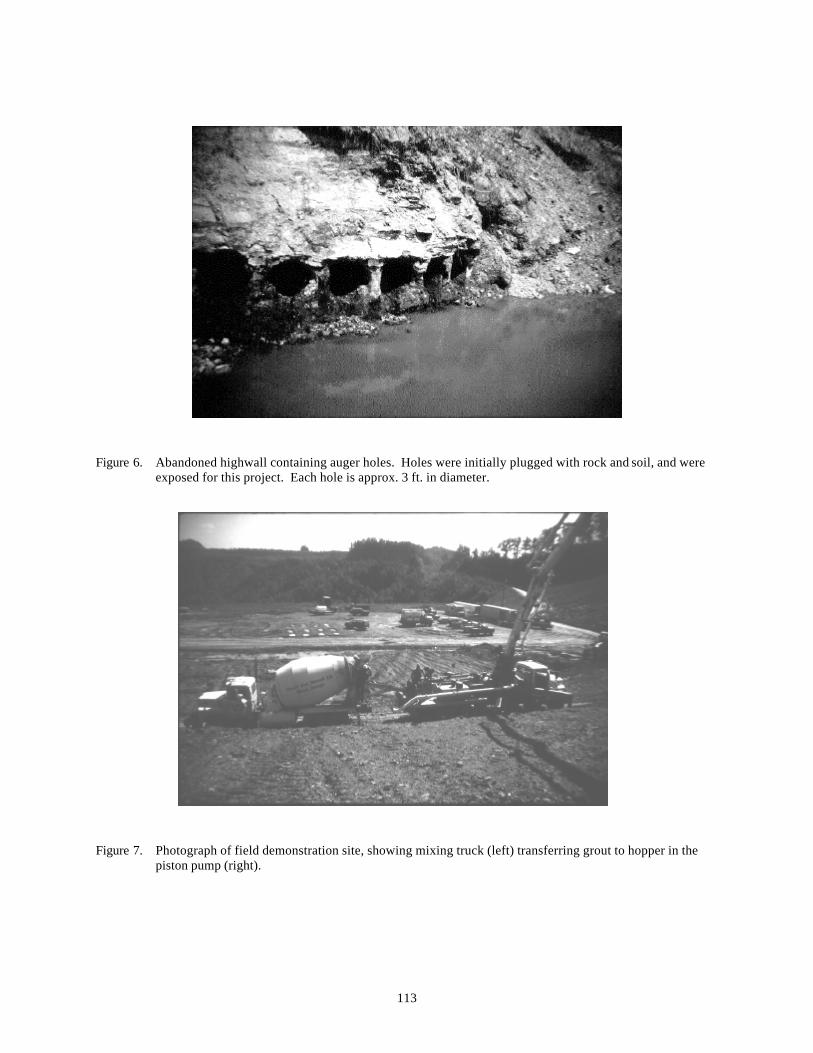
113
Figure 6. Abandoned highwall containing auger holes. Holes were initially plugged with rock and soil, and were
exposed for this project. Each hole is approx. 3 ft. in diameter.
Figure 7. Photograph of field demonstration site, showing mixing truck (left) transferring grout to hopper in the
piston pump (right).

114
Grout Emplacement The field demo nstrations occurred in June and August 1997. Although standing water was pumped from some of the auger holes, it was apparently unnecessary for successful grout emplacement. During grouting of auger holes containing standing water, large amounts of fairly clear water were observed flowing from the hole entrance and from adjacent holes, indicating that the grout effectively displaced water without mixing with it to a significant extent. This worked particularly well when the grout was injected from the back of the hole. Sandbags were first used as bulkheads at the hole entrances but proved ineffectual at restraining the wet grout. Therefore, additional auger holes were prepared for grouting by removing only the top 6 in. of soil and rock, thus leaving in-place an earthen bulkhead. This bulkhead and the dip of the hole allowed for grouting nearly to the roof. The bulkhead remained intact during grouting and was effective in allowing for greater pressure to be applied to the grout, thus forcing it to the back of the hole. Moisture contents were obtained at the site using a microwave oven and ranged from 30%-42%. Temperature measurements of the grout were obtained on cylinder samples (prepared for compressive strength testing). These ranged from 45o to 75oC. In addition, a thermocouple apparatus inserted into an auger hole indicated an in situ grout temperature of 70o C. Five days after grout emplacement the auger hole temperature was 62o C. Comparison of the volume of emplaced grout with the capacity of the holes indicated that filling was nearly complete for many of the holes, and suggested that the grout fluidity was sufficient for proper flow. Although several auger holes were successfully filled with bed ash-based grout, it is preferable to use grout containing less bed ash because of the large amount of heat of hydration, and the comparatively low ultimate compressive strengths that are produced. There was a significant problem regarding the extensive amount of elapsed time (> 1hr.) between truckloads of grout arriving at the mine site. This not only limited the number of holes grouted, but also caused problems with grout stiffening within the mixing trucks, pump, and (partially filled) auger holes between deliveries. It was therefore concluded that the use of concrete mixing trucks be avoided in favor of mixing the grout at the mine site using a mill. Similar techniques have been successful for the injection of FGD-based grouts into abandoned underground mines (e.g., Mafi et al., 1997; Chugh et al., 1997; Petzrick and Rafalko, 1997). Geotechnical, Chemical, and Mineralogical Monitoring In addition to cylinder samples prepared during the field demonstrations, cured grout from the auger holes was sampled 194 days and 240 days after the 2nd and 1st demonstrations, respectively. Mining had proceeded to a point where the strata overlying the coal was completely removed thus exposing the grout-filled auger holes. Eleven grouted holes were sampled for physical testing, and chemical and mineralogical analysis. Representative samples of each grout were cut into prisms, with a height:width = 2:1, for unconfined compressive strength testing. The strength data are provided in Table 3. Comparison of field data with laboratory data (Figure 8) reveals that the range of compressive strengths was very similar for the two data sets. This indicates that the laboratory grout mix proportions and 50oC curing conditions produced material that was similar to the field demonstration grouts and that, more importantly, the compressive strengths exceeded the minimum 500 PSI criterion for proper, safe support of the coal overburden. After testing for unconfined compressive strength, x-ray diffraction (XRD) analysis was conducted on fragments of the grout samples. These data indicated that the mineralogy of the field demonstration grout was also similar to that of the laboratory-prepared material.

115
Table 3. Physical Properties of Several Field Demonstration Grouts
Auger Hole No.
Grout Type
Moisture (wt.%)
Strength (PSI)
Wet Density (g/cm3)
L1 Bed Ash 30.4 944 1.56 L2 Fly Ash 34.3 1334 1.61 L3 BA/FA 40.0 1000 1.67 L8 Fly Ash 38.7 1597 1.59
L10 Fly Ash 36.7 1601 1.60 R2 Fly Ash 34.1 2263 1.79 R4 Fly Ash 39.5 1677 1.79 R11 Fly Ash 38.9 1759 1.58
Figure 8. Unconfined compressive strength of lab grouts cured at 50oC, with water:solid ratios between 0.62 and
0.77 (38%-44% moisture), compared with field demo (auger hole) grouts.
Economic Analysis The final project objective was to evaluate the economics of the concept. A computer program was developed for a basic economic model, and a hypothetical operation was devised to evaluate the feasibility of auger hole filling. The hypothetical mine setup produced a total cost for the auger hole filling operation of less than $0.20 per yd3 of coal recovered. This low cost largely resulted from the high proportion of coal recovered per ton of grout placed. It was concluded that grouting should be economically feasible and, when combined with modern automated highwall mining methods, could add significant quantities of coal reserves in the eastern United States.
Age (days)
0 10 20 30 40 50 60 70 200240
Com
pres
sive
Stre
ngth
(P
SI)
0
500
1000
1500
2000
2500
3000
0.62 w:s
0.72 w:s
0.77 w:s
FieldSamples
116
References Berry, E.E., Hemmings, R.T. and Cornelius, B.J. (1991) EPRI GS-7122, Volume 2, Research Project 2708-4, Final
Report, January 1991. Chugh, Y., Dutta, D., Powell, E., Yuan, X., Thomasson, E., Wangler, G., and Cockrum, G. (1997) in Proc. 1997 Intl.
Ash Util. Symp., Lexington KY, pp. 483-494. Iribarne, A.P., Iribarne, J.V., Anthony, E.J. and Blondin, J. (1994) Journal of Energy Resources Technology,
Transactions of the ASME, Vol. 116, pp. 278-286. Jones, B.F., C.M. Thompson, A.G. Lampkin, and K.R. Williams (1980) EPRI, CS-1533, Palo Alto, CA. Mafi, S., Damian, M.T. and Baker, R. (1997) in Proc. 1997 Intl. Ash Util. Symp., Lexington, KY, pp. 560-567. McCarthy, G.J. and Solem-Tishmack, J.K. (1994) in Adv. in Cement and Concrete, Proc. Eng. Found. Conf., Mat.
Eng. Div./ASCE. July 24-29, 1994, Durham, NH, pp. 103-121. Neville, A.M. (1996) Properties of Concrete, 4th Ed. 844 pp., Wiley & Sons, New York. Petzrick, P. and Rafalko, L.G. (1997) Proc. 1997 Int. Ash Util. Symp., Lex. KY, pp. 525-532. Weinberg, A., L. Holcombe. and R. Butler (1991) Proc. 11th Intl. Conf. on Fluidized Bed Combustion, AIME, New
York, pp. 865-870. ______________________________ 1Bob Rathbone is a research scientist at the University of Kentucky Center for Applied Energy Research. He has been involved with many aspects of coal combustion product (CCP) research and characterization, including studies of ammonia in fly ash, the effects of fly ash carbon on air entrainment in concrete, the use of fluidized bed combustion ash as a low-cost grout in mine voids, and the potential use of fly ash carbon as a boiler fuel. He has authored or co-authored publications in many professional journals and conference proceeding related to CCP research, and serves on the Program Committee for the International Ash Utilization Symposium in Lexington, Kentucky.
117
GROUT INJECTION INTO AN UNDERGROUND COAL MINE TO CONTROL ACID MINE DRAINAGE AND SUBSIDENCE
D. Courtney Black1 and Paul F. Ziemkiewicz
National Mine Land Reclamation Center West Virginia University
Morgantown, West Virginia
Abstract This paper presents the results of a study involving the field scale injection of grouts into underground room and pillar mines to control acid mine drainage and subsidence. The grout used is made of Class F fly ash and cement kiln dust (CKD). The mix was developed from several laboratory scale experiments conducted to investigate flow characteristics and strength. Strength requirements for the grout were determined from site specific geologic information and expected stress levels. Starting in the spring of 1999, 40,000 yd3 of the Class F/CKD grout was pumped into the Longridge Mine in Preston County, West Virginia. Complications due to the mine geometry and recharge to the mine pool have led to the development of new methods for achieving complete backfill in underground room and pillar mines. These new methods and project results will be discussed.
Introduction
Acid mine drainage from abandoned coal mines continues to be the legacy of Appalachian coal mining. Current treatment technologies treat the acid mine drainage after it has exited the mine. Many of these systems are quite efficient but do require substantial flat land in order to be installed. The objective of this project is to evaluate the technical, economic, and environmental feasibility of filling abandoned underground mine voids with a chemically stable grout to control acid mine drainage and subsidence.
Demonstration Project
The Longridge Mine in Preston County, West Virginia is an 11-acre deep mine. The mine void is intercepted by an auger hole that was installed to drain a mine pool so that surface mining could proceed down dip of the Longridge Mine. The auger hole allows a 11,000 cubic yard or 2.2 million gallon mine pool to remain in the Longridge Mine. The auger hole discharged about 100 gallons per minute of acid mine drainage prior to any work at the site. The Longridge injection began in late January 1999. A total of 3,000 cubic yards of grout was injected into the up dip section of the mine. After two weeks of injection, it was observed that the grout was communicating with the auger hole drainage; grout began to flow from the auger hole that is located 2,000 feet from the injection hole. Grouting ceased while plans were made to stop the grout from leaving the mine. In early April, the project team decided to place a barrier 200 feet down dip from the injection bore hole. The barrier was to be made by pneumatically injected gravel into the mine void from the surface via the Burnett Ejector. A total of 300 tons of gravel was placed into two headings to create a barrier. Three thousand yards of stiff grout (2/5 cement kiln dust to 3/5 class F ash with one bucket of gravel with a solids to water ratio of 3:2) were placed directly up-dip from the barrier. The installation of the barrier decreased the auger hole flow by 90% (from 92 gpm to 9 gpm). Grouting with the prescribed thin grout (1/4 cement kiln dust, 3/4 class F ash with a solids to water ratio of 1:1) continued in holes above the barrier. A total of 12,500 yards of thin grout was placed in the upper cell after barrier construction. The auger hole continued to flow at less than 10 gpm during the spring and summer of 1999.

118
After the upper cell (Cell 1) was complete, grouting commenced just below Cell 1. While grouting Cell 1, holes were drilled across the mine void to divide it in half. The Office of Surface Mining (OSM) bore hole camera was emp loyed to investigate the mine void. The mine was collapsed and no void could be seen. Thin grout injected below Cell 1 did communicate with the auger hole so a thicker grout mix was employed to stop up the void space in the collapsed barrier. This has worked as 12,000 yards of grout have been placed in Cell 2 with no communication with the auger hole. An investigation of the mine void via the OSM camera on 29 July 1999, indicated that solid grout could be seen 2 feet above the mine roof in boreholes just above the barrier for Cell 2. The auger hole flow is below 5 gpm and has continued to stay at this level through the summer of 2000. Table 1 shows the water quality data from the auger hole before, during, and after grouting.
Conclusions
The placement of a chemically stable grout in underground mine voids is technically feasible and environmentally sound. No adverse water quality affects can be seen from the placement of the Class F fly ash/Cement Kiln Dust grout in the mine. While barium did triple in concentration, it is still well below the drinking water limit established by the U.S. Environmental Protection Agency. Injection costs (labor, water, mixing, pumping) remain below $3.00 per yard. When transportation of cement kiln dust and Class F fly ash are factored in, a cubic yard of grout costs about $12.85 to get into the mine void. A full-scale economic analysis will be completed once injection is complete. ______________________________ 1 D. Courtney Black is a Program Manager with the National Mine Land Reclamation Center at West Virginia University. He serves as the Eastern Regional Director for the Combustion By-Products Recycling Consortium and as Director of the National Environmental Education and Training Center. Black has more than seven years experience in acid mine drainage treatment and control. He specializes in using alkaline waste products, including coal combustion by-products, to accomplish AMD treatment and control.

119
BENEFICIAL USES OF CLEAN COAL COMBUSTION BY-PRODUCTS: SOIL AMENDMENT AND COAL REFUSE TREATMENT EXAMPLES
AND CASE STUDIES
Warren A. Dick1, Liming Chen and Yueli Hao School of Natural Resources The Ohio State University
Wooster, Ohio
Abstract Combustion of coal, with high sulfur content, often requires some sort of scrubbing technology be applied so that the emissions meet clean air standards. The by-products produced, often referred to as Clean Coal Combustion By-Products (CCCBs), have unique properties that give them value when properly used for various land application purposes. The keys to a successful beneficial use program are knowing these properties and understanding how to capture them in a beneficial way. In some cases, modification or treatment of the CCCBs must be done to obtain the proper characteristics to achieve a desired end. Also required is an understanding of the regulatory restraints to the use of CCCBs so that we can effectively work within them. We have characterized a large number of CCCBs created by different scrubbing processes. Based on these characterization data, we have designed and conducted laboratory and field scale studies related to land application uses of CCCBs involving agriculture and surface mine land reclamation. This paper summarizes some of the results obtained from these studies. We conclude that CCCBs can be successfully used for land application benefits and may be potentially developed into commercial products. Environmental responses are mostly either not measurable or positive. Observed negative responses are primarily limited to release of metals either directly from the CCCBs or from the treated soil as they are displaced by basic cations (Na, Ca, Mg, etc.) contained in the CCCBs For CCCBs to achieve widespread land application use, we need: 1) education of the general public concerning their benefits, 2) acceptance by regulatory agencies that CCCBs are just as safe as other commonly used land application products (e.g., mineral fertilizers, limestone, various types of composts), and 3) creation of companies or commercial partnerships that focus on the development and marketing of products derived from CCCBs.
Introduction Coal represents a major natural resource in the United States and a large amount of it is burned each year to produce electricity, heat or other forms of useful energy. Approximately 92.5 million Mg (102 million short tons) of coal combustion by-products were produced in the United States in 1996. The materials produced in major abundance during combustion of coal and scrubbing of the waste gases include fly ash, bottom ash, boiler slag, and various types of scrubbing by-products. Fly ash is a fine inorganic particulate residue suspended in the flue gases produced when coal is combusted and is collected primarily by electrostatic precipitators. The rapid cooling of the, ? ash from the molten state as it leaves the flame,? causes fly ash to be predominantly noncrystalline (glassy) with minor amounts of crystalline constituents such as quartz, hematite, mullite, and magnetite. Fly ash particles are extremely variable, however, in size and chemistry due to variability of the coal feedstock and the various types of burners used. In general, fly ash particles are composed of alumina, silica, and iron oxide. They are less than 250 micrometers in diameter, spherical in shape, have a high mechanical strength, and are mostly chemically inert. The shape, fineness, particle size, density, and chemical composition of the fly ash particles determine end-use potential and the properties of the end-use products. Boiler slag and bottom ash are heavier and coarser than fly ash. Bottom ash, a granular material, is often used as a low cost replacement for more expensive sand in the production of concrete blocks, and in many States it is used as a base in road construction. Boiler slag is granular and sand-like but is shiny black in color and is very hard and abrasive. It is widely used to coat roofing shingles and as a blasting abrasive.

120
Because burning of coal results in the production of sulfur dioxide (SO2 )(which has been linked to acid rain formation, acidification of soils, and forest decline), the 1990 amendments to the Clean Air Act have mandated a two-stage, 9.07 million Mg reduction in SO2 emissions by the year 2000. These amendments have spurred the development of SO2 scrubbing technologies which produce a clean coal combustion by-product (CCCB). Several industry, government agencies, and university programs have conducted extensive studies on the characterization and beneficial uses of CCCB materials and much of this information has been reviewed (Dick et al., 1999; Stehouwer et al., 1998; 1995a; Clark et al., 1995; Korcak, 1995; Norton, 1995; Carlson and Adriano, 1993; Adriano et al., 1980). In the past, CCCBs were treated primarily as a waste and landfilled; however, landfill sites are becoming scarce and disposal costs are constantly increasing. Provided the environmental impacts are minimal and socially acceptable, land application uses can provide economic benefit to both the producer and the end user of the CCCBs. The bulk of this paper is extracted from a chapter in a book published by the Soil Science Society of America (Power and Dick, 2000). This book deals with all types of by-products including CCCBs and other related by-products such as gypsum (Dick et al., 2000; Ritchey et al., 2000)
Properties of Clean Coal Combustion By-products and Their Impacts on Land Application Uses
Two major forms of CCCBs are produced during the removal of SO2 from flue gases. Dry CCCBs are produced by any of several technologies developed for retrofitting on existing coal burning facilities. New fluidized bed combustion boilers are the most common source of dry CCCBs. They are collected using various particulate emission control devices. Dry CCCBs are highly variable in their characteristic properties. We have analyzed more than 50 samples collected from different sources located primarily in Ohio (Stehouwer et al., 1995a). A second type of CCCB, and by far the largest volume produced, is a wet flue gas desulfurization by-product. In general, once the flue gas is discharged from the boiler, it is fed through a dust collector to remove fly ash and then introduced into a scrubber. In the scrubber, the flue gas contacts slaked lime or limestone slurry which absorbs SO2. If additional air is injected with the flue gas, production of almost pure gypsum results. There are numerous uses of gypsum including production of wall board and land application uses (Ritchey et al., 2000). If air is not forced into the absorber, a slurry cake of CCCB is created containing a mixture of calcium sulfite and calcium sulfate. This slurry cake must be dewatered by centrifugation or vacuum filtration prior to its use. The slurry cake is then generally further processed or fixated by adding dry fly ash to increase solids content along with some additional lime. This causes a pozzolanic or cementitious reaction to occur which strengthens or hardens the material. Each scrubbing process yields materials that have different properties that will affect their end use potential. Properties of CCCBs that can either enhance or reduce value for various land application uses are summarized (Table 1). Consequently, not all CCCB materials are equally suitable for all possible beneficial uses. Specific beneficial uses of CCCBs must be designed to take maximum advantage of those properties that enhance the value of the CCCBs and to minimize the properties that reduce value. Obviously, information on the mineralogical, engineering, and chemical properties of CCCBs is essential in designing a beneficial use program. Data on the types and amounts of minerals in dry CCCBs (Table 2) is often the most informative when planning potential beneficial land application uses. For example, those interested in using CCCBs to capture their pozzolanic properties will want to know the relative amounts of CaO, Ca(OH)2, and fly ash. Fly ash, by itself, can increase compressive strength, durability, and workability while decreasing permeability, shrinkage, and segregation of many materials with which it is mixed. These benefits are due to the fineness, spherical nature, and size distribution of the fly ash particles which allow better filling of voids and reduce the need for water. Both wet and dry CCCB samples, containing fly ash and CaO or Ca(OH)2, will exhibit cementitious properties that can be useful for various engineering applications such as embankment stabilization or roadbed construction.
121
For agronomic land application uses, the trace mineral content and minerals that provide neutralization potential are most important. The neutralization potential can be determined by titration and is generally expressed as a percentage of calcium carbonate equivalence (ASTM, 1990). Mean calcium carbonate equivalency (CCE) values measured for materials obtained from each of the various dry CCCB processes ranged from 24.8% to 65.2% (Table 3). The four large volume wastes from coal-fired boilersCfly ash, bottom ash, boiler slag, and wet scrubber CCCBsCwere exempted in 1988 from hazardous waste regulations under Subtitle C of the Resource Conservation and Recovery Act (RCRA) (USEPA, 1993). This exemption was reaffirmed in 1993. Instead, the regulations of these by-products was left to the individual States. The American Coal Ash Association (Washington, DC) has taken the lead in working with CCCB producers and States in developing guidelines for the use of these materials. For other types of CCCBs, particularly the fluidized bed combustion boiler by-products, the American Coal Ash Association and the Council of Industrial Boiler Owners are assisting the U.S. Environmental Protection Agency in creating a database of chemical and physical properties to also exempt these sources from the RCRA regulations. If we consider the major components in most of the CCCBs that are currently nonexempt, we can begin to understand what their potential environmental impacts may be. The sorbent used in most scrubbing processes is hydrated lime (Ca(OH)2), limestone (CaCO3), or dolomite (CaMg(CO3)2). These materials have been used by farmers for centuries, at rates of 20 Mg/ha (8.9 tons/acre) or greater, to alter soil pH from an acidic value to a value near neutral (pH 7). Thus, their introduction during the scrubbing process should not result in any harmful environmental impacts of the resultant by-product. The product of the scrubbing reaction is primarily CaSO3 and this material, when applied to aerobic soil environments, is rapidly converted to gypsum (CaSO4$2H2O) which also has a long history of use as a soil amendment (Ritchey et al., 2000). Fly ash is the mineral residue from the coal that is burned and its chemical properties will depend on the source of the coal. Combustion of coals that are high in Boron (B) may produce fly ash or CCCBs that contain sufficient concentrations of this element to caution against land application due to B phytotoxicity. This problem can be reduced by allowing these materials to weather, to leach out the B, before land application. If there is a concern in land applying CCCBs, it is that during the SO2 scrubbing reaction, a potentially harmful element or compound may be sequestered or concentrated in the reaction by-products. Because there is little information or baseline data available, many states are requiring environmental impact information before approving CCCB materials for land application uses. Due to a lack of clear regulatory guidelines we have adopted the 503 Rules (USEPA, 1993) to help us assess the risks involved for land application uses of CCCBs. The 503 Rules were developed to regulate land application of biosolids and are not directly applicable to CCCBs. CCCBs are essentially 100 percent inorganic and amorphous whereas the 503 Rules were developed for organic materials which mineralize in soil. Thus, the use of the 503 Rules, when applied to CCCB materials, probably imposes a stricter level and greater margin of safety than when applied to land application of biosolids. If a total chemical analysis of the CCCBs is done, one can compare the concentrations in the CCCBs sample with the concentration limits as defined by the 503 Rules. Stehouwer et al. (1995a) and Clark et al (1995) have reported detailed elemental concentrations of a range of CCCBs. It is also possible to calculate the loading rates of the various elements by multiplying the application rates by their concentrations in the CCCBs sample and comparing these values with the 503 cumulative loading limits. Toxicity characteristic leaching procedure (TCLP) tests are commonly used to characterize the potential toxicity of waste products. This procedure was developed to determine the potential mobility of both organic and inorganic analytes present in liquid, solid, and multiphasic waste materials. The results of applying the TCLP tests to six CCCB samples indicated that, in all cases, the TCLP concentrations were well below the drinking water limits. This is not surprising because the alkaline material in the CCCB samples causes the pH to be above 7 and precipitates metals, thus removing them from solution, or precluding them from entering the solution phase.
Case Studies of Clean Coal Combustion By-product Land Application Uses

122
Agricultural Uses To justify CCCBs use in agriculture, any addition to the soil must clearly benefit the environment (i.e., soil, water, or air) or the crop (Korcak, 1998). Potential benefits of applying CCCBs to soil are both chemical and physical in nature. Physical benefits include increased water infiltration and aggregation of the soil. Chemical benefits of land applications of CCCBs include its ability to supply essential plant nutrients, modify the balance of nutrients, or adjust the pH to a more optimum level. As previously stated, there are several properties of CCCBs that can be captured for beneficial use when they are used as an agricultural amendment. Many soils in the United States are limiting in one or more essential plant nutrients that are required in trace amounts for optimum crop growth (Adriano et al., 1980; Dick et al., 2000). For example, CCCBs may serve as supplementary sources of Ca, S, B, Mo, Se, and other trace elements. Proper rates are often site specific and studies are required to match the proper rate of CCCBs to be applied to the land to the need of the crop. Selenium is one element that is not required by most higher plants but is an essential element for animal growth. Since Se is often limiting in animal feed, it is added as a supplement to improve feed efficiency. The problem is that Se is needed only in very low concentrations, and it can become toxic if concentrations in the diet are not properly controlled. Recommended food and feed concentrations to provide adequate Se for animal growth range from 0.2 to 1.0 mg Se/kg plant material and concentrations above 5 mg/kg can cause Se toxicity (Mengel and Kirby, 1987). Use of CCCBs can supply Se to plants, and when the plants are subsequently fed to animals, this Se can help overcome deficiencies. It is important, however, that Se concentrations in the crop growing in soil amended with CCCBs are in a proper range so that the feed can be safely used. Soluble salts also can be a problem when fresh CCCBs are land applied unto agricultural fields. If the material used to scrub the sulfur dioxide contains dolomite, magnesium sulfate is created during the scrubbing process and this material can be an especially important contributor to salt problems. The problem of high soluble salt concentrations can be minimized in several ways. Surface application, without incorporation, separates the CCCBs from the germination seed and reduces the salt effect. The surface layer of CCCBs can, in addition, also act as a mulch to conserve soil moisture. Applying the CCCBs at times when the crop is dormant (e.g., in the fall of the year after crop harvest and before a new crop is planted), also provides time for salts to be flushed from the treated soil. Weathered or stockpiled material, from which a substantial portion of the soluble salts have been leached, also may provide a solution to the salt problem. One study has shown that weathered ash could be used up to rates of 131 Mg/ha (58 tons/acre) while salt-related problems occurred at 87.2 Mg/ha (39 tons/acre) for the fresh ash (Martens and Beahm, 1976). Boron is an essential plant nutrient but also can easily become toxic if applied at excessive rates. Boron concentrations greater than 1 mg/L in the soil solution may be toxic to sensitive plants (Bohn et al., 1979). However, concentrations of several tenths mg/kg may indicate deficiency. Boron toxicity is primarily a problem the year of application only (Ransome and Dowdy, 1987). Boron is very soluble and can be easily leached away so that toxicity problems can be easily avoided with proper testing and if time is permitted for natural leaching to occur in the field prior to planting of a crop. Benefits of CCCBs as an agricultural amendment also may be attributed to changes in the chemical, physical, and microbiological properties of the soil. The benefits that can be captured related to soil chemistry are changes in pH and additions of essential plant nutrients. These have already been discussed. Physical changes of the soil, after CCCBs treatment, would include changes in the distribution of soil particle size, increased pozzolanic activity and possibly increased soil dispersion. To overcome many of the chemical and physical problems of CCCB use, work is needed to develop equipment that can apply the CCCBs at precise rates and precise locations within the soil profile. Jacobs et al. (1991) found that when a coal ash was banded into the soil at a 45 degree angle to the surface, corn roots were concentrated at the ash band, which was water saturated after rain occurred. Corn yields were increased in the ash-banded plots. The ash may have increased yields by supplying essential plant nutrients and by holding water for longer periods of time, than the natural soils, thus reducing drought problems. Additional work on this and
123
other creative ways to apply CCCBs to soil may indicate even greater land application benefits to agriculture. The effect of CCCBs application on the microbiology of the soil/plant system is largely unknown. This microbiology is very complex and represents an area that is ripe for further study. The preceding paragraphs highlight some of the general issues related to beneficial uses of CCCBs. The following sections will provide specific examples or case studies where CCCBs were used in agriculture and in surface coal mining. We will focus on things learned to optimize the benefits of the CCCBs while maintaining the quality of the environment. Agricultural Limestone Substitute. Many CCCBs contain a substantial amount of neutralizing potential, either as CaCO3 or CaOH. In addition, once a pH adjustment has been made, the coal ash in some CCCBs exhibit a large buffering capacity which provides resistance to further pH change. CCCBs also contain essential plant macronutrients and micronutrients. Rates of CCCBs to be applied to soil for pH adjustment can be easily determined by matching the soil=s lime requirement with the total neutralizing potential (expressed as calcium carbonate equivalency or CCE) of the CCCBs. Both analyses are commonly provided by university or other commercial testing laboratories and analytical procedures have been published (Thomas, 1996; Sims, 1996). For example, if a soil test indicates that 10 Mg/ha (4.5 tons/acre) of CaCO3 is required to achieve a final soil pH of 7.0 and the CCE value of the CCCB is 50%, then 20 Mg/ha (9.0 tons/acre) of the CCCB will need to be applied to the soil. A CCCB with a CCE value of 60% and containing 129 g/kg of magnesium (as CaMg(CO3)2) was tested as a limestone substitute at three different sites in Ohio. The Wooster site was the most acid with a pH of 4.6. The amount of CCCB applied was 0, 1/2, 1, and 2 times the lime requirement rate as determined by standard soil tests. The actual amount of CCCB applied at the maximum rate (i.e., two times the lime requirement) was 70 Mg/ha (31 tons/acre). This CCCB by-product consisted of a 40:60 (wt/wt) mixture of bed and cyclone materials from a pressurized fluidized bed combustion (PFBC) process and had a particle size distribution similar to conventional agricultural limestone. Approximately 25% of the cyclone portion of the by-product was the mineral dolomite (CaMg(CO3)2). The B concentration was approximately 190 mg/kg. Nutrient concentrations were adjusted by applying fertilizers. The CCCB was applied in September 1992 and alfalfa (Medicago aestivum L.) was planted that fall and corn (Zea mays L.) was planted the next spring. Alfalfa yields were increased slightly in 1993 (a very dry year) and more significantly in 1994 by application of the CCCB to the soil when compared to the untreated control. Unfortunately, an agricultural limestone treatment was not included to compare with the CCCB response. Corn yields were not significantly increased and this is probably due to corn being more tolerant of acid soil conditions than is alfalfa. Alfalfa and corn tissue elemental concentrations remained within sufficiency ranges for Mg, S, and Mo and were increased in the alfalfa grown on the CCCB treated soil, as compared to the untreated control soil, in 1993 but not in 1994. Although there was some evidence of increased concentrations of B in alfalfa tissue resulting from the CCCB application, these concentrations remained well below phytotoxic levels. Molybdenum concentrations also increased substantially, although this is commonly observed when acid soils are limed. This increase was thought not to be due to Mo in the CCCB material applied. Tissue concentrations of Al and Mn decreased in all samplings which can be directly attributed to the increased soil pH. Other results of this study can be summarized as follows. The Mg-containing CCCB was an effective soil liming material when applied according to standard CCE and soil tests. It neutralized soil acidity within the depth of incorporation and sustained a near neutral soil pH. Surface application of the CCCB also affected subsoil chemistry. The downward movement of Mg and sulfate was the main mechanism for this effect even though a large amount of CaSO4 was present in the CCCB. The much greater solubility of epsomite (MgSO4!7H2O) resulted in much greater and more rapid transport of Mg than Ca. Because there was more Mg than sulfate in the CCCB, sulfate was depleted in the surface soil before Mg. Following depletion of sulfate, transport of Mg and Ca decreased substantially

124
because their solubility was then controlled by their respective carbonate forms. The effect of the CCCB on subsoil chemistry also depended on the base-status of the subsoil. In a high Ca status subsoil, movement of Mg and Al from the surface decreased subsoil Ca and increased subsoil Al. In a subsoil with high Al concentrations, movement of Mg and sulfate from the surface decreased subsoil Al and increased subsoil Mg. A CCCB containing Mg, thus, may be more effective than gypsum in ameliorating subsoil Al phytotoxicity. A second experiment was begun at Wooster in 1997 and involved the use of a specific CCCB that contained expanded vermiculite clay and had a CCE of 46%. This CCCB was applied in the spring of 1997 at a rate based on the soil=s lime requirement to achieve pH 7 (18.3 Mg/ha or 8.2 tons/acre CCCB) and alfalfa was planted. Results after one year (Figure 1) showed that the CCCB significantly increased alfalfa yields compared to the untreated control. The yields on the CCCB treated plots (both with and without added fly ash) were higher than when soils were amended with agricultural limestone. This suggests there was a benefit obtained from applying the CCCB in addition to only pH adjustment. This benefit is probably due to the presence of trace elements contained in the CCCB. Obviously not all CCCBs are candidates as agricultural limestone substitutes for land application uses. Factors that may preclude their use are heavy metal concentrations that exceed the EPA 503 regulation limits, high B content, high soluble salt content and low acid neutralizing potential (Carlson and Adriano, 1993; Clark et al., 1995; Stehouwer et al., 1995a). Use of a material with a low CCE value would require much higher rates than are normally recommended (usually 10 to 50 Mg/ha which is equivalent to 4.5 to 22.3 tons/acre). Applying CCCBs for mine land reclamation, where soils are often severely degraded and contain very high levels of acidity, would be a situation where recommended rates would need to be increased. If CCCBs are weathered prior to their application to soil, many of the problems related to excessive B and salt concentrations can be avoided. Weathering also, however, decreases the liming benefit of the CCCBs. In all cases, especially where food crops will be grown, a careful chemical analysis of the CCCBs should be made prior to their application. The very small size of fly ash or CCCB particles makes material handling considerations a very important part of any beneficial land application program. When dry CCCB materials are applied to soil using a commercial limestone spinner spreader, excessive dusting occurs. A drop box spreader or any other spreader that can evenly apply the CCCB to the soil surface without dusting could be used. Wet CCCBs are also difficult to handle because they are formed as a paste-like material. After mixing with fly ash and lime, the material agglomerates into large chucks (5-30 cm diameter). These chunks will plug most lime spreaders, but are easily broken up by a manure spreader. We have found that when high rates of CCCBs are applied to soil for reclamation of abandoned surface coal mines, which often also require an organic amendment, it is possible to combine these two materials. For example, a CCCB mixed with a biosolid or yard trimmings compost creates a granular material that has excellent spreadability with minimum dusting. Coal Mine Spoil or Coal Refuse Treatment There has been a recent trend for coal mining companies in the Eastern United States to both sell coal to an end user and to remove or dispose of the coal combustion by-product once the coal is burned. The most obvious use of the CCCBs is to return it to the mine where the coal originated. There are also many abandoned (or orphaned) mine lands that often are located near an active mine that can benefit from land application of the CCCBs (Sutton and Dick, 1987). In the following section, we describe several uses of CCCBs that are specific to the coal mining industry. Several projects have been conducted in Ohio to investigate the use of CCCBs for reclamation of highly degraded mine soils or areas where coal refuse has been deposited and accumulated (Stehouwer et al., 1995b and 1995c). The project for which we have the most complete information is an abandoned clay and coal mine site, located near Dover, OH. This site was regraded during the summer of 1994 and the treatments were applied in the fall of 1994 just prior to seeding with a mixture of grasses and legumes. Approximately 1.2 m (4 feet) of overburden were placed above an impermeable clay layer and three treatments, each replicated two times, were then applied to the
125
overburden. They included: (1) 112 Mg/ha (50 tons/acre) of agricultural limestone mixed into the overburden and then 20 cm (8 inches) of resoil material placed over the overburden and treated with an additional 45 Mg/ha (20 tons/acre) of limestone; (2) 280 Mg/ha (125 tons/acre) of CCCB (an atmospheric fluidized bed combustion material) incorporated to a depth of 20 cm (8 inches); and (3) 280 Mg/ha (125 tons/acre) of CCCB plus 112/Mg (50 tons/acre) yard waste compost also incorporated to a depth of 20 cm (8 inches). The quality of both surface water and drainage water, representing that which leached downward to the clay layer and then laterally to the tile drains, was measured. All three treatments improved surface water quality. Changes in pH, soluble Al and sulfur concentrations before, during and after reclamation are shown in Figure 2. Calcium concentrations were also increased by the CCCB treatments, as compared to the resoil treatment, due to the gypsum in the CCCB material. Tile water was near neutral and Al concentrations were generally less than 3 mg/L. With the exception of B, trace element concentrations in surface and tile water generally remained very low and were unaffected by treatments. Mean concentrations of As, Ba, Cd, Cr, Cu, and Se were below detection limits or below primary drinking water standards. Boron is associated with the coal ash component of the CCCB. Although B concentrations were increased compared to the resoil treatment, they were below phytotoxic levels. Biomass production was greatest for the topsoil (i.e., resoil) treatment (Figure 3) but all treatments provided almost complete ground cover, thus protecting the site from erosion. Long-term effectiveness of the CCCB treatments is being studied to learn whether CCCB materials can create conditions that are ecologically sustainable and to ensure the site does not revert to the toxic and vegetation free environment present prior to reclamation. Groundwater quality was also monitored at the Fleming site. In addition to groundwater wells, lysimeter clusters were installed to provide a more rapid or initial estimate of the effect of CCCBs on groundwater quality. Interstitial water in the application area had pH values more than one unit higher and specific conductance more than 8 S/m higher compared to a control area or where a borrow topsoil was used in a traditional reclamation procedure (Haefner and Rowe, 1997). Other elements with concentrations higher in the interstitial water beneath the CCCB application area included SO4
2-, Cl, F, Ca, Mg and B. Sixteen months after reclamation was completed, there was no evidence that CCCBs had adversely affected the chemistry of groundwater beneath the reclamation areaCeven in shallow groundwater. Clean coal combustion by-products can be mixed with pyritic overburden to help neutralize acidity and buffer pH at a level high enough to prohibit formation of additional acidity. It can also be mixed with coal refuse, i.e., material high in sulfur content that is washed from the coal. Sometimes as much as 50% of the raw coal is removed in this washing process and the coal refuse may contain S concentrations that approach 20% due to the enrichment of pyrites (Daniels et al., 1995; Buttermore et al., 1978). Coal refuse disposal is a major problem because copious amounts of acidity are created in the refuse and is released as acid mine drainage (Daniels et al., 1995; Martin, 1974). This acid drainage must be collected in ponds and treated. Much of our early work involved treating coal refuse with dry CCCB materials that contained approximately equal amounts of ash, unreacted sorbent and reaction by-product (mostly CaSO4 and CaSO3). Dissolution of CaSO3 increases water pH by consuming hydrogen ions during formation of bisulfite ion (HSO3
-). Calcium sulfite is also an efficient reductant, limiting the concentrations of dissolved O2 and ferric ion in the solution that equilibrates with the coal refuse. These reducing reactions are rapid and have large equilibrium coefficients and when pH is less than 8, the presence of CaSO3 in a slurry can maintain dissolved O2 below 10 mg/L. Decreasing pH greatly accelerates the dissolution and oxidation of CaSO3 in water (Tseng and Rochelle, 1986; Masson, 1986) so that the inhibitory action of the SO3
2- is eventually lost. Under acid conditions, SO32- will also react to form sulfur oxide gases such as SO2 and
SO3, which can be toxic to plants (Clark et al., 1995). Therefore, the optimum combination for inhibiting formation of acidity is to combine the use of CaSO3 with a material that will result in an initial adjustment in pH to above 5.0 and preferably to 6.5 or higher. Pyrite oxidation and acid production are also inhibited by the sulfite species SO3
2-, HSO3- and H2SO3 found in CCCBs.
These species are toxic against Thiobacillus ferrooxidans, Thiobacillus thiooxidans, and Leptospirillum

126
ferrooxidans which are the main bacteria known to be involved in catalysis of pyrite oxidation (Hirose et al., 1991, Hurtado et al., 1987; Sugio et al., 1994 and 1995; Takeuchi and Suzuki, 1994). We recently began a series of experiments to determine the effectiveness of CaSO3 to inhibit acid production in coal refuse or mine spoil. These tests included: (1) a slurry experiment; (2) a lab-scale column (2.5 cm i.d. x 13 cm length) leaching experiment; and (3) a large-scale greenhouse (30 cm i.d. x 112 cm length) column leaching experiment. The fresh coal refuse used was generated by the gravity separation method and had a mean particle size >0.95 cm (classified as a coarse refuse) and contained 17.5% S. Calcium sulfite was synthesized in our lab and calcium CaSO3-based wet CCCB was obtained from the American Electric Power plant located near Coshocton, Ohio. The composition of this CCCB sample was 64% CaSO3, 10% CaCO3, 9% CaSO4, and 17% fly ash. In the slurry experiment, we incorporated 0.1 g to 0.2 g of CaSO3 every three days into a freshly ground (<2 mm) coal refuse slurry (1 g refuse in 100 ml water) maintained under normal oxygen (21%) and reduced (1%) O2 partial pressures. The reduced O2 partial pressure was tested because when coal refuse is buried and capped, the levels of O2 are much lower than found at the surface and the effectiveness of the CaSO3 treatment may be greater and longer lasting under such conditions. At both O2 partial pressures, CaSO3 prevented a decrease in pH. In the lab-scale column leaching experiments, CaSO3 (6.4 g) and a CCCB material (10 g) containing CaCO3 and fly ash were applied to 50 g fresh ground (<2 mm) coal refuse. The columns were leached (1 ml/h) with 20 ml water weekly for the initial 13 weeks and biweekly for the last 14 weeks. We found CaSO3 inhibited the onset of acid production for about one month and produced at least 36% less total leachate acidity than the control during the 27 weeks of the test (Figure 4). The CCCB inhibited acid production more effectively than CaSO3 alone and this seemed to be mainly due to a positive synergistic effect of the CaSO3 with components of the CCCB (i.e., CaCO3, fly ash, and possibly CaSO4). Iron and SO42-leaching also indicated pyrite oxidation inhibition by CaSO3 and this inhibition was increased by the CCCB. The positive synergistic interaction of CaSO3 with CCCB components is due to the great dependence of dissolution, oxidation, and speciation of CaSO3 in water on the pH, the O2 content, and the concentrations of various metal ions. At the equilibrium pH of a solution containing CaCO3 (about 8.0), the rate of dissolution and oxidation of CaSO3 is just rapid enough to maintain dissolved O2 below 10 mg/L resulting in inhibition of pyrite oxidation. Fly ash has small particle size (<0.05 mm), large surface area (>1 m2/g), and various metal oxides. Small sized particles can fill the pore spaces in coarse coal refuse and thus retard oxygen diffusion from the atmosphere into the coal refuse. In addition, the large surface area can adsorb protons and various metal ions and buffer pH which, in turn, can decrease sulfite oxidation kinetics. In the greenhouse column leaching experiment, we incorporated 5.5%, 11%, and 22% CCCB into the surface (0 to 15 cm) layer. To the middle (50 to 65 cm) layer of the same columns, we applied an additional 1.25%, 2.5%, and 5.0% CCCB, with the low to high rates in the middle layer matched with the low to high rates of CCCB applied to the surface layer, respectively. The columns were leached with water (0.5 liter water applied twice with two hours between each application) weekly for the first 13 weeks, biweekly for the second 14 weeks, and monthly for the last 12 weeks (total 39 weeks). The CCCB applied at the highest rate significantly (P # 0.01) increased leachate pH and decreased leachate acidity compared to the control (Figure 5). The inhibitory effects of the CCCB on acid production in the coal refuse decreased with decreasing amounts of the CCCB and with time. During the initial 27 weeks, the high rate of CCCB also significantly (P # 0.05) reduced concentrations of various elementsCespecially As, Fe, Ni, Pb and S, and Zn (Table 4). From the above experiments, we concluded that CaSO3 and CaSO3-based CCCBs can effectively inhibit acid production in coal refuse containing high concentrations of pyritic sulfur. This inhibition can be improved by initially adjusting the pH to at least 5.0 and restricting O2 diffusion into the coal refuse. The pH adjustment can be made by addition of CaSO3-containing CCCBs that are also alkaline. Oxygen diffusion in coal refuse can be inhibited by addition of fine particles such as fly ash to fill the pore space in coal refuse or placement of soil and vegetation covers on the surface of coal refuse to separate coal refuse from the atmosphere. An even stronger inhibitory effect

127
of CaSO3 on acid production in coal refuse can be achieved by placing CaSO3 or CaSO3-based CCCB at depth. Oxygen concentrations decrease rapidly with depth and any O2 in percolation water will be rapidly removed when it passes through the buried CaSO3 layer. Prolonged existence of CaSO3 at depth of coal refuse would also be important when the toxicity of dissolved sulfite species to the bacteria involved in pyrite oxidation is considered.
Other Uses This paper is not a comprehensive review of all known or potential land application uses of CCCBs. Some uses of CCCBs described (Table 5) have been developed and tested only in the most preliminary manner. Even greater use can be envisioned as many of the regulatory and material handling barriers that restrain CCCBS use are overcome. With imagination and a detailed knowledge and understanding of the properties of CCCBs, additional uses will undoubtably be discovered and developed in the future.
Summary and Conclusions Large amounts of CCCBs are created each year. If their properties are properly exploited, CCCBs can provide many economic benefits to both producers and end users. The key to a successful beneficial use program is knowing the properties that can be utilized, understanding the regulatory restraints to their use, and then to work effectively within these restraints. This chapter summarizes some of the properties that provide economic value to CCCBs and also some of the properties that must be carefully considered before land application uses can move forward. Case studies present examples of how CCCBs can be successfully used as a commercial product. Use of CCCBs in agriculture, coal extraction and processing, as an engineering or construction material, and for other less developed uses, demonstrate the value of the these materials. What is needed next is: (1) education of the general public of the benefits of using these by-products; (2) an acceptance by regulatory agencies that CCCBs are just as safe as other commonly used land application products (e.g., mineral fertilizers, limestone, various types of composts); and (3) the creation of companies or commercial partnerships that focus on the development and marketing of products derived from CCCBs.
Literature Cited Adriano, D.C., A.L. Page, A.A. Elseewi, A.C. Chang and I. Straughan. 1980. Utilization and disposal of fly ash and
other coal residues in terrestrial ecosystems: A review. J. Environ. Qual. 9:333-344. American Society for Testing and Materials. 1990. Standard specification for agricultural liming materials. V.
04.01. C 602-90. In Annual Book of ASTM Standards, American Society of Testing and Materials, Philadelphia, PA, USA.
Bohn, H.L., B.L. McNeal and G.A. O=Connor. 1979. Soil Chemistry. John Wiley & Sons, New York, NY, USA. 329
pages. Buttermore, W.H., E.J. Simcoe and M.A. Malloy. 1978. Characterization of coal refuse. Coal Res. Bureau, Tech. Rep.
159. West Virginia Univ., Morgantown, WV. Carlson, C.L. and D.C. Adriano. 1993. Environmental impacts of coal combustion residues. J. Environ. Qual. 22:227-247.

128
Clark, R.B., S.K. Zeto, K.D. Ritchey, R.R. Wendell and V.C. Baligar. 1995. Coal combustion by-product use on acid soil: Effects on maize growth and soil pH and electrical conductivity. p. 131-155. In Agricultural Utilization of Urban and Industrial By-Products. ASA Special Publication No. 58, American Society of Agronomy, Madison, WI, USA.
Daniels, W.L., B. Stewart and D. Dove. 1995. Reclamation of coal refuse disposal areas. Publ. No. 460-131. Virginia
State University and Virginia Polytechnical Institute and State University, Blacksburg, VA. Dick, W.A., J.M. Bigham, R. Forster, F. Hitzhusen, R. Lal., R. Stehouwer, S. Traina, W. Wolfe, R. Haefner and G. Rowe.
1999. Land application uses for dry flue gas desulfurization by-products: Phase 3. EPRI Report TR- 112916, Electrical Power Research Institute, Palo Alto, CA, USA. Dick, W.A., R.C. Stehouwer, J.M Bigham, W.E. Wolfe, Y.L. Hao, D.C. Adriano, J.H. Beeghly and R.J. Haefner. 2000.
Beneficial uses of flue gas desulfurization by-products: Examples and case studies of land application. p. 505-536. In J.F. Power and W. A. Dick (Eds.), Land Application of Agricultural, Industrial and Municipal By-Products, Soil Science Society of America, Madison, WI, USA.
Haefner, R.J. and G.L. Rowe. 1997. Water quality at an abandoned Ohio coal mine reclaimed with dry flue-gas
desulfurization by-products. U.S. Geological Survey Fact Sheet FS-051-97. Water Resources Division, US Geological Survey, Columbus, OH.
Hirose, T., H. Suzuki, K. Inagaki, H. Tanaka, T. Tano and T. Sugio. 1991. Inhibition of sulfur use by sulfite ion in Thiobacillus ferrooxidans. Agric. Biol. Chem. 55:2479-2484.
Hurtado, J.E., Y.L. Tsai and O.H. Tuovinen. 1987. Effect of oxyanions of sulfur on Thiobacillus ferrooxidans: ferrous ion oxidation, oxygen uptake, and cytochrome reduction. Curr. Microbiol. 15:111-113.
Jacobs, L.W., A.E. Erickson, W.R. Berti and B.M. Nackellar. 1991. Improving crop yield potentials of coarse textured soils with coarse fly ash amendments. In Proceedings of the 9th International Ash Use Symposium, Vol. 3, Eprigs-7162, pp.59-1to 59-16. American Coal Ash Association, Washington, DC.
Korcak, R.F. 1995. Utilization of coal combustion by-products in agriculture and horticulture. p. 107-130. In Agricultural Utilization of Urban and Industrial By-Products. ASA Special Publication No. 58, American Society of Agronomy, Madison, WI, USA.
Korcak, R.F. 1998. Agricultural uses of coal combustion by-products. p. 103-119. In R.J. Wright, P.D. Millner and R.F. Korcak (Eds.), Agricultural Uses of Municipal, Animal, and Industrial By-products. USDA National Technical Information Center, Springfield, VA.
Martens, D.C. and B.R. Beahm. 1976. Growth of plants in fly ash amended soils. In J.H. Faber, A.W. Babcock, and J.D. Spencer (Eds.), Proceedings of the 4th International Ash Utilization Symposium, St. Louis, MO, MERC SP-76/4, pp.657-664. ERDA Morgantown Energy Research Center, Morgantown, WV.
Martin, J.F. 1974. Quality of effluents from coal refuse piles. p. 26-37. In First symposium on mine and preparation plant refuse disposal. National Coal Association, Louisville, KY.
Masson, M.R. 1986. Sulfite, selenite, tellurites. p. 187-195. In Solubility data series. Pergamon Press, Oxford.
Mengel, K. and E.A. Kirby. 1987. Principles of plant nutrition. International Potash Institute, Bern, Switzerland.
Norton, L.D. 1995. Mineralogy of high calcium/sulfur-containing coal combustion by-products and their effects on

129
soil surface sealing. p. 87-106. In Agricultural Utilization of Urban and Industrial By-Products. ASA Special Publication No. 58, American Society of Agronomy, Madison, WI, USA.
Power, J.F. and W.A. Dick (Editors). 2000. Land Application of Agricultural, Industrial and Municipal By-Products. Soil Science Society of America, Madison, WI, USA. 623 pages.
Ransome, L.S. and R.H. Dowdy. 1987. Soybean growth and boron distribution in a sandy soil amended with scrubber sludge. Journal of Environmental Quality 16:171-175.
Ritchey, K.D., R.B. Clark, M.A. Elrashidi and V.C. Baligar. 2000. Properties and examples of beneficial use of gypsumlike by-products. p. 537-566. In J.F. Power and W. A. Dick (Eds.), Land Application of Agricultural, Industrial and Municipal By-Products, Soil Science Society of America, Madison, WI, USA.
Stehouwer, R., W. Dick, J. Bigham, L. Forster, F. Hitzhusen, E. McCoy, S. Traina, W. Wolfe and R. Haefner. 1995a. Land application uses for dry flue gas desulfurization by-products. EPRI Report TR-105264, Electrical Power Research Inst., Palo Alto, CA, USA.
Stehouwer, R.C., P. Sutton, R.K. Fowler and W.A. Dick. 1995b. Minespoil amendment with dry flue gas desulfurization by-products: Element solubility and mobility. J. Environ. Qual. 24:165-174.
Stehouwer, R.C., P. Sutton and W.A. Dick. 1995c. Minespoil amendment with dry flue gas desulfurization by-products: Plant growth. J. Environ. Qual. 24:861-869.
Stehouwer, R., W. Dick, J. Bigham, L. Forster, F. Hitzhusen, E. McCoy, S. Traina, W. Wolfe, R. Haefner and G. Rowe. 1998. Land application uses for dry flue gas desulfurization by-products: Phase 2. EPRI Report TR- 109652, Electrical Power Research Institute, Palo Alto, CA, USA.
Sugio, T., S. Uemura, I. Makino, K. Iwahori, T. Tano and R.C. Blake II. 1994. Sensitivity of iron-oxidizing bacteria, Thiobacillus ferrooxidans and Leptospirillum ferrooxidans, to bisulfite ion. Appl. Environ. Microbiol. 60:722-725.
Sugio, T., I. Makino, K. Iwahori, S. Uemura, M. Takai and T. Tano. 1995. Isolation and some properties of an iron-oxidizing bacterium Thiobacillus ferrooxidans resistant to bisulfite ion. Biosci. Biotech. Biochem. 59:435-438.
Sutton, P. and W.A. Dick. 1987. Reclamation of acid mined lands in humid areas. Adv. Agron. 41:377-405.
Takeuchi, T. and I. Suzuki. 1994. Effect of pH on sulfite oxidation by Thiobacillus thioxidans cells with sulfurous acid or sulfur dioxide as a possible substrate. J. Bacteriol. 176:913-916.
Thomas, B.W. 1996. Soil pH and soil acidity. pp. 475-490. In D.L. Sparks et al. (Eds.), Soil Analysis, Part 3: Chemical Methods. SSSA Book Series 5, Soil Science Society of America, Madison, WI.
Tseng, P. and G.T. Rochelle. 1986. Dissolution rate of calcium sulfite hemihydrate in flue gas desulfurization processes. Environ. Proc. 5:34-40.
Sims, J.T. 1996. Lime requirement. pp. 491-515. In D.L. Sparks et al. (Eds.), Soil Analysis, Part 3: Chemical Methods. SSSA Book Series 5, Soil Science Society of America, Madison, WI.
U.S. Environmental Protection Agency (USEPA). 1993. Standards for the use of or disposal of sewage sludge: Final rule. Federal Register 58:032, part II (19 Feb. 1993), USEPA, Washington, DC.

130
______________________________ 1Warren Dick is a Professor of Soil and Environmental Science at The Ohio State University in Wooster, Ohio. He is actively involved in understanding the characteristics of coal combustion by-products, especially those created by different sulfur scrubbing processes. He also has conducted studies related to various land application uses of coal combustion by-products including their use as an agricultural lime substitute for surface mine land reclamation, as a sulfur and trace mineral nutrient source for crop production, and for treatment of coal refuse to reduce acid production and drainage. Warren is currently serving a second three year term as Editor of the Journal of Environmental Quality and beginning January 1, 2000 has assumed the role of Editor-in-Chief of all publications produced by the Soil Science Society of America.
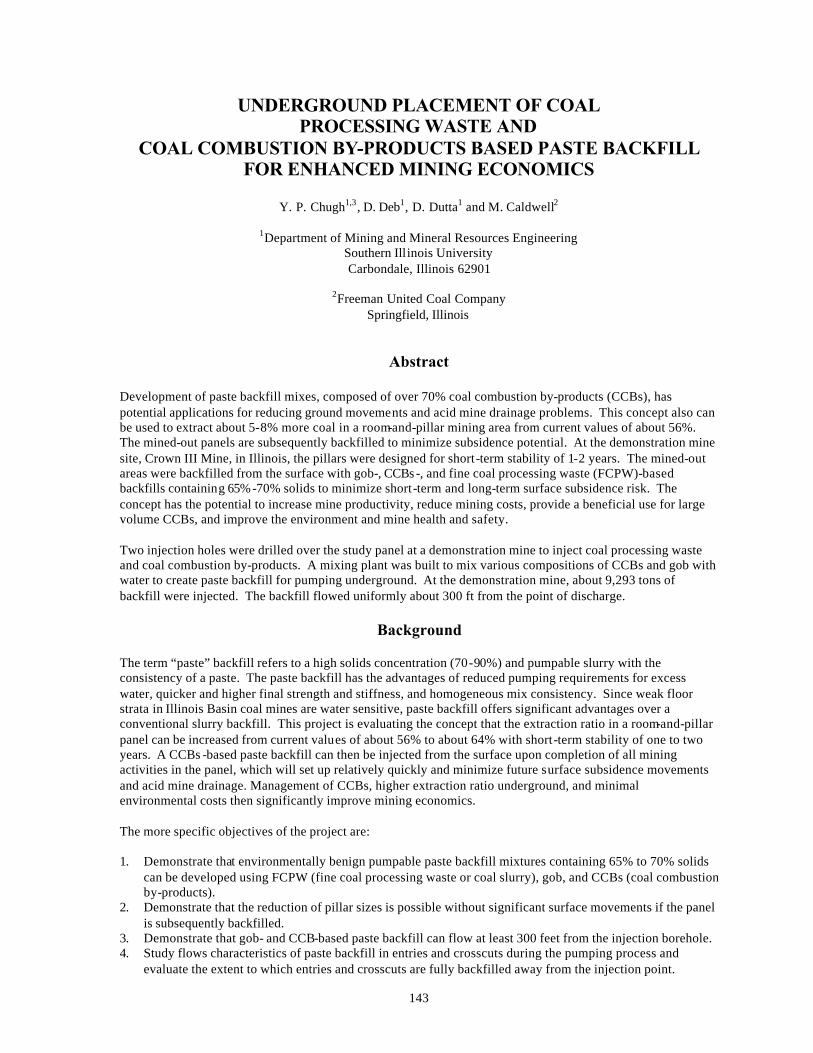
143
UNDERGROUND PLACEMENT OF COAL PROCESSING WASTE AND
COAL COMBUSTION BY-PRODUCTS BASED PASTE BACKFILL FOR ENHANCED MINING ECONOMICS
Y. P. Chugh1,3, D. Deb1, D. Dutta1 and M. Caldwell2
1Department of Mining and Mineral Resources Engineering Southern Illinois University Carbondale, Illinois 62901
2Freeman United Coal Company
Springfield, Illinois
Abstract
Development of paste backfill mixes, composed of over 70% coal combustion by-products (CCBs), has potential applications for reducing ground movements and acid mine drainage problems. This concept also can be used to extract about 5-8% more coal in a room-and-pillar mining area from current values of about 56%. The mined-out panels are subsequently backfilled to minimize subsidence potential. At the demonstration mine site, Crown III Mine, in Illinois, the pillars were designed for short-term stability of 1-2 years. The mined-out areas were backfilled from the surface with gob-, CCBs -, and fine coal processing waste (FCPW)-based backfills containing 65% -70% solids to minimize short-term and long-term surface subsidence risk. The concept has the potential to increase mine productivity, reduce mining costs, provide a beneficial use for large volume CCBs, and improve the environment and mine health and safety. Two injection holes were drilled over the study panel at a demonstration mine to inject coal processing waste and coal combustion by-products. A mixing plant was built to mix various compositions of CCBs and gob with water to create paste backfill for pumping underground. At the demonstration mine, about 9,293 tons of backfill were injected. The backfill flowed uniformly about 300 ft from the point of discharge.
Background The term “paste” backfill refers to a high solids concentration (70-90%) and pumpable slurry with the consistency of a paste. The paste backfill has the advantages of reduced pumping requirements for excess water, quicker and higher final strength and stiffness, and homogeneous mix consistency. Since weak floor strata in Illinois Basin coal mines are water sensitive, paste backfill offers significant advantages over a conventional slurry backfill. This project is evaluating the concept that the extraction ratio in a room-and-pillar panel can be increased from current values of about 56% to about 64% with short-term stability of one to two years. A CCBs -based paste backfill can then be injected from the surface upon completion of all mining activities in the panel, which will set up relatively quickly and minimize future surface subsidence movements and acid mine drainage. Management of CCBs, higher extraction ratio underground, and minimal environmental costs then significantly improve mining economics. The more specific objectives of the project are: 1. Demonstrate that environmentally benign pumpable paste backfill mixtures containing 65% to 70% solids
can be developed using FCPW (fine coal processing waste or coal slurry), gob, and CCBs (coal combustion by-products).
2. Demonstrate that the reduction of pillar sizes is possible without significant surface movements if the panel is subsequently backfilled.
3. Demonstrate that gob- and CCB-based paste backfill can flow at least 300 feet from the injection borehole. 4. Study flows characteristics of paste backfill in entries and crosscuts during the pumping process and
evaluate the extent to which entries and crosscuts are fully backfilled away from the injection point.

144
5. Study shrinkage, durability, and strength-deformation properties of the pumped backfill as curing progress. 6. Study impacts of backfilling on surface movements. 7. Perform industrial engineering and cost studies for paste backfill placement in an active mine. 8. Evaluate environmental impacts of paste backfill placement in an active mine. This project is a cooperative effort between the industry, university, and the State and Federal government. The State’s Office of Coal Development and Marketing and the Federal Energy Technology Laboratory are actively involved in the project. For the purpose of this concept demonstration, Crown III Mine of Freeman United Coal Company developed a small panel (hereafter called the backfilling panel) with eight entries with 80 ft by 60 ft (center-to-center) pillar sizes and 20 ft entry width (Figure 1). The pillars were designed for short-term stability of 1-2 years. Secondary mining was done in this panel to increase the extraction ratio from 50-55% to 65%. Two injection holes were drilled over the study area to inject paste backfill consisting of coal processing waste and coal combustion by-products into the panel. For this purpose, a plant was built to mix about 10% F-ash, 50% FBC, and 40% gob with water for pumping underground. Underground backfilling was started on August 11, 1999 through the primary borehole and subsequently on October 13, 1999 through the secondary borehole. Altogether 9,293 tons of backfill were injected underground and it flowed in all directions from the point of discharge. The backfill flowed as a sheet covering the entire width of the opening. A maximum flow distance of 300 ft was observed underground. Underground visits were made periodically to measure roof-to-floor convergence to obtain the general conditions of the roof and floor. Underground roof-to-floor convergence in the backfilling panel taken in March 1999 showed a convergence of 1.8 inches in the center of the panel. It was also found that in some intersections roof falls occurred and those areas might be inaccessible in the future.
Figure 1. Location of underground convergence stations and surface.
BACKFILLING PANEL
8N
9N 1N 2N 3N 4N 5N 6E 7
E 8E
10E
11E
13M
12M
9E
14M
15M
A
A’ B
B’
CC’
H
H’
G
G’
7
6
5
4
3
2
1
Primary injection hole
Alternative injection hole
Subsidence monuments
Convergence station
Note: G4 and G6, and H3 and H6 convergence stations are destroyed.

145
Pertinent Previous Work Large volume management of CCBs (coal combustion by-products) in underground mines to control subsidence and acid mine drainage has significant possibilities, particularly in Illinois where high sulfur coals at shallow mining depths are exploited and protection of prime agricultural lands and groundwater resources is crucial. A cooperative research agreement between the U.S. Department of Energy and Southern Illinois University at Carbondale was initiated in 1993 to develop blind backfilling technologies to manage CCBs and FGD (flue gas desulfurization) by-products in underground mines to control surface subsidence (Chugh et al, 1996). A paste backfill grout made of 48% scrubber sludge, 52% fly ash/bottom ash mixture, and 2 to 3% lime was used for hydraulic backfilling. About 8,062 tons of grout were injected into an abandoned coal mine near Pawnee, Illinois. Monitoring of ground movements before and after backfilling has indicated that the rate of vertical surface displacement after backfilling is much lower (in the range of 4 mm after six months of backfilling operation). Recent measurement (January 2000) indicates that no measurable vertical downward ground movement has occurred for the last one year. Underground backfilling operations have been carried out using mine tailings, slurry mixes, cement mixes, and CCBs. Several researchers have performed backfill operations in abandoned mines to reduce surface subsidence (Whaite and Allen, 1975; Maser et al., 1975; Petulanas, 1988). Slurry backfilling, fly ash-cement sealant, and high volume fly ash were used in those studies. Enhanced extraction ratio and acid mine drainage control studies have also been performed in the United States as well as in other countries (Palarski, 1993; Gray et al., 1995; and Chugh 1996).
Paste Backfill – Previous Experience in Illinois As indicated earlier, a paste backfill may be defined as a high solids concentration (70-90%) and pumpable slurry with a paste like consistency. The ASTM slump for a paste backfill may range from larger than zero to less than 12 inches, with bleed typically less than 4%. Since the solid and liquid phases do not separate significantly over a short period of time in a paste backfill, it is easy to refluidize the fill in a pipeline and start pumping operations. A small proportion of fines, typically less than 20 microns, is required to develop a paste backfill (Brackebusch, 1994). Since a paste backfill has low water content, it should be beneficial for mines with weak floor strata. Chugh et al. (1998) demonstrated the development of a CCBs -based paste backfill to fill an abandoned mine panel near Pawnee, Illinois. The backfill was composed of scrubber sludge, F-ash, bottom ash, and 1-2% lime. The solids concentration was over 70%, with bleed less than 3%, and ASTM slump height of 9 to 10 inches. Compressive strength values of over 400 psi were achieved. Strength and elastic modulus of cured mixes can be varied depending on the composition and proportion of different elements. Over 8,000 tons of the designed backfill were pumped with flow distance of at least 200 feet.
Development of CCBs and CPW Based Paste Backfill Mixes in the Current Study The goal of this study was to investigate if a paste backfill can be developed with CCBs and CPW so that potential acid mine drainage problems can be minimized. Based on the coal company interests, paste backfill development was limited to CCBs and coarse coal refuse (gob) only. The gob was crushed to minus 1/4-inch size before using it as part of the paste backfill development in the laboratory, and minus ¾ inch in the field demonstration. Several paste backfill mixes were prepared in the laboratory using different compositions of FBC ash, F ash, and gob. The main idea was to develop a mix that will flow at least 300 ft from the point of discharge and possess about 300 to 400 psi compressive strength with elastic modulus of 20,000 to 25,000 psi. In addition, environmental characteristics must be suitable to minimize acid drainage development.
Characteristics of Gob and CCBs Crown III Mine supplied gob (coarse coal refuse of coal processing rejects) and FBC (fluidized bed combustion) fly ash. As the size of gob varied between -4 inches to +28 mesh, the as-received gob was crushed

146
in the laboratory to sizes less than 0.25 inches. However, in the field demonstration, gob was crushed using a jaw crusher to a maximum size of 0.75 inch. Particle size distribution data show that about 62% (by weight) of gob particles are finer than 0.1 inch for field crushed samples as compared to 90% (by weight) for laboratory crushed samples (Figure 2).
Figure 2. Particle Size Distribution for field and Laboratory Crushed Gob Samples. F-type fly ash was obtained from the Coffeen power plant. Water content in the F-ash ranges from 9 to 16% but it could increase to 22% if ash is rain soaked. The moisture content of the as-received materials, particle sizes, and calcium carbonate equivalent (CCE) values of the raw materials (gob, FBC, and F-type fly ash) were determined (Table 1). CCE values indicate that the proportions of FBC fly ash will dictate the CCE of the mix. By thoroughly mixing crushed gob, a potential acid producing material, with FBC fly ash, a highly alkaline material, it is possible to neutralize acid forming potential of the gob.
Table 1. Selected Physical Properties of Mix Components.
Properties Gob FBC fly ash F-type Fly ash+ Mean particle size 0.09 inches 33.2 microns 32.6 microns
As-received moisture 9.0 % 0.0 % 16.0% CCE 9.3% 75.0% 3.7%
Paste pH 3.2 12.8 8.8 +: From Coffeen power plant
Mix Development and Characterization Eighteen (18) preliminary mixes were made using water to make a grout of slump between 9.0 to 10.0 inches. Proportions of gob and FBC were varied from 25% to 75%. The ratio of F-type fly ash to FBC fly ash was kept in the range of 0.0 to 1.2. Figure 3 shows the bleed of freshly prepared grouts for slump values in the range of 9 to 11 inches. Low bleed values (1% to 3%) suggest that the developed mix may be a suitable paste backfill. Cylindrical samples of cured grouts were tested for compressive strength at 7-day and 28-day curing. All the samples were cured at room temperature and humidity. Tables 2 and 3 show mix components and the engineering properties for different mixes.
0
20
40
60
80
100
0.0010.010.11
Particle Size (inch)
% F
iner
by
Wei
ght
Gob Crushed at Crown III
Crushed at Lab
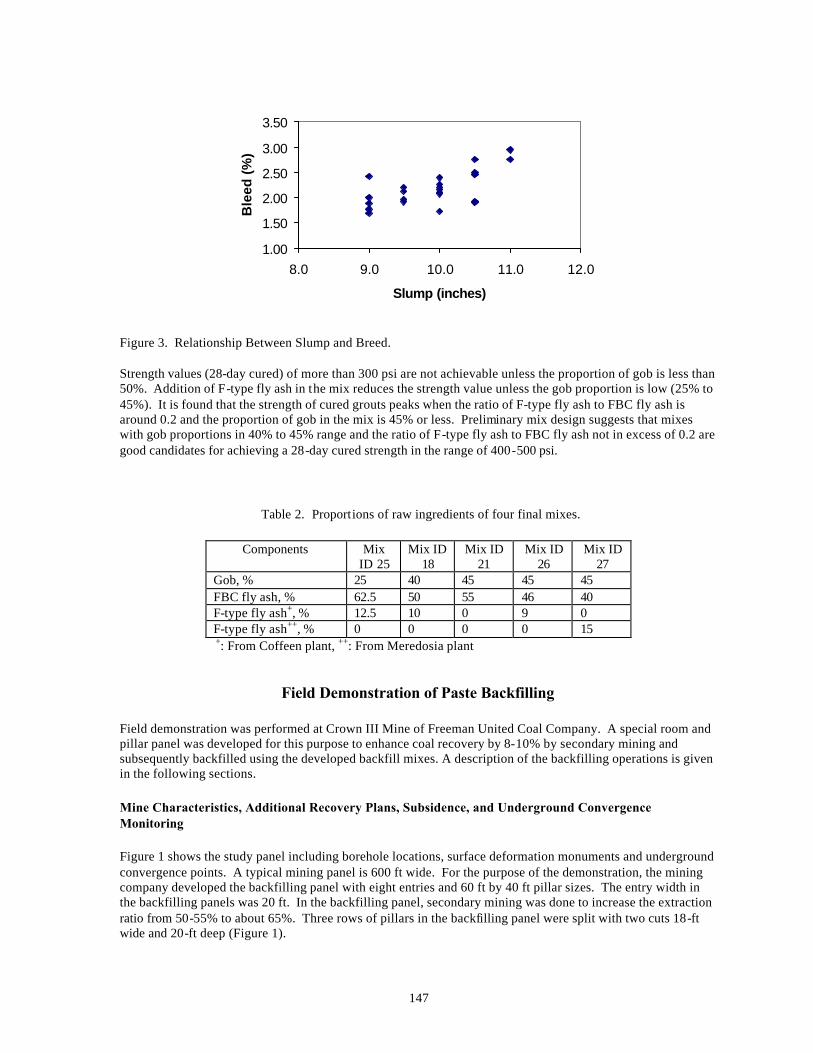
147
Figure 3. Relationship Between Slump and Breed. Strength values (28-day cured) of more than 300 psi are not achievable unless the proportion of gob is less than 50%. Addition of F-type fly ash in the mix reduces the strength value unless the gob proportion is low (25% to 45%). It is found that the strength of cured grouts peaks when the ratio of F-type fly ash to FBC fly ash is around 0.2 and the proportion of gob in the mix is 45% or less. Preliminary mix design suggests that mixes with gob proportions in 40% to 45% range and the ratio of F-type fly ash to FBC fly ash not in excess of 0.2 are good candidates for achieving a 28-day cured strength in the range of 400-500 psi.
Table 2. Proportions of raw ingredients of four final mixes.
Components Mix ID 25
Mix ID 18
Mix ID 21
Mix ID 26
Mix ID 27
Gob, % 25 40 45 45 45 FBC fly ash, % 62.5 50 55 46 40 F-type fly ash+, % 12.5 10 0 9 0 F-type fly ash++, % 0 0 0 0 15 +: From Coffeen plant, ++: From Meredosia plant
Field Demonstration of Paste Backfilling Field demonstration was performed at Crown III Mine of Freeman United Coal Company. A special room and pillar panel was developed for this purpose to enhance coal recovery by 8-10% by secondary mining and subsequently backfilled using the developed backfill mixes. A description of the backfilling operations is given in the following sections. Mine Characteristics, Additional Recovery Plans, Subsidence, and Underground Convergence Monitoring Figure 1 shows the study panel including borehole locations, surface deformation monuments and underground convergence points. A typical mining panel is 600 ft wide. For the purpose of the demonstration, the mining company developed the backfilling panel with eight entries and 60 ft by 40 ft pillar sizes. The entry width in the backfilling panels was 20 ft. In the backfilling panel, secondary mining was done to increase the extraction ratio from 50-55% to about 65%. Three rows of pillars in the backfilling panel were split with two cuts 18-ft wide and 20-ft deep (Figure 1).
1.00
1.50
2.00
2.50
3.00
3.50
8.0 9.0 10.0 11.0 12.0
Slump (inches)
Ble
ed (
%)

148
Table 3. Properties of final mixes.
Properties Mix 25 Mix 18 Mix 21 Mix 26 Mix 27 7-day strength, psi 479 243 168 430 149 28-day strength, psi 523 523 492 579 299 7-day elastic modulus, psi 22,407 20,000 19,433 26,452 9,000 28-day elastic modulus, psi 36,822 27,000 37,156 33,750 11,387 Water requirement for 9-inch slump, % 40 36 39 40 42 Bleed at 9-10 inch slump, % 1.1 1.6 1.6 1.6 1.1 CCE, % 45 44 41 36 32 Density of fresh grout, pcf 109 Density of 28-day cured grout, pcf 90
Surface subsidence movement stations along line A-A’, B-B’ and C-C’ were installed at variable intervals (Figure 1). Measurement of vertical ground movements started prior to secondary mining and the last measurement was recorded on August 12, 1999. After that period most of the monuments were destroyed due to vehicle movements, digging of surface trench, etc. Since this area was eventually ponded with coal combustion by-products, no more surface movements could be collected in this area. Underground convergence stations numbered G1 through G7 and H1 through H7 were monitored periodically to measure underground movements (Figure 1). A convergence station consisted of a roof bolt head and a square head bolt, vertically beneath the roof bolt, anchored into the floor. It is designed to measure the roof-to-floor convergence using a convergence rod. Underground roof-to-floor convergence monitoring could be carried out until March 23, 1999. Some of the convergence stations were damaged due to roof falls and reaching other measuring stations became unsafe. As a result, the underground monitoring program was abandoned. Mixing and Underground Placement Plant Figure 4 shows the schematic of the mixing plant at Crown III Mine. Three hoppers were used to load FBC, F-ash, and gob into three conveyor belts, which fed the main belt. By controlling opening width of hoppers and speeds of respective conveyor belts, the final dry mix of 53% FBC, 33% gob, and 14% F-ash was obtained. Characteristics of various components of the mixing plant are given in Table 4. This mix is similar to the mix ID 18 which has considerable strength and stiffness and is also designed to control acid mine drainage. At the pug mill, water is added to mix solids; then the paste backfill is pumped into the injection hole.
Figure 4. Schematics of mixing plant at Crown III Mine.
Water pipe
Pug mill
FBC hopper
F-ash hopper
Gob hopper X Main Conveyor belt
FBC belt
Gob belt F-ash belt
To injection hole
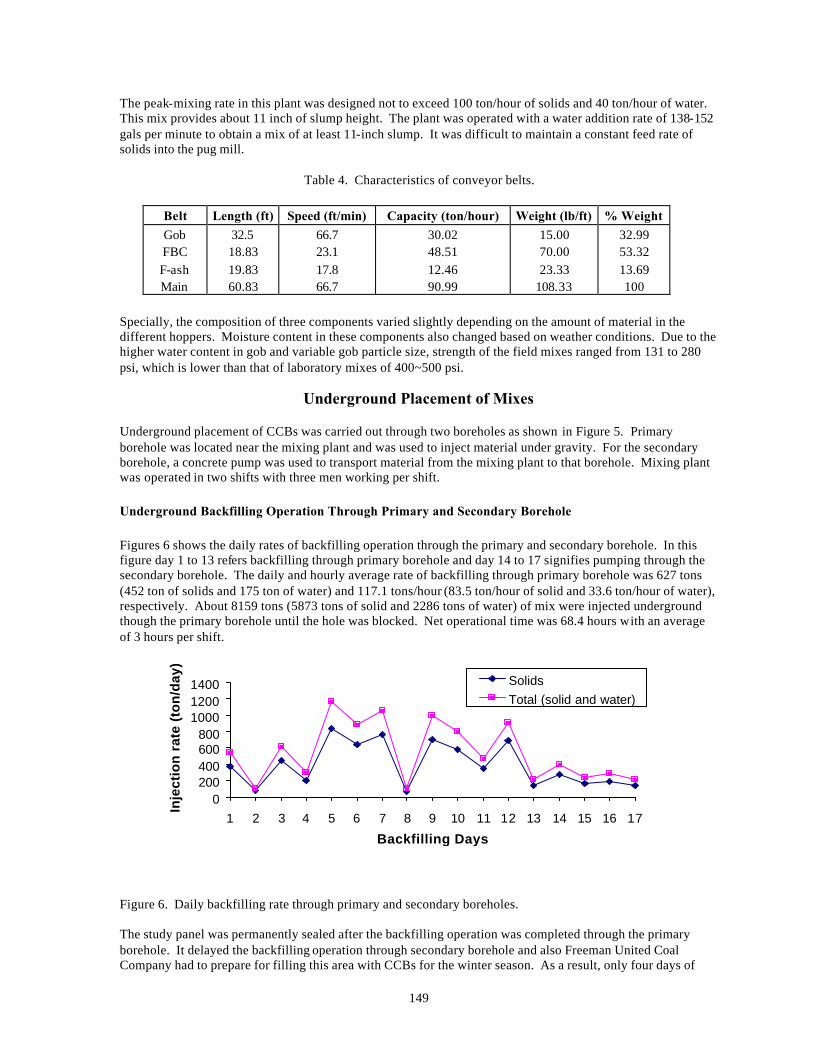
149
The peak-mixing rate in this plant was designed not to exceed 100 ton/hour of solids and 40 ton/hour of water. This mix provides about 11 inch of slump height. The plant was operated with a water addition rate of 138-152 gals per minute to obtain a mix of at least 11-inch slump. It was difficult to maintain a constant feed rate of solids into the pug mill.
Table 4. Characteristics of conveyor belts.
Belt Length (ft) Speed (ft/min) Capacity (ton/hour) Weight (lb/ft) % Weight Gob 32.5 66.7 30.02 15.00 32.99 FBC 18.83 23.1 48.51 70.00 53.32 F-ash 19.83 17.8 12.46 23.33 13.69 Main 60.83 66.7 90.99 108.33 100
Specially, the composition of three components varied slightly depending on the amount of material in the different hoppers. Moisture content in these components also changed based on weather conditions. Due to the higher water content in gob and variable gob particle size, strength of the field mixes ranged from 131 to 280 psi, which is lower than that of laboratory mixes of 400~500 psi.
Underground Placement of Mixes Underground placement of CCBs was carried out through two boreholes as shown in Figure 5. Primary borehole was located near the mixing plant and was used to inject material under gravity. For the secondary borehole, a concrete pump was used to transport material from the mixing plant to that borehole. Mixing plant was operated in two shifts with three men working per shift. Underground Backfilling Operation Through Primary and Secondary Borehole Figures 6 shows the daily rates of backfilling operation through the primary and secondary borehole. In this figure day 1 to 13 refers backfilling through primary borehole and day 14 to 17 signifies pumping through the secondary borehole. The daily and hourly average rate of backfilling through primary borehole was 627 tons (452 ton of solids and 175 ton of water) and 117.1 tons/hour (83.5 ton/hour of solid and 33.6 ton/hour of water), respectively. About 8159 tons (5873 tons of solid and 2286 tons of water) of mix were injected underground though the primary borehole until the hole was blocked. Net operational time was 68.4 hours with an average of 3 hours per shift.
Figure 6. Daily backfilling rate through primary and secondary boreholes. The study panel was permanently sealed after the backfilling operation was completed through the primary borehole. It delayed the backfilling operation through secondary borehole and also Freeman United Coal Company had to prepare for filling this area with CCBs for the winter season. As a result, only four days of
0200400600800
100012001400
1 2 3 4 5 6 7 8 9 10 11 12 13 14 15 16 17
Backfilling Days
Inje
ctio
n r
ate
(to
n/d
ay)
SolidsTotal (solid and water)

151
operation were possible through the secondary borehole as shown in Figure 6. Within these four days, 1134 tons (773 tons solid and 361 tons water) were placed underground in 14.4 net hours of operation. The hourly average rate was 79 ton/hour (54 ton/h solid and 25 ton/h water). These rates are lower than those in the primary hole due to the size restriction of the concrete pump. Altogether using both holes, about 9293 tons of solid and water mix were injected underground. The overall water to powder ratio was about 0.40 with 11-inch slump height. Underground Flow Characteristics It was found that the mix flowed in all four directions, especially toward the west and southwest. Mine entries were filled to within 1 ft of the roofline within 30-ft in all directions from the primary borehole. The backfill flowed a maximum distance of 300 ft with a gradient of two degrees as shown by the shaded region in Figure 5. It also was observed that the mix flowed uniformly as a sheet and did not form any channels. There was hardly any separation between solids and water. High volume of gob in the mix did not impede underground flow behavior. Moreover, the strength of mix after twenty-four hours of curing was enough to sustain the weight of a human being. Underground observers had no problem walking over the thick sheet of mix.
Vertical Ground Movements and Underground Roof to Floor Convergence
Prior to the backfilling operation, roof-to-floor convergence and surface subsidence data were collected periodically. Rate of vertical surface movements was about 0.5 to 0.6 inch per year. The average downward movement over two years was 1.16 inch and it was uniform over the entire panel (Figure 7). There ware no significant differential movements over the entire backfill panel. However, just after backfilling, the surface had to be prepared for land filling with CCBs. Thus, no ground movement measurement could be recorded after backfilling.
Figure 7. Vertical ground movement over the backfill panel. Underground roof-to-floor convergence data taken after 18-months of secondary mining in the backfilling panel indicates that about 2.0 inches of convergence had occurred at the center of the panel (Figure 8). This is because of heaving associated with weak floor strata. Also, the roof shale above the coal seam sags over a period of time and increases roof-to-floor convergence. A few roof falls also occurred at intersections.
-2
-1
0
1
2
3
0 100 200 300 400Distance (ft)
Su
rfac
e D
efo
rmat
ion
(i
nch
)
Along AA' line, August 12, 1999
Along BB' line, August 12, 1999
Along CC' line, August 12, 1999

152
Figure 8. Roof to floor convergence at the study panel after one and half year of secondary mining.
Economics of Underground Management Economic analysis of backfilling for all panels was performed by Freeman United Coal Company (Caldwell, 1999). Preliminary analyses indicate that the proposed technology and concept have potential to enhance economics of underground mining in Illinois. In performing these analyses, capital requirements of equipment, ash plant, ash/slurry pond, and other operating costs such as land, royalty, trucking, road, and site development, etc. were considered. Additional more detailed analyses are currently underway by the Company.
Conclusions The concept of paste backfilling using CCBs and CPW has potential to enhance mine economics through higher recovery and reduced environmental impacts such as mine subsidence, and acid mine drainage. Paste backfill material composed of gob, FBC fly ash, and F-type fly ash was successfully developed and demonstrated for use at the demonstration mine site. Over 9,000 tons of material were injected underground through two boreholes. The overall water powder ratio was close to 0.4. Underground flow behavior was excellent without much separation of solids and water. A high amount of gob in the mix did not impede flow behavior. An underground visit revealed that material flowed a distance of about 300 ft as expected. Material flow was uniform and sheet-like. Backfill material provides lateral support to the coal pillars increasing their effective width and reducing the effective opening height. This improves long-term pillar strength and thus reduces potential for long-term surface movements. The underground management of by-products also will be economically beneficial to both the mining and the electric utility companies. Integrating gob and FBC (a highly alkaline material) thoroughly can minimize environmental concerns associated with the acid-producing gob. In this study, the pH of filled mixes ranges from 9.47 to 10.0 with a CCE value of 2-kg/ m ton. When placed underground, a cured mix of gob and FBC fly ash should have little oxidation potential, which should further reduce the acid producing capability of gob. Economic analyses of underground management of coal processing wastes and CCBs were done by the mining company (Freeman United Coal Company) and preliminary analyses indicate an economic potential for the concept and technology.
References Brackebush, F.W, 1994, “Basics of Paste Backfill Systems”, Mining Engineering , v. 46, p. 1175-8. Caldwell, Mike, 1999, Economic Analysis: Underground Placement of Coal Processing Waste and Coal
Combustion By-Products Based Backfill for Enhanced Mining Economics, A Report Prepared by the Freeman United Coal Company
00.5
11.5
2
2.5
1 2 3 4 5 6 7
Convergence stations
Roo
f-to
-flo
or
conv
erge
nce,
inch
es
November 19, 1997 January 19, 1998May 11, 1998 June 30, 1998March 23, 1999

153
Chugh, Y. P., F. Brackebusch, J. Carpenter, D. Dutta, S. Esling, G. Klinzing, B. Paul, E, Powell, H. Sevim, E. Thomasson, X. Yuan, 1996, Management of dry flue gas desulfurization by-products in underground mines, Phase I Final Report, Submitted to Morgantown Energy Technology Center under DOE Agreement No. DE-FC21-93MC 30252, pp. 218.
Chugh, Y.P., D. Dutta, 1998, Underground placement of coal processing waste and coal combustion by-
products based paste backfill for enhanced mining economics, Mid-Year Technical Report submitted to Illinois Clean Coal Institute, ICCI project number 97US-1
Gray, D. D., W. J. Head, H. J. Siriwardane, and W. A. Sack, 1995, Disposal of fluidized bed combustion ash in
an underground mine to control acid mine drainage and subsidence, in Proc. of International Ash Utilization Symposium, October 23-25, Lexington, Kentucky.
Maser, K. R., R. E. Wallhagen, J. Dieckman, 1975, Development of a fly ash-cement mine sealing system, U.S.
Bureau of Mines, Open File Report 26-76, NTIS PB-250 611. Palarski, J., 1993, The use of fly ash, tailings, rock, and binding agents as consolidated backfill for coal mines,
in Proc. of Minefill 93, ed. H. W. Gelen, the South African Inst. of Min. and Metal, pp. 403-408. Petulanas, G. M., 1988, High volume fly ash utilization projects in the United States and Canada (2nd Ed.),
Final Report CS-4446 to EPRI, Palo Alto, CA, pp. 244. Whaite, R. H. and A. S. Allen, 1975, Pumped slurry backfilling of inaccessible mine workings for subsidence
control, U.S. Bureau of Mines, Information Circular 8667.
Acknowledgements
The authors sincerely acknowledge the financial support of the Office of Coal Development and Marketing of the Illinois Department of Commerce and Community Affairs and the Federal Energy Technology Laboratory of the U.S. Department of Energy. The cooperation and financial support of Freeman United Coal Company and other cooperating coal companies is also sincerely appreciated.
______________________________ 3Paul Chugh has BS, MS, and Ph.D. degrees in Mining Engineering; the latter two are from The Pennsylvania State University. Dr. Chugh has been at Southern Illinois University for the past 23 years. For the past 9 years, he has been actively engaged in research, development, and demonstration studies related to coal combustion by-products. He has commercialized three CCBs -based lightweight structural materials for use in mining industries. Currently, he is developing utility poles from CCBs and hopes to commercialize them in the near future. He is currently Director, Combustion By-products Recycling Consortium-Midwestern Region.

150
6.8
All entry/cross cut widths are 18 ft
LEGEND
Roof fall height, ft
a.b: Extraction height, ft
Entry/cross cut width, ft
High top cre ated by the continuos miner, ft
Primary borehole
Secondary borehole
Major roof falls
Unsafe Area Mix flowed underground
Expected Mix flow underground Height of mix from the roof
a.b
-a.b
a.b
6.5 8.1 6.9 6.3 7.4
9.4 7.2
7.8
7.8 9.3 6.6 8.1 7.4
7.2 6.9 6.8 6.9 9.3
7.7
8.1
18.1
18.2
6.5 7.7 6.9
10.3
8.8 7.0 7.7 7.9
7.3
6.4 6.7
-2.0 7.3 6.3 7.3
7.0 6.7 5.8 6.8 7.3 6.0 6.5 10.3
-4.0 -6.0
6.6
6.7 6.9 6.5 7.3 7.0 7.5 9.8 18.1
7.0 6.9 6.6 6.8 6.8
-4.0 -1.0
-5.0 -5.0
-2.0 4.0
4.0 2.0
2.0
-4.0
-3.0 18.1
18.1 6.9
7.3
11.3 12.1 7.1 7.1 7.8 9.6 6.8 7.3
Figure 5. Underground condition of the panel after backfilling.
6.7 9.0 7.2 6.9 8.9 6.8 7.1 -4.0 -5.0 -5.0
4.0 -4.0 -3.0 9.7
a.0
18.1

151
155
RE-MINING WITH CCBs AT THE BROKEN ARO DEMONSTRATION SITE
Ben J. Stuart7 and Gary Novak8
7Department of Civil Engineering Ohio University
Athens, Ohio 8Division of Mines and Reclamation
Ohio Department of Natural Resources Cambridge, Ohio
Abstract Re-mining has the benefits of recovering an energy reserve not usually accessible because of abandoned underground mines. The hidden dangers of abandoned underground mines during re-mining include: mine gases, unstable roof, volumes of acid water, and unstable highwall. However, re-mining offers exposure of the acid mine drainage (AMD) source and dewatering of the mine complex. Additionally, re-mining allows for simple placement of a continuous mine seal that would be effective for multiple openings and additional entries. Re-mining of the coal reserve is not economically feasible for the coal company due to AMD responsibilities. Thus, a joint effort between Ohio DNR-Division of Mines and Reclamation, R&F Coal, and American Electric Power allowed for a controlled test site to evaluate re-mining as an AML restoration and AMD abatement technique. An abandoned underground mine complex last mined in 1910 in Coshocton County, Ohio, Broken Aro Mine is located on Woodbury wildlife area, seven miles west of Coshocton. The site forms the headwaters of the Simmons Run Watershed. This paper will present the planning and completion of the re-mining effort and the flue gas desulfurization material (FGD) seal placement. Preliminary and post-mining water quality monitoring is used as an indicator as to the effectiveness of the AMD abatement. Included in the environmental assessments are 24 surface water locations and 14 monitoring wells. Mine inundation is evaluated through water levels in the wells and subsequent water quality monitoring is utilized to assess mine flooding effects on water quality both inside and outside of the mine openings.
Introduction The Broken Aro Mine site is located about seven miles west of Coshocton, Ohio on State Route 541 at the Woodbury Wildlife Preserve. An abandoned underground mine complex last mined in 1910, this site forms the headwaters of the Simmons Run Watershed. A No. 6 and a deeper No. 5 coal seam on the 40-acre site have been mined by means of underground mining in the 1910s. The mining operations produced acid mine drainage (AMD) that polluted receiving streams with acidity and heavy metals, killing aquatic and plant life. To prevent this pollution from continuing, a design for keeping the water inside the mine was developed with the cooperation of the Ohio Department of Natural Resources, R&F Coal Company, American Electric Power, and Ohio University. This paper will give a background of the Broken Aro Project, describe the FGD seal design, and demonstrate its effectiveness. Re-mining was selected as the best option to economically extract remaining coal deposits and provide an opportunity to employ abatement technology. The groundwater was sealed inside the underground mine to inundate the mine voids with water, removing the air to minimize oxidation and reduce stream pollution. The seal was made from a chemical by-product produced in coal-fired power plants called fixated flue gas desulfurization (FGD) sludge. The FGD seal has a low hydraulic conductivity, which limits water from seeping out of the underground mine. It also has high alkalinity, which may neutralize the acidic waters of AMD when water does seep from the mine. This document gives a brief background of AMD chemistry and its effects, and a discussion of the impact the fixated FGD seal has had on the water quality to date.

156
AMD Chemistry Acid mine pollution is caused by the physical and chemical weathering of iron pyrite (FeS2), also known as “fool’s gold.” Acidity, ferric iron (Fe3+) precipitation, oxygen depletion, and the release of heavy metals, such as aluminum (Al3+), zinc (Zn2+), and manganese (Mn2+) are pollutants, which may be associated with coal mining. The level of acidity and the concentration of the heavy metals is a function of the amount of pyrite in the area around the mine. Physical weathering is essential to reduce the grain size of the pyrite. The early miners inadvertently accelerated this process by grinding up the ore and dumping the overburden in mine tailings. The next step in the geochemical process is the chemical oxidation of pyrite1:
2 FeS2(s) + 7 O2(g) + 2 H2O(l) à 2 Fe2+
(aq) + 4 SO42-
(aq) + 4 H+(aq) (1)
When the pyrite is exposed to oxygen and water, it reacts to form sulfuric acid (H2SO4), which causes a decrease in pH. The Fe2+ ions (ferrous) are released into the runoff waters from drainage tunnels or tailings piles. Next, the Fe2+ ions are oxidized to Fe3+ (ferric) ions, which hydrolyze in water to form iron (III) hydroxide [Fe(OH)3] as shown in the following reactions:
4 Fe2+
(aq) + O2(g) + 4 H+(aq) à 4 Fe3+
(aq) + 2 H2O(l) (2) 4 Fe3+
(aq) + 12 H2O(l) à 4 Fe(OH)3 (s) + 12 H+(aq) (3)
This process releases more hydrogen ions into the environment, which continues to reduce the pH. The low pH of the water makes it difficult for aquatic life to survive. The iron (III) hydroxide formed in this reaction is referred to as “yellow boy,” which is a yellowish-orange precipitate that turns the acidic runoff in the streams to an orange-red color and fouls the stream bed. The iron (III) hydroxide precipitate kills plants and fish by reducing the amount of light for photosynthesis and smothering aquatic life, their food resources, and spawning beds on the stream bottom. Pyritic mine tailings leach AMD, in a large part due to the metabolic activity of Thiobacillus ferrooxidans2. These acid-tolerant bacteria serve to catalyze the oxidation of the pyrite in Equations 1, 2, and 3 above, thereby increasing the amounts of acidity and iron released to the environment. Complex systems in nature such as mine tailings and mine drainage tunnels cannot be described by just a few equations. Other chemical reactions which may take place are3:
FeS2(aq) + 14 Fe2+
(aq) + 8 H2O(l) à 15 Fe3+(aq) + 2 SO4
2-(aq) + 16 H+
(aq) (4)
In addition, sulfides of copper, zinc, cadmium, lead, and arsenic will undergo similar chemical reactions resulting in the contribution of toxic metal ions in polluted mine streams. It is the oxygen requirement in Equations 1 and 2 that are exploited in mine sealing for AMD abatement. Notice that, if the iron pyrite is never oxidized or exposed to the atmosphere, the pollution caused by AMD could be eliminated. Therefore, if groundwater could be trapped inside an underground mine to the point of inundation, the air in the mine voids would be forced out. While traces of dissolved oxygen may still be present, the largest oxygen source would be removed. The FGD seal at Broken Aro was designed to retain the groundwater inside the mine to a level above the highest roof elevation, thus minimizing the availability of oxygen and inhibiting the oxidation reaction inside the mine.
Re-mining for the Purpose of FGD Seal Placement Re-mining was the strategy used at Broken Aro to benefit the environment, industry, and the public. Re-mining operations ultimately accomplished three goals. First, it recovered remaining coal reserves left from previous mining operations. Second, re-mining allowed for the reclamation of the Broken Aro site and the placement of the FGD seal in order to achieve current environmental standards. Sites that are re-mined and reclaimed reduce environmental pollution, remove health and safety hazards, and considerably improve aesthetic properties4. Third, the State of Ohio, American Electric Power, and R&F Coal Company were able to share financial and regulatory

157
burdens so that the re-mining operation was possible. The normal barriers of an insufficient coal reserve; liabilities due to poor, pre-existing water quality; and seal material experimentation can be overcome with this kind of cooperative partnership. Installation of the FGD seal began concurrent with the continued re-mining effort in June 1997. The seal design and construction has been described fully previously5, but will be summarized here. A series of open pits were excavated to recover remaining coal in the re -mining operation. The construction of the seal started adjacent to the exposed highwall with the excavation of a keyway trench which was five feet wide and one foot deep in the pit floor. The FGD material was delivered to the site as needed with a moisture content of 40-45%. It was placed and compacted within ten days of production to achieve optimum performance. The FGD seal itself was constructed in two four-foot lifts at least 10 feet wide. The first lift of the seal was constructed by placing the FGD material into the open pit and the keyway trench. The FGD material was forced into mine openings and compacted using a dozer. The compacted first lift was sufficient to cover the face of the exposed coal seam. After the first lift was installed, mine spoil from the adjacent pit was pushed into the current pit floor and used in the leveling of the first lift. This allowed trucks to transport the second lift of FGD without damaging the first. The second lift was placed on top of the first lift, and the FGD material was pushed into the highwall with a dozer to fill and compact the lift. The now, compacted FGD seal was a minimum of eight feet above the pit floor. The top surface of the second lift was sloped gradually away from the highwall. This was to ensure that infiltration waters flowing through the reclaim would be diverted away from the highwall and off the seal. All deep mine openings that were encountered during seal placement were handled accordingly. Openings were sealed from floor to roof by pushing FGD material as far back into the entrance as possible using a backhoe. Also, care was taken to ensure that there were no gaps between mining pits. This guaranteed that the mine seal was constructed continuously along the length of the highwall. Additional compaction was produced from the placement of overburden above the mine seal from the next pit.
The Goal of the FGD Seal The ultimate goal of the seal was to displace the air voids inside the underground mine with groundwater. By retaining the water inside the mine to the point of inundation, the FGD seal limits the amount of oxygen present in the mine. This inhibits the oxidation reaction and subsequently minimizes the acidic drainage. It would be impractical to expect that all of the water would be restricted only to the mine, especially with the increasing head pressure due to the rising water level. It is expected that some water will continue to seep from the mine complex. The expectation is that the amount of AMD that is produced can be treated by means of natural attenuation, and therefore it will not be a threat to water quality further downstream.
Environmental Monitoring Sampling Locations and Methods A map of the Broken Aro Mine site is presented in Figure 1. On site there are 15 surface water locations that are sampled and tested that are comprised of underground seeps, ponds, streams, and stormwater runoff from the mined areas. Originally, there were 8 monitoring wells situated in four pairs that were drilled into and below the mine. Six additional wells were installed in the reclaim area outside of the seal in August of 1998. The groundwater from each of these wells is also sampled and tested. Sampling began in April of 1997, prior to the re-mining effort to establish background contaminant profiles. Sampling continued during mining operations and, to date, for over two years after the completion of the FGD seal.

158
Figure 1. Site map for Broken Aro Mine identifying the locations of the mine complex, the FGD seal, monitoring
wells, and surface sampling sites.

159
For each stream location, three tasks are performed in the field. First, preserved and unpreserved samples are obtained. Second, field evaluations for water quality indicators are performed. Finally, the flowrate is measured for each stream location. At the well locations, the water level elevation, and the depth of the well is measured first. Then, unfiltered, unpreserved and filtered, preserved groundwater samples are obtained. Finally, field evaluations for water quality indicators are performed. Once samples have been collected from each location, they are transported to an environmental testing laboratory for analysis. This is done at the end of the same day of the sampling event. Field Water Quality Assessments The field tests must be conducted and recorded for each stream and/or well location. The pH, temperature, specific conductivity or total dissolved solids (TDS), and the oxidation-reduction potential (ORP) are measured directly in the field using specific probes. Then, 3% peroxide (H2O2) is added to the sample cup. Next, the pH and ORP are tested for the oxidized sample to see if it has changed6. Most groundwater samples are in a reduced state. For mine water samples that contain a substantial mineral fraction, the peroxide addition causes the release of hydrogen ions (H+) in the oxidation process and thus lowers the pH. This provides the researcher with the ability to predict the potential acidification of a receiving stream once the source has an opportunity to oxidize. In the streams, volumetric flowrates are determined using different devices such as weirs, flumes, current meters, or culverts. The choice of a flowrate measuring technique depends on the nature (e.g., quantity, site topography, etc.) of the sample location. This enables the calculations of mass loadings from concentration data obtained in the laboratory. Laboratory Water Quality Assessments Each water sample is tested in the laboratory for the following constituents: pH, total acidity, total alkalinity, bicarbonate alkalinity, carbonate alkalinity, specific conductance at 25°C, total non-filterable residue, total dissolved solids, sulfate, chloride, total calcium, total magnesium, total sodium, total potassium, total iron, total manganese, total aluminum, and hardness. The trace compounds analyzed are: total zinc, phosphate, copper, chromium, arsenic, barium, cadmium, lead, mercury, selenium, silver, cobalt, boron, total nickel, bromide, and total molybdenum. All constituents were analyzed during the first year. Subsequently, the trace compound series were only analyzed on a quarterly basis.
Effectiveness of the FGD Seal The effectiveness of the seal to date can be seen via examination of the data collected as a function of time. Sampling events began on a regular basis two months prior to the start of the installation of the FGD seal. Therefore, one can see the effects of re-mining and dewatering activities and any immediate effect the FGD seal had on the AMD pollution. Water level elevations in the monitoring wells will be used to demonstrate how the FGD seal developed and maintained flooding of the underground mines. Chemical concentration profiles in one pair of the monitoring wells will be utilized to demonstrate water quality improvements inside the mine. Contaminant loads at surface water location D1A will be used as an indicator of the FGD seal’s effectiveness due to its critical location at the boundary of the mining areas. Figure 2 presents the water levels in the monitoring wells as a function of time. The water inside the mine is monitored by wells MW3, MW7, and MW11. Monitoring wells MW6, MW8, and MW12 are screened in a geologic interval under the deep mine, and they describe the water level and water quality below the mine. Monitoring well MW2 is located in a perched aquifer, where the water level is much higher than in the other wells. It should be noted that some vertical connectivity exists between the mine and MW8 as demonstrated by the fact that the water elevation in that well (below the mine) is the same as the water levels inside the mine.
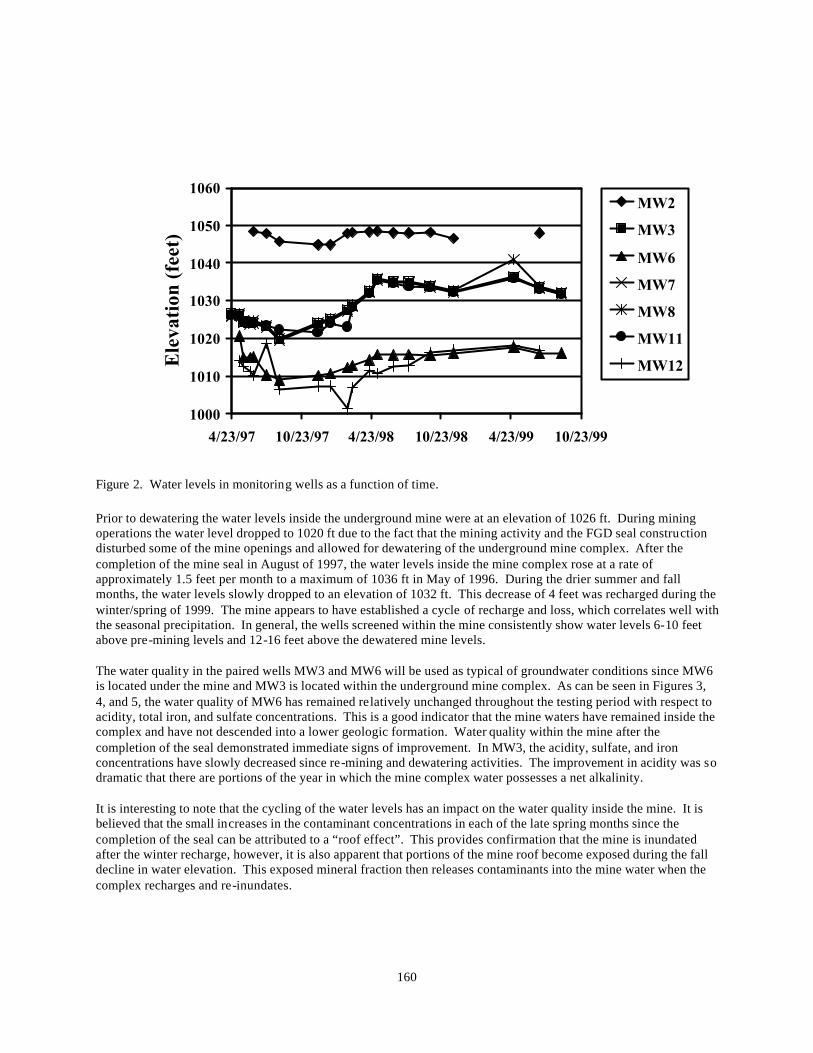
160
Figure 2. Water levels in monitoring wells as a function of time. Prior to dewatering the water levels inside the underground mine were at an elevation of 1026 ft. During mining operations the water level dropped to 1020 ft due to the fact that the mining activity and the FGD seal construction disturbed some of the mine openings and allowed for dewatering of the underground mine complex. After the completion of the mine seal in August of 1997, the water levels inside the mine complex rose at a rate of approximately 1.5 feet per month to a maximum of 1036 ft in May of 1996. During the drier summer and fall months, the water levels slowly dropped to an elevation of 1032 ft. This decrease of 4 feet was recharged during the winter/spring of 1999. The mine appears to have established a cycle of recharge and loss, which correlates well with the seasonal precipitation. In general, the wells screened within the mine consistently show water levels 6-10 feet above pre-mining levels and 12-16 feet above the dewatered mine levels. The water quality in the paired wells MW3 and MW6 will be used as typical of groundwater conditions since MW6 is located under the mine and MW3 is located within the underground mine complex. As can be seen in Figures 3, 4, and 5, the water quality of MW6 has remained relatively unchanged throughout the testing period with respect to acidity, total iron, and sulfate concentrations. This is a good indicator that the mine waters have remained inside the complex and have not descended into a lower geologic formation. Water quality within the mine after the completion of the seal demonstrated immediate signs of improvement. In MW3, the acidity, sulfate, and iron concentrations have slowly decreased since re-mining and dewatering activities. The improvement in acidity was so dramatic that there are portions of the year in which the mine complex water possesses a net alkalinity. It is interesting to note that the cycling of the water levels has an impact on the water quality inside the mine. It is believed that the small increases in the contaminant concentrations in each of the late spring months since the completion of the seal can be attributed to a “roof effect”. This provides confirmation that the mine is inundated after the winter recharge, however, it is also apparent that portions of the mine roof become exposed during the fall decline in water elevation. This exposed mineral fraction then releases contaminants into the mine water when the complex recharges and re-inundates.
1000
1010
1020
1030
1040
1050
1060
4/23/97 10/23/97 4/23/98 10/23/98 4/23/99 10/23/99
Ele
vatio
n (f
eet)
MW2
MW3
MW6
MW7
MW8
MW11
MW12

161
0
500
1000
1500
2000
2500
4/23/97 10/23/97 4/23/98 10/23/98 4/23/99 10/23/99
Sulfa
te (m
g/L
)
MW3
MW6
Figure 3. Total acidity in monitoring wells 3 and 6 as a function of time.
Figure 5. Sulfate concentrations in monitoring wells 3 and 6 as a function of time.
-400
-200
0
200
400
600
800
4/23/97 10/23/97 4/23/98 10/23/98 4/23/99 10/23/99
Aci
dity
(mg/
L a
s CaC
O 3)
MW3
MW6
Figure 4. Total iron concentrations in monitoring well 3 and 6 as a function of time.
0
50
100
150
200
250
300
350
4/23/97 10/23/97 4/23/98 10/23/98 4/23/99 10/23/99
Tot
al Ir
on (m
g/L
)
MW3
MW6

162
Figure 6 presents sulfate and total iron loadings at location D1A (site boundary). Sulfate loadings reached a high of 1120 kg/day during the re-mining in May of 1997, but decreased to 370 kg/day by September of 1999. This constitutes a reduction in sulfate load to the watershed of 67%. The iron loadings have decreased in even a more drastic manner, from over 43 kg/day during re-mining operations to about 1.1 kg/day in September of 1999. This is equal to 97.5% reduction in total iron load off-site. Again, the recharge roof effect can be seen in the loading profiles as small increases in contaminant loads appear during the spring months.
Figure 6. Iron and sulfate loads at sampling location D1A, the project boundary.
Conclusion The Broken Aro Project will continue to be monitored in years to come to determine the level of success of the fixated FGD seal. The cooperative re -mining effort shared the benefits and liabilities, as well as the costs, of coal recovery and implementation of novel environmental control strategies. To date, the FGD seal has shown that it has improved water quality inside the mine, reduced the quantity of water seeping from the mine, and reduced contaminant loads to Simmons Run by up to 97.5%. The site still needs to reach its hydrogeologic equilibrium to completely determine the seal’s effectiveness. The seasonal cycling of the mine water elevations has had a small, but noticeable, effect on contaminant profiles. It is important to either lower the concentration of the contaminants or the flowrate so that ultimately the total loading decreases. In this project, both the concentrations and flowrates have consistently decreased due to the mine seal, which is optimal for contaminant load reduction.
References 1. Stumm, W. and Morgan, J.J. Aquatic Chemistry: Chemical Equilibria and Rates in Natural Waters, 1996,
John Wiley and Sons, New York, 3rd Edition, p1024. 2. Wildeman, T., Dietz, J., Gusek, J., Morea, S., and Bates, E. Handbook For Constructed Wetlands Receiving
Acid Mine Drainage, 1993, EPA/540/R-93/523. 3. Sobek, Andrew A., Schuller, W.A., Freeman, J.R., and Smith, R.M . Field and Laboratory Methods Applicable
to Overburdens and Minesoils, 1978, EPA 600/2-78-054, PB-280495. 4. Skousen, J.G. Remining to Reduce/Prevent Acid Mine Drainage, 1996, OSP#88-345/WV88,
http://www.nrcce.wvu.edu/programs/nmlrcabs.html
0
10
20
30
40
50
4/23/97 10/23/97 4/23/98 10/23/98 4/23/99 10/23/99
Tot
al Ir
on [
kg/d
ay]
0
250
500
750
1000
1250
Sulfate [kg/day]
Iron
Sulfate

163
5. Mafi, S., Novak, G., and Faulconer, J. Broken Aro coal remining/reclamation project, 1998, Mining Engineering Journal, Vol. 50(4):44-47.
6. Standard Methods for the Examination of Water and Wastewater, 1996, American Public Health Association,
Washington, D.C., 18th Edition. _____________________________ 7Ben J. Stuart is an Assistant Professor holding a joint appointment between the Department of Civil Engineering and the Department of Chemical Engineering at Ohio University. Stuart received his B.S., M.S., and Ph.D. in 1990, 1993, and 1995 from the Department of Chemical and Biochemical Engineering at Rutgers, the State University of New Jersey. He is a registered professional engineer in the State of Ohio. Stuart has been involved with the study of emissions from municipal waste combustion and coal fired power plants for ten years. Major recent research efforts include the utilization of coal combustion by-products for abatement and treatment of acid mine drainage, and scrubbing of power plant flue gases.

Session 4
Hydrologic Long-Term Monitoring
Session Chairperson:Stephen Smith
TXUDallas, Texas
Water Quality Effects of Beneficial CCBs Use at Coal MinesPaul F. Ziemkiewicz and D.C. Black, National Mine Land Reclamation Center, WestVirginia University, Morgantown, West Virginia
Effects of CCBs on Groundwater Quality after MiningDavid J. Hassett, G.J. Groenewold, and F.W. Beaver, Energy and EnvironmentalResearch Center, Grand Forks, North Dakota, and O.E. Manz, Manz Associates,Alvarado, Minnesota
Performance Assessment of a Flue Gas Desulfurization Material at a LinedPond FacilityTarunjit Butalia and William Wolfe, Department of Civil and EnvironmentalEngineering and Geodetic Science, The Ohio State University, Columbus, Ohio
Water Quality at an Abandoned Mine Site Treated with Coal CombustionBy-ProductsRalph J. Haefner, U.S. Geological Survey, Water Resources Division, Columbus, Ohio
Hydrologic Monitoring at Three Mine Sites Reclaimed with Mixtures ofSpoil and Coal Combustion Residues in IllinoisSteven P. Esling, Department of Geology, and Bradley C. Paul, Department of Miningand Mineral Resources Engineering, Southern Illinois University, Carbondale, Illinois
167
WATER QUALITY EFFECTS OF BENEFICIAL CCBS USE AT COAL MINES
Dr. Paul F. Ziemkiewicz1 and D.C. BlackNational Mine Land Reclamation Center
West Virginia UniversityMorgantown, West Virginia
Abstract
One hundred and five million tons of coal combustion products (CCP) were produced by American power generatingutilities in 1997 (ACAA, 1998). Of that total, 1.68 million tons were used in mining applications. Twenty years agocoal ashes, bottom and fly ashes, constituted nearly all CCPs. With the shift to new emission control technologiesat power plants, however, large volumes of new products are being generated. Many do not lend themselves totraditional ash applications such as cement formulation. Mine filling has the potential to absorb substantialproportions of annual fly ash and other CCP production, and State and Federal policies encourage beneficial use ofCCPs. Beneficial uses in mines include acid drainage control, subsidence control, grading, and soil reconstruction. Results have ranged from the environmentally beneficial to neutral and, in some cases, detrimental. States such asPennsylvania and West Virginia have developed policies which define and regulate beneficial use of CCPs for coalmine remediation. These successful policies will be summarized.
Many CCP disposal sites are not documented with reliable pre and post application monitoring. In this report we willdiscuss the types of CCP, their relevant characteristics, and the mining environment. We have attempted to identifya range of documented applications and to draw conclusions about their environmental effects including benefitsand adverse impacts.
Types of Coal Combustion Products
Coal combustion products can be grouped into four main classes: 1) Class F ashes; 2) Class C ashes; 3) FluidizedBed Combustion ashes; and 4) Flue Gas Desulfurization solids. Class F and C ashes are produced in largepulverized coal boilers. They comprise the bulk of CCBs produced in the United States. They are distinguished bythe American Society for Testing and Materials (ASTM) on the basis of their free lime (CaO) content2. Class F asheshave less than 10% lime while Class C ashes have more than 10% lime. Nearly all ashes produced by pulverized coalboilers in the eastern United States are Class F while those burning western United States coal are typically Class C. Table 1 shows typical chemical compositions for both Class F and Class C ashes.
Fluidized Bed Combustion (FBC) ashes and Flue Gas Desulfurization (FGD) sludges result from relatively new cleancoal technologies. Both use lime or limestone (CaCO3) to generate CaO to capture SOx in the boiler exhaust gasstream. FBC ashes are produced when high sulfur coal and/or coal tailings are burned with limestone in a fluidizedbed boiler. SOx is precipitated as gypsum (CaSO4) along with unreacted lime in a strongly alkaline ash (typically 25to 30% free lime). Flue Gas Desulfurization solids are produced when lime or limestone slurries are injected into theexhaust gas downstream of the boiler. SOx is precipitated either as gypsum or calcium sulfite (CaSO3). Some utilitiescombine FGD solids with fly ash to improve solidification so FGD solids may or may not contain fly ash. In eithercase, sulfites may then be converted to gypsum by forced oxidation. Currently 25 million tons of FGD solids are produced each year with 9% of that total being beneficially used1 as minefill. The remainder is land filled. FGD solids normally have little inherent lime. However, they are often amended(fixated) with lime (CaO) for solidification, otherwise they have the consistency of a thin paste.

168
Table 1. Typical Composition of Class F and C ashes as defined by ASTM (1997).
Parameter ClassF
ClassC
SiO2 54.9% 39.9%
Al2O3 25.8% 16.7%
Fe2O3 6.9% 5.8%
CaO 8.7% 24.3%
SO3 0.6% 3.3%
Moisture content 0.3% 0.9%
Loss on Ignition (LOI)(@750C) 2.8% 0.5%
Available alkalies as Na2O 0.5% 0.7%
Specific gravity 2.34 2.67
fineness, retained on #325 meshsieve
14% 8%
Beneficial CCP Applications in Coal Mines
CCPs are typically used in the following beneficial applications at coal mines:• Neutralization of acid forming materials,• Barriers to acid mine drainage (AMD) formation/transport,• Subsidence control in underground mines,• Pit filling to reach approximate original contour (AOC) in surface mines, and• Soil reconstruction.
This report will discuss only the first four scenarios since soil reconstruction is fundamentally an agriculturalapplication.
Coal Mine Environments and Their Implications for CCP Use
Mine environments are complex and a given mine will contain zones of high groundwater flux and others nearby,which are nearly stagnant. Mine groundwater can be oxidizing or reducing. Reducing conditions are often found insaturated zones while unsaturated zones tend to be oxidizing. Certain redox-sensitive metals and oxy-anions ofelements tend to be more soluble in reducing conditions.
Mine groundwaters also vary according to their acidity/alkalinity. Many mine waters, particularly in the easternUnited States are slightly to strongly acidic with significant concentrations of iron, aluminum and manganese. Theseions are more soluble in acid conditions, and alkalinity from CCPs are often used to neutralize acid mine drainage. The resulting metal hydroxides formed in these conditions will scavenge many trace elements such as arsenic andzinc.
In a given mine one might encounter acid/oxidizing, acid/reducing, alkaline/oxidizing, and alkaline/reducingconditions. Care must be taken to ensure that CCPs are matched to zones that take advantage of their beneficialproperties and minimize their exposure to conditions that will mobilize toxic concentrations.

169
The CCPs can be placed in permeable or impermeable forms. At one end of the spectrum, bottom ashes have thehydraulic conductivity of gravel, while fly ash is closer to silt. Class F ashes tend to be more permeable than class Cashes due to the tendency of class C ashes to self-cement. At the opposite extreme, fixated FGD solids have verylow hydraulic conductivity, and the various CCP grouts behave like concrete and are virtually impermeable.
Nearly all CCPs contain soluble and insoluble salts. If permeable and exposed to groundwater, soluble salts willdissolve. These include salts of boron, chlorides, and sodium carbonates. On the other hand, the solubility ofsulfates and calcium or magnesium carbonates is controlled by their concentrations in the mine water. It is notunusual to find mine waters that are already saturated with respect to gypsum or calcium carbonate. In such cases,little or no net dissolution will occur. Care should be taken that CCPs containing substantial amounts of solublesalts are not exposed to zones of significant groundwater flux.
State Beneficial Use Policies for CCPs
The State of West Virginia’s Coal Policy (13 Jan 98) distinguishes between coal combustion wastes and coal combustionby-products. While both consist of coal ash, boiler slag and flue gas desulfurization solids, wastes are not usedbeneficially. Coal combustion wastes, therefore, are regulated under solid waste regulations. Allowable beneficial usesinclude:
• Subsidence control as part of a confined cementitious mixture,• Abatement of underground mine fires as part of a cementitious mixture,• Soil amendment or substitute,• Alkaline amendment to neutralize acid producing rock,• Encapsulation of acid producing rock, and• Filling underground coal mine voids to control acid drainage.
Quality criteria are included in the policy. For example, beneficially used CCPs must pass the USEPA’s Test Methodsfor Evaluating Solid Waste, SW-846, Method 1311 (Toxicity Characteristic Leaching Procedure or TCLP) for non-organics. They also must have at least 0.5% alkalinity (calcium carbonate equivalent) and be applied at a rate neededto treat any acidity which could be generated by the acid producing rock. The later is calculated by the followingformula:
( )( )A W S NNP= *% * . / % * .3125 11Where: A = Required amendment (tonnes)
W = Amount of waste rock to be neutralized (tonnes)%S = Percent sulfur in waste rock%NNP = Percent net neutralization potential of amendment e.g. %NP - %MPA
The West Virginia ash policy calls for a 10% safety factor. Hence the total is multiplied by 1.1.
Under Pennsylvania’s Certification Guidelines for Beneficial Uses of Coal Ash (30 Apr 98) beneficial ash applicationsinclude:
• Coal Ash Placement: pH between 7.0 and 12.5 at the generator’s site.• Soil substitute or soil additive: for use as a liming agent, the calcium carbonate equivalent must be at least
100 tons/1000 tons of ash.• For use as a soil substitute or soil additive, the generator must provide a description and justification for
the intended use. Certification would be granted on a site specific basis.• Alkaline addition: for use as an alkaline amendment, the pH must be in the range 7.0 to 12.5 at the
generator’s site. Also, the calcium carbonate equivalent must be at least 100 tons/1000 tons of ash.• Low-permeability material: To be certified for low-permeability material, the pH of the coal ash must be in the
range of 7.0 to 12.5 at the generator’s site. However, if an additive is used, the mixture can be adjusted tothe pH range of 7.0 to 12.5 at the site of beneficial use. To be certified as a low-permeability material, thehydraulic conductivity of the coal ash/additive mixture must be 1.0 x 10⁻⁶ cm/sec or less based on
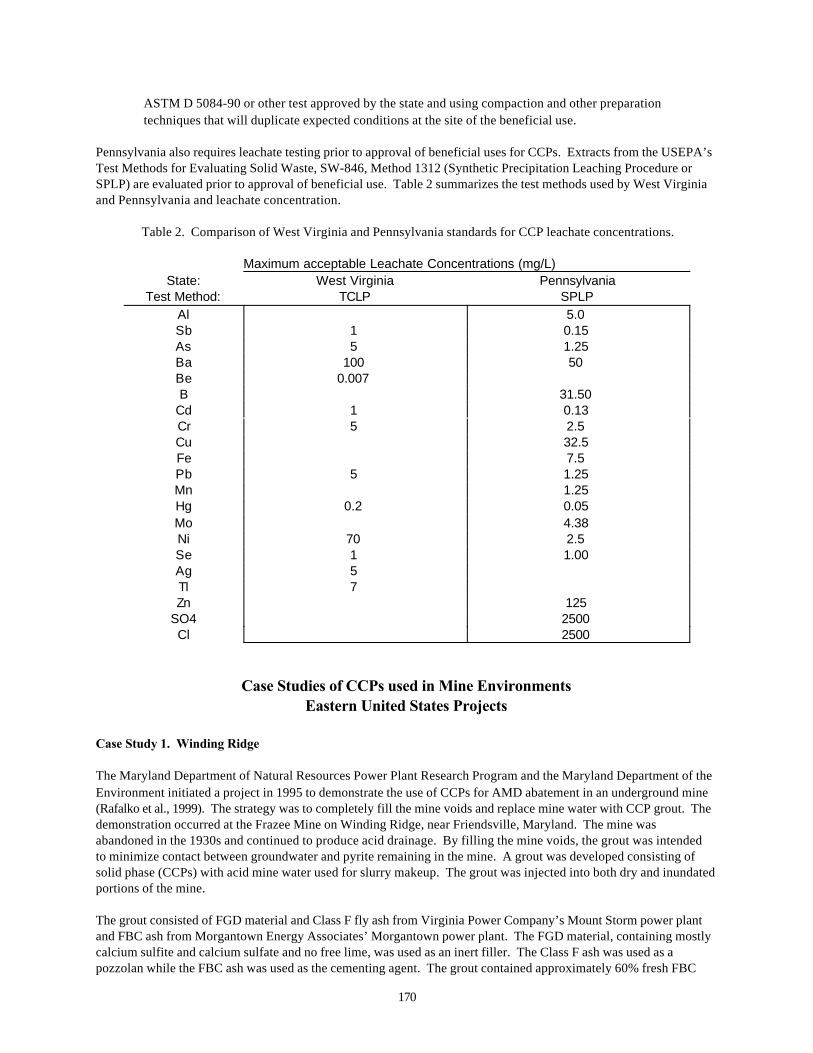
170
ASTM D 5084-90 or other test approved by the state and using compaction and other preparationtechniques that will duplicate expected conditions at the site of the beneficial use.
Pennsylvania also requires leachate testing prior to approval of beneficial uses for CCPs. Extracts from the USEPA’sTest Methods for Evaluating Solid Waste, SW-846, Method 1312 (Synthetic Precipitation Leaching Procedure orSPLP) are evaluated prior to approval of beneficial use. Table 2 summarizes the test methods used by West Virginiaand Pennsylvania and leachate concentration.
Table 2. Comparison of West Virginia and Pennsylvania standards for CCP leachate concentrations.
Maximum acceptable Leachate Concentrations (mg/L)State: West Virginia Pennsylvania
Test Method: TCLP SPLPAl 5.0 Sb 1 0.15 As 5 1.25 Ba 100 50 Be 0.007 B 31.50
Cd 1 0.13 Cr 5 2.5 Cu 32.5 Fe 7.5 Pb 5 1.25 Mn 1.25 Hg 0.2 0.05 Mo 4.38 Ni 70 2.5 Se 1 1.00 Ag 5 Tl 7 Zn 125
SO4 2500 Cl 2500
Case Studies of CCPs used in Mine EnvironmentsEastern United States Projects
Case Study 1. Winding Ridge
The Maryland Department of Natural Resources Power Plant Research Program and the Maryland Department of theEnvironment initiated a project in 1995 to demonstrate the use of CCPs for AMD abatement in an underground mine(Rafalko et al., 1999). The strategy was to completely fill the mine voids and replace mine water with CCP grout. Thedemonstration occurred at the Frazee Mine on Winding Ridge, near Friendsville, Maryland. The mine wasabandoned in the 1930s and continued to produce acid drainage. By filling the mine voids, the grout was intendedto minimize contact between groundwater and pyrite remaining in the mine. A grout was developed consisting of solid phase (CCPs) with acid mine water used for slurry makeup. The grout was injected into both dry and inundatedportions of the mine.
The grout consisted of FGD material and Class F fly ash from Virginia Power Company’s Mount Storm power plantand FBC ash from Morgantown Energy Associates’ Morgantown power plant. The FGD material, containing mostlycalcium sulfite and calcium sulfate and no free lime, was used as an inert filler. The Class F ash was used as apozzolan while the FBC ash was used as the cementing agent. The grout contained approximately 60% fresh FBC

171
(<24 hours old), 20% FGD, and 20% Class F fly ash. The FBC ash arrived from the power plant containing about15% moisture. The final design mix yielded 8 inches of spread using ASTM PS 28-95, and a 28 day unconfinedcompressive strength of 520 pounds per square inch (psi) as determined by ASTM C 39-94. Prior to injection, the grout was subjected to a Toxicity Characteristic Leaching Procedure or TCLP for non-organics. None of the analytes exceeded their respective regulatory limits for characterization as a hazardous waste.
During the fall of 1996, more than 5,600 cubic yards of grout were injected into the mine. The original design was for3,900 cubic yards but additional void space was encountered and grouted. During the injection it became apparentthat the Frazee Mine was larger and more complex than determined during the mine characterization phase. As aresult, the mine was not completely filled and the mine continues to produce AMD.
The mine’s discharge pH remained around 3.0 during and after grout injection while Ca, Na, and K concentrationsincreased by nearly an order of magnitude (Aljoe, 1999). Sulfate, Cu, Ni, Zn, and Cl all nearly doubled with both Niand Zn in excess of water quality discharge limits. Both Ni and Zn had exceeded water quality limits prior toinjection. Two years after injection, however, concentrations of both Ni and Zn were at or slightly above pre-injection levels (Table 3).
Table 3. Summary of pre and post injection water quality at the Frazee Mine, Friendsville, Maryland. The data arefor samples taken and analyzed by the USDOE Federal Energy Technology Center. (All values in mg/L)
EPARCRA TCLP Drinking Pre-CCB Post-CCB
Element Limit Water) n=18 n=15Sb 1 0.006 <0.2 <0.2As 5 0.05 <0.2 <0.2Ba 100 2 0.029 <0.02Be 0.007 0.004 <0.02 <0.02Cd 1 0.005 <0.02 <0.02
Cr (6+) 5 0.1 0.03 0.04Pb 5 0.015 <0.02 <0.02Ni 70 0.01 0.62 1.13Se 1 0.05 <0.5 <0.5
Al 37 56Ca 25 223Cl 2.3 7.3 Co 0.3 0.5 Cu 0.08 0.25 Fe 67 67Mg 26 32Mn 2.7 2.8 K 0.9 13.3 Zn 1.4 2.3 Na 1 8
SO4 564 1182 In September 1997, nine core holes were drilled into the Frazee Mine to recover grout. The core hole locationstargeted previously wet and dry sections of the mine. The grout samples were submitted to the laboratory fortesting of density, permeability (hydraulic conductivity), and unconfined compressive strength. Grout wasencountered at five holes. In general, the cores showed little sign of in situ weathering and displayed good mineroof and pavement contact. Cores recovered from the grout after one year yielded permeabilities between 1.89x10⁻⁶
and 6.02x10⁻⁸ cm/sec.

172
The measured permeabilities range from 6.02x10⁻⁸ to 1.89x10⁻⁶ cm/sec. Core hole 1 matched the target strength in the28 day laboratory test. The other holes all had approximately twice the strength achieved in the laboratory after 28days. The behavior of calcium and sulfate after injection was significantly different than that of acidity, iron and aluminum. Calcium concentrations increased by a factor of 3 to 6 and remained at these levels for more than 16 months afterinjection. Sulfate levels remained at about twice the pre-injection level. These persistent increases in calcium andsulfate can probably be attributed to the dissolution of these ions from the injected FBC and FGD materials. Trendsin sodium, potassium, and chloride concentrations were similar to those of calcium. It is likely that their elevatedconcentrations resulted from some grout dissolution.
Also note that prior to injection the grout itself was subjected to a TCLP. The results were that arsenic and bariumwere found at levels of 0.13 and 0.11 mg/l, respectively. Post grouting water quality of the mine discharge did notdetect these constituents (the detection limit for arsenic in the mine water was 0.2 mg/l but the detection limit forbarium is one order of magnitude below the TCLP result). The data show that with the exception of a short-termincrease in Ni and Zn, no toxins are leaching from the ash even though the ash is dissolving due to acid attack. Thepermeabilities exhibited by the ash (see Table 2) would indicate that the grout could withstand surface attack forsome time.
The grout was placed under nearly worst case conditions: there was insufficient grout placement to neutralize acid inthe mine water and as a result it was subjected to continuous weathering by pH 3.0 water. Further, the flow of thiswater through the mine was unhindered. The objective of such mine grouting projects is to occlude voids andeliminate mine drainage. This project, however, represents a case where this objective was not achieved and thegrout was subject to a high flux, chemically aggressive mine water.
Case Study 2. Mettiki Coal, Underground Mine Back Stowing
In December 1996, Metikki Coal Corporation began injecting a mixture of non-fixated flue gas desulfurization solids(FGD), AMD metal precipitates, and fine coal refuse into its underground coal mine near Redhouse, Maryland. Materials are mixed in a specially designed building with slurry water added and monitored in the receiving bindirectly underneath the truck loadout. The slurry is injected at about 15% solids content. There is some unreactedlime in both the FGD and the AMD sludge, which would dissolve in the thin slurry. CCBs are injected into aninactive section of the mine and to date about 320,000 tons of CCB have been injected. The CCBs enter the lowpoint in a synclinal structure and displace an otherwise acid mine pool. The FGD solids are not fixated and are notexpected to solidify. On the other hand, since they are placed in the low point of the mine and well below regionaldrainage, the ambient mine water is expected to be stagnant. Thus, stratification of water layers above the CCBs islikely to occur with minimal mixing. Water has been sampled and analyzed since prior to injection of CCBs and thesedata are summarized in Table 4. Chloride was expected to be the most sensitive ion as the FGD solids have between10,000 and 30,000 mg/l Cl. As chloride is an anion and extremely soluble it has been monitored closely. Maryland seta discharge limit of 860 mg/L on chloride.
Chloride concentrations remain well below the Maryland limit of 860 mg/L, averaging about 120 mg/L. This isnevertheless, above the pre-injection level of 3 mg/L. Other than roughly 30% increase in sulfate concentrations, theinjection has had little effect other than to increase the alkalinity in the mine pool. This has caused the pH toincrease from about 3 to 4.5 while Al and Fe have both dropped substantially. Prior to discharge, mine water istreated in a high density lime treatment system and discharged through a polishing pond to the NPDES monitoringpoint. Trout are successfully raised in the polishing pond. They are exceptionally sensitive to chloride.
Case Study 3. Clinton County, Pennyslvania. Fran Contracting, Surface Mine Grouting and Capping for AMDControl
Between 1974 and 1977 a 37 acre surface coal mine was mined and reclaimed in Clinton County, Pennsylvania. Pyriterich pit cleanings and refuse were buried in the backfill, producing severe acid mine drainage. The pyritic materialwas located in discrete piles or pods within the backfill. The pods and initial contaminant plumes were identifiedusing geophysical techniques confirmed by drilling.
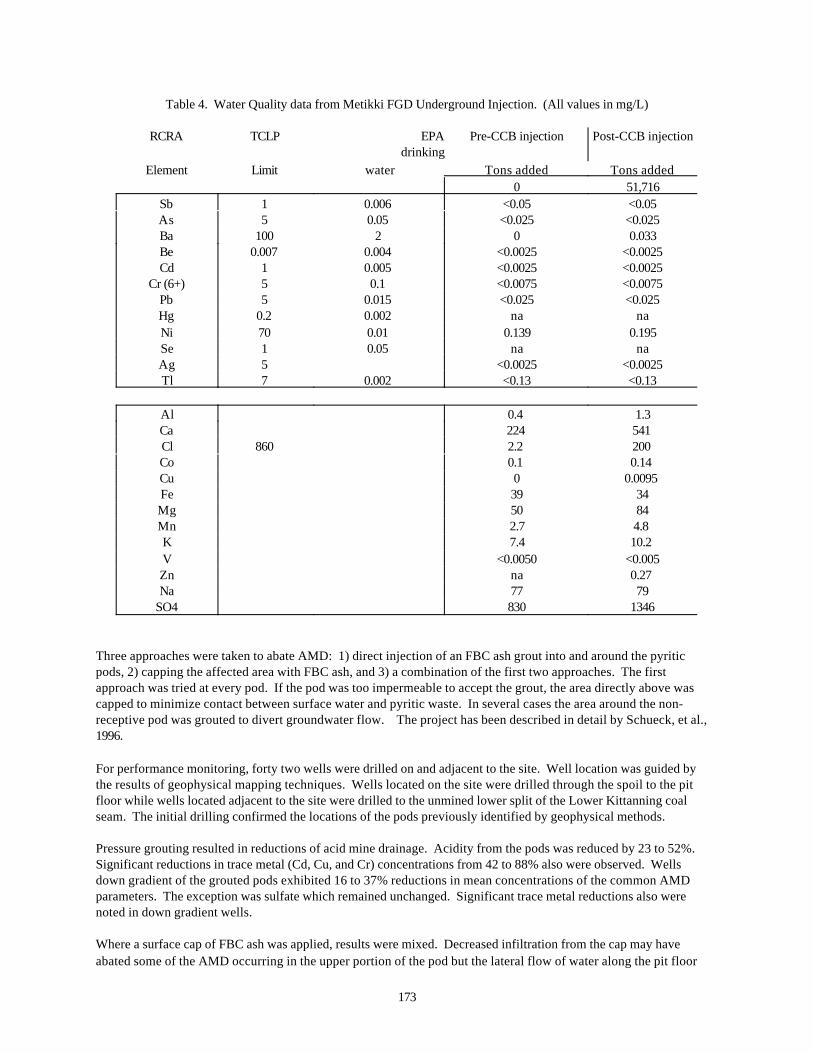
173
Table 4. Water Quality data from Metikki FGD Underground Injection. (All values in mg/L)
RCRA TCLP EPAdrinking
Pre-CCB injection Post-CCB injection
Element Limit water Tons added Tons added0 51,716
Sb 1 0.006 <0.05 <0.05As 5 0.05 <0.025 <0.025Ba 100 2 0 0.033Be 0.007 0.004 <0.0025 <0.0025Cd 1 0.005 <0.0025 <0.0025
Cr (6+) 5 0.1 <0.0075 <0.0075Pb 5 0.015 <0.025 <0.025Hg 0.2 0.002 na naNi 70 0.01 0.139 0.195Se 1 0.05 na naAg 5 <0.0025 <0.0025Tl 7 0.002 <0.13 <0.13
Al 0.4 1.3Ca 224 541 Cl 860 2.2 200 Co 0.1 0.14 Cu 0 0.0095 Fe 39 34Mg 50 84Mn 2.7 4.8 K 7.4 10.2 V <0.0050 <0.005Zn na 0.27 Na 77 79
SO4 830 1346
Three approaches were taken to abate AMD: 1) direct injection of an FBC ash grout into and around the pyriticpods, 2) capping the affected area with FBC ash, and 3) a combination of the first two approaches. The firstapproach was tried at every pod. If the pod was too impermeable to accept the grout, the area directly above wascapped to minimize contact between surface water and pyritic waste. In several cases the area around the non-receptive pod was grouted to divert groundwater flow. The project has been described in detail by Schueck, et al.,1996.
For performance monitoring, forty two wells were drilled on and adjacent to the site. Well location was guided bythe results of geophysical mapping techniques. Wells located on the site were drilled through the spoil to the pitfloor while wells located adjacent to the site were drilled to the unmined lower split of the Lower Kittanning coalseam. The initial drilling confirmed the locations of the pods previously identified by geophysical methods.
Pressure grouting resulted in reductions of acid mine drainage. Acidity from the pods was reduced by 23 to 52%. Significant reductions in trace metal (Cd, Cu, and Cr) concentrations from 42 to 88% also were observed. Wellsdown gradient of the grouted pods exhibited 16 to 37% reductions in mean concentrations of the common AMDparameters. The exception was sulfate which remained unchanged. Significant trace metal reductions also werenoted in down gradient wells.
Where a surface cap of FBC ash was applied, results were mixed. Decreased infiltration from the cap may haveabated some of the AMD occurring in the upper portion of the pod but the lateral flow of water along the pit floor
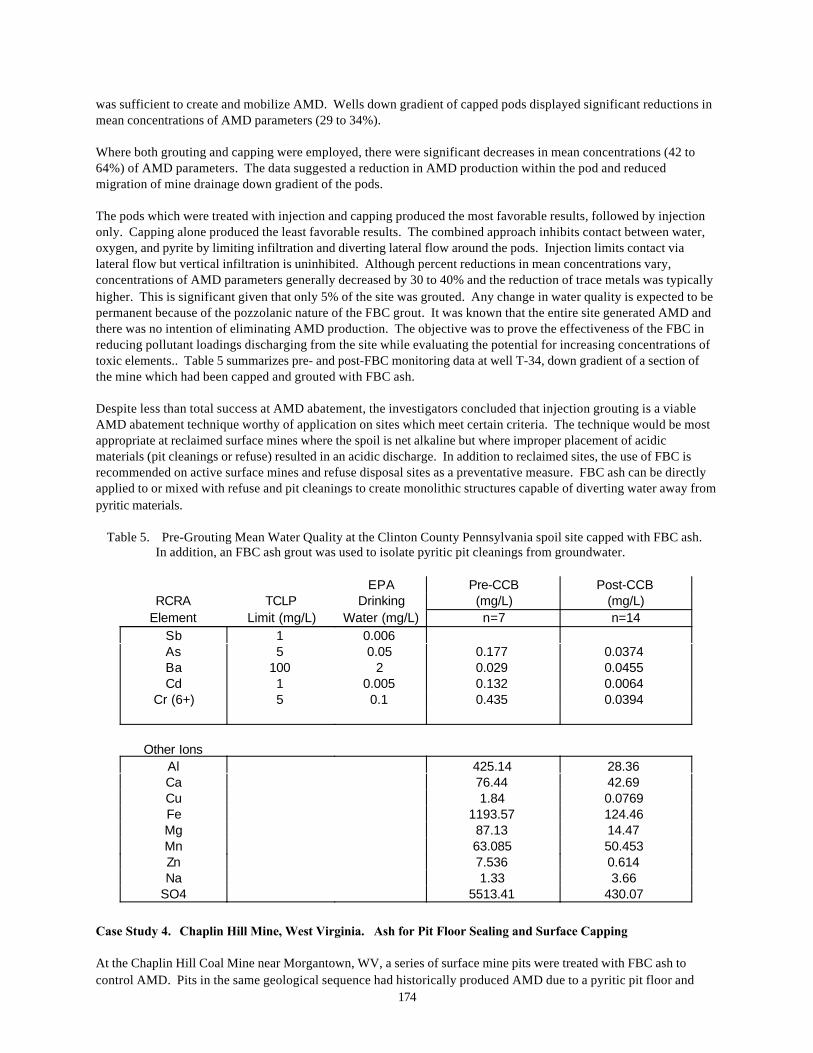
174
was sufficient to create and mobilize AMD. Wells down gradient of capped pods displayed significant reductions inmean concentrations of AMD parameters (29 to 34%).
Where both grouting and capping were employed, there were significant decreases in mean concentrations (42 to64%) of AMD parameters. The data suggested a reduction in AMD production within the pod and reducedmigration of mine drainage down gradient of the pods. The pods which were treated with injection and capping produced the most favorable results, followed by injectiononly. Capping alone produced the least favorable results. The combined approach inhibits contact between water,oxygen, and pyrite by limiting infiltration and diverting lateral flow around the pods. Injection limits contact vialateral flow but vertical infiltration is uninhibited. Although percent reductions in mean concentrations vary,concentrations of AMD parameters generally decreased by 30 to 40% and the reduction of trace metals was typicallyhigher. This is significant given that only 5% of the site was grouted. Any change in water quality is expected to bepermanent because of the pozzolanic nature of the FBC grout. It was known that the entire site generated AMD andthere was no intention of eliminating AMD production. The objective was to prove the effectiveness of the FBC inreducing pollutant loadings discharging from the site while evaluating the potential for increasing concentrations oftoxic elements.. Table 5 summarizes pre- and post-FBC monitoring data at well T-34, down gradient of a section ofthe mine which had been capped and grouted with FBC ash.
Despite less than total success at AMD abatement, the investigators concluded that injection grouting is a viableAMD abatement technique worthy of application on sites which meet certain criteria. The technique would be mostappropriate at reclaimed surface mines where the spoil is net alkaline but where improper placement of acidicmaterials (pit cleanings or refuse) resulted in an acidic discharge. In addition to reclaimed sites, the use of FBC isrecommended on active surface mines and refuse disposal sites as a preventative measure. FBC ash can be directlyapplied to or mixed with refuse and pit cleanings to create monolithic structures capable of diverting water away frompyritic materials.
Table 5. Pre-Grouting Mean Water Quality at the Clinton County Pennsylvania spoil site capped with FBC ash. In addition, an FBC ash grout was used to isolate pyritic pit cleanings from groundwater.
EPA Pre-CCB Post-CCBRCRA TCLP Drinking (mg/L) (mg/L)
Element Limit (mg/L) Water (mg/L) n=7 n=14Sb 1 0.006 As 5 0.05 0.177 0.0374 Ba 100 2 0.029 0.0455 Cd 1 0.005 0.132 0.0064
Cr (6+) 5 0.1 0.435 0.0394
Other IonsAl 425.14 28.36 Ca 76.44 42.69 Cu 1.84 0.0769 Fe 1193.57 124.46 Mg 87.13 14.47 Mn 63.085 50.453 Zn 7.536 0.614 Na 1.33 3.66
SO4 5513.41 430.07
Case Study 4. Chaplin Hill Mine, West Virginia. Ash for Pit Floor Sealing and Surface Capping
At the Chaplin Hill Coal Mine near Morgantown, WV, a series of surface mine pits were treated with FBC ash tocontrol AMD. Pits in the same geological sequence had historically produced AMD due to a pyritic pit floor and
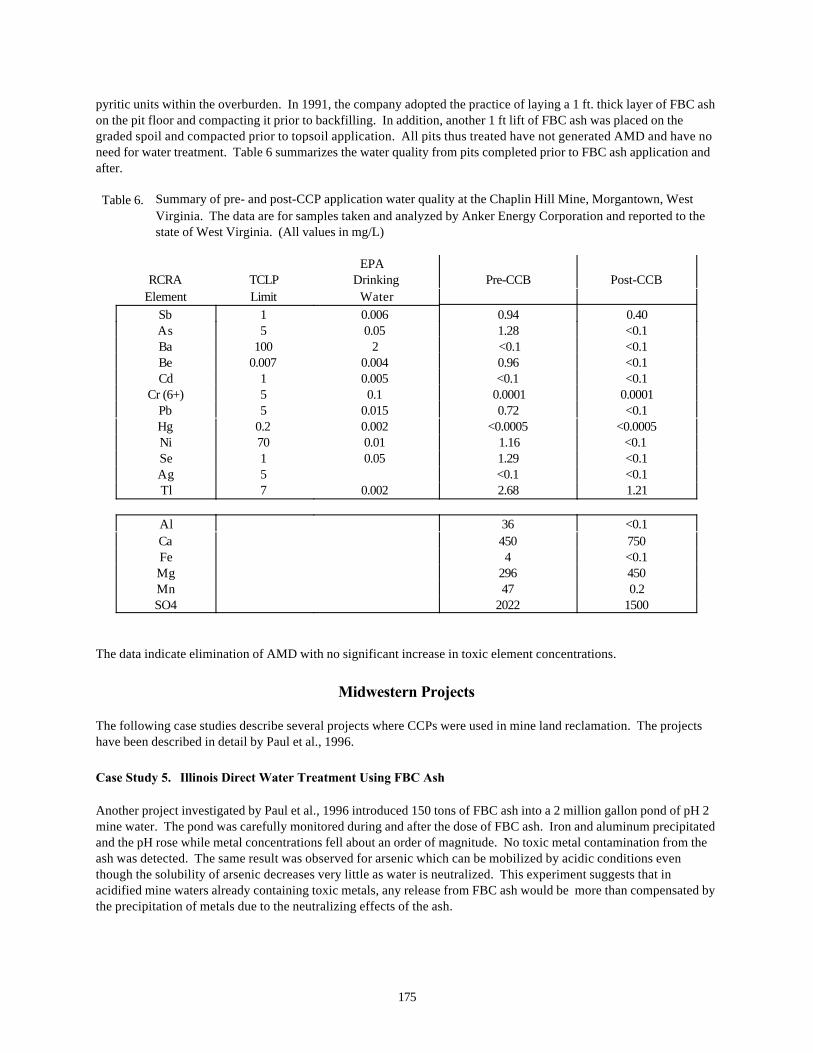
175
pyritic units within the overburden. In 1991, the company adopted the practice of laying a 1 ft. thick layer of FBC ashon the pit floor and compacting it prior to backfilling. In addition, another 1 ft lift of FBC ash was placed on thegraded spoil and compacted prior to topsoil application. All pits thus treated have not generated AMD and have noneed for water treatment. Table 6 summarizes the water quality from pits completed prior to FBC ash application andafter.
Table 6. Summary of pre- and post-CCP application water quality at the Chaplin Hill Mine, Morgantown, WestVirginia. The data are for samples taken and analyzed by Anker Energy Corporation and reported to thestate of West Virginia. (All values in mg/L)
EPA RCRA TCLP Drinking Pre-CCB Post-CCB
Element Limit WaterSb 1 0.006 0.94 0.40As 5 0.05 1.28 <0.1Ba 100 2 <0.1 <0.1Be 0.007 0.004 0.96 <0.1Cd 1 0.005 <0.1 <0.1
Cr (6+) 5 0.1 0.0001 0.0001Pb 5 0.015 0.72 <0.1Hg 0.2 0.002 <0.0005 <0.0005Ni 70 0.01 1.16 <0.1 Se 1 0.05 1.29 <0.1Ag 5 <0.1 <0.1Tl 7 0.002 2.68 1.21
Al 36 <0.1Ca 450 750Fe 4 <0.1Mg 296 450Mn 47 0.2SO4 2022 1500
The data indicate elimination of AMD with no significant increase in toxic element concentrations.
Midwestern Projects
The following case studies describe several projects where CCPs were used in mine land reclamation. The projectshave been described in detail by Paul et al., 1996.
Case Study 5. Illinois Direct Water Treatment Using FBC Ash
Another project investigated by Paul et al., 1996 introduced 150 tons of FBC ash into a 2 million gallon pond of pH 2mine water. The pond was carefully monitored during and after the dose of FBC ash. Iron and aluminum precipitatedand the pH rose while metal concentrations fell about an order of magnitude. No toxic metal contamination from theash was detected. The same result was observed for arsenic which can be mobilized by acidic conditions eventhough the solubility of arsenic decreases very little as water is neutralized. This experiment suggests that inacidified mine waters already containing toxic metals, any release from FBC ash would be more than compensated bythe precipitation of metals due to the neutralizing effects of the ash.
176
Conclusions
The use of CCPs as mine backfills has been beneficial in some settings, neutral in others, and harmful in yet othersettings. While each setting and CCP form a unique set of circumstances requiring individual analysis andevaluation, several generalizations can be made. 1. As mine fills, CCPs are used to: neutralize acid groundwater, encapsulate toxic materials, bring the land surface
to approximate original contour, prevent subsidence, and control hydraulic pressure buildup in undergroundcoal mines.
2. CCP mine fills introduce an alkaline component into the mine fill. In acid environments this can be beneficial. Byneutralizing acid, metal laden water, CCPs tend to cause metals to precipitate, lowering the concentrations ofnearly all metal ions. No case was found in which metal loadings increased beyond either TCLP or drinkingwater limits due to the application of CCPs in mine backfill. Neutralization of mine spoil or refuse is bestaccomplished by blending the CCP with pyritic materials in appropriate ratios.
3. In already neutral or alkaline groundwater environments, CCPs can exacerbate soil salinity problems. 4. The extent of positive or negative impacts is a function of the groundwater flux through the CCP, its chemistry
and the chemistry of the mine groundwater.5. Water flux is governed by local hydrology and the permeability of the CCP. In flat, arid regions water flux due to
precipitation may be negligible while flux along the mine pit floor may be high and regional. In mountainous,humid areas precipitation driven flux can be very high while groundwater flux is high but localized.
6. Some CCPs can be compacted or formulated as grouts such that they are nearly impermeable to water.
In mines suffering from acid mine drainage (AMD), most CCPs containing lime have positive effects. In nearly allcases, acid and metal loadings are substantially reduced or eliminated. Toxic element concentrations either decreaseor increase to levels well below TCLP and even drinking water standards. In arid, alkaline mines, care should betaken to ensure that groundwater flux is minimized either by compaction/solidification or by keeping the CCPs abovethe re-established saturated zone above the pit floor.
Non-fixated FGD materials contain almost no neutralization potential and are presently not very useful in mine landreclamation. The non-fixated materials typically exhibit a high permeability, as well. However, fixated FGD containsexcess alkalinity with low permeability. Fixated FGD materials can be useful in acid mine drainage abatement,subsidence control, high volume backfills, and as a barrier material to encapsulate acidic materials or seal pit floorson surface mines. Both materials can contain high chloride levels that are concentrated in the flue gasdesulfurization units.
References
American Coal Ash Association, Inc. 1998. Coal Combustion Product (CCP) Production and Use – 1997 in theUSA.
Aljoe, William W. 1999. Hydrologic and Water Quality Changes Resulting from Injection of CCB Grout into aMaryland Underground Mine, In. Proceedings: The 13th International Symposium on Use and Management ofCoal Combustion Products Volume 3 (TR-111829-V3), January 1999, Orlando, Florida paper 66: pp 66-1 to 66-12.
American Society for Testing and Materials. 1997. Standard Specification for Coal Fly Ash and Raw CalcinedNatural Pozzolan for Use as a Mineral Admixture in Concrete, ASTM C 618-97.
Paul, B., S. Chaturvedula, and B. Newton. 1996. Use of Coal Combustion By-Products for Reclamation andEnvironmental Applications, Proceedings of Coal Combustion By-Products Associated with Coal Mining –Interactive Forum.
Rafalko, Leonard and Petzrick, Paul. 1999. The Western Maryland Coal Combustion By-product/Acid Mine DrainageInitiative, The Winding Ridge Project. In. Proceedings: The 13th International Symposium on Use andManagement of Coal Combustion Products Volume 3 (TR-111829-V3), January 1999, Orlando, Florida paper 70:pp 70-1 to 70-16.

177
Shueck, Joseph, Mike DiMatteo, Barry Sheetz and Mike Silsbee. 1996. Water quality Improvements Resulting fromFBC Ash Grouting of Buried Piles of Pyritic Materials on a Surface Coal Mine. In. Proceedings of SeventeenthAnnual West Virginia Surface Mine Drainage Task Force Symposium, 2-3 April 1996, Morgantown WV: pp A1-A.
_____________________________1Paul Ziemkiewicz is the Director of the National Mine Land Reclamation Center and the West Virginia WaterResources Research Institute, West Virginia University, Morgantown, West Virginia. He received B.S. and M.S.degrees from Utah State University in Biology and Range Ecology, respectively, and a Ph.D from the University ofBritish Columbia in Forest Ecology. He joined the Alberta Government’s Department of Energy after graduating fromUBC in 1978 where he directed its reclamation research program in coal and oil sand mining. He also served onAlberta’s regulatory review committee and served as the research manager of the Province’s coal research program. He came to West Virginia University in 1988 as the Director of the National Mine Land Reclamation Center and theWest Virginia Water Resources Research Institute. He serves on a number of Federal, State and industry advisorypanels on environmental remediation. He has more than 70 publications on the topic of mine land reclamation, acidmine drainage, and coal ash application in mines.

178

179
EFFECTS OF CCBs ON GROUNDWATER QUALITY AFTER MINING
D.J. Hassett1, G.H. Groenewold, and F.W. BeaverEnergy and Environmental Research Center,
Grand Forks, North DakotaO.E. Manz
Manz AssociatesAlvarado, Minnesota
Introduction
Although there have been many studies of the effects of disposed coal combustion by-products (CCBs) ongroundwater, few sites have been as well understood, studied, and monitored as the one selected as the focus forthis manuscript. The site at Center, North Dakota, represents disposal of both alkaline fly ash and flue gasdesulfurization (FGD) residue. Alkaline CCBs are unique in that they undergo interesting and complex hydrationreactions upon contact with water; however, they are not the only members of their category. It is now known thatadvanced methods such as fluidized bed combustion (FBC), as well as technologies for flue gas treatment that usealkaline scrubber materials, create CCBs from coal normally producing nonalkaline-type Class F fly ash that behavesimilarly to the alkaline Class C fly ash studied at this research site.
In 1978, a field study was begun to determine the effects of fly ash and FGD residue on groundwater as a result ofdisposal in a reclaimed lignite strip mine. Although the results of this research are as would be expected, specific tothe site and disposed materials, the overall results and conclusions are typical for most mine disposal scenarios. Theresidues used for this study were generated at the Milton R. Young Power Station, Square Butte ElectricCooperative, near Center, North Dakota. The site contains a mine mouth electric generating power plant operated byBaukol-Noonan that burned low-sulfur lignite from the Center mine. The Milton R. Young Station consists of twogenerating units. Unit 1 is a 240-MW cyclone-fired boiler, and Unit 2 is a 440-MW cyclone-fired boiler. Both unitsare equipped with electrostatic precipitators (ESPs), and Unit 2 is also equipped with a wet-scrubber FGD systemthat uses the naturally alkaline fly ash produced at the plant as the sorbent scrubber material instead of lime orlimestone.
Fly ash and FGD residue disposal was evaluated in two hydrogeologically different disposal settings: pit bottomsand vee-notches between spoil ridges. Both combustion residues were disposed in each of the settings. Afterreclamation, the pit bottoms were typically below the water table, while material disposed in the vee-notches wastypically above the postmining water table. The pit-bottom environment was a saturated setting with a relativelyhigh permeability, while the vee-notches provided an unsaturated setting enclosed by relatively low- permeablitymaterial.
More than 240 piezometers and 40 pressure vacuum lysimeters were installed within the waste disposal sites andundisturbed adjacent areas throughout the duration of the project. Monitoring at the site continued for over 8 yearsafter disposal of the CCBs. Groundwater flow and occurrence at the site was well defined as a result of more than15,000 water level recordings. It was determined that the local hydrogeologic regime returned to near the premininglevels after reclamation. The base of the spoils commonly constituted the major aquifer in the disturbed areas of thepost-reclamation site.
There were a total of five disposal settings. These were:
1. Wet-pit-bottom FGD disposal. This first site represents a pit-bottom setting that intersected thegroundwater surface and contained standing water when the FGD residues were placed. The pit is at theedge of the mine and is adjacent to the unmined lignite aquifer at the base of the spoils.
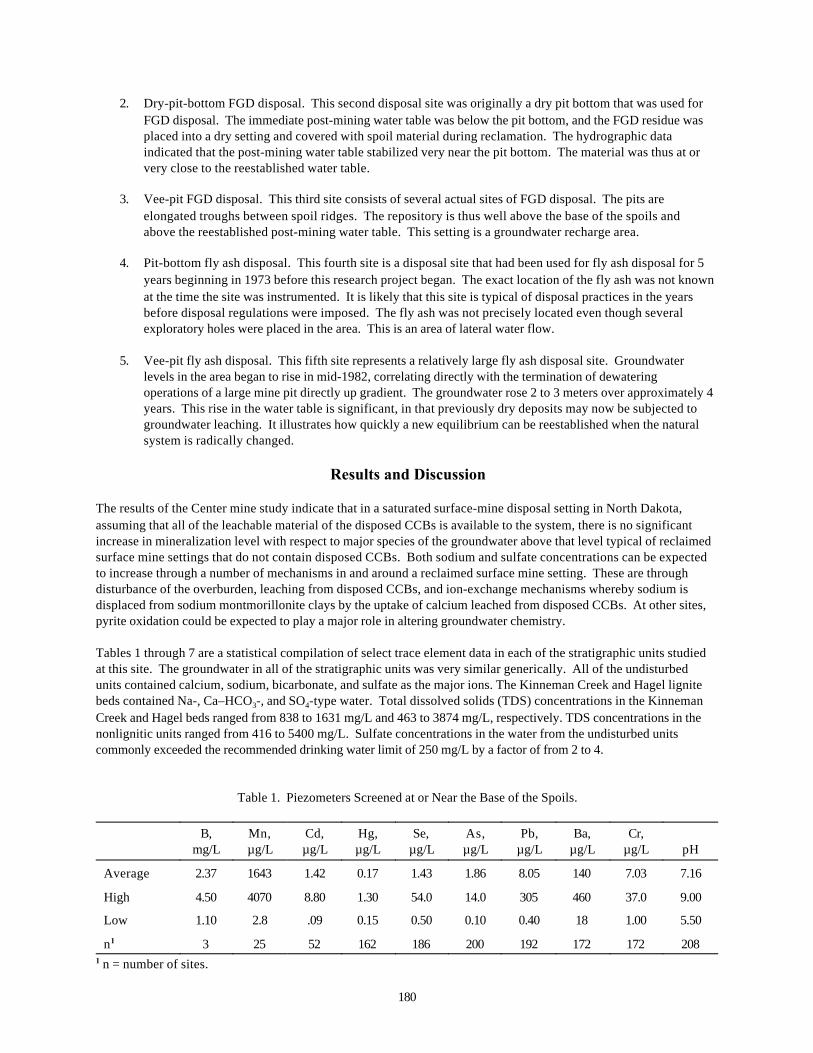
180
2. Dry-pit-bottom FGD disposal. This second disposal site was originally a dry pit bottom that was used forFGD disposal. The immediate post-mining water table was below the pit bottom, and the FGD residue wasplaced into a dry setting and covered with spoil material during reclamation. The hydrographic dataindicated that the post-mining water table stabilized very near the pit bottom. The material was thus at orvery close to the reestablished water table.
3. Vee-pit FGD disposal. This third site consists of several actual sites of FGD disposal. The pits areelongated troughs between spoil ridges. The repository is thus well above the base of the spoils andabove the reestablished post-mining water table. This setting is a groundwater recharge area.
4. Pit-bottom fly ash disposal. This fourth site is a disposal site that had been used for fly ash disposal for 5years beginning in 1973 before this research project began. The exact location of the fly ash was not knownat the time the site was instrumented. It is likely that this site is typical of disposal practices in the yearsbefore disposal regulations were imposed. The fly ash was not precisely located even though severalexploratory holes were placed in the area. This is an area of lateral water flow.
5. Vee-pit fly ash disposal. This fifth site represents a relatively large fly ash disposal site. Groundwaterlevels in the area began to rise in mid-1982, correlating directly with the termination of dewateringoperations of a large mine pit directly up gradient. The groundwater rose 2 to 3 meters over approximately 4years. This rise in the water table is significant, in that previously dry deposits may now be subjected togroundwater leaching. It illustrates how quickly a new equilibrium can be reestablished when the naturalsystem is radically changed.
Results and Discussion
The results of the Center mine study indicate that in a saturated surface-mine disposal setting in North Dakota,assuming that all of the leachable material of the disposed CCBs is available to the system, there is no significantincrease in mineralization level with respect to major species of the groundwater above that level typical of reclaimedsurface mine settings that do not contain disposed CCBs. Both sodium and sulfate concentrations can be expectedto increase through a number of mechanisms in and around a reclaimed surface mine setting. These are throughdisturbance of the overburden, leaching from disposed CCBs, and ion-exchange mechanisms whereby sodium isdisplaced from sodium montmorillonite clays by the uptake of calcium leached from disposed CCBs. At other sites,pyrite oxidation could be expected to play a major role in altering groundwater chemistry.
Tables 1 through 7 are a statistical compilation of select trace element data in each of the stratigraphic units studiedat this site. The groundwater in all of the stratigraphic units was very similar generically. All of the undisturbedunits contained calcium, sodium, bicarbonate, and sulfate as the major ions. The Kinneman Creek and Hagel lignitebeds contained Na-, Ca–HCO3-, and SO4-type water. Total dissolved solids (TDS) concentrations in the KinnemanCreek and Hagel beds ranged from 838 to 1631 mg/L and 463 to 3874 mg/L, respectively. TDS concentrations in thenonlignitic units ranged from 416 to 5400 mg/L. Sulfate concentrations in the water from the undisturbed unitscommonly exceeded the recommended drinking water limit of 250 mg/L by a factor of from 2 to 4.
Table 1. Piezometers Screened at or Near the Base of the Spoils.
B,mg/L
Mn,µg/L
Cd,µg/L
Hg,µg/L
Se,µg/L
As,µg/L
Pb,µg/L
Ba,µg/L
Cr,µg/L pH
Average 2.37 1643 1.42 0.17 1.43 1.86 8.05 140 7.03 7.16
High 4.50 4070 8.80 1.30 54.0 14.0 305 460 37.0 9.00
Low 1.10 2.8 .09 0.15 0.50 0.10 0.40 18 1.00 5.50
n1 3 25 52 162 186 200 192 172 172 2081 n = number of sites.

181
Table 2. Piezometers Screened in Fly Ash.
B,mg/L
Mn,µg/L
Cd,µg/L
Hg,µg/L
Se,µg/L
As,µg/L
Pb,µg/L
Ba,µg/L
Cr,µg/L pH
Average 8.14 1219 2.07 0.17 13.3 59.6 18.5 91.5 51.7 8.94
High 25.3 6500 6.50 0.80 760 613 236 302 205 12.84
Low 1.00 10.0 0.05 0.15 0.20 0 .30 1.00 13.0 1.00 5.60
n 8 14 19 59 74 78 76 61 64 80
Table 3. Piezometers Screened in FGD Residue.
B,mg/L
Mn,µg/L
Cd,µg/L
Hg,µg/L
Se,µg/L
As,µg/L
Pb,µg/L
Ba,µg/L
Cr,µg/L pH
Average 9.76 1546 2.62 0.17 5.18 4.89 16.4 127 27.7 7.31High 42.4 4410 6.50 0.60 130 19.0 93.0 420 102 9.15Low 1.10 380 0.32 0.15 1.00 0.70 1.00 22 1.00 6.15n 5 5 25 58 63 64 61 56 59 64
Table 4. Piezometers Screened Below the Base of the Spoils.
B,mg/L
Mn,µg/L
Cd,µg/L
Hg,µg/L
Se,µg/L
As,µg/L
Pb,µg/L
Ba,µg/L
Cr,µg/L pH
Average 6.42 395 3.98 0.35 1.39 2.68 6.80 133 6.65 7.53High 20.7 2930 25.2 4.60 6.10 37.6 38.8 758 52.6 9.25Low 2.10 100 0.14 0.10 0.90 0.40 0.90 7.20 1.00 5.86n 14 45 35 97 101 106 98 92 92 118
Table 5. Piezometers Screened in the Hagel Bed.
B,mg/L
Mn,µg/L
Cd,µg/L
Hg,µg/L
Se,µg/L
As,µg/L
Pb,µg/L
Ba,µg/L
Cr,µg/L pH
Average 2.35 747 3.28 0.17 1.01 1.28 5.62 131 2.29 7.11High 2.80 2750 27.0 0.70 2.20 6.20 94.0 473 20.0 8.70Low 1.90 50 0.30 0.15 0.40 0.80 0.50 0.50 0.30 6.05n 2 16 16 105 107 107 106 103 103 117
Table 6. Piezometers Screened in the Kinneman Creek Bed.
B,mg/L
Mn,µg/L
Cd,µg/L
Hg,µg/L
Se,µg/L
As,µg/L
Pb,µg/L
Ba,µg/L
Cr,µg/L pH
Average — 359 0.95 0.17 1.55 1.82 21.7 51.6 2.50 6.63High — 730 3.00 0.20 3.40 5.10 60.0 60.0 3.60 7.49Low — 95.0 0.22 0.15 0.20 0.20 2.00 43.1 1.40 6.00n — 12 8 2 4 4 7 2 2 15
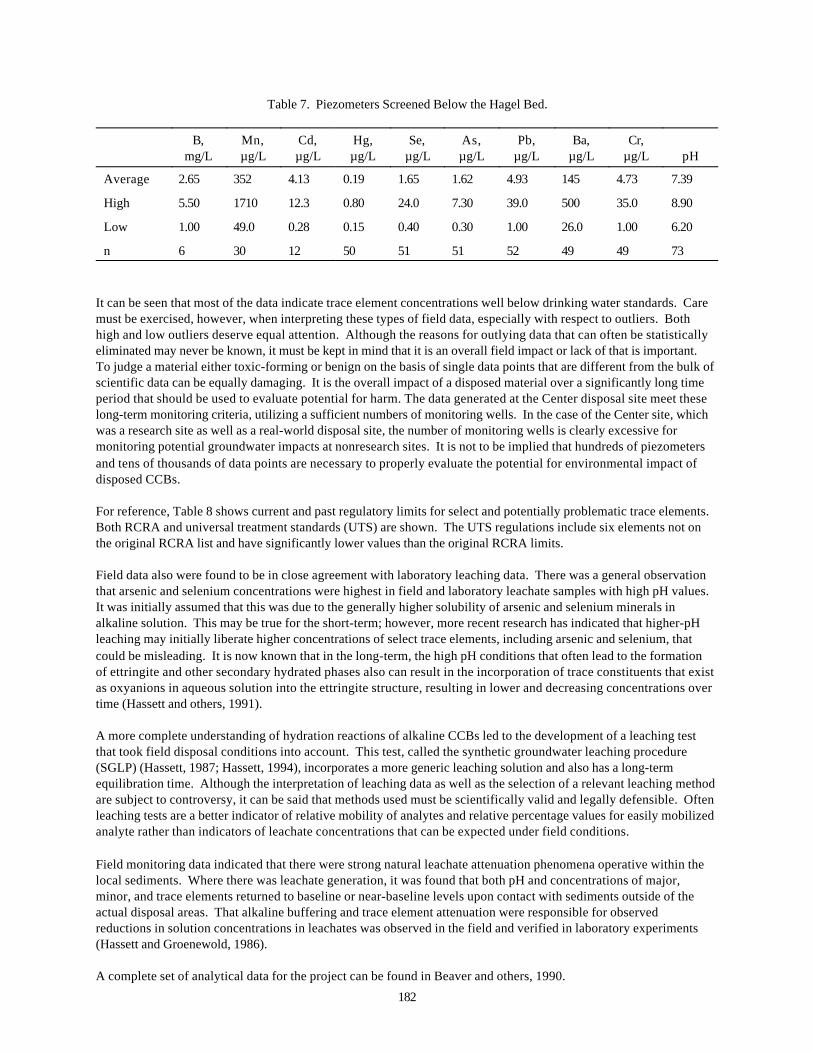
182
Table 7. Piezometers Screened Below the Hagel Bed.
B,mg/L
Mn,µg/L
Cd,µg/L
Hg,µg/L
Se,µg/L
As,µg/L
Pb,µg/L
Ba,µg/L
Cr,µg/L pH
Average 2.65 352 4.13 0.19 1.65 1.62 4.93 145 4.73 7.39
High 5.50 1710 12.3 0.80 24.0 7.30 39.0 500 35.0 8.90
Low 1.00 49.0 0.28 0.15 0.40 0.30 1.00 26.0 1.00 6.20
n 6 30 12 50 51 51 52 49 49 73
It can be seen that most of the data indicate trace element concentrations well below drinking water standards. Caremust be exercised, however, when interpreting these types of field data, especially with respect to outliers. Bothhigh and low outliers deserve equal attention. Although the reasons for outlying data that can often be statisticallyeliminated may never be known, it must be kept in mind that it is an overall field impact or lack of that is important. To judge a material either toxic-forming or benign on the basis of single data points that are different from the bulk ofscientific data can be equally damaging. It is the overall impact of a disposed material over a significantly long timeperiod that should be used to evaluate potential for harm. The data generated at the Center disposal site meet theselong-term monitoring criteria, utilizing a sufficient numbers of monitoring wells. In the case of the Center site, whichwas a research site as well as a real-world disposal site, the number of monitoring wells is clearly excessive formonitoring potential groundwater impacts at nonresearch sites. It is not to be implied that hundreds of piezometersand tens of thousands of data points are necessary to properly evaluate the potential for environmental impact ofdisposed CCBs.
For reference, Table 8 shows current and past regulatory limits for select and potentially problematic trace elements.Both RCRA and universal treatment standards (UTS) are shown. The UTS regulations include six elements not onthe original RCRA list and have significantly lower values than the original RCRA limits.
Field data also were found to be in close agreement with laboratory leaching data. There was a general observationthat arsenic and selenium concentrations were highest in field and laboratory leachate samples with high pH values. It was initially assumed that this was due to the generally higher solubility of arsenic and selenium minerals inalkaline solution. This may be true for the short-term; however, more recent research has indicated that higher-pHleaching may initially liberate higher concentrations of select trace elements, including arsenic and selenium, thatcould be misleading. It is now known that in the long-term, the high pH conditions that often lead to the formationof ettringite and other secondary hydrated phases also can result in the incorporation of trace constituents that existas oxyanions in aqueous solution into the ettringite structure, resulting in lower and decreasing concentrations overtime (Hassett and others, 1991).
A more complete understanding of hydration reactions of alkaline CCBs led to the development of a leaching testthat took field disposal conditions into account. This test, called the synthetic groundwater leaching procedure(SGLP) (Hassett, 1987; Hassett, 1994), incorporates a more generic leaching solution and also has a long-termequilibration time. Although the interpretation of leaching data as well as the selection of a relevant leaching methodare subject to controversy, it can be said that methods used must be scientifically valid and legally defensible. Oftenleaching tests are a better indicator of relative mobility of analytes and relative percentage values for easily mobilizedanalyte rather than indicators of leachate concentrations that can be expected under field conditions.
Field monitoring data indicated that there were strong natural leachate attenuation phenomena operative within thelocal sediments. Where there was leachate generation, it was found that both pH and concentrations of major,minor, and trace elements returned to baseline or near-baseline levels upon contact with sediments outside of theactual disposal areas. That alkaline buffering and trace element attenuation were responsible for observedreductions in solution concentrations in leachates was observed in the field and verified in laboratory experiments(Hassett and Groenewold, 1986).
A complete set of analytical data for the project can be found in Beaver and others, 1990.

183
Table 8. Comparison of RCRA and UTS Criteria
Element UTS Change RCRA Limit, mg/L1 UTS, mg/L1 PDWS, mg/LArsenic — 5.0 5.00 0.05Antimony New — 1.15 0.006Barium Lower 100 21.0 2.0Beryllium New — 1.22 0.0042
Cadmium Lower 1.0 0.11 0.005Chromium Lower 5.0 0.60 0.1Lead Lower 5.0 0.75 TT3
Mercury Lower 0.2 0.025 0.002Nickel New — 11.00 —Selenium — 1.0 5.7 —Silver Lower 5.0 0.14 —Thallium New — 0.20 0.002Vanadium New — 1.60 —Zinc New — 4.30 —1 Both UTS and RCRA levels are leachate concentrations determined using toxicity characteristic leaching procedure (TCLP)
or, under the performance-based measurement system (PBMS), a relevant scientifically valid alternative test such as ASTM orsynthetic groundwater leaching procedure (SGLP) (Hassett, 1987).
2 Powder concentration.3 Treatment technique.
Conclusions
The primary impacts to the environment were increased concentrations of sodium and sulfate. In FGD, this can beattributed to solubility phenomena associated with the sulfate salts and minerals that are associated with thedisposed material. Since alkaline fly ash was used as a scrubbing material, long-term hydration reactions can beexpected to alter the system as time passes. Unlike conventional scrubbers that generate calcium sulfite or calciumsulfate, which have predictable solubility behavior, fly ash-based FGD can be expected to result in lowerconcentrations of sulfate and alkali and alkaline-earth salts due to the formation of ettringite and ettringite phases. The lower concentrations of these leachate components would not be predicted considering only the solubility ofinitially identified minerals in the FGD. It has been shown that in fly ash–FGD systems where there is a source ofsoluble calcium, aluminum, and sulfate or suitable oxyanion plus alkalinity, ettringite is usually the main secondaryhydration product (Hassett and others, 1991).
Although the primary purpose of fly ash based FGD systems is to reduce atmospheric contamination, the results ofthis study showed that a secondary benefit of this process is to convert the fly ash from a form that can potentiallyleach problematic trace elements to a form that causes increased sulfate concentrations but generally no significantincreases in the potentially more toxic trace elements. The addition of sufficient concentrations of sulfate to assistettringite formation is likely the reason for this phenomenon. In the case of alkaline ash from low-sulfur lignite, thedeficient ingredient for ettringite formation is likely sulfate, which following the FGD process is present in sufficientquantities to result in the fixation of the potentially toxic trace elements that exist as oxyanions in aqueous solution. These include, but are not limited to, arsenic, boron, chromium, molybdenum, selenium, and vanadium.
Burial of FGD residue in mined areas offers an effective means of disposal providing that the material is placed in afavorable location in the mined area and provided that the selective placement of FGD and spoil is accomplished withappropriate consideration for the hydrologic and geochemical nature of the system. In North Dakota and many otherareas where mining occurs, placement of waste materials can be accomplished in a manner that nearly assures thatcontact with water and thus leachate formation are a remote possibility.

184
Beneficial reuse should always be considered before disposal (Pflughoeft-Hassett et al., 1996), but since that is notalways possible, disposal practices and their potential consequences are of the greatest importance. Propercharacterization is essential to environmentally responsible disposal. It is now known that the formation ofsecondary hydrated phases such as ettringite, which tends to form in alkaline CCBs, can significantly alter themobility of certain trace elements that exist as oxyanions in aqueous solution. This phenomenon, although likely inplay at the Center, North Dakota, site, was not recognized at the time of the publication of initial results of this study. It is likely that ettringite formation may have been responsible for the low observed concentrations of trace elementsas well as the phenomena recognized in the final report. Attenuation mechanisms such as soil attenuation, dilution,dispersion, and diffusion will still exert a powerful influence on leachates from CCBs that become mobilized into theenvironment. Alkaline CCBs will, however, present lower concentrations of certain trace elements than previouslyperformed short-term leaching tests would have indicated. This can only be seen as a benefit to an alreadyenvironmentally benign system.
References
Beaver, F.W.; Groenewold, G.H.; Manz, O.E.; Hassett, D.J. The Effects of Fly Ash and Flue Gas DesulfurizationWastes on Groundwater Quality in a Reclaimed Lignite Strip Mine; final report for U.S. Department of EnergyContract Nos. DE-AC21-80FC10230 and DE-AC21-80FC10120; Energy and Environmental Research Center:Grand Forks, ND, 1990.
Hassett, D.J. A Generic Test of Leachability: The Synthetic Groundwater Leaching Procedure. In Proceedings of theWaste Management for the Energy Industries Conference, University of North Dakota, Grand Forks, ND, April29–May 1, 1987.
Hassett, D.J. Scientifically Valid Leaching of Coal Conversion Solid Residues to Predict Environmental Impact. InProceedings of the Trace Element Transformations in Coal-Fired systems Workshop, Scottsdale, AZ, April19–22, 1993; Special Issue of Fuel Processing Technology 1994, 39 (1–3), 445–459.
Hassett, D.J.; Groenewold, G.H. Attenuation Capacity of Western North Dakota Overburden Sediments; final reportfor U.S. Department of Energy Contract No. DE-AT18-80FC10120; Bulletin No. 86-04-MMRRI-01; 1986; 105 p.
Hassett, D.J.; Pflughoeft-Hassett, D.F.; McCarthy, G.J. Ettringite Formation in Coal Ash as a Mechanism forStabilization of Hazardous Trace Elements. In Proceedings of the 8th Annual International Pittsburgh CoalConference, Pittsburgh, PA, Oct 14–18, 1991.
Pflughoeft-Hassett, D.F.; Dockter, B.A.; Eylands, K.E.; Hassett, D.J. Survey and Demonstration of UtilizationPotential of North Dakota Lignite Ash Resources; Report 96-EERC-04-01 for the Industrial Commission ofNorth Dakota; Energy and Environmental Research Center: Grand Forks, ND, April, 1996.
______________________________1David J. Hassett is a Senior Research Advisor at the Energy and Environmental Research Center (EERC) of theUniversity of North Dakota. He received his B.S. in Chemistry and Mathematics from Winona State University inWinona, Minnesota, in 1966 and continued with graduate studies in Chemistry from 1970 to 1975. He has authoredor coauthored over 130 publications. Mr. Hassett's principal areas of interest and expertise include the application ofanalytical chemistry toward the solution of environmental problems associated with trace element occurrence,transport, and fate. The most recent research focus has been on trace element transformations during coalconversion processes and interaction between groundwater and coal conversion solids as related to the leachabilityof trace elements. Additional areas of expertise include hydration reactions of coal conversion solid residues as wellas organic synthesis, radiochemistry, x-ray spectrometry, analytical chemistry, and vegetable oil diesel fuels.

185
PERFORMANCE ASSESSMENT OF A FLUE GAS DESULFURIZATION MATERIAL AT A LINED POND FACILITY
Tarunjit S. Butalia1, Ph.D., P.E., Research ScientistWilliam E. Wolfe, Ph.D., P.E., Professor
Department of Civil and Environmental Engineering and Geodetic ScienceThe Ohio State University
Columbus, Ohio
Abstract
A broad overview of the technical feasibility of using stabilized Flue Gas Desulfurization (FGD) product as a rawmaterial for the construction of low permeability liners is presented. To demonstrate the practicality of using FGDmaterial as a hydraulic barrier, a full-scale pond was designed and built on property owned by The Ohio StateUniversity. The facility, using lime-enriched FGD as the primary liner, was constructed in the summer of 1997 at theWestern Branch of the Ohio Agricultural Research and Development Center near South Charleston in Clark County. The full-scale facility was monitored to study the leaching characteristics of the FGD liner. An evaluation of theperformance of the facility is presented in terms of measurements of the permeability of the field-compacted FGDliner as well as the quality of the leachate. FGD materials can be compacted in the field using traditional constructionequipment and the hydraulic barrier can be made comparable to one made from clay. First year monitoring of the full-scale facility has shown that: (a) the permeability coefficient of the field compacted liner is in the 10-7 cm/sec range,and (b) the quality of the leachate flowing through the FGD-liner generally meets the National Primary DrinkingWater Regulations.
Introduction
Increasing restrictions on sulfur dioxide (SO2) emissions from coal-fired plants have led utilities to design a numberof methods to remove SO2 from the flue gases before releasing them to the atmosphere. Lime is commonly used asthe SO2 scrubbing agent. The solid product produced is commonly referred to as Flue Gas Desulfurization (FGD)material. It mainly consists of varying amounts of sulfates and/or sulfites of a chemical reagent, unreacted reagent,fly ash, and water. Ohio generates approximately 4 to 6 million tons of FGD material annually. In the past, the FGD material hadgenerally been treated as a waste and consequently landfilled. Increasing costs of landfilling as well as the scarcityof landfill space have led utilities to look into the re-use of FGD material. Researchers at The Ohio State Universityhave recently completed a comprehensive study of the land application of FGD materials.1-3
Laboratory Tests
Laboratory evaluation of the hydraulic conductivity and strength characteristics of lime enriched FGD materials havebeen presented by Butalia and Wolfe.4 Table 1 shows some of the laboratory test results presented by Butalia andWolfe and some additional tests that were conducted on compacted FGD samples. Two laboratory samples (66-34-5and 66-34-8) were prepared in the laboratory by mixing fly ash (FA) and filter cake (FC) in approximately 2:1 ratio (dryweight basis). Samples 66-34-5 and 66-34-8 had lime contents (dry weight basis) of 5% and 8%, respectively. Themoisture contents listed for the laboratory mixed samples are the optimum moisture contents so as to achievemaximum dry density (as per ASTM D-698-915). The CON(AEP)-5%L and CON(AEP)-8%L samples were obtainedfrom American Electric Power’s (AEP) Conesville power plant near Coshocton, Ohio, while the GAV(AEP)-4%L andGAV(AEP)-8%L samples were obtained from AEP’s Gavin plant near Gallipolis, Ohio. These samples were preparedat the respective power plants instead of being mixed in the laboratory. 4%L and 5%L denote the lime percentage ona dry weight basis as estimated by the plant operators. The CON and GAV samples were compacted using standardproctor test guidelines5 at as received moisture contents. It can be observed from Table 1 that moisture contents ofthe samples received from the power plants were higher than the optimum moisture contents obtained in thelaboratory. Consequently, the dry densities obtained by compacting these samples were lower than the maximum
186
dry densities obtained from the laboratory mixed samples. However, the coefficient of permeability, which wasmeasured as a function of curing time (7,28,60 and 90 days), using a falling head test6, is lower for the plant mixedsamples than for the laboratory samples. For the plant mixed samples, the permeability values are in the 10-7 to 10-8
cm/sec range at 28 days of curing. Samples with higher lime contents resulted in lower coefficients of permeability aswell as higher unconfined compressive strengths. From Table 1, it can be observed that the permeability andstrength characteristics of FGD materials generated at the Conesville and Gavin plants are similar. The 8% limesamples have the lowest permeability values that come close to 10-8 cm/sec. It can be concluded from Table 1 thatFGD material can be compacted in the laboratory using standard soil testing procedures to obtain permeabilitycoefficients that are in the 10-7 to 10-8 cm/sec range, which is lower than the 1x10⁻⁷ cm/sec value typically recommended by the U.S. Environmental Protection Agency for constructing liners forwaste containment facilities.7
Full Scale FGD-Lined Facility
Since permeability is likely to be a function of the construction process, the field validation of the propertiesobtained in the laboratory is an important part of the documentation process. The design, construction, andmonitoring of a full-scale testing facility, to evaluate the performance of a field-compacted FGD liner, is presented inthis section.
Design of Facility
The full-scale facility was constructed to addresses two critical questions that will need to be answered about thebehavior of stabilized FGD products constructed in the field, i.e., What is the permeability of a compacted engineeredliner of known thickness and density? and What is the quality of the water that flows through the FGD liner?
The facility was designed and constructed at The Ohio State University’s Ohio Agricultural Research andDevelopment Center (OARDC) Western Branch in South Charleston (Clark County), Ohio. This site was chosenover other university sites because it had an abundance of clay onsite that was suitable for use as a secondary orouter liner to contain the primary FGD liner. The OARDC Western Branch is a swine and agronomic research facilityand, hence, it was decided to build a livestock manure storage facility that could be used by the center for storingswine manure after the completion of this research. The facility was designed for a capacity of approximately 150,000ft3 to provide six months storage for all liquid wastes from the swine onsite. A double-layered design was chosenwith compacted FGD as the primary inner liner and the onsite clay as the secondary outer liner. A leachate systemwas placed between the primary FGD liner and secondary clay liner to collect in a sump any water passing throughthe FGD fill. The sump was designed so that it could be used to collect leachate samples with ease and forconducting field permeability tests on the pond.
The facility is essentially rectangular in shape with overall dimensions of approximately 144 feet by 250 feet(including 8-foot wide berms), as shown in Figure 1. Three sides of the pond were constructed at 3:1 slope and thefourth (east) side slope at 7:1. The east side slope was designed to be less steep so as to allow for easy access tothe pond bottom during and after construction. Cross-sections AA and BB which are presented as Figures 2 and 3,respectively, show the final elevations of the facility. As seen in Figures 2 and 3, the pond is 9 feet deep with aliquid freeboard of 2 feet. A berm of minimum 8-foot top width was added around the periphery of the pond tominimize the inflow of surface water. The natural clay at the site provided an outer liner that was at least 5 feet thick. The leachate collection system, which consisted of corrugated high-density polyethylene (HDPE) perforated pipes(with socks) and protected against crushing using #57 washed river gravel, was placed over the re-compacted clay. The bottom of the pond was then covered with 9 inches of sand. On top of the sand layer, an 18-inch thick layer ofcompacted FGD material was placed. A plan view of the leachate collection system is shown in Figure 4. A typicaldetail of the perforated pipe embedded in the sand layer is shown in Figure 5.
Construction of Facility
Excavation of the site began on July 30, 1997, and the re-compaction of onsite clay to form the secondary liner wascompleted on August 7, 1997. A sheepsfoot roller was used to compact the onsite clay (Figure 6). A geofabric was spread over the secondary liner. The leachate system was then placed over the secondary liner (Figure 7) and

187
covered with sand (Figure 8). A layer of geofabric was laid over the sand layer. Lime-enriched FGD material wasdelivered by truck from American Electric Power’s Conesville Station near Coshocton, Ohio (Figure 9) to the site at arate of approximately 600 tons per day. Placement and compaction of FGD in 4-6 inch lifts were accomplished usingtwo dozers and one sheepsfoot roller (figures 10 and 11). The site was smooth rolled before completion of theproject (Figure 12).
Approximately 2,700 tons of lime-enriched FGD material was used in the construction of the primary liner. Themoisture content of the FGD material received at the site during construction ranged from 49% to 62%, while theproctor dry density varied between 9.6 and 11.6 kN/m3.
Wet weather during the liner placement resulted in several delays but construction at the site was completed byAugust 26, 1997. Filling of the pond with water began on September 12, 1997, and was completed on September 23,1997. Figure 13 is a photograph of the partially filled facility. The pond was filled with water up to a depth ofapproximately 9 feet as shown in Figure 14.
Monitoring of Facility
The facility was used to store water for the first year. In August/September of 1998, some of the water was replacedwith swine manure and the facility was monitored for at least another year. The monitoring program consists of twomain activities:
1. Field Permeability Testing: Full-scale permeability tests on the facility are being conducted by lowering thewater level in the sump to create a head difference across the FGD liner. The amount of time taken to increasethe water in the sump to specific levels is observed. Knowing the thickness of the FGD liner and its plan viewarea, the effective permeability of the field compacted FGD-lined facility is calculated (Figure 15). Thepermeability data obtained from the full-scale pond tests is being compared with: a) laboratory tests conductedon laboratory compacted samples collected during pond construction; b) laboratory tests conducted on fieldcompacted samples cored from test pads installed at the site; and c) field permeability tests (Boutwell)conducted on the test pads.
2. Water Quality Monitoring Program: Testing of water samples from the pond, the sump, and a well about 1,000feet from the site is being carried out on a regular basis. The water quality analysis is being performed by theChemical Analysis Laboratory of The Ohio State University’s School of Natural Resources at OARDC inWooster. Tests conducted on the water samples include pH, electrical conductivity, alkalinity, acidity, totaldissolved solids, 24 elements by Inductively Coupled Plasma (ICP) Emission Spectrometry Mineral Analysis, 4anions using Ion Chromatography (IC) Analysis, and ammonia as well as nitrogen by Micro-KjeldahlDistillation. The effect of FGD on the quality of the water that does flow through the liner is being evaluated bycomparing the results obtained from the pond and sump samples.
Results of First Year Monitoring
The full-scale FGD-lined facility was monitored for field permeability and water quality on a regular basis. Table 2shows the effective coefficients of permeability obtained from full-scale permeability tests (Figure 15) conductedafter the pond was filled with water. The permeability coefficients were calculated using the bottom area of the pondas the effective leaching area for the FGD-liner. The permeability coefficient values listed in Table 2 are the averageof several test readings that were measured at each curing time. The full-scale permeability of the facility wasevaluated to be 9.1x10⁻⁷ cm/sec at a curing time of one month. The permeability coefficient has continued to reduceover time and has stabilized at approximately 4x10⁻⁷cm/sec. The actual area over which water flows through the FGD-liner is greater than the bottom area of the pond. Hence the full-scale permeability values presented in Table 2should be taken to be an upper bound to the actual permeability of the field compacted FGD liner. Figure 16 showsthe time history comparison of the full-scale permeability test values with averaged permeability coefficientsobtained from a) laboratory tests on laboratory compacted samples, b) field tests (Boutwell) conducted on test pads,and c) laboratory tests conducted on samples cored from test pads. All the test procedures showed decreasingpermeability with increasing curing time. It was observed that the laboratory compacted samples had permeabilitycoefficients which were an order of magnitude lower than the full-scale testing values. Permeability values obtainedfrom Boutwell tests and cored samples tested in the laboratory were in close agreement with each

188
other but were one to three orders of magnitude higher than the full-scale tests. The test pad sample permeabilityvalues (Boutwell tests and cored sample testing) indicated a large scatter in the data. The permeability coefficientsvaried from 10-4 to 10-6 cm/sec with average permeabilities in range of 10-5 cm/sec.
Water quality monitoring of the site was conducted by collecting water samples from the pond, sump, and a vicinitywell. The first baseline water samples were collected on September 12, 1997 before any water was added to thefacility. Only well and sump samples were collected. After the pond had been filled with water on September 23,1997, water samples were collected from the pond, sump, and well on a regular basis. All samples were tested forseveral constituents and properties including pH, electrical conductivity, alkalinity, acidity, total dissolved solids,aluminum, arsenic, boron, barium, calcium, cadmium, chromium, copper, iron, potassium, magnesium, manganese,sodium, nickel, phosphorous, lead, sulfur, selenium, silica, silver, vanadium, zinc, chloride, phosphate, sulfate,nitrate, ammonia, and nitrogen.
Table 3 lists the measured concentration levels of some the above listed elements. It is observed that concentrationof barium, cadmium, and copper are much lower than the National Primary Drinking Water Regulation (NPDWR) limit. Arsenic concentration levels are also lower than the NPDWR limit. Immediately after the pond was filled, the level ofchromium recorded was 0.125 mg/l. We believe that this was the result of relatively high levels of chromium in thesource water. However, the sump samples have consistently shown lower chromium concentrations than the pondsamples. We will continue to monitor chromium levels in the pond and sump since preliminary data indicate thatthere may be some absorption of the chromium by the FGD material. All measurements for chromium, which weremade after the pond was filled with water, show low concentration levels compared to the NPDWR limit. The nitrateconcentration level in the sump only slightly exceeded the NPDWR limit when the facility was first filled with water. Beyond the filling of the pond, the nitrate concentration levels were much lower than the NPDWR limit.
It can be observed from Table 3 that the pH of the well sample has been decreasing slightly according to seasonalgroundwater variations. The pH of the pond sample was within the Ohio Secondary Maximum Contaminant Level(OSMCL). The pH of the sump water rose sharply to 12.0 on filling the facility with water and has been droppingsince then. The last pH level reading for the sump was 9.1, which is within the OSMCL range of 7.0 to 10.5. Thedissolved aluminum concentrations in the sump samples increased significantly during the filling of the pond. However soon after filling the facility, the aluminum concentrations dropped significantly and have stabilized atapproximately four times the National Secondary Drinking Water Regulation (NSDWR) limit. The aluminumconcentrations in the pond are approximately twice the NSDWR limit. Iron levels for the pond and sump sampleshave always been lower than the NSDWR limit. Sulfate levels have generally been within the NSDWR limit. TheNSDWR limit for silver was exceeded slightly in the sump during the filling of the pond but since then the measuredlevels have decreased significantly and are currently much lower than the recommended regulation limit. Zincconcentration levels are also much lower than the NSDWR limit. On filling the pond, the chloride concentration inthe sump increased to about four times the NSDWR limit, but has decreased since then to a level much lower thanthe regulation limit. Phosphate level in the sump increased on filling of the facility with water but reduced quicklyand no measurable concentrations have been detected in the last 5 months. Boron, elevated levels of which can bephytotoxic to plant growth, generally had lower concentration levels in the sump than the pond. As with chromium,we will be monitoring this element to see if this trend is continued for a long enough period of time to indicate thepossibility that boron is being trapped in the FGD liner.
Conclusions
Lime-enriched FGD material can be compacted in the laboratory to achieve permeability values lower than thosegenerally recommended for lining waste containment facilities. A full-scale FGD-lined pond facility was constructedat The Ohio State University to study the permeability and leachate characteristics of a field-compacted FGD liner. First year monitoring of the facility has shown that: a) the full-scale permeability of the field-compacted FGD liner isin the 10-7 cm/sec range, which is typical of compacted clays; b) the full-scale permeability testing method is the mostreliable; c) results of field permeability tests (e.g., Boutwell test) on test pads have large scatter in the data; d) qualityof the leachate that flowed through the field-compacted FGD liner generally meets the NPDWR limits; and e) someconstituents (e.g., chromium and boron) may be absorbed by the FGD material as water leaches through it. Thewater in the pond was replaced with swine manure beginning in August/September 1998 and the facility will bemonitored for at least one more year.
189
Acknowledgments
The work described in this paper was part of a research project entitled Re-Use of Clean Coal Technology By-Products in the Construction of Impervious Liners (OCDO Grant CDO/D-95-10) and was performed at The Ohio StateUniversity. The principal sponsor of the research project is the Ohio Department of Development’s CoalDevelopment Office. Industrial co-sponsors are American Electric Power, Dravo Lime Company, Ohio Department ofNatural Resources, Ohio Farm Bureau, Ohio Pork Producers Council, Ohio Cattlemen’s Association, Ohio PoultryAssociation and BBC&M Engineering, Inc. Jim Fordyce and George Campirini of AEP provided useful comments onthe design of the pond. The cooperation of AEP’s Conesville plant staff is valued and appreciated. The assistanceprovided by the OARDC Western Branch staff during the construction of the full-scale facility is appreciated. Theauthors would like to thank graduate students Gokhan Inci and Jennifer Myers for their help. More information onthis research initiative may be obtained from the Internet web address: http://ccpohio.eng.ohio-state.edu/liner/.Additional information on the use of coal combustion products can be accessed at: http://ccpohio.eng.ohio-state.edu
References
1. Land Application Uses of Dry FGD By-Products (Phase 1 Report), R. Stehouwer, W. Dick, J. Bigham, L. Forster,F. Hitzhusen, E. McCoy, S. Traina and W. Wolfe. Electric Power Research Institute, 1991, Report # EPRI TR-105264.
2. Land Application Uses of Dry FGD By-Product (Phase 2 Report), R. Stehouwer, W. Dick, J. Bigham, L. Forster,F. Hitzhusen, E. McCoy, S. Traina and W. Wolfe. Electric Power Research Institute, 1998, Report # EPRI TR-109652.
3. Land Application Uses of Dry FGD By-Product (Phase 3 Report), W. Dick, J. Bigham, L. Forster, F. Hitzhusen, R.Lal, R. Stehouwer, S. Traina and W. Wolfe, 1998, The Ohio State University.
4. Butalia, T.S. and W.E. Wolfe, Re-Use of Clean Coal Technology By-Products in the Construction of ImperviousLiners, 1997 International Ash Utilization Symposium, Lexington, Kentucky, October 20-22, 1997.
5. Test Method for Laboratory Compaction Characteristics of Soil Using Standard Effort (12,400 ft-lbf/ft3 (600 kN-m/m3)), ASTM D698-91, 1997.
6. Standard Test Method for Measurement of Hydraulic Conductivity of Porous Materials Using a Rigid-WallCompaction Mold Permeameter, ASTM D5856-95, 1996.
7. Design, Construction, and Evaluation of Clay Liners For Waste Management Facilities, Goldman, L.J., et al., EPAReport, EPA/530/SW-86/007F, Office of Solid Waste and Emergency Response, United States EnvironmentalProtection Agency, Washington, DC, 1988.

190
124 ft.
62 ft.
250 ft.
144 ft. 8 ft. 14 ft.
8ft.
Section AA
Section AA
6ft.
27ft.
8 ft.6 ft.
27 ft.
8 ft.6 ft.
27 ft.
63 ft.
SectionBB
SectionBB
Table 1. Laboratory Compacted FGD Samples
Sample
MoistureContent
(%)
Dry Density
(kN/m3)
Coefficient of Permeability (cm/sec)
7 day 28 day 60 day 90 day
qu
(psi)
90 day
66-34-5(FA-FC-L)
27 12.4 3.6 x10⁻⁵ 3.2 x10⁻⁶ 1.5 x10⁻⁶ 1.4 x10⁻⁶ 242
66-34-8(FA-FC-L)
32 12.2 1.4 x10⁻⁵ 1.2 x10⁻⁶ 1.3 x10⁻⁷ 4.8 x10⁻⁸ 343
CON(AEP)-5%L 48 11.1 2.6 x10⁻⁶ 3.6 x10⁻⁷ 3.2 x10⁻⁷ 2.6 x10⁻⁷ 240
CON(AEP)-8%L 42 11.9 1.3 x10⁻⁶ 6.1 x10⁻⁸ 3.4 x10⁻⁸ 3.0 x10⁻⁸ 629
GAV(AEP)-4%L 51 10.8 2.2 x10⁻⁶ 2.2 x10⁻⁷ 1.5 x10⁻⁷ 1.7 x10⁻⁷ 371
GAV(AEP)-8%L 39 12.5 1.6 x10⁻⁶ 1.2 x10⁻⁷ 2.0 x10⁻⁸ 1.0 x10⁻⁸ 607
FA: Fly Ash FC: Filter Cake L: Lime AEP: American Electric Power CON: Conesville Plant GAV: Gavin Plant
Figure 1.
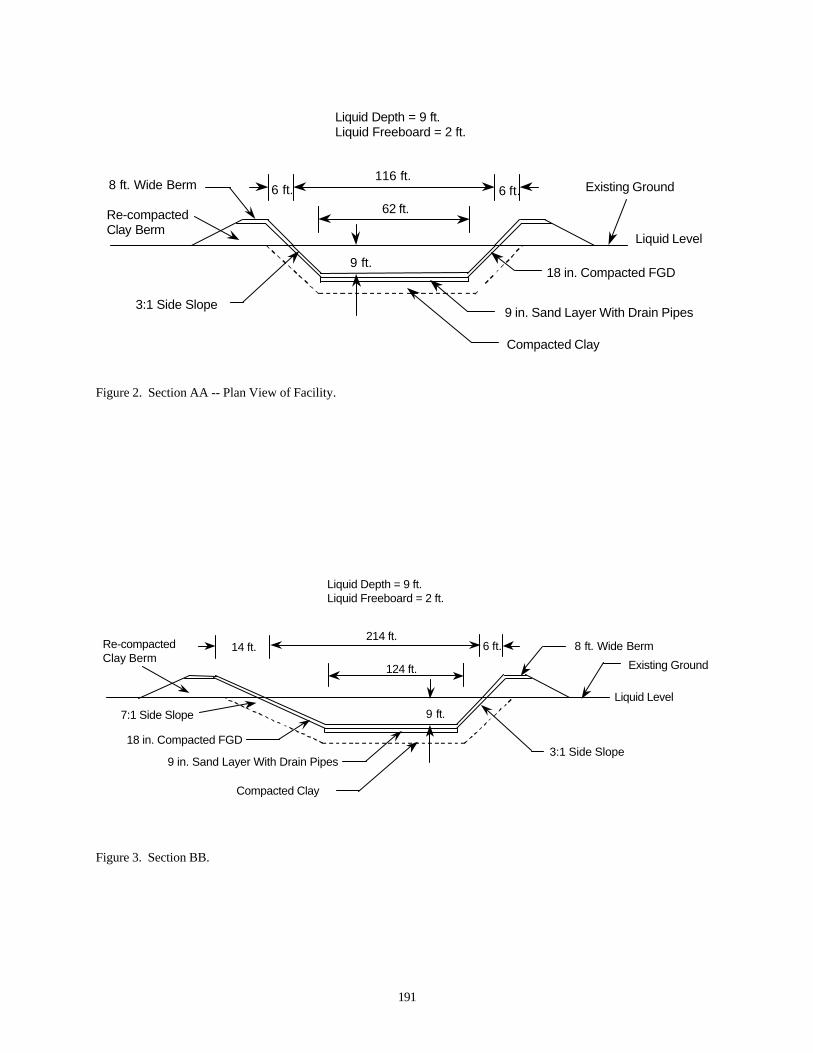
191
62 ft.
116 ft.6 ft. 6 ft.8 ft. Wide Berm
9 ft.
Existing Ground
Liquid Level
18 in. Compacted FGD
9 in. Sand Layer With Drain Pipes3:1 Side Slope
Liquid Depth = 9 ft.Liquid Freeboard = 2 ft.
Compacted Clay
Re-compactedClay Berm
124 ft.
214 ft.6 ft.14 ft. 8 ft. Wide Berm
9 ft.
Existing Ground
Liquid Level
18 in. Compacted FGD
9 in. Sand Layer With Drain Pipes3:1 Side Slope
Liquid Depth = 9 ft.Liquid Freeboard = 2 ft.
Compacted Clay
7:1 Side Slope
Re-compactedClay Berm
Figure 2. Section AA -- Plan View of Facility.
Figure 3. Section BB.

192
124 ft.
4 in. Perforated Collection Pipe6 in. Transmission Pipe
20 ft. typ.
40-50 ft.
62 ft.
18 in. Collection Sump
2%
2% 2% 2% 2% 2% 2% 2%
Section CC
Section CC
18 in. Compacted FGD
9 in. Sand Layer
Compacted Clay
#57 Washed River Gravel 4 in. Perforated Pipe with Sock
Geofabric
Figure 4. Leachate Collection System Layout.
Figure 5. Section CC.

193
Figure 6. Compaction of Onsite Clay.
Figure 7. Typical Leachate System Collection.
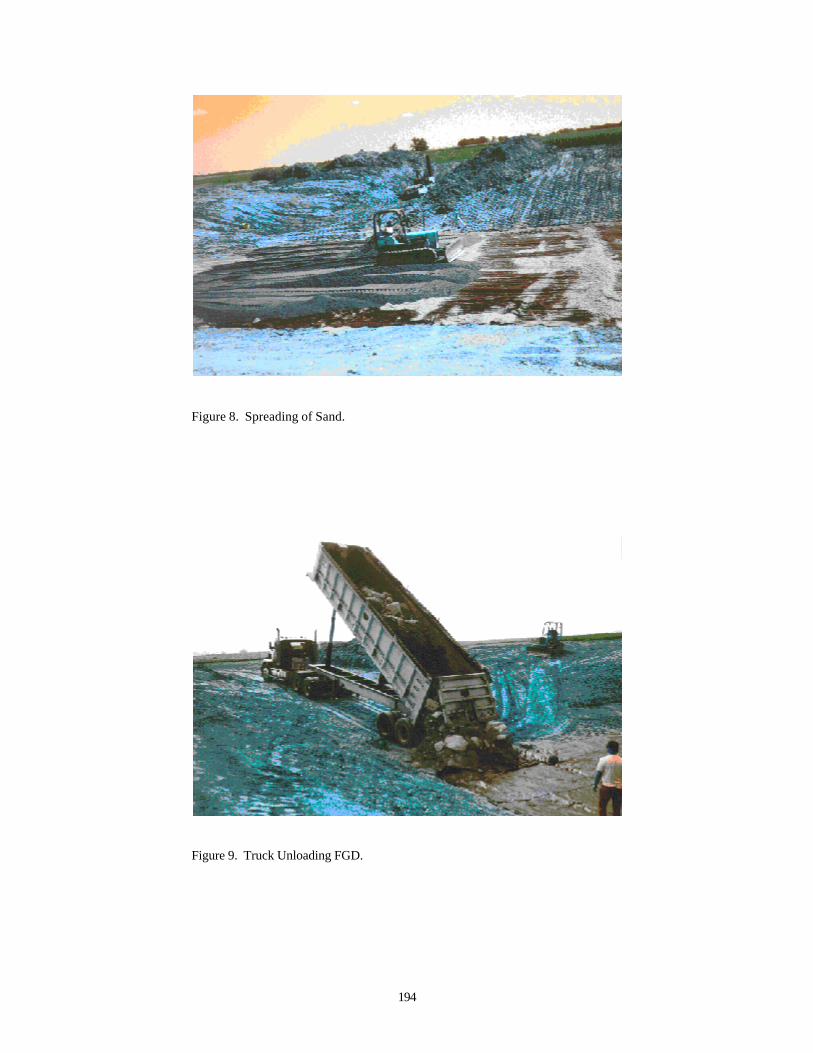
194
Figure 8. Spreading of Sand.
Figure 9. Truck Unloading FGD.
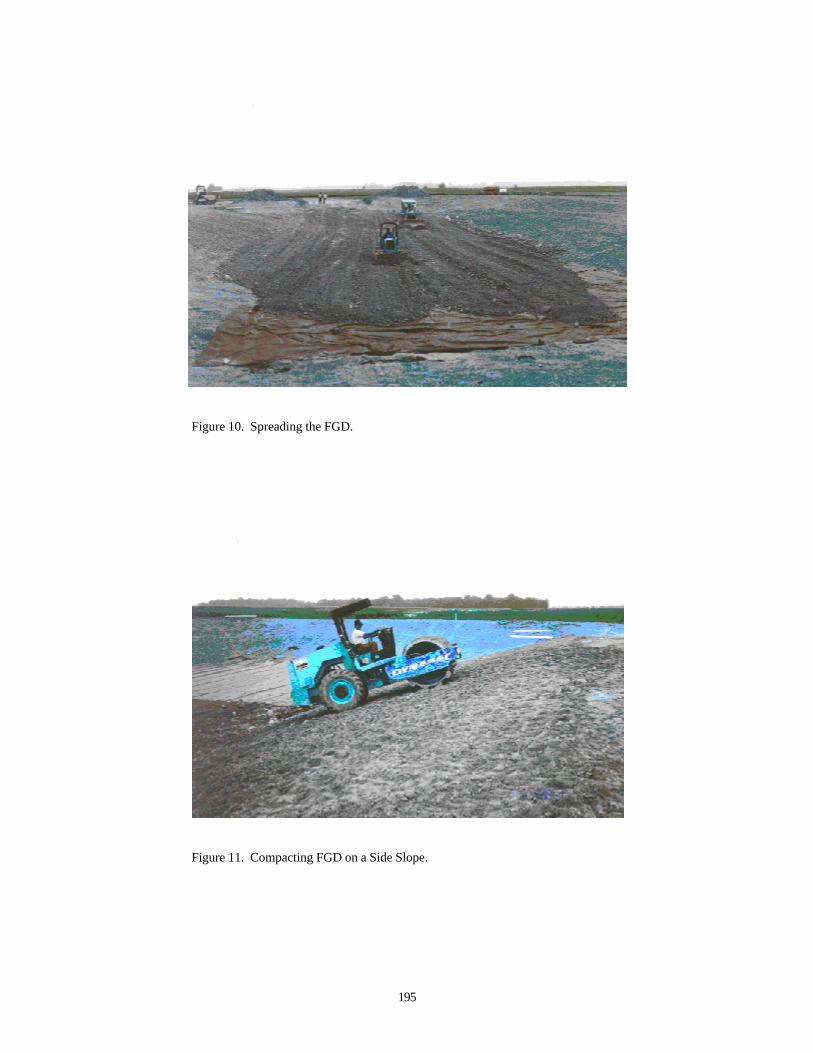
195
Figure 10. Spreading the FGD.
Figure 11. Compacting FGD on a Side Slope.
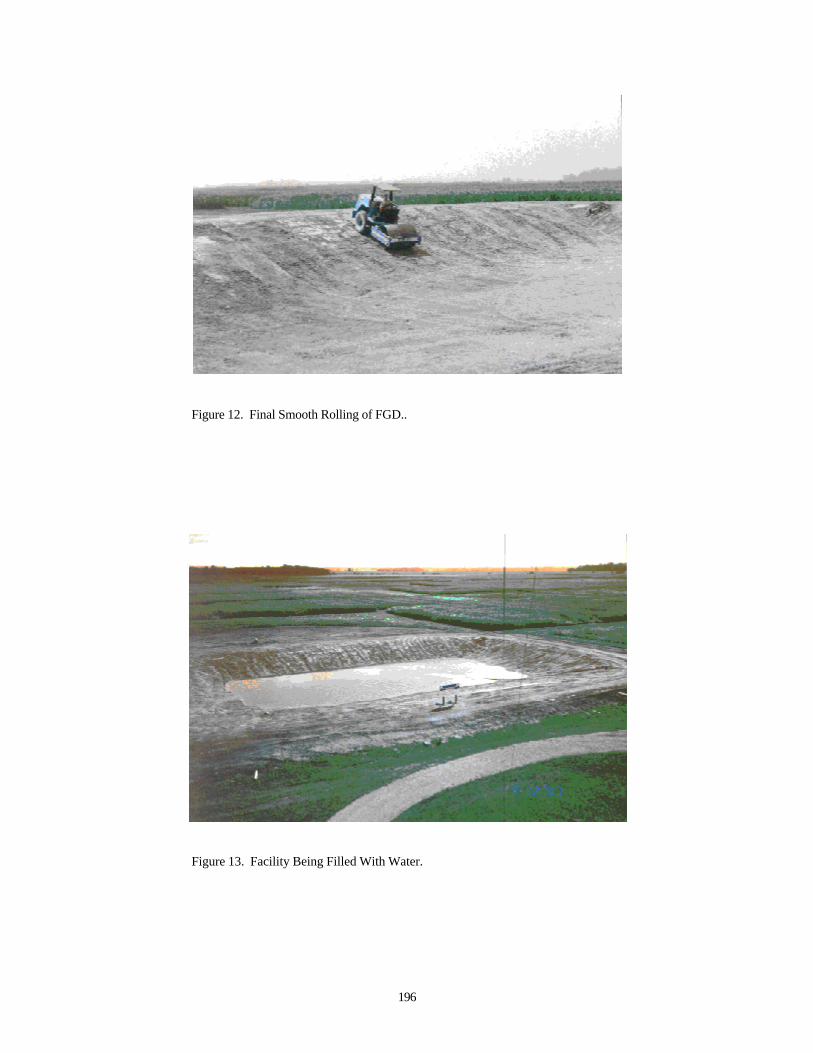
196
Figure 12. Final Smooth Rolling of FGD..
Figure 13. Facility Being Filled With Water.
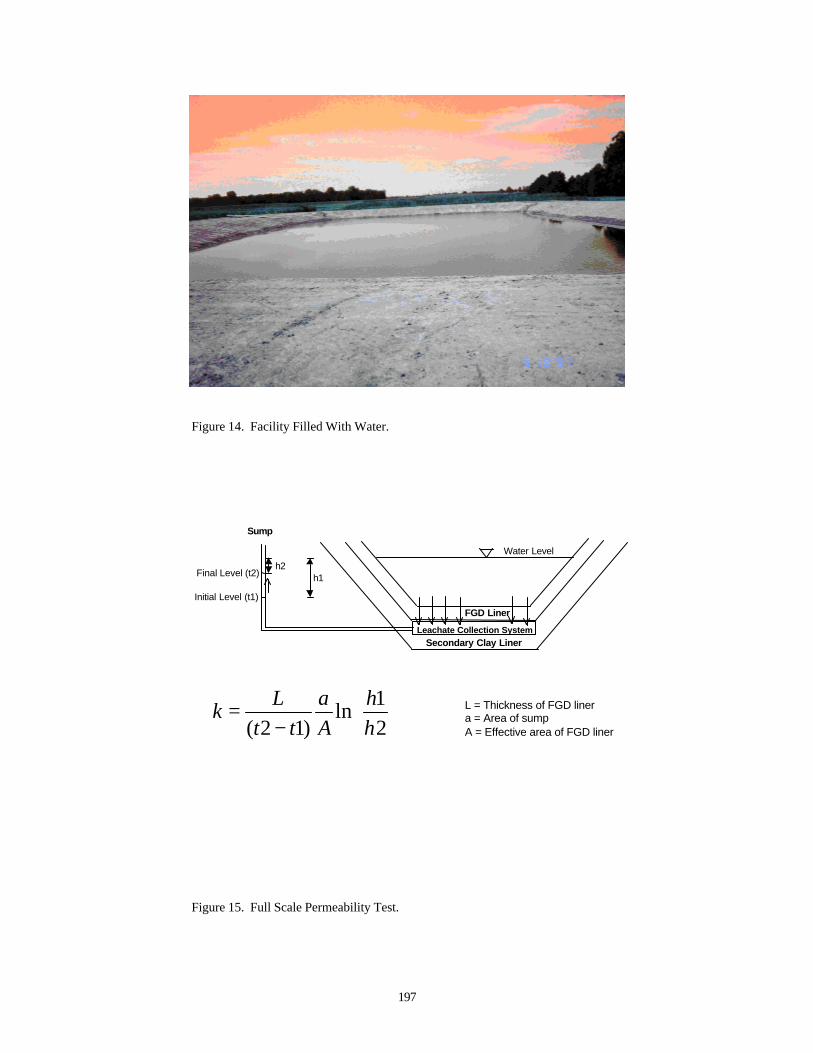
197
FGD Liner
Leachate Collection SystemSecondary Clay Liner
Sump
Water Level
Final Level (t2)
Initial Level (t1)
h1h2
−=
21ln
)12( hh
Aa
ttLk L = Thickness of FGD liner
a = Area of sumpA = Effective area of FGD liner
Figure 14. Facility Filled With Water.
Figure 15. Full Scale Permeability Test.

198
1.E-08
1.E-07
1.E-06
1.E-05
1.E-040 60 120 180 240 300 360
Curing Time (days)C
oeff
icie
nt o
f Per
mea
bilit
y
(cm
/sec) Full scale test
Laboratory test on laboratorycompacted sample Boutwell test
Laboratory test on cored sample
Curing Time(days)
Coefficient of Permeability*(cm/sec)
31 9.1 x 10 -7
63 6.8 x 10 -7
153 4.1 x 10 -7
202 4.3 x 10 -7
317 3.8 x 10 -7
Figure 16. Comparison of Permeability Test Methods.
Table 2. Full Scale Permeability Tests.
*Effective area of FGD liner = Bottom area of pond.

199
Table 3. Water Quality Monitoring.
Regulation Limit Measured Concentration Levels (mg/l except pH)
Sample Location Sump Well Sump Pond Well Sump Pond Well Sump Pond Sump PondDate Collected 9/12/97 9/12/97 9/28/97 9/28/97 9/28/97 1/26/98 1/26/98 1/26/98 3/16/98 3/16/98 7/9/98 7/9/98pH 7.0-10.5*** 7.94 8.25 12.05 8.39 8.62 11.23 7.85 7.96 11.28 7.57 9.12 8.22Aluminum 0.05 to 0.2 mg/l** 0.157 0.248 5.505 0.713 0.151 1.033 0.489 <0.040 0.737 0.305 0.809 0.403Arsenic 0.05 mg/l* <0.035 <0.035 0.049 <0.035 <0.035 <0.035 <0.035 <0.035 <0.035 <0.035 <0.035 <0.035Boron - 0.059 0.214 1.154 0.742 0.204 0.552 0.635 0.203 0.455 0.692 0.374 0.952Barium 2.0 mg/l* 0.100 0.080 0.035 0.028 0.078 0.027 0.028 0.058 0.030 0.031 0.017 0.049Cadmium 0.005 mg/l* <0.001 <0.001 <0.001 <0.001 <0.001 0.001 <0.001 0.001 0.001 <0.001 <0.001 <0.001Chromium 0.1 mg/l* 0.080 0.125 0.087 0.188 0.127 <0.005 <0.005 <0.005 <0.005 <0.005 <0.005 0.006Copper 1.3 mg/l* 0.018 0.026 0.014 0.019 0.034 <0.004 <0.004 0.039 <0.004 <0.004 <0.004 <0.004Iron 0.3 mg/l** 0.043 0.267 0.150 0.048 0.039 0.019 0.142 1.313 <0.006 0.016 <0.006 <0.006Silver 0.1 mg/l** <0.008 <0.008 0.104 0.012 0.008 0.044 0.018 0.010 0.028 0.018 <0.008 <0.008Zinc 5.0 mg/l** 0.043 0.271 <0.005 <0.005 <0.005 0.009 <0.005 <0.005 <0.005 <0.005 0.531 0.623Chloride 250 mg/l** 85.38 6.91 976.92 16.80 5.77 480.08 32.69 5.46 377.50 34.33 38.93 239.67Phosphate - 0.00 0.00 53.71 0.00 0.00 1.36 0.00 0.00 0.00 5.51 0.00 0.00Sulfate 250 mg/l** 125.25 21.82 182.11 104.46 18.95 185.05 141.25 20.45 171.19 183.79 262.31 120.82Nitrate 10 mg/l* 11.41 0.00 0.81 0.17 0.26 0.41 0.51 0.25 0.33 0.35 0.00 0.00* National Primary Drinking Water Regulation** National Secondary Drinking Water Regulation*** Ohio Secondary Maximum Contaminant Level
______________________________1Tarunjit S. Butalia is a Research Specialist with the Department of Civil and Environmental Engineering and GeodeticScience, The Ohio State University, Columbus, Ohio. He received a Ph.D in Engineering from The Ohio StateUniversity and is a Registered Professional Engineer in the State of Ohio. He is the Program Coordinator for aStatewide Coal Combustion Products Pilot Extension Program at The Ohio State University. His technical specialtyis the characterization of natural and synthetic materials and their uses in technically sound, environmentally benign,socially acceptable, and commercially competitive applications. He is involved directly in several CCP research anddemonstration projects and has authored, presented, and/or published more than 25 technical papers.

200

201
WATER QUALITY AT AN ABANDONED MINE SITE TREATED WITH COAL COMBUSTION BY-PRODUCTS
Ralph J. Haefner1
U.S. Geological SurveyWater Resources Division
Columbus Ohio
Abstract
Most coal combustion by-products (CCBs), including fly ash, bottom ash, and scrubber sludge, are disposed of inlandfills at a significant cost to the electric industry and, ultimately, to the consumer. Many of these CCBs havephysical and chemical properties that may make them useful in industrial or agronomic applications; however,regulatory agencies require environmental information regarding their potential toxicity and chemical influence ongroundwater and surface water before widespread use can be initiated. To assess the environmental influence ofCCBs in an abandoned coal mine setting, a multi-organization project team applied 125 tons per acre of drypressurized fluidized bed combustion (PFBC) by-products to the land surface during reclamation of a 7-acre site inTuscarawas County, Ohio in 1994. The PFBC by-product had a paste pH value of approximately 10 to 12 and had acalcium carbonate equivalent of about 60 percent, thus making it potentially useful in amelioration of acid minedrainage. Interstitial water (water in the shallow unsaturated zone), groundwater, and spring water were sampledannually at the mine site from 1995 through 1998 to determine the fate and transport of constituents derived from thePFBC by-product in the groundwater flow system.
Comparison of interstitial-water quality between the PFBC by-product application area and a control area wheretraditional reclamation methods were used showed that addition of PFBC by-products resulted in higher median pH,specific conductance, and magnesium to calcium mole ratios, as well as higher median concentrations of sulfate andboron. Potentially toxic trace elements such as arsenic, selenium, lead, and mercury were detected only at or near thedetection limit (1.0 microgram per liter) in the application area and the control area. Median concentrations ofdissolved iron, nickel, and zinc in interstitial waters were significantly lower in the application area than in the controlarea as a result of pH increases caused by the addition of PFBC by-product. Concentrations of most constituents ininterstitial water in the application area decreased over the 4-year monitoring period. Water quality analyses ofinterstitial waters show that addition of PFBC by-products has resulted in partial amelioration of the production ofacid mine drainage in the application area; however, increased concentrations of dissolved sulfate and boron may bean undesirable side effect of PFBC by-products for reclamation purposes.
In contrast to interstitial water, groundwater and spring water have shown no major changes in chemistry related tosurface application of PFBC by-product. Groundwater samples were obtained from wells placed up gradient anddown gradient from the application area. Spring water was obtained from down gradient springs. Increases indissolved sulfate concentrations were noted in groundwater during the 4-year period; however, sulfur-isotope ratiosin sulfate indicated that these increases were caused by oxidation of iron sulfide minerals in the mine spoil, not byapplication of PFBC by-products. The oxidation of mine spoil likely increased because of spoil disturbance duringreclamation activities. Because changes in groundwater chemistry at abandoned mine sites are typically slow andmay take several years to occur, continued monitoring of the site is planned through 2001.
Introduction In 1994, a seven-acre abandoned surface coal mine in eastern Ohio was reclaimed with 125 tons per acre of a dry coalcombustion by-product derived from a pressurized fluidized bed combustion process. The by-product wasproduced at the American Electric Power Tidd Plant in Brilliant, Ohio which used a dolomitic (calcium-magnesiumcarbonate) sorbent. The chemical composition of this material is similar to flue gas desulfurization (FGD) by-products and includes calcium sulfate, unspent sorbent (calcium carbonate, calcium oxide, and magnesium oxide),iron oxide, and fly ash. Accordingly, major-element chemistry of the PFBC by-product is dominated by calcium,
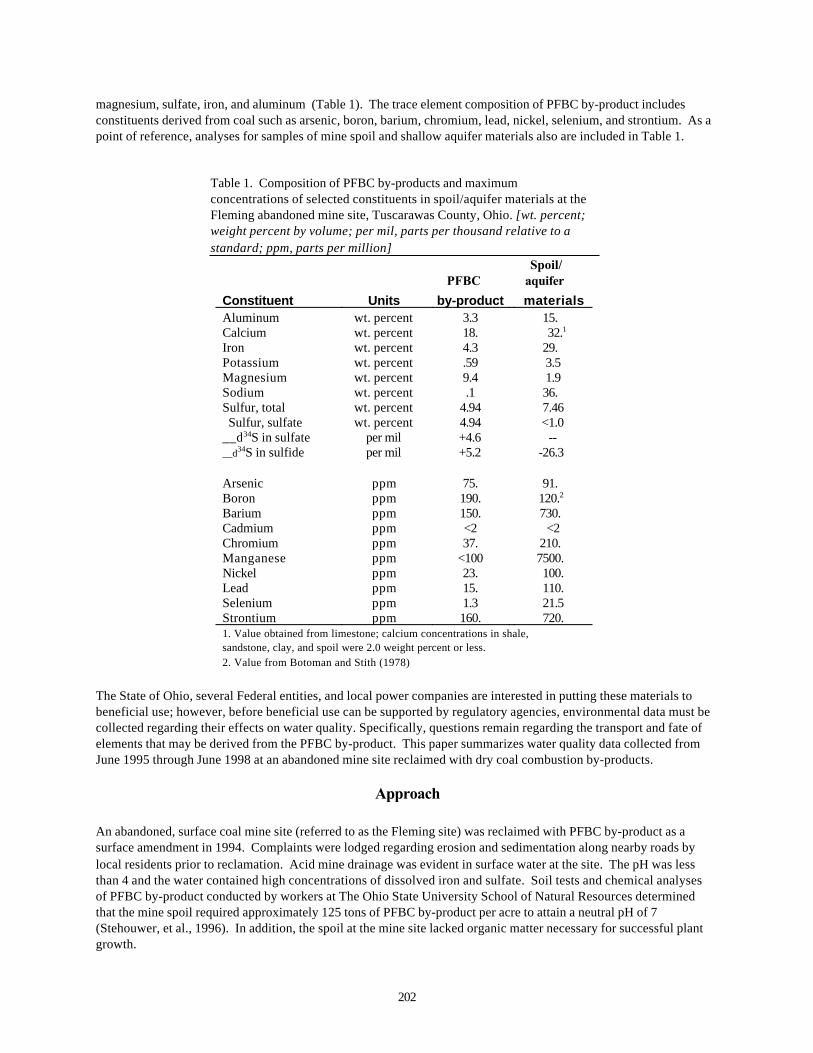
202
magnesium, sulfate, iron, and aluminum (Table 1). The trace element composition of PFBC by-product includesconstituents derived from coal such as arsenic, boron, barium, chromium, lead, nickel, selenium, and strontium. As apoint of reference, analyses for samples of mine spoil and shallow aquifer materials also are included in Table 1.
Table 1. Composition of PFBC by-products and maximumconcentrations of selected constituents in spoil/aquifer materials at theFleming abandoned mine site, Tuscarawas County, Ohio. [wt. percent;weight percent by volume; per mil, parts per thousand relative to astandard; ppm, parts per million]
Spoil/ PFBC aquifer
Constituent Units by-product materials Aluminum wt. percent 3.3 15. Calcium wt. percent 18. 32.1 Iron wt. percent 4.3 29. Potassium wt. percent .59 3.5 Magnesium wt. percent 9.4 1.9 Sodium wt. percent .1 36. Sulfur, total wt. percent 4.94 7.46 Sulfur, sulfate wt. percent 4.94 <1.0 __d34S in sulfate per mil +4.6 -- __d34S in sulfide per mil +5.2 -26.3 Arsenic ppm 75. 91. Boron ppm 190. 120.2 Barium ppm 150. 730. Cadmium ppm <2 <2 Chromium ppm 37. 210. Manganese ppm <100 7500. Nickel ppm 23. 100. Lead ppm 15. 110. Selenium ppm 1.3 21.5 Strontium ppm 160. 720. 1. Value obtained from limestone; calcium concentrations in shale,
sandstone, clay, and spoil were 2.0 weight percent or less. 2. Value from Botoman and Stith (1978)
The State of Ohio, several Federal entities, and local power companies are interested in putting these materials tobeneficial use; however, before beneficial use can be supported by regulatory agencies, environmental data must becollected regarding their effects on water quality. Specifically, questions remain regarding the transport and fate ofelements that may be derived from the PFBC by-product. This paper summarizes water quality data collected fromJune 1995 through June 1998 at an abandoned mine site reclaimed with dry coal combustion by-products.
Approach An abandoned, surface coal mine site (referred to as the Fleming site) was reclaimed with PFBC by-product as asurface amendment in 1994. Complaints were lodged regarding erosion and sedimentation along nearby roads bylocal residents prior to reclamation. Acid mine drainage was evident in surface water at the site. The pH was lessthan 4 and the water contained high concentrations of dissolved iron and sulfate. Soil tests and chemical analysesof PFBC by-product conducted by workers at The Ohio State University School of Natural Resources determinedthat the mine spoil required approximately 125 tons of PFBC by-product per acre to attain a neutral pH of 7(Stehouwer, et al., 1996). In addition, the spoil at the mine site lacked organic matter necessary for successful plantgrowth.

203
Therefore, approximately 50 tons per acre of yard-waste compost were added at the time of PFBC by-productapplication.
The site was instrumented after reclamation in late 1994 and early 1995 so that changes in water quality could beassessed through time. Thirty-five soil-suction lysimeters in six clusters were installed to monitor water qualitywithin the shallow unsaturated zone (Figure 1). Lysimeters were installed in both the application area and a controlarea, where traditional reclamation methods were used. Twenty monitoring wells were installed to monitorgroundwater levels and water quality at depths ranging from 15 to 100 feet. Three sampling sites were selected atdown gradient springs to monitor water quality of spring water flowing from the site. Water samples were collectedfrom lysimeters, monitoring wells, and spring sites during the period 1995-98. Sampling rounds for each source ofwater generally corresponded to June 1995 (Round 1), January 1996 (Round 2), June 1996 (Round 3), June 1997(Round 4), and June 1998 (Round 5). Onsite measurements of water characteristics included water temperature,alkalinity, pH, reduction-oxidation potential, specific conductance, and dissolved oxygen concentration. Laboratorymeasurements were made on water samples for constituents that were selected on the basis of known composition ofPFBC by-product, of acid mine drainage, and of anticipated water-rock interactions. Additionally, analysis of sulfur-isotope ratios was done to determine if they could be used to distinguish between sources of sulfur at the mine site.
To determine the effects of PFBC by-product leachate on water quality, several comparisons were made, includingcomparison of median concentrations of selected constituents in application-area and control-area interstitial water,comparison of median concentrations of selected constituents in up gradient and down gradient groundwater, andgraphs of sulfate concentration as a function of sulfur-isotope ratios. Twenty-nine of 35 lysimeters were installed inthe application area and the remaining six lysimeters were installed in a control area where traditional reclamationmethods were used. Water levels in wells indicate groundwater flow directions were from north to south. Upgradient wells included shallow wells at sites 1, 8, 9, and 13 (Figure 1).
Down gradient wells included shallow wells at sites 4, 5, 10, and 11. Both shallow and deep wells were sampledduring this study, but only shallow wells were included in the following interpretive discussion because, if leachatederived from a surface application of PFBC by-product were to influence the quality of groundwater, shallow wellsshould show this influence before deep groundwater.
Spring water was sampled four times during this study during periods of base flow. Base flow conditions imply thatall stream water flowing down gradient from the site was contributed by groundwater. Thus, water-chemistrycomparisons are made between down gradient groundwater and spring site TU-124 to evaluate the potential for off-site movement of constituents in water. Water quality results from site TU-124 were used because this site isdirectly down gradient of the site. Spring water was not sampled during the January 1996 sampling round because ofa significant contribution from melt water and surface runoff.
Results Application-area interstitial-water samples clearly show the influence of PFBC by-product leachate (Table 2). Specific conductance and pH were significantly higher in the application area as compared to the control area. Median concentrations of calcium, magnesium, sulfate, chloride, boron, and strontium from the application area wereat least 2 times higher than median concentrations of the same constituents in control-area interstitial waters. Application area interstitial waters also had lower median concentrations of iron, nickel, and zinc. These elementsare commonly found in above-background concentrations in waters affected by acid mine drainage (Rose andCravotta, 1999) and their solubilities are strongly pH dependent. Median aluminum concentrations are approximatelythe same in interstitial waters from both areas. Aluminum is present in elevated concentrations in acid mine drainageand contributes up to 3.8 weight percent of the PFBC by-product (Haefner, 1998). Thus, even though the increasedpH caused by the PFBC by-product may reduce solubility of dissolved aluminum, additional aluminum may becontributed to the spoil by the by-product itself.
Comparison of medians of water quality constituents between up gradient and down gradient groundwaters showsthat these waters are chemically very similar (Table 2). Median specific conductance was 3,100 µS/cm for up gradient

204
waters and 3,000 µS/cm for down gradient waters. Both up gradient and down gradient areas are similarly influencedby acid mine drainage as shown by median pH values of 5.7 for up gradient groundwaters and 5.5 for down gradientgroundwaters. Major-element chemistry of groundwater was dominated by high concentrations of dissolved sulfate,iron, calcium, magnesium, manganese, and aluminum. Median concentrations of these
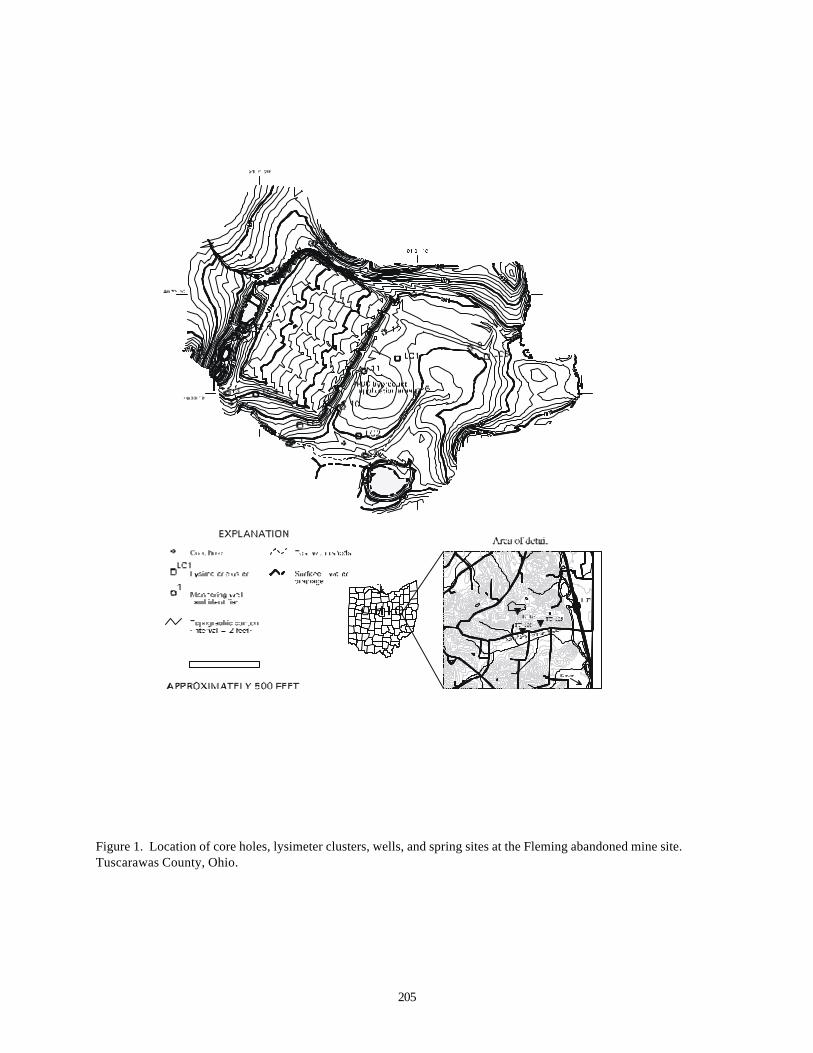
205
Figure 1. Location of core holes, lysimeter clusters, wells, and spring sites at the Fleming abandoned mine site. Tuscarawas County, Ohio.

206
Table 2. Median values of selected constituents at the fleming abandoned mine site. Tuscarawas County, Ohio.[uS/cm, microsiemens per centimeter at 25 degrees Celsius; mg/L milligrams per liter; ug/L, micrograms per liter; --, nodata; per mil, parts per thousand relative to a standard] Interstitial water Groundwater Spring water Appli- Up Down Constituent (units) cation Control Gradient Gradient TU-120 TU-124 TU-125pH 6.5 5.1 5.7 5.5 4.1 4.1 6.1Specific conductance 5,300 2,100 3,100 3,000 1,500 1,400 600Alkalinity (mg/L as HCO3) -- -- 85 66 <1.0 4.0 6.0Acidity (mg/L as CaCO3) <1.0 <1.0 11.5 10.9 0.90 0.60 0.10 Aluminum (ug/L) 300 300 90 210 5,300 1,900 300Arsenic (ug/L) <1.0 <2.0 <1.0 <1.0 <1.0 <1.0 <1.0
Boron (ug/L) 690 74 230 270 180 260 60Cadmium (ug/L) <1.0 <1.0 3.0 4.0 <1.0 <1.0 <2.0Calcium (mg/L) 430 200 360 360 160 160 46Chloride (mg/L) 51 8.9 2.0 3.7 11 8.0 16
Chromium (ug/L) 10 <2.0 3.0 4.0 5.0 <2.0 <2.0Cobalt (ug/L) 94 120 200 250 140 100 <6.0Copper (ug/L) 23 11 <2.0 <2.0 10.00 <2.0 <2.0Fluoride (ug/L) 6.0 0.4 <0.1 <0.1 <1.0 1.9 0.7Iron (mg/L) 0.07 11.6 278 280 0.75 1.7 0.5
Lead (ug/L) <4.0 <1.0 <1.0 <2.0 <1.0 <1.0 <1.0
Magnesium (mg/L) 1,400 110 210 210 100 100 30
Manganese (mg/L) 21.1 16.1 16.2 17.0 20.9 7.1 2.8
Mercury (ug/L) <0.1 <0.1 <0.1 <0.1 <0.1 <0.1 <0.1
Nickel (ug/L) 180 530 410 490 310 200 130Nitrogen as nitrate (mg/L) 0.06 0.06 <0.05 <0.05 0.13 <0.05 0.33Nitrogen as ammonia (mg/L) 0.13 0.92 1.02 0.94 0.27 0.12 0.11
Selenium (ug/L) <5.0 <1.0 <1.0 <1.0 <1.0 <1.0 <1. 0
Sodium (mg/L) 55 41 11 9.7 9.0 3.0 9.0Sulfate (mg/L) 5,300 1,100 2,200 2,200 940 820 280
Strontium (ug/L) 770 360 2,840 2,770 380 490 140Vanadium (ug/L) 16 13 <5.0 <5.0 <5.0 8 <5.0Zinc (ug/L) 81 420 305 520 320 230 140 d34S of sulfate (per mil) -2.8 -14.7 -9.7 -9.9 -14.2 -9.6 -14.1
constituents were similar or only slightly greater in down gradient groundwaters, except for aluminum, which wasmore than two times greater in down gradient groundwaters than in up gradient groundwaters. Trace elements thatwere higher in down gradient waters as compared to up gradient groundwaters included boron, cobalt, nickel, andzinc. Solid-phase chemical analyses of mine spoil, core samples, and literature published by the Ohio Department ofNatural Resources indicate coal and underclay are a significant source of these elements (Dick and others, 1999;Botoman and Stith, 1978).
Trace elements in PFBC by-product that may be of environmental concern include arsenic, lead, mercury, andselenium. These elements were only detected at or near the reporting limits for all water samples collected duringthis study. Arsenic was detected above the reporting limit of 1 µg/L in 11 of 39 application-area interstitial-watersamples during sampling rounds 3, 4, and 5 (all other analyses were below the detection limit). The maximumconcentration of arsenic for all sampling rounds since 1995 was 10 µg/L, which was detected in one application-areainterstitial water sample during sampling round 1 (Dick and others, 1999). Concentrations of arsenic in control-areainterstitial waters were all below detection (less than 1 or 2 µg/L). Lead was detected in one control-

207
area interstitial water sample at a concentration of 6 µg/L. All other analyses for lead were below the detection limitof less than 4, 2 or 1 µg/L. Mercury and selenium were not detected in any samples above the detection limit of 1µg/L and 5 µg/L, respectively.
Previous work published in Dick and others (1999) and Haefner (1998) describe the properties and constituents thatcan be used to evaluate differences between water types at the Fleming site. These include pH, concentrations ofboron, magnesium to calcium (Mg:Ca) mole ratios, sulfate, and sulfur-isotope ratios (d34S). Figure 2 shows themedian values for these constituents during each of the 5 sampling rounds.
The highest median pH values were observed in the application-area interstitial waters. Samples were only obtainedfor 4 of the 5 sampling rounds; however, median values for pH in the application area were consistently greater than6.0. The pH in control-area interstitial waters was generally less than 5.3 during all sampling rounds. Up gradientgroundwater pH was slightly greater than down gradient groundwater. Median pHs for all groundwaters increasedbetween sampling rounds. Spring water pH at site TU-124 was equal to or less than down gradient groundwaters forall sampling rounds.
Boron concentrations in the application-area interstitial waters were consistently higher than concentrations in thecontrol area. The highest median boron concentration of 850 µg/L was observed during sampling Round 1, but thendecreased between sampling rounds 1, 2, and 3 and increased between rounds 3, 4, and 5. Boron concentrations inthe control-area interstitial waters were generally less than 200 µg/L. Median boron concentrations in down gradientgroundwaters were greater than or equal to concentrations in up gradient groundwaters for all sampling rounds.Median boron concentrations in spring water were similar to those in down gradient groundwater. Magnesium tocalcium (Mg:Ca) mole ratios were selected for analysis because the PFBC by-product was known to have elevatedconcentrations of magnesium, and there were only limited sources of magnesium in, the mine spoil and aquifermaterials.
Interstitial-water samples from the control area have Mg:Ca mole ratios near 1 (median Mg:Ca of for all samples was0.9; Figure 2). The interstitial waters from the application area, however, have much higher Mg:Ca mole ratios(median Mg:Ca of 5.3). The magnesium to calcium mole ratios in application-area interstitial waters increase betweenrounds 1 and 2 and are the greatest for the entire study period during Round 2. The ratios decreased during allsubsequent sampling rounds. Magnesium to calcium mole ratios in control-area interstitial waters remained relativelyconstant between 0.90 and 0.97. The magnesium to calcium mole ratios for groundwater were similar to thoseobtained from control-area interstitial waters and were generally less than 1.2. Down gradient groundwaters hadconsistently higher Mg:Ca mole ratios as compared to up gradient water. These data may provide evidence thatleachate from PFBC by-product is reaching groundwater. Magnesium to calcium mole ratios for spring watersamples at TU-124 were typically close to 1.0. These ratios were slightly greater than median down gradient groundwater (0.98). Median Mg:Ca ratios increased slightly from 1.02 during Round 1 to 1.05 during Round 4.
Sulfate concentrations in application-area interstitial waters increased between rounds 1 and 2 and then decreasedbetween rounds 2, 3, 4, and 5. Maximum sulfate concentrations in application-area interstitial waters exceeded 13,000mg/L during sampling Round 2. Sulfate concentrations in the control area were much lower than those in theapplication area. Median interstitial-water sulfate concentrations in the control area ranged from 650 to 1,200mg/L. Sulfate concentrations in up gradient groundwaters increased between all five sampling rounds from a medianvalue of 1,500 mg/L during sampling Round 1 to 2,500 mg/L during sampling Round 5. Median sulfate concentrations in down gradient groundwaters decreased between sampling rounds 1 and 2 but then increasedbetween sampling rounds 2 through 5 and ranged from 2,100 mg/L during sampling Round 2 to 2,500 mg/L duringsampling Round 5. Because increases were noted in median sulfate concentrations for both up gradient and downgradient groundwaters, a source of sulfate must be identified that can provide sulfur throughout the entire studyarea. Median concentrations of sulfate in spring water were generally one to two times less than medianconcentrations of down gradient groundwater (median for all down gradient groundwater samples was 2,200 mg/L). Application-area interstitial waters have the most enriched sulfur-isotope signatures of any waters at the study site. Sulfur-isotope ratios for application and control-area interstitial waters become more depleted between samplingrounds 3, 4, and 5. Median sulfur-isotope ratios in sulfate from up gradient groundwaters increased slightly

208
-20-15-10-50
Round 1 Round 2 Round 3 Round 4 Round 5
02000400060008000
Round 1 Round 2 Round 3 Round 4 Round 5
02468
Round 1 Round 2 Round 3 Round 4 Round 5
pH
Baron (Fg/L
Mg:Ca mole ratios
Sulfate (mg/L
δ 3 4S (permil)
2
4
6
8
Round 1 Round 2 Round 3 Round 4 Round 5
0
500
1000
Round 1 Round 2 Round 3 Round 4 Round 5
Interstitial water Ground water
Application area Up gradient Spring waterControl area Down gradient
Figure 2. Graphs of selected median concentrations for five sampling rounds at the Fleming abandoned mine site,Tuscarawas County, Ohio.

209
between sampling rounds 1 and 2, but then decreased between sampling rounds 2, 3, 4, and 5. Median sulfur-isotope ratios for down gradient groundwaters were consistently more depleted than up gradient ratios. Sulfur-isotope values at TU-124 ranged from -10.3 to -9.4 per mil, which was very similar to median values of down gradientgroundwater (median for all down gradient groundwater samples was -9.9 per mil). Similar to groundwater samples,the most depleted water sample at TU-124 was obtained during the last sampling round.
The sulfur-isotope ratios of two samples of PFBC by-product were reported by Haefner (1998) to be +4.6 and +4.8 permil. Application-area interstitial waters show the influence of the contribution of isotopically heavy sulfate from thePFBC by-product in the form of relatively enriched d34S values as compared to those in the control area. Similarly, ifthe increase in sulfate in groundwater were due to leachate derived from PFBC by-product, sulfur-isotope ratios indown gradient groundwaters would have become enriched, not depleted. The dominant source of sulfate ingroundwater at the mine site is likely from oxidation of sulfide in mine spoil that was disturbed and regraded duringreclamation. Sulfur-isotope ratios of sulfide in five spoil samples provide a range of –13.7 to +3.0per mil (Haefner, 1998). Another source of sulfate could be from the aquifer materials themselves, with sulfur-isotoperatios in sulfide ranging from –26.3 to –5.8 per mil.
A graph of d34S versus the inverse of sulfate shows the distribution of isotope composition between different watertypes (Figure 3). The application-area interstitial waters have a somewhat linear trend on this graph with a negativeslope and a Y-intercept of approximately +5 per mil (close to the d34S value for solid-phase sulfate in PFBC by-product). This graph clearly shows the difference between the application-area interstitial waters that are influencedby PFBC by-product leachate and other water types found at the study site. The relative contributions of differentsources of sulfate in interstitial water were evaluated with a mixing model of sulfur-isotope ratios (Haefner, 1999). During sampling Round 3, for example, the mixing model estimated that up to 75 percent of the sulfate was derivedfrom the PFBC by-product. Additionally, Haefner (1998) modeled magnesium concentrations and found that themajority of magnesium in application-area interstitial water also was derived from the PFBC leachate.
Summary and Conclusions
Water quality at a seven-acre abandoned mine site reclaimed with 125 tons per acre of PFBC by-product was studiedover a 4-year period. Addition of alkaline PFBC by-product was intended to increase pH, thereby reducing thesolubility of major and trace elements in water. As of June 1998, the site was still undergoing hydrologic andgeochemical changes. This was documented by changes in water quality between June 1995 and June of 1998. Although the Fleming site was mined more than 25 years before the onset of this investigation, it is likely thatreclamation in 1994 caused a disturbance of the chemical and hydrologic flow regime.
Water quality was assessed five times since 1995. Interstitial water containing leachate derived from PFBC by-product had elevated concentrations of calcium, magnesium, sulfate, chloride, and boron. The influence of PFBC by-product on water quality also was evident from lower concentrations of iron, nickel, and zinc in application-areainterstitial waters as compared to control-area interstitial waters. Elevated boron concentrations from the PFBC by-product may be a cause for concern because an important aspect of mine reclamation is re-establishment ofvegetation and elevated B concentrations can cause phytotoxicity (Pierzynski and others, 1994; Hem, 1992).
Concentrations of arsenic, lead, mercury, and selenium in all samples were well below the year 2000 MaximumContaminant Levels (MCLs) set by the USEPA (arsenic, 50 µg/L; lead, 15 µg/L; mercury, 2 µg/L; and selenium, 50µg/L). Furthermore, concentrations of these elements rarely exceeded reporting limits, which were less than 1 µg/Lfor mercury and generally 5 µg/L or less for the other elements.
Groundwater chemistry was dominated by high concentrations of sulfate, iron, calcium, magnesium, manganese, andaluminum. Groundwater chemistry was assessed for a subset of wells up gradient of the PFBC by-productapplication area and down gradient of the application area. Median concentrations of most major elements in downgradient groundwaters were similar or only slightly greater than concentrations in up gradient groundwaters, exceptfor aluminum, which was more than two times greater in down gradient groundwaters than in up gradientgroundwaters.
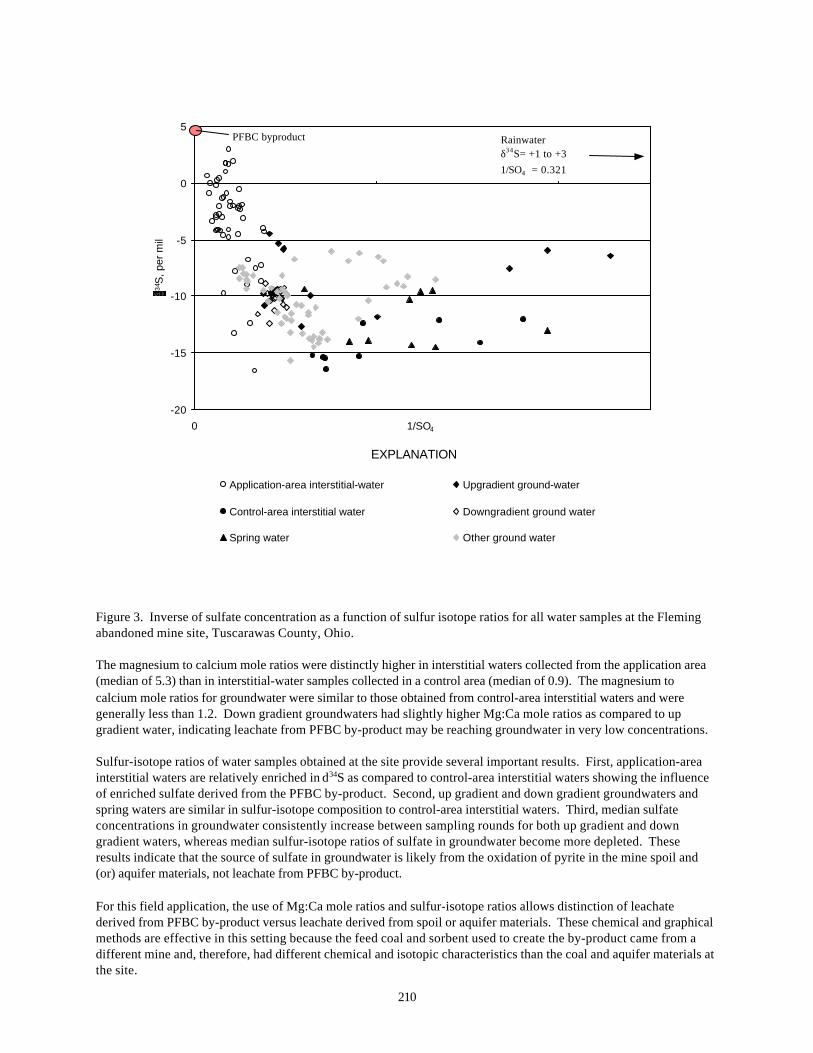
210
-20
-15
-10
-5
0
5
0 1/SO4
34S
, per
mil
Application-area interstitial-water Upgradient ground-water
Control-area interstitial water Downgradient ground water
Spring water Other ground water
PFBC byproduct Rainwaterδ34S = +1 to +31/SO4 = 0.321
EXPLANATION
Figure 3. Inverse of sulfate concentration as a function of sulfur isotope ratios for all water samples at the Flemingabandoned mine site, Tuscarawas County, Ohio.
The magnesium to calcium mole ratios were distinctly higher in interstitial waters collected from the application area(median of 5.3) than in interstitial-water samples collected in a control area (median of 0.9). The magnesium tocalcium mole ratios for groundwater were similar to those obtained from control-area interstitial waters and weregenerally less than 1.2. Down gradient groundwaters had slightly higher Mg:Ca mole ratios as compared to upgradient water, indicating leachate from PFBC by-product may be reaching groundwater in very low concentrations.
Sulfur-isotope ratios of water samples obtained at the site provide several important results. First, application-areainterstitial waters are relatively enriched in d34S as compared to control-area interstitial waters showing the influenceof enriched sulfate derived from the PFBC by-product. Second, up gradient and down gradient groundwaters andspring waters are similar in sulfur-isotope composition to control-area interstitial waters. Third, median sulfateconcentrations in groundwater consistently increase between sampling rounds for both up gradient and downgradient waters, whereas median sulfur-isotope ratios of sulfate in groundwater become more depleted. Theseresults indicate that the source of sulfate in groundwater is likely from the oxidation of pyrite in the mine spoil and(or) aquifer materials, not leachate from PFBC by-product.
For this field application, the use of Mg:Ca mole ratios and sulfur-isotope ratios allows distinction of leachatederived from PFBC by-product versus leachate derived from spoil or aquifer materials. These chemical and graphicalmethods are effective in this setting because the feed coal and sorbent used to create the by-product came from adifferent mine and, therefore, had different chemical and isotopic characteristics than the coal and aquifer materials atthe site.
211
References Cited
Botoman, George, and Stith, D.A., 1978, Analyses of Ohio Coals: Ohio Department of Natural Resources InformationCircular No. 47, 148 p.
Dick, W.A., Bigham, J., Forster, L., Hitzhusen, F., McCoy, E., Stehouwer, R., Traina, S., Wolfe, W., Haefner, R., Rowe,G., and Beeghly, J., 1999, Land application uses for dry flue gas desulfurization by-products: Phase 3: ElectricPower Research Institute Report TR-112916, September 1999, [variously paginated].
Haefner, R.J., 1998, Geochemistry and ground-water flow beneath an abandoned coal mine reclaimed with pressurizedfluidized bed combustion by-products: unpublished Ph.D. dissertation, The Ohio State University, Columbus,Ohio, 238 p.
Haefner, R.J., 1999, A sulfur-isotope mixing model to trace leachate from pressurized fluidized bed combustion by-products in an abandoned coal mine setting: Proceedings of the 1999 International Ash Utilization Symposium,Lexington, KY, October 18-20. Center for Applied Energy Research, University of Kentucky, LexingtonKentucky.
Hem, J. D., 1992, Study and interpretation of the chemical characteristics of natural water: U.S. Geological SurveyWater-Supply Paper 2254, 263 p.
Pierzynksi, G.M., Sims, J.T., and Vance, G.F., 1994, Soils and environmental quality: Lewis Publishers, Boca Raton,FL, 313 p.
Rose, A.W. and Cravotta, C.A., 1999, Geochemistry of acid mine drainage: Chapter 1. In Coal Mine DrainagePrediction and Pollution Prevention in Pennsylvania: accessed on the Internet on September 7, 1999 at:<http://www.dep.state.pa.us/dep/deputate/minres/ districts/cmdp/chap01.html>
Stehouwer, R.C., Sutton, P., Fowler, R.K., and Dick, W.A., 1995, Minespoil amendment with dry flue gasdesulfurization by-products—element solubility and mobility: Journal of Environmental Quality, vol. 24, no. 1, p.165-174.
Stehouwer, R., Dick, W., Bigham, J., Forster, L., Hitzhusen, F., McCoy, E., Traina, S., Wolfe, W., Haefner, R., andRowe, G., 1996, Land application uses for dry FGD by-products, Phase II report: The Ohio State University,Columbus, Ohio, 302 p.
______________________________1Ralph J. Haefner is a hydrologist with the U.S. Geological Survey, Water Resources Division in Columbus, Ohio. Hereceived a Ph.D. in Geology from Ohio State University in 1998 where he studied geochemistry and groundwater flowbeneath an abandoned coal mine. During his 13 years with the USGS, he has published more than 20 abstracts,articles, and reports related to the hydrologic sciences. His research interests include groundwater chemistry,groundwater flow and transport simulations, and application of geographic information systems to groundwaterinvestigations.

212
HYDROLOGIC MONITORING AT THREE MINE SITES RECLAIMEDWITH MIXTURES OF SPOIL AND COAL COMBUSTION RESIDUES
IN ILLINOIS
Dr. Steven P. Esling1
Department of GeologyDr. Bradley C. Paul
Department of Mining Engineering Southern Illinois University
Abstract
Three separate large-scale field demonstration projects begun within the last six years at abandoned mines, haveinvolved in one way or another, the application of both flue gas desulfurization (FGD) and fluidized bed combustion(FBC) residues in mine land reclamation. The first, at Forsythe-Energy, used FGD residues as well as fly ash assubstitute fill to a surface mine pit; the second, at Thunderbird, created seven caps composed of varyingproportions of FBC fly and bottom ashes; and the third, at Harco, involved amending coal processing waste withFGD residues to control infiltration and to induce alkaline recharge. Previous studies monitored the groundwater atthe Forsythe-Energy site and the surface water at the Thunderbird site for short-term performance, and no significantenvironmental impacts were detected. The long-term capacity of the residues to control acid mine drainage and theirlong-term impact on the environment, however, are unknown. The widespread application of the residues inreclamation as well as industry acceptance of these methods hinges on the long-term behavior.
More recent research continued monitoring the impact of reclamation with coal combustion residues on groundwaterat the Forsythe-Energy site and surface water at the Thunderbird site for an additional two years. In addition, aninvestigation of the impact of reclamation on groundwater at the Harco and Thunderbird sites was completed. Datafor four years after reclamation at Forsythe-Energy indicate that leachate generated by the residues has notdegraded groundwater. In addition, evidence suggests that the fill can ameliorate groundwater degraded by mining. Data collected thus far at the Harco site on the impact of the residues on groundwater quality are largelyinconclusive. Evidence from the Thunderbird site suggests that although the caps do not degrade groundwater orsurface water, they do not improve existing groundwater quality. Qualitative data from both Thunderbird and Harcosuggest that the FGD soil amendments and FBC fly ash and bottom ash caps may leak at these sites. Of the threereclamation strategiesSapplication of residues as a bulk fill, cap, or soil amendmentSthe bulk fill approach showedthe most promise.
Introduction
Under the terms of the Clean Air Act, there is little doubt that most use of Illinois coal will be linked to some form ofsulfate control technology or practice, either on the specific boiler burning the Illinois coal, or on another facilityfrom which emission allowances are transferred. Only two sulfate control technologies have found full scalecommercial use in Illinois; FBC boilers and wet scrubbers. Both of these technologies produce significant volumesof residues.
Innovative reclamation strategies with fluidized gas desulfurization (FGD) and fluidized bed combustion (FBC)residues can provide a beneficial outlet for these materials. In reclamation, the residues replace the agriculturallimestone that is commonly used to neutralize the potential acidity in acid forming materials at the site. The use ofFGD and FBC residues at a mine site may also reduce soil hydraulic conductivity which would enable the residues toalso function as an infiltration barrier.
Large-scale field demonstration projects at the Forsythe-Energy, Thunderbird, and Harco Mines, have involved inone way or another, the application of both FGD and FBC residues in mine land reclamation. The Illinois AbandonedMine Land Reclamation Division (IAMLRD) of the Illinois Department of Natural Resources retained contractors to
213
complete reclamation at all three sites. Preliminary environmental monitoring at Forsythe-Energy
suggested that combustion residues can effectively control acid mine drainage when used as substitute fill insurface mined land. No environmental impacts originating from the residues at any of the sites were detected ingroundwater resources at the time of the initial studies.
More recent research evaluated the effectiveness and, more importantly, the long-term stability of sites reclaimedwith a mixture of FBC or FGD residues and mine spoil or mine processing wastes. The two year program continuedwater quality monitoring at a network of instruments established during the three previous projects. The analysis ofthe samples collected at each site seeks an answer to two questions: Does leachate generated by the coalcombustion and flue gas desulfurization residues impact groundwater or surface water quality? and, Do theseresidues mitigate acid mine drainage?
Procedures
Esling and Paul (1998) provided the details for monitoring well installation at the three sites, which followed acceptedguidelines (USEPA, 1986). Esling and Caudle (1990) described the design of the rain gauges and free-drainagelysimeters installed at both the Thunderbird and Harco sites. Surface water and groundwater quality samplingfollowed U.S. Environmental Protection Agency (USEPA) procedures (USEPA, 1979; 1984a; 1984b; 1986) in order toeffectively guarantee reliable field geochemical and hydrologic data. Esling and Paul (1998) summarized the samplingprogram, including analysis methods by the Environmental Chemistry Laboratories maintained by the Department ofMining Engineering at Southern Illinois University.
Results and Discussion
Esling and Paul (1998) provided detailed tables of all analyses at the three sites. Column studies indicated that thefly ash which composed part of the fill at the Forsythe-Energy site generates high concentrations of boron in itsleachate. The FBC residues at Thunderbird and the FGD residues at Forsythe-Energy and Harco produce highconcentrations of sodium and potassium in their leachate. Elevated levels of these parameters would suggestcontamination by residue leachate.
Forsythe-Energy
The study area is an abandoned strip mine located within the Herrin 7.5 Minute Quadrangle, just east of Energy, inWilliamson County, Illinois. A private landfill and the Herrin Municipal landfill are located in the section to thenorth. The National Mine Land Reclamation Center (NMLRC) provided funding for the initial environmentalstudies. The test site (Figure 1) was an abandoned strip-pit lake that was partially filled with debris from thesurrounding spoil piles and an adjacent highwall. The pit, which was about 1030 ft (315 m) long, 160 ft (50 m) wide,and up to 40 ft (12 m) deep (as measured from the top of the highwall), was filled in stages with unoxidized sulfite richscrubber sludge mixed with fly ash (Southern Illinois Power, Marion Station). Initial work during the summer of 1993reclaimed the western 300 ft (90 m) of the pit, with the residues filling the first 230 ft (70 m) of the pit behind a 70 ft (20m) wide spoil dam. Reclamation was completed during the summer of 1994, with residues filling the next 300 ft (90 m)and spoil filling the remaining 430 ft (130 m) of the pit. The residues acted as a structural fill to stabilize the adjacentroadway to the north. Two other abandoned pits are nearby, one to the west of the disposal site (West Lake) andthe other to the south and east (South Lake).
Fielding (1993) and Esling and others (1996) summarized site hydrogeology, which included field studies and numericgroundwater flow modeling. Thirteen groundwater monitoring wells were originally installed at the site. In addition,a 15 m long drain was constructed in the west end of the test site prior to the initial reclamation work. The drain is aslotted pipe surrounded by quartz silica sand, with access through a vertical standpipe installed in the spoil dam. The drain captures leachate from the residues, prior to any natural attenuation, and provides samples from what is ineffect a field-scale leachate column test. Column studies suggested that the FGD residues actually cleaned thenative groundwater, and that laboratory tests could be devised to predict field leaching and groundwater cleaningperformance. Esling and others (1996) summarized the earlier results of environmental monitoring. No residue

214
leachate was detected down gradient, but the samples from the drain beneath the fill do indicate a distinctive qualityto the leachate associated with the fill.
The hydraulic conductivity of the spoil ranges from 1.9e-7 to 4.1e-3 cm/s, with a geometric mean of 1.8e-4 cm/s (9tests). One test on the residues in the field yielded a hydraulic conductivity of 9.8e-6 cm/s. Well 9 was installed inan area that escaped mining. The screen is completed in the Herrin Coal at an elevation comparable to that of themonitoring wells in the spoil. Field testing of hydraulic conductivity in this well yielded a value of 6.8e-5 cm/s.
Topographic maps of the area prior to strip mining clearly show that the test site was located on a drainage divide. Flow from the adjacent drainage basins emptied into the Big Muddy River to the north. Prior to reclamation, nodistinct surface drainage flowed away from the project site, as surface mining operations disrupted the originaldrainage pattern and created a hummocky terrain, characterized by numerous small hills, swales, and depressions. Reclamation associated with the placement of the coal combustion residues has created a more subdued topographywith a gentle slope trending to the east in place of the abandoned pit (Figure 1).
Hydraulic head data from wells 9, 10, and 11 suggest that groundwater flow in the area of the first phase of the fillhas not changed significantly to what existed before reclamation. Groundwater flows predominantly to the east, withsome component of flow to the north and south. Well 10 is clearly up gradient of the fill and should reflectbackground water quality. Well 9 appears to be down gradient of the fill, at least during portions of the year. Thelocation of Well 11 with respect to the groundwater flow is not clear from the available data, but the assumption isthat this well is also down gradient of the residues for at least a portion of the year. All pre-existing wells locatedeast of the fill were too far away to capture leachate generated from the residues in a reasonable period of time. Onenew monitoring well (Well 14) was installed immediately down gradient and east of the fill for the sampling project.
Samples from the drain beneath the fill show high concentrations of boron, sodium, molybdenum, and potassiumand much lower concentrations of the iron, magnesium, manganese, and sulfate relative to background groundwater. The drain samples have low concentrations of iron (too low to plot) with levels less than 1 mg/l and often belowdetection. Figure 2 shows boron concentration in the drain through time. Laboratory column studies suggested thatthe boron concentration should decrease dramatically after a short initial flush. Long-term field data, however, showlevels of boron in the drain generally greater than 60 mg/l.
Figure 3 summarizes boron concentration from all sampled wells through time. Note that most wells show boronconcentrations through time comparable to Well 10, which represents background water quality. Although Well 9shows slightly higher concentrations of boron in the last two sample events, it does not show elevated levels ofsodium, potassium, or molybdenum. No well to date has shown boron concentrations anywhere near that detectedin the drain. Figure 4 summarizes iron concentrations from all sampled wells through time. Well 10, thebackground, shows significantly greater levels of iron in all sample events. Wells 9 and 14, down gradient of the fill,show reduced levels of iron. Since the lower concentrations of iron are not associated with elevated levels of boron,the residues appear to have a beneficial effect on groundwater quality. In general, down gradient wells also havelower concentrations of magnesium, manganese, and sulfate. The data indicate that the residues have the capacityto reduce the constituents associated with acid mine drainage over long time intervals and in a large scale fieldsetting.
Esling and others (1996) modeled contaminant transport away from a hypothetical residue fill under veryconservative assumptions. Their study suggested little impact from the fill at the Forsythe-Energy site. The morerecent sampling, however, suggests that even under conservative assumptions, their numeric model greatly overpredicts the impact of residue leachate on groundwater quality. In the area of Well 14, the numeric model suggestedthat boron concentration could reach levels over 50 mg/l four years after placement of the fill if groundwater movedat an average linear velocity based on the geometric mean hydraulic conductivity. To date, four years afterreclamation, Well 14 does not show levels of boron significantly different than those found in the up gradient well. This suggests two possibilities regarding the numeric transport model: groundwater flow velocities must be lowerthan originally estimated, or the spoil must retard boron relative to groundwater flow. Either possibility suggeststhat the residue fill at Forsythe-Energy does not pose a threat to groundwater quality.

215
Thunderbird
The Illinois Clean Coal Institute (ICCI) funded a two year study to assess environmental impacts at the abandonedThunderbird Mine, located on the eastern side of Williamson County. The test site (Figure 5) is located in the areaof an abandoned strip pit. The pit, which was about 1200 ft (360 m) long and 160 ft (50 m) wide, was first filled withspoil. Approximately 6 to 12 inches of FBC residues covered the spoil, followed by about 4 ft of compacted soil. The residue layer was designed to serve two purposes. First, it should act as a low permeability cap to reduceinfiltration through the underlying spoil. Second, the alkaline residues should ameliorate acid mine drainage fromany water that should infiltrate the cap. Seven test plots were established, each containing different proportions ofbottom ash and fly ash in the residue layer.
Lysimeters and a network of monitoring wells were installed to assess environment impacts. In addition, the qualityof the water in nearby Brier Creek was monitored regularly. The Brier Creek sample network is important both as ameans of verifying the elimination of acid drainage from the GOB filled pit, and for determining that the quality ofwater running off of the site has not been adversely effected by trace metals in the ash. Even if the cap is completelysuccessful as an infiltration barrier, the question of whether the ash contaminates the surface run-off must beaddressed.
Figure 5 shows the topography in areas that escaped reclamation. The topography in and around the test site isrelatively level. A land survey of the post reclamation topography is not available, and the map of the site (Figure 5)does not show contour lines in this area. The land surface in the reclaimed area slopes to the south, away from thetopographic high on the northern edge of the map and to the east toward Brier Creek.
Early studies at Thunderbird attempted to assess the impact of the reclamation in the vadose zone, before anyleachate reached the water table. Ryan (1998) discussed much of this work which included monitoring infiltrationtrapped by free drainage lysimeters. She also attempted to induce infiltration with two large diameter infiltrometers (6ft diameter) tests. Unfortunately, most of the lysimeters at the Thunderbird site failed. Initially 32 lysimeters wereinstalled prior to placement of the residue layer, four beneath each of the seven test plots and four in a control plotwest of the test plots. Heavy equipment moving across the site distributing the residues and the soil cover damagedlysimeter drain pipes, leading to significant leakage. Although some of the lysimeters may have worked, the failureof a substantial number of them made any of the measurements suspect. An additional 12 lysimeters were installedafter reclamation was completed. These lysimeters were installed in the sidewalls of access pits below the residuelayer.
During excavation of the access pits for the installation of the second set of lysimeters, field workers noticed that theresidue layer had compacted to a thickness of 2 to 4 inches. The infiltrometer tests conducted over the newlysimeters suggested that infiltration readily passes through the residue cap. Water samples collected from theoriginal lysimeters also suggest that water infiltrating through the residues often has a pH less than 4 and containshigh total dissolved solids. These data, like the data on infiltration rates, are suspect. The available data on vadosezone quality, however, does not suggest any ameliorating effects of the residue cap.
More recent sampling efforts concentrated on surface and groundwater, rather than vadose zone water. Figure 5shows the location of the stream sampling stations. For this study, the active stream sample stations include S1, S2-3, S4, S5, and S6, with Brier Creek flowing from site S1 toward site S6. Station S1 and S2-3 are upstream of theresidues, station S4 is immediately downstream. Many factors can influence the geochemistry of stream water otherthan drainage across the reclaimed mine site, including the duration and intensity of recent storm events. Theconcentration of some constituents tends to fluctuate from one sample event to another because of these factors. Certain trends in the Brier Creek data, however, are evident. With the exception of rare elevated levels, sodium andpotassium, indicators of leachate generated by the FBC residues at this site are not detected in concentrationsdownstream from the test plots in levels significantly different than those upstream. Figure 6 shows iron

216
concentration through time in stream water samples. Stream sample collection began during reclamation at the siteand the general downward trend in iron concentration over time reflects the overall influence of reclamation on thesurface water quality. The small size of the test plots relative to the upper drainage basin area of Brier Creek doesnot allow any more specific statements regarding the impact of the residue cap on improving surface water quality.
Figure 5 shows the location of the groundwater monitoring wells. Groundwater flows predominantly east, with acomponent to the south. Wells 6 and 8 are located up gradient and Wells 2, 4, and 5 are located down gradient ofthe test plots. Groundwater sampling began at Thunderbird in June, 1997. Figures 7 and 8 summarize boron and ironconcentrations in sampled wells through time. Boron is detected in Well 5 and in lysimeter samples atconcentrations above those found in Well 6, but Well 8, also up gradient of the test site, has boron concentrationsover 4 mg/l in the last three sampling events suggesting that the boron found at the Thunderbird site may notoriginate from the residues. Wells 2, 4, and 6 show comparable levels of iron (Figure 8). Near the end of the project,Well 5 had elevated levels of iron. The results therefore suggest little improvement in overall groundwater qualityfrom the residues at Thunderbird. Do the residues degrade groundwater quality? Well 5 has potassium and sodiumconcentrations consistently greater than those in Well 6. The other down gradient wells, however, do not haveconcentrations of these constituents significantly above background suggesting little impact of the residues ongroundwater quality at the time of sampling.
Harco
The ICCI also funded a study of environmental impacts of reclamation at the Harco Mine, an abandonedunderground mine located in Saline County, Illinois. Reclamation involved amending coal processing waste withFGD residues to control infiltration and to induce alkaline recharge. Previous studies characterized the material usedin the Harco reclamation, finding a laboratory hydraulic conductivity of 1E-5 cm/sec that has been confirmed in thefield. Delays in reclamation work at the site impacted the environmental studies. In fact, reclamation work continuedat the site at the beginning of the two year monitoring project.
Waste at the site originated from coal processing and secondary carbon recovery operations. Prior to reclamation,the site’s irregular topography was dotted with thirteen ponds. Most of these ponds were subsequently drainedduring reclamation.
Figure 9 depicts the site after reclamation. Site grading has created two large hills in the northeast and east-centralareas of the site. A drainage ditch running south from the lake in the north-central portion of the site (North Lake)divides the site into an eastern and a western area. The site is bounded by creeks to the east and to the south, by alake to the southwest (South Lake), and uplands to the north. An area of wetlands was created in the southeastcorner of the site. The original plan called for applying a six inch layer of compacted residues consisting of 90% fluegas desulfurization by-products and 10% fly ash to the area immediately east of South Lake and west of the creektrending through the center of the site. This area, herein referred to as the test site, was the location of a formerslurry pond. Other areas at the Harco site were supposed to be treated with agricultural ground limestone, but atleast some of the hillsides were also treated with residues. The entire site was covered by 30-33 inches of compactedsoil. Reclamation was completed in November, 1997. Research on the impact of the residues on groundwaterconcentrated on the test site.
Three groundwater monitoring wells were installed at the site in May and July of 1997; one up gradient and twodown gradient of the residue area east of South Lake. Additional wells were installed as the contractor completedreclamation adjacent to the test site during the year. Ultimately, a total of ten monitoring wells were installedbetween May and November of 1997.
An original objective of the Harco study was to investigate vadose zone hydrology. A total of ten lysimeters wereinstalled at the test site in July of 1996. Subsequently, a rain gauge was installed to monitor precipitation. Thelysimeters were installed after placement of the residue mixture, but prior to the application of the cover material(Lannert, 1998).
217
Lysimeters 5 and 8 were destroyed when the heavy equipment applied the cover soil to the test site. From May 14,1997 to May 13, 1998, the volume of water collected by the remaining lysimeters was periodically measured and thendrained (Lannert, 1998). In order to get infiltration in units of length, the volume of water collected was divided bythe cross-sectional area of the receiving basin of the lysimeter. The infiltration measurements from all eight of theworking lysimeters were averaged each time the lysimeters were drained and compared to the rainfall since the lastdate of measurement. The total infiltration measured by the lysimeters ranged from 8.7 cm (3.4 inches) in Lysimeter 1to 39.4 cm (15.5 inches) in Lysimeter 9. The total average infiltration was 28.0 cm (11.0
inches) with a standard deviation of 10.9 cm (4.3 inches). The total rainfall measured at the site during this time was62.7 cm (24.7 inches). The information gained from the lysimeters suggests that approximately 45 percent of theprecipitation that fell at the site infiltrated through the cover material. This is much higher than predicted by thegroundwater flow model or cited in the literature for recharge rates in similar materials.
Field observations suggest that the lysimeters received water from sources other than precipitation. From May 14,1997 to March 10, 1998 infiltration appeared to parallel precipitation which would be expected. However, betweenJanuary 10 and January 22 of 1998 no precipitation fell yet the lysimeters collected one inch of infiltration. Also inthe last two months of measurement, 18.6 cm (7.32 inches) of rain fell and the lysimeters captured 4.3 cm (1.7 inches)of infiltration, less than expected from the analysis of past trends. The tops of Lysimeters 7, 9, and 10 may have beenbelow the top of the water table for a portion of the year which explains at least some of the water collected by them. However, even if the data collected from these lysimeters were eliminated, the total average infiltration is onlyreduced to 25.2 cm (9.9 inches) which is also higher than expected. In all of the lysimeters the pipe from the receivingbasin to the standpipe was below the water table for most of the year. A small leak in this pipe would cause thelysimeters to fill between measurements regardless of precipitation. The drain in the bottom of the receiving basinwas sealed with silicone caulking which may have been a poor choice because of the lack of bond strength. Theseals around these drains may not have withstood the rigors of installation. Any leaks would cause the lysimetersto gain water from the saturated zone.
Infiltrometer tests at Harco also failed (Lannert, 1998). Large networks of animal burrows caused water added to theinfiltrometers to move laterally, eventually returning to the surface as overland flow. Although the lysimeters havelittle value for a quantitative analysis of infiltration, one of then did collect water from an infiltrometer test whichsuggests some leakage through the residue layer.
Lannert (1998) described groundwater conditions at the Harco site. His work included a numeric model ofgroundwater flow. At Harco, groundwater tends to flow to the south, with some minor deviation from this trendcaused by the lakes and hills at the site. For example, groundwater discharges toward the North Lake from alldirections. A stagnant area of groundwater is south of this lake, which divides flow north toward the lake from flowto the south. Groundwater flows west from the upland on the east side of the site where it joins the generalsoutherly flow. Groundwater flow at this site may be complicated by the heterogeneity of the surficial material. Thetwo large hills in the study area are covered gob piles. Gob is a generally coarse, poorly sorted mine refuse andwould be expected to have a hydraulic conductivity higher than that of fine grained mine refuse. The exactboundaries of the different refuse types are not known. The area east of South Lake is the site of a former slurrypond. Logs of borings for the installation of the monitoring wells suggest fine grained coal refuse beneath thesurface. This material would have a lower hydraulic conductivity than the coarse refuse. Hydraulic conductivity atHarco ranged over three orders of magnitude, from 5.46e-7 to 5.78e-4 cm/s with a geometric mean of 2.18e-5 cm/s (9measurements).
Wells 4 and 5 were originally installed up gradient of the test site. Wells 2 and 3 are located within the test site. Figures 10 and 11 summarize boron and iron concentrations in sampled wells through time. Well 5, up gradient of thetest site has high concentrations of boron (Figure 10). With the exception of one data point from Well 3, all otherwells indicate low levels of boron. Iron concentrations (Figure 11) are generally low in all wells, with the exception ofWell 5, up gradient of the test site. Well 4, however, is also up gradient of the test site and this well has ironconcentrations comparable to the wells down gradient of the test site. Similarly, sodium and potassiumconcentrations offer no real insight into the impact of the residues on overall groundwater quality. Well 2, located inthe test site, has concentrations of sodium consistently higher than the other wells. This well, however, has low

218
levels of potassium. The application of residues to the hillside up gradient of wells 4 and 5 makes an interpretation ofthe impact of the residues on groundwater quality problematic.
Conclusions
This research found little value in monitoring vadose zone hydrology with free drainage lysimeters or infiltrometers. The application of soil cover by heavy equipment tends to damage lysimeters, making them unreliable instrumentsfor quantitatively measuring infiltration. High contrast in soil permeability between animal burrows and thecompacted soil matrix also biased the infiltrometer tests at Harco.
This study suggests that the FGD/fly ash fill at the Forsythe-Energy site has not impacted groundwater quality. Infact, geochemical data collected over a four year period indicates a substantial improvement in groundwater qualitydown gradient of the residues. Boron, the primary indicator of residue leachate at this site still has not reached thenearest down gradient well in concentrations significantly different than those found in the background well. Thisfinding in light of contaminant transport modeling suggests that boron transport is retarded relative to groundwaterflow at this site.
Surface water and groundwater quality data collected at the Thunderbird site also indicate no significant impact ofthe FBC residues cap. This research, however, does suggest that the cap at Thunderbird leaks and that the residuesdo not significantly improve groundwater quality.
Data from the Harco site are inconclusive because changes in the original plan for the distribution of FGD residuesmay have affected water quality in the wells up gradient of the test site. Qualitative data from Harco suggest that thelayer incorporating FGD residues leaks.
In summary, this study suggests that groundwater degraded by mining may actually improve in quality as itpercolates through coal combustion residues over an extended time period and in a field setting. Therefore, coalcombustion residues can serve as a beneficial fill material for the reclamation of abandoned mines. Large bulk fillsmay offer distinct advantage over thin caps or soil amendments. The FGD soil amendments and FBC residue capsdesigned to simultaneously serve as a barrier to infiltration and a treatment for acid mine drainage performed poorly. Although the geochemical data do not indicate an impact on groundwater quality from the residue leachate, the dataalso do not support any substantial ameliorating effects of the residues when used as a thin cap or soil amendment.
Disclaimer Statement
This report was prepared by Steven Esling of Southern Illinois University with support, in part by grants madepossible by the Illinois Department of Commerce and Community Affairs through the Illinois Coal DevelopmentBoard and the Illinois Clean Coal Institute. Neither Steven Esling of Southern Illinois University nor any of itssubcontractors nor the Illinois Department of Commerce and Community Affairs, Illinois Coal Development Board,Illinois Clean Coal Institute, nor any person acting on behalf of either:
(A) Makes any warranty of representation, express or implied, with respect to the accuracy, completeness, orusefulness of the information contained in this report, or that the use of any information, apparatus, method, orprocess disclosed in this report may not infringe privately owned rights; or
(B) Assumes any liabilities with respect to the use of, or for damages resulting from the use of, any information,apparatus, method or, process disclosed in this report.
Reference herein to any specific commercial product, process, or service by trade name, trademark, manufacturer, orotherwise, does not necessarily constitute or imply its endorsement, recommendation, or favoring; nor do the viewsand opinions of authors expressed herein necessarily state or reflect those of the Illinois Department of Commerceand Community Affairs, Illinois Coal Development Board, or the Illinois Clean Coal Institute.
Notice to Journalists and Publishers: If you borrow information from any part of this report, you must include a
219
statement about the State of Illinois' support of the project.
References
Esling, S.P., and R. Caudle. 1990. "Free-Drainage Lysimeters for the Determination of Infiltration through CoalRefuse Sites: A Preliminary Evaluation." Paper presented at the First Midwest Region Reclamation Conference,National Mine Land Reclamation Center-Midwestern Region, Coal Extraction and Utilization Center, SouthernIllinois University at Carbondale, Carbondale, Illinois, p. 3.1-3.9.
Esling, S.P., M. Fielding, and B. Paul. 1996. "Groundwater Conditions around a Coal-Combustion Residue Site inSouthern Illinois" In Proceedings of the Thirteenth Annual Meeting, American Society for Surface Mining andReclamation, eds., W.L. Daniels, J.A. Burger, and C.E. Zipper, pp.115-131.
Esling, S.P., and B. Paul. 1998. "Monitoring Mines Reclaimed with Mixtures of Spoil and Coal Combustion Residues" Final Technical Report, Illinois Clean Coal Institute, ICCI Project Number: 96-1/7.1A-3, Dr. Dan D. Banerjee,Project Manager, 18 p, plus figures.
Fielding, M. A. 1993. Groundwater Flow Conditions at a Coal Combustion Residue Site in Williamson County,Illinois. Unpublished Master’s Thesis, Southern Illinois University at Carbondale, Illinois.
Lannert, T., 1998. Groundwater Flow Conditions at an Underground Coal Mine Reclamation Site near Harco, SalineCounty, Illinois. Unpublished Master’s Thesis, Southern Illinois University at Carbondale, Illinois.
Ryan, E Z.., 1998. Evaluation of Shallow Free Drainage Lysimeter Performance in Disturbed Ground. UnpublishedMaster’s Thesis, Southern Illinois University at Carbondale, Illinois.
USEPA. 1979. Methods for Chemical Analysis of Water and Wastes. EPA-600/4-79-020, U.S. EnvironmentalProtection Agency., Revised March, 1983
USEPA. 1984a. Test Method Technical Addition to Methods for Chemical Analysis of Water and Wastes (EPA-600/4-79-020). EPA-600/4-84-017, U.S. Environmental Protection Agency, March 1984.
USEPA. 1984b. Test Methods for Evaluating Solid Waste - Physical/Chemical Methods. SW-846.9, U.S.Environmental Protection Agency.
USEPA. 1986. RCRA Groundwater Monitoring Technical Enforcement Guidance Document. OSWER-9950.1, U.S.Environmental Protection Agency, Office of Waste Programs Enforcement, Office of Solid Waste andEmergency Response.
____________________________1Steven P. Esling is an Associate Professor of Geology at Southern Illinois University. He received his M.S. inMathematics in 1982 and his Ph.D. in Geology in 1984, both from the University of Iowa. He blends his backgroundin mathematics and geology with his interests in hydrogeology and Quaternary stratigraphy. His efforts have led tostudies quantifying erosion rates in strip mine spoils, evaluating the impact of agricultural drainage wells on shallowbedrock aquifers, and assessing the impacts of mine reclamation with coal combustion resides on groundwater flowand quality. Esling works closely with his students investigating a variety of hydrogeologic and Quaternarystratigraphic problems in southern Illinois. Developing analytic models to describe the groundwater flow systemsthat develop in response to mining activities, monitoring the hydrologic budget of coal refuse sites, andcharacterizing the material properties of surficial deposits including hydraulic conductivity are research projects nowunderway. Esling also is active in developing innovative, interactive simulations of physical systems including aquasi-three-dimensional cylindrical finite-difference groundwater flow model. He also is the author of a pre- andpost-processor for numeric groundwater modeling.

220
POSTER PRESENTATIONS
Assessment of Coal Combustion By-products and Water Quality Variationsat Mine SitesCarol R. Cardone and Ann G. Kim, U.S. Department of Energy, NationalEnergy Technology Laboratory, Pittsburgh, Pennsylvania
Mine Remediation with Coal Combustion By-productsAnn G. Kim, U.S. Department of Energy, National Energy TechnologyLaboratory, Pittsburgh, Pennsylvania
The Release of Common Metals From Fly Ash During Leaching by Low pHLiquidsGeorge Kazonich and Ann G. Kim, U.S. Department of Energy, National EnergyTechnology Laboratory, Pittsburgh, Pennsylvania

233
ASSESSMENT OF COAL COMBUSTION BY-PRODUCTS AND WATER QUALITY VARIATIONS AT MINE SITES
Carol R. Cardone and Ann G. KimU.S. Department of Energy
National Energy Technology LaboratoryEnvironmental Science and Technology Division
Pittsburgh, Pennsylvania
Abstract
With over 100 million tons of coal combustion by-products (CCB) generated annually, the need to utilize fly ash iswell established. The use of CCBs in surface mines can provide a beneficial and inexpensive alternative to landfill. Ifthe CCB is alkaline, the placement of coal combustion by-products may prevent the formation of acid mine drainage(AMD) and improve water quality. Although, for most uses, fly ash is not considered a hazardous waste,environmental problems related to the release of heavy metals from CCBs are still a concern when it is exposed toacid mine drainage (AMD).
The Department of Energy has assembled a database from reports submitted by mining companies to thePennsylvania Department of Environmental Protection (PADEP). In Pennsylvania, CCBs can be used for reclamationat surface mine sites if approved under their Module 25 permit. The Module 25 requires the submission of data onthe physical properties and chemical composition of each ash placed at a facility and a monitoring plan for surfaceand groundwater. Data from the permit and from annual reports included major and trace element concentrations. The database included information from 37 sites with over 500 monitoring points and 75 CCB sources.
Statistical analysis of the water data included mean and median values of cation concentrations, pH, acidity, andalkalinity for up and down gradient samples. Because the distribution of values was not normal, this approach didnot provide an accurate measure of changes due to CCB placement. Distributions of trace elements in water samplesindicated that slightly increased levels of trace metal concentrations may have been related to levels of theseelements in the CCB. However, down gradient concentrations of trace metals, such as arsenic, barium, cadmium, andzinc, were lower than RCRA or water quality standards. The pH and alkalinity of down gradient samples weregenerally higher than up gradient samples. The difference between up and down gradient values was determined ateach site and evaluated over time. The data, analyzed to date, indicated no serious or consistent changes in waterquality.
An analysis of the solid CCB composition showed that the major cations by weight were aluminum and iron withlesser amounts of calcium, magnesium, and manganese. The trace elements, antimony, barium, cadmium, cobalt,molybdenum, and silver, were detected in less than half of the CCB samples; while, arsenic, boron, chromium,copper, lead, mercury, nickel, selenium, and zinc were detected in more than half, but not all, of the samples. Considered as a random sample population, the mean, median, and standard deviation were determined. Differencesbetween mean and median data indicated that the values, for the solid composition were not normally distributed. Four standard leachate tests were used to determine leachable concentrations : ASTM, EPTOX, SPLP, and TCLP. However, there was no consistent pattern to the results.
In general, CCB composition is variable; even samples from a single source sometimes exhibit compositional andleachate variability that can impact utilization. Based on this analysis, usage of CCB should be encouraged wheresuch variability will not critically affect the application. Otherwise, the use should involve a single well characterizedand consistent CCB or a quality control determination for the CCB must be incorporated in the process.
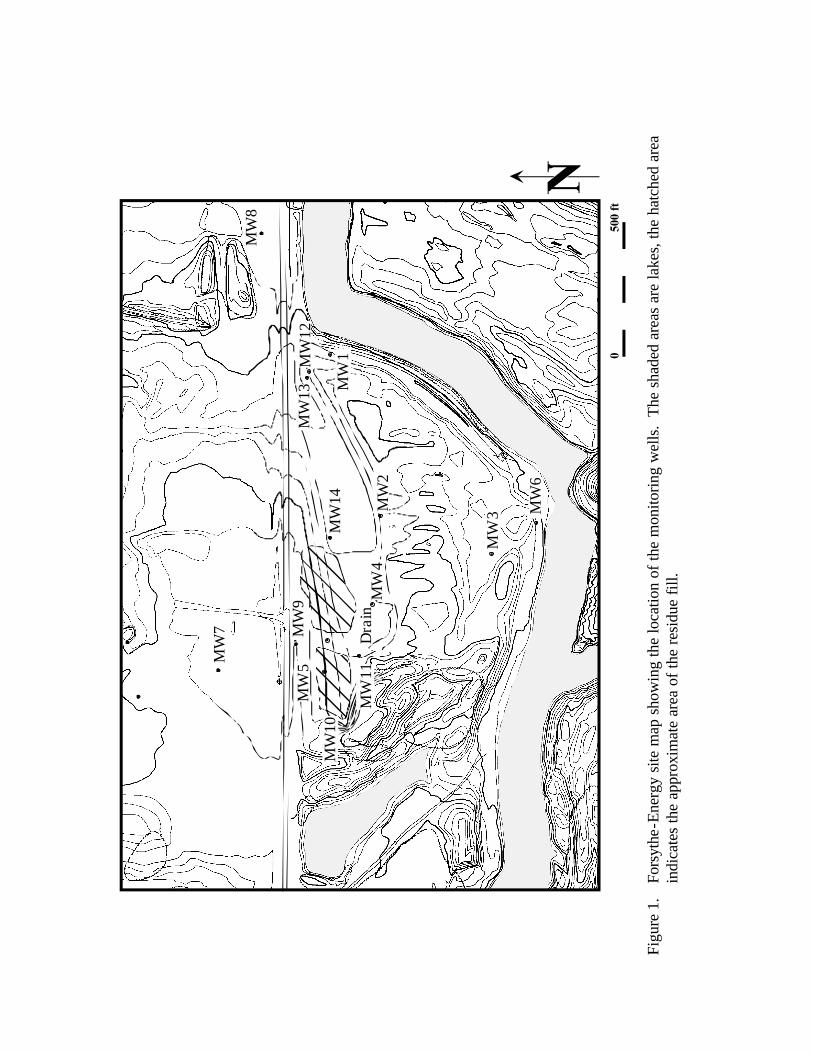
MW
7
MW
8
MW
2
MW
3 MW
6
MW
1
MW
5M
W9
Dra
inM
W4
050
0 ft
MW
10
MW
11
MW
14
MW
13M
W12
Fi
gure
1.
Fors
ythe
-Ene
rgy
site
map
sho
win
g th
e lo
catio
n of
the
mon
itorin
g w
ells.
The
sha
ded
area
s ar
e la
kes,
the
hatc
hed
area
in
dica
tes
the
appr
oxim
ate
area
of t
he re
sidue
fill.
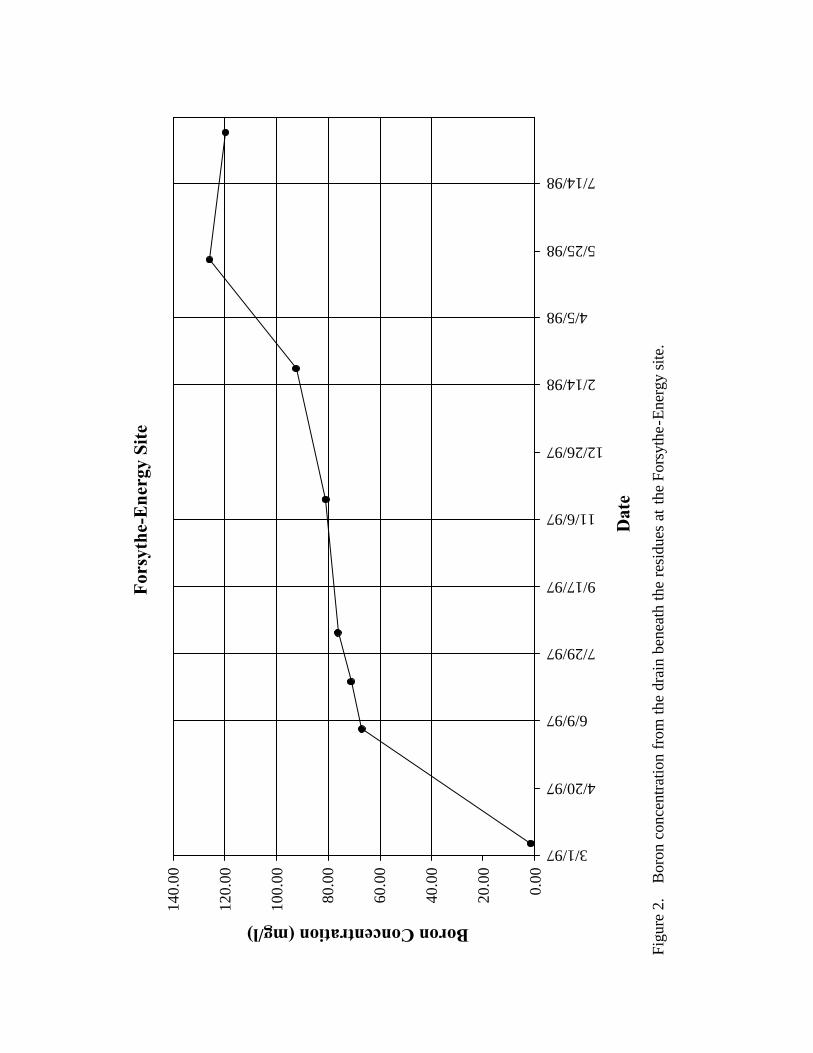
Fors
ythe
-Ene
rgy
Site
0.00
20.0
0
40.0
0
60.0
0
80.0
0
100.
00
120.
00
140.
003/1/97
4/20/97
6/9/97
7/29/97
9/17/97
11/6/97
12/26/97
2/14/98
4/5/98
5/25/98
7/14/98
Dat
e
Boron Concentration (mg/l)
Fi
gure
2.
Bor
on c
once
ntra
tion
from
the
drai
n be
neat
h th
e re
sidue
s at
the
Fors
ythe
-Ene
rgy
site.

Fors
ythe
-Ene
rgy
Site
0.00
0.50
1.00
1.50
2.00
2.50
3.00
3/1/97
4/20/97
6/9/97
7/29/97
9/17/97
11/6/97
12/26/97
2/14/98
4/5/98
5/25/98
7/14/98
Dat
e
Boron Concentration (mg/l)
Wel
l 9
Wel
l 10
Wel
l 11
Wel
l 14
Fi
gure
3.
Bor
on c
once
ntra
tion
from
gro
undw
ater
sam
ples
col
lect
ed a
t the
For
syth
e-En
ergy
site
. W
ell 9
show
s ele
vate
d le
vels
of
boro
n in
the
last
two
sam
ple
even
ts.
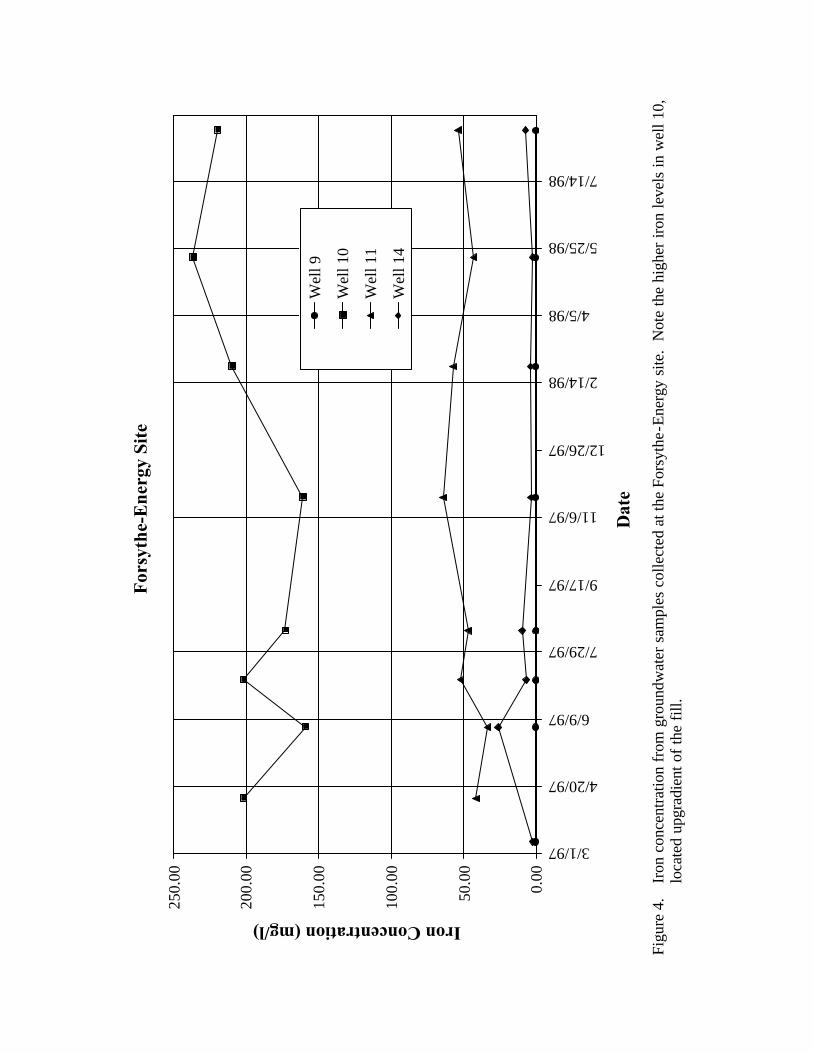
Fors
ythe
-Ene
rgy
Site
0.00
50.0
0
100.
00
150.
00
200.
00
250.
003/1/97
4/20/97
6/9/97
7/29/97
9/17/97
11/6/97
12/26/97
2/14/98
4/5/98
5/25/98
7/14/98
Dat
e
Iron Concentration (mg/l)
Wel
l 9
Wel
l 10
Wel
l 11
Wel
l 14
Fi
gure
4.
Iron
con
cent
ratio
n fr
om g
roun
dwat
er s
ampl
es c
olle
cted
at t
he F
orsy
the-
Ener
gy s
ite.
Not
e th
e hi
gher
iron
leve
ls in
wel
l 10,
lo
cate
d up
grad
ient
of t
he fi
ll.

MW3MW1
Brier Cr
eek
0 1000 ft
MW8
MW2MW4
MW5
MW6
S2-3
S4
S5
S6
S1
Figure 5. Thunderbird site map showing the location of the monitoring wells and the
stream sample points. The hatched area indicates the location of the seven test plots.

Thu
nder
bird
Site
0.00
10.0
0
20.0
0
30.0
0
40.0
0
50.0
0
60.0
0
70.0
0
80.0
0
90.0
0
100.
0010/15/9412/4/941/23/953/14/955/3/95
6/22/958/11/959/30/95
11/19/951/8/96
2/27/964/17/966/6/96
7/26/969/14/96
11/3/9612/23/962/11/974/2/97
5/22/977/11/978/30/97
10/19/9712/8/97
1/27/983/18/985/7/98
6/26/988/15/98
Dat
e
Iron Concentration (mg/l)
Stat
ion
1St
atio
n 2-
3St
atio
n 4
Stat
ion
5St
atio
n 6
204.
6 (S
tatio
n 5)
140.
8 (S
tatio
n 6)
220.
0 (S
tatio
n 5)
Fi
gure
6.
Iron
conc
entra
tion
from
surfa
ce w
ater
sam
ples
col
lect
ed a
t the
Thu
nder
bird
site
. Th
e va
lues
of s
pike
s for
stat
ions
5 a
nd 6
ar
e in
dica
ted
at th
e to
p of
the
grap
h.

Thu
nder
bird
Site
0.00
0.20
0.40
0.60
0.80
1.00
1.20
1.40
1.60
1.80
2.00
6/1/97
7/21/97
9/9/97
10/29/97
12/18/97
2/6/98
3/28/98
5/17/98
7/6/98
8/25/98
Dat
e
Boron Concentration (mg/l)
Wel
l 2W
ell 4
Wel
l 5W
ell 6
Fi
gure
7.
Bor
on c
once
ntra
tion
from
gro
undw
ater
sam
ples
col
lect
ed a
t the
Thu
nder
bird
site
.

Thu
nder
bird
Site
0.00
100.
00
200.
00
300.
00
400.
00
500.
00
600.
00
700.
00
800.
006/1/97
7/21/97
9/9/97
10/29/97
12/18/97
2/6/98
3/28/98
5/17/98
7/6/98
8/25/98
Dat
e
Iron Concentration (mg/l)
Wel
l 2W
ell 4
Wel
l 5W
ell 6
Fi
gure
8.
Iron
con
cent
ratio
n fr
om g
roun
dwat
er sa
mpl
es c
olle
cted
at t
he T
hund
erbi
rd si
te.

0 600 ft
MW4
MW5
Figure 9. Harco site map showing the location of the monitoring wells.
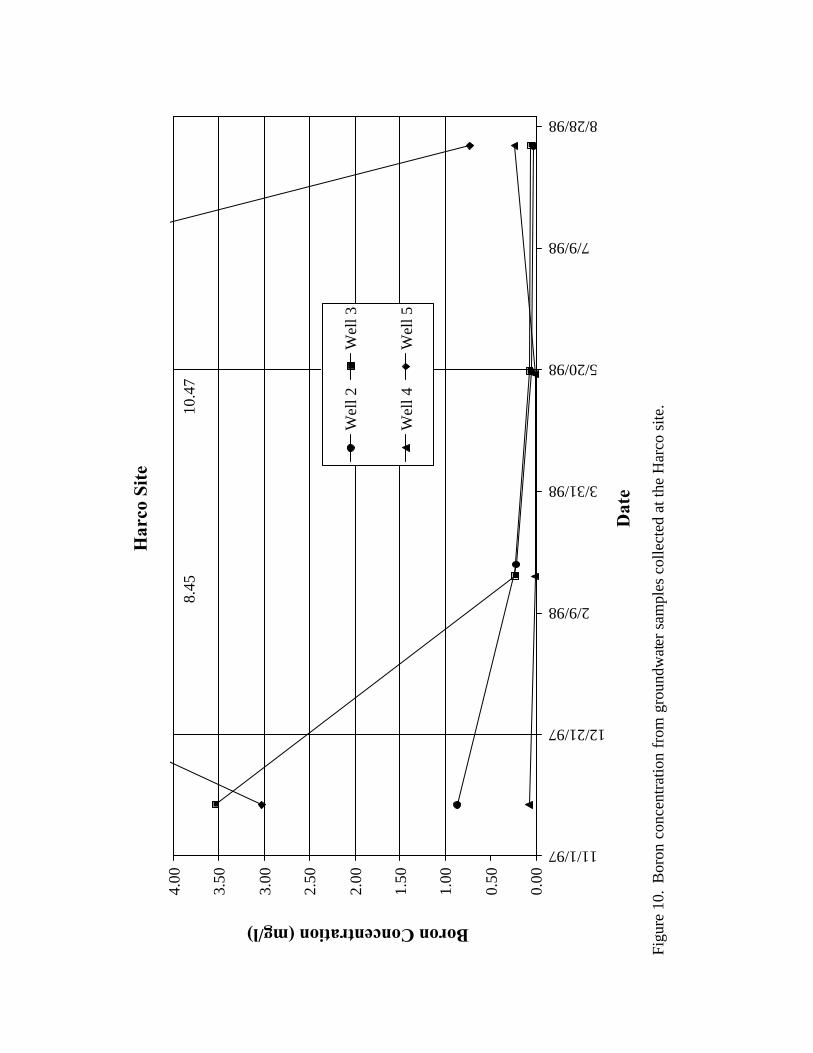
Har
co S
ite
0.00
0.50
1.00
1.50
2.00
2.50
3.00
3.50
4.00
11/1/97
12/21/97
2/9/98
3/31/98
5/20/98
7/9/98
8/28/98
Dat
e
Boron Concentration (mg/l)
Wel
l 2W
ell 3
Wel
l 4W
ell 5
8.45
10.4
7
Fi
gure
10.
Bor
on c
once
ntra
tion
from
gro
undw
ater s
ampl
es c
olle
cted
at t
he H
arco
site
.

Har
co S
ite
0.00
100.
00
200.
00
300.
00
400.
00
500.
00
600.
00
700.
00
800.
00
900.
0011/1/97
12/21/97
2/9/98
3/31/98
5/20/98
7/9/98
8/28/98
Dat
e
Iron Concentration (mg/l)
Wel
l 2W
ell 3
Wel
l 4W
ell 5
Fi
gure
11.
Iro
n co
ncen
tratio
n fr
om g
roun
dwat
er s
ampl
es c
olle
cted
at t
he H
arco
site
.

235
MINE REMEDIATION WITH COAL COMBUSTION BY-PRODUCTS
Ann G. KimU.S. Department of Energy
National Energy Technology LaboratoryEnvironmental Science and Technology Division
Pittsburgh, Pennsylvania
Abstract
In 1998, 1.1 billion tons of coal were mined in the United States. Eighty-four percent was used to produce electricity,and 108 million tons of coal combustion by-products (CCB), fly ash, bottom ash, boiler slag, and flue gasdesulfurization materials, were also produced. A conventional pulverized coal boiler produces 158 pounds of CCBper ton of coal burned, and a fluidized bed combustion (FBC) boiler generates approximately 220 lb of by-product perton of coal. Fly ash constitutes 60% of CCB, and about 30% of that produced annually from PC boilers is utilized incement and concrete, structural fills, and waste stabilization. Less than 1% of CCB from conventional boilers is usedin coal mine remediation. Almost 75% of FBC by-products are beneficially used; in 1995, 3.6 million tons were used inmine reclamation.
Under the Bevill Amendment to the Resource Conservation and Recovery Act (RCRA), the EnvironmentalProtection Agency (EPA) was required to assess high volume low toxicity wastes. EPA issued a Report to Congresson wastes from the combustion of coal by electric utility power plants, and concluded in 1993 that regulation of suchwastes under Subtitle C of RCRA was not warranted. In 1999, EPA, although it stated that there was insufficientinformation to assess potential risks of groundwater contamination, questioned the use of CCB in mine backfills. Inits comments on EPA’s report, the U.S. Department of Energy (DOE) summarized field data that supported thisbeneficial use.
The placement of alkaline fly ash in abandoned, reclaimed, or active surface coal mines is intended to reduce theamount of acid mine drainage (AMD) produced at such sites by neutralization, inhibition of acid forming bacteria,encapsulation of the pyrite, or water diversion. Preventive measures during reclamation or closure that inhibit theformation of AMD are intended to reduce the economic burden of perpetual treatment and limit the effect of miningon the environment.
Water quality changes have been monitored at three surface mine sites where fly ash grout was injected afterreclamation to control AMD. The fly ash was produced at both PC and FBC plants. When compared before andafter grouting, small increases in pH and decreases in acidity at discharge points were observed. When grouted andungrouted areas were compared, the effect of the fly ash was shown to be localized in the areas of injection. Increases in trace element concentrations were comparable in grouted and ungrouted areas, suggesting that the coalor shale could be the source of these metals.
When FBC ash was injected, the concentrations of calcium and magnesium in water samples generally increasedcompared to background levels. The average concentration of trace elements (arsenic, cobalt, copper, nickel, andzinc) was slightly elevated in the injection areas, but in down dip and discharge water samples were comparable tobackground levels.
Over a four year period, average acidity in the injected area decreased by approximately 30% at sites where a mixtureof class F fly ash and cement or the FBC grout was injected. Although coal mine remediation is a beneficialenvironmental use of FBC products, its effectiveness may be related to the amount of FBC by-products used and themethod of emplacement.

236

237
THE RELEASE OF COMMON METALS FROM FLY ASH DURING LEACHING BY LOW PH LIQUIDS
George Kazonich and Ann G. KimU.S. Department of Energy
National Energy Technology LaboratoryEnvironmental Science and Technology Division
Pittsburgh, Pennsylvania
Abstract
More than 100 million tons of coal combustion by-products (CCB) are generated by U.S. power plants each year, andfly ash makes up 60% of that total. About 30% of fly ash is utilized (mostly for concrete and structural fill), requiringthe disposal of approximately 40 million tons per year. Fly ash is primarily composed of relatively insoluble silicon,aluminum, and iron oxides; but it also contains a few percent of soluble metals and metal oxides. When exposed tonatural fluids, the metals in fly ash could leach into the environment, polluting surface or groundwater.
The Department of Energy (DOE) is studying the leaching of metals from fly ash by liquids simulating natural fluidsto assess the potential for environmental damage. The DOE leaching study places 1-kg CCB samples in 5-cm id by1-meter columns. Seven lixiviants from pH 1 to pH 11 are used to simulate common environmental liquids such asacid rain, landfill runoff, and acid mine drainage. Each column is leached with approximately 230 mL/day of onelixiviant for 30 to 120 days. The leachates are analyzed for metals, sulfate, pH, alkalinity, and conductivity. Metalsstudied include aluminum, copper, iron, manganese, nickel, zinc, and the trace elements antimony, arsenic, barium,beryllium, cadmium, chromium, lead, mercury, and selenium. Most of the metals leached from fly ash in an acidicenvironment. This resulted in a surge of metal values in the leachate as soon as the initial alkalinity in the fly ashwas neutralized. The metal concentrations in the leachates dropped rapidly after this initial surge.
Tests have been completed on 36 fly ash samples. Metal recoveries varied greatly among fly ash samples, but sometrends were observed. For example, zinc was the most soluble metal and it leached readily from most samples. Copper, however, leached well in some acidic conditions but little in others. Apparently copper occurs in differentchemical compounds which produce differing extractions. Generally, the release of metals from CCB is low, less than20% of the amount in the sample, and exposure to naturally occurring liquids does not release concentrations ofenvironmental significance.

238

239
WHERE DO WE GO FROM HERE?
FORUM PARTICIPANT RECOMMENDATIONS
At the conclusion of the forum on April 12, 2000, the participants provided the following recommendationsconcerning issues or concerns deserving attention and efforts by the Coal Combustion By-Products SteeringCommittee.
1. Improve educational outreach efforts and products to the public.2. Find a way to adequately investigate and document the actual circumstances behind each of the alleged EPA
damage cases.3. At any future technology transfer event, try to present more active mining case studies of CCB use and disposal
that include relevant site specific permit information.4. Continue the effort to provide speakers from all perspectives on the issues related to CCB use and disposal.5. Continue to improve Internet access to CCB Information and provide information products on CD ROM format.6. Consider making future forums more Region/State specific so that they can focus on more site specific problems
and solutions.7. Consider holding the next regional forum in the Western United States.8. Investigate ways to make more citizen scholarships available.9. Consider having more talks on construction methods and economics.10. Investigate methods for promotion of better guidelines for handling and testing CCB materials.

241
SURVEY RESULTSTHE USE AND DISPOSAL OF COAL COMBUSTION BY-PRODUCTS
AT COAL MINES: A TECHNICAL INTERACTIVE FORUMPARTICIPANT COMMENTS AND RECOMMENDATIONS
REGISTRATION# of Registrants % of Registrants
TOTAL: 140 100
PARTICIPANTS THAT COMPLETED THE SURVEYS TOTAL RECEIVED 49 100
LEVEL OF SATISFACTION WITH THE FORUM
VERY SATISFIED 22 45SATISFIED 24 49ADEQUATE 3 6DISSATISFIED 0 0VERY DISSATISFIED 0 0
COMPLIMENTS:1. Great Format with broad overview of topic. Fast Moving. I enjoyed the practical applications.2. Congratulations. The forum was extremely useful. A good mix of State/University/Mining/Electric
Utilities/and Environmental. I learned a lot and only wish I had done it sooner.3. Impressive overall experience. My compliments on the selection of speakers. A well rounded forum.4. Good coverage of topics.5. All speakers were very professional and doing needed research.6. Well planned overall. Good variety of speakers.7. Very educational.8. As a relative neophyte to the CCB issues, I found the presentations very helpful and informative.9. All speakers generally good and the topics pertinent.10. Good program. An overall success.11. Excellent. Well balanced. Good adherence to the schedule, session leaders, and audio visual.12. Very well conducted.13. Good cross section of topics, excellent presentations. All presenters knew their topics extraordinarily well.
Having both sides of the CCB disposal issue promoted a spirited discussion.14. The forum overall was very good, timely, and informative. Keep up the good work.15. Very good and informative forum. Good job keeping on schedule.16. The forum was great, the right length, good speakers, and a focused setting.
PARTICIPANT AFFILIATION # of Registrants % of RegistrantsSTATE 27 19CONSULTANT 27 19COAL INDUSTRY 21 15POWER INDUSTRY 16 11UNIVERSITY 14 10OSM 14 10US DOE 12 9CITIZEN 5 4OTHER FEDERAL 3 2EPA . 1 1
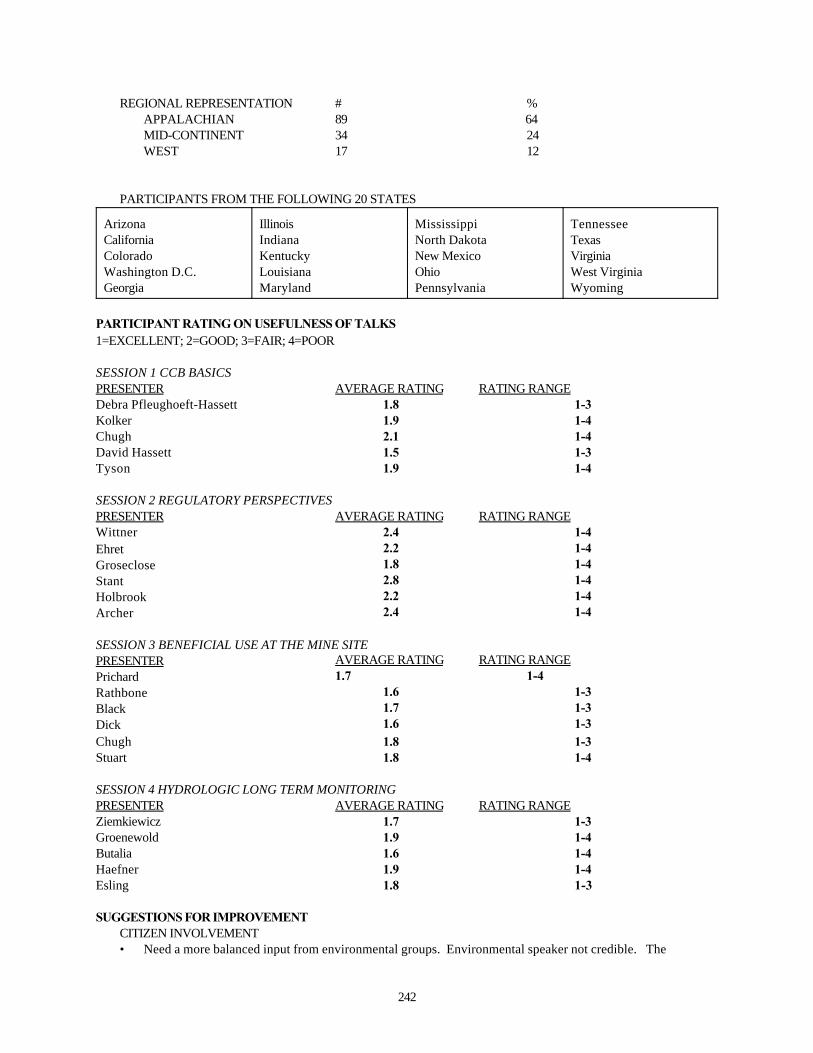
242
REGIONAL REPRESENTATION # %APPALACHIAN 89 64MID-CONTINENT 34 24WEST 17 12
PARTICIPANTS FROM THE FOLLOWING 20 STATES
ArizonaCaliforniaColoradoWashington D.C.Georgia
IllinoisIndianaKentuckyLouisianaMaryland
MississippiNorth DakotaNew MexicoOhioPennsylvania
TennesseeTexasVirginiaWest VirginiaWyoming
PARTICIPANT RATING ON USEFULNESS OF TALKS1=EXCELLENT; 2=GOOD; 3=FAIR; 4=POOR
SESSION 1 CCB BASICSPRESENTER AVERAGE RATING RATING RANGEDebra Pfleughoeft-Hassett 1.8 1-3Kolker 1.9 1-4Chugh 2.1 1-4David Hassett 1.5 1-3Tyson 1.9 1-4
SESSION 2 REGULATORY PERSPECTIVESPRESENTER AVERAGE RATING RATING RANGEWittner 2.4 1-4Ehret 2.2 1-4Groseclose 1.8 1-4Stant 2.8 1-4Holbrook 2.2 1-4Archer 2.4 1-4
SESSION 3 BENEFICIAL USE AT THE MINE SITEPRESENTER AVERAGE RATING RATING RANGEPrichard 1.7 1-4Rathbone 1.6 1-3Black 1.7 1-3Dick 1.6 1-3Chugh 1.8 1-3Stuart 1.8 1-4
SESSION 4 HYDROLOGIC LONG TERM MONITORINGPRESENTER AVERAGE RATING RATING RANGEZiemkiewicz 1.7 1-3Groenewold 1.9 1-4Butalia 1.6 1-4Haefner 1.9 1-4Esling 1.8 1-3
SUGGESTIONS FOR IMPROVEMENTCITIZEN INVOLVEMENT• Need a more balanced input from environmental groups. Environmental speaker not credible. The

243
perspective of a credible environmental group would have been useful in evaluating concerns with heavymetals.
• Future forums should address more citizen concerns as to exposure risks.• There needs to be more public outreach to citizens. Both scientists and government can benefit by public
education and communication that can dispel existing public misinformation.• Need to use good science to evaluate citizen data to determine its value in a credible way.• Invite environmental experts like Dr. Cherry and Dr. Currie who write negative reports to bring their
questions to the forum.• Invite more citizens affected by CCW disposal and application at mine sites and scientists who present a
different view to present a more balanced view point.REGIONAL CONCERNS• Would like to see a future forum focus on the western States.• Need more specifics on the detailed processes of States like Pennsylvania, West Virginia, Maryland, and
Ohio.CASE STUDIES• Would like to see more case studies of CCB buffering and mine refuse sites.• Need more case studies of disposal on the mine site.ECONOMICS• Need to see more economic details and reviews of economic viability.• Need more emphasis and data on the economic viability of projects.GENERAL • EPA should have participated more.• Need to consider future forums that would focus more on the needs of the scientific community.• Explore beneficial re-use options.• Need to have this type of forum on a more frequent basis.• A good historical review of CCB utilization and impacts would have been very informative.

APPENDIX 1: RECORDED DISCUSSIONS
Edited by Kimery C. Vories
USDI Office of Surface MiningAlton, Illinois
The following are the edited discussions that took place at the end of each speaker presentation and at the end ofeach topic session. The actual comments have been edited to translate the verbal discussion into a format that moreeffectively and efficiently communicates the information exchange into a written format. The organization of thediscussion follows the same progression as that which took place at the forum. A topical outline has beendeveloped to aid in accessing the information brought out in the discussions.
The topic of each question is shown in alphabetical order in bold. The individual speaker questions are listed inoutline format under the appropriate topic session and presentation title. Questions during the twenty minuteinteractive discussion are listed at the end of the session in the following format.
SESSION # AND TOPIC AREA1. Presentation Title
• Subject of Question or CommentSESSION INTERACTIVE DISCUSSIONSubject of Question or Comment
OUTLINE OF DISCUSSION TOPICS
SESSION 1: COAL COMBUSTION BY-PRODUCTS: THE BASICS 1. Production of Coal Combustion By-Products: Processes, Volumes, and Variability
• Ash variability due to power plant operations• Ash variability within a given coal seam
2. Composition of Coal Combustion By-Products• Arsenic enhancement in ash
3. Physical Properties and Engineering Performance of Coal Combustion By-Products
4. Environmental Performance and Regulatory Status of Coal Combustion By-Products• North Dakota Damage Site• Validity of the TCLP test for determining environmental impact of CCBs
5. Coal Combustion Products: A Material Flow Model• Change in concrete strength due to increasing fly ash in mixture
SESSION 1 INTERACTIVE DISCUSSIONComparability of cement kiln dust to CCBsMercury in ashReaction of CCB contractors to EPA rule makingTrace element partitioning
SESSION 2: REGULATORY PERSPECTIVES1. U.S. Environmental Protection Agency/Fossil Fuel Combustion: A Hazardous Waste Determination
• Clarification of uncertainty and unevenness• Effect of improving waste management• Mining damage cases• Nature of the damage cases
2. A Discussion of the Development and Evolution of Indiana’s Process for Regulatingthe Disposal of Coal Combustion Materials at Surface Coal Mines• Background water monitoring in Indiana

• Effect of EPA rule making on disposal of CCBs in Indiana• Use of CCBs for abatement of acid mine drainage at abandoned sites
3. Utility Industry Perspective of Mine Placement of Coal Combustion By-Products• Legality of EPA rule making without adequate public notice
4. A Citizen Regulatory Perspective of Disposal of Coal Combustion Wastes at the Mine Site• Indiana ash dump aquifers• Indiana disposal site - coal processing waste or CCBs?• Oklahoma CCB problem disposal sites?• Pennsylvania public meetings on ash disposal
5. The Office of Surface Mining’s Perspective of Coal Combustion Waste Disposal onNative American Land• OSM baseline hydrology requirements• OSM bond requirements for protection of groundwater resources• OSM relationship to RCRA
6. Comparison of Legal Approaches to Coal Combustion By-Product Reuse: A Changing Area of the lawSESSION 2 INTERACTIVE DISCUSSIONDifferent state definitions of beneficial useDisposal requirements for construction products containing CCBsElimination of state beneficial uses not defined by EPAEPA staff vs management differencesFluidized bed combustion ash should be exempt from Subtitle C determinationHazardous waste characterization of CCBsMisrepresentation of Pennsylvania program for handling CCBsPotential for different standards to be applied to the same CCBsSpoil chemical characterizationStates that HEC thinks are doing a good job regulating CCBs
SESSION 3: BENEFICIAL USES AT THE MINE SITE1. Development and Demonstration of Coal Combustion By-Product Based Structural
Products for Mine Use• Cost comparison with wood• Comparison with normal construction products• How are these products cut?• Product density• Product ingredients
2. Backfilling of Highwalls for Improved Coal Recovery• Delivery problems• Required strength
3. Grout Injection into an Underground Coal Mine to Control Acid Mine Drainage and Subsidence• Benefits of grouting• Explain the fluctuating concentrations of metals during grouting• Extent of mine slumping• Flow distance of the grout• Length of time that water monitoring is necessary• Long-term pH levels
4. Beneficial Uses of Clean Coal Combustion By-Products: Soil Amendment and Coal Refuse TreatmentExamples and Case Studies• Application of sulfide based lime to coal refuse• Benefits of CCB addition to plant growth• Concerns about boron• Exchange capacity of composting material

• How is CCB compost applied• Plant material chemical analysis on trace elements• Regulatory requirements for use of CCBs in agriculture in Ohio• Type of compost material
5. Underground Placement of Coal Processing Waste and Coal Combustion By-Products Based Paste Backfill for Enhanced Mining
6. Remining with Coal Combustion By-Products at the Broken Aro Demonstration Site• Recent water quality data
SESSION 3 INTERACTIVE DISCUSSIONBoron levels toxic to plantsExpansion of CCBs in underground applicationsImpact of EPA rule making on CCB researchIndustry reaction to CCB substitutes for conventional productsPotential benefits of clarification of acceptable uses for CCBsPurpose of lining mine floor with CCBs
SESSION 4: HYDROLOGIC LONG-TERM MONITORING1. Water Quality Effects of Beneficial Coal Combustion By-Product Use at Coal Mines
• Extend of fracturing• Water quality parameters
2. The Effects of Fly Ash and Flue Gas Desulfurization Wastes on Groundwater Quality in a ReclaimedStrip Mine Disposal Site• EPA applicability of TCLP test• EPA statement of application of TCLP to CCBs
3. Performance Assessment of a Flue Gas Desulfurization Material at a Lined Pond Facility• Disintegration due to freeze-thaw• Impact of moisture content on permeability
4. Water Quality at an Abandoned Mine Land Site Treated with Coal Combustion By-Products
5. Hydrologic Monitoring at Three Mine Sites Reclaimed with Mixtures of Spoil and Coal CombustionResidues in Illinois• Effectiveness of down gradient wells
SESSION 4 INTERACTIVE DISCUSSIONBoron attenuation studiesRegulatory prohibition below the groundwater tableTexas solid waste regulations
DISCUSSION BY SESSION SESSION 1: COAL COMBUSTION BY-PRODUCTS: THE BASICS
1. Production of Coal Combustion By-Products: Processes, Volumes, and Variability Debra Pflughoeft-Hassett, Energy and Environment Research Center, University of North Dakota, Grand Forks, North Dakota
Question: (Ash variability due to power plant operations) We found that different power plant operations haveeffected the chemistry of some coal combustion materials. Would you comment on your experience with changes tothe power plant operations?
Answer: Power plants that are being modified for low nitrous oxide combustion systems, SCR systems, and SNCRsystems to reduce nitrogen emissions need to be looked at on a case by case basis. In general, to understand the

variability of ash you need to know the source of the ash. Some power plants continually use the same source ofcoal while others may us several sources that are continually changing.
Question: (Ash variability within a given coal seam): You have been discussing the variability between the differenttypes of coal combustion materials and you mentioned that ash from a similar type of coal will not be too variable. Ifyou have the same type of coal burned in the same power plant unit, what type of variability would you expect in theash products?
Answer: I would expect a very limited variability. We have data from some mine mouth power plants that go backfor about 20 years, and we have seen very little variability in that data. You will see some changes in ash quality asthe mine moves across the coal seam over time. We have seen some variability in the potassium concentrations andin some of the trace elements. Even within a particular coal basin we have seen very little variability in the ashmaterials. This needs to be checked, however. You can not just assume that it will not change. 2. Composition of Coal Combustion By-Products Allen Kolker, U.S. Geological Survey Coal Division, Reston,
Virginia
Question: (Arsenic enhancement in ash) Could you clarify your statement concerning arsenic enhancement in feedcoal and ash?
Answer: We found that close to 100 percent of the arsenic is retained in the combination of fly ash and bottom ash,but it was preferentially concentrated in fly ash.
3. Physical Properties and Engineering Performance of Coal Combustion By-Products Yoginder P. Chugh andDebasis Deb, Department of Mining Engineering, Southern Illinois University, Carbondale, Illinois
4. Environmental Performance and Regulatory Status of Coal Combustion By-Products David Hassett, Energyand Environment Research Center, University of North Dakota,Grand Forks, North Dakota
Question: (North Dakota Damage Site) In the current EPA rulemaking process, EPA has noted that in North Dakotathere is an exceedance for selenium and arsenic in down gradient monitoring wells. Do you know anything aboutthis?
Answer: I will have to stand by my earlier statement, that according to the North Dakota Public Health Department,who are not friends or advocates of the mining industry, there are no problematic sites in North Dakota.
Answer: We think that EPA is referring to a historical disposal situation. At this site when disposal was initiated,everyone including the Regional EPA and the State, determined that no liners were needed for the site. Later it wasfound that there were some discharges with high concentrations of certain elements. The State and utility thenagreed that it would be better to install a liner and the disposal facility was taken out of service. It was ultimatelydetermined that both a clay liner and synthetic liner were necessary on this site and the utility has followed thispractice on all of its disposal areas. Since the water quality is continually improving at this site, North Dakota doesnot consider this to be a problematic site.
Question: (Validity of the TCLP test for determining environmental impact of CCBs)You made a statement aboutthe TCLP test for determining leachate concentrations. You said you would not recommend the TCLP test for CCBsbecause it can't be backed up by science. Could you explain this statement since this is the test recommended byEPA for testing CCB leachate characteristics?
Answer: The use of TCLP in the leaching of ash to determine its environmental impact is invalid and this is why. If Iam going to do a test in the laboratory, then I should be able to say that the test is going to have some sort ofrelevance to what also will happen in the environment. The TCLP test was designed for use in sanitary landfill
codisposal conditions. This is not the case with disposal of ash because the water that comes into contact with theash is not generally acid because the ash is not exposed to rotting garbage. The second thing that is wrong with theTCLP is that it is an 18 hour test. I can tell you with certainty that ash will change its character radically in the first360 days so that an 18 hour test will be invalid in terms of measuring this change.
5. Coal Combustion Products: A Material Flow Model Samuel S. Tyson, American Coal Ash Association,Alexandria, Virginia
Question: (Change in concrete strength due to increasing fly ash in mixture)What would happen to the strength ofconcrete if it were composed of 50 percent fly ash?
Answer: With a class F ash you would have a lower early strength gain. You would go from a 28 day strength resultto a 90 day strength result. The question is whether on not the market can live with that change.
SESSION 1 INTERACTIVE DISCUSSION
Question: (Comparability of cement kiln dust to CCBs) Has the EPA rulemaking concerning cement kiln dust (whichis similar to what is being proposed for CCBs) hurt its acceptance as a recycled product? It is my understanding thatthe cement kiln dust requirements provide minimal safety standards for this material. What is wrong with providingsimilar minimal safety standards for CCBs? Answer: First, it is my understanding that EPA, under Subtitle D of RCRA, does have the ability to intervene in asituation where certain kinds of unacceptable, environmentally dangerous threats to health practices are employed. Concerning the impact on recycling of cement kiln dust following EPA regulation of the material under the "soft C"approach, there was a short-term (6 months to a year) reduction in use that disappeared after that time. The marketfor cement kiln dust, however, is a very different market than the market for CCBs. Cement kiln dust is primarilymarketed to remediation contractors who have an in-depth knowledge of Subtitle C management practices that dealwith Subtitle C on a daily basis. The basic customer base for CCBs, however, is made up of average constructioncompanies. If you place yourself in the position of these companies, who are looking at only a small monetarydifference in price between CCBs and non-hazardous construction materials, they will turn away from a material thatmay require a hazardous waste cleanup. ACAA sees that the current regulation of CCBs by the states under SubtitleD (solid waste) is working, so why try to fix something that isn't broken?
Question: (Mercury in ash) What quantities of mercury are you finding in ash?
Answer: We really don't have an answer for mercury in ash. We are just beginning to do some tests to determinethe rate of loss of mercury from ash over time. I am concerned that if we start putting more mercury in ash that it willbe a problem in the future.
Question: (Reaction of CCB contractors to EPA rule making) Have you heard from ash product consumersregarding the EPA proposal to list CCBs under Subtitle C (hazardous waste) of RCRA?
Answer: Not only have we heard from our marketers, ACAA has a documented case from a marketer in Nebraska,where the State has approved ash based products for floors for feedlots, who had been working with a contractor formonths in using ash as a second pond liner for feedlot waste. Recently, the State wrote the contractor that becauseof the current EPA discussion of Subtitle C regulation of CCBs they would immediately suspend indefinitely theprogress on this project. This points out, that at the State level, the system was working to encourage the use ofthese materials. It only took the rumor that EPA was thinking about a Subtitle C regulation to kill the process.
Question: (Trace element partitioning) Please explain trace element partitioning.
Answer: From an environmental standpoint, the more volatile trace elements like selenium, cadmium, and lead tend

to go up the stack gases and associate more with the lightweight fly ash and not the bottom ash. Although notalways the case, there is generally a partitioning of the trace elements with the finer fractions of ash like the fly ash.
SESSION 2: REGULATORY PERSPECTIVES
1. U.S. Environmental Protection Agency/Fossil Fuel Combustion: A Hazardous Waste DeterminationAndrew Wittner, U.S. Environmental Protection Agency, Washington, D.C.
Question: (Clarification of uncertainty and unevenness) Please clarify your references to the uncertainty and theunevenness of the damage cases.
Answer: The unevenness is the different levels of protection provided by the different states. The uncertainty is thelevel of damage that may be occurring in terms of the interpretation of the evidence. Whether or not the damage isevidence of a precursor that may be an indicator of more damage in the future.
Question: (Effect of improving waste management) It is my understanding that most of the damage cases come fromthe 1970s. Since many of these cases are the result of practices that no longer occur, does EPA take into account thediminishing impact of these cases? How does EPA evaluate the effect of better management practices beingcurrently employed?
Answer: I think there is no doubt that the states are becoming more knowledgeable about handling these situations. I think that management practices are getting more protective. The question, however, is whether or not this trendwill continue, and is the increase in protection sufficient?
Question: (Mining damage cases) Of the damage sites that EPA has recorded, how many involve mining?
Answer: Most of the damage cases do not involve mining to my knowledge.
Question: (Nature of the damage cases) Have the damage cases been shown to be exclusively the product of coalcombustion wastes?
Answer: There is no question that the damage cases are subject to interpretation and there are compounding effects. With respect to mine filling there is the question of whether the results are a result of mine filling or the presence ofwastes. More importantly, whether enough time has passed, assuming we are monitoring properly, that the resultswe are seeing are just the precursor of what we may see at a later time. At this time, EPA does not have the datanecessary to adequately model the groundwater mine filling situation.
2. A Discussion of the Development and Evolution of Indiana’s Process for Regulating the Disposal of CoalCombustion Materials at Surface Coal Mines Paul Ehret, Indiana Department of Natural Resources, Bureauof Mine Reclamation, Indianapolis, Indiana
Question: (Effect of EPA rule making on disposal of CCBs in Indiana) If EPA comes out with a determination forCCBs that is similar to that for cement kiln dust concerning disposal of the materials below the water table, howwould that impact the program for disposal of CCBs at mine sites?
Answer: The Indiana program is based on placing CCBs below the water table. The rationale is that in general theupland areas of southwestern Indiana are not groundwater rich. Groundwater is a limited resource in this area of theState with the exception of bottomland areas and alluvial valleys. The amount of groundwater is limited and aftermining the groundwater is highly mineralized. It makes no sense to us in this situation to try to separate the spoilwater from the CCB water. The problem with placement of CCBs above the groundwater is that this may result in aconflict with the approximate original contour requirements of the Surface Mining Act which would preclude thedisposal of CCBs at surface coal mines.

Question: (Background water monitoring in Indiana) How extensive is your background monitoring of groundwaterquality in Indiana?
Answer: We have a pretty good handle on the pre-mining groundwater data. The problem is that the pre-miningwater quality is not a good indicator what the post-mining groundwater quality will be. This has nothing to do withCCBs. There is tremendous variability in post-reclamation water quality from wells that may only be 50 feet apart. Because of this problem with post-reclamation groundwater, we do not consider it to be a resource.
Comment: (Use of CCBs for abatement of acid mine drainage at abandoned sites) In Maryland, we have four CCBdamage cases that have been grandfathered. But speaking of grandfathered problems, we have 450 abandoned coalmines in Maryland that have unquestionably created environmental damage. As a result, Maryland has 450 miles ofstreams that are devoid of aquatic life. My problem is that the risk analysis described by EPA considers eliminatingthe use of CCBs as a method for mitigation of the acid mine drainage at the 450 abandoned mine sites because offour CCB damage cases resulting from grandfathered CCB disposal areas. This does not seem to be either goodscience or good public policy to me.
Response: In abandoned mine situations you change the subject dramatically. Acid mine drainage (AMD) problemscan be severe. My problem with the proposed EPA rule making is that it appears to preclude the use of CCBs formitigation or abatement of AMD. Given the known problem we have with mitigation of AMD at abandoned minesites, the EPA proposal seems to through the baby out with the bath water.
3. Utility Industry Perspective of Mine Placement of Coal Combustion By-Products Steven Groseclose, Piper,Marbury, Rudnick, and Wolfe LLP, Washington, D.C.
Question: (Legality of EPA rule making without adequate public notice) What is the legal perspective on EPAsending a report to Congress that indicates the evidence does not support regulation of CCBs under Subtitle C(hazardous waste) in March of 1999 and then at the 11th hour without any public notice in the Federal Register,completely reversing itself based on data from only four additional sites that even EPA has not had time toadequately investigate?
Answer: Certainly it is highly irregular and is not the way it is supposed to be done. We will have to wait and seehow the final determination comes out before I would consider the legal aspects.
4. A Citizen Regulatory Perspective of Disposal of Coal Combustion Wastes at the Mine Site Jeff Stant,Hoosier Environmental Council speaking for Tom FitzGerald, Kentucky Resources Council, Inc., Frankfort,Kentucky
Question: (Indiana ash dump aquifers) What were you referring to when you said that Indiana was reconstitutingaquifers as ash dumps?
Answer: What I mean is that there are final box cuts in Indiana where they dispose of fly ash from the elevation ofthe lowest coal seam mined to within 4 feet of the final surface. These areas are up to 1,000 yards long and 200 yardswide horizontally. They call this a monofill. Instead of any spoil material being put back, what you have is a block ofsolid ash the size of a ship under the ground in the water table. Within this monofill site, I would call this an ashaquifer. The Indiana Universal site has very high levels of boron (60 -70 ppm), many times over the standards usedin the State of Wisconsin and many times over the U.S. Department of Agriculture's crop irrigation standard.
Question: (Indiana disposal site, coal processing waste or CCBs?) You showed us pictures of CCB disposal at PrideCreek in Indiana. The material being disposed of in the picture was not CCBs but coal processing waste.
Answer: We had it tested and the analysis showed that it was coal ash.

Response: I tell you what Jeff, you send a person and the State of Indiana will send a person to this site and we willcollect a sample and split it. We can then both test the same sample and see what the result is. The site you showedin your picture is approved for both fly ash disposal and for coal processing waste. The pit you showed in yourpicture is only approved for coal processing waste primarily from their underground mine and that is what we werelooking at in your picture.
Question: (Oklahoma CCB problem disposal sites?)I am from the Oklahoma Department of Mines. You mentionedseveral states that had groundwater pollution due to disposal of CCBs and Oklahoma was one of them. I am notaware of that. Could you tell me the particulars to which you are referring?
Answer: Although it was several months ago, we were dealing with four sites and the State person we were talkingto, who told us about the sites, later told us that the sites did not exist. It was our interpretation that he had beeninstructed by management to not talk to us because it would be admitting that the State was not doing its job.
Question: (Pennsylvania public meetings on ash disposal) I take issue with you concerning what you said about thePennsylvania project that I am intimately involved with. This issue I take is that you said we had exceeded 250,000tons and the State did nothing about it. The regulation reads that if you exceed 250,000 tons you need to
submit a request for approval. This is what we have done and we have had three public meetings concerning thisrequest. We are meeting with the public on this issue because it is good business.
Answer: I stand corrected.
5. The Office of Surface Mining’s Perspective of Coal Combustion Waste Disposal on Native American LandRick Holbrook, Office of Surface Mining, Denver, Colorado
Question: (OSM baseline hydrology requirements) On the permit application, you mentioned that the permit shoulddescribe protection of the hydrologic balance and hydrologic resources. In Indiana, we are claiming that if you aregoing to turn mines into large disposal sites for CCBs you need to do a better job characterizing the groundwaterrates, direction of flow, and quality, and the vertical connection between aquifers. Are you saying that OSMrequires this for each aquifer? In Indiana the State says that this can be assessed from existing technical guides andpermitting information from nearby mines without obtaining site specific baseline information.
Answer: Although I think you need to work with the State Regulatory Authority on this I think you should be ableto ask what is the technical basis for their review findings.
Question: (OSM bond requirements for protection of groundwater resources) You said that during bond release theregulatory authority needs to take into account the amount of bond necessary to protect the water resources. If theState says they don't value the post-mining groundwater resource then there is no money in the bond forgroundwater resource protection.
Answer: If you have no groundwater resource, then you have nothing to protect.
Question: (OSM relationship to RCRA)What would be the advantage to OSM of operating its program underRCRA authorization?
Answer: OSM now operates under a RCRA plan to the degree that the Solid Waste regulations have to be abidedby and are self implementing. OSM is obligated to insure that the permittee under a Federal program is in compliancewith the EPA Solid Waste regulations. If there would be a Subtitle C (hazardous waste) determination for CCBs, thenthere will be another regulatory authority that we would need to coordinate with.
6. Comparison of Legal Approaches to Coal Combustion By-Product Reuse: A Changing Area of the law Tina

Archer, Howard and Howard Attorneys, Peoria, Illinois
SESSION 2 INTERACTIVE DISCUSSION
Question: (Different State definitions of beneficial use) If EPA does require additional regulation of CCBs andbeneficial use is exempted, and yet many states do not have the same definition of what constitutes beneficial use,how will that effect the EPA rule making?
Answer: If EPA rule making does exempt beneficial use, then EPA will define what it means by beneficial use andstates could be more stringent but not less.
Question: (Disposal requirements for construction products containing CCBs) Under the proposed EPA rulemaking for CCBs, if you are using Sheetrock in construction that has CCB gypsum in it, later when a buildingcontaining this Sheetrock is torn down where would this waste be disposed? Would construction material withCCBs be disposed of differently than construction materials without CCBs?
Answer: It would be taken to a Subtitle D (solid waste) landfill. If, however, you did not take it to an appropriatesolid waste disposal area, then it would be regulated as a hazardous waste.
Response 1: I would not go down to the lumber yard and buy Sheetrock or concrete with CCBs in it if there was achance it would have to be disposed of differently than Sheetrock or concrete without CCBs.
Response 2: People buy batteries today with lead in them, and we have programs for recycling the lead that hasbeen brought about by RCRA in order to control the hazardous components of batteries.
Question: (Elimination of State beneficial uses not defined by EPA) If beneficial use is defined by EPA, and thestates have listed uses not included in the EPA definition, will those uses be eliminated at the State level?
Answer: That is my understanding.
Question: (EPA staff vs management differences) Was there a technical or professional group of staff within EPAsolid waste that recommended that EPA continue the exemption of CCBs from Subtitle C that was overruled by EPAmanagement?
Answer: That is my understanding. There are a number of letters written by congressmen and senators to thateffect.
Comment: (Fluidized bed combustion ash should be exempt from Subtitle C determination) Concerning the March1999 EPA Report to Congress, there were five different categories of coal combustion wastes being considered. There were the large volume wastes comingled with the low volume wastes, the large volume wastes, the fluidizedbed combustion (FBC) waste, the low volume wastes, and then the oil and natural gas wastes. The recentlyproposed EPA determination does not distinguish between the large volume wastes and the FBC wastes. We havebeneficially used FBC ash in Pennsylvania for some time. We have a number of FBC power plants that use coalrefuse as a fuel source. There is no other way to reclaim these coal refuse sites short of capping the areas with sometype of concrete. These FBC power plants take the FBC ash back to the coal refuse site to finish the reclamation ofthe area. We have had some tremendous successes with reclaiming these sites. The groundwater has beenmonitored closely and there is not one site reclaimed with FBC that is even close to being considered a damage case. At one site I used FBC ash as a grout at a mine site where it is in contact with groundwater that has a pH of 2.3 fromacid mine drainage from surrounding mines. Groundwater contamination was well documented prior to remediationwith FBC ash with high levels of several RCRA metals. After grouting with FBC ash these concentrations werereduced by 65 - 95 percent. These reduced levels have remained the same for the last 8 years. I have yet to see asingle case of FBC damage. If EPA looked at the FBC data, I think they would determine that FBC ash should remainexempt. The industry has told us that if a single FBC power plant has to start land filling the FBC ash then all of the

FBC power plants in Pennsylvania will shut down. In Pennsylvania we have on our inventory 854 abandoned coalrefuse piles covering about 8,500 acres across the State. The 8.5 billion gallons of water per year coming off theseunreclaimed sites would all be proven damage cases because of the AMD with very high levels of trace metals and apH as low as 1.9.
Question: (Hazardous waste characterization of CCBs) Have CCBs been adequately tested to determine whether ornot they would be characterized as hazardous materials?
Answer: Industry and academia have conducted extensive characterization studies on CCBs and determined thatbetween 1 and 2 percent of the CCBs would be characterized as hazardous. But EPA would not consider that to be asufficient test. No one would assert that these materials routinely test as hazardous for one of the RCRA metals. The problem is that in some cases leachate from CCB disposal sites have been found to pollute the environment andcreate damages. Comment: (Misrepresentation of Pennsylvania program for handling CCBs) Having worked for the State ofPennsylvania for almost three decades, I would like to point out that the Pennsylvania program for handling CCBshas been seriously misrepresented here today. Pennsylvania has learned a lot concerning handling CCBs over thelast 20 plus years. At this point in time, the program does involve testing the CCB materials often and early, it doesnot allow CCBs to be disposed of below the water table, and there is a complete list of conditions that control how itcan be used.
Question: (Potential for different standards to be applied to the same CCBs)If EPA does regulate CCBs on minesites under Subtitle C (hazardous waste), what happens to the very same CCBs when they are being used as fill onhighway construction or flowable fill for utilities or make school soccer fields. Why would the same material
be required to have a liner and have groundwater monitoring on a mine application but not on these otherapplications?
Answer: In Illinois, there are some CCBs that can be beneficially used in applications that you have mentioned. There also are some CCBs that need a special handling plan. This is how we handle CCBs in Illinois. There aresituations in Illinois where the scenario you suggested does occur, and ash that is suitable for a beneficial use isinstead disposed of because there is just not enough demand for its use.
Question: (Spoil chemical characterization)Have spoil materials been characterized in the same sense that CCBshave been characterized chemically?
Answer: The answer is yes. If you what to know the detailed mineralogy please contact Dr. Chugh at SIUC.
Question: (States that HEC thinks are doing a good job regulating CCBs) I have been employed to explore bothnew and proven sound methods of using CCBs in coal mine subsidence issues. My goal is to take in positiveinformation from speakers at this conference. Based on the Hoosier Environmental Council research of CCB sitesyou indicated that states are doing a good job utilizing CCBs in mine subsidence.
Answer: The Hoosier Environmental Council looked at State programs, their permits, and testing in an effort toregulate the use of CCBs in the environment. We think that both the Department of Natural Resources and theelectric utilities in Wisconsin are very aggressive in dealing with problems related to CCBs. In Wisconsin the peopledo not fight disposal of CCBs because they feel that they are being protected. I think that Illinois has been trying todo a good job with its groundwater protection act and its effort to monitor surface impoundments and to putadequate water monitoring at its CCW disposal sites and mine sites. We also were very impressed by the Kentuckylaw and the Ohio Surface Mine disposal permits. We were impressed by the amount of water monitoring being doneat the Turris Mine in Illinois where they had 26 monitoring wells around a 180 acre lagoon. There were a couple ofother sites where there was a small disposal area were extensive water monitoring was being conducted. I have beenimpressed with the amount of research that is being done in West Virginia on leaching tests with sulfuric acid and

the research on ash characterization in Wisconsin. Ohio has a provision that requires a one year column leachingtest where if the resulting leachate does not exceed drinking water standards then the ash can be disposed of belowthe water table. Although there are examples of states trying to be protective in this area, there are other stateswhere this is not the case, and we need a minimum federal floor that all of the states have to abide by.
SESSION 3: BENEFICIAL USES AT THE MINE SITE
1. Development and Demonstration of Coal Combustion By-Product Based Structural Products for Mine UseY. P. Chugh, Mining Engineering Department, Southern Illinois University, Carbondale, Illinois
Question: (Comparison with normal construction products) How would these products compare to constructionproducts not found on the mine site?
Answer: Our CCB blocks are not nearly as hard or strong as a conventional concrete block. They also tend to bleedthe fly ash which could be a concern in a home environment.
Question: (Cost comparison with wood) What is the cost comparison of your CCB product with comparable woodproducts?
Answer: Our CCB blocks are made to be economically comparable to the Omega blocks. I do not know the actualprice but our CCB blocks are less expensive and the performance is substantially higher. Our CCB blocks have acompresive strength around 200 pounds per square inch (psi) compared to the Omega block at around 40 psi.
Question: (How are these products cut?) Wood products can be shaped with a saw, how do you cut theseproducts?
Answer: They can be cut with a bow saw just like wood.
Question: (Product density) How does the density of wood compare with the density of your CCB product?
Answer: The average density of an oak hardwood support member you would see in a mine is 80 to 90 pounds percubic foot (pcf). The CCB crib ties were cast at 85 pcf. This gives a product that is almost identical to woodproducts currently in use.
Question: (Product ingredients) One slide showed that your product was about 80 percent fluidized bedcombustion ash. What are the other ingredients in these products?
Answer: The crib elements are F ash with liming agents, commercial concrete foam to lower the density, and areinforcing polymer.
2. Backfilling of Highwalls for Improved Coal Recovery Robert Rathbone, Center for Applied EnergyResearch, University of Kentucky, Lexington, Kentucky
Question: (Delivery problems) It seemed like the problem with the cement trucks was that they could not deliverquickly enough. Would more trucks and a different wash down area promote quicker delivery?
Answer: We used more trucks the second time but this just seemed to compound the problem. Since they wererented trucks, the drivers felt that they really needed to get them clean and the cleaning time really killed us. I likedthe idea I heard here at the forum about using on site pug mills that you mixed yourself from a stockpile. Question: (Required strength) Looking at your strength values, did you really need 1,500 psi?
Answer: No. What was actually calculated was about 50 psi. But we just decided to make it 500 psi. I think ingeneral the higher the strength the better and we did not have to do anything other than add water to get the flowthat we needed. But we didn't need it that high.
3. Grout Injection into an Underground Coal Mine to Control Acid Mine Drainage and Subsidence D.Courtney Black, National Mine Land Reclamation Center, West Virginia University, Morgantown, WestVirginia
Question: (Benefits of grouting) Where is the true benefit of grouting these AMD mine pools, is it the treatment ofacid mine drainage with alkaline material in the grout or is it sealing the underground works so that the incomingwater does not come in contact with the acid forming materials in the mine?
Answer: We do not want the grout to dissolve because of neutralization of the mine water. We want to plug thehole so that water does not come in contact with acid forming materials in the mine.
Question: (Explain the fluctuating concentrations of metals during grouting) Comparing concentrations before,during, and after grouting, it seemed the concentration of several chemicals went down and then came back up butnot as much as before grouting. How do you explain that?
Answer: The arsenic number I reported was before cell one was completed. We were getting a lot of acid minedrainage. Once we sealed that off, the pH of the discharge water started going up above 8.0. Because of leakagefrom the mine pool, the pH went up significantly during grouting. A lot of things happened during grouting becauseof the high pH levels of the grout. I am more concerned with what is happening after grouting.
Question: (Extent of mine slumping) Were you able to determine if you had much slumping in the mine before youstarted grouting?
Answer: We did do a survey with the OSM down hole camera and found a significant amount of slumping aroundcell #2.
Question: (Flow distance of the grout) Were you able to determine how far the grout would flow?
Answer: If there was no mine drainage occuring, we could fill 800 feet of cell with about three holes. In actualpractice we needed about 17 holes to fill that 800 feet of cell. We filled one cell that had a high point with one hole.
Question: (Length of water monitoring necessary) How long will you need to monitor around the grout to determineif the seal will break down?
Answer: We plan to monitor this site on a quarterly basis indefinitely in order to determine the long-term effectsbecause the cost at this site is fairly low.
Response: At another site where the grout has been exposed to AMD at a pH of 2.1 we have been monitoring forseven years and have not seen any breakdown of the grout. Question: (Long-term pH levels) Have you determined the long-term impact on the pH of the mine pool?
Answer: We determined that the water coming into the mine pool had a pH of 5 to 6. It was being discharged fromthe mine pool at about pH 2.7. The water after grouting only needs settling not treatment for low pH.
4. Beneficial Uses of Clean Coal Combustion By-Products: Soil Amendment and Coal Refuse TreatmentExamples and Case Studies Warren Dick, School of Natural Resources, The Ohio State University, Wooster,Ohio

Question: (Application of sulfide based lime to coal refuse) How do you apply a sulfide based lime to coarse coalrefuse material?
Answer: At one site we are working on, we are applying it in layers with a dozer. The distribution of material is notuniform but adequate for our purposes.
Question: (Benefits of CCB addition to plant growth) Do you apply the FGD as an alternate to convential soilamendments or is this a supplement to those?
Answer: We would apply FGD primarily as lime substitute. Farmers in the eastern United States require limeadditions to adjust the soil pH. So instead of the farmer buying commercial lime, we would recommend theapplication of FGD in the place of lime. The advantage is that it not only increases the soil pH just like lime but italso supplies essential trace nutrients that the farmer would not apply otherwise. Very few farmers apply tracenutrients as part of their fertilizer application even when they are deficient.
Question: (Concerns about boron) Please explain your concerns about boron.
Answer: I have several examples of where reclamation was done on mine sites about 15 years ago where therevegetation failed initially due to high boron levels. After enough time had passed for the boron to leach from thesoils, the areas were reseeded successfully. Boron has a very fine line between optimum concentration for plantgrowth and too much. Boron is an absolute nutrient requirement that is needed by the plants for growth but there isa fine line between sufficient and too much.
Question: (Exchange capacity of composting material) Do you have to account for the exchange capacity of materialsuch as your compost that may absorb cations and lock them up?
Answer: No we don't because if you have 70 percent of the by-product in the compost, you have so much excesscalcium or other exchangeable bases that you don't have to worry about this.
Question: (How is CCB compost applied?) Concerning your reference to FBC compost, how is that applied?
Answer: If you use FBC by itself it is very dry. When you spread this material it is very difficult to apply because itwould blow too much. By mixing the FBC with the compost as 70 percent FBC and 30 percent compost by
weight and about 50 percent each by volume within conventional compost mixing machinery, you end up with agranular type of material that spreads very well with a comercial lime spreader.
Question: (Plant material chemical analysis on trace elements) Have you collected data to determine which specifictrace elements we are getting a benefit from applying these CCB materials?
Answer: We have not done this yet due to the expense and complications of numerous variables.
Question: (Regulatory requirements for use of CCBs in agriculture in Ohio) What type of regulatory approvalsare required in Ohio for this type of agricultural application?
Answer: We really do not know for sure. There has been an ongoing interaction with the Ohio EPA concerning howmuch regulation is necessary, but this is still an issue that we struggle with.
Question: (Type of compost material) What type of compost were you using?
Answer: Our compost was a yard waste compost consisting of grass clippings and leaves.
5. Underground Placement of Coal Processing Waste and Coal Combustion By-Products Based Paste Backfill for Enhanced Mining Economics Y.P. Chugh, Department of Mining and Mineral Resources
Engineering, Southern Illinois University, Carbondale, Illinois
6. Remining with Coal Combustion By-Products at the Broken Aro Demonstration Site Ben J. Stuart,Department of Civil Engineering, Ohio University, Athens, Ohio
Question: (Recent water quality data) Have you had any results for this year?
Answer: We had our last results from February of 2000. We only had data from about half of the sites because ofthe very low flow rates. Water quality was continuing to improve but we did not calculate loads.
SESSION 3 INTERACTIVE DISCUSSION
Question: (Boron levels toxic to plants) Concerning boron toxicity, at what level does boron negatively affect thegrowth of plants?
Answer: If you have very sensitive plants, one part per million(ppm) of boron can cause problems if you weregrowing plants in a nutrient solution. Normally, if you are getting 10 to 15 ppm of boron then you will need to delaythe establishment of vegetation until leaching brings the level down to 3 to 4 ppm.
Question: (Expansion of CCBs in underground applications) Have you noticed any threat from expansion of thesematerials in mine applicatons?
Answer: We have seen some expansion of materials in underground applications but it was not enough to causeany problems. This has only been in unconfined situtations.
Question: (Impact of EPA rule making on CCB research) Concerning EPA's draft proposal to regulate CCBs ashazardous waste and not allow mine filling as an exempt practice, what would be the impact to CCB research?
Answer: I have two more CCB project proposals in Ohio, and I was told by the Ohio Department of NaturalResources that they were hesitant to continue with these projects because of the EPA rule making even though theylike the projects and would like to do more of them.
Question: (Industry reaction to CCB substitutes for conventional products) What kind of reactions are you gettingfrom industry for the CCB products that are substitutes for more traditional materials like wood?
Answer: The people from the mine site have been very enthusiastic. The only actual product that is in production isthe ventilation blocks.
Question: (Potential benefits of clarification of acceptable uses for CCBs) If the EPA determination provides a clearexemption of AML projects and other projects that utilize CCBs beneficially to groundwater and surface watersystem or to soils, couldn't such a determination benefit CCB research and encourage greater application of thisresearch in the marketplace?
Answer: Certainly, it would benefit everyone if the boundaries for the use of CCB materials were clear because up tonow they have been constantly shifting. Assuming we could get to this point, it would be good for marketing CCBproducts. One of the ways I like to look at CCBs is they are usually a mixture of fly ash, where we have just tons ofinformation over the years. The by-product of the scrubbing of the flue gas is gypsum and gypsum has been usedin agriculture for thousands of years. The unreacted sorbent which is calcium carbonate or lime also has been usedin agriculture for thousands of years. What makes CCBs so special when you mix all of these ingredients together? This shows that much of the marketing of these materials is dependent upon education.
Answer: At any of our abandoned mine site projects, we are looking at tens of thousands of kilograms per day of
acid and sulfur being dumped into streams. When you talk about beneficial use of these materials reducing the acidloads to these streams, the leachability of these materials is way below the levels of trace elements already impactingthese areas due to acid mine drainage for the last several decades. There is a tremendous benefit to using thesematerials to remediate the effects of acid mine drainage.
Answer: I am a reseacher for the Department of Energy. When I try to obtain soils that have been contaminatedwith hazardous waste in order to conduct research, I have to go through so much paper work in order to acquire thematerial and work with them on site that this is a good indication to me of the negative impact that will result to CCBsbeing regulated under Subtitle C of RCRA.
Question: (Purpose of lining mine floor with CCBs) Someone mentioned the use of FBC on mine floors. What isthe point of this type of use?
Answer: When pyritic material is located right below and above the coal seam, we lay the FBC material next to theexposed coal seam and on the pit floor in order to prevent the contact of water with either the exposed coal seam orthe pyritic material on the pit floor. These materials compact very well and are great for use as sealants but do notproduce long-term alkalinity.
SESSION 4: HYDROLOGIC LONG-TERM MONITORING
1. Water Quality Effects of Beneficial Coal Combustion By-Product Use at Coal Mines Paul F. Ziemkiewicz andD.C. Black, National Mine Land Reclamation Center, West Virginia University, Morgantown, West Virginia
Question: (Extent of fracturing) I was suprised you had such low permeabilities with FBC material. Don't you get alot of fracturing?
Answer: If you mix FBC with water and put it in a bucket outside, it will be concrete for about a year and then it willbe mush. If you put it in an underground mine, where it is not exposed to freeze-thaw with relatively constantmoisture conditions it tends to set up and stay set up for a very long period of time. Most of the fractures you sawin the pictures were less than one half inch deep and were a function of drying on the surface.
Question: (Water quality parameters) How many water quality paramenters do you test for? Answer: We normally test for about 18 metals plus the typical AMD suspects of iron , aluminum, and manganese. Sometimes we do not analyze for boron because West Virginia doesn't really care about boron, but Pennsylvaniadoes.
2. The Effects of Fly Ash and Flue Gas Desulfurization Wastes on Groundwater Quality in a Reclamed StripMine Disposal Site F. W. Beaver, University of North Dakota, Department of Geology and GeologicalEngineering, David J. Hassett and G.J. Groenewold, Energy and Environment Research Center, Grand Forks,North Dakota, and O.E. Manz, Alvarado, Minnesota
Question: (EPA applicability of TCLP test) What did you mean by your statement that EPA has readily admittedthat the use of the TCLP leachate test procedure is not the way the go?
Answer: At a meeting on leaching and leaching protocols held by EPA, it was discussed that it could not be usedfor CCBs because of its reactivity to the formation of secondary hydrated phases, and acedic acid is not produced inthe environment. I would not like to take distilled ionized water and apply a leaching test to environmental settingsthat have acid mine drainage. Being in academia, when we saw that TCLP didn't seem to make sense, we invented amethod that did. There are other tests that are as good as the TCLP.
Question: (EPA statement of application of TCLP to CCBs) Did the Office of Solid Waste in EPA actually say that

they did believe the TCLP test should not be applied to CCBs?
Answer: Representatives of EPA said this, but I don't know which office they were from. I was really suprised tohear all of this frank open discussion about the misapplication of the TCLP test.
Response: TCLP was developed for the situtation where a waste would enter a municipal landfill. It was developedto estimate the potential leachate that would be generated if the waste in that municipal landfill was aproximately 5percent or less. The problem is when you apply the TCLP to a monofill situtation.
3. Performance Assessment of a Flue Gas Desulfurization Material at a Lined Pond Facility Tarunjit Butaliaand William Wolfe, The Ohio State University, Columbus, Ohio
Question: (Disentigration due to freeze-thaw) Have you noticed any disentigration of the material that is exposed tothe air due to freeze-thaw?
Answer: Absolutely. What we found was that the surface half inch of the material was fractured but it was hardbelow that. At most pond sites you would cover the material with a few inches of soil.
Question: (Impact of moisture content on permeability) Would the permeability be impacted by moisture content inthe field?
Answer: It would be impacted if you were limited to 28 days for curing, but if you have 60, 90, or 180 days for curingthen it is not impacted.
4. Water Quality at an Abandoned Mine Land Site Treated with Coal Combustion By-Products Ralph J.Haefner, U.S. Geological Survey, Water Resources Division, Columbus, Ohio
5. Hydrologic Monitoring at Three Mine Sites Reclaimed with Mixtures of Spoil and Coal CombustionResidues in Illinois Stephen P. Esling, Department of Geology, and Bradley C. Paul, Department of MiningEngineering, Southern Illinois University, Carbondale, Illinois
Question: (Effectiveness of down gradient wells) Did the all of the proposed down gradient wells actually turn out tobe down gradient?
Answer: There is no question that well 14 is down gradient. There is now some question whether or not well 9 or 11are down gradient. The only well that showed any elevated levels of boron was well 9 not 14. Originally the planwas to fill the entire pit but then they ran out of ash and the deficiency was filled with spoil. This resulted in some ofthe wells being too far away from the site to serve as down gradient wells. This is why we installed well 14 to insurewe had a down gradient well which is very close to the fill material. I am hoping that we can continue monitoring ofthis site long-term.
SESSION 4 INTERACTIVE DISCUSSION
Question: (Boron attenuation studies) Does anyone know about studies being done concerning the attenuation ofboron?
Answer: There are very few attenuation mechanisms for boron. The only attenuation that we know of that has anystrength is alkaline attenuation. If you are talking about boron attenuation in a very alkaline environment, we knowyou can get initial mobility followed by very high uptake and stabilization.
Question: (Regulatory prohibition below the groundwater table) I am concerned that regulations that would prohibitthe disposal of CCBs below the water table would in effect prohibit monofils at the mine site and also potentiallyprohibit the use of CCBs in underground mines because they are also below the water table. Please comment.

Answer: I am concerned about over simplifications in this area. Site specific conditions have so much to do withwhat may or may not be proper. I am a big advocate of testing to determine what is necessary for the specific site.
Answer: In Pennsylvania, with FBC ash we strongly suspect they do not cause problems below the water table. Infact, we have several demonstration projects where ash has been placed either in contact with or below the watertable. These projects are well monitored, and we have not seen any problems with any of the leachate with respectto placement below the water table.
Comment: (Texas solid waste regulations) In regards to a statement made earlier, it was said that the State of Texashas no solid waste regulations in the case where an operator owns the land. That is not correct. There are solidwaste regulations in Texas covering permitting, monitoring requirements, liners, and caps regardless of who ownsthe land.

THE USE AND DISPOSAL OF CCBS AT COAL MINES: A TECHNICAL INTERACTIVE FORUM
PARTICIPANT LIST
263
Malcolm AhrensOffice of Surface Mining501 Belle St.Alton, IL 62002(618) 463-6463 x 104
Mark BalajOffice of Surface Mining4480 Refugee Rd.Columbus, OH 43232(614) 866-0578
William W. AljoeNational Energy Technology LaboratoryP.O. Box 10940Pittsburgh, PA 15236-0940(412) 386-6569
Carole B. BallKentucky Department for Surface Mining41 Willow Run CourtFrankfort, KY 40601(502) 564-2320
Christina ArcherHoward and Howard Attorneys, PC211 Fulton Street, Suite 600Peoria, IL 61602(309) 672-1483
David L. BartschThe Ohio Valley Coal Company56854 Pleasant Ridge RoadAlledonia, OH 43902(740) 926-1351
Jim AshbyMettiki Coal Co.293 Table Rock Rd.Oakland, MD 21550(301) 334-5336
Richard BeamPennsylvania DEPBureau of Abandoned Mine ReclamationEbensburg, PA 15931(814) 472-1800
Thomas E. BaileyCinergy Corporation139 E. Fourth St., Room 552ACincinnati, OH 45201(513) 287-2596
Larry BeckSkelly and Loy2601 North Front StreetHarrisburg, PA 17110(814) 692-8682
Rita A. BajuraU.S. DOENational Energy Technology Laboratory3610 Collins Ferry RoadMorgantown, WV 26505-0880(304) 285-4511
Susan BenesCentre Analytical Laboratories331 Rebecca AvenueLeechburg, PA 15656(724) 845-7278
D. Courtney BlackWest Virginia UniversityNational Mine Land Reclamation CenterP.O. Box 6064Morgantown, WV 26506-6064(304) 293-2867
Gary F. BrendelGAI Consultants Inc.570 Beatty RoadMonroeville, PA 15146(412) 856-6400

THE USE AND DISPOSAL OF CCBS AT COAL MINES: A TECHNICAL INTERACTIVE FORUM
PARTICIPANT LIST
264
Richard BolenAnker Energy Corporation2708 Cranberry SquareMorgantown, WV 26508-9286(304) 594-1616
Lynn A. BrickettNational Energy Technology LaboratoryP.O. Box 10940626 Cochrans Mill RoadPittsburgh, PA 15236-0940(412) 386-6574
Denton BowmanWaterloo Coal Co., Inc.P.O. Box 626Jackson, OH 45640(740) 384-1378
Stephen BrownRJ LecGroup, Inc.350 Hochberg RoadMonroeville, PA 15146(724) 325-1766
Ihor N. BoykoIndiana Department of Natural Resources402 W. Washington Street, Suite 295Indianapolis, IN 46204(317) 232-1558
Dr. Tarunjit S. ButaliaThe Ohio State University470 Hitchkock Hall2070 Neil Ave.Columbus, OH 43210(614) 688-3408
Amy BoyleWyoming DEQ250 Lincoln StreetLander, WY 82520(307) 332-3047
Charles E. CallOhio Mineland Partnership5215 Fishcreek Rd.Stow, OH 44224(330) 688-5293
David B. BradshawKY Dept. for Surface Mining, AML Division2521 Lawrenceburg RoadFrankfort, KY 40601(502) 564-2141
William E. CannonAllegheny Energy Supply800 Cabin Hill DriveGreensburg, PA 15601(724) 830-5609
Carol R. CardoneNational Energy Technology LaboratoryP.O. Box 10940626 Cochrans Mill RoadPittsburgh, PA 15236-0940(412) 386-5060
Doyle CoakleyCitizen’s Coal CouncilBox 245Cowen, WV 26206(304) 226-5290
Pam CarewKentucky DSMRE#2 Hudson HollowFrankfort, KY 40601(502) 564-2340
Jim CookHanson Building Materials - AmericaOne Oxford CenterPittsburgh, PA 15219(412) 208-8865
Kevin L. CheeksConsolidation Coal Co.919 Groveland Dr.Bluefield, WV 24701540-988-1026
Daniel CrawfordCombustion Products Management150 Ridgeway DriveBridgeport, WV 26330(610) 349-8184

THE USE AND DISPOSAL OF CCBS AT COAL MINES: A TECHNICAL INTERACTIVE FORUM
PARTICIPANT LIST
265
Peter E. ChristensenSan Juan Coal CompanyP.O. Box 561Waterflow, NM 87421(505) 598-2104
Larry D. CrislipIllinois Environmental Protection Agency2309 W. Main StreetMarion IL 62966(618) 993-7200
Dr. Paul ChughSouthern Illinois UniversityDept. of Mining & Mineral Res. EngineeringCarbondale, IL 62901-6603(618) 536-6637
Deborah A. DaleIndiana Department of Natural ResourcesRR 2, P. O. Box 129Jasonville, IN 47438(812) 665-2207
Alfred L. ClayborneIL DNR, Office of Mines & Minerals, AMLR300 West Jefferson St.Springfield, IL 62709(217) 782-1297
Ram S. DasNavajo Nation, Minerals DepartmentP.O. Box 1910Window Rock, AZ 86515(520) 871-6507
Dr. Warren DickThe Ohio State UniversitySchool of Natural Resources1680 Madison Ave.Wooster, OH 44691(216) 263-3877
Tom FitzGeraldKentucky Resources CouncilP.O. Box 1070Frankfort, KY 40602(502) 875-2428
Eugene EdensTexas Lime CompanyP.O. Box 1225Hillsboro, TX 76645(800) 380-5463
Jim FlahertyAllegheny Energy800 Cabin Hill DriveGreensburg, PA 15601(724) 838-6764
Brad EdwardsOffice Surface Mining75 High StreetMorgantown, WV 26505(304) 291-4004
Kenneth H. FoitOffice of Surface Mining575 N. Pennsylvania St., Room 301Indianapolis, IN 46204(317) 226-6166 x 230
Paul J. EhretIndiana DNR, Bureau of Mine Reclamation402 W. Washington St., Room W-256Indianapolis, IN 46204-2748(317) 232-4020
Jim FordyceAmerican Electric Power1 Riverside PlazaColumbus, OH 43215(614) 223-2951
Debbie ElcockArgonne National Laboratory955 L’Efant Plaza North SW, Suite 6000Washington, DC 20024(202) 488-2451
Joe FriedlanderThe Coteau Properties Company204 Country Road 15Beulah, ND 58523(701) 873-7213
THE USE AND DISPOSAL OF CCBS AT COAL MINES: A TECHNICAL INTERACTIVE FORUM
PARTICIPANT LIST
266
Dr. Steven EslingSouthern Illinois UniversityDepartment of GeologyCarbondale, IL 62901-4324(618) 453-7363
Eric FryBlack Beauty CoalP.O. Box 312Evansville, IN 47702(812) 424-9000
Joe GaletovicOffice of Surface Mining1999 Broadway, Suite 3320Denver, CO 80202303-844-1448
David GossNew Century Energies550 15th St., Suite 900Denver, CO 80202-4256(303) 571-7075
Richard GawelConstellation Operating ServicesPanther Creek Energy Facility4 Dennison RoadNesquehoning, PA 18240-2242(570) 645-8721
Richard E. GrayGAI Consultants Inc.570 Beatty RoadMonroeville, PA 15146(412) 856-6400
Robert GerthDolet Hills Mining Venture377 Hwy 522Mansfield, LA 71052(318) 872-6300 x 120
Steven J. GroseclosePiper, Marbury, Rudnick & Wolfe LLP1200 19th Street, NWWashington, DC 20036-2412(202) 861-6455
Gary H. GessRiverton Investment CorporationP.O. Box 885Martinsburg, WV 25402(304) 267-8966 x 252
Dr. Ralph J. HaefnerUSGS Water Resources Division6480 Double Tree Ave.Columbus, OH 43229(614) 430-7751
William GilesFreeman United Coal Mining Co.Crown Mine 3P.O. Box 259Farmersville, IL 62533217-627-2161 x 228
Ronald Hamric Anker Energy Corporation2708 Cranberry SquareMorgantown, WV 26508-9286(304) 594-1616
Andrew GilmoreOffice of Surface Mining575 N. Pennsylvania St., Room 301Indianapolis, IN 46204(317) 226-6700
Bob HartmanConsol, Inc.1800 Washington RoadPittsburgh, PA 15241(412) 831-4669
THE USE AND DISPOSAL OF CCBS AT COAL MINES: A TECHNICAL INTERACTIVE FORUM
PARTICIPANT LIST
267
David J. HassettUniversity of North DakotaEnergy & Environmental Research CenterP.O. Box 9018Grand Forks, ND 58202-9018(701) 777-5192
Jack JohannesOhio DNR, Division of Mines & Reclamation439 Fair Ave., NENew Philadelphia, OH 44663330-339-2207
William J. HeldDuquesne Light Company206 Emerson DriveZelienople, PA 16063(724) 452-0591
Clifton JohnsonIllinois Department of Natural Resources300 W. Jefferson StreetSpringfield, IL 62701(217) 785-0267
Laura HildenInterior Budget Office1849 C St. NW, MS 4116Washington, DC 20240(202) 208-4962
David JohnsonKentucky DSMRE#2 Hudson HollowFrankfort, KY 40601(502) 564-2340
Rick HolbrookUSDI Office of Surface MiningWestern Regional Coordinating Center1999 Broadway, Suite 3320Denver, CO 80202(303) 844-1400 x 1491
Darrell G. KaskieSouthern Illinois University1381 Nighthawk RoadElkville, IL 62932(618) 984-2494
Fred HoltCleco Corporation963 Power Plant RoadMansfield, LA 71052(318) 871-3162
George KazonichU.S. DOENational Energy Technology LaboratoryP.O. Box 10940Pittsburgh, PA 15236-0940(412) 386-6624
Suresh JainU.S. DOENational Energy Technology Laboratory3610 Collins Ferry RoadMorgantown, WV 26507-0880(304) 285-5431
Ann KimU.S. DOE National Energy Technology LaboratoryP.O. Box 10940Pittsburgh, PA 15236-0940(412) 386-6724
Dave KirtzConsol, Inc.1800 Washington RoadPittsburgh, PA 15241(412) 831-4533
James LauritaMEPCO, Inc.P.O. Box 1209Morgantown, WV 26505(304) 296-4501

THE USE AND DISPOSAL OF CCBS AT COAL MINES: A TECHNICAL INTERACTIVE FORUM
PARTICIPANT LIST
268
Karl KoehlerTrapper Mining Inc.P.O. Box 187Craig, CO 81626(470) 824-4401 x 143
Howard S. LewisCinergy Corporation8406 Northern DriveCincinnati, OH 46123317-838-1661
Allan KolkerU.S. Geological Survey956 National Center, MS 956Reston, VA 20192(703) 648-6418
Paul LinnanPennsylvania DEP, Bur. of Abandoned MinesP.O. Box 669Knox, PA 16232(814) 797-1191
Steffan KoratichOffice of Surface Mining4480 Refugee Rd.Columbus, OH 43232(614) 866-0578
Debra Jo LittletonU.S. Department of Energy1000 Independence Ave., SW, Room 4G036, FE 26Washington, DC 20585(202) 586-3033
F. Edward KruegerPotomac Electric Power Company1900 Pennsylvania Ave., N.W.Washington, DC 20002(202) 331-6539
Lynn McCauleyOffice of Surface Mining1027 Virginia Street, ECharleston, WV 25301(304) 347-7158
Ken LadwigElectric Power Research Institute200 S. Executive Drive, Suite 101New Berlin, WI 53005(262) 789-3145
Randy Mc DonaldMcDonald Farms Ent., Inc.P.O. Box 124Timnath, CO 80547(303) 772-4577
Mark MeadeKY Dept. for Surface Mining, Div. of AML2521 Lawrenceburg RoadFrankfort, KY 40601(502) 564-2141
James R. MorrisEnviro-Power, LLCP.O. Box 703Newburg, IN 47630(812) 858-5476
Dana G. MeierICE Miller, Donadio & RyanP.O. Box 82001Indianapolis, IN 46282317-236-2383
Dr. Ishwar P. MurarkaISH, Inc.690 W. Fremont Ave., Suite 9CSunnyvale, CA 94087(408) 720-0474

THE USE AND DISPOSAL OF CCBS AT COAL MINES: A TECHNICAL INTERACTIVE FORUM
PARTICIPANT LIST
269
R. James MeiersIndianapolis Power & Light Co.1230 West Morris StreetIndianapolis, IN 46221(317) 236-2383
Harvey M. NessU.S. DOENational Energy Technology Laboratory3610 Collins Ferry RoadMorgantown, WV 26507-0880(304) 285-4172
E. Cheri MillerTennessee Valley Authority1101 Market St., LP5HChattanooga, TN 37402(423) 751-4419
Brian OsbornMEPCO, Inc.P.O. Box 1209Morgantown, WV 26505(304) 296-4501
Rodney A. MooreOffice of Surface MiningP.O. Box 886Morgantown, WV 26507(304) 291-4004
Dennis M. PalladinoPennsylvania DEP2 Public Square, 5th FloorWilkes-barre, PA 18711(570) 830-3190
Russ MoranJohn T. Boyd Co.444 Liberty Ave.4 Gateway Center, Suite 1900Pittsburgh, PA 15222(412) 562-1770
Robert A. PattonNational Energy Technology LaboratoryP.O. Box 10940Pittsburgh, PA 15236-0940(412) 386-6455
Paul PetzrickMaryland Dept. of Natural ResourcesTAWES State Office Bldg., B-3Annapolis, MD 21401(410) 260-8660
Robert RathboneUniversity of KentuckyCenter for Applied Energy Research2540 Research Park DriveLexington, KY 40511-8410(606) 257-0272
Debra Pflughoeft-HassettUniversity of North DakotaEnergy & Environmental Research CenterP.O. Box 9018Grand Forks, ND 58202-9018(701) 777-5261
Shawn RayWaterloo Coal Co., Inc.P.O. Box 626Jackson, OH 45640(740) 384-1378
J. Greg PintoIllinois DNR, Office of Mines & Minerals300 West Jefferson StreetSpringfield, IL 62709(217) 785-0398
Scott RenningerU.S. DOENational Energy Technology Laboratory3610 Collins Ferry RoadMorgantown, WV 26507-0880(304) 285-4790

THE USE AND DISPOSAL OF CCBS AT COAL MINES: A TECHNICAL INTERACTIVE FORUM
PARTICIPANT LIST
270
Nancy PointonAllegheny Energy Supply800 Cabin Hill DriveGreensburg, PA 15601(724) 830-5890
William RiderIN Natural Resources Commission5953 Honeywell DriveIndianapolis, IN 46236317-232-7082
Lenny RafalkoERM, Inc.2666 Riva Rd., Suite 200Annapolis, MD 21401(410) 266-0006
Thomas L. RoblUniversity of KentuckyCenter for Applied Energy Research2540 Research Park DriveLexington, KY 40511-8410606-257-0272
Cindy RankWest Virginia Highlands ConservancyRt 1, Box 227Rock Cave, WV 26234(304) 924-5802
James R. RoewerUtility Solid Waste Activity Group701 Pennsylvania Ave., NWWashington, D.C. 20004-2696(202) 508-5645
Harry RoofBoral Material Technologies, Inc.45 NE Loop 410, Suite 700San Antonio, TX 78216(210) 349-4069
Kent ShoemakerPennsylvania DEPP.O. Box 209Hawk Run, PA 16840(814) 342-8110
Sadananda SahuRJ LeeGroup, Inc.350 Hochberg RoadMonroeville, PA 15146724-326-1776
Bill SmithCommercial Testing & Engineering Co.P.O. Box 32Charlerioi, PA 15022(724) 483-3549
Dan SammarcoPennsylvania DEPBureau of Abandoned Mine Reclamation122 South Center St.Ebensburg, PA 15931(814) 472-1800
Stephen SmithTXU Business Services1601 Bryan Street Dallas, TX 75201(214) 812-8478
Joseph H. SchueckPennsylvania DEPP.O. Box 8460Harrisburg, PA 17105(717) 783-5649
Kevin SolieND Health Department3063 Greenwood DriveBismarck, ND 58501(701) 328-5166
Richard J. SeibelOffice of Surface Mining501 Belle St., Room 216Alton, IL 62002(618) 462-6460
Jeff StantHoosier Environmental Council520 E. 12th StreetIndianapolis, IN 46202(317) 685-8800

THE USE AND DISPOSAL OF CCBS AT COAL MINES: A TECHNICAL INTERACTIVE FORUM
PARTICIPANT LIST
271
Ralph ShankNorth American Coal Corp.Box 429Seward, PA 15954(814) 446-5631
Brenda SteeleOffice of Surface Mining1999 Broadway, Suite 3320Golden, CO 80403(303) 844-1400 x 1459
Donn SteffenThe Coteau Properties Company204 Country Road 15Beulah, ND 58523(701) 873-7227
Tekleab TsegayOklahoma Department of Mines4040 N. LincolnOklahoma City, OK 73114(405) 521-3859 x 25
Dr. Ben StuartOhio University120 Stocker CenterAthens, OH 45701740-593-9455
Sam TysonAmerican Coal Ash Association6940 South Kings Highway, Suite 207Alexandria, VA 22310-3344(703) 317-2400
David P. SzuchAllegheny Energy Supply800 Cabin Hill DriveGreensburg, PA 15601(724) 838-6211
Jason UnderbrinkBoral Material Technologies, Inc.45 NE Loop 410, Suite 700San Antonio, TX 78216(210) 349-4069
Panuwat TaerakulThe Ohio State UniversityCivil & Environmental Engineering4513 Mobile DriveColumbus, OH 43220(614) 292-7340
Tamara VandivortWest Virginia University National Mine Land Reclamation CenterP.O. Box 6064, Suite 202 NRCCEMorgantown, WV 26506-6064(304) 293-2867 x 5441
Michael TischukHanson Building Materials - America1706 Hedwig DriveAllison Park, PA 15101(412) 208-8800
Kimery VoriesOffice of Surface Mining501 Belle St.Alton, IL 62002(618) 463-6463 x 103
Gene TrioPennsylvania DEPBureau of Abandoned Mine Reclamation122 South Center StreetEbensburg, PA 15931(814) 472-1800
Marty WalkerRed Hills MineRt 3, P.O. Box 98Ackerman, MS 39785(662) 387-5200
THE USE AND DISPOSAL OF CCBS AT COAL MINES: A TECHNICAL INTERACTIVE FORUM
PARTICIPANT LIST
272
Sheila A. WaltonOffice of Surface Mining530 Gay Street, SW, Suite 500Knoxville, TN 37902(865) 545-4103 x 183
Brian WrightHoosier Environmental Council520 E. 12th StreetIndianapolis, IN 46202(317) 685-4794
Heather WattenbachERM, Inc.266 Riva Rd., Suite 200Annapolis, MD 21401(410) 266-0006
Doug YearickMintek Resources1434 Fox Hollow RoadMill Hall, PA 17751(570) 726-7935
Daniel WheelerIllinois Department of Natural Resources300 W. Jefferson StreetSpringfield, IL 62701(217) 785-0267
Andy YoungBHP1008 Delhi TerraceFarmington, NM 87401(505) 326-5105
Andrew WittnerU.S. EPA1029 Old Bay RidgeAnnapolis, MD 21403(703) 308-0496
Dr. Paul ZiemkiewiczWest Virginia UniversityNational Mine Land Reclamation CenterP.O. Box 6064, Suite 202 NRCCEMorgantown, WV 26506-6064(304) 293-2867


![[PPT]Coal Combustion - BGU · Web viewCoal Combustion Nadine Spitz Environmental Engineering Ben-Gurion University Contents What is coal? Formation, sources, applications. Coal combustion](https://img.pdfslide.us/doc/110x75/5ad704077f8b9a5b538c15a7/pptcoal-combustion-viewcoal-combustion-nadine-spitz-environmental-engineering.jpg)