Embed Size (px)
Citation preview
Rating MethodologyMarch 2007
New YorkNaomi Richman 1.212.553.0014Bart Oosterveld 1.212.553.7914John Nelson 1.212.553.4096Lisa Washburn 1.212.553.4133Robert Kurtter 1.212.553.4453Gail Sussman 1.212.553.0819San FranciscoKenneth Kurtz 1.415.274.1737
Contact Phone
The U.S. Municipal Bond Rating Scale:
Mapping to the Global Rating ScaleAnd Assigning Global Scale Ratings to Municipal Obligations
Product of Moody's Public Finance Credit Committee1
Summary Opinion
To improve the transparency of U.S. long-term municipal bond ratings, Moody's is implementing a new analyticalapproach for mapping these ratings to the global scale used to rate all bonds outside of the U.S. public finance market.We are also expanding the availability of global scale ratings to include taxable municipal transactions sold both insideand outside the U.S., and to municipal bond sectors beyond tax-backed and water/sewer debt, such as healthcare,transportation, electric power, higher education, and certain subsectors of municipal housing.
In recent years, the lines separating the U.S. municipal market from other global markets have becomeincreasingly blurred as growing numbers of "crossover" buyers invest in municipal bonds for various reasons. Themarket overlap is caused partly by U.S. municipalities issuing more debt in the taxable market, and partly by globalinvestors who may not be subject to U.S. income taxes but are nevertheless purchasing municipal bonds for portfoliodiversification and other purposes not linked to the debt's tax-exempt status.
In response to these developments, and in an effort to provide greater transparency about the meaning of ourratings, Moody's has spent the past five years refining our analytical approach for expressing the relationship betweenthe U.S. municipal scale and the global rating scale. In our November 2002 publication, "Moody's U.S. MunicipalBond Rating Scale," we discussed the existence of a separate municipal bond rating scale that takes account of themuch lower risk profile of the U.S. municipal sector as compared to the corporate sector. In April 2003, we announcedthat we would begin assigning cross-scale ratings called corporate equivalent ratings (CERs) to cross-border taxabletransactions and obligations under swaps, for credits supported by broad based taxes and water and/or sewer revenues.Since then, we have assigned CERs to seven such obligations (listed in Appendix A).
This report presents our new approach to mapping from the municipal rating scale to the global scale. Our newmethodology uses idealized municipal default rates by rating category, and a set of average loss severities upon defaultfor each municipal sector. These default rates and loss severities are based on a combination of our analysis ofhistorical defaults and near-defaults of municipal bonds, and our expectation of how various types of bonds are likely toperform in the future. The product of the default rate and the loss severity results in an expected loss value for eachrating by sector. We then use the expected loss value of the municipal rating to map to its equivalent rating on theglobal scale.
1. This report was sponsored by Moody's Public Finance Credit Committee, which sets policies that govern the rating process in Moody's Public Finance Group. The Committee was appointed by Moody's Credit Policy Committee to promote transparency and consistency in Public Finance rating practices. The membership of the Committee includes senior managers and analysts in the Public Finance Group, as well as representatives of Moody's Corporate, Structured Finance, and Credit Policy groups. For additional information on Moody's Credit Policy function, please email [email protected].
We will now use the term "Global Scale Rating" (GSR) instead of "Corporate Equivalent Rating" (CER) to referto ratings of U.S. municipal obligations on the global scale. We are making this change because Moody's uses theglobal scale not just for corporate ratings, but for financial institution, sovereign and structured finance ratingsinternationally and for all subsovereign ratings outside the United States. We will continue to assign GSRs only uponthe request of the issuer or with the issuer's consent, and only for obligations with a published rating on Moody'smunicipal rating scale.
Because many municipal investors and issuers place a high value on the fine gradations of risk provided by themunicipal rating scale, Moody's will continue to use this scale for our core U.S. municipal ratings. At the same time,the metrics used in deriving global scale ratings will enable market participants to understand better the quantitativerelationship between the municipal and global scales. Moody's will use these metrics in rating collateralized debtobligations (CDO) comprised of municipal obligations, and in analyzing the municipal exposures of financialguarantors (bond insurance companies) and managed funds. They will also be employed to analyze the U.S. municipalrisks of commercial banks and other rated entities, and in the near future will be used when assigning joint-defaultanalysis (JDA) ratings to obligations that have support from both a municipality and a letter-of-credit bank or otherentity that is rated on the global scale.
To minimize the potential for confusion between Moody's U.S. municipal scale ratings and global scale ratings, weintend to implement a "U.S. municipal scale flag" that we will attach to all ratings on the municipal scale. With such aflag in place, market participants will be able to assume that any rating that does not display the flag is rated on theglobal scale. Tax-exempt bonds that have historically been rated on the global scale, including bonds supported byfinancial guarantors, letter of credit banks and other corporate guarantors, as well as certain housing, student loan andtobacco settlement bonds, will not display the municipal scale flag. Our short-term municipal ratings will also notdisplay the flag, as these ratings are already calibrated to the global scale.
Meaning of U.S. Municipal Ratings
Unlike Moody's global scale ratings, which measure "expected loss" (default probability times loss given default),Moody's long-term municipal ratings measure the intrinsic ability and willingness of an entity to pay its debt service.In the investment grade categories, the municipal rating measures distance to distress – how likely an entity is to reachsuch a weakened financial condition that extraordinary support is needed in order to avert default. This extraordinarysupport typically is provided by another entity, usually a higher level of government, or by means of voter-enactedadditions to governmental powers. Moody's considers extraordinary support to include any form of financial, legal orregulatory relief – beyond routine or regular forms of ongoing support – that is provided by an external entity or by thevoters to assist a distressed municipal obligor in meeting its financial obligations. Routine support, such as regularoperating subsidies from a state to a public university or school district, is incorporated into municipal ratings. Themunicipal rating also incorporates actions within an issuer's own power such as legislatively enacted tax increases, one-shot revenue sources, asset sales, and other similar measures.
The risk of default rises and the need for extraordinary support increases sharply when the rating falls belowinvestment grade, and at that point the severity of potential loss becomes a more meaningful component of the rating.At rating levels below Baa3, Moody's municipal ratings do incorporate the probability of receiving extraordinarysupport. Credits that have not received extraordinary support but have some degree of fiscal stress, or have alreadyreceived extraordinary support to avoid a default will generally be rated in the Ba or B categories, depending on thedegree of fiscal distress and the likelihood that support will continue. If extraordinary support becomes a recurring,institutionalized feature of the credit situation, such as following the establishment of an emergency oversight board,the threat of default will be diminished and the rating may remain in the investment grade part of the scale. The ratinglevels of Caa and below will denote distressed credits that are in or near default, because extraordinary support isinsufficient to prevent a default or has not been provided.
Moody's uses a joint-default analysis (JDA) methodology for rating corporate, financial institution, subsovereigngovernments outside the U.S., and other obligors that may receive support from another entity in order to avoiddefault. For more information about JDA, please refer to "The Incorporation of Joint-Default Analysis into Moody'sCorporate, Financial and Government Rating Methodologies" dated February 2005. Moody's has decided not toapply JDA to municipal ratings at this time. However, when Moody's transitions to apply its updated JDAmethodology to letter of credit transactions that have joint support from a bank and a municipal credit, we intend touse the global scale ratings of municipal bonds as the rating input for such municipal credits.
2 Moody’s Rating Methodology
Three recent examples vividly illustrate the provision of extraordinary support by a senior level of government inthe U.S. municipal market. The first and most prominent is enactment of special federal and state measures to aid theGulf Coast municipalities affected by Hurricane Katrina. A second illustration is the support that Aaa-ratedWestchester County, New York has provided to the Westchester County Health Care Corporation (WCHHC, debtrated Ba2), a public benefit corporation spun off from the county in 1997 to provide essential health care services toresidents and designed to operate independently of county subsidy. When WCHHC later experienced severefinancial stress, Westchester County did not let the hospital default on its debt, but rather decided to provide directfinancial subsidies to cover operating deficits, as well as funding of capital projects at the hospital. A third example ofextraordinary support is the special line item appropriation by the Aa3-rated State of Connecticut to benefit thefinancially troubled St. Mary's Hospital in Waterbury (debt rated Ba3).
General Obligation and Water/Sewer Sectors Have Superior Risk Profile
Since 1970, defaults of Moody's-rated general obligation (GO) and water and/or sewer (water/sewer) revenuemunicipal bonds have been extremely rare. Municipalities in severe financial distress usually receive some form ofextraordinary support from another entity prior to a payment default. The Gulf Coast communities most severelyaffected by Hurricane Katrina provide a recent illustration of the occurrence of extraordinary support. Most of thesemunicipalities are likely to avoid default because they have received, or will receive, extraordinary assistance fromfederal and state levels of government. Default risk for state and local governmental issuers has also diminished overtime, as many high profile municipal defaults and near-defaults have led to governmental reforms that have reducedthe overall likelihood of default for municipal borrowers. The New York City financial crisis of the 1970's led to theconcept of a state-mandated oversight board that has become a common approach to fiscally stressed local units, andto the widespread adoption of Generally Accepted Accounting Principles by state and local governments. In the mid-1990s, the Orange County bankruptcy and other liquidity problems, stemming from certain investments in derivativesand Collateralized Mortgage Obligations, caused many states to tighten controls on investment of state and localfunds.
In our November 2002 report, "Moody's Municipal Bond Rating Scale," Moody's provided guidance on therelationship between GO and water/sewer revenue municipal bond ratings and global scale ratings. We indicated thatlarge, fiscally sound issuers in these sectors would likely map to a rating of Aaa or Aa on the global rating scale. Inthese sectors, issuers' taxing authority and monopolistic rate-setting powers generally allow them to maintain a healthydistance from distress. Even in the rare situations where a financially stressed issuer has reached the precipice ofinsolvency, the near-complete absence of defaults by Moody's-rated obligations over the past 37 years providesoverwhelming evidence that distressed situations are almost always resolved prior to a default occurring.
Despite this strong track record, the form and timing of extraordinary support is still not easily predictable.Support for a municipality under stress typically results from political and policy negotiations that are not finalizeduntil there is considerable concern that a payment default on debt service may occur. Therefore, in the past Moody'shas not restricted its GO and water/sewer ratings on the municipal scale to the lowest risk rating categories of Aaa orAa, but rather has employed the full investment grade rating scale from Aaa to Baa3, as well as occasional ratings belowinvestment grade for credits in severe distress.
Moody's Definition of DefaultMoody's definition of default includes three types of credit events:1. A missed or delayed disbursement of interest and/or principal;2. Bankruptcy, administration, legal receivership, or other legal blocks (perhaps by regulators) to the timely
payment of interest and/or principal; or3. A distressed exchange where: (i) the obligor offers debt holders a new security or package of securities that
amount to a diminished financial obligation (such as debt with a lower coupon or par amount, lower seniority, orlonger maturity); or (ii) the exchange had the apparent purpose of helping the obligor avoid default.The definition of a default is intended to capture events that change the relationship between debt holders and
the debt issuer from the relationship which was originally contracted and which subjects the bondholder to aneconomic loss. Technical defaults (covenant violations, etc.) are not included in Moody's definition of default.Secondary and tertiary defaults by a single obligor are reported only after the initial default event is believed to havebeen cured. This is to ensure that multiple defaults related to a single episode of credit distress are not over-counted.
Defaulted obligations that are enhanced by bond insurance or a letter of credit are not counted as defaults if theycontinue to be paid due to the credit enhancement.
Moody’s Rating Methodology 3
In light of the strong performance in the GO and water/sewer sectors relative to other municipal bonds, we havedecided to recalibrate our municipal scale ratings in these sectors. Credits that are not experiencing stress willgenerally be rated A3 or higher, credits experiencing some stress will be rated in the Baa category, and credits that areexperiencing significant stress and have a growing probability of default in the absence of extraordinary support will berated below investment grade. This recalibration, which will occur over time, is likely to result in the upgrade of Baa-rated credits that are not currently experiencing stress, potentially up to 50% of GO and water/sewer bonds in the Baacategory, into the A category. This transition will result in a more consistent application of the municipal scale acrossall municipal sectors, and therefore in a more accurate translation of these ratings from the municipal scale to theglobal scale.
Beyond Moody's 2002 Municipal Default Study: Risk Profile of Sectors Other than General Obligation and Water/Sewer
Many municipal credits are not backed by a GO or a water/sewer revenue pledge. These include issues backed by:• special or limited taxes or lease pledges of municipal government issuers;• public enterprises, such as airports, hospitals, housing agencies, transportation authorities, public
universities, and public power systems;• not-for-profit corporations such as private universities and hospitals; • individual stand-alone financings, such as local multi-family housing, stadiums, and start-up toll roads. Because these credits lack unlimited taxing power, usually depend to some degree on competitive market
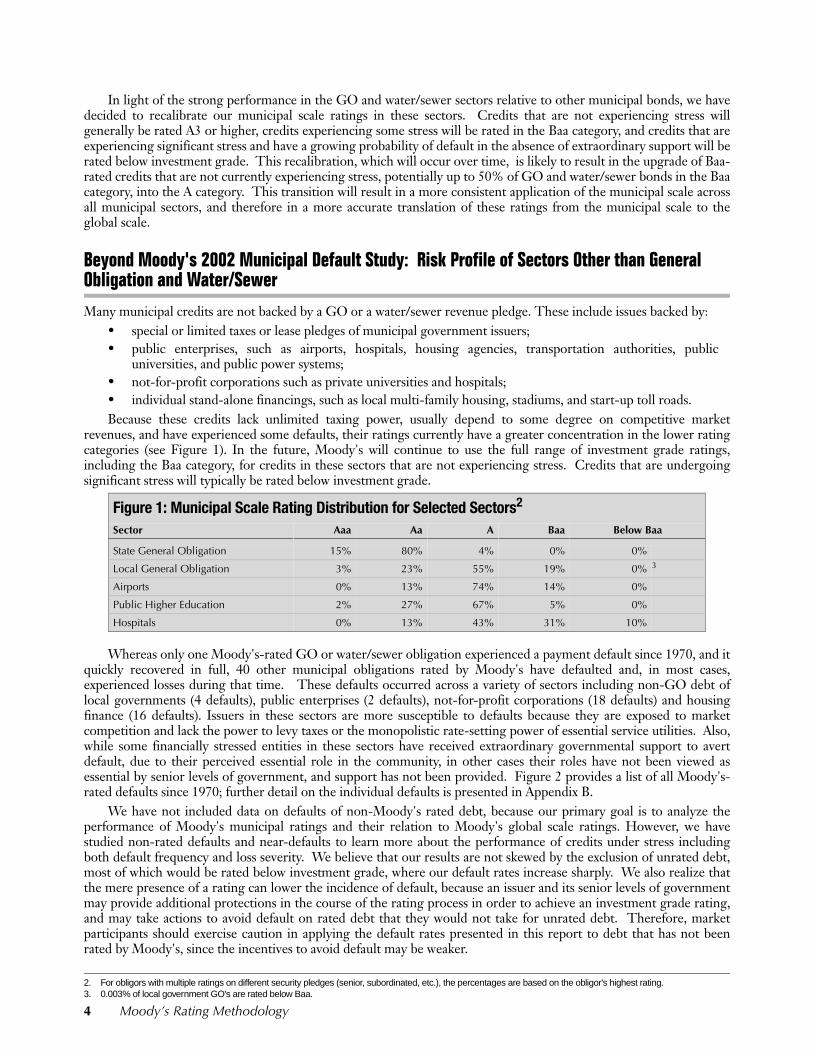
revenues, and have experienced some defaults, their ratings currently have a greater concentration in the lower ratingcategories (see Figure 1). In the future, Moody's will continue to use the full range of investment grade ratings,including the Baa category, for credits in these sectors that are not experiencing stress. Credits that are undergoingsignificant stress will typically be rated below investment grade.2 3
Whereas only one Moody's-rated GO or water/sewer obligation experienced a payment default since 1970, and itquickly recovered in full, 40 other municipal obligations rated by Moody's have defaulted and, in most cases,experienced losses during that time. These defaults occurred across a variety of sectors including non-GO debt oflocal governments (4 defaults), public enterprises (2 defaults), not-for-profit corporations (18 defaults) and housingfinance (16 defaults). Issuers in these sectors are more susceptible to defaults because they are exposed to marketcompetition and lack the power to levy taxes or the monopolistic rate-setting power of essential service utilities. Also,while some financially stressed entities in these sectors have received extraordinary governmental support to avertdefault, due to their perceived essential role in the community, in other cases their roles have not been viewed asessential by senior levels of government, and support has not been provided. Figure 2 provides a list of all Moody's-rated defaults since 1970; further detail on the individual defaults is presented in Appendix B.
We have not included data on defaults of non-Moody's rated debt, because our primary goal is to analyze theperformance of Moody's municipal ratings and their relation to Moody's global scale ratings. However, we havestudied non-rated defaults and near-defaults to learn more about the performance of credits under stress includingboth default frequency and loss severity. We believe that our results are not skewed by the exclusion of unrated debt,most of which would be rated below investment grade, where our default rates increase sharply. We also realize thatthe mere presence of a rating can lower the incidence of default, because an issuer and its senior levels of governmentmay provide additional protections in the course of the rating process in order to achieve an investment grade rating,and may take actions to avoid default on rated debt that they would not take for unrated debt. Therefore, marketparticipants should exercise caution in applying the default rates presented in this report to debt that has not beenrated by Moody's, since the incentives to avoid default may be weaker.
Figure 1: Municipal Scale Rating Distribution for Selected Sectors2
Sector Aaa Aa A Baa Below Baa
State General Obligation 15% 80% 4% 0% 0%
Local General Obligation 3% 23% 55% 19% 0% 3
Airports 0% 13% 74% 14% 0%
Public Higher Education 2% 27% 67% 5% 0%
Hospitals 0% 13% 43% 31% 10%
2. For obligors with multiple ratings on different security pledges (senior, subordinated, etc.), the percentages are based on the obligor's highest rating.3. 0.003% of local government GO's are rated below Baa.
4 Moody’s Rating Methodology
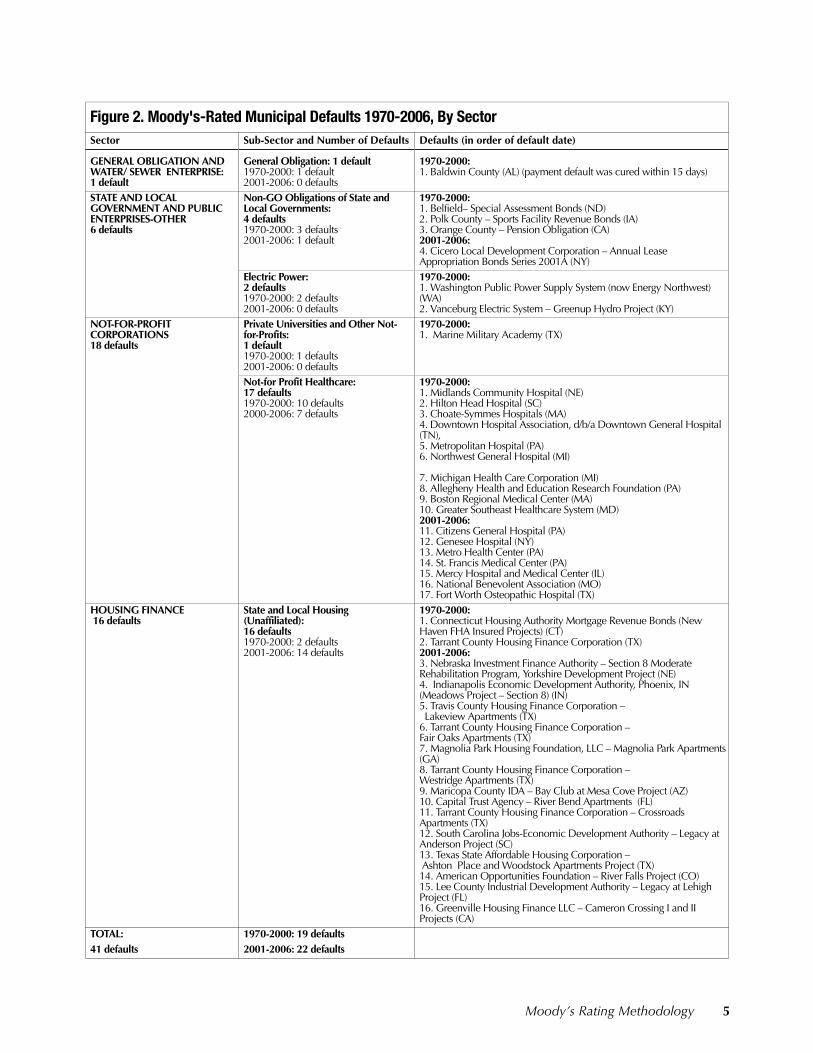
Figure 2. Moody's-Rated Municipal Defaults 1970-2006, By SectorSector Sub-Sector and Number of Defaults Defaults (in order of default date)
GENERAL OBLIGATION AND WATER/ SEWER ENTERPRISE:1 default
General Obligation: 1 default1970-2000: 1 default2001-2006: 0 defaults
1970-2000:1. Baldwin County (AL) (payment default was cured within 15 days)
STATE AND LOCAL GOVERNMENT AND PUBLIC ENTERPRISES-OTHER6 defaults
Non-GO Obligations of State and Local Governments: 4 defaults1970-2000: 3 defaults2001-2006: 1 default
1970-2000:1. Belfield– Special Assessment Bonds (ND)2. Polk County – Sports Facility Revenue Bonds (IA)3. Orange County – Pension Obligation (CA)2001-2006:4. Cicero Local Development Corporation – Annual Lease Appropriation Bonds Series 2001A (NY)
Electric Power:2 defaults1970-2000: 2 defaults2001-2006: 0 defaults
1970-2000:1. Washington Public Power Supply System (now Energy Northwest) (WA)2. Vanceburg Electric System – Greenup Hydro Project (KY)
NOT-FOR-PROFIT CORPORATIONS 18 defaults
Private Universities and Other Not-for-Profits:1 default1970-2000: 1 defaults2001-2006: 0 defaults
1970-2000:1. Marine Military Academy (TX)
Not-for Profit Healthcare:17 defaults1970-2000: 10 defaults2000-2006: 7 defaults
1970-2000:1. Midlands Community Hospital (NE) 2. Hilton Head Hospital (SC)3. Choate-Symmes Hospitals (MA)4. Downtown Hospital Association, d/b/a Downtown General Hospital (TN), 5. Metropolitan Hospital (PA)6. Northwest General Hospital (MI) 7. Michigan Health Care Corporation (MI)8. Allegheny Health and Education Research Foundation (PA) 9. Boston Regional Medical Center (MA)10. Greater Southeast Healthcare System (MD) 2001-2006:11. Citizens General Hospital (PA)12. Genesee Hospital (NY)13. Metro Health Center (PA) 14. St. Francis Medical Center (PA)15. Mercy Hospital and Medical Center (IL)16. National Benevolent Association (MO)17. Fort Worth Osteopathic Hospital (TX)
HOUSING FINANCE 16 defaults
State and Local Housing (Unaffiliated): 16 defaults1970-2000: 2 defaults2001-2006: 14 defaults
1970-2000:1. Connecticut Housing Authority Mortgage Revenue Bonds (New Haven FHA Insured Projects) (CT)2. Tarrant County Housing Finance Corporation (TX) 2001-2006:3. Nebraska Investment Finance Authority – Section 8 Moderate Rehabilitation Program, Yorkshire Development Project (NE)4. Indianapolis Economic Development Authority, Phoenix, IN (Meadows Project – Section 8) (IN)5. Travis County Housing Finance Corporation – Lakeview Apartments (TX)6. Tarrant County Housing Finance Corporation –Fair Oaks Apartments (TX)7. Magnolia Park Housing Foundation, LLC – Magnolia Park Apartments (GA)8. Tarrant County Housing Finance Corporation –Westridge Apartments (TX)9. Maricopa County IDA – Bay Club at Mesa Cove Project (AZ)10. Capital Trust Agency – River Bend Apartments (FL)11. Tarrant County Housing Finance Corporation – Crossroads Apartments (TX)12. South Carolina Jobs-Economic Development Authority – Legacy at Anderson Project (SC)13. Texas State Affordable Housing Corporation – Ashton Place and Woodstock Apartments Project (TX)14. American Opportunities Foundation – River Falls Project (CO)15. Lee County Industrial Development Authority – Legacy at Lehigh Project (FL) 16. Greenville Housing Finance LLC – Cameron Crossing I and II Projects (CA)
TOTAL: 1970-2000: 19 defaults 41 defaults 2001-2006: 22 defaults
Moody’s Rating Methodology 5
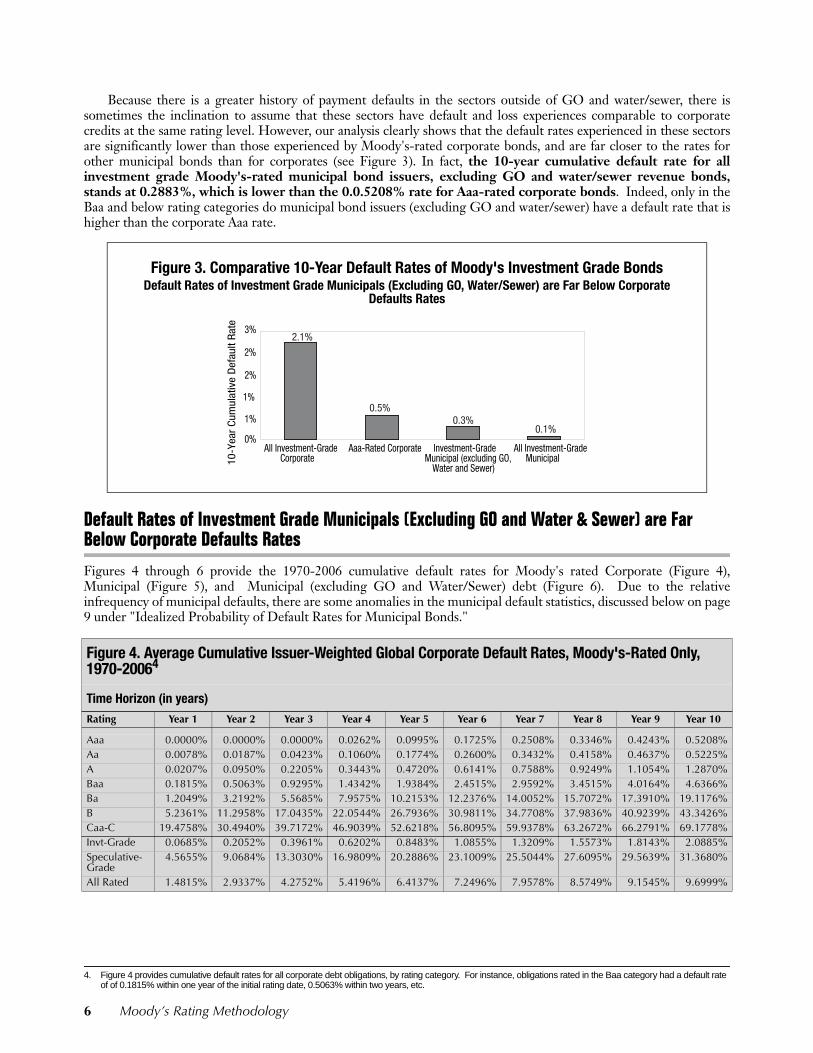
Because there is a greater history of payment defaults in the sectors outside of GO and water/sewer, there issometimes the inclination to assume that these sectors have default and loss experiences comparable to corporatecredits at the same rating level. However, our analysis clearly shows that the default rates experienced in these sectorsare significantly lower than those experienced by Moody's-rated corporate bonds, and are far closer to the rates forother municipal bonds than for corporates (see Figure 3). In fact, the 10-year cumulative default rate for allinvestment grade Moody's-rated municipal bond issuers, excluding GO and water/sewer revenue bonds,stands at 0.2883%, which is lower than the 0.0.5208% rate for Aaa-rated corporate bonds. Indeed, only in theBaa and below rating categories do municipal bond issuers (excluding GO and water/sewer) have a default rate that ishigher than the corporate Aaa rate.
Default Rates of Investment Grade Municipals (Excluding GO and Water & Sewer) are Far Below Corporate Defaults Rates
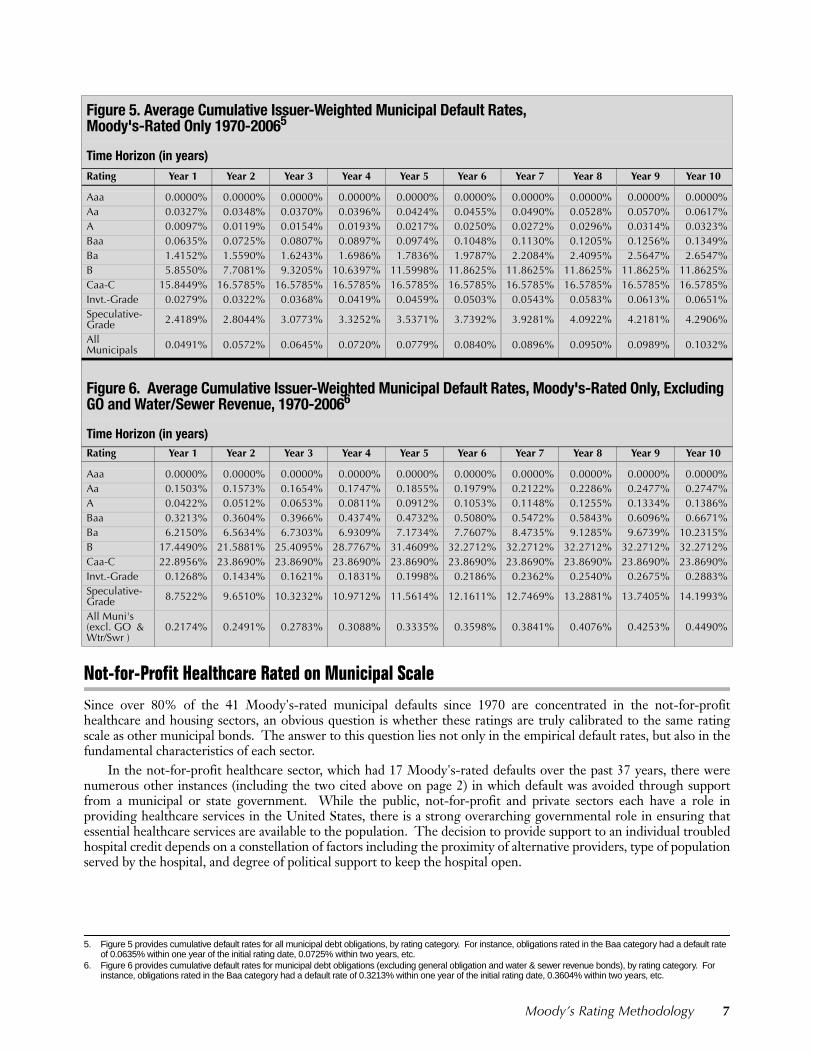
Figures 4 through 6 provide the 1970-2006 cumulative default rates for Moody's rated Corporate (Figure 4),Municipal (Figure 5), and Municipal (excluding GO and Water/Sewer) debt (Figure 6). Due to the relativeinfrequency of municipal defaults, there are some anomalies in the municipal default statistics, discussed below on page9 under "Idealized Probability of Default Rates for Municipal Bonds."4
Figure 3. Comparative 10-Year Default Rates of Moody's Investment Grade BondsDefault Rates of Investment Grade Municipals (Excluding GO, Water/Sewer) are Far Below Corporate
Defaults Rates
4. Figure 4 provides cumulative default rates for all corporate debt obligations, by rating category. For instance, obligations rated in the Baa category had a default rate of of 0.1815% within one year of the initial rating date, 0.5063% within two years, etc.
Figure 4. Average Cumulative Issuer-Weighted Global Corporate Default Rates, Moody's-Rated Only, 1970-20064
Time Horizon (in years)Rating Year 1 Year 2 Year 3 Year 4 Year 5 Year 6 Year 7 Year 8 Year 9 Year 10
Aaa 0.0000% 0.0000% 0.0000% 0.0262% 0.0995% 0.1725% 0.2508% 0.3346% 0.4243% 0.5208%Aa 0.0078% 0.0187% 0.0423% 0.1060% 0.1774% 0.2600% 0.3432% 0.4158% 0.4637% 0.5225%A 0.0207% 0.0950% 0.2205% 0.3443% 0.4720% 0.6141% 0.7588% 0.9249% 1.1054% 1.2870%Baa 0.1815% 0.5063% 0.9295% 1.4342% 1.9384% 2.4515% 2.9592% 3.4515% 4.0164% 4.6366%Ba 1.2049% 3.2192% 5.5685% 7.9575% 10.2153% 12.2376% 14.0052% 15.7072% 17.3910% 19.1176%B 5.2361% 11.2958% 17.0435% 22.0544% 26.7936% 30.9811% 34.7708% 37.9836% 40.9239% 43.3426%Caa-C 19.4758% 30.4940% 39.7172% 46.9039% 52.6218% 56.8095% 59.9378% 63.2672% 66.2791% 69.1778%Invt-Grade 0.0685% 0.2052% 0.3961% 0.6202% 0.8483% 1.0855% 1.3209% 1.5573% 1.8143% 2.0885%Speculative-Grade
4.5655% 9.0684% 13.3030% 16.9809% 20.2886% 23.1009% 25.5044% 27.6095% 29.5639% 31.3680%
All Rated 1.4815% 2.9337% 4.2752% 5.4196% 6.4137% 7.2496% 7.9578% 8.5749% 9.1545% 9.6999%
0%
1%
1%
2%
2%
3%
All Investment-GradeCorporate
Aaa-Rated Corporate Investment-GradeMunicipal (excluding GO,
Water and Sewer)
All Investment-GradeMunicipal10
-Yea
r C
umul
ativ
e D
efau
lt R
ate
2.1%
0.5%0.3%
0.1%
6 Moody’s Rating Methodology
Not-for-Profit Healthcare Rated on Municipal Scale
Since over 80% of the 41 Moody's-rated municipal defaults since 1970 are concentrated in the not-for-profithealthcare and housing sectors, an obvious question is whether these ratings are truly calibrated to the same ratingscale as other municipal bonds. The answer to this question lies not only in the empirical default rates, but also in thefundamental characteristics of each sector.5 6
In the not-for-profit healthcare sector, which had 17 Moody's-rated defaults over the past 37 years, there werenumerous other instances (including the two cited above on page 2) in which default was avoided through supportfrom a municipal or state government. While the public, not-for-profit and private sectors each have a role inproviding healthcare services in the United States, there is a strong overarching governmental role in ensuring thatessential healthcare services are available to the population. The decision to provide support to an individual troubledhospital credit depends on a constellation of factors including the proximity of alternative providers, type of populationserved by the hospital, and degree of political support to keep the hospital open.
Figure 5. Average Cumulative Issuer-Weighted Municipal Default Rates, Moody's-Rated Only 1970-20065
Time Horizon (in years)Rating Year 1 Year 2 Year 3 Year 4 Year 5 Year 6 Year 7 Year 8 Year 9 Year 10
Aaa 0.0000% 0.0000% 0.0000% 0.0000% 0.0000% 0.0000% 0.0000% 0.0000% 0.0000% 0.0000%Aa 0.0327% 0.0348% 0.0370% 0.0396% 0.0424% 0.0455% 0.0490% 0.0528% 0.0570% 0.0617%A 0.0097% 0.0119% 0.0154% 0.0193% 0.0217% 0.0250% 0.0272% 0.0296% 0.0314% 0.0323%Baa 0.0635% 0.0725% 0.0807% 0.0897% 0.0974% 0.1048% 0.1130% 0.1205% 0.1256% 0.1349%Ba 1.4152% 1.5590% 1.6243% 1.6986% 1.7836% 1.9787% 2.2084% 2.4095% 2.5647% 2.6547%B 5.8550% 7.7081% 9.3205% 10.6397% 11.5998% 11.8625% 11.8625% 11.8625% 11.8625% 11.8625%Caa-C 15.8449% 16.5785% 16.5785% 16.5785% 16.5785% 16.5785% 16.5785% 16.5785% 16.5785% 16.5785%Invt.-Grade 0.0279% 0.0322% 0.0368% 0.0419% 0.0459% 0.0503% 0.0543% 0.0583% 0.0613% 0.0651%Speculative-Grade 2.4189% 2.8044% 3.0773% 3.3252% 3.5371% 3.7392% 3.9281% 4.0922% 4.2181% 4.2906%
All Municipals 0.0491% 0.0572% 0.0645% 0.0720% 0.0779% 0.0840% 0.0896% 0.0950% 0.0989% 0.1032%
Figure 6. Average Cumulative Issuer-Weighted Municipal Default Rates, Moody's-Rated Only, Excluding GO and Water/Sewer Revenue, 1970-20066
Time Horizon (in years)Rating Year 1 Year 2 Year 3 Year 4 Year 5 Year 6 Year 7 Year 8 Year 9 Year 10
Aaa 0.0000% 0.0000% 0.0000% 0.0000% 0.0000% 0.0000% 0.0000% 0.0000% 0.0000% 0.0000%Aa 0.1503% 0.1573% 0.1654% 0.1747% 0.1855% 0.1979% 0.2122% 0.2286% 0.2477% 0.2747%A 0.0422% 0.0512% 0.0653% 0.0811% 0.0912% 0.1053% 0.1148% 0.1255% 0.1334% 0.1386%Baa 0.3213% 0.3604% 0.3966% 0.4374% 0.4732% 0.5080% 0.5472% 0.5843% 0.6096% 0.6671%Ba 6.2150% 6.5634% 6.7303% 6.9309% 7.1734% 7.7607% 8.4735% 9.1285% 9.6739% 10.2315%B 17.4490% 21.5881% 25.4095% 28.7767% 31.4609% 32.2712% 32.2712% 32.2712% 32.2712% 32.2712%Caa-C 22.8956% 23.8690% 23.8690% 23.8690% 23.8690% 23.8690% 23.8690% 23.8690% 23.8690% 23.8690%Invt.-Grade 0.1268% 0.1434% 0.1621% 0.1831% 0.1998% 0.2186% 0.2362% 0.2540% 0.2675% 0.2883%Speculative-Grade 8.7522% 9.6510% 10.3232% 10.9712% 11.5614% 12.1611% 12.7469% 13.2881% 13.7405% 14.1993%
All Muni's (excl. GO & Wtr/Swr )
0.2174% 0.2491% 0.2783% 0.3088% 0.3335% 0.3598% 0.3841% 0.4076% 0.4253% 0.4490%
5. Figure 5 provides cumulative default rates for all municipal debt obligations, by rating category. For instance, obligations rated in the Baa category had a default rate of 0.0635% within one year of the initial rating date, 0.0725% within two years, etc.
6. Figure 6 provides cumulative default rates for municipal debt obligations (excluding general obligation and water & sewer revenue bonds), by rating category. For instance, obligations rated in the Baa category had a default rate of 0.3213% within one year of the initial rating date, 0.3604% within two years, etc.
Moody’s Rating Methodology 7
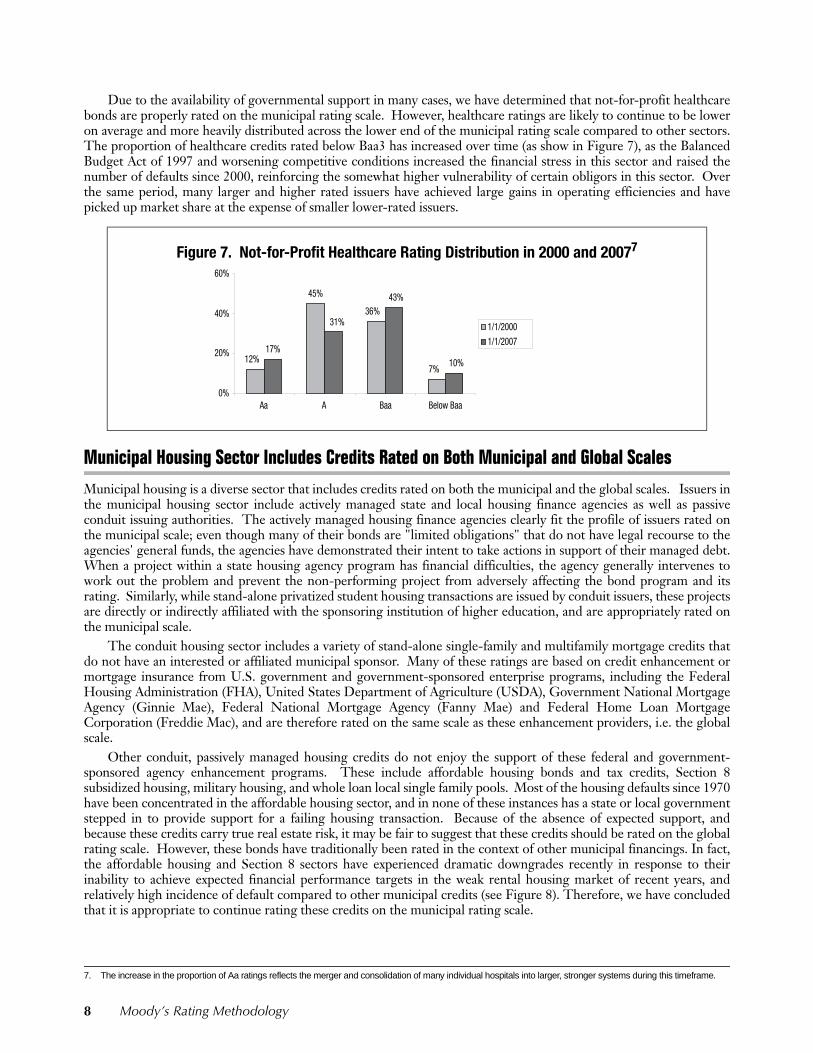
Due to the availability of governmental support in many cases, we have determined that not-for-profit healthcarebonds are properly rated on the municipal rating scale. However, healthcare ratings are likely to continue to be loweron average and more heavily distributed across the lower end of the municipal rating scale compared to other sectors.The proportion of healthcare credits rated below Baa3 has increased over time (as show in Figure 7), as the BalancedBudget Act of 1997 and worsening competitive conditions increased the financial stress in this sector and raised thenumber of defaults since 2000, reinforcing the somewhat higher vulnerability of certain obligors in this sector. Overthe same period, many larger and higher rated issuers have achieved large gains in operating efficiencies and havepicked up market share at the expense of smaller lower-rated issuers.7
Municipal Housing Sector Includes Credits Rated on Both Municipal and Global Scales
Municipal housing is a diverse sector that includes credits rated on both the municipal and the global scales. Issuers inthe municipal housing sector include actively managed state and local housing finance agencies as well as passiveconduit issuing authorities. The actively managed housing finance agencies clearly fit the profile of issuers rated onthe municipal scale; even though many of their bonds are "limited obligations" that do not have legal recourse to theagencies' general funds, the agencies have demonstrated their intent to take actions in support of their managed debt.When a project within a state housing agency program has financial difficulties, the agency generally intervenes towork out the problem and prevent the non-performing project from adversely affecting the bond program and itsrating. Similarly, while stand-alone privatized student housing transactions are issued by conduit issuers, these projectsare directly or indirectly affiliated with the sponsoring institution of higher education, and are appropriately rated onthe municipal scale.
The conduit housing sector includes a variety of stand-alone single-family and multifamily mortgage credits thatdo not have an interested or affiliated municipal sponsor. Many of these ratings are based on credit enhancement ormortgage insurance from U.S. government and government-sponsored enterprise programs, including the FederalHousing Administration (FHA), United States Department of Agriculture (USDA), Government National MortgageAgency (Ginnie Mae), Federal National Mortgage Agency (Fanny Mae) and Federal Home Loan MortgageCorporation (Freddie Mac), and are therefore rated on the same scale as these enhancement providers, i.e. the globalscale.
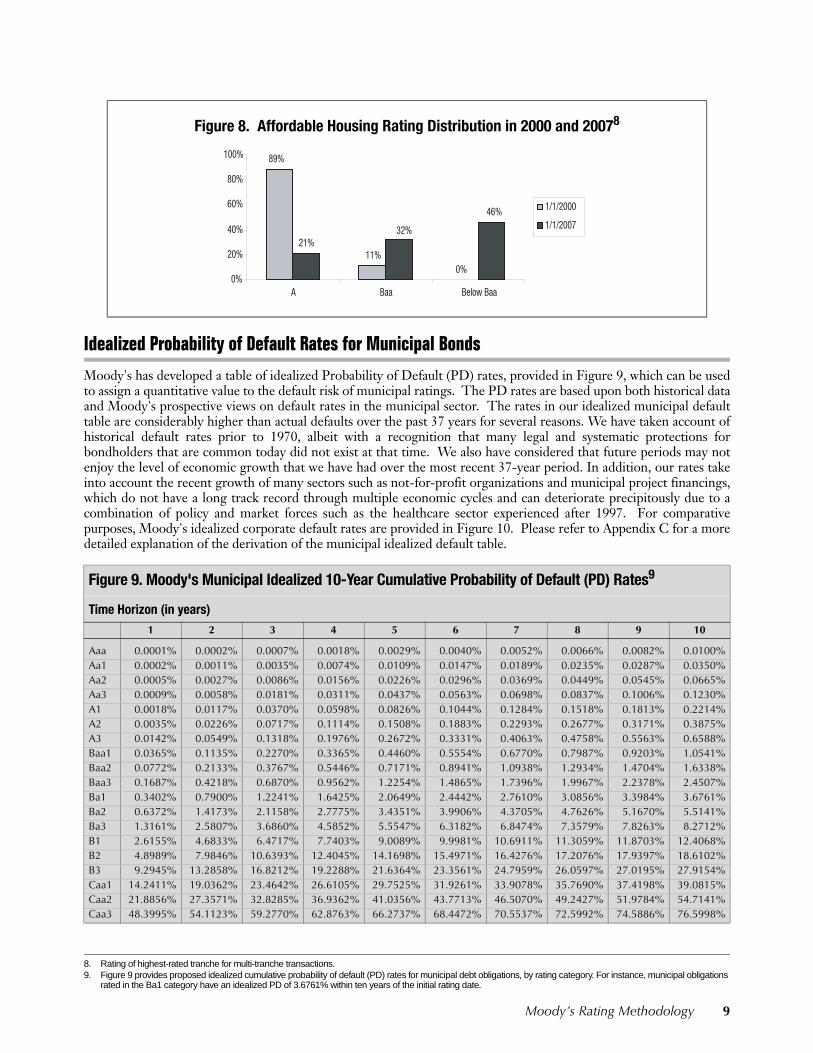
Other conduit, passively managed housing credits do not enjoy the support of these federal and government-sponsored agency enhancement programs. These include affordable housing bonds and tax credits, Section 8subsidized housing, military housing, and whole loan local single family pools. Most of the housing defaults since 1970have been concentrated in the affordable housing sector, and in none of these instances has a state or local governmentstepped in to provide support for a failing housing transaction. Because of the absence of expected support, andbecause these credits carry true real estate risk, it may be fair to suggest that these credits should be rated on the globalrating scale. However, these bonds have traditionally been rated in the context of other municipal financings. In fact,the affordable housing and Section 8 sectors have experienced dramatic downgrades recently in response to theirinability to achieve expected financial performance targets in the weak rental housing market of recent years, andrelatively high incidence of default compared to other municipal credits (see Figure 8). Therefore, we have concludedthat it is appropriate to continue rating these credits on the municipal rating scale.
7. The increase in the proportion of Aa ratings reflects the merger and consolidation of many individual hospitals into larger, stronger systems during this timeframe.
Figure 7. Not-for-Profit Healthcare Rating Distribution in 2000 and 20077
45%
17%12%
36%
7%
31%
43%
10%
0%
20%
40%
60%
Aa A Baa Below Baa
1/1/2000
1/1/2007
8 Moody’s Rating Methodology
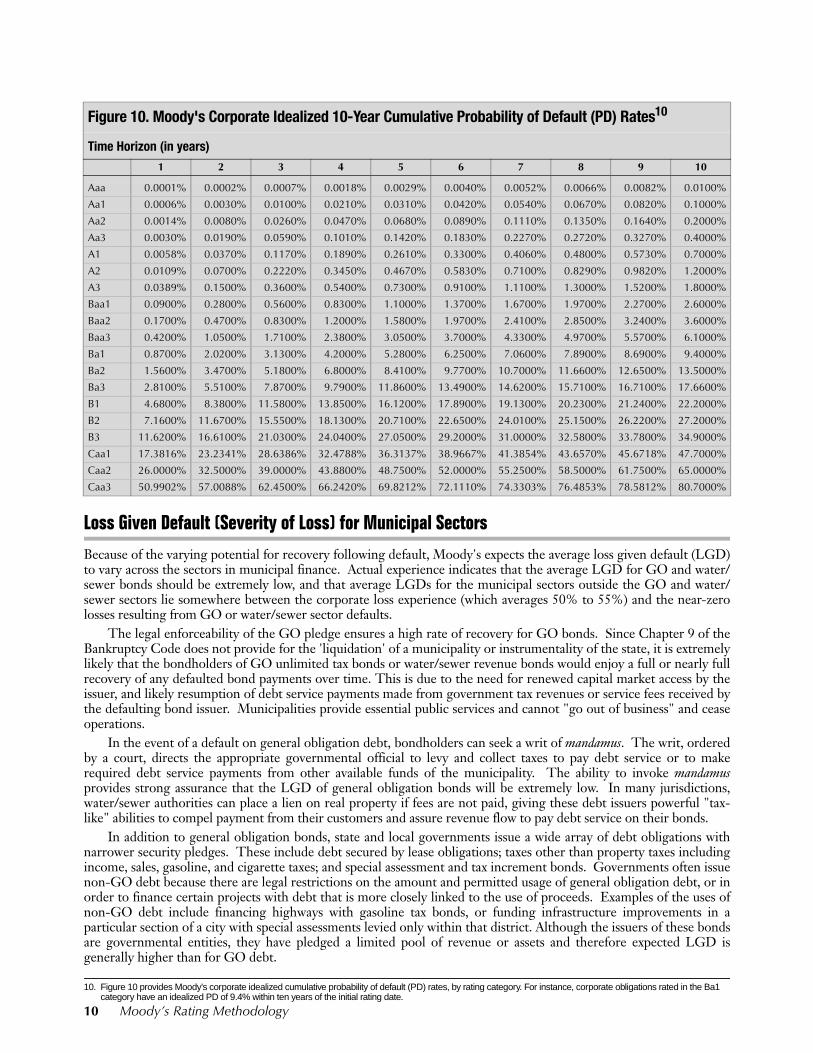
Idealized Probability of Default Rates for Municipal Bonds8
Moody's has developed a table of idealized Probability of Default (PD) rates, provided in Figure 9, which can be usedto assign a quantitative value to the default risk of municipal ratings. The PD rates are based upon both historical dataand Moody's prospective views on default rates in the municipal sector. The rates in our idealized municipal defaulttable are considerably higher than actual defaults over the past 37 years for several reasons. We have taken account ofhistorical default rates prior to 1970, albeit with a recognition that many legal and systematic protections forbondholders that are common today did not exist at that time. We also have considered that future periods may notenjoy the level of economic growth that we have had over the most recent 37-year period. In addition, our rates takeinto account the recent growth of many sectors such as not-for-profit organizations and municipal project financings,which do not have a long track record through multiple economic cycles and can deteriorate precipitously due to acombination of policy and market forces such as the healthcare sector experienced after 1997. For comparativepurposes, Moody's idealized corporate default rates are provided in Figure 10. Please refer to Appendix C for a moredetailed explanation of the derivation of the municipal idealized default table.9
Figure 8. Affordable Housing Rating Distribution in 2000 and 20078
8. Rating of highest-rated tranche for multi-tranche transactions.9. Figure 9 provides proposed idealized cumulative probability of default (PD) rates for municipal debt obligations, by rating category. For instance, municipal obligations
rated in the Ba1 category have an idealized PD of 3.6761% within ten years of the initial rating date.
Figure 9. Moody's Municipal Idealized 10-Year Cumulative Probability of Default (PD) Rates9
Time Horizon (in years)1 2 3 4 5 6 7 8 9 10
Aaa 0.0001% 0.0002% 0.0007% 0.0018% 0.0029% 0.0040% 0.0052% 0.0066% 0.0082% 0.0100%Aa1 0.0002% 0.0011% 0.0035% 0.0074% 0.0109% 0.0147% 0.0189% 0.0235% 0.0287% 0.0350%Aa2 0.0005% 0.0027% 0.0086% 0.0156% 0.0226% 0.0296% 0.0369% 0.0449% 0.0545% 0.0665%Aa3 0.0009% 0.0058% 0.0181% 0.0311% 0.0437% 0.0563% 0.0698% 0.0837% 0.1006% 0.1230%A1 0.0018% 0.0117% 0.0370% 0.0598% 0.0826% 0.1044% 0.1284% 0.1518% 0.1813% 0.2214%A2 0.0035% 0.0226% 0.0717% 0.1114% 0.1508% 0.1883% 0.2293% 0.2677% 0.3171% 0.3875%A3 0.0142% 0.0549% 0.1318% 0.1976% 0.2672% 0.3331% 0.4063% 0.4758% 0.5563% 0.6588%Baa1 0.0365% 0.1135% 0.2270% 0.3365% 0.4460% 0.5554% 0.6770% 0.7987% 0.9203% 1.0541%Baa2 0.0772% 0.2133% 0.3767% 0.5446% 0.7171% 0.8941% 1.0938% 1.2934% 1.4704% 1.6338%Baa3 0.1687% 0.4218% 0.6870% 0.9562% 1.2254% 1.4865% 1.7396% 1.9967% 2.2378% 2.4507%Ba1 0.3402% 0.7900% 1.2241% 1.6425% 2.0649% 2.4442% 2.7610% 3.0856% 3.3984% 3.6761%Ba2 0.6372% 1.4173% 2.1158% 2.7775% 3.4351% 3.9906% 4.3705% 4.7626% 5.1670% 5.5141%Ba3 1.3161% 2.5807% 3.6860% 4.5852% 5.5547% 6.3182% 6.8474% 7.3579% 7.8263% 8.2712%B1 2.6155% 4.6833% 6.4717% 7.7403% 9.0089% 9.9981% 10.6911% 11.3059% 11.8703% 12.4068%B2 4.8989% 7.9846% 10.6393% 12.4045% 14.1698% 15.4971% 16.4276% 17.2076% 17.9397% 18.6102%B3 9.2945% 13.2858% 16.8212% 19.2288% 21.6364% 23.3561% 24.7959% 26.0597% 27.0195% 27.9154%Caa1 14.2411% 19.0362% 23.4642% 26.6105% 29.7525% 31.9261% 33.9078% 35.7690% 37.4198% 39.0815%Caa2 21.8856% 27.3571% 32.8285% 36.9362% 41.0356% 43.7713% 46.5070% 49.2427% 51.9784% 54.7141%Caa3 48.3995% 54.1123% 59.2770% 62.8763% 66.2737% 68.4472% 70.5537% 72.5992% 74.5886% 76.5998%
11%21%
89%
0%
32%
46%
0%
20%
40%
60%
80%
100%
A Baa Below Baa
1/1/2000
1/1/2007
Moody’s Rating Methodology 9
10 Moody’s Rating Methodology
Loss Given Default (Severity of Loss) for Municipal Sectors
Because of the varying potential for recovery following default, Moody's expects the average loss given default (LGD)to vary across the sectors in municipal finance. Actual experience indicates that the average LGD for GO and water/sewer bonds should be extremely low, and that average LGDs for the municipal sectors outside the GO and water/sewer sectors lie somewhere between the corporate loss experience (which averages 50% to 55%) and the near-zerolosses resulting from GO or water/sewer sector defaults. 10
The legal enforceability of the GO pledge ensures a high rate of recovery for GO bonds. Since Chapter 9 of theBankruptcy Code does not provide for the 'liquidation' of a municipality or instrumentality of the state, it is extremelylikely that the bondholders of GO unlimited tax bonds or water/sewer revenue bonds would enjoy a full or nearly fullrecovery of any defaulted bond payments over time. This is due to the need for renewed capital market access by theissuer, and likely resumption of debt service payments made from government tax revenues or service fees received bythe defaulting bond issuer. Municipalities provide essential public services and cannot "go out of business" and ceaseoperations.
In the event of a default on general obligation debt, bondholders can seek a writ of mandamus. The writ, orderedby a court, directs the appropriate governmental official to levy and collect taxes to pay debt service or to makerequired debt service payments from other available funds of the municipality. The ability to invoke mandamusprovides strong assurance that the LGD of general obligation bonds will be extremely low. In many jurisdictions,water/sewer authorities can place a lien on real property if fees are not paid, giving these debt issuers powerful "tax-like" abilities to compel payment from their customers and assure revenue flow to pay debt service on their bonds.
In addition to general obligation bonds, state and local governments issue a wide array of debt obligations withnarrower security pledges. These include debt secured by lease obligations; taxes other than property taxes includingincome, sales, gasoline, and cigarette taxes; and special assessment and tax increment bonds. Governments often issuenon-GO debt because there are legal restrictions on the amount and permitted usage of general obligation debt, or inorder to finance certain projects with debt that is more closely linked to the use of proceeds. Examples of the uses ofnon-GO debt include financing highways with gasoline tax bonds, or funding infrastructure improvements in aparticular section of a city with special assessments levied only within that district. Although the issuers of these bondsare governmental entities, they have pledged a limited pool of revenue or assets and therefore expected LGD isgenerally higher than for GO debt.
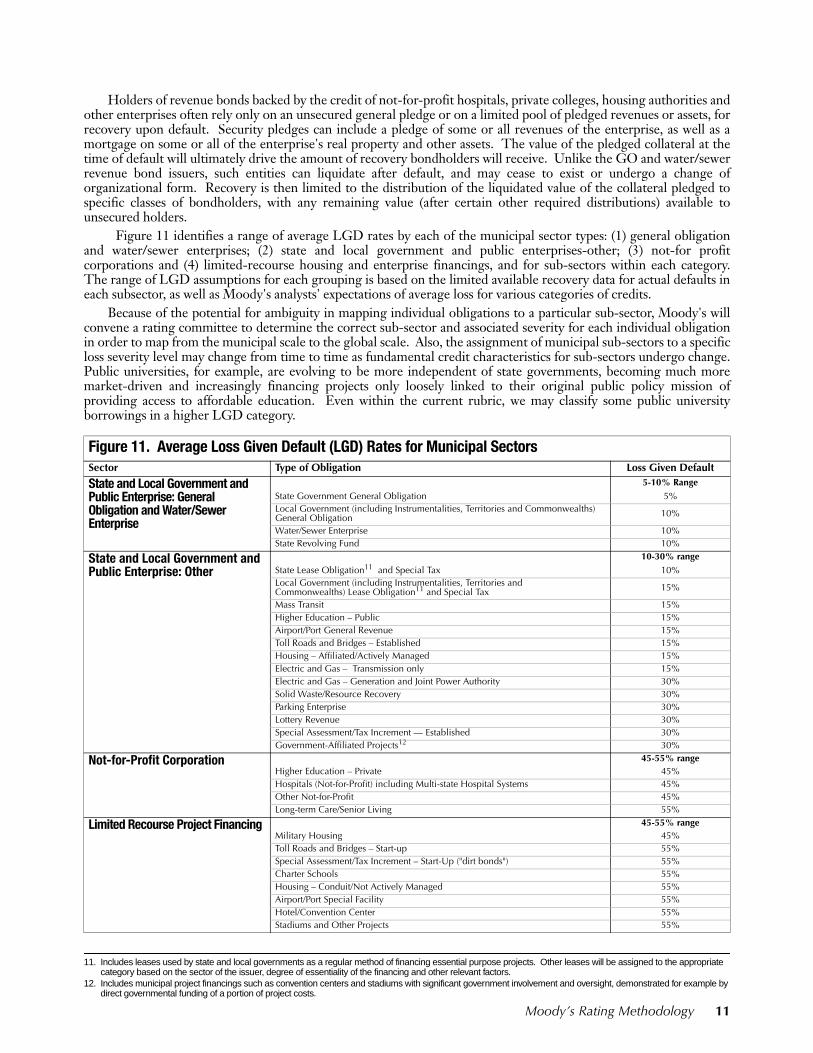
Figure 10. Moody's Corporate Idealized 10-Year Cumulative Probability of Default (PD) Rates10
Time Horizon (in years)1 2 3 4 5 6 7 8 9 10
Aaa 0.0001% 0.0002% 0.0007% 0.0018% 0.0029% 0.0040% 0.0052% 0.0066% 0.0082% 0.0100%
Aa1 0.0006% 0.0030% 0.0100% 0.0210% 0.0310% 0.0420% 0.0540% 0.0670% 0.0820% 0.1000%
Aa2 0.0014% 0.0080% 0.0260% 0.0470% 0.0680% 0.0890% 0.1110% 0.1350% 0.1640% 0.2000%
Aa3 0.0030% 0.0190% 0.0590% 0.1010% 0.1420% 0.1830% 0.2270% 0.2720% 0.3270% 0.4000%
A1 0.0058% 0.0370% 0.1170% 0.1890% 0.2610% 0.3300% 0.4060% 0.4800% 0.5730% 0.7000%
A2 0.0109% 0.0700% 0.2220% 0.3450% 0.4670% 0.5830% 0.7100% 0.8290% 0.9820% 1.2000%
A3 0.0389% 0.1500% 0.3600% 0.5400% 0.7300% 0.9100% 1.1100% 1.3000% 1.5200% 1.8000%
Baa1 0.0900% 0.2800% 0.5600% 0.8300% 1.1000% 1.3700% 1.6700% 1.9700% 2.2700% 2.6000%
Baa2 0.1700% 0.4700% 0.8300% 1.2000% 1.5800% 1.9700% 2.4100% 2.8500% 3.2400% 3.6000%
Baa3 0.4200% 1.0500% 1.7100% 2.3800% 3.0500% 3.7000% 4.3300% 4.9700% 5.5700% 6.1000%
Ba1 0.8700% 2.0200% 3.1300% 4.2000% 5.2800% 6.2500% 7.0600% 7.8900% 8.6900% 9.4000%
Ba2 1.5600% 3.4700% 5.1800% 6.8000% 8.4100% 9.7700% 10.7000% 11.6600% 12.6500% 13.5000%
Ba3 2.8100% 5.5100% 7.8700% 9.7900% 11.8600% 13.4900% 14.6200% 15.7100% 16.7100% 17.6600%
B1 4.6800% 8.3800% 11.5800% 13.8500% 16.1200% 17.8900% 19.1300% 20.2300% 21.2400% 22.2000%
B2 7.1600% 11.6700% 15.5500% 18.1300% 20.7100% 22.6500% 24.0100% 25.1500% 26.2200% 27.2000%
B3 11.6200% 16.6100% 21.0300% 24.0400% 27.0500% 29.2000% 31.0000% 32.5800% 33.7800% 34.9000%
Caa1 17.3816% 23.2341% 28.6386% 32.4788% 36.3137% 38.9667% 41.3854% 43.6570% 45.6718% 47.7000%
Caa2 26.0000% 32.5000% 39.0000% 43.8800% 48.7500% 52.0000% 55.2500% 58.5000% 61.7500% 65.0000%
Caa3 50.9902% 57.0088% 62.4500% 66.2420% 69.8212% 72.1110% 74.3303% 76.4853% 78.5812% 80.7000%
10. Figure 10 provides Moody's corporate idealized cumulative probability of default (PD) rates, by rating category. For instance, corporate obligations rated in the Ba1 category have an idealized PD of 9.4% within ten years of the initial rating date.
Holders of revenue bonds backed by the credit of not-for-profit hospitals, private colleges, housing authorities andother enterprises often rely only on an unsecured general pledge or on a limited pool of pledged revenues or assets, forrecovery upon default. Security pledges can include a pledge of some or all revenues of the enterprise, as well as amortgage on some or all of the enterprise's real property and other assets. The value of the pledged collateral at thetime of default will ultimately drive the amount of recovery bondholders will receive. Unlike the GO and water/sewerrevenue bond issuers, such entities can liquidate after default, and may cease to exist or undergo a change oforganizational form. Recovery is then limited to the distribution of the liquidated value of the collateral pledged tospecific classes of bondholders, with any remaining value (after certain other required distributions) available tounsecured holders.
Figure 11 identifies a range of average LGD rates by each of the municipal sector types: (1) general obligationand water/sewer enterprises; (2) state and local government and public enterprises-other; (3) not-for profitcorporations and (4) limited-recourse housing and enterprise financings, and for sub-sectors within each category.The range of LGD assumptions for each grouping is based on the limited available recovery data for actual defaults ineach subsector, as well as Moody's analysts' expectations of average loss for various categories of credits.
Because of the potential for ambiguity in mapping individual obligations to a particular sub-sector, Moody's willconvene a rating committee to determine the correct sub-sector and associated severity for each individual obligationin order to map from the municipal scale to the global scale. Also, the assignment of municipal sub-sectors to a specificloss severity level may change from time to time as fundamental credit characteristics for sub-sectors undergo change.Public universities, for example, are evolving to be more independent of state governments, becoming much moremarket-driven and increasingly financing projects only loosely linked to their original public policy mission ofproviding access to affordable education. Even within the current rubric, we may classify some public universityborrowings in a higher LGD category.11 12
11. Includes leases used by state and local governments as a regular method of financing essential purpose projects. Other leases will be assigned to the appropriate category based on the sector of the issuer, degree of essentiality of the financing and other relevant factors.
12. Includes municipal project financings such as convention centers and stadiums with significant government involvement and oversight, demonstrated for example by direct governmental funding of a portion of project costs.
Figure 11. Average Loss Given Default (LGD) Rates for Municipal SectorsSector Type of Obligation Loss Given Default
State and Local Government and Public Enterprise: General Obligation and Water/Sewer Enterprise
5-10% RangeState Government General Obligation 5%Local Government (including Instrumentalities, Territories and Commonwealths) General Obligation 10%
Water/Sewer Enterprise 10%State Revolving Fund 10%
State and Local Government and Public Enterprise: Other
10-30% rangeState Lease Obligation11 and Special Tax 10%Local Government (including Instrumentalities, Territories andCommonwealths) Lease Obligation11 and Special Tax 15%
Mass Transit 15%Higher Education – Public 15%Airport/Port General Revenue 15%Toll Roads and Bridges – Established 15%Housing – Affiliated/Actively Managed 15%Electric and Gas – Transmission only 15%Electric and Gas – Generation and Joint Power Authority 30%Solid Waste/Resource Recovery 30%Parking Enterprise 30%Lottery Revenue 30%Special Assessment/Tax Increment — Established 30%Government-Affiliated Projects12 30%
Not-for-Profit Corporation 45-55% rangeHigher Education – Private 45%Hospitals (Not-for-Profit) including Multi-state Hospital Systems 45%Other Not-for-Profit 45%Long-term Care/Senior Living 55%
Limited Recourse Project Financing 45-55% rangeMilitary Housing 45%Toll Roads and Bridges – Start-up 55%Special Assessment/Tax Increment – Start-Up ("dirt bonds") 55%Charter Schools 55%Housing – Conduit/Not Actively Managed 55%Airport/Port Special Facility 55%Hotel/Convention Center 55%Stadiums and Other Projects 55%
Moody’s Rating Methodology 11
Mapping Municipal Ratings to the Global Scale
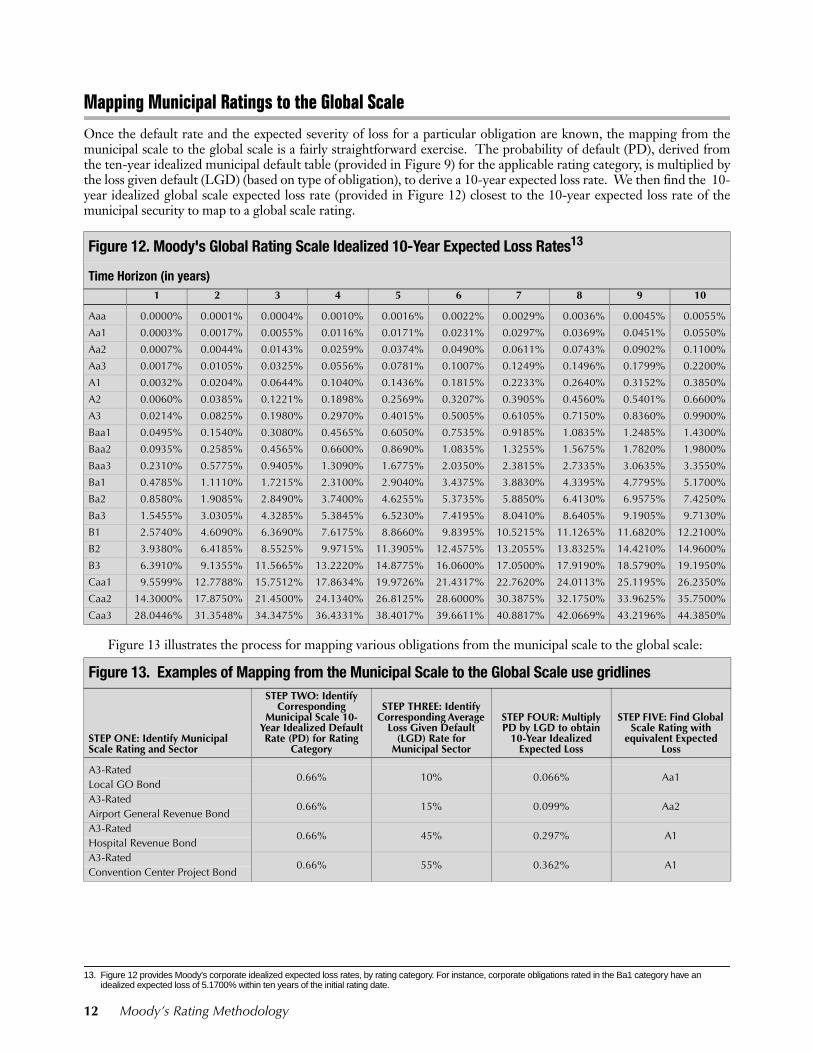
Once the default rate and the expected severity of loss for a particular obligation are known, the mapping from themunicipal scale to the global scale is a fairly straightforward exercise. The probability of default (PD), derived fromthe ten-year idealized municipal default table (provided in Figure 9) for the applicable rating category, is multiplied bythe loss given default (LGD) (based on type of obligation), to derive a 10-year expected loss rate. We then find the 10-year idealized global scale expected loss rate (provided in Figure 12) closest to the 10-year expected loss rate of themunicipal security to map to a global scale rating. 13
Figure 13 illustrates the process for mapping various obligations from the municipal scale to the global scale:
13. Figure 12 provides Moody's corporate idealized expected loss rates, by rating category. For instance, corporate obligations rated in the Ba1 category have an idealized expected loss of 5.1700% within ten years of the initial rating date.
Figure 12. Moody's Global Rating Scale Idealized 10-Year Expected Loss Rates13
Time Horizon (in years)1 2 3 4 5 6 7 8 9 10
Aaa 0.0000% 0.0001% 0.0004% 0.0010% 0.0016% 0.0022% 0.0029% 0.0036% 0.0045% 0.0055%
Aa1 0.0003% 0.0017% 0.0055% 0.0116% 0.0171% 0.0231% 0.0297% 0.0369% 0.0451% 0.0550%
Aa2 0.0007% 0.0044% 0.0143% 0.0259% 0.0374% 0.0490% 0.0611% 0.0743% 0.0902% 0.1100%
Aa3 0.0017% 0.0105% 0.0325% 0.0556% 0.0781% 0.1007% 0.1249% 0.1496% 0.1799% 0.2200%
A1 0.0032% 0.0204% 0.0644% 0.1040% 0.1436% 0.1815% 0.2233% 0.2640% 0.3152% 0.3850%
A2 0.0060% 0.0385% 0.1221% 0.1898% 0.2569% 0.3207% 0.3905% 0.4560% 0.5401% 0.6600%
A3 0.0214% 0.0825% 0.1980% 0.2970% 0.4015% 0.5005% 0.6105% 0.7150% 0.8360% 0.9900%
Baa1 0.0495% 0.1540% 0.3080% 0.4565% 0.6050% 0.7535% 0.9185% 1.0835% 1.2485% 1.4300%
Baa2 0.0935% 0.2585% 0.4565% 0.6600% 0.8690% 1.0835% 1.3255% 1.5675% 1.7820% 1.9800%
Baa3 0.2310% 0.5775% 0.9405% 1.3090% 1.6775% 2.0350% 2.3815% 2.7335% 3.0635% 3.3550%
Ba1 0.4785% 1.1110% 1.7215% 2.3100% 2.9040% 3.4375% 3.8830% 4.3395% 4.7795% 5.1700%
Ba2 0.8580% 1.9085% 2.8490% 3.7400% 4.6255% 5.3735% 5.8850% 6.4130% 6.9575% 7.4250%
Ba3 1.5455% 3.0305% 4.3285% 5.3845% 6.5230% 7.4195% 8.0410% 8.6405% 9.1905% 9.7130%
B1 2.5740% 4.6090% 6.3690% 7.6175% 8.8660% 9.8395% 10.5215% 11.1265% 11.6820% 12.2100%
B2 3.9380% 6.4185% 8.5525% 9.9715% 11.3905% 12.4575% 13.2055% 13.8325% 14.4210% 14.9600%
B3 6.3910% 9.1355% 11.5665% 13.2220% 14.8775% 16.0600% 17.0500% 17.9190% 18.5790% 19.1950%
Caa1 9.5599% 12.7788% 15.7512% 17.8634% 19.9726% 21.4317% 22.7620% 24.0113% 25.1195% 26.2350%
Caa2 14.3000% 17.8750% 21.4500% 24.1340% 26.8125% 28.6000% 30.3875% 32.1750% 33.9625% 35.7500%
Caa3 28.0446% 31.3548% 34.3475% 36.4331% 38.4017% 39.6611% 40.8817% 42.0669% 43.2196% 44.3850%
Figure 13. Examples of Mapping from the Municipal Scale to the Global Scale use gridlines
STEP ONE: Identify Municipal Scale Rating and Sector
STEP TWO: Identify Corresponding
Municipal Scale 10-Year Idealized Default Rate (PD) for Rating
Category
STEP THREE: Identify Corresponding Average
Loss Given Default (LGD) Rate for
Municipal Sector
STEP FOUR: Multiply PD by LGD to obtain
10-Year Idealized Expected Loss
STEP FIVE: Find Global Scale Rating with
equivalent Expected Loss
A3-Rated 0.66% 10% 0.066% Aa1
Local GO BondA3-Rated
0.66% 15% 0.099% Aa2Airport General Revenue BondA3-Rated
0.66% 45% 0.297% A1Hospital Revenue BondA3-Rated
0.66% 55% 0.362% A1Convention Center Project Bond
12 Moody’s Rating Methodology
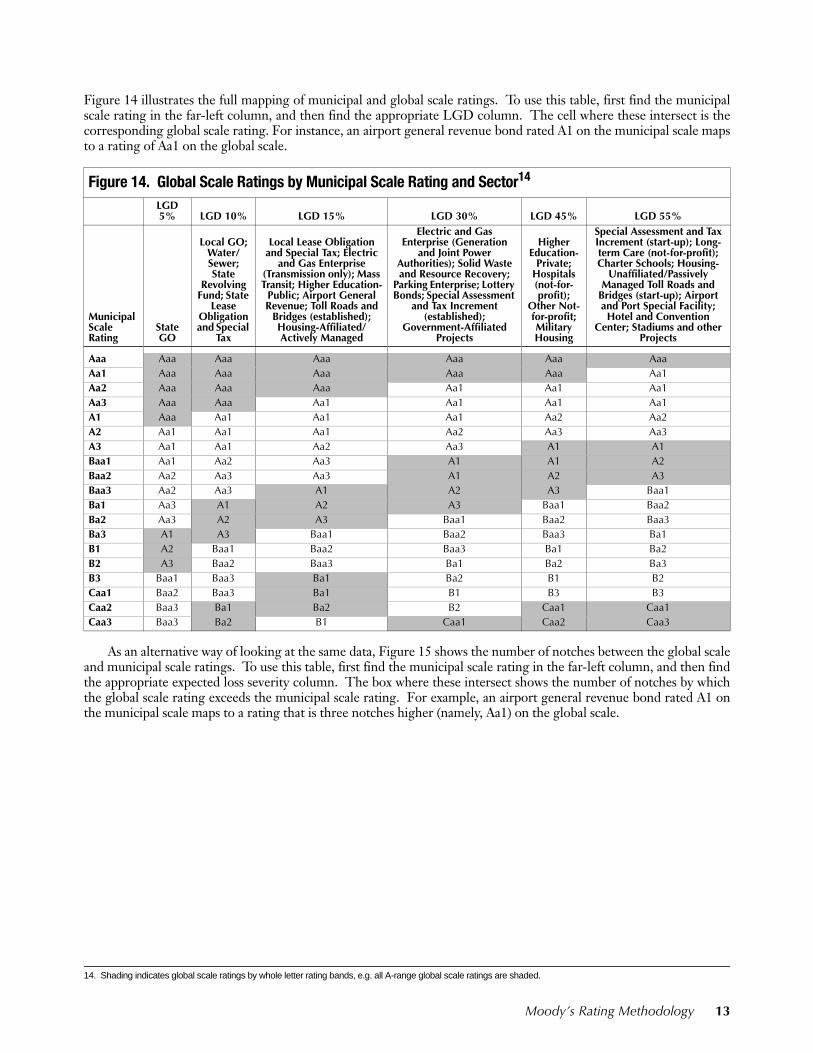
Figure 14 illustrates the full mapping of municipal and global scale ratings. To use this table, first find the municipalscale rating in the far-left column, and then find the appropriate LGD column. The cell where these intersect is thecorresponding global scale rating. For instance, an airport general revenue bond rated A1 on the municipal scale mapsto a rating of Aa1 on the global scale.14
As an alternative way of looking at the same data, Figure 15 shows the number of notches between the global scaleand municipal scale ratings. To use this table, first find the municipal scale rating in the far-left column, and then findthe appropriate expected loss severity column. The box where these intersect shows the number of notches by whichthe global scale rating exceeds the municipal scale rating. For example, an airport general revenue bond rated A1 onthe municipal scale maps to a rating that is three notches higher (namely, Aa1) on the global scale.
14. Shading indicates global scale ratings by whole letter rating bands, e.g. all A-range global scale ratings are shaded.
Figure 14. Global Scale Ratings by Municipal Scale Rating and Sector14
LGD 5% LGD 10% LGD 15% LGD 30% LGD 45% LGD 55%
Municipal Scale Rating
State GO
Local GO; Water/ Sewer; State
Revolving Fund; State
Lease Obligation and Special
Tax
Local Lease Obligation and Special Tax; Electric
and Gas Enterprise (Transmission only); Mass Transit; Higher Education-
Public; Airport General Revenue; Toll Roads and
Bridges (established); Housing-Affiliated/Actively Managed
Electric and Gas Enterprise (Generation
and Joint Power Authorities); Solid Waste and Resource Recovery;
Parking Enterprise; Lottery Bonds; Special Assessment
and Tax Increment (established);
Government-Affiliated Projects
Higher Education-
Private; Hospitals (not-for-profit);
Other Not-for-profit; Military Housing
Special Assessment and Tax Increment (start-up); Long-term Care (not-for-profit); Charter Schools; Housing-
Unaffiliated/Passively Managed Toll Roads and
Bridges (start-up); Airport and Port Special Facility; Hotel and Convention
Center; Stadiums and other Projects
Aaa Aaa Aaa Aaa Aaa Aaa AaaAa1 Aaa Aaa Aaa Aaa Aaa Aa1Aa2 Aaa Aaa Aaa Aa1 Aa1 Aa1Aa3 Aaa Aaa Aa1 Aa1 Aa1 Aa1A1 Aaa Aa1 Aa1 Aa1 Aa2 Aa2A2 Aa1 Aa1 Aa1 Aa2 Aa3 Aa3A3 Aa1 Aa1 Aa2 Aa3 A1 A1Baa1 Aa1 Aa2 Aa3 A1 A1 A2Baa2 Aa2 Aa3 Aa3 A1 A2 A3Baa3 Aa2 Aa3 A1 A2 A3 Baa1Ba1 Aa3 A1 A2 A3 Baa1 Baa2Ba2 Aa3 A2 A3 Baa1 Baa2 Baa3Ba3 A1 A3 Baa1 Baa2 Baa3 Ba1B1 A2 Baa1 Baa2 Baa3 Ba1 Ba2B2 A3 Baa2 Baa3 Ba1 Ba2 Ba3B3 Baa1 Baa3 Ba1 Ba2 B1 B2Caa1 Baa2 Baa3 Ba1 B1 B3 B3Caa2 Baa3 Ba1 Ba2 B2 Caa1 Caa1Caa3 Baa3 Ba2 B1 Caa1 Caa2 Caa3
Moody’s Rating Methodology 13
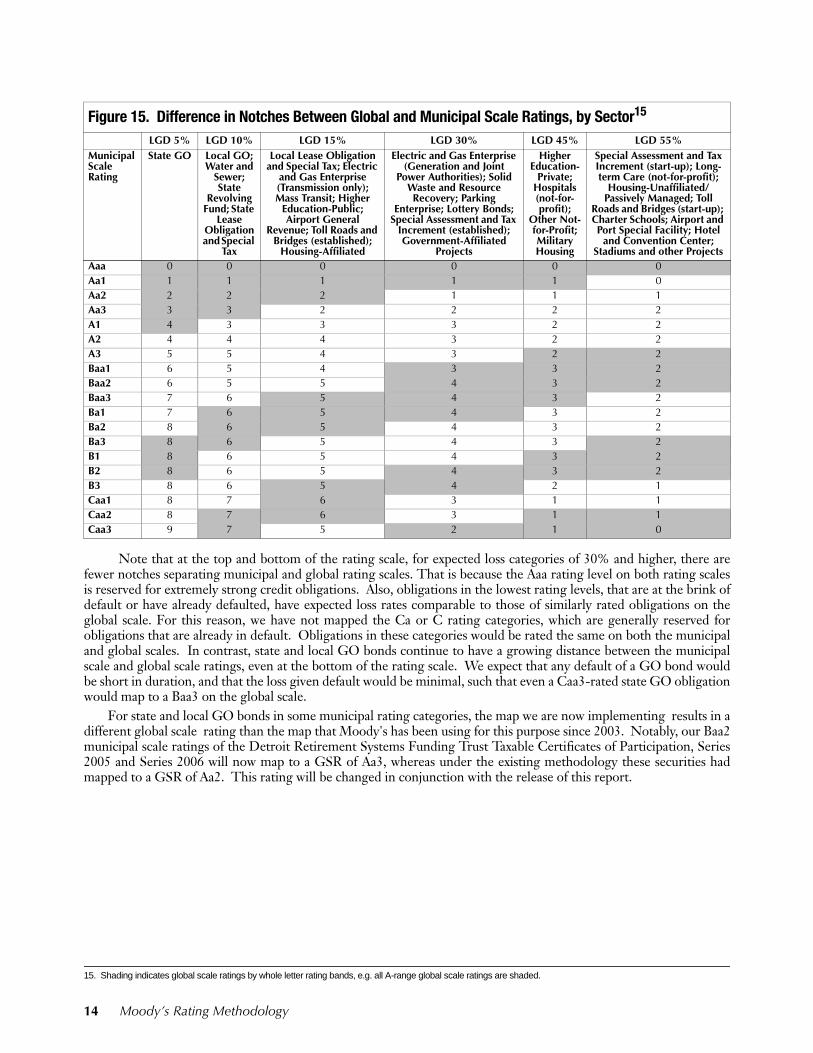
15Note that at the top and bottom of the rating scale, for expected loss categories of 30% and higher, there arefewer notches separating municipal and global rating scales. That is because the Aaa rating level on both rating scalesis reserved for extremely strong credit obligations. Also, obligations in the lowest rating levels, that are at the brink ofdefault or have already defaulted, have expected loss rates comparable to those of similarly rated obligations on theglobal scale. For this reason, we have not mapped the Ca or C rating categories, which are generally reserved forobligations that are already in default. Obligations in these categories would be rated the same on both the municipaland global scales. In contrast, state and local GO bonds continue to have a growing distance between the municipalscale and global scale ratings, even at the bottom of the rating scale. We expect that any default of a GO bond wouldbe short in duration, and that the loss given default would be minimal, such that even a Caa3-rated state GO obligationwould map to a Baa3 on the global scale.
For state and local GO bonds in some municipal rating categories, the map we are now implementing results in adifferent global scale rating than the map that Moody's has been using for this purpose since 2003. Notably, our Baa2municipal scale ratings of the Detroit Retirement Systems Funding Trust Taxable Certificates of Participation, Series2005 and Series 2006 will now map to a GSR of Aa3, whereas under the existing methodology these securities hadmapped to a GSR of Aa2. This rating will be changed in conjunction with the release of this report.
Figure 15. Difference in Notches Between Global and Municipal Scale Ratings, by Sector15
LGD 5% LGD 10% LGD 15% LGD 30% LGD 45% LGD 55%Municipal Scale Rating
State GO Local GO; Water and
Sewer; State
Revolving Fund; State
Lease Obligation and Special
Tax
Local Lease Obligation and Special Tax; Electric
and Gas Enterprise (Transmission only); Mass Transit; Higher
Education-Public; Airport General
Revenue; Toll Roads and Bridges (established);
Housing-Affiliated
Electric and Gas Enterprise (Generation and Joint
Power Authorities); Solid Waste and Resource Recovery; Parking
Enterprise; Lottery Bonds; Special Assessment and Tax
Increment (established); Government-Affiliated
Projects
Higher Education-
Private; Hospitals (not-for-profit);
Other Not-for-Profit; Military Housing
Special Assessment and Tax Increment (start-up); Long-term Care (not-for-profit);
Housing-Unaffiliated/Passively Managed; Toll
Roads and Bridges (start-up); Charter Schools; Airport and Port Special Facility; Hotel
and Convention Center; Stadiums and other Projects
Aaa 0 0 0 0 0 0Aa1 1 1 1 1 1 0Aa2 2 2 2 1 1 1Aa3 3 3 2 2 2 2A1 4 3 3 3 2 2A2 4 4 4 3 2 2A3 5 5 4 3 2 2Baa1 6 5 4 3 3 2Baa2 6 5 5 4 3 2Baa3 7 6 5 4 3 2Ba1 7 6 5 4 3 2Ba2 8 6 5 4 3 2Ba3 8 6 5 4 3 2B1 8 6 5 4 3 2B2 8 6 5 4 3 2B3 8 6 5 4 2 1Caa1 8 7 6 3 1 1Caa2 8 7 6 3 1 1Caa3 9 7 5 2 1 0
15. Shading indicates global scale ratings by whole letter rating bands, e.g. all A-range global scale ratings are shaded.
14 Moody’s Rating Methodology
Moody’s Rating Methodology 15
Assignment of Global Scale Ratings (formerly referred to as Corporate Equivalent Ratings)
In our 2002 default study publication, Moody's recognized both the difference between the municipal and globalrating scales and the need in certain circumstances to provide a comparable rating for a municipal debt obligation onthe global scale. The circumstances which Moody's thought warranted a rating on the global scale were limited to theissuance of municipal debt in non-U.S. taxable markets and to swap obligations entered into by municipalities withnon-municipal entities rated on the global scale. The rationale for this practice was to increase the transparency of ourratings and mitigate economic inefficiencies that could arise due to the existence of two distinct rating scales. Forexample, many interest rate swaps between municipalities and financial institutions have bilateral credit terms, such asa requirement for posting of collateral upon downgrade to various rating levels, yet the two counterparties are rated ondifferent rating scales.
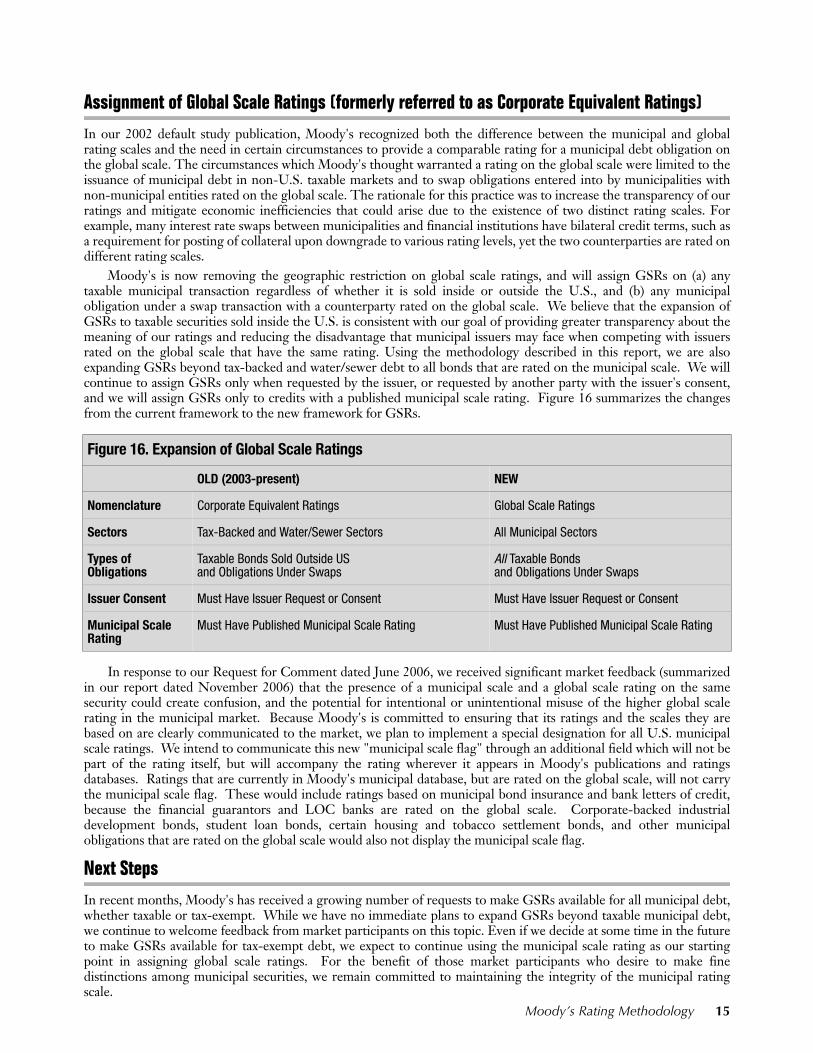
Moody's is now removing the geographic restriction on global scale ratings, and will assign GSRs on (a) anytaxable municipal transaction regardless of whether it is sold inside or outside the U.S., and (b) any municipalobligation under a swap transaction with a counterparty rated on the global scale. We believe that the expansion ofGSRs to taxable securities sold inside the U.S. is consistent with our goal of providing greater transparency about themeaning of our ratings and reducing the disadvantage that municipal issuers may face when competing with issuersrated on the global scale that have the same rating. Using the methodology described in this report, we are alsoexpanding GSRs beyond tax-backed and water/sewer debt to all bonds that are rated on the municipal scale. We willcontinue to assign GSRs only when requested by the issuer, or requested by another party with the issuer's consent,and we will assign GSRs only to credits with a published municipal scale rating. Figure 16 summarizes the changesfrom the current framework to the new framework for GSRs.
In response to our Request for Comment dated June 2006, we received significant market feedback (summarizedin our report dated November 2006) that the presence of a municipal scale and a global scale rating on the samesecurity could create confusion, and the potential for intentional or unintentional misuse of the higher global scalerating in the municipal market. Because Moody's is committed to ensuring that its ratings and the scales they arebased on are clearly communicated to the market, we plan to implement a special designation for all U.S. municipalscale ratings. We intend to communicate this new "municipal scale flag" through an additional field which will not bepart of the rating itself, but will accompany the rating wherever it appears in Moody's publications and ratingsdatabases. Ratings that are currently in Moody's municipal database, but are rated on the global scale, will not carrythe municipal scale flag. These would include ratings based on municipal bond insurance and bank letters of credit,because the financial guarantors and LOC banks are rated on the global scale. Corporate-backed industrialdevelopment bonds, student loan bonds, certain housing and tobacco settlement bonds, and other municipalobligations that are rated on the global scale would also not display the municipal scale flag.
Next Steps
In recent months, Moody's has received a growing number of requests to make GSRs available for all municipal debt,whether taxable or tax-exempt. While we have no immediate plans to expand GSRs beyond taxable municipal debt,we continue to welcome feedback from market participants on this topic. Even if we decide at some time in the futureto make GSRs available for tax-exempt debt, we expect to continue using the municipal scale rating as our startingpoint in assigning global scale ratings. For the benefit of those market participants who desire to make finedistinctions among municipal securities, we remain committed to maintaining the integrity of the municipal ratingscale.
Figure 16. Expansion of Global Scale Ratings
OLD (2003-present) NEW
Nomenclature Corporate Equivalent Ratings Global Scale Ratings
Sectors Tax-Backed and Water/Sewer Sectors All Municipal Sectors
Types of Obligations
Taxable Bonds Sold Outside US and Obligations Under Swaps
All Taxable Bonds and Obligations Under Swaps
Issuer Consent Must Have Issuer Request or Consent Must Have Issuer Request or Consent
Municipal Scale Rating
Must Have Published Municipal Scale Rating Must Have Published Municipal Scale Rating
16 Moody’s Rating Methodology
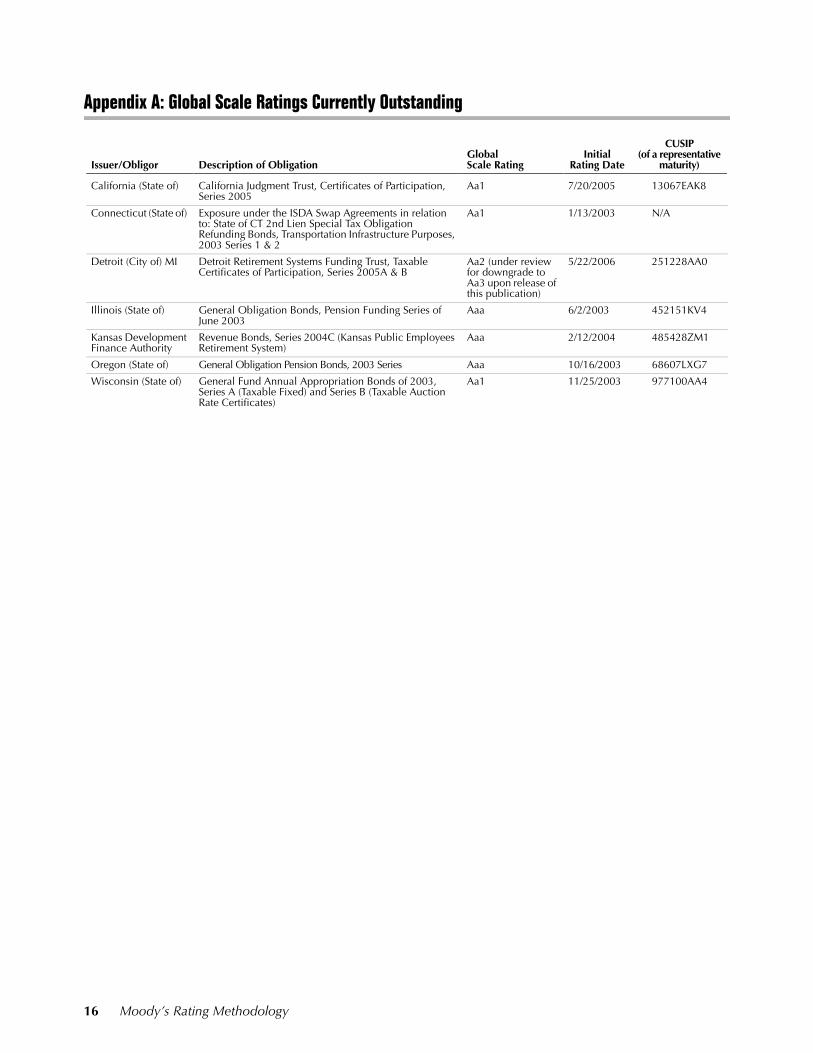
Appendix A: Global Scale Ratings Currently Outstanding
Issuer/Obligor Description of ObligationGlobal Scale Rating
Initial Rating Date
CUSIP(of a representative
maturity)
California (State of) California Judgment Trust, Certificates of Participation, Series 2005
Aa1 7/20/2005 13067EAK8
Connecticut (State of) Exposure under the ISDA Swap Agreements in relation to: State of CT 2nd Lien Special Tax Obligation Refunding Bonds, Transportation Infrastructure Purposes, 2003 Series 1 & 2
Aa1 1/13/2003 N/A
Detroit (City of) MI Detroit Retirement Systems Funding Trust, Taxable Certificates of Participation, Series 2005A & B
Aa2 (under review for downgrade to Aa3 upon release of this publication)
5/22/2006 251228AA0
Illinois (State of) General Obligation Bonds, Pension Funding Series of June 2003
Aaa 6/2/2003 452151KV4
Kansas Development Finance Authority
Revenue Bonds, Series 2004C (Kansas Public Employees Retirement System)
Aaa 2/12/2004 485428ZM1
Oregon (State of) General Obligation Pension Bonds, 2003 Series Aaa 10/16/2003 68607LXG7
Wisconsin (State of) General Fund Annual Appropriation Bonds of 2003, Series A (Taxable Fixed) and Series B (Taxable Auction Rate Certificates)
Aa1 11/25/2003 977100AA4
Moody’s Rating Methodology 17
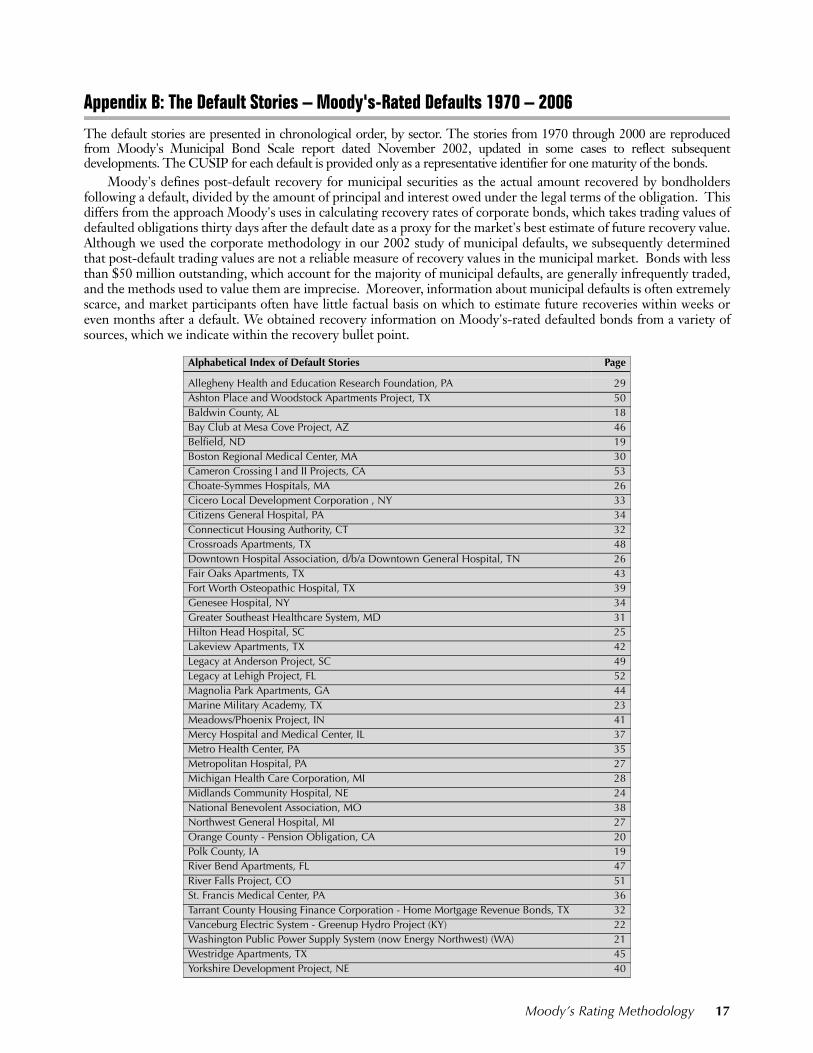
Appendix B: The Default Stories – Moody's-Rated Defaults 1970 – 2006
The default stories are presented in chronological order, by sector. The stories from 1970 through 2000 are reproducedfrom Moody's Municipal Bond Scale report dated November 2002, updated in some cases to reflect subsequentdevelopments. The CUSIP for each default is provided only as a representative identifier for one maturity of the bonds.
Moody's defines post-default recovery for municipal securities as the actual amount recovered by bondholdersfollowing a default, divided by the amount of principal and interest owed under the legal terms of the obligation. Thisdiffers from the approach Moody's uses in calculating recovery rates of corporate bonds, which takes trading values ofdefaulted obligations thirty days after the default date as a proxy for the market's best estimate of future recovery value.Although we used the corporate methodology in our 2002 study of municipal defaults, we subsequently determinedthat post-default trading values are not a reliable measure of recovery values in the municipal market. Bonds with lessthan $50 million outstanding, which account for the majority of municipal defaults, are generally infrequently traded,and the methods used to value them are imprecise. Moreover, information about municipal defaults is often extremelyscarce, and market participants often have little factual basis on which to estimate future recoveries within weeks oreven months after a default. We obtained recovery information on Moody's-rated defaulted bonds from a variety ofsources, which we indicate within the recovery bullet point.
Alphabetical Index of Default Stories Page
Allegheny Health and Education Research Foundation, PA 29Ashton Place and Woodstock Apartments Project, TX 50Baldwin County, AL 18Bay Club at Mesa Cove Project, AZ 46Belfield, ND 19Boston Regional Medical Center, MA 30Cameron Crossing I and II Projects, CA 53Choate-Symmes Hospitals, MA 26Cicero Local Development Corporation , NY 33Citizens General Hospital, PA 34Connecticut Housing Authority, CT 32Crossroads Apartments, TX 48Downtown Hospital Association, d/b/a Downtown General Hospital, TN 26Fair Oaks Apartments, TX 43Fort Worth Osteopathic Hospital, TX 39Genesee Hospital, NY 34Greater Southeast Healthcare System, MD 31Hilton Head Hospital, SC 25Lakeview Apartments, TX 42Legacy at Anderson Project, SC 49Legacy at Lehigh Project, FL 52Magnolia Park Apartments, GA 44Marine Military Academy, TX 23Meadows/Phoenix Project, IN 41Mercy Hospital and Medical Center, IL 37Metro Health Center, PA 35Metropolitan Hospital, PA 27Michigan Health Care Corporation, MI 28Midlands Community Hospital, NE 24National Benevolent Association, MO 38Northwest General Hospital, MI 27Orange County - Pension Obligation, CA 20Polk County, IA 19River Bend Apartments, FL 47River Falls Project, CO 51St. Francis Medical Center, PA 36Tarrant County Housing Finance Corporation - Home Mortgage Revenue Bonds, TX 32Vanceburg Electric System - Greenup Hydro Project (KY) 22Washington Public Power Supply System (now Energy Northwest) (WA) 21Westridge Apartments, TX 45Yorkshire Development Project, NE 40
18 Moody’s Rating Methodology
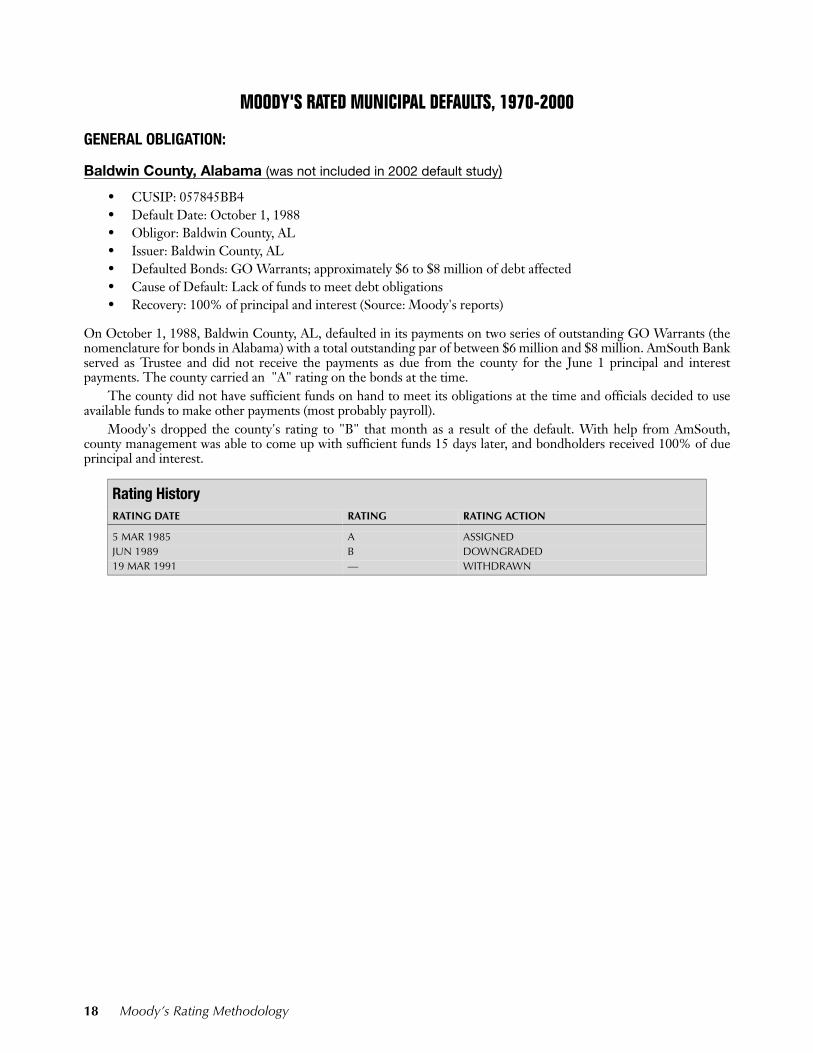
MOODY'S RATED MUNICIPAL DEFAULTS, 1970-2000
GENERAL OBLIGATION:
Baldwin County, Alabama (was not included in 2002 default study)
• CUSIP: 057845BB4• Default Date: October 1, 1988• Obligor: Baldwin County, AL• Issuer: Baldwin County, AL• Defaulted Bonds: GO Warrants; approximately $6 to $8 million of debt affected• Cause of Default: Lack of funds to meet debt obligations• Recovery: 100% of principal and interest (Source: Moody's reports)
On October 1, 1988, Baldwin County, AL, defaulted in its payments on two series of outstanding GO Warrants (thenomenclature for bonds in Alabama) with a total outstanding par of between $6 million and $8 million. AmSouth Bankserved as Trustee and did not receive the payments as due from the county for the June 1 principal and interestpayments. The county carried an "A" rating on the bonds at the time.
The county did not have sufficient funds on hand to meet its obligations at the time and officials decided to useavailable funds to make other payments (most probably payroll).
Moody's dropped the county's rating to "B" that month as a result of the default. With help from AmSouth,county management was able to come up with sufficient funds 15 days later, and bondholders received 100% of dueprincipal and interest.
Rating HistoryRATING DATE RATING RATING ACTION
5 MAR 1985 A ASSIGNEDJUN 1989 B DOWNGRADED19 MAR 1991 — WITHDRAWN
Moody’s Rating Methodology 19
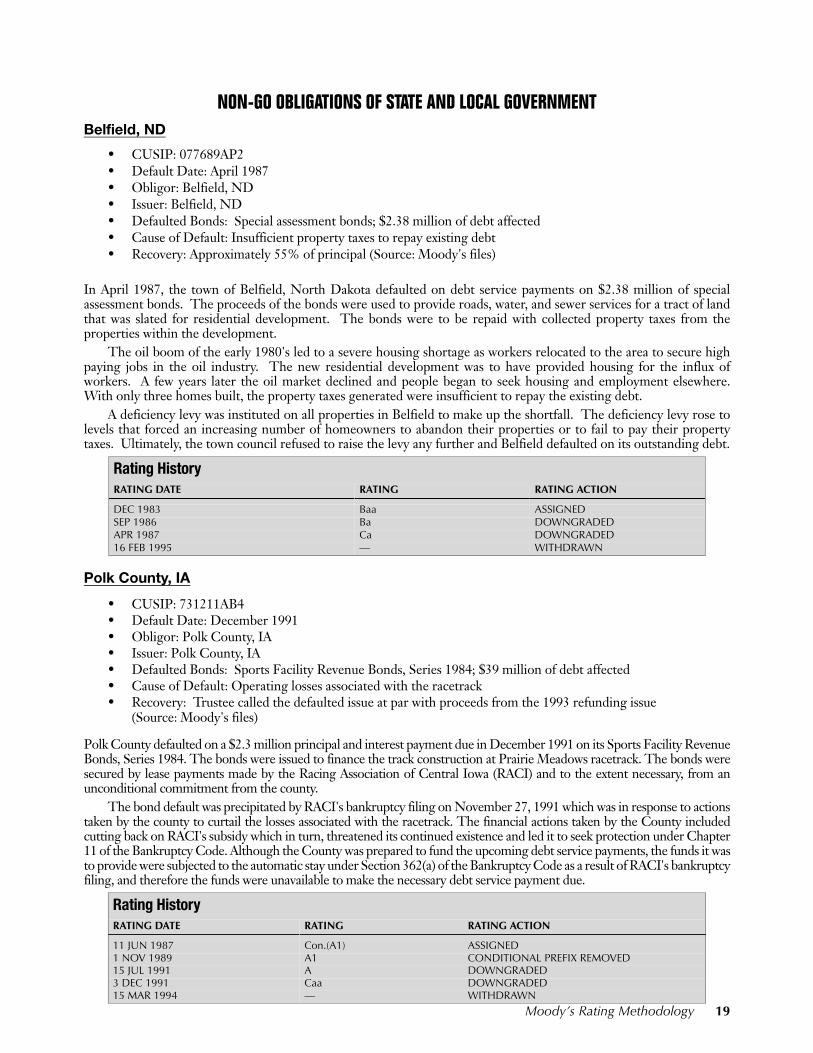
NON-GO OBLIGATIONS OF STATE AND LOCAL GOVERNMENTBelfield, ND
• CUSIP: 077689AP2• Default Date: April 1987• Obligor: Belfield, ND• Issuer: Belfield, ND• Defaulted Bonds: Special assessment bonds; $2.38 million of debt affected• Cause of Default: Insufficient property taxes to repay existing debt• Recovery: Approximately 55% of principal (Source: Moody's files)
In April 1987, the town of Belfield, North Dakota defaulted on debt service payments on $2.38 million of specialassessment bonds. The proceeds of the bonds were used to provide roads, water, and sewer services for a tract of landthat was slated for residential development. The bonds were to be repaid with collected property taxes from theproperties within the development.
The oil boom of the early 1980's led to a severe housing shortage as workers relocated to the area to secure highpaying jobs in the oil industry. The new residential development was to have provided housing for the influx ofworkers. A few years later the oil market declined and people began to seek housing and employment elsewhere.With only three homes built, the property taxes generated were insufficient to repay the existing debt.
A deficiency levy was instituted on all properties in Belfield to make up the shortfall. The deficiency levy rose tolevels that forced an increasing number of homeowners to abandon their properties or to fail to pay their propertytaxes. Ultimately, the town council refused to raise the levy any further and Belfield defaulted on its outstanding debt.
Polk County, IA
• CUSIP: 731211AB4• Default Date: December 1991• Obligor: Polk County, IA• Issuer: Polk County, IA• Defaulted Bonds: Sports Facility Revenue Bonds, Series 1984; $39 million of debt affected• Cause of Default: Operating losses associated with the racetrack• Recovery: Trustee called the defaulted issue at par with proceeds from the 1993 refunding issue
(Source: Moody's files)
Polk County defaulted on a $2.3 million principal and interest payment due in December 1991 on its Sports Facility RevenueBonds, Series 1984. The bonds were issued to finance the track construction at Prairie Meadows racetrack. The bonds weresecured by lease payments made by the Racing Association of Central Iowa (RACI) and to the extent necessary, from anunconditional commitment from the county.
The bond default was precipitated by RACI's bankruptcy filing on November 27, 1991 which was in response to actionstaken by the county to curtail the losses associated with the racetrack. The financial actions taken by the County includedcutting back on RACI's subsidy which in turn, threatened its continued existence and led it to seek protection under Chapter11 of the Bankruptcy Code. Although the County was prepared to fund the upcoming debt service payments, the funds it wasto provide were subjected to the automatic stay under Section 362(a) of the Bankruptcy Code as a result of RACI's bankruptcyfiling, and therefore the funds were unavailable to make the necessary debt service payment due.
Rating HistoryRATING DATE RATING RATING ACTION
DEC 1983 Baa ASSIGNEDSEP 1986 Ba DOWNGRADEDAPR 1987 Ca DOWNGRADED16 FEB 1995 — WITHDRAWN
Rating HistoryRATING DATE RATING RATING ACTION
11 JUN 1987 Con.(A1) ASSIGNED1 NOV 1989 A1 CONDITIONAL PREFIX REMOVED15 JUL 1991 A DOWNGRADED3 DEC 1991 Caa DOWNGRADED15 MAR 1994 — WITHDRAWN
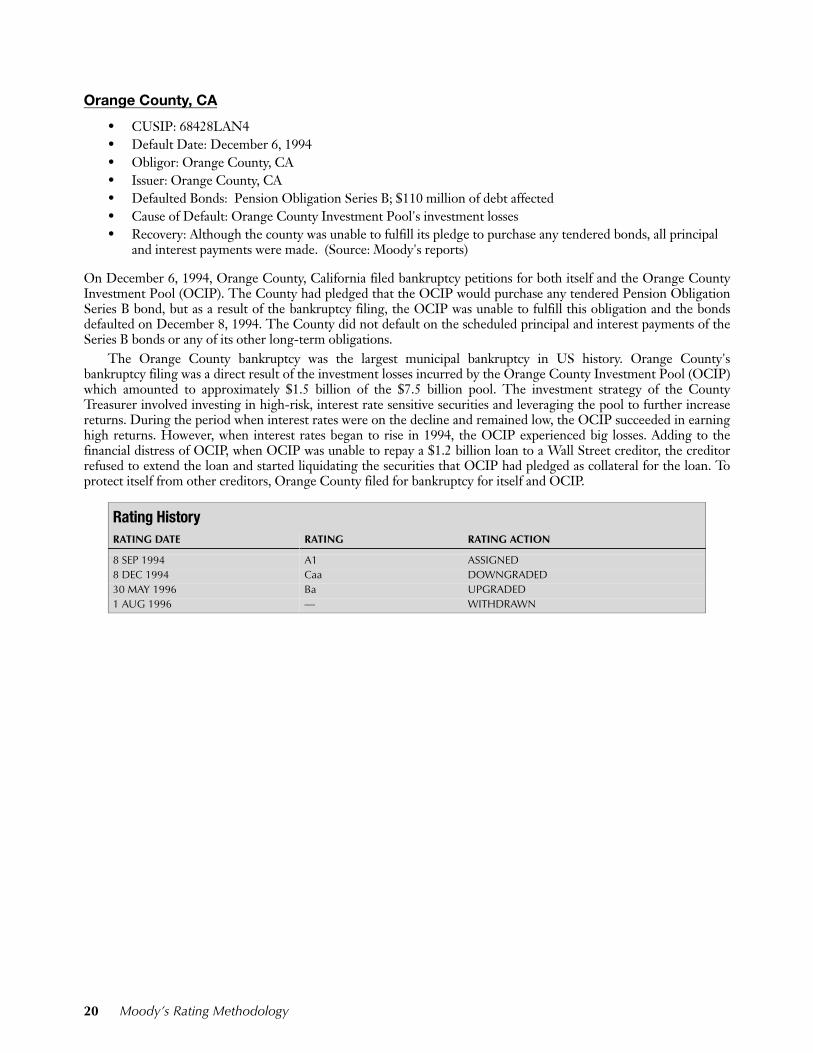
Orange County, CA
• CUSIP: 68428LAN4 • Default Date: December 6, 1994• Obligor: Orange County, CA• Issuer: Orange County, CA• Defaulted Bonds: Pension Obligation Series B; $110 million of debt affected• Cause of Default: Orange County Investment Pool's investment losses• Recovery: Although the county was unable to fulfill its pledge to purchase any tendered bonds, all principal
and interest payments were made. (Source: Moody's reports)
On December 6, 1994, Orange County, California filed bankruptcy petitions for both itself and the Orange CountyInvestment Pool (OCIP). The County had pledged that the OCIP would purchase any tendered Pension ObligationSeries B bond, but as a result of the bankruptcy filing, the OCIP was unable to fulfill this obligation and the bondsdefaulted on December 8, 1994. The County did not default on the scheduled principal and interest payments of theSeries B bonds or any of its other long-term obligations.
The Orange County bankruptcy was the largest municipal bankruptcy in US history. Orange County'sbankruptcy filing was a direct result of the investment losses incurred by the Orange County Investment Pool (OCIP)which amounted to approximately $1.5 billion of the $7.5 billion pool. The investment strategy of the CountyTreasurer involved investing in high-risk, interest rate sensitive securities and leveraging the pool to further increasereturns. During the period when interest rates were on the decline and remained low, the OCIP succeeded in earninghigh returns. However, when interest rates began to rise in 1994, the OCIP experienced big losses. Adding to thefinancial distress of OCIP, when OCIP was unable to repay a $1.2 billion loan to a Wall Street creditor, the creditorrefused to extend the loan and started liquidating the securities that OCIP had pledged as collateral for the loan. Toprotect itself from other creditors, Orange County filed for bankruptcy for itself and OCIP.
Rating History RATING DATE RATING RATING ACTION
8 SEP 1994 A1 ASSIGNED8 DEC 1994 Caa DOWNGRADED30 MAY 1996 Ba UPGRADED1 AUG 1996 — WITHDRAWN
20 Moody’s Rating Methodology
ELECTRIC POWER:
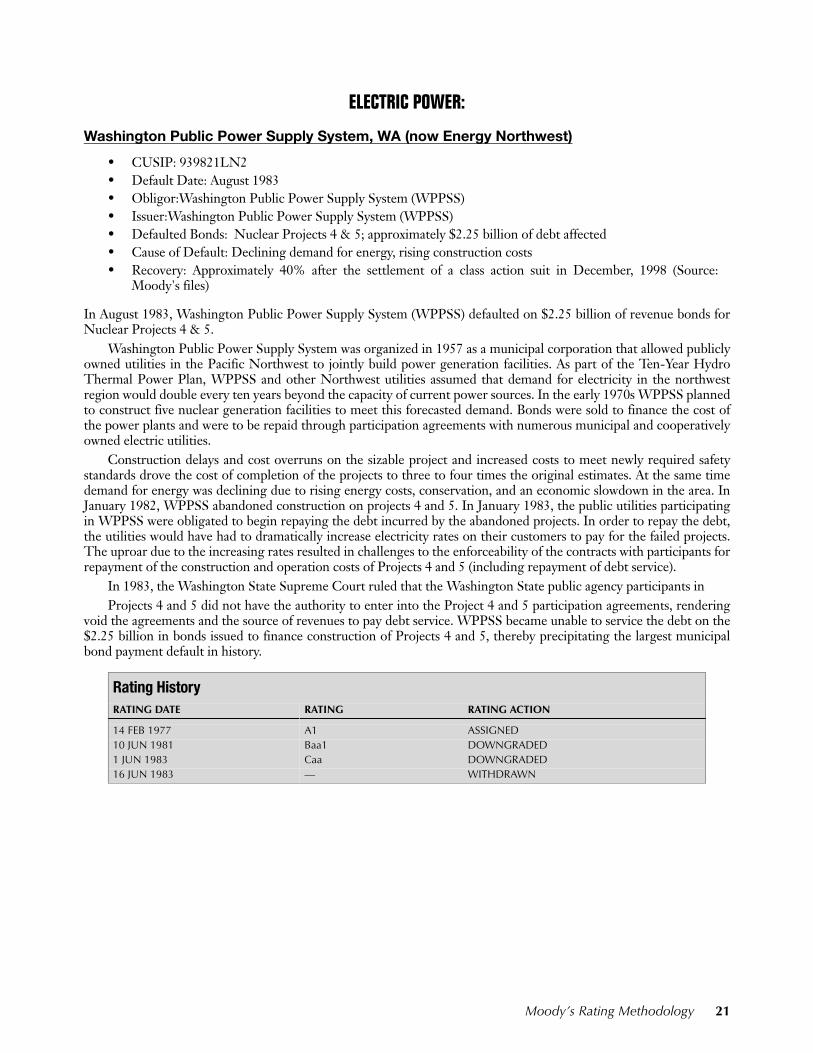
Washington Public Power Supply System, WA (now Energy Northwest)
• CUSIP: 939821LN2• Default Date: August 1983• Obligor:Washington Public Power Supply System (WPPSS)• Issuer:Washington Public Power Supply System (WPPSS)• Defaulted Bonds: Nuclear Projects 4 & 5; approximately $2.25 billion of debt affected• Cause of Default: Declining demand for energy, rising construction costs• Recovery: Approximately 40% after the settlement of a class action suit in December, 1998 (Source:
Moody's files)
In August 1983, Washington Public Power Supply System (WPPSS) defaulted on $2.25 billion of revenue bonds forNuclear Projects 4 & 5.
Washington Public Power Supply System was organized in 1957 as a municipal corporation that allowed publiclyowned utilities in the Pacific Northwest to jointly build power generation facilities. As part of the Ten-Year HydroThermal Power Plan, WPPSS and other Northwest utilities assumed that demand for electricity in the northwestregion would double every ten years beyond the capacity of current power sources. In the early 1970s WPPSS plannedto construct five nuclear generation facilities to meet this forecasted demand. Bonds were sold to finance the cost ofthe power plants and were to be repaid through participation agreements with numerous municipal and cooperativelyowned electric utilities.
Construction delays and cost overruns on the sizable project and increased costs to meet newly required safetystandards drove the cost of completion of the projects to three to four times the original estimates. At the same timedemand for energy was declining due to rising energy costs, conservation, and an economic slowdown in the area. InJanuary 1982, WPPSS abandoned construction on projects 4 and 5. In January 1983, the public utilities participatingin WPPSS were obligated to begin repaying the debt incurred by the abandoned projects. In order to repay the debt,the utilities would have had to dramatically increase electricity rates on their customers to pay for the failed projects.The uproar due to the increasing rates resulted in challenges to the enforceability of the contracts with participants forrepayment of the construction and operation costs of Projects 4 and 5 (including repayment of debt service).
In 1983, the Washington State Supreme Court ruled that the Washington State public agency participants inProjects 4 and 5 did not have the authority to enter into the Project 4 and 5 participation agreements, rendering
void the agreements and the source of revenues to pay debt service. WPPSS became unable to service the debt on the$2.25 billion in bonds issued to finance construction of Projects 4 and 5, thereby precipitating the largest municipalbond payment default in history.
Rating HistoryRATING DATE RATING RATING ACTION
14 FEB 1977 A1 ASSIGNED10 JUN 1981 Baa1 DOWNGRADED1 JUN 1983 Caa DOWNGRADED16 JUN 1983 — WITHDRAWN
Moody’s Rating Methodology 21
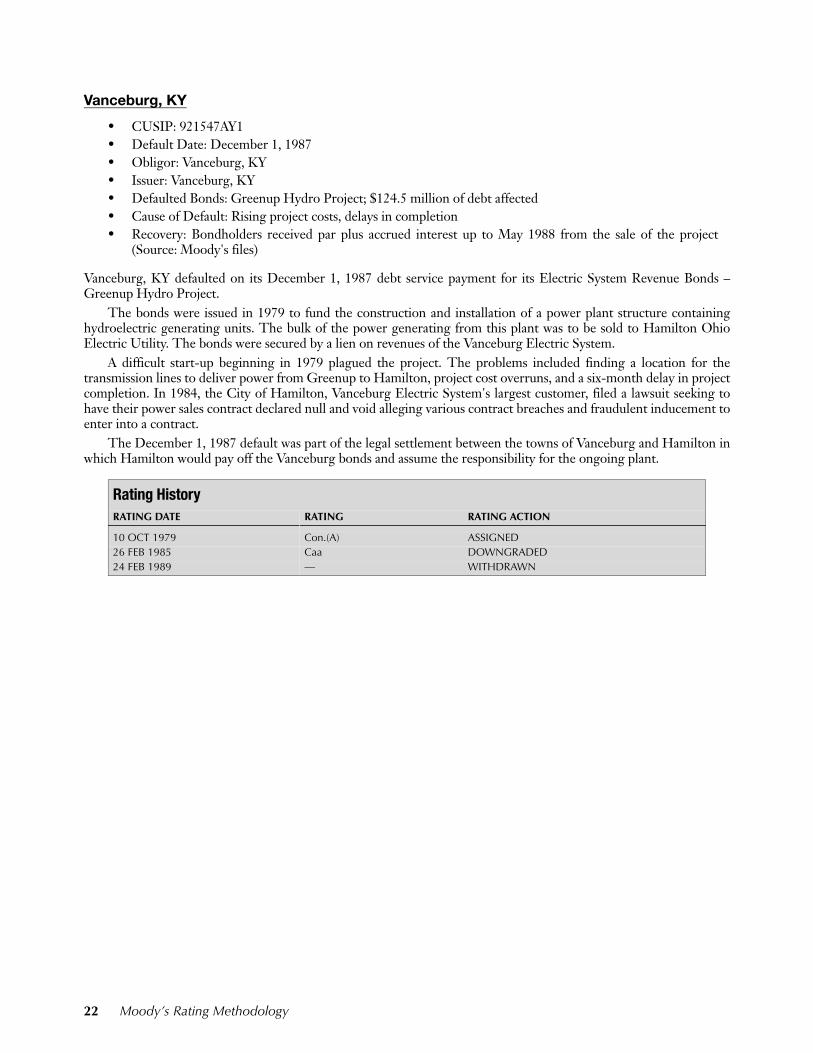
Vanceburg, KY
• CUSIP: 921547AY1• Default Date: December 1, 1987• Obligor: Vanceburg, KY• Issuer: Vanceburg, KY• Defaulted Bonds: Greenup Hydro Project; $124.5 million of debt affected• Cause of Default: Rising project costs, delays in completion• Recovery: Bondholders received par plus accrued interest up to May 1988 from the sale of the project
(Source: Moody's files)
Vanceburg, KY defaulted on its December 1, 1987 debt service payment for its Electric System Revenue Bonds –Greenup Hydro Project.
The bonds were issued in 1979 to fund the construction and installation of a power plant structure containinghydroelectric generating units. The bulk of the power generating from this plant was to be sold to Hamilton OhioElectric Utility. The bonds were secured by a lien on revenues of the Vanceburg Electric System.
A difficult start-up beginning in 1979 plagued the project. The problems included finding a location for thetransmission lines to deliver power from Greenup to Hamilton, project cost overruns, and a six-month delay in projectcompletion. In 1984, the City of Hamilton, Vanceburg Electric System's largest customer, filed a lawsuit seeking tohave their power sales contract declared null and void alleging various contract breaches and fraudulent inducement toenter into a contract.
The December 1, 1987 default was part of the legal settlement between the towns of Vanceburg and Hamilton inwhich Hamilton would pay off the Vanceburg bonds and assume the responsibility for the ongoing plant.
Rating HistoryRATING DATE RATING RATING ACTION
10 OCT 1979 Con.(A) ASSIGNED26 FEB 1985 Caa DOWNGRADED 24 FEB 1989 — WITHDRAWN
22 Moody’s Rating Methodology
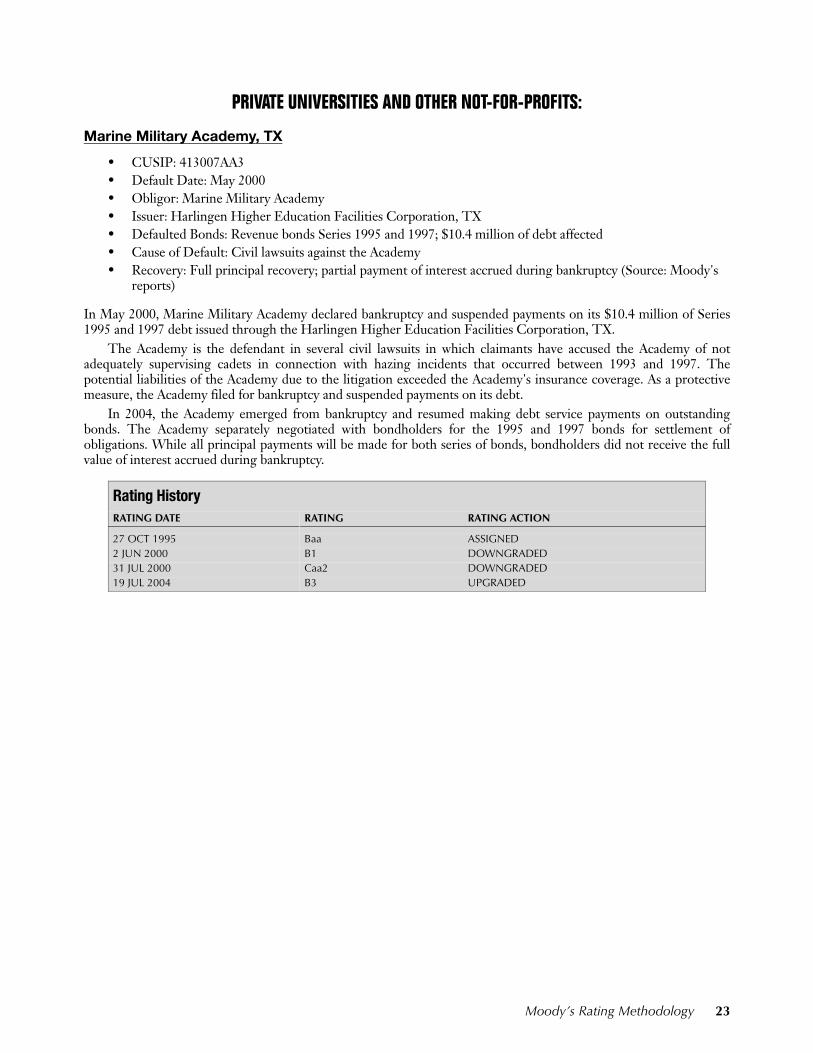
PRIVATE UNIVERSITIES AND OTHER NOT-FOR-PROFITS:
Marine Military Academy, TX
• CUSIP: 413007AA3 • Default Date: May 2000• Obligor: Marine Military Academy• Issuer: Harlingen Higher Education Facilities Corporation, TX• Defaulted Bonds: Revenue bonds Series 1995 and 1997; $10.4 million of debt affected• Cause of Default: Civil lawsuits against the Academy• Recovery: Full principal recovery; partial payment of interest accrued during bankruptcy (Source: Moody's
reports)
In May 2000, Marine Military Academy declared bankruptcy and suspended payments on its $10.4 million of Series1995 and 1997 debt issued through the Harlingen Higher Education Facilities Corporation, TX.
The Academy is the defendant in several civil lawsuits in which claimants have accused the Academy of notadequately supervising cadets in connection with hazing incidents that occurred between 1993 and 1997. Thepotential liabilities of the Academy due to the litigation exceeded the Academy's insurance coverage. As a protectivemeasure, the Academy filed for bankruptcy and suspended payments on its debt.
In 2004, the Academy emerged from bankruptcy and resumed making debt service payments on outstandingbonds. The Academy separately negotiated with bondholders for the 1995 and 1997 bonds for settlement ofobligations. While all principal payments will be made for both series of bonds, bondholders did not receive the fullvalue of interest accrued during bankruptcy.
Rating HistoryRATING DATE RATING RATING ACTION
27 OCT 1995 Baa ASSIGNED2 JUN 2000 B1 DOWNGRADED31 JUL 2000 Caa2 DOWNGRADED19 JUL 2004 B3 UPGRADED
Moody’s Rating Methodology 23
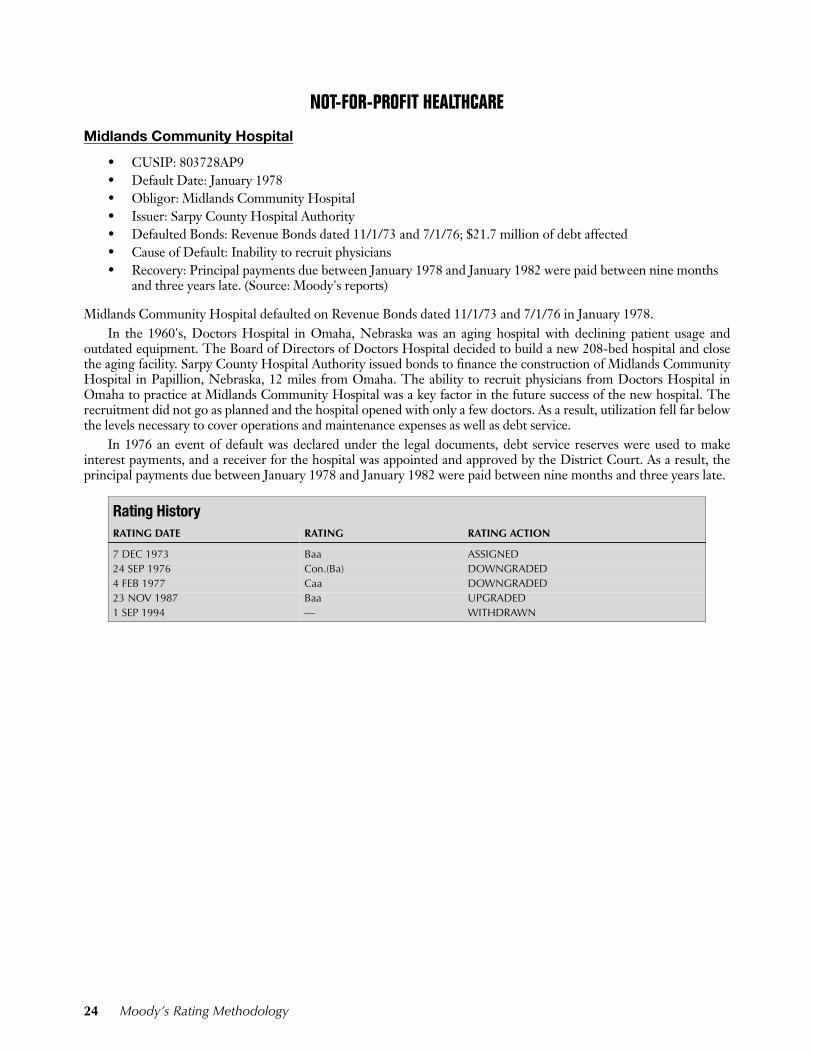
NOT-FOR-PROFIT HEALTHCARE
Midlands Community Hospital
• CUSIP: 803728AP9• Default Date: January 1978• Obligor: Midlands Community Hospital• Issuer: Sarpy County Hospital Authority• Defaulted Bonds: Revenue Bonds dated 11/1/73 and 7/1/76; $21.7 million of debt affected• Cause of Default: Inability to recruit physicians• Recovery: Principal payments due between January 1978 and January 1982 were paid between nine months
and three years late. (Source: Moody's reports)
Midlands Community Hospital defaulted on Revenue Bonds dated 11/1/73 and 7/1/76 in January 1978.In the 1960's, Doctors Hospital in Omaha, Nebraska was an aging hospital with declining patient usage and
outdated equipment. The Board of Directors of Doctors Hospital decided to build a new 208-bed hospital and closethe aging facility. Sarpy County Hospital Authority issued bonds to finance the construction of Midlands CommunityHospital in Papillion, Nebraska, 12 miles from Omaha. The ability to recruit physicians from Doctors Hospital inOmaha to practice at Midlands Community Hospital was a key factor in the future success of the new hospital. Therecruitment did not go as planned and the hospital opened with only a few doctors. As a result, utilization fell far belowthe levels necessary to cover operations and maintenance expenses as well as debt service.
In 1976 an event of default was declared under the legal documents, debt service reserves were used to makeinterest payments, and a receiver for the hospital was appointed and approved by the District Court. As a result, theprincipal payments due between January 1978 and January 1982 were paid between nine months and three years late.
Rating HistoryRATING DATE RATING RATING ACTION
7 DEC 1973 Baa ASSIGNED24 SEP 1976 Con.(Ba) DOWNGRADED4 FEB 1977 Caa DOWNGRADED23 NOV 1987 Baa UPGRADED1 SEP 1994 — WITHDRAWN
24 Moody’s Rating Methodology
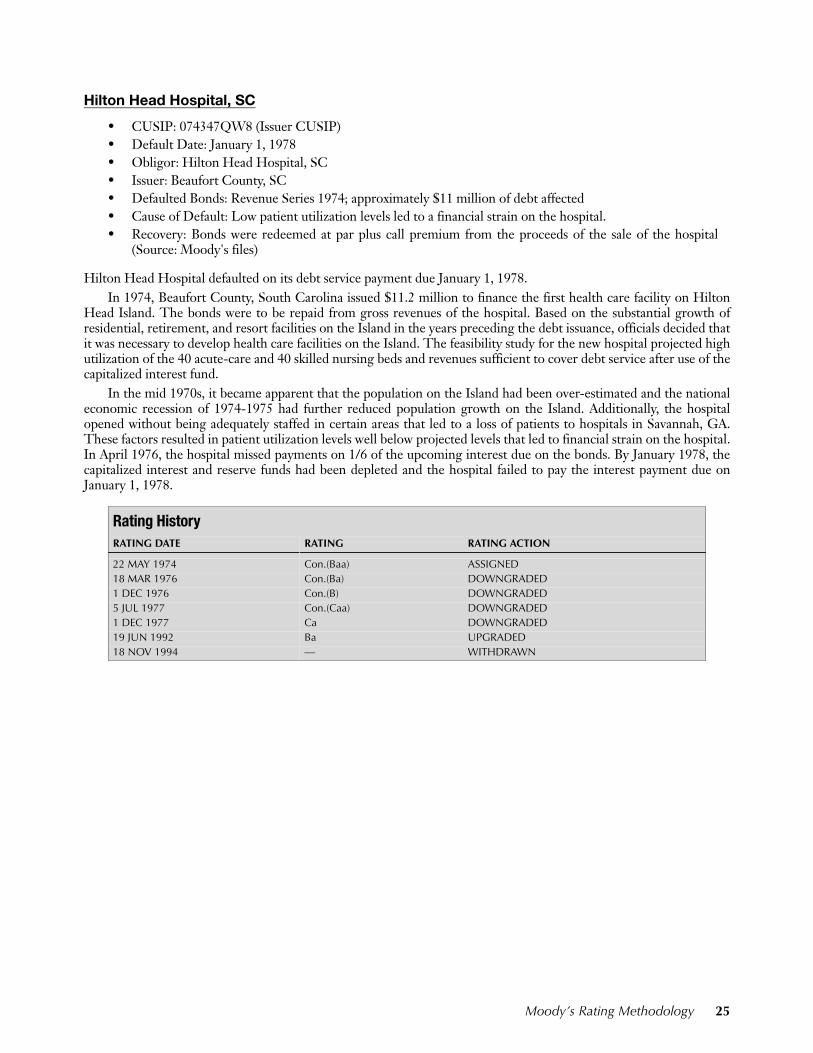
Hilton Head Hospital, SC
• CUSIP: 074347QW8 (Issuer CUSIP)• Default Date: January 1, 1978• Obligor: Hilton Head Hospital, SC• Issuer: Beaufort County, SC• Defaulted Bonds: Revenue Series 1974; approximately $11 million of debt affected• Cause of Default: Low patient utilization levels led to a financial strain on the hospital.• Recovery: Bonds were redeemed at par plus call premium from the proceeds of the sale of the hospital
(Source: Moody's files)
Hilton Head Hospital defaulted on its debt service payment due January 1, 1978.In 1974, Beaufort County, South Carolina issued $11.2 million to finance the first health care facility on Hilton
Head Island. The bonds were to be repaid from gross revenues of the hospital. Based on the substantial growth ofresidential, retirement, and resort facilities on the Island in the years preceding the debt issuance, officials decided thatit was necessary to develop health care facilities on the Island. The feasibility study for the new hospital projected highutilization of the 40 acute-care and 40 skilled nursing beds and revenues sufficient to cover debt service after use of thecapitalized interest fund.
In the mid 1970s, it became apparent that the population on the Island had been over-estimated and the nationaleconomic recession of 1974-1975 had further reduced population growth on the Island. Additionally, the hospitalopened without being adequately staffed in certain areas that led to a loss of patients to hospitals in Savannah, GA.These factors resulted in patient utilization levels well below projected levels that led to financial strain on the hospital.In April 1976, the hospital missed payments on 1/6 of the upcoming interest due on the bonds. By January 1978, thecapitalized interest and reserve funds had been depleted and the hospital failed to pay the interest payment due onJanuary 1, 1978.
Rating HistoryRATING DATE RATING RATING ACTION
22 MAY 1974 Con.(Baa) ASSIGNED18 MAR 1976 Con.(Ba) DOWNGRADED1 DEC 1976 Con.(B) DOWNGRADED5 JUL 1977 Con.(Caa) DOWNGRADED1 DEC 1977 Ca DOWNGRADED19 JUN 1992 Ba UPGRADED18 NOV 1994 — WITHDRAWN
Moody’s Rating Methodology 25
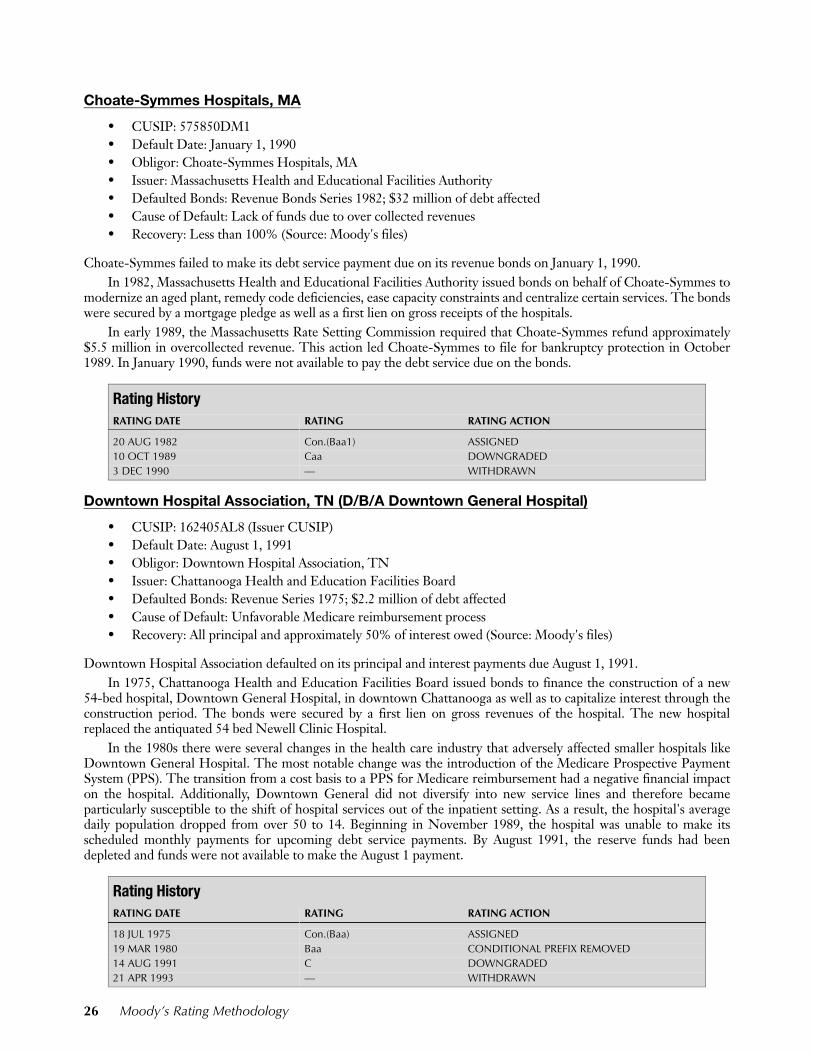
26 Moody’s Rating Methodology
Choate-Symmes Hospitals, MA
• CUSIP: 575850DM1• Default Date: January 1, 1990• Obligor: Choate-Symmes Hospitals, MA• Issuer: Massachusetts Health and Educational Facilities Authority• Defaulted Bonds: Revenue Bonds Series 1982; $32 million of debt affected• Cause of Default: Lack of funds due to over collected revenues• Recovery: Less than 100% (Source: Moody's files)
Choate-Symmes failed to make its debt service payment due on its revenue bonds on January 1, 1990.In 1982, Massachusetts Health and Educational Facilities Authority issued bonds on behalf of Choate-Symmes to
modernize an aged plant, remedy code deficiencies, ease capacity constraints and centralize certain services. The bondswere secured by a mortgage pledge as well as a first lien on gross receipts of the hospitals.
In early 1989, the Massachusetts Rate Setting Commission required that Choate-Symmes refund approximately$5.5 million in overcollected revenue. This action led Choate-Symmes to file for bankruptcy protection in October1989. In January 1990, funds were not available to pay the debt service due on the bonds.
Downtown Hospital Association, TN (D/B/A Downtown General Hospital)
• CUSIP: 162405AL8 (Issuer CUSIP)• Default Date: August 1, 1991• Obligor: Downtown Hospital Association, TN• Issuer: Chattanooga Health and Education Facilities Board• Defaulted Bonds: Revenue Series 1975; $2.2 million of debt affected• Cause of Default: Unfavorable Medicare reimbursement process• Recovery: All principal and approximately 50% of interest owed (Source: Moody's files)
Downtown Hospital Association defaulted on its principal and interest payments due August 1, 1991.In 1975, Chattanooga Health and Education Facilities Board issued bonds to finance the construction of a new
54-bed hospital, Downtown General Hospital, in downtown Chattanooga as well as to capitalize interest through theconstruction period. The bonds were secured by a first lien on gross revenues of the hospital. The new hospitalreplaced the antiquated 54 bed Newell Clinic Hospital.
In the 1980s there were several changes in the health care industry that adversely affected smaller hospitals likeDowntown General Hospital. The most notable change was the introduction of the Medicare Prospective PaymentSystem (PPS). The transition from a cost basis to a PPS for Medicare reimbursement had a negative financial impacton the hospital. Additionally, Downtown General did not diversify into new service lines and therefore becameparticularly susceptible to the shift of hospital services out of the inpatient setting. As a result, the hospital's averagedaily population dropped from over 50 to 14. Beginning in November 1989, the hospital was unable to make itsscheduled monthly payments for upcoming debt service payments. By August 1991, the reserve funds had beendepleted and funds were not available to make the August 1 payment.
Rating HistoryRATING DATE RATING RATING ACTION
20 AUG 1982 Con.(Baa1) ASSIGNED10 OCT 1989 Caa DOWNGRADED3 DEC 1990 — WITHDRAWN
Rating HistoryRATING DATE RATING RATING ACTION
18 JUL 1975 Con.(Baa) ASSIGNED19 MAR 1980 Baa CONDITIONAL PREFIX REMOVED14 AUG 1991 C DOWNGRADED21 APR 1993 — WITHDRAWN
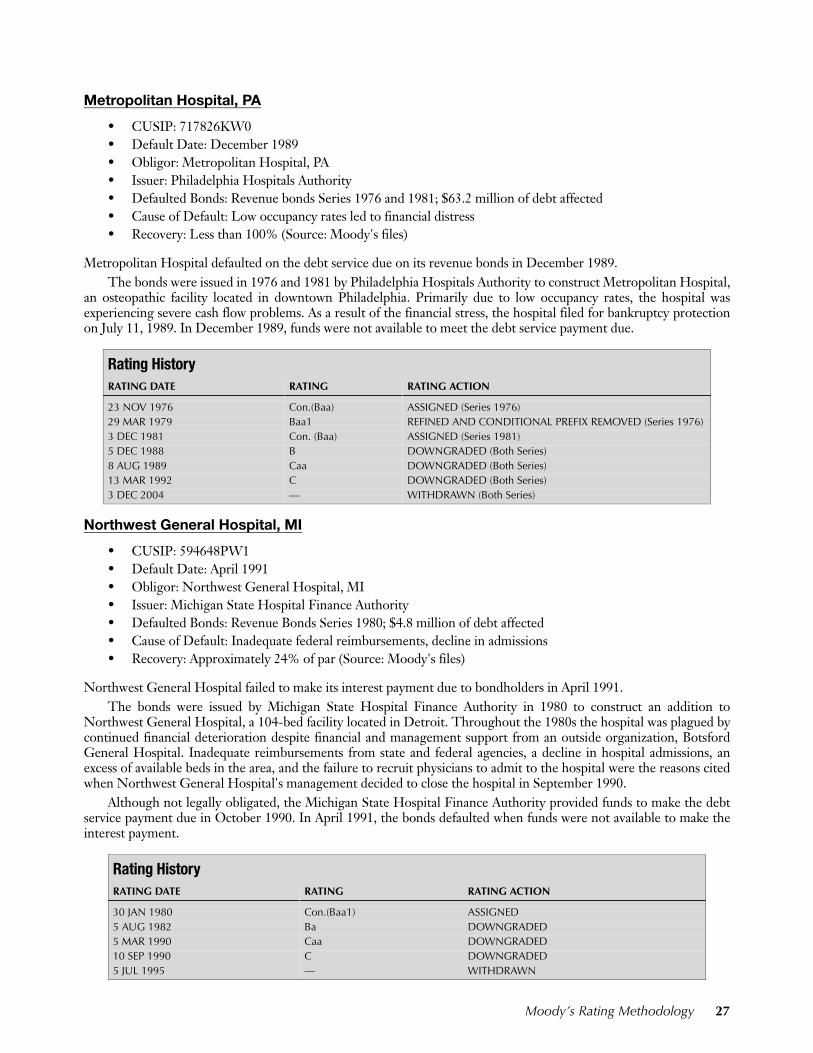
Metropolitan Hospital, PA
• CUSIP: 717826KW0 • Default Date: December 1989• Obligor: Metropolitan Hospital, PA• Issuer: Philadelphia Hospitals Authority• Defaulted Bonds: Revenue bonds Series 1976 and 1981; $63.2 million of debt affected• Cause of Default: Low occupancy rates led to financial distress• Recovery: Less than 100% (Source: Moody's files)
Metropolitan Hospital defaulted on the debt service due on its revenue bonds in December 1989.The bonds were issued in 1976 and 1981 by Philadelphia Hospitals Authority to construct Metropolitan Hospital,
an osteopathic facility located in downtown Philadelphia. Primarily due to low occupancy rates, the hospital wasexperiencing severe cash flow problems. As a result of the financial stress, the hospital filed for bankruptcy protectionon July 11, 1989. In December 1989, funds were not available to meet the debt service payment due.
Northwest General Hospital, MI
• CUSIP: 594648PW1• Default Date: April 1991• Obligor: Northwest General Hospital, MI• Issuer: Michigan State Hospital Finance Authority• Defaulted Bonds: Revenue Bonds Series 1980; $4.8 million of debt affected• Cause of Default: Inadequate federal reimbursements, decline in admissions• Recovery: Approximately 24% of par (Source: Moody's files)
Northwest General Hospital failed to make its interest payment due to bondholders in April 1991.The bonds were issued by Michigan State Hospital Finance Authority in 1980 to construct an addition to
Northwest General Hospital, a 104-bed facility located in Detroit. Throughout the 1980s the hospital was plagued bycontinued financial deterioration despite financial and management support from an outside organization, BotsfordGeneral Hospital. Inadequate reimbursements from state and federal agencies, a decline in hospital admissions, anexcess of available beds in the area, and the failure to recruit physicians to admit to the hospital were the reasons citedwhen Northwest General Hospital's management decided to close the hospital in September 1990.
Although not legally obligated, the Michigan State Hospital Finance Authority provided funds to make the debtservice payment due in October 1990. In April 1991, the bonds defaulted when funds were not available to make theinterest payment.
Rating HistoryRATING DATE RATING RATING ACTION
23 NOV 1976 Con.(Baa) ASSIGNED (Series 1976)29 MAR 1979 Baa1 REFINED AND CONDITIONAL PREFIX REMOVED (Series 1976)3 DEC 1981 Con. (Baa) ASSIGNED (Series 1981)5 DEC 1988 B DOWNGRADED (Both Series)8 AUG 1989 Caa DOWNGRADED (Both Series)13 MAR 1992 C DOWNGRADED (Both Series)3 DEC 2004 — WITHDRAWN (Both Series)
Rating HistoryRATING DATE RATING RATING ACTION
30 JAN 1980 Con.(Baa1) ASSIGNED5 AUG 1982 Ba DOWNGRADED5 MAR 1990 Caa DOWNGRADED10 SEP 1990 C DOWNGRADED5 JUL 1995 — WITHDRAWN
Moody’s Rating Methodology 27
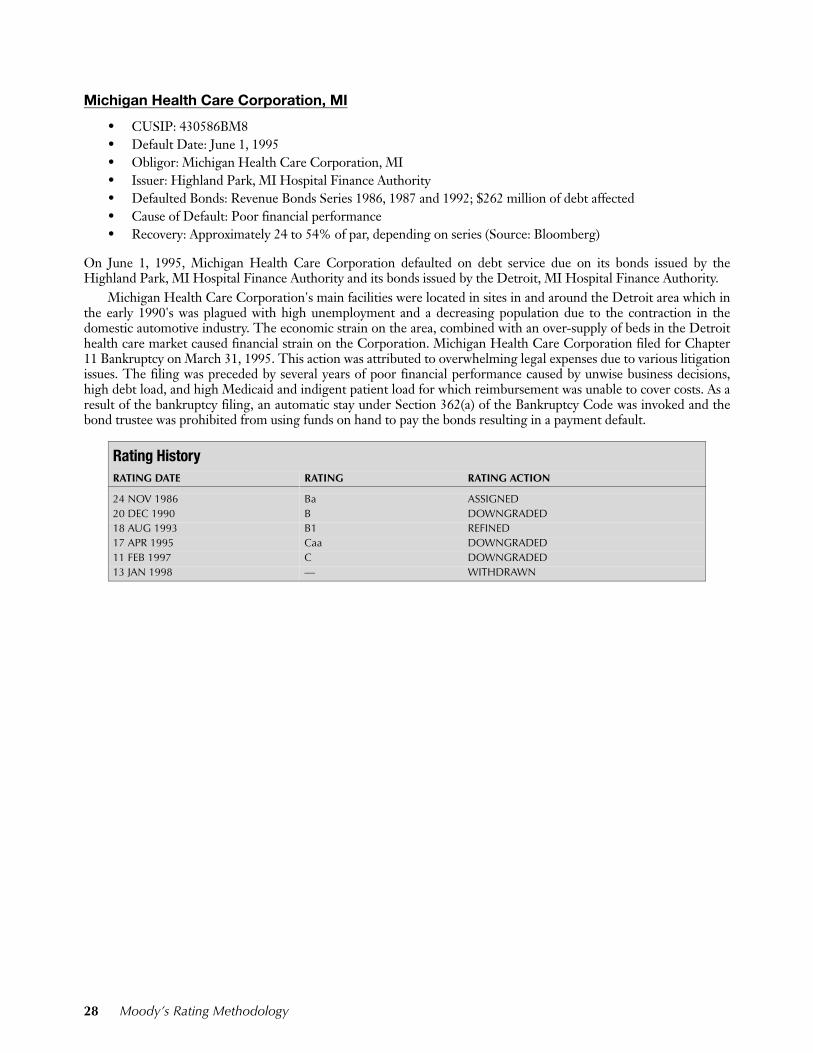
Michigan Health Care Corporation, MI
• CUSIP: 430586BM8• Default Date: June 1, 1995• Obligor: Michigan Health Care Corporation, MI• Issuer: Highland Park, MI Hospital Finance Authority• Defaulted Bonds: Revenue Bonds Series 1986, 1987 and 1992; $262 million of debt affected• Cause of Default: Poor financial performance• Recovery: Approximately 24 to 54% of par, depending on series (Source: Bloomberg)
On June 1, 1995, Michigan Health Care Corporation defaulted on debt service due on its bonds issued by theHighland Park, MI Hospital Finance Authority and its bonds issued by the Detroit, MI Hospital Finance Authority.
Michigan Health Care Corporation's main facilities were located in sites in and around the Detroit area which inthe early 1990's was plagued with high unemployment and a decreasing population due to the contraction in thedomestic automotive industry. The economic strain on the area, combined with an over-supply of beds in the Detroithealth care market caused financial strain on the Corporation. Michigan Health Care Corporation filed for Chapter11 Bankruptcy on March 31, 1995. This action was attributed to overwhelming legal expenses due to various litigationissues. The filing was preceded by several years of poor financial performance caused by unwise business decisions,high debt load, and high Medicaid and indigent patient load for which reimbursement was unable to cover costs. As aresult of the bankruptcy filing, an automatic stay under Section 362(a) of the Bankruptcy Code was invoked and thebond trustee was prohibited from using funds on hand to pay the bonds resulting in a payment default.
Rating HistoryRATING DATE RATING RATING ACTION
24 NOV 1986 Ba ASSIGNED20 DEC 1990 B DOWNGRADED18 AUG 1993 B1 REFINED17 APR 1995 Caa DOWNGRADED11 FEB 1997 C DOWNGRADED13 JAN 1998 — WITHDRAWN
28 Moody’s Rating Methodology
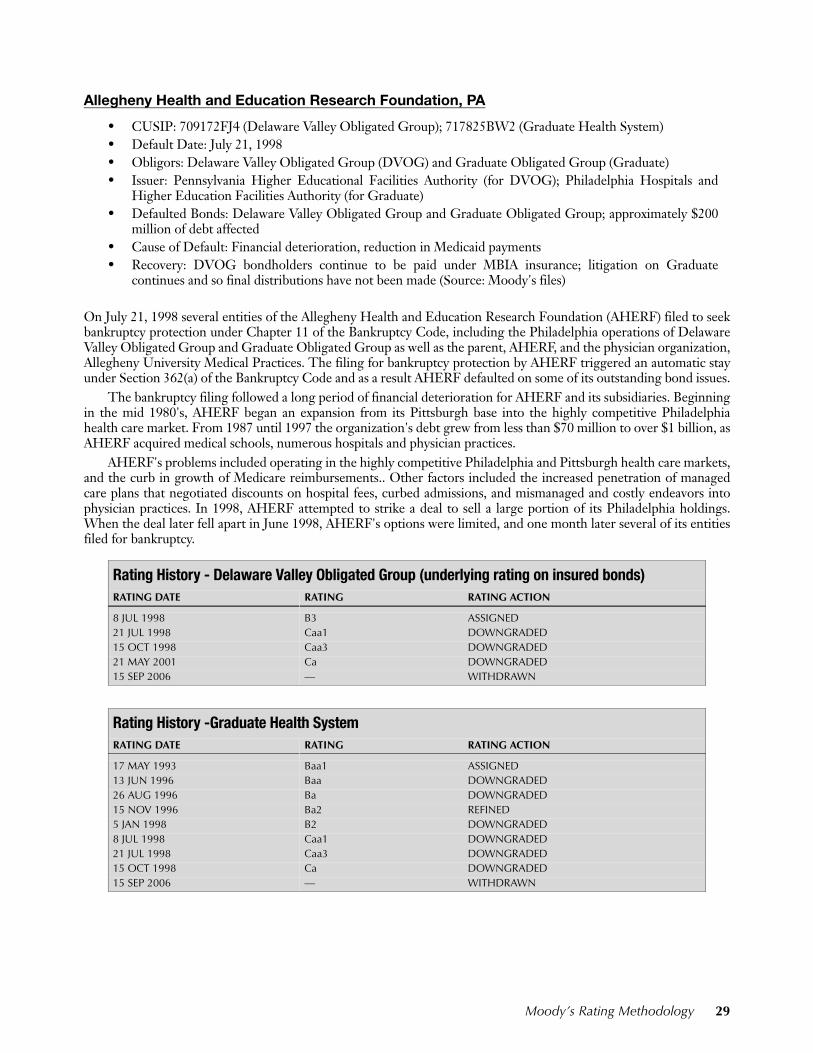
Moody’s Rating Methodology 29
Allegheny Health and Education Research Foundation, PA
• CUSIP: 709172FJ4 (Delaware Valley Obligated Group); 717825BW2 (Graduate Health System)• Default Date: July 21, 1998• Obligors: Delaware Valley Obligated Group (DVOG) and Graduate Obligated Group (Graduate)• Issuer: Pennsylvania Higher Educational Facilities Authority (for DVOG); Philadelphia Hospitals and
Higher Education Facilities Authority (for Graduate) • Defaulted Bonds: Delaware Valley Obligated Group and Graduate Obligated Group; approximately $200
million of debt affected• Cause of Default: Financial deterioration, reduction in Medicaid payments• Recovery: DVOG bondholders continue to be paid under MBIA insurance; litigation on Graduate
continues and so final distributions have not been made (Source: Moody's files)
On July 21, 1998 several entities of the Allegheny Health and Education Research Foundation (AHERF) filed to seekbankruptcy protection under Chapter 11 of the Bankruptcy Code, including the Philadelphia operations of DelawareValley Obligated Group and Graduate Obligated Group as well as the parent, AHERF, and the physician organization,Allegheny University Medical Practices. The filing for bankruptcy protection by AHERF triggered an automatic stayunder Section 362(a) of the Bankruptcy Code and as a result AHERF defaulted on some of its outstanding bond issues.
The bankruptcy filing followed a long period of financial deterioration for AHERF and its subsidiaries. Beginningin the mid 1980's, AHERF began an expansion from its Pittsburgh base into the highly competitive Philadelphiahealth care market. From 1987 until 1997 the organization's debt grew from less than $70 million to over $1 billion, asAHERF acquired medical schools, numerous hospitals and physician practices.
AHERF's problems included operating in the highly competitive Philadelphia and Pittsburgh health care markets,and the curb in growth of Medicare reimbursements.. Other factors included the increased penetration of managedcare plans that negotiated discounts on hospital fees, curbed admissions, and mismanaged and costly endeavors intophysician practices. In 1998, AHERF attempted to strike a deal to sell a large portion of its Philadelphia holdings.When the deal later fell apart in June 1998, AHERF's options were limited, and one month later several of its entitiesfiled for bankruptcy.
Rating History - Delaware Valley Obligated Group (underlying rating on insured bonds)RATING DATE RATING RATING ACTION
8 JUL 1998 B3 ASSIGNED21 JUL 1998 Caa1 DOWNGRADED15 OCT 1998 Caa3 DOWNGRADED21 MAY 2001 Ca DOWNGRADED15 SEP 2006 — WITHDRAWN
Rating History -Graduate Health SystemRATING DATE RATING RATING ACTION
17 MAY 1993 Baa1 ASSIGNED13 JUN 1996 Baa DOWNGRADED26 AUG 1996 Ba DOWNGRADED15 NOV 1996 Ba2 REFINED5 JAN 1998 B2 DOWNGRADED8 JUL 1998 Caa1 DOWNGRADED21 JUL 1998 Caa3 DOWNGRADED15 OCT 1998 Ca DOWNGRADED15 SEP 2006 — WITHDRAWN
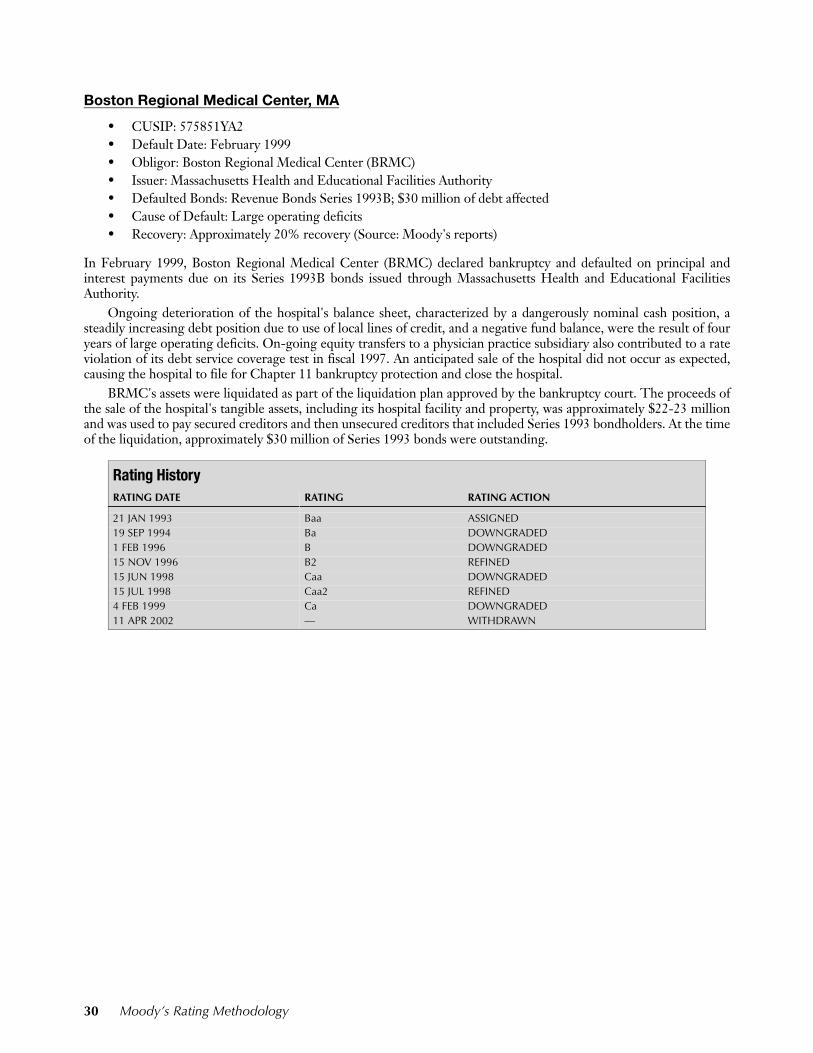
Boston Regional Medical Center, MA
• CUSIP: 575851YA2• Default Date: February 1999• Obligor: Boston Regional Medical Center (BRMC)• Issuer: Massachusetts Health and Educational Facilities Authority• Defaulted Bonds: Revenue Bonds Series 1993B; $30 million of debt affected• Cause of Default: Large operating deficits• Recovery: Approximately 20% recovery (Source: Moody's reports)
In February 1999, Boston Regional Medical Center (BRMC) declared bankruptcy and defaulted on principal andinterest payments due on its Series 1993B bonds issued through Massachusetts Health and Educational FacilitiesAuthority.
Ongoing deterioration of the hospital's balance sheet, characterized by a dangerously nominal cash position, asteadily increasing debt position due to use of local lines of credit, and a negative fund balance, were the result of fouryears of large operating deficits. On-going equity transfers to a physician practice subsidiary also contributed to a rateviolation of its debt service coverage test in fiscal 1997. An anticipated sale of the hospital did not occur as expected,causing the hospital to file for Chapter 11 bankruptcy protection and close the hospital.
BRMC's assets were liquidated as part of the liquidation plan approved by the bankruptcy court. The proceeds ofthe sale of the hospital's tangible assets, including its hospital facility and property, was approximately $22-23 millionand was used to pay secured creditors and then unsecured creditors that included Series 1993 bondholders. At the timeof the liquidation, approximately $30 million of Series 1993 bonds were outstanding.
Rating HistoryRATING DATE RATING RATING ACTION
21 JAN 1993 Baa ASSIGNED19 SEP 1994 Ba DOWNGRADED1 FEB 1996 B DOWNGRADED15 NOV 1996 B2 REFINED15 JUN 1998 Caa DOWNGRADED 15 JUL 1998 Caa2 REFINED4 FEB 1999 Ca DOWNGRADED11 APR 2002 — WITHDRAWN
30 Moody’s Rating Methodology
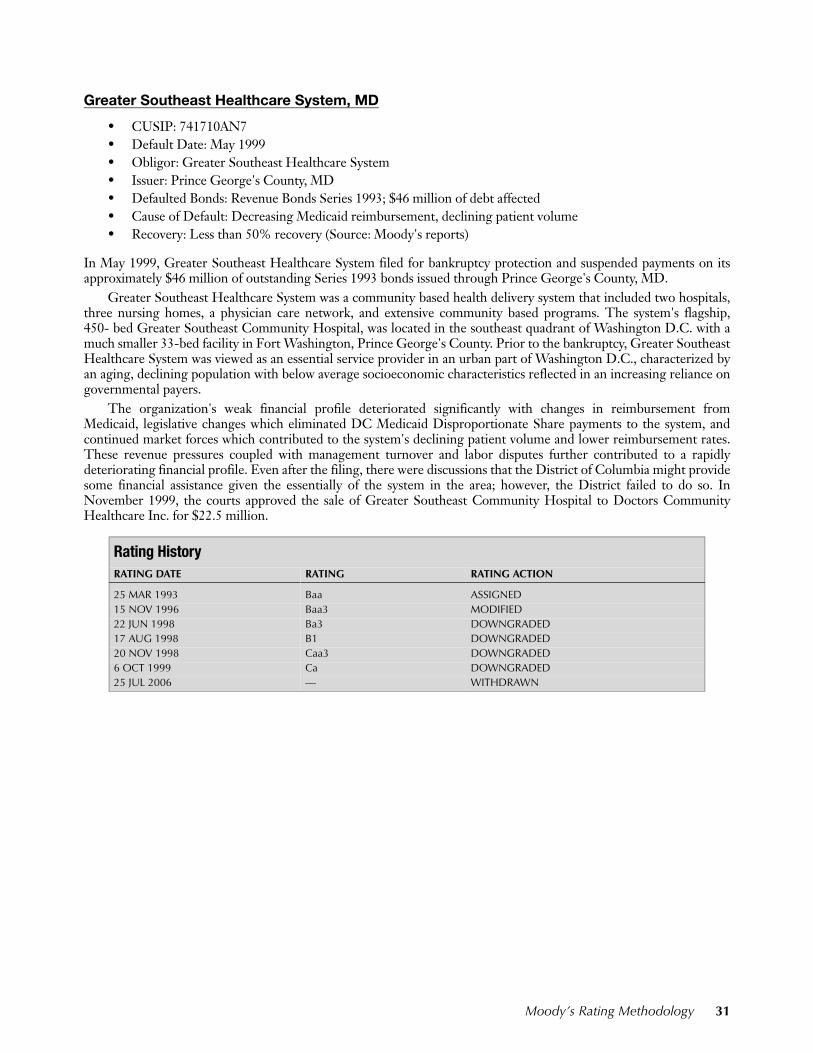
Greater Southeast Healthcare System, MD
• CUSIP: 741710AN7 • Default Date: May 1999• Obligor: Greater Southeast Healthcare System• Issuer: Prince George's County, MD• Defaulted Bonds: Revenue Bonds Series 1993; $46 million of debt affected• Cause of Default: Decreasing Medicaid reimbursement, declining patient volume• Recovery: Less than 50% recovery (Source: Moody's reports)
In May 1999, Greater Southeast Healthcare System filed for bankruptcy protection and suspended payments on itsapproximately $46 million of outstanding Series 1993 bonds issued through Prince George's County, MD.
Greater Southeast Healthcare System was a community based health delivery system that included two hospitals,three nursing homes, a physician care network, and extensive community based programs. The system's flagship,450- bed Greater Southeast Community Hospital, was located in the southeast quadrant of Washington D.C. with amuch smaller 33-bed facility in Fort Washington, Prince George's County. Prior to the bankruptcy, Greater SoutheastHealthcare System was viewed as an essential service provider in an urban part of Washington D.C., characterized byan aging, declining population with below average socioeconomic characteristics reflected in an increasing reliance ongovernmental payers.
The organization's weak financial profile deteriorated significantly with changes in reimbursement fromMedicaid, legislative changes which eliminated DC Medicaid Disproportionate Share payments to the system, andcontinued market forces which contributed to the system's declining patient volume and lower reimbursement rates.These revenue pressures coupled with management turnover and labor disputes further contributed to a rapidlydeteriorating financial profile. Even after the filing, there were discussions that the District of Columbia might providesome financial assistance given the essentially of the system in the area; however, the District failed to do so. InNovember 1999, the courts approved the sale of Greater Southeast Community Hospital to Doctors CommunityHealthcare Inc. for $22.5 million.
Rating HistoryRATING DATE RATING RATING ACTION
25 MAR 1993 Baa ASSIGNED15 NOV 1996 Baa3 MODIFIED22 JUN 1998 Ba3 DOWNGRADED17 AUG 1998 B1 DOWNGRADED20 NOV 1998 Caa3 DOWNGRADED 6 OCT 1999 Ca DOWNGRADED25 JUL 2006 — WITHDRAWN
Moody’s Rating Methodology 31
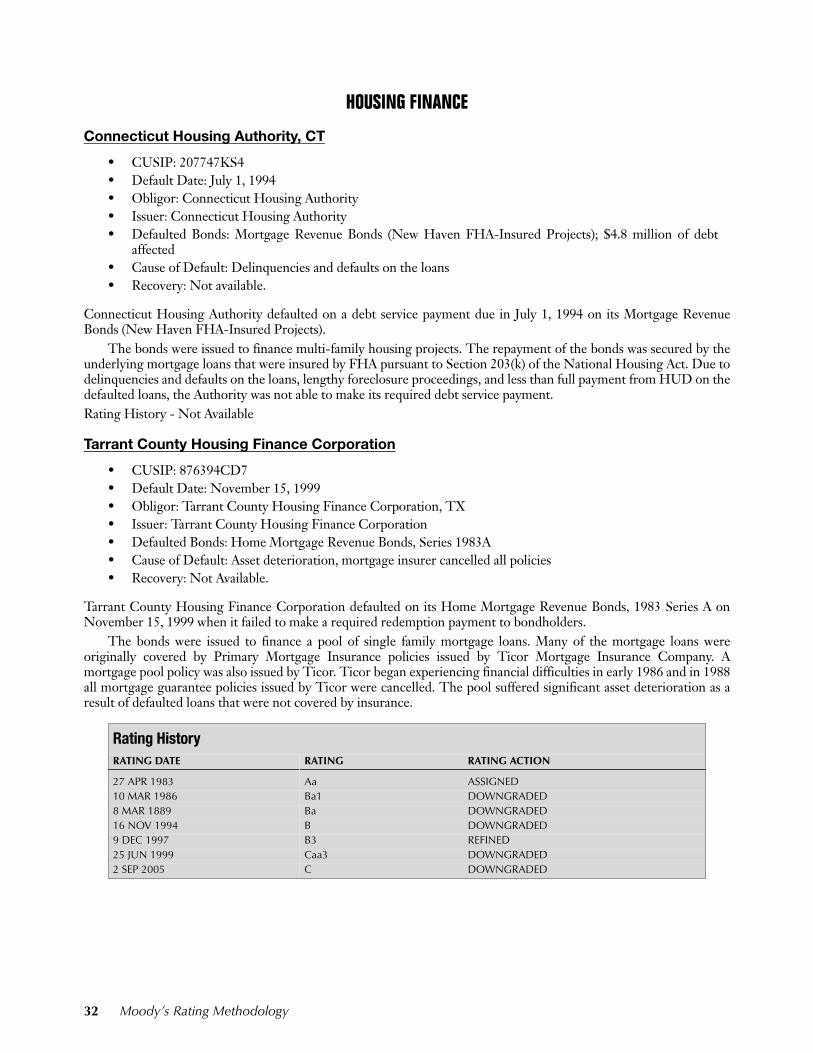
HOUSING FINANCE
Connecticut Housing Authority, CT
• CUSIP: 207747KS4• Default Date: July 1, 1994• Obligor: Connecticut Housing Authority• Issuer: Connecticut Housing Authority• Defaulted Bonds: Mortgage Revenue Bonds (New Haven FHA-Insured Projects); $4.8 million of debt
affected• Cause of Default: Delinquencies and defaults on the loans• Recovery: Not available.
Connecticut Housing Authority defaulted on a debt service payment due in July 1, 1994 on its Mortgage RevenueBonds (New Haven FHA-Insured Projects).
The bonds were issued to finance multi-family housing projects. The repayment of the bonds was secured by theunderlying mortgage loans that were insured by FHA pursuant to Section 203(k) of the National Housing Act. Due todelinquencies and defaults on the loans, lengthy foreclosure proceedings, and less than full payment from HUD on thedefaulted loans, the Authority was not able to make its required debt service payment.Rating History - Not Available
Tarrant County Housing Finance Corporation
• CUSIP: 876394CD7 • Default Date: November 15, 1999• Obligor: Tarrant County Housing Finance Corporation, TX• Issuer: Tarrant County Housing Finance Corporation• Defaulted Bonds: Home Mortgage Revenue Bonds, Series 1983A• Cause of Default: Asset deterioration, mortgage insurer cancelled all policies• Recovery: Not Available.
Tarrant County Housing Finance Corporation defaulted on its Home Mortgage Revenue Bonds, 1983 Series A onNovember 15, 1999 when it failed to make a required redemption payment to bondholders.
The bonds were issued to finance a pool of single family mortgage loans. Many of the mortgage loans wereoriginally covered by Primary Mortgage Insurance policies issued by Ticor Mortgage Insurance Company. Amortgage pool policy was also issued by Ticor. Ticor began experiencing financial difficulties in early 1986 and in 1988all mortgage guarantee policies issued by Ticor were cancelled. The pool suffered significant asset deterioration as aresult of defaulted loans that were not covered by insurance.
Rating HistoryRATING DATE RATING RATING ACTION
27 APR 1983 Aa ASSIGNED10 MAR 1986 Ba1 DOWNGRADED8 MAR 1889 Ba DOWNGRADED16 NOV 1994 B DOWNGRADED9 DEC 1997 B3 REFINED25 JUN 1999 Caa3 DOWNGRADED 2 SEP 2005 C DOWNGRADED
32 Moody’s Rating Methodology
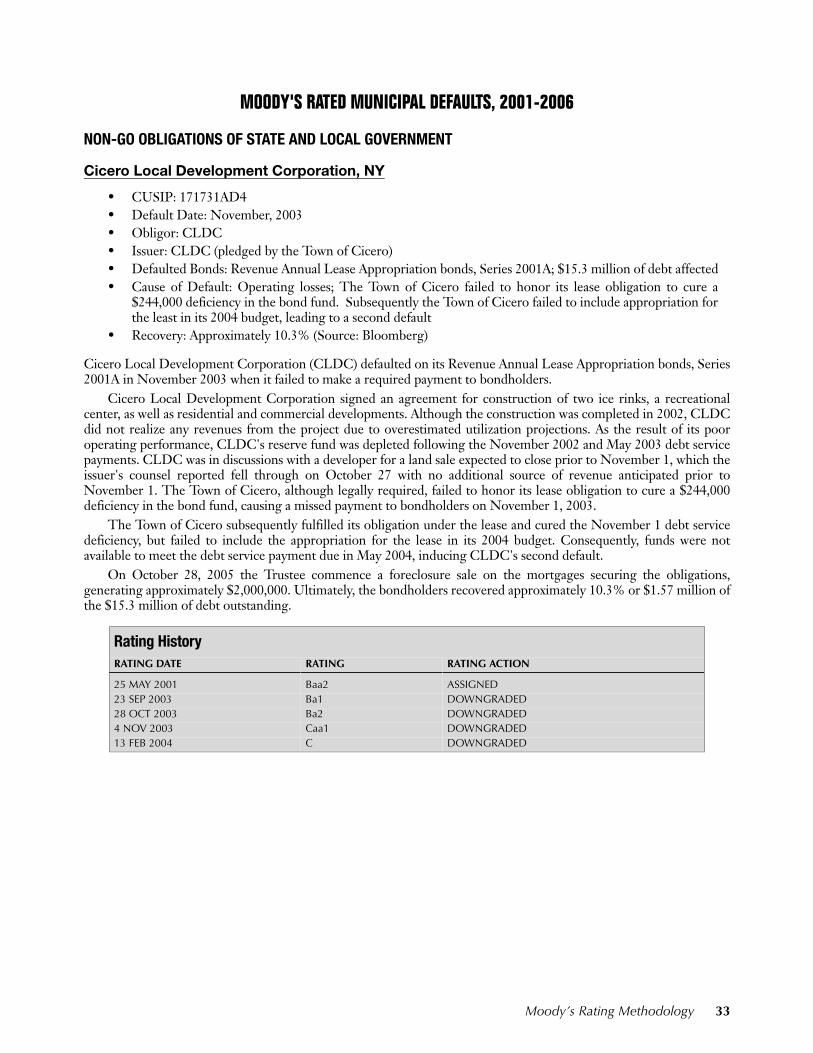
MOODY'S RATED MUNICIPAL DEFAULTS, 2001-2006
NON-GO OBLIGATIONS OF STATE AND LOCAL GOVERNMENT
Cicero Local Development Corporation, NY
• CUSIP: 171731AD4• Default Date: November, 2003• Obligor: CLDC• Issuer: CLDC (pledged by the Town of Cicero)• Defaulted Bonds: Revenue Annual Lease Appropriation bonds, Series 2001A; $15.3 million of debt affected• Cause of Default: Operating losses; The Town of Cicero failed to honor its lease obligation to cure a
$244,000 deficiency in the bond fund. Subsequently the Town of Cicero failed to include appropriation forthe least in its 2004 budget, leading to a second default
• Recovery: Approximately 10.3% (Source: Bloomberg)
Cicero Local Development Corporation (CLDC) defaulted on its Revenue Annual Lease Appropriation bonds, Series2001A in November 2003 when it failed to make a required payment to bondholders.
Cicero Local Development Corporation signed an agreement for construction of two ice rinks, a recreationalcenter, as well as residential and commercial developments. Although the construction was completed in 2002, CLDCdid not realize any revenues from the project due to overestimated utilization projections. As the result of its pooroperating performance, CLDC's reserve fund was depleted following the November 2002 and May 2003 debt servicepayments. CLDC was in discussions with a developer for a land sale expected to close prior to November 1, which theissuer's counsel reported fell through on October 27 with no additional source of revenue anticipated prior toNovember 1. The Town of Cicero, although legally required, failed to honor its lease obligation to cure a $244,000deficiency in the bond fund, causing a missed payment to bondholders on November 1, 2003.
The Town of Cicero subsequently fulfilled its obligation under the lease and cured the November 1 debt servicedeficiency, but failed to include the appropriation for the lease in its 2004 budget. Consequently, funds were notavailable to meet the debt service payment due in May 2004, inducing CLDC's second default.
On October 28, 2005 the Trustee commence a foreclosure sale on the mortgages securing the obligations,generating approximately $2,000,000. Ultimately, the bondholders recovered approximately 10.3% or $1.57 million ofthe $15.3 million of debt outstanding.
Rating HistoryRATING DATE RATING RATING ACTION
25 MAY 2001 Baa2 ASSIGNED23 SEP 2003 Ba1 DOWNGRADED28 OCT 2003 Ba2 DOWNGRADED4 NOV 2003 Caa1 DOWNGRADED13 FEB 2004 C DOWNGRADED
Moody’s Rating Methodology 33
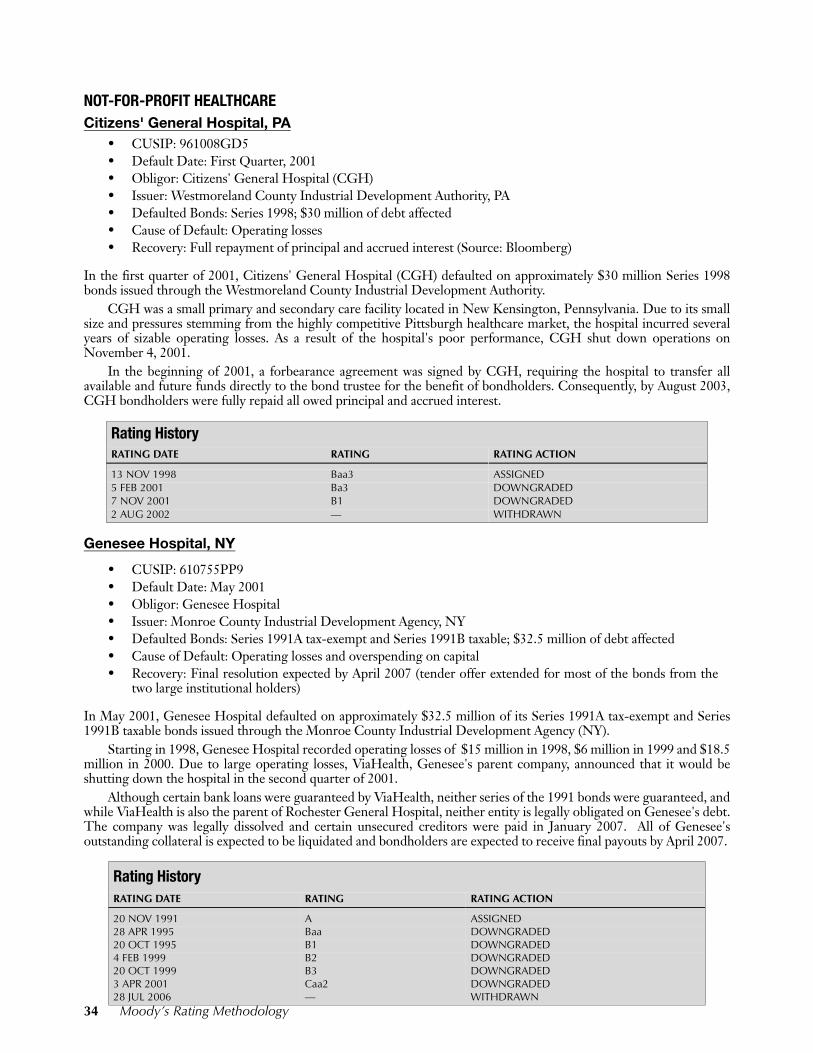
34 Moody’s Rating Methodology
NOT-FOR-PROFIT HEALTHCARECitizens' General Hospital, PA
• CUSIP: 961008GD5• Default Date: First Quarter, 2001• Obligor: Citizens' General Hospital (CGH) • Issuer: Westmoreland County Industrial Development Authority, PA• Defaulted Bonds: Series 1998; $30 million of debt affected• Cause of Default: Operating losses• Recovery: Full repayment of principal and accrued interest (Source: Bloomberg)
In the first quarter of 2001, Citizens' General Hospital (CGH) defaulted on approximately $30 million Series 1998bonds issued through the Westmoreland County Industrial Development Authority.
CGH was a small primary and secondary care facility located in New Kensington, Pennsylvania. Due to its smallsize and pressures stemming from the highly competitive Pittsburgh healthcare market, the hospital incurred severalyears of sizable operating losses. As a result of the hospital's poor performance, CGH shut down operations onNovember 4, 2001.
In the beginning of 2001, a forbearance agreement was signed by CGH, requiring the hospital to transfer allavailable and future funds directly to the bond trustee for the benefit of bondholders. Consequently, by August 2003,CGH bondholders were fully repaid all owed principal and accrued interest.
Genesee Hospital, NY
• CUSIP: 610755PP9• Default Date: May 2001• Obligor: Genesee Hospital • Issuer: Monroe County Industrial Development Agency, NY• Defaulted Bonds: Series 1991A tax-exempt and Series 1991B taxable; $32.5 million of debt affected• Cause of Default: Operating losses and overspending on capital• Recovery: Final resolution expected by April 2007 (tender offer extended for most of the bonds from the
two large institutional holders)
In May 2001, Genesee Hospital defaulted on approximately $32.5 million of its Series 1991A tax-exempt and Series1991B taxable bonds issued through the Monroe County Industrial Development Agency (NY).
Starting in 1998, Genesee Hospital recorded operating losses of $15 million in 1998, $6 million in 1999 and $18.5million in 2000. Due to large operating losses, ViaHealth, Genesee's parent company, announced that it would beshutting down the hospital in the second quarter of 2001.
Although certain bank loans were guaranteed by ViaHealth, neither series of the 1991 bonds were guaranteed, andwhile ViaHealth is also the parent of Rochester General Hospital, neither entity is legally obligated on Genesee's debt.The company was legally dissolved and certain unsecured creditors were paid in January 2007. All of Genesee'soutstanding collateral is expected to be liquidated and bondholders are expected to receive final payouts by April 2007.
Rating HistoryRATING DATE RATING RATING ACTION
13 NOV 1998 Baa3 ASSIGNED5 FEB 2001 Ba3 DOWNGRADED7 NOV 2001 B1 DOWNGRADED2 AUG 2002 — WITHDRAWN
Rating HistoryRATING DATE RATING RATING ACTION
20 NOV 1991 A ASSIGNED28 APR 1995 Baa DOWNGRADED20 OCT 1995 B1 DOWNGRADED 4 FEB 1999 B2 DOWNGRADED20 OCT 1999 B3 DOWNGRADED3 APR 2001 Caa2 DOWNGRADED28 JUL 2006 — WITHDRAWN
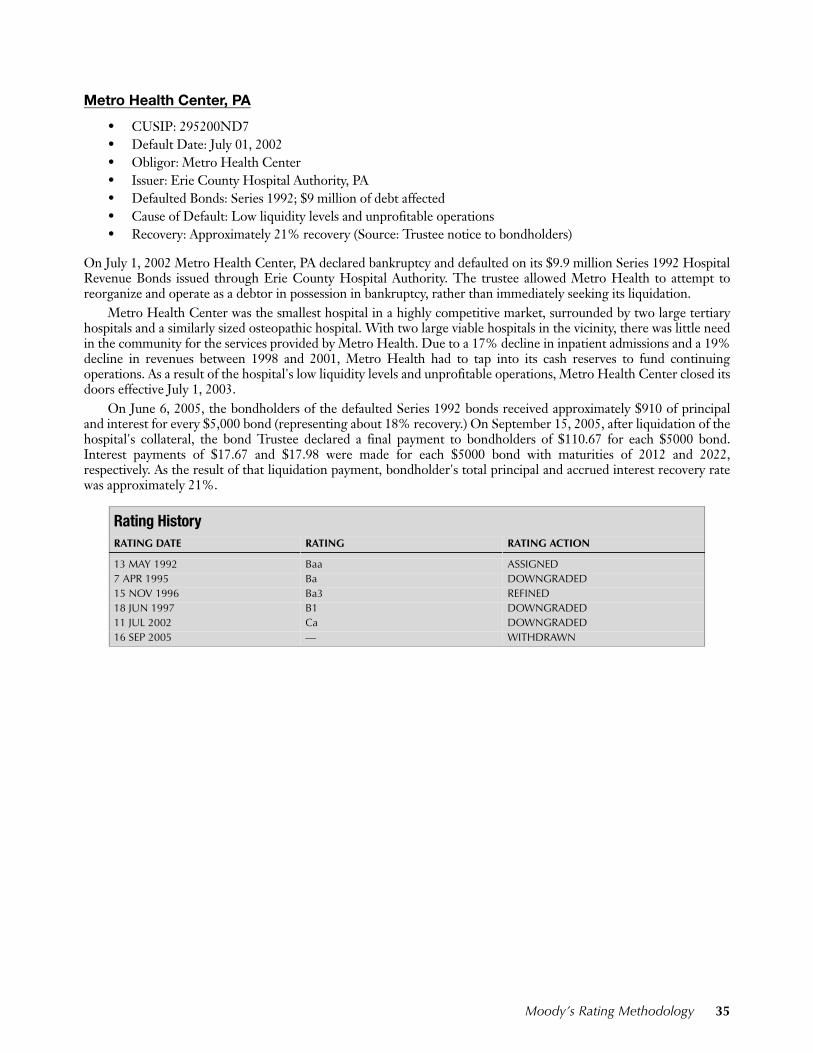
Moody’s Rating Methodology 35
Metro Health Center, PA
• CUSIP: 295200ND7• Default Date: July 01, 2002• Obligor: Metro Health Center• Issuer: Erie County Hospital Authority, PA• Defaulted Bonds: Series 1992; $9 million of debt affected• Cause of Default: Low liquidity levels and unprofitable operations• Recovery: Approximately 21% recovery (Source: Trustee notice to bondholders)
On July 1, 2002 Metro Health Center, PA declared bankruptcy and defaulted on its $9.9 million Series 1992 HospitalRevenue Bonds issued through Erie County Hospital Authority. The trustee allowed Metro Health to attempt toreorganize and operate as a debtor in possession in bankruptcy, rather than immediately seeking its liquidation.
Metro Health Center was the smallest hospital in a highly competitive market, surrounded by two large tertiaryhospitals and a similarly sized osteopathic hospital. With two large viable hospitals in the vicinity, there was little needin the community for the services provided by Metro Health. Due to a 17% decline in inpatient admissions and a 19%decline in revenues between 1998 and 2001, Metro Health had to tap into its cash reserves to fund continuingoperations. As a result of the hospital's low liquidity levels and unprofitable operations, Metro Health Center closed itsdoors effective July 1, 2003.
On June 6, 2005, the bondholders of the defaulted Series 1992 bonds received approximately $910 of principaland interest for every $5,000 bond (representing about 18% recovery.) On September 15, 2005, after liquidation of thehospital's collateral, the bond Trustee declared a final payment to bondholders of $110.67 for each $5000 bond.Interest payments of $17.67 and $17.98 were made for each $5000 bond with maturities of 2012 and 2022,respectively. As the result of that liquidation payment, bondholder's total principal and accrued interest recovery ratewas approximately 21%.
Rating HistoryRATING DATE RATING RATING ACTION
13 MAY 1992 Baa ASSIGNED7 APR 1995 Ba DOWNGRADED15 NOV 1996 Ba3 REFINED18 JUN 1997 B1 DOWNGRADED11 JUL 2002 Ca DOWNGRADED16 SEP 2005 — WITHDRAWN
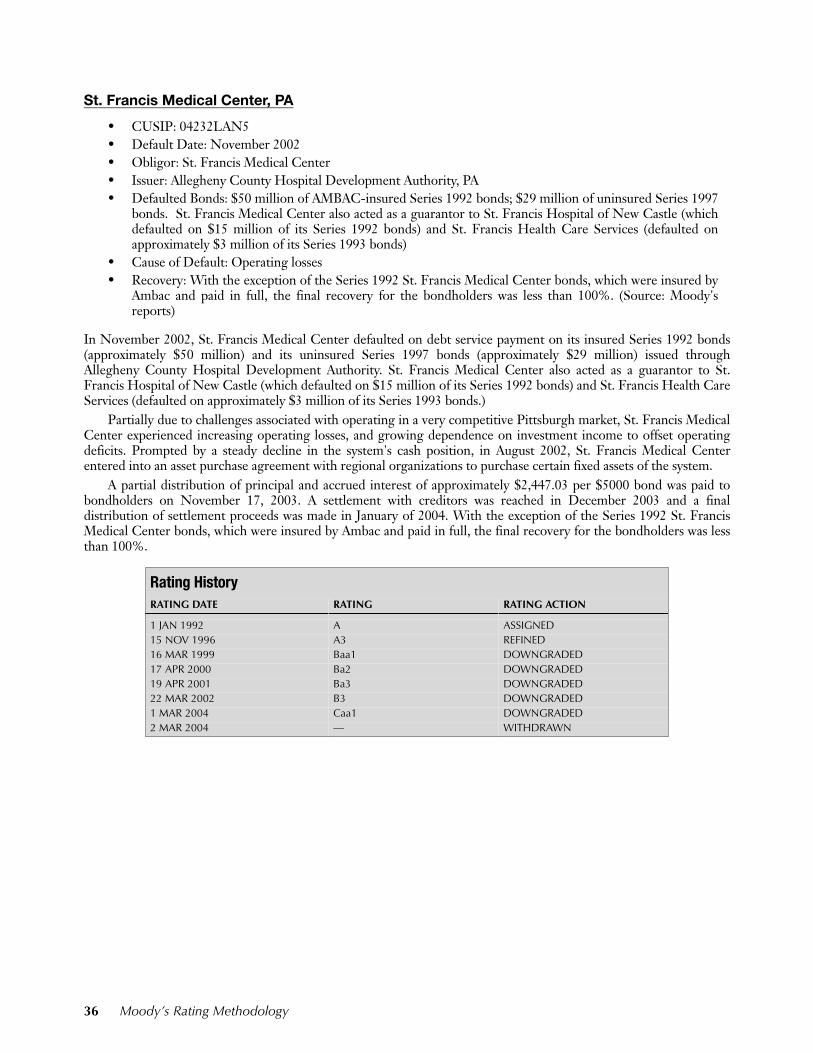
St. Francis Medical Center, PA
• CUSIP: 04232LAN5• Default Date: November 2002• Obligor: St. Francis Medical Center• Issuer: Allegheny County Hospital Development Authority, PA• Defaulted Bonds: $50 million of AMBAC-insured Series 1992 bonds; $29 million of uninsured Series 1997
bonds. St. Francis Medical Center also acted as a guarantor to St. Francis Hospital of New Castle (whichdefaulted on $15 million of its Series 1992 bonds) and St. Francis Health Care Services (defaulted onapproximately $3 million of its Series 1993 bonds)
• Cause of Default: Operating losses • Recovery: With the exception of the Series 1992 St. Francis Medical Center bonds, which were insured by
Ambac and paid in full, the final recovery for the bondholders was less than 100%. (Source: Moody'sreports)
In November 2002, St. Francis Medical Center defaulted on debt service payment on its insured Series 1992 bonds(approximately $50 million) and its uninsured Series 1997 bonds (approximately $29 million) issued throughAllegheny County Hospital Development Authority. St. Francis Medical Center also acted as a guarantor to St.Francis Hospital of New Castle (which defaulted on $15 million of its Series 1992 bonds) and St. Francis Health CareServices (defaulted on approximately $3 million of its Series 1993 bonds.)
Partially due to challenges associated with operating in a very competitive Pittsburgh market, St. Francis MedicalCenter experienced increasing operating losses, and growing dependence on investment income to offset operatingdeficits. Prompted by a steady decline in the system's cash position, in August 2002, St. Francis Medical Centerentered into an asset purchase agreement with regional organizations to purchase certain fixed assets of the system.
A partial distribution of principal and accrued interest of approximately $2,447.03 per $5000 bond was paid tobondholders on November 17, 2003. A settlement with creditors was reached in December 2003 and a finaldistribution of settlement proceeds was made in January of 2004. With the exception of the Series 1992 St. FrancisMedical Center bonds, which were insured by Ambac and paid in full, the final recovery for the bondholders was lessthan 100%.
Rating History RATING DATE RATING RATING ACTION
1 JAN 1992 A ASSIGNED15 NOV 1996 A3 REFINED16 MAR 1999 Baa1 DOWNGRADED17 APR 2000 Ba2 DOWNGRADED19 APR 2001 Ba3 DOWNGRADED22 MAR 2002 B3 DOWNGRADED1 MAR 2004 Caa1 DOWNGRADED2 MAR 2004 — WITHDRAWN
36 Moody’s Rating Methodology
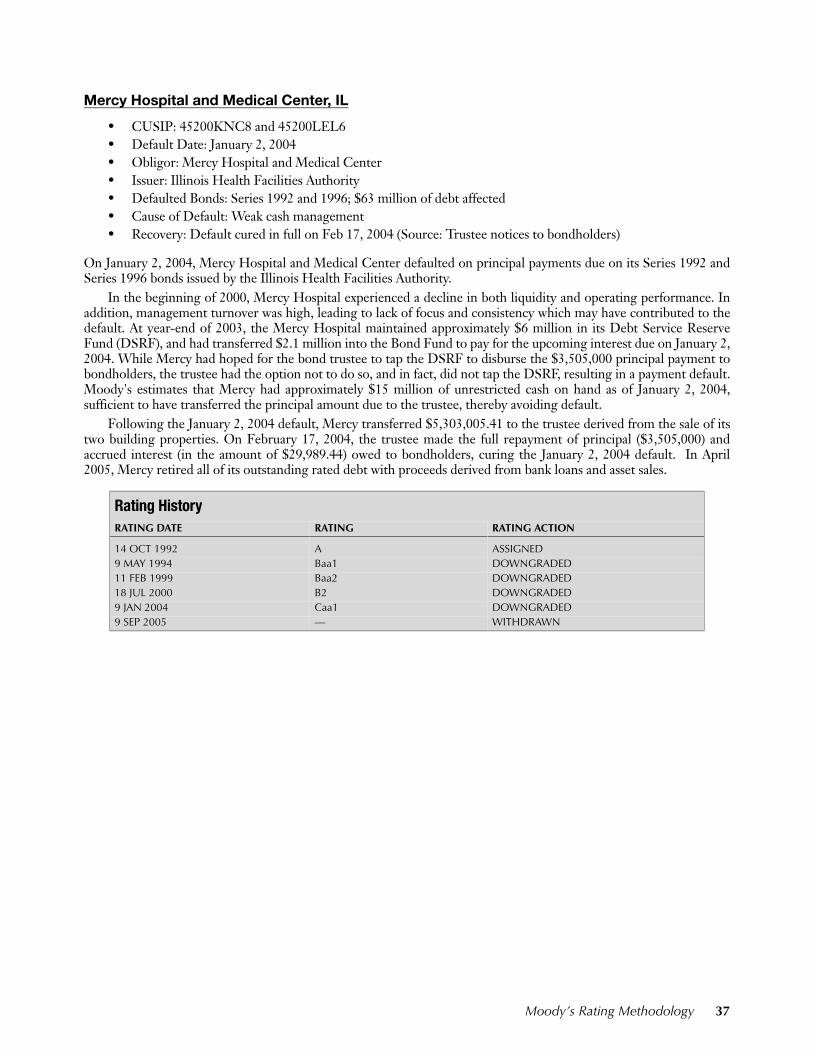
Mercy Hospital and Medical Center, IL
• CUSIP: 45200KNC8 and 45200LEL6• Default Date: January 2, 2004• Obligor: Mercy Hospital and Medical Center• Issuer: Illinois Health Facilities Authority• Defaulted Bonds: Series 1992 and 1996; $63 million of debt affected• Cause of Default: Weak cash management • Recovery: Default cured in full on Feb 17, 2004 (Source: Trustee notices to bondholders)
On January 2, 2004, Mercy Hospital and Medical Center defaulted on principal payments due on its Series 1992 andSeries 1996 bonds issued by the Illinois Health Facilities Authority.
In the beginning of 2000, Mercy Hospital experienced a decline in both liquidity and operating performance. Inaddition, management turnover was high, leading to lack of focus and consistency which may have contributed to thedefault. At year-end of 2003, the Mercy Hospital maintained approximately $6 million in its Debt Service ReserveFund (DSRF), and had transferred $2.1 million into the Bond Fund to pay for the upcoming interest due on January 2,2004. While Mercy had hoped for the bond trustee to tap the DSRF to disburse the $3,505,000 principal payment tobondholders, the trustee had the option not to do so, and in fact, did not tap the DSRF, resulting in a payment default.Moody's estimates that Mercy had approximately $15 million of unrestricted cash on hand as of January 2, 2004,sufficient to have transferred the principal amount due to the trustee, thereby avoiding default.
Following the January 2, 2004 default, Mercy transferred $5,303,005.41 to the trustee derived from the sale of itstwo building properties. On February 17, 2004, the trustee made the full repayment of principal ($3,505,000) andaccrued interest (in the amount of $29,989.44) owed to bondholders, curing the January 2, 2004 default. In April2005, Mercy retired all of its outstanding rated debt with proceeds derived from bank loans and asset sales.
Rating HistoryRATING DATE RATING RATING ACTION
14 OCT 1992 A ASSIGNED9 MAY 1994 Baa1 DOWNGRADED11 FEB 1999 Baa2 DOWNGRADED 18 JUL 2000 B2 DOWNGRADED9 JAN 2004 Caa1 DOWNGRADED9 SEP 2005 — WITHDRAWN
Moody’s Rating Methodology 37
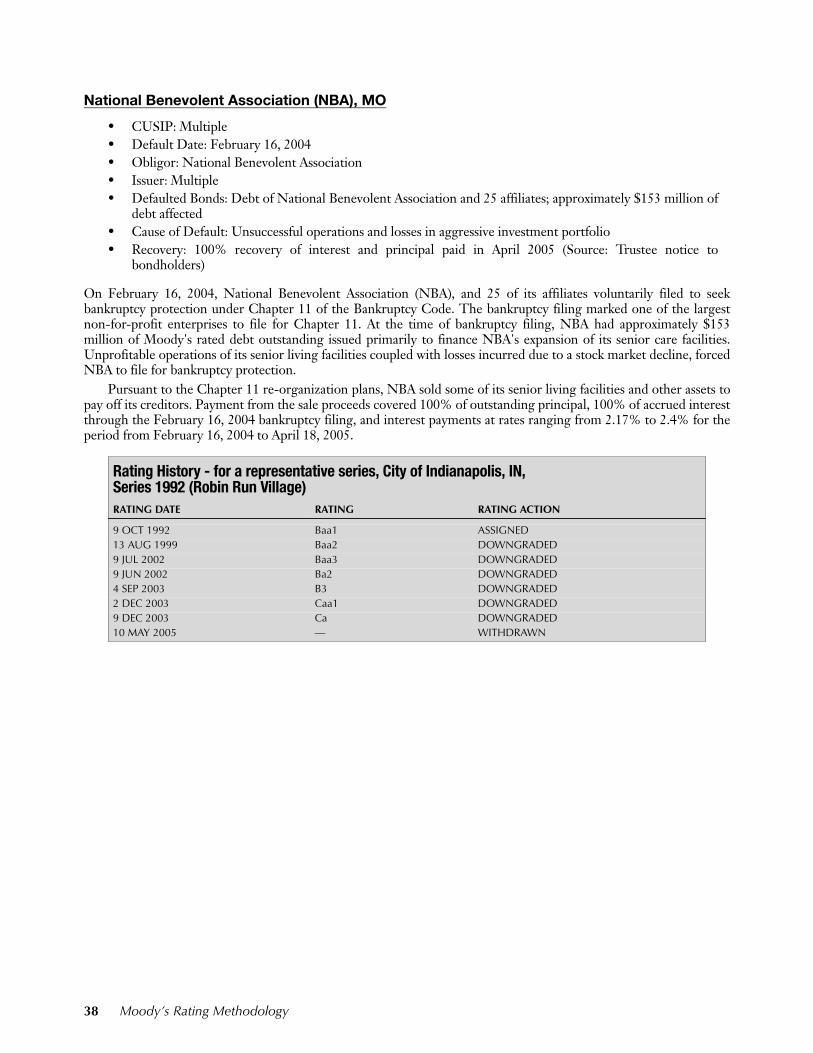
National Benevolent Association (NBA), MO
• CUSIP: Multiple• Default Date: February 16, 2004• Obligor: National Benevolent Association• Issuer: Multiple• Defaulted Bonds: Debt of National Benevolent Association and 25 affiliates; approximately $153 million of
debt affected• Cause of Default: Unsuccessful operations and losses in aggressive investment portfolio• Recovery: 100% recovery of interest and principal paid in April 2005 (Source: Trustee notice to
bondholders)
On February 16, 2004, National Benevolent Association (NBA), and 25 of its affiliates voluntarily filed to seekbankruptcy protection under Chapter 11 of the Bankruptcy Code. The bankruptcy filing marked one of the largestnon-for-profit enterprises to file for Chapter 11. At the time of bankruptcy filing, NBA had approximately $153million of Moody's rated debt outstanding issued primarily to finance NBA's expansion of its senior care facilities.Unprofitable operations of its senior living facilities coupled with losses incurred due to a stock market decline, forcedNBA to file for bankruptcy protection.
Pursuant to the Chapter 11 re-organization plans, NBA sold some of its senior living facilities and other assets topay off its creditors. Payment from the sale proceeds covered 100% of outstanding principal, 100% of accrued interestthrough the February 16, 2004 bankruptcy filing, and interest payments at rates ranging from 2.17% to 2.4% for theperiod from February 16, 2004 to April 18, 2005.
Rating History - for a representative series, City of Indianapolis, IN, Series 1992 (Robin Run Village)RATING DATE RATING RATING ACTION
9 OCT 1992 Baa1 ASSIGNED13 AUG 1999 Baa2 DOWNGRADED9 JUL 2002 Baa3 DOWNGRADED9 JUN 2002 Ba2 DOWNGRADED4 SEP 2003 B3 DOWNGRADED2 DEC 2003 Caa1 DOWNGRADED9 DEC 2003 Ca DOWNGRADED10 MAY 2005 — WITHDRAWN
38 Moody’s Rating Methodology
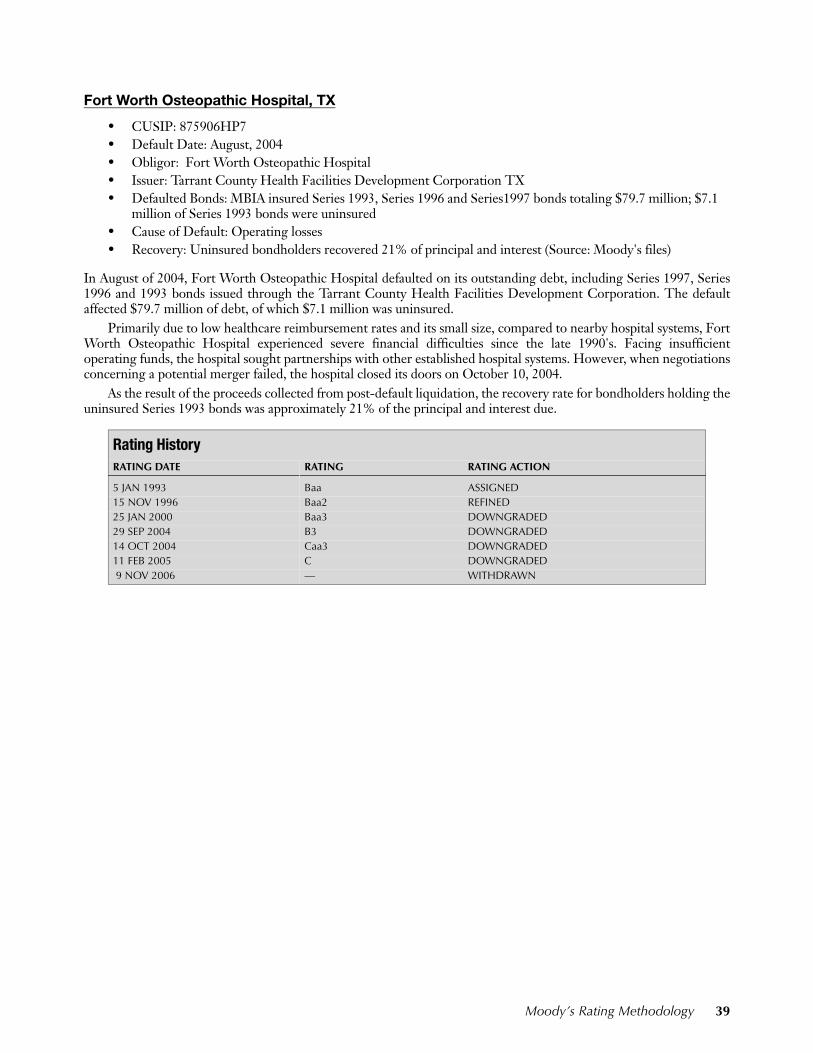
Fort Worth Osteopathic Hospital, TX
• CUSIP: 875906HP7• Default Date: August, 2004• Obligor: Fort Worth Osteopathic Hospital• Issuer: Tarrant County Health Facilities Development Corporation TX• Defaulted Bonds: MBIA insured Series 1993, Series 1996 and Series1997 bonds totaling $79.7 million; $7.1
million of Series 1993 bonds were uninsured• Cause of Default: Operating losses• Recovery: Uninsured bondholders recovered 21% of principal and interest (Source: Moody's files)
In August of 2004, Fort Worth Osteopathic Hospital defaulted on its outstanding debt, including Series 1997, Series1996 and 1993 bonds issued through the Tarrant County Health Facilities Development Corporation. The defaultaffected $79.7 million of debt, of which $7.1 million was uninsured.
Primarily due to low healthcare reimbursement rates and its small size, compared to nearby hospital systems, FortWorth Osteopathic Hospital experienced severe financial difficulties since the late 1990's. Facing insufficientoperating funds, the hospital sought partnerships with other established hospital systems. However, when negotiationsconcerning a potential merger failed, the hospital closed its doors on October 10, 2004.
As the result of the proceeds collected from post-default liquidation, the recovery rate for bondholders holding theuninsured Series 1993 bonds was approximately 21% of the principal and interest due.
Rating HistoryRATING DATE RATING RATING ACTION
5 JAN 1993 Baa ASSIGNED15 NOV 1996 Baa2 REFINED25 JAN 2000 Baa3 DOWNGRADED29 SEP 2004 B3 DOWNGRADED14 OCT 2004 Caa3 DOWNGRADED11 FEB 2005 C DOWNGRADED 9 NOV 2006 — WITHDRAWN
Moody’s Rating Methodology 39
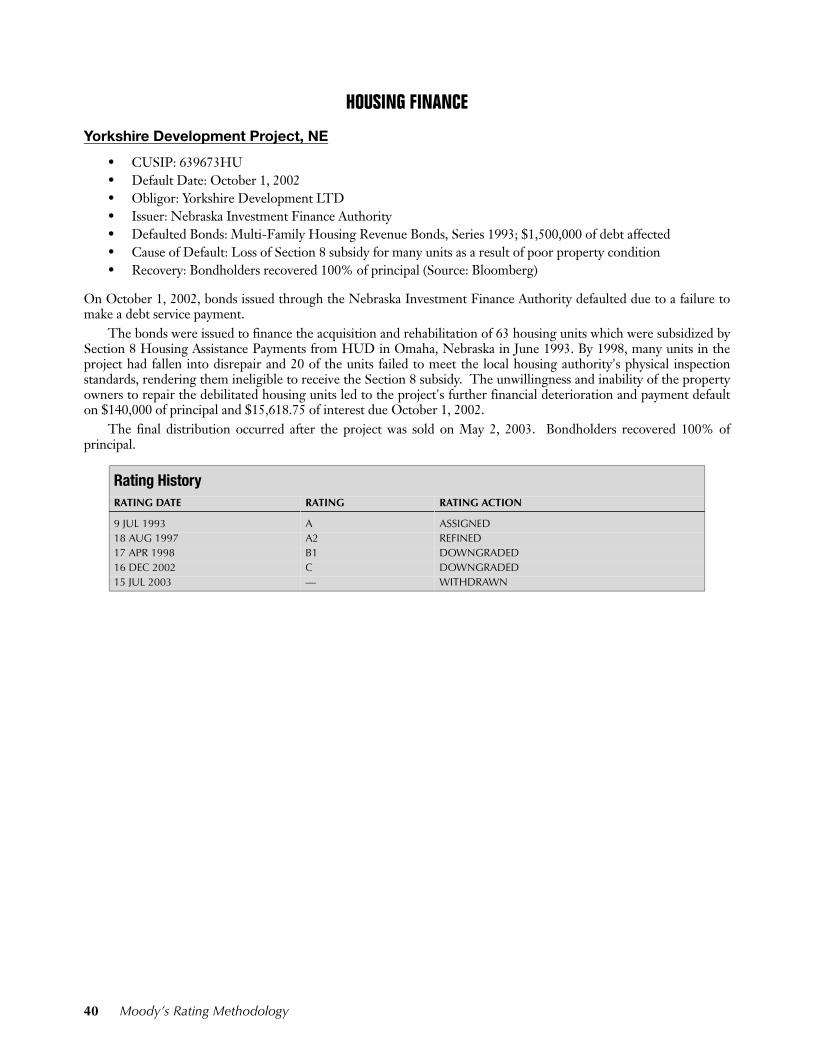
HOUSING FINANCE
Yorkshire Development Project, NE
• CUSIP: 639673HU• Default Date: October 1, 2002• Obligor: Yorkshire Development LTD • Issuer: Nebraska Investment Finance Authority• Defaulted Bonds: Multi-Family Housing Revenue Bonds, Series 1993; $1,500,000 of debt affected• Cause of Default: Loss of Section 8 subsidy for many units as a result of poor property condition• Recovery: Bondholders recovered 100% of principal (Source: Bloomberg)
On October 1, 2002, bonds issued through the Nebraska Investment Finance Authority defaulted due to a failure tomake a debt service payment.
The bonds were issued to finance the acquisition and rehabilitation of 63 housing units which were subsidized bySection 8 Housing Assistance Payments from HUD in Omaha, Nebraska in June 1993. By 1998, many units in theproject had fallen into disrepair and 20 of the units failed to meet the local housing authority's physical inspectionstandards, rendering them ineligible to receive the Section 8 subsidy. The unwillingness and inability of the propertyowners to repair the debilitated housing units led to the project's further financial deterioration and payment defaulton $140,000 of principal and $15,618.75 of interest due October 1, 2002.
The final distribution occurred after the project was sold on May 2, 2003. Bondholders recovered 100% ofprincipal.
Rating History RATING DATE RATING RATING ACTION
9 JUL 1993 A ASSIGNED18 AUG 1997 A2 REFINED17 APR 1998 B1 DOWNGRADED16 DEC 2002 C DOWNGRADED15 JUL 2003 — WITHDRAWN
40 Moody’s Rating Methodology
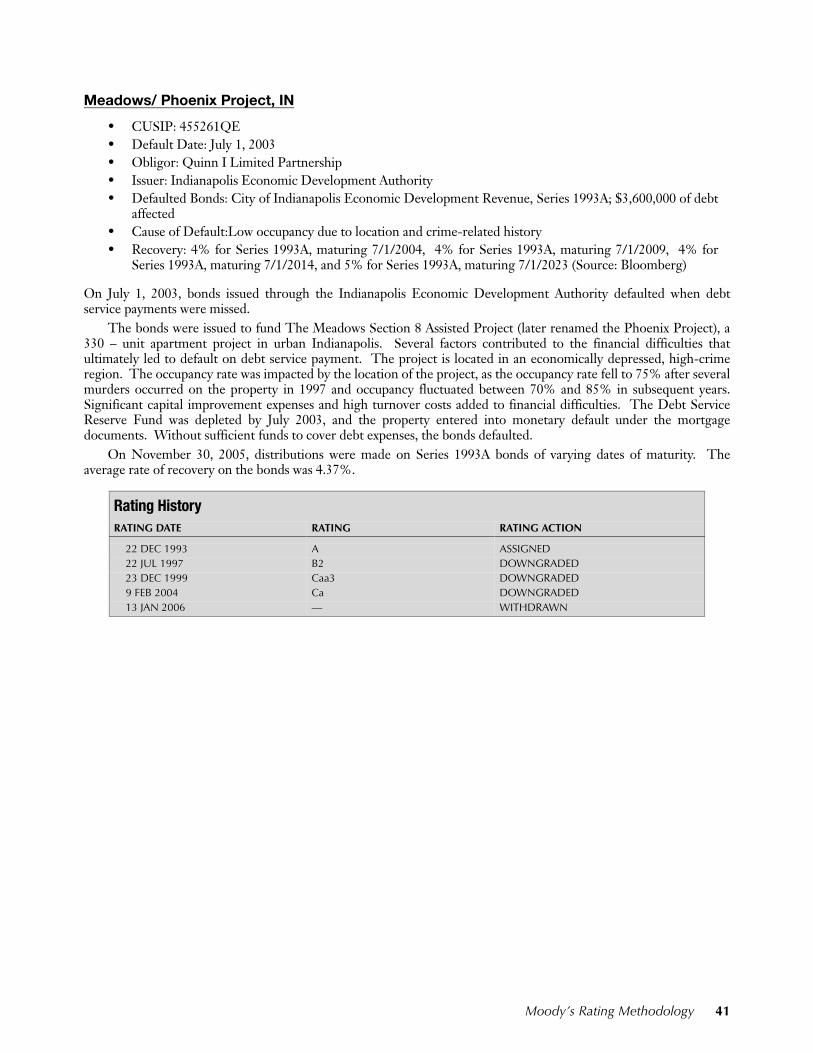
Meadows/ Phoenix Project, IN
• CUSIP: 455261QE• Default Date: July 1, 2003• Obligor: Quinn I Limited Partnership• Issuer: Indianapolis Economic Development Authority• Defaulted Bonds: City of Indianapolis Economic Development Revenue, Series 1993A; $3,600,000 of debt
affected• Cause of Default:Low occupancy due to location and crime-related history• Recovery: 4% for Series 1993A, maturing 7/1/2004, 4% for Series 1993A, maturing 7/1/2009, 4% for
Series 1993A, maturing 7/1/2014, and 5% for Series 1993A, maturing 7/1/2023 (Source: Bloomberg)
On July 1, 2003, bonds issued through the Indianapolis Economic Development Authority defaulted when debtservice payments were missed.
The bonds were issued to fund The Meadows Section 8 Assisted Project (later renamed the Phoenix Project), a330 – unit apartment project in urban Indianapolis. Several factors contributed to the financial difficulties thatultimately led to default on debt service payment. The project is located in an economically depressed, high-crimeregion. The occupancy rate was impacted by the location of the project, as the occupancy rate fell to 75% after severalmurders occurred on the property in 1997 and occupancy fluctuated between 70% and 85% in subsequent years.Significant capital improvement expenses and high turnover costs added to financial difficulties. The Debt ServiceReserve Fund was depleted by July 2003, and the property entered into monetary default under the mortgagedocuments. Without sufficient funds to cover debt expenses, the bonds defaulted.
On November 30, 2005, distributions were made on Series 1993A bonds of varying dates of maturity. Theaverage rate of recovery on the bonds was 4.37%.
Rating History RATING DATE RATING RATING ACTION
22 DEC 1993 A ASSIGNED 22 JUL 1997 B2 DOWNGRADED 23 DEC 1999 Caa3 DOWNGRADED 9 FEB 2004 Ca DOWNGRADED 13 JAN 2006 — WITHDRAWN
Moody’s Rating Methodology 41
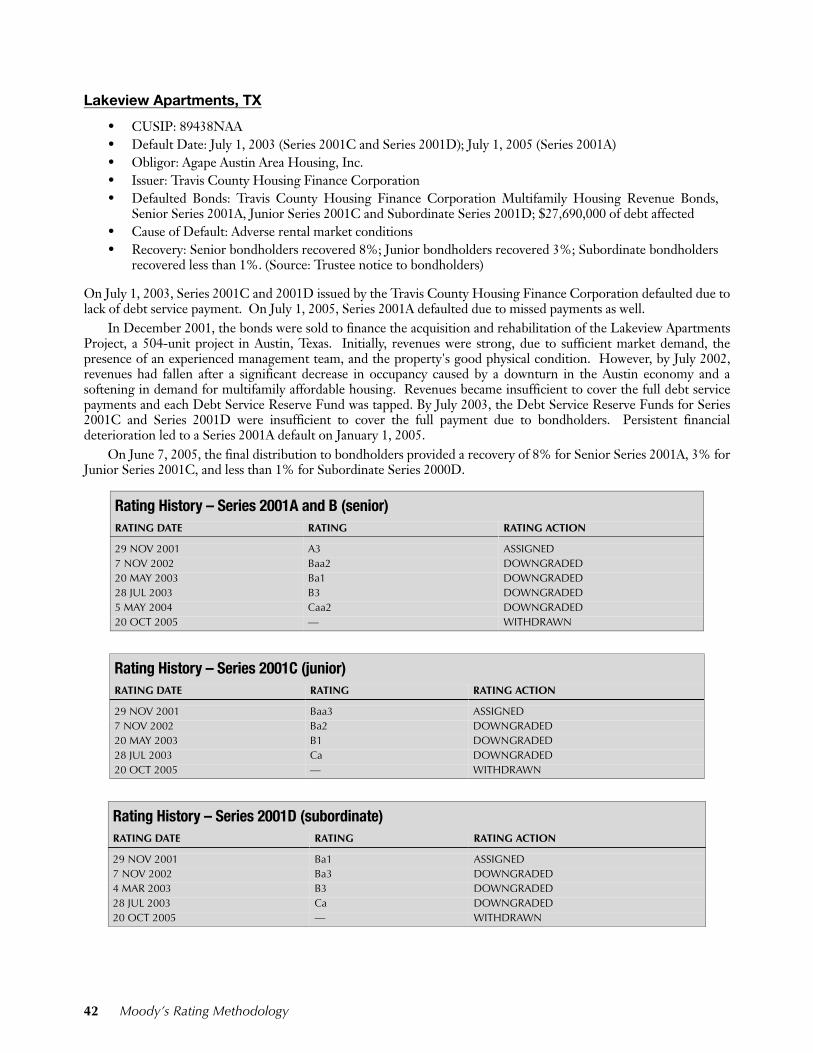
Lakeview Apartments, TX
• CUSIP: 89438NAA• Default Date: July 1, 2003 (Series 2001C and Series 2001D); July 1, 2005 (Series 2001A)• Obligor: Agape Austin Area Housing, Inc. • Issuer: Travis County Housing Finance Corporation• Defaulted Bonds: Travis County Housing Finance Corporation Multifamily Housing Revenue Bonds,
Senior Series 2001A, Junior Series 2001C and Subordinate Series 2001D; $27,690,000 of debt affected• Cause of Default: Adverse rental market conditions• Recovery: Senior bondholders recovered 8%; Junior bondholders recovered 3%; Subordinate bondholders
recovered less than 1%. (Source: Trustee notice to bondholders)
On July 1, 2003, Series 2001C and 2001D issued by the Travis County Housing Finance Corporation defaulted due tolack of debt service payment. On July 1, 2005, Series 2001A defaulted due to missed payments as well.
In December 2001, the bonds were sold to finance the acquisition and rehabilitation of the Lakeview ApartmentsProject, a 504-unit project in Austin, Texas. Initially, revenues were strong, due to sufficient market demand, thepresence of an experienced management team, and the property's good physical condition. However, by July 2002,revenues had fallen after a significant decrease in occupancy caused by a downturn in the Austin economy and asoftening in demand for multifamily affordable housing. Revenues became insufficient to cover the full debt servicepayments and each Debt Service Reserve Fund was tapped. By July 2003, the Debt Service Reserve Funds for Series2001C and Series 2001D were insufficient to cover the full payment due to bondholders. Persistent financialdeterioration led to a Series 2001A default on January 1, 2005.
On June 7, 2005, the final distribution to bondholders provided a recovery of 8% for Senior Series 2001A, 3% forJunior Series 2001C, and less than 1% for Subordinate Series 2000D.
Rating History – Series 2001A and B (senior)RATING DATE RATING RATING ACTION
29 NOV 2001 A3 ASSIGNED7 NOV 2002 Baa2 DOWNGRADED20 MAY 2003 Ba1 DOWNGRADED28 JUL 2003 B3 DOWNGRADED5 MAY 2004 Caa2 DOWNGRADED20 OCT 2005 — WITHDRAWN
Rating History – Series 2001C (junior)RATING DATE RATING RATING ACTION
29 NOV 2001 Baa3 ASSIGNED7 NOV 2002 Ba2 DOWNGRADED20 MAY 2003 B1 DOWNGRADED28 JUL 2003 Ca DOWNGRADED20 OCT 2005 — WITHDRAWN
Rating History – Series 2001D (subordinate)RATING DATE RATING RATING ACTION
29 NOV 2001 Ba1 ASSIGNED7 NOV 2002 Ba3 DOWNGRADED4 MAR 2003 B3 DOWNGRADED28 JUL 2003 Ca DOWNGRADED20 OCT 2005 — WITHDRAWN
42 Moody’s Rating Methodology
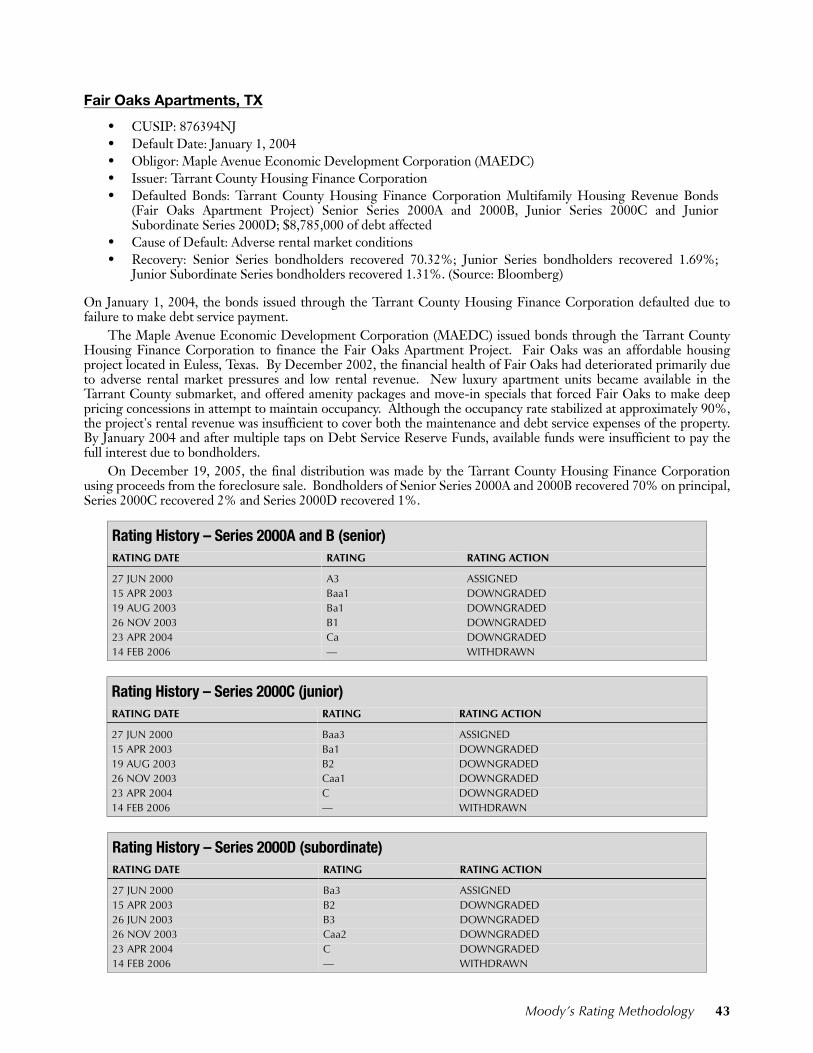
Fair Oaks Apartments, TX
• CUSIP: 876394NJ• Default Date: January 1, 2004• Obligor: Maple Avenue Economic Development Corporation (MAEDC)• Issuer: Tarrant County Housing Finance Corporation• Defaulted Bonds: Tarrant County Housing Finance Corporation Multifamily Housing Revenue Bonds
(Fair Oaks Apartment Project) Senior Series 2000A and 2000B, Junior Series 2000C and JuniorSubordinate Series 2000D; $8,785,000 of debt affected
• Cause of Default: Adverse rental market conditions• Recovery: Senior Series bondholders recovered 70.32%; Junior Series bondholders recovered 1.69%;
Junior Subordinate Series bondholders recovered 1.31%. (Source: Bloomberg)
On January 1, 2004, the bonds issued through the Tarrant County Housing Finance Corporation defaulted due tofailure to make debt service payment.
The Maple Avenue Economic Development Corporation (MAEDC) issued bonds through the Tarrant CountyHousing Finance Corporation to finance the Fair Oaks Apartment Project. Fair Oaks was an affordable housingproject located in Euless, Texas. By December 2002, the financial health of Fair Oaks had deteriorated primarily dueto adverse rental market pressures and low rental revenue. New luxury apartment units became available in theTarrant County submarket, and offered amenity packages and move-in specials that forced Fair Oaks to make deeppricing concessions in attempt to maintain occupancy. Although the occupancy rate stabilized at approximately 90%,the project's rental revenue was insufficient to cover both the maintenance and debt service expenses of the property.By January 2004 and after multiple taps on Debt Service Reserve Funds, available funds were insufficient to pay thefull interest due to bondholders.
On December 19, 2005, the final distribution was made by the Tarrant County Housing Finance Corporationusing proceeds from the foreclosure sale. Bondholders of Senior Series 2000A and 2000B recovered 70% on principal,Series 2000C recovered 2% and Series 2000D recovered 1%.
Rating History – Series 2000A and B (senior)RATING DATE RATING RATING ACTION
27 JUN 2000 A3 ASSIGNED15 APR 2003 Baa1 DOWNGRADED19 AUG 2003 Ba1 DOWNGRADED26 NOV 2003 B1 DOWNGRADED23 APR 2004 Ca DOWNGRADED14 FEB 2006 — WITHDRAWN
Rating History – Series 2000C (junior)RATING DATE RATING RATING ACTION
27 JUN 2000 Baa3 ASSIGNED15 APR 2003 Ba1 DOWNGRADED19 AUG 2003 B2 DOWNGRADED26 NOV 2003 Caa1 DOWNGRADED23 APR 2004 C DOWNGRADED14 FEB 2006 — WITHDRAWN
Rating History – Series 2000D (subordinate)RATING DATE RATING RATING ACTION
27 JUN 2000 Ba3 ASSIGNED15 APR 2003 B2 DOWNGRADED26 JUN 2003 B3 DOWNGRADED26 NOV 2003 Caa2 DOWNGRADED23 APR 2004 C DOWNGRADED14 FEB 2006 — WITHDRAWN
Moody’s Rating Methodology 43
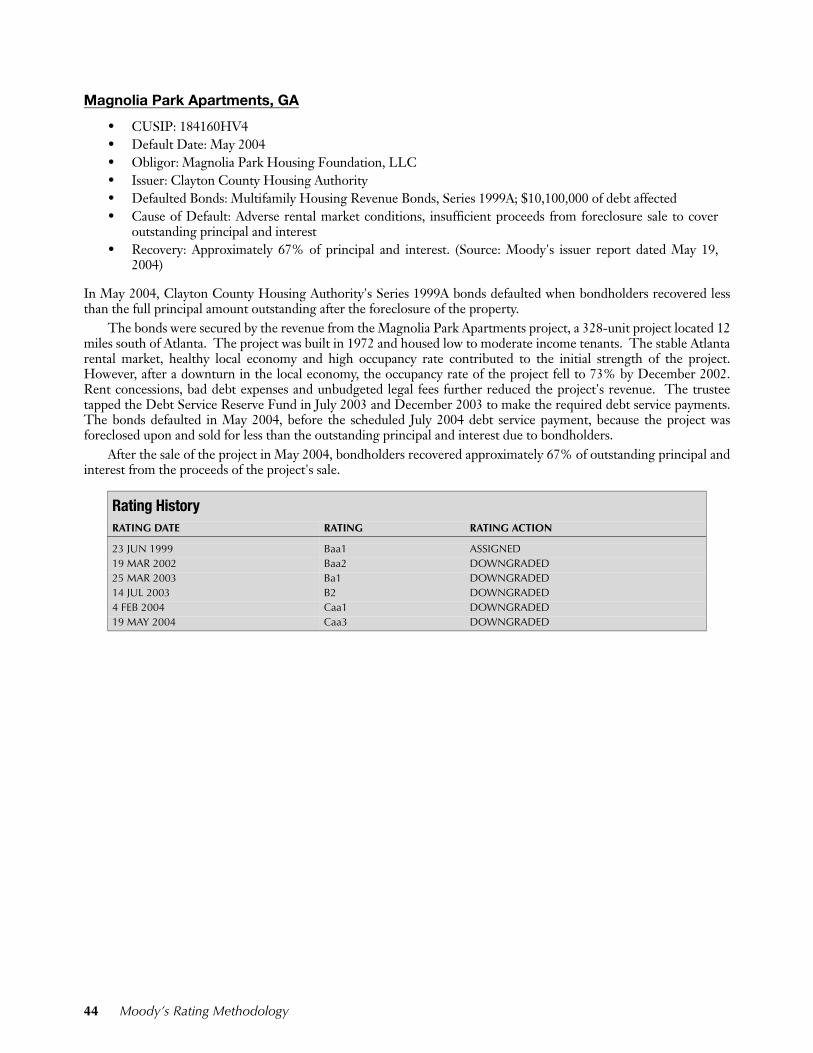
Magnolia Park Apartments, GA
• CUSIP: 184160HV4• Default Date: May 2004• Obligor: Magnolia Park Housing Foundation, LLC• Issuer: Clayton County Housing Authority • Defaulted Bonds: Multifamily Housing Revenue Bonds, Series 1999A; $10,100,000 of debt affected• Cause of Default: Adverse rental market conditions, insufficient proceeds from foreclosure sale to cover
outstanding principal and interest • Recovery: Approximately 67% of principal and interest. (Source: Moody's issuer report dated May 19,
2004)
In May 2004, Clayton County Housing Authority's Series 1999A bonds defaulted when bondholders recovered lessthan the full principal amount outstanding after the foreclosure of the property.
The bonds were secured by the revenue from the Magnolia Park Apartments project, a 328-unit project located 12miles south of Atlanta. The project was built in 1972 and housed low to moderate income tenants. The stable Atlantarental market, healthy local economy and high occupancy rate contributed to the initial strength of the project.However, after a downturn in the local economy, the occupancy rate of the project fell to 73% by December 2002.Rent concessions, bad debt expenses and unbudgeted legal fees further reduced the project's revenue. The trusteetapped the Debt Service Reserve Fund in July 2003 and December 2003 to make the required debt service payments.The bonds defaulted in May 2004, before the scheduled July 2004 debt service payment, because the project wasforeclosed upon and sold for less than the outstanding principal and interest due to bondholders.
After the sale of the project in May 2004, bondholders recovered approximately 67% of outstanding principal andinterest from the proceeds of the project's sale.
Rating History RATING DATE RATING RATING ACTION
23 JUN 1999 Baa1 ASSIGNED19 MAR 2002 Baa2 DOWNGRADED25 MAR 2003 Ba1 DOWNGRADED14 JUL 2003 B2 DOWNGRADED4 FEB 2004 Caa1 DOWNGRADED19 MAY 2004 Caa3 DOWNGRADED
44 Moody’s Rating Methodology
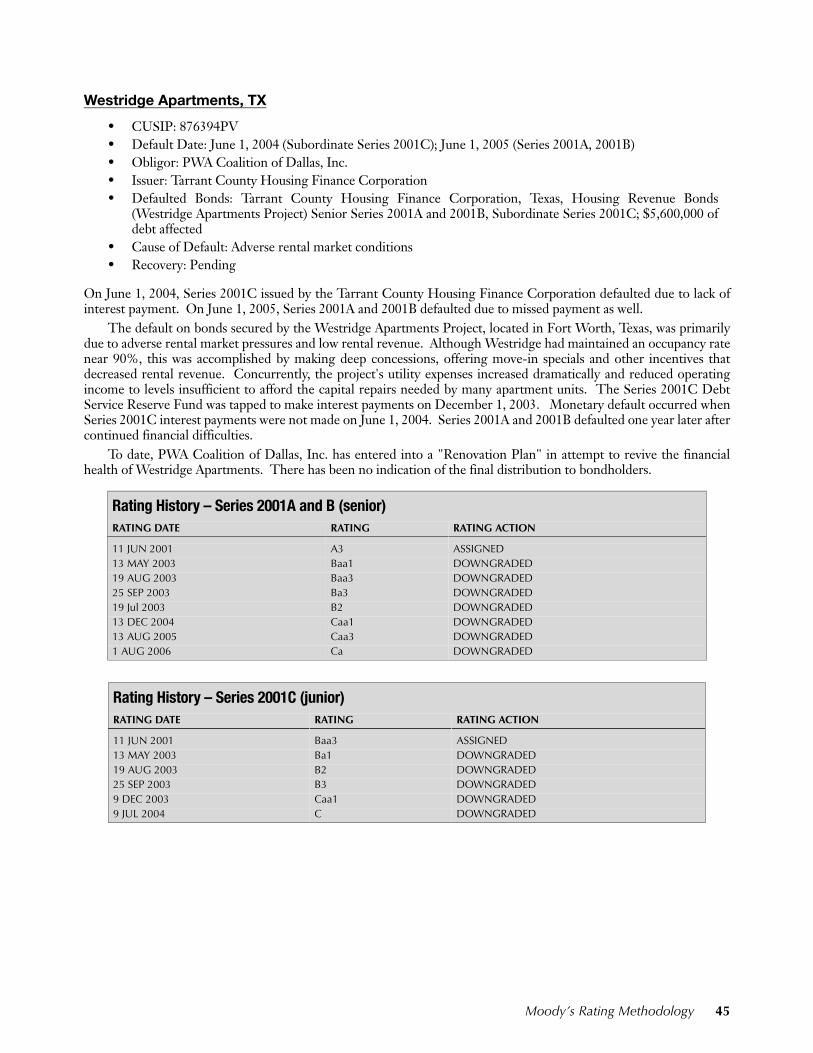
Westridge Apartments, TX
• CUSIP: 876394PV• Default Date: June 1, 2004 (Subordinate Series 2001C); June 1, 2005 (Series 2001A, 2001B)• Obligor: PWA Coalition of Dallas, Inc.• Issuer: Tarrant County Housing Finance Corporation• Defaulted Bonds: Tarrant County Housing Finance Corporation, Texas, Housing Revenue Bonds
(Westridge Apartments Project) Senior Series 2001A and 2001B, Subordinate Series 2001C; $5,600,000 ofdebt affected
• Cause of Default: Adverse rental market conditions• Recovery: Pending
On June 1, 2004, Series 2001C issued by the Tarrant County Housing Finance Corporation defaulted due to lack ofinterest payment. On June 1, 2005, Series 2001A and 2001B defaulted due to missed payment as well.
The default on bonds secured by the Westridge Apartments Project, located in Fort Worth, Texas, was primarilydue to adverse rental market pressures and low rental revenue. Although Westridge had maintained an occupancy ratenear 90%, this was accomplished by making deep concessions, offering move-in specials and other incentives thatdecreased rental revenue. Concurrently, the project's utility expenses increased dramatically and reduced operatingincome to levels insufficient to afford the capital repairs needed by many apartment units. The Series 2001C DebtService Reserve Fund was tapped to make interest payments on December 1, 2003. Monetary default occurred whenSeries 2001C interest payments were not made on June 1, 2004. Series 2001A and 2001B defaulted one year later aftercontinued financial difficulties.
To date, PWA Coalition of Dallas, Inc. has entered into a "Renovation Plan" in attempt to revive the financialhealth of Westridge Apartments. There has been no indication of the final distribution to bondholders.
Rating History – Series 2001A and B (senior)RATING DATE RATING RATING ACTION
11 JUN 2001 A3 ASSIGNED13 MAY 2003 Baa1 DOWNGRADED19 AUG 2003 Baa3 DOWNGRADED25 SEP 2003 Ba3 DOWNGRADED19 Jul 2003 B2 DOWNGRADED13 DEC 2004 Caa1 DOWNGRADED13 AUG 2005 Caa3 DOWNGRADED1 AUG 2006 Ca DOWNGRADED
Rating History – Series 2001C (junior)RATING DATE RATING RATING ACTION
11 JUN 2001 Baa3 ASSIGNED13 MAY 2003 Ba1 DOWNGRADED19 AUG 2003 B2 DOWNGRADED25 SEP 2003 B3 DOWNGRADED9 DEC 2003 Caa1 DOWNGRADED9 JUL 2004 C DOWNGRADED
Moody’s Rating Methodology 45
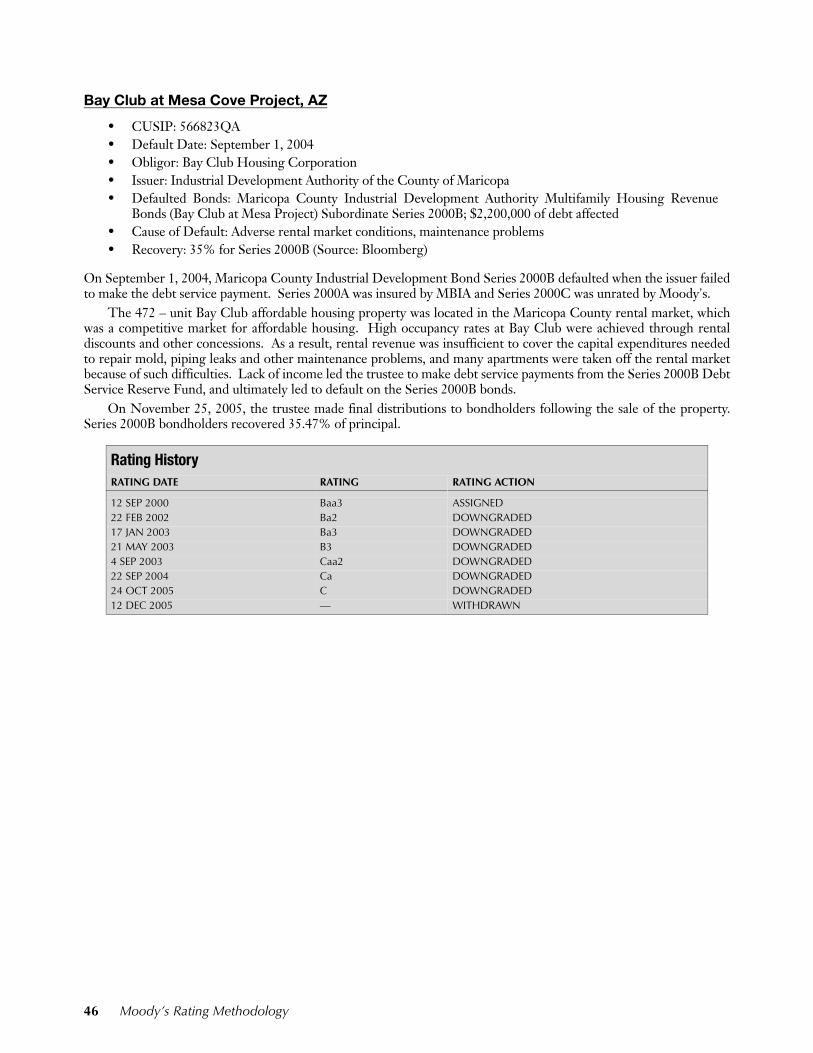
Bay Club at Mesa Cove Project, AZ
• CUSIP: 566823QA• Default Date: September 1, 2004• Obligor: Bay Club Housing Corporation• Issuer: Industrial Development Authority of the County of Maricopa• Defaulted Bonds: Maricopa County Industrial Development Authority Multifamily Housing Revenue
Bonds (Bay Club at Mesa Project) Subordinate Series 2000B; $2,200,000 of debt affected• Cause of Default: Adverse rental market conditions, maintenance problems• Recovery: 35% for Series 2000B (Source: Bloomberg)
On September 1, 2004, Maricopa County Industrial Development Bond Series 2000B defaulted when the issuer failedto make the debt service payment. Series 2000A was insured by MBIA and Series 2000C was unrated by Moody's.
The 472 – unit Bay Club affordable housing property was located in the Maricopa County rental market, whichwas a competitive market for affordable housing. High occupancy rates at Bay Club were achieved through rentaldiscounts and other concessions. As a result, rental revenue was insufficient to cover the capital expenditures neededto repair mold, piping leaks and other maintenance problems, and many apartments were taken off the rental marketbecause of such difficulties. Lack of income led the trustee to make debt service payments from the Series 2000B DebtService Reserve Fund, and ultimately led to default on the Series 2000B bonds.
On November 25, 2005, the trustee made final distributions to bondholders following the sale of the property.Series 2000B bondholders recovered 35.47% of principal.
Rating History RATING DATE RATING RATING ACTION
12 SEP 2000 Baa3 ASSIGNED22 FEB 2002 Ba2 DOWNGRADED17 JAN 2003 Ba3 DOWNGRADED21 MAY 2003 B3 DOWNGRADED4 SEP 2003 Caa2 DOWNGRADED22 SEP 2004 Ca DOWNGRADED24 OCT 2005 C DOWNGRADED12 DEC 2005 — WITHDRAWN
46 Moody’s Rating Methodology
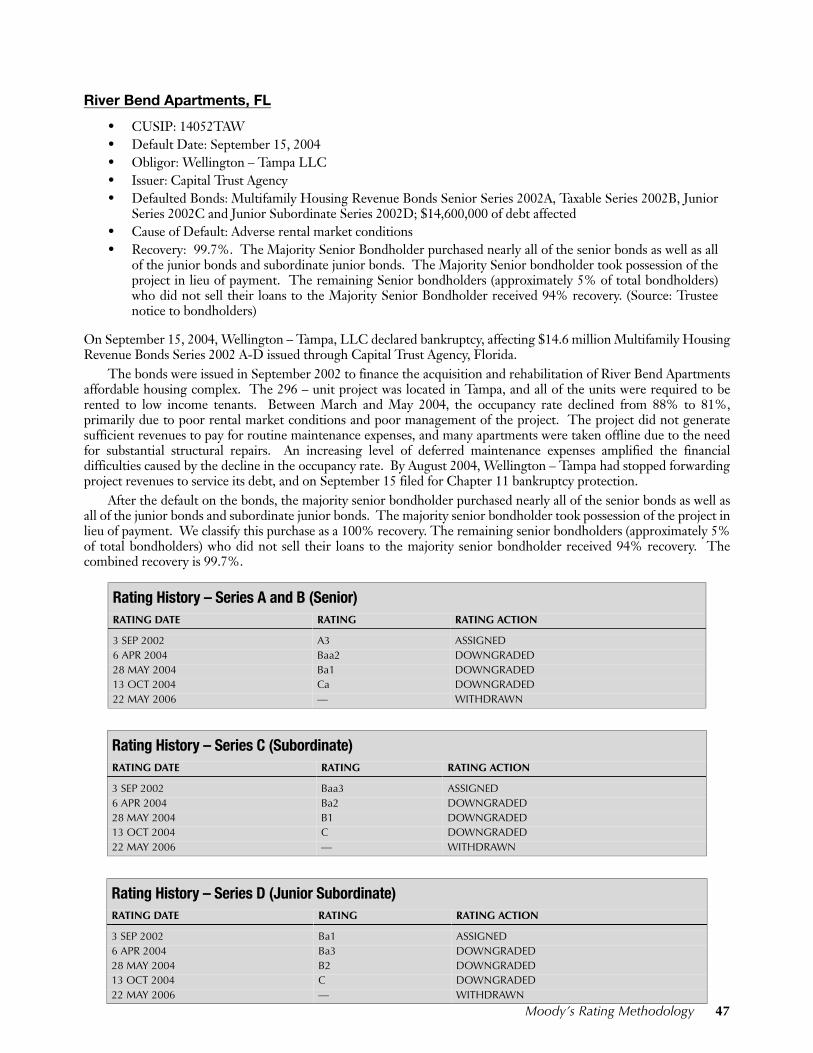
Moody’s Rating Methodology 47
River Bend Apartments, FL
• CUSIP: 14052TAW• Default Date: September 15, 2004• Obligor: Wellington – Tampa LLC• Issuer: Capital Trust Agency• Defaulted Bonds: Multifamily Housing Revenue Bonds Senior Series 2002A, Taxable Series 2002B, Junior
Series 2002C and Junior Subordinate Series 2002D; $14,600,000 of debt affected• Cause of Default: Adverse rental market conditions• Recovery: 99.7%. The Majority Senior Bondholder purchased nearly all of the senior bonds as well as all
of the junior bonds and subordinate junior bonds. The Majority Senior bondholder took possession of theproject in lieu of payment. The remaining Senior bondholders (approximately 5% of total bondholders)who did not sell their loans to the Majority Senior Bondholder received 94% recovery. (Source: Trusteenotice to bondholders)
On September 15, 2004, Wellington – Tampa, LLC declared bankruptcy, affecting $14.6 million Multifamily HousingRevenue Bonds Series 2002 A-D issued through Capital Trust Agency, Florida.
The bonds were issued in September 2002 to finance the acquisition and rehabilitation of River Bend Apartmentsaffordable housing complex. The 296 – unit project was located in Tampa, and all of the units were required to berented to low income tenants. Between March and May 2004, the occupancy rate declined from 88% to 81%,primarily due to poor rental market conditions and poor management of the project. The project did not generatesufficient revenues to pay for routine maintenance expenses, and many apartments were taken offline due to the needfor substantial structural repairs. An increasing level of deferred maintenance expenses amplified the financialdifficulties caused by the decline in the occupancy rate. By August 2004, Wellington – Tampa had stopped forwardingproject revenues to service its debt, and on September 15 filed for Chapter 11 bankruptcy protection.
After the default on the bonds, the majority senior bondholder purchased nearly all of the senior bonds as well asall of the junior bonds and subordinate junior bonds. The majority senior bondholder took possession of the project inlieu of payment. We classify this purchase as a 100% recovery. The remaining senior bondholders (approximately 5%of total bondholders) who did not sell their loans to the majority senior bondholder received 94% recovery. Thecombined recovery is 99.7%.
Rating History – Series A and B (Senior)RATING DATE RATING RATING ACTION
3 SEP 2002 A3 ASSIGNED6 APR 2004 Baa2 DOWNGRADED28 MAY 2004 Ba1 DOWNGRADED13 OCT 2004 Ca DOWNGRADED22 MAY 2006 — WITHDRAWN
Rating History – Series C (Subordinate)RATING DATE RATING RATING ACTION
3 SEP 2002 Baa3 ASSIGNED6 APR 2004 Ba2 DOWNGRADED28 MAY 2004 B1 DOWNGRADED13 OCT 2004 C DOWNGRADED22 MAY 2006 — WITHDRAWN
Rating History – Series D (Junior Subordinate)RATING DATE RATING RATING ACTION
3 SEP 2002 Ba1 ASSIGNED6 APR 2004 Ba3 DOWNGRADED28 MAY 2004 B2 DOWNGRADED13 OCT 2004 C DOWNGRADED22 MAY 2006 — WITHDRAWN
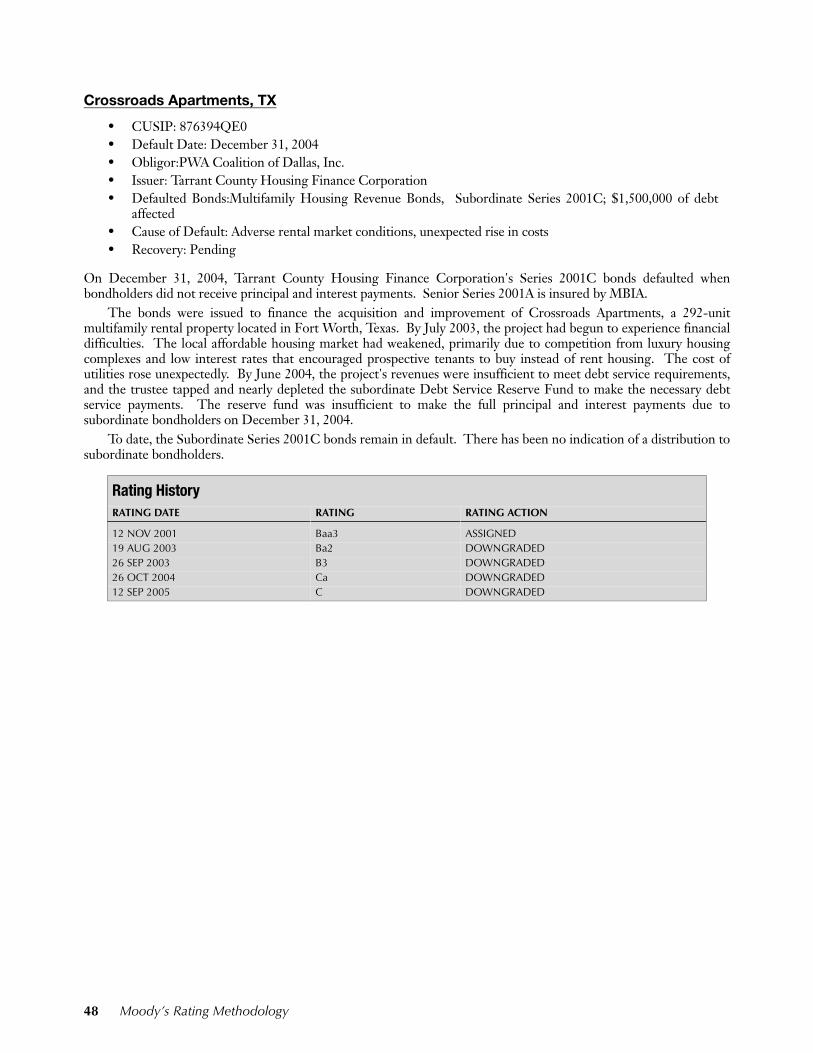
Crossroads Apartments, TX
• CUSIP: 876394QE0• Default Date: December 31, 2004• Obligor:PWA Coalition of Dallas, Inc. • Issuer: Tarrant County Housing Finance Corporation• Defaulted Bonds:Multifamily Housing Revenue Bonds, Subordinate Series 2001C; $1,500,000 of debt
affected• Cause of Default: Adverse rental market conditions, unexpected rise in costs• Recovery: Pending
On December 31, 2004, Tarrant County Housing Finance Corporation's Series 2001C bonds defaulted whenbondholders did not receive principal and interest payments. Senior Series 2001A is insured by MBIA.
The bonds were issued to finance the acquisition and improvement of Crossroads Apartments, a 292-unitmultifamily rental property located in Fort Worth, Texas. By July 2003, the project had begun to experience financialdifficulties. The local affordable housing market had weakened, primarily due to competition from luxury housingcomplexes and low interest rates that encouraged prospective tenants to buy instead of rent housing. The cost ofutilities rose unexpectedly. By June 2004, the project's revenues were insufficient to meet debt service requirements,and the trustee tapped and nearly depleted the subordinate Debt Service Reserve Fund to make the necessary debtservice payments. The reserve fund was insufficient to make the full principal and interest payments due tosubordinate bondholders on December 31, 2004.
To date, the Subordinate Series 2001C bonds remain in default. There has been no indication of a distribution tosubordinate bondholders.
Rating HistoryRATING DATE RATING RATING ACTION
12 NOV 2001 Baa3 ASSIGNED19 AUG 2003 Ba2 DOWNGRADED26 SEP 2003 B3 DOWNGRADED26 OCT 2004 Ca DOWNGRADED12 SEP 2005 C DOWNGRADED
48 Moody’s Rating Methodology
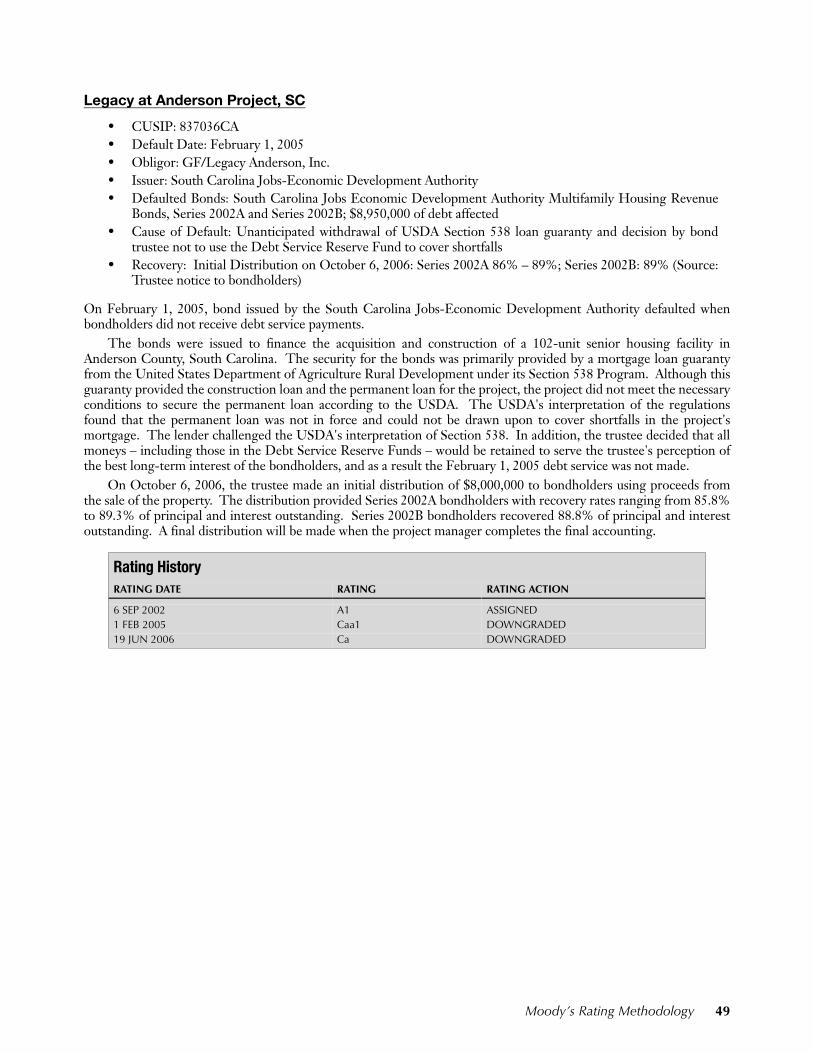
Legacy at Anderson Project, SC
• CUSIP: 837036CA• Default Date: February 1, 2005• Obligor: GF/Legacy Anderson, Inc. • Issuer: South Carolina Jobs-Economic Development Authority• Defaulted Bonds: South Carolina Jobs Economic Development Authority Multifamily Housing Revenue
Bonds, Series 2002A and Series 2002B; $8,950,000 of debt affected• Cause of Default: Unanticipated withdrawal of USDA Section 538 loan guaranty and decision by bond
trustee not to use the Debt Service Reserve Fund to cover shortfalls• Recovery: Initial Distribution on October 6, 2006: Series 2002A 86% – 89%; Series 2002B: 89% (Source:
Trustee notice to bondholders)
On February 1, 2005, bond issued by the South Carolina Jobs-Economic Development Authority defaulted whenbondholders did not receive debt service payments.
The bonds were issued to finance the acquisition and construction of a 102-unit senior housing facility inAnderson County, South Carolina. The security for the bonds was primarily provided by a mortgage loan guarantyfrom the United States Department of Agriculture Rural Development under its Section 538 Program. Although thisguaranty provided the construction loan and the permanent loan for the project, the project did not meet the necessaryconditions to secure the permanent loan according to the USDA. The USDA's interpretation of the regulationsfound that the permanent loan was not in force and could not be drawn upon to cover shortfalls in the project'smortgage. The lender challenged the USDA's interpretation of Section 538. In addition, the trustee decided that allmoneys – including those in the Debt Service Reserve Funds – would be retained to serve the trustee's perception ofthe best long-term interest of the bondholders, and as a result the February 1, 2005 debt service was not made.
On October 6, 2006, the trustee made an initial distribution of $8,000,000 to bondholders using proceeds fromthe sale of the property. The distribution provided Series 2002A bondholders with recovery rates ranging from 85.8%to 89.3% of principal and interest outstanding. Series 2002B bondholders recovered 88.8% of principal and interestoutstanding. A final distribution will be made when the project manager completes the final accounting.
Rating HistoryRATING DATE RATING RATING ACTION
6 SEP 2002 A1 ASSIGNED1 FEB 2005 Caa1 DOWNGRADED19 JUN 2006 Ca DOWNGRADED
Moody’s Rating Methodology 49
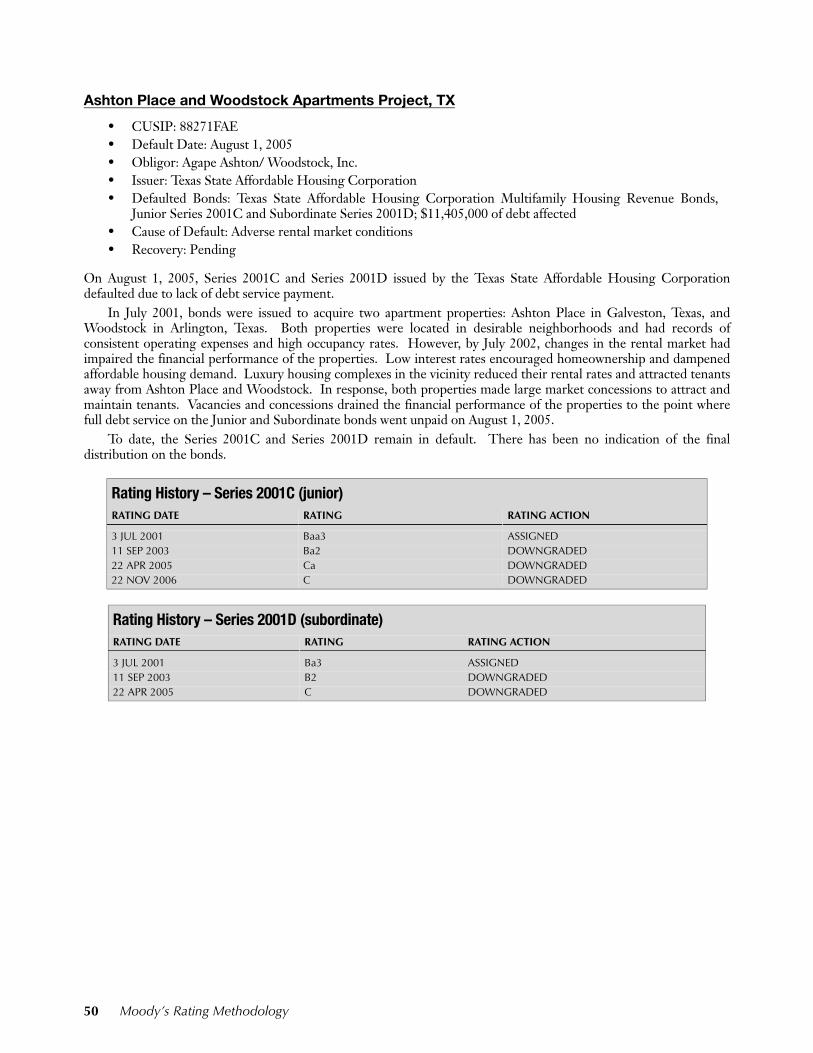
Ashton Place and Woodstock Apartments Project, TX
• CUSIP: 88271FAE• Default Date: August 1, 2005• Obligor: Agape Ashton/ Woodstock, Inc. • Issuer: Texas State Affordable Housing Corporation• Defaulted Bonds: Texas State Affordable Housing Corporation Multifamily Housing Revenue Bonds,
Junior Series 2001C and Subordinate Series 2001D; $11,405,000 of debt affected• Cause of Default: Adverse rental market conditions• Recovery: Pending
On August 1, 2005, Series 2001C and Series 2001D issued by the Texas State Affordable Housing Corporationdefaulted due to lack of debt service payment.
In July 2001, bonds were issued to acquire two apartment properties: Ashton Place in Galveston, Texas, andWoodstock in Arlington, Texas. Both properties were located in desirable neighborhoods and had records ofconsistent operating expenses and high occupancy rates. However, by July 2002, changes in the rental market hadimpaired the financial performance of the properties. Low interest rates encouraged homeownership and dampenedaffordable housing demand. Luxury housing complexes in the vicinity reduced their rental rates and attracted tenantsaway from Ashton Place and Woodstock. In response, both properties made large market concessions to attract andmaintain tenants. Vacancies and concessions drained the financial performance of the properties to the point wherefull debt service on the Junior and Subordinate bonds went unpaid on August 1, 2005.
To date, the Series 2001C and Series 2001D remain in default. There has been no indication of the finaldistribution on the bonds.
Rating History – Series 2001C (junior)RATING DATE RATING RATING ACTION
3 JUL 2001 Baa3 ASSIGNED11 SEP 2003 Ba2 DOWNGRADED22 APR 2005 Ca DOWNGRADED22 NOV 2006 C DOWNGRADED
Rating History – Series 2001D (subordinate)RATING DATE RATING RATING ACTION
3 JUL 2001 Ba3 ASSIGNED11 SEP 2003 B2 DOWNGRADED22 APR 2005 C DOWNGRADED
50 Moody’s Rating Methodology
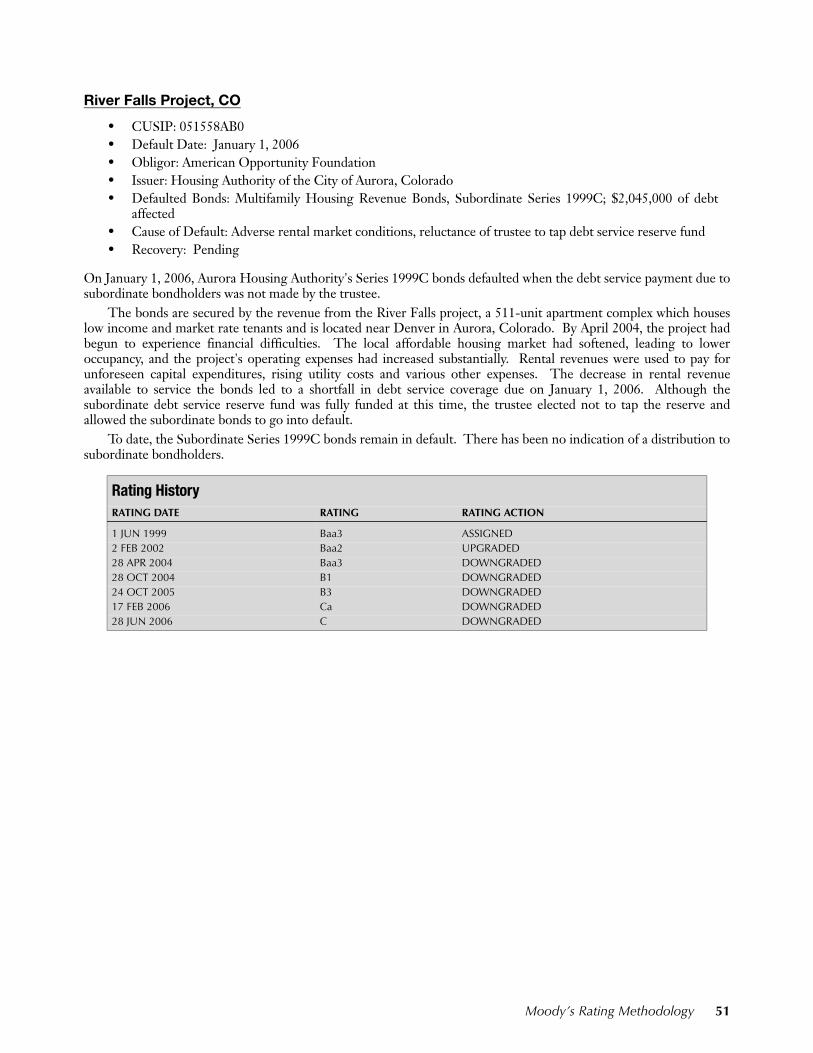
River Falls Project, CO
• CUSIP: 051558AB0• Default Date: January 1, 2006• Obligor: American Opportunity Foundation• Issuer: Housing Authority of the City of Aurora, Colorado • Defaulted Bonds: Multifamily Housing Revenue Bonds, Subordinate Series 1999C; $2,045,000 of debt
affected• Cause of Default: Adverse rental market conditions, reluctance of trustee to tap debt service reserve fund• Recovery: Pending
On January 1, 2006, Aurora Housing Authority's Series 1999C bonds defaulted when the debt service payment due tosubordinate bondholders was not made by the trustee.
The bonds are secured by the revenue from the River Falls project, a 511-unit apartment complex which houseslow income and market rate tenants and is located near Denver in Aurora, Colorado. By April 2004, the project hadbegun to experience financial difficulties. The local affordable housing market had softened, leading to loweroccupancy, and the project's operating expenses had increased substantially. Rental revenues were used to pay forunforeseen capital expenditures, rising utility costs and various other expenses. The decrease in rental revenueavailable to service the bonds led to a shortfall in debt service coverage due on January 1, 2006. Although thesubordinate debt service reserve fund was fully funded at this time, the trustee elected not to tap the reserve andallowed the subordinate bonds to go into default.
To date, the Subordinate Series 1999C bonds remain in default. There has been no indication of a distribution tosubordinate bondholders.
Rating History RATING DATE RATING RATING ACTION
1 JUN 1999 Baa3 ASSIGNED2 FEB 2002 Baa2 UPGRADED28 APR 2004 Baa3 DOWNGRADED28 OCT 2004 B1 DOWNGRADED24 OCT 2005 B3 DOWNGRADED17 FEB 2006 Ca DOWNGRADED28 JUN 2006 C DOWNGRADED
Moody’s Rating Methodology 51
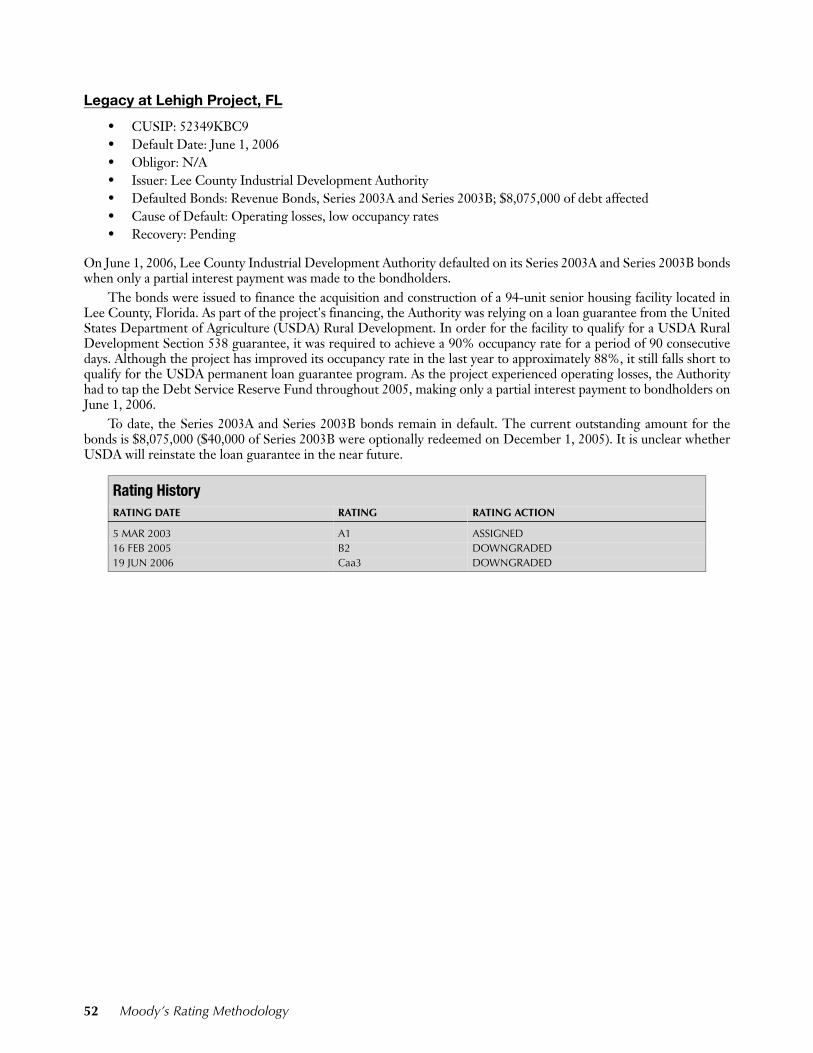
Legacy at Lehigh Project, FL
• CUSIP: 52349KBC9 • Default Date: June 1, 2006• Obligor: N/A• Issuer: Lee County Industrial Development Authority• Defaulted Bonds: Revenue Bonds, Series 2003A and Series 2003B; $8,075,000 of debt affected• Cause of Default: Operating losses, low occupancy rates• Recovery: Pending
On June 1, 2006, Lee County Industrial Development Authority defaulted on its Series 2003A and Series 2003B bondswhen only a partial interest payment was made to the bondholders.
The bonds were issued to finance the acquisition and construction of a 94-unit senior housing facility located inLee County, Florida. As part of the project's financing, the Authority was relying on a loan guarantee from the UnitedStates Department of Agriculture (USDA) Rural Development. In order for the facility to qualify for a USDA RuralDevelopment Section 538 guarantee, it was required to achieve a 90% occupancy rate for a period of 90 consecutivedays. Although the project has improved its occupancy rate in the last year to approximately 88%, it still falls short toqualify for the USDA permanent loan guarantee program. As the project experienced operating losses, the Authorityhad to tap the Debt Service Reserve Fund throughout 2005, making only a partial interest payment to bondholders onJune 1, 2006.
To date, the Series 2003A and Series 2003B bonds remain in default. The current outstanding amount for thebonds is $8,075,000 ($40,000 of Series 2003B were optionally redeemed on December 1, 2005). It is unclear whetherUSDA will reinstate the loan guarantee in the near future.
Rating History RATING DATE RATING RATING ACTION
5 MAR 2003 A1 ASSIGNED16 FEB 2005 B2 DOWNGRADED19 JUN 2006 Caa3 DOWNGRADED
52 Moody’s Rating Methodology
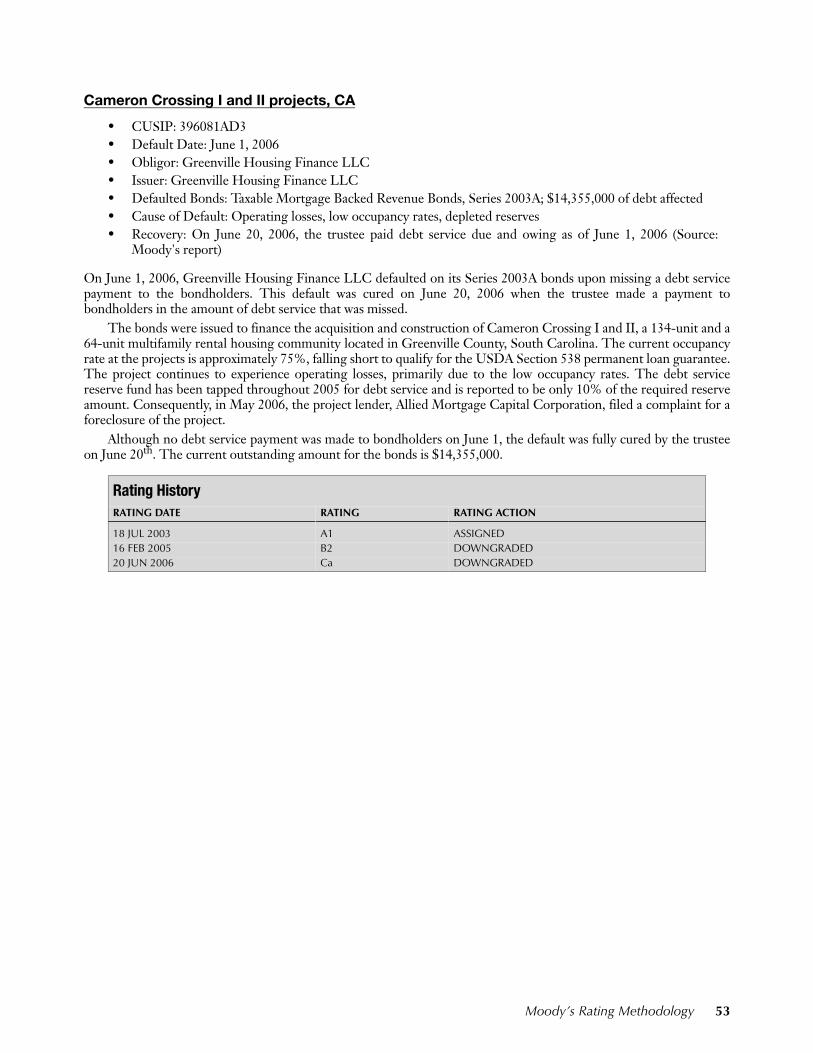
Cameron Crossing I and II projects, CA
• CUSIP: 396081AD3• Default Date: June 1, 2006 • Obligor: Greenville Housing Finance LLC • Issuer: Greenville Housing Finance LLC• Defaulted Bonds: Taxable Mortgage Backed Revenue Bonds, Series 2003A; $14,355,000 of debt affected• Cause of Default: Operating losses, low occupancy rates, depleted reserves• Recovery: On June 20, 2006, the trustee paid debt service due and owing as of June 1, 2006 (Source:
Moody's report)
On June 1, 2006, Greenville Housing Finance LLC defaulted on its Series 2003A bonds upon missing a debt servicepayment to the bondholders. This default was cured on June 20, 2006 when the trustee made a payment tobondholders in the amount of debt service that was missed.
The bonds were issued to finance the acquisition and construction of Cameron Crossing I and II, a 134-unit and a64-unit multifamily rental housing community located in Greenville County, South Carolina. The current occupancyrate at the projects is approximately 75%, falling short to qualify for the USDA Section 538 permanent loan guarantee.The project continues to experience operating losses, primarily due to the low occupancy rates. The debt servicereserve fund has been tapped throughout 2005 for debt service and is reported to be only 10% of the required reserveamount. Consequently, in May 2006, the project lender, Allied Mortgage Capital Corporation, filed a complaint for aforeclosure of the project.
Although no debt service payment was made to bondholders on June 1, the default was fully cured by the trusteeon June 20th. The current outstanding amount for the bonds is $14,355,000.
Rating History RATING DATE RATING RATING ACTION
18 JUL 2003 A1 ASSIGNED16 FEB 2005 B2 DOWNGRADED20 JUN 2006 Ca DOWNGRADED
Moody’s Rating Methodology 53
Appendix C: Derivation of Moody's Idealized Municipal Default Tables
In conjunction with the effort to further define the relationship between Moody's municipal bond ratings and Moody'sglobal rating scale, we have developed an "idealized" cumulative default probability table for the municipal market.The idealized cumulative default rate table represents our prospective look at default probabilities and adjustshistorical default data for statistical anomalies.
When combined with assumptions regarding average sub-sector loss severity, the idealized cumulative defaulttable provides a useful starting point for the analysis of expected loss for portfolios of municipal bonds.
Moody's developed the idealized cumulative default table to further clarify our expectations surrounding defaultrisk in the municipal market and for use in the models employed by our CDO, Financial Guarantor (FG), andManaged Funds analytic groups. Along with other risk measures and assumptions, idealized default rates are a keyinput in the various methodologies, including the Binomial Expansion Technique and the Monte Carlo Simulation-based CDOROMTM modeling, used by the Moody's Derivatives Group to calculate expected losses and rate anassortment of CDOs.
In Moody's FG model, default rates and expected recoveries factor into the estimation of the probabilitydistribution of losses a guarantor would face under a very wide range of scenarios given the unique composition of itsinsurance portfolio. The FG model is used for the assessment of a guarantor's claims-paying ability, and is one of thepillars of its overall credit evaluation.
Both models drive the need for idealized default rates that include a level of robustness to stress. The fact that themunicipal default data set contains limited observations compared to corporate data further strengthens the case forconservative assumptions on prospective default rates.
Moody's municipal finance idealized cumulative default rate table is based on a variety of adjustments of historicaldefault data to reflect the considerations above. In addition, it makes use of statistical patterns in corporate defaults tosmooth missing or "thin" municipal default data. Moody's has used a combination of historical information, indentureanalysis, and estimates of market participants and analysts to approximate expected severity of loss given default for thedifferent municipal sub-sectors.
54 Moody’s Rating Methodology
Related Research
Special Comments:Moody's US Municipal Bond Rating Scale, November 2002 (76553)Moody's Introduces Corporate Equivalent Ratings for Municipal Obligations Under Swap and Cross Border TaxableTransactions, April 2003 (77844)Request for Comment: Mapping of Moody's U.S. Municipal Bond Rating Scale to Moody's Corporate Rating Scaleand Assignment of Corporate Equivalent Ratings to Municipal Obligations (97921)Moody's U.S. Municipal Bond Rating Scale: Summary of Market Feedback (100478)The Incorporation of Joint-Default Analysis into Moody's Corporate, Financial and Government RatingMethodologies (91617)
To access any of these reports, click on the entry above. Note that these references are current as of the date of publication of this reportand that more recent reports may be available. All research may not be available to all clients.
Moody’s Rating Methodology 55

56 Moody’s Rating Methodology

Moody’s Rating Methodology 57
© Copyright 2007, Moody’s Investors Service, Inc. and/or its licensors and affiliates including Moody’s Assurance Company, Inc. (together, “MOODY’S”). All rights reserved. ALLINFORMATION CONTAINED HEREIN IS PROTECTED BY COPYRIGHT LAW AND NONE OF SUCH INFORMATION MAY BE COPIED OR OTHERWISE REPRODUCED, REPACKAGED,FURTHER TRANSMITTED, TRANSFERRED, DISSEMINATED, REDISTRIBUTED OR RESOLD, OR STORED FOR SUBSEQUENT USE FOR ANY SUCH PURPOSE, IN WHOLE OR IN PART, INANY FORM OR MANNER OR BY ANY MEANS WHATSOEVER, BY ANY PERSON WITHOUT MOODY’S PRIOR WRITTEN CONSENT. All information contained herein is obtained byMOODY’S from sources believed by it to be accurate and reliable. Because of the possibility of human or mechanical error as well as other factors, however, such information is provided “asis” without warranty of any kind and MOODY’S, in particular, makes no representation or warranty, express or implied, as to the accuracy, timeliness, completeness, merchantability or fitnessfor any particular purpose of any such information. Under no circumstances shall MOODY’S have any liability to any person or entity for (a) any loss or damage in whole or in part caused by,resulting from, or relating to, any error (negligent or otherwise) or other circumstance or contingency within or outside the control of MOODY’S or any of its directors, officers, employees oragents in connection with the procurement, collection, compilation, analysis, interpretation, communication, publication or delivery of any such information, or (b) any direct, indirect,special, consequential, compensatory or incidental damages whatsoever (including without limitation, lost profits), even if MOODY’S is advised in advance of the possibility of suchdamages, resulting from the use of or inability to use, any such information. The credit ratings and financial reporting analysis observations, if any, constituting part of the informationcontained herein are, and must be construed solely as, statements of opinion and not statements of fact or recommendations to purchase, sell or hold any securities. NO WARRANTY,EXPRESS OR IMPLIED, AS TO THE ACCURACY, TIMELINESS, COMPLETENESS, MERCHANTABILITY OR FITNESS FOR ANY PARTICULAR PURPOSE OF ANY SUCH RATING OR OTHEROPINION OR INFORMATION IS GIVEN OR MADE BY MOODY’S IN ANY FORM OR MANNER WHATSOEVER. Each rating or other opinion must be weighed solely as one factor in anyinvestment decision made by or on behalf of any user of the information contained herein, and each such user must accordingly make its own study and evaluation of each security and ofeach issuer and guarantor of, and each provider of credit support for, each security that it may consider purchasing, holding or selling.
MOODY’S hereby discloses that most issuers of debt securities (including corporate and municipal bonds, debentures, notes and commercial paper) and preferred stock rated byMOODY’S have, prior to assignment of any rating, agreed to pay to MOODY’S for appraisal and rating services rendered by it fees ranging from $1,500 to approximately $2,400,000.Moody’s Corporation (MCO) and its wholly-owned credit rating agency subsidiary, Moody’s Investors Service (MIS), also maintain policies and procedures to address the independence ofMIS’s ratings and rating processes. Information regarding certain affiliations that may exist between directors of MCO and rated entities, and between entities who hold ratings from MIS andhave also publicly reported to the SEC an ownership interest in MCO of more than 5%, is posted annually on Moody’s website at www.moodys.com under the heading “ShareholderRelations — Corporate Governance — Director and Shareholder Affiliation Policy.”
58 Moody’s Rating Methodology
To order reprints of this report (100 copies minimum), please call 1.212.553.1658.Report Number: 102249
Authors Senior Associates Senior Production Associates
Naomi Richman Dmitriy Plit Wing ChanBart Oosterveld Ross Gabrielson Cassina BrooksJohn NelsonLisa Washburn